Recently Published Bulletin Reports
Erebus (Antarctica) Lava lake remains active; most thermal alerts recorded since 2019
Rincon de la Vieja (Costa Rica) Frequent phreatic explosions during July-December 2023
Bezymianny (Russia) Explosion on 18 October 2023 sends ash plume 8 km high; lava flows and incandescent avalanches
Kilauea (United States) Low-level lava effusions in the lava lake at Halema’uma’u during July-December 2022
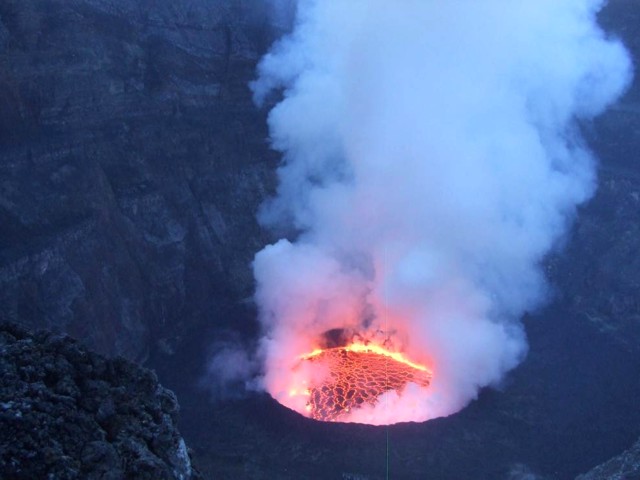
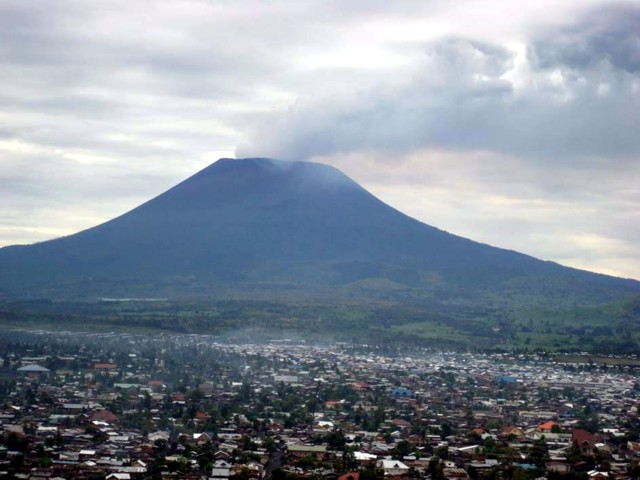
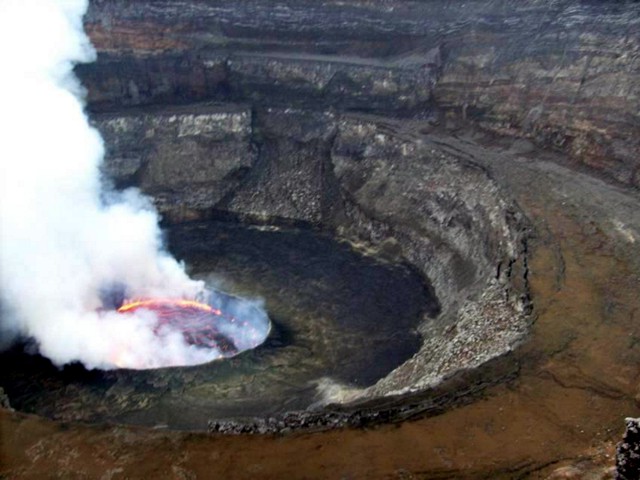
Nyamulagira (DR Congo) Lava flows and thermal activity during May-October 2023
Bagana (Papua New Guinea) Explosions, ash plumes, ashfall, and lava flows during April-September 2023
Mayon (Philippines) Lava flows, pyroclastic flows, ash emissions, and seismicity during April-September 2023
Nishinoshima (Japan) Eruption plumes and gas-and-steam plumes during May-August 2023
Krakatau (Indonesia) White gas-and-steam plumes and occasional ash plumes during May-August 2023
Villarrica (Chile) Strombolian activity, gas-and-ash emissions, and crater incandescence during April-September 2023
Merapi (Indonesia) Frequent incandescent avalanches during April-September 2023
Ebeko (Russia) Moderate explosive activity with ash plumes continued during June-November 2023
Erebus (Antarctica) — January 2024  Cite this Report
Erebus
Antarctica
77.53°S, 167.17°E; summit elev. 3794 m
All times are local (unless otherwise noted)
Lava lake remains active; most thermal alerts recorded since 2019
The lava lake in the summit crater of Erebus has been active since at least 1972. Located in Antarctica overlooking the McMurdo Station on Ross Island, it is the southernmost active volcano on the planet. Because of the remote location, activity is primarily monitored by satellites. This report covers activity during 2023.
The number of thermal alerts recorded by the Hawai'i Institute of Geophysics and Planetology’s MODVOLC Thermal Alerts System increased considerably in 2023 compared to the years 2020-2022 (table 9). In contrast to previous years, the MODIS instruments aboard the Aqua and Terra satellites captured data from Erebus every month during 2023. Consistent with previous years, the lowest number of anomalous pixels were recorded in January, November, and December.
Table 9. Number of monthly MODIS-MODVOLC thermal alert pixels recorded at Erebus during 2017-2023. See BGVN 42:06 for data from 2000 through 2016. The table was compiled using data provided by the HIGP – MODVOLC Thermal Alerts System.
| Year |
Jan |
Feb |
Mar |
Apr |
May |
Jun |
Jul |
Aug |
Sep |
Oct |
Nov |
Dec |
SUM |
| 2017 |
0 |
21 |
9 |
0 |
0 |
1 |
11 |
61 |
76 |
52 |
0 |
3 |
234 |
| 2018 |
0 |
21 |
58 |
182 |
55 |
17 |
137 |
172 |
103 |
29 |
0 |
0 |
774 |
| 2019 |
2 |
21 |
162 |
151 |
55 |
56 |
75 |
53 |
29 |
19 |
1 |
0 |
624 |
| 2020 |
0 |
2 |
16 |
18 |
4 |
4 |
1 |
3 |
18 |
3 |
1 |
6 |
76 |
| 2021 |
0 |
9 |
1 |
0 |
2 |
56 |
46 |
47 |
35 |
52 |
5 |
3 |
256 |
| 2022 |
1 |
13 |
55 |
22 |
15 |
32 |
39 |
19 |
31 |
11 |
0 |
0 |
238 |
| 2023 |
2 |
33 |
49 |
82 |
41 |
32 |
70 |
64 |
42 |
17 |
5 |
11 |
448 |
Sentinel-2 infrared images showed one or two prominent heat sources within the summit crater, accompanied by adjacent smaller sources, similar to recent years (see BGVN 46:01, 47:02, and 48:01). A unique image was obtained on 25 November 2023 by the OLI-2 (Operational Land Imager-2) on Landsat 9, showing the upper part of the volcano surrounded by clouds (figure 32).
Geologic Background. Mount Erebus, the world's southernmost historically active volcano, overlooks the McMurdo research station on Ross Island. It is the largest of three major volcanoes forming the crudely triangular Ross Island. The summit of the dominantly phonolitic volcano has been modified by one or two generations of caldera formation. A summit plateau at about 3,200 m elevation marks the rim of the youngest caldera, which formed during the late-Pleistocene and within which the modern cone was constructed. An elliptical 500 x 600 m wide, 110-m-deep crater truncates the summit and contains an active lava lake within a 250-m-wide, 100-m-deep inner crater; other lava lakes are sometimes present. The glacier-covered volcano was erupting when first sighted by Captain James Ross in 1841. Continuous lava-lake activity with minor explosions, punctuated by occasional larger Strombolian explosions that eject bombs onto the crater rim, has been documented since 1972, but has probably been occurring for much of the volcano's recent history.
Information Contacts: Hawai'i Institute of Geophysics and Planetology (HIGP) - MODVOLC Thermal Alerts System, School of Ocean and Earth Science and Technology (SOEST), Univ. of Hawai'i, 2525 Correa Road, Honolulu, HI 96822, USA (URL: http://modis.higp.hawaii.edu/); Copernicus Browser, Copernicus Data Space Ecosystem, European Space Agency (URL: https://dataspace.copernicus.eu/browser/); NASA Earth Observatory, EOS Project Science Office, NASA Goddard Space Flight Center, Goddard, Maryland, USA (URL: https://earthobservatory.nasa.gov/images/152134/erebus-breaks-through).
Rincon de la Vieja (Costa Rica) — January 2024 Cite this Report
Rincon de la Vieja
Costa Rica
10.83°N, 85.324°W; summit elev. 1916 m
All times are local (unless otherwise noted)
Frequent phreatic explosions during July-December 2023
Rincón de la Vieja is a volcanic complex in Costa Rica with a hot convecting acid lake that exhibits frequent weak phreatic explosions, gas-and-steam emissions, and occasional elevated sulfur dioxide levels (BGVN 45:10, 46:03, 46:11). The current eruption period began June 2021. This report covers activity during July-December 2023 and is based on weekly bulletins and occasional daily reports from the Observatorio Vulcanologico Sismologica de Costa Rica-Universidad Nacional (OVSICORI-UNA).
Numerous weak phreatic explosions continued during July-December 2023, along with gas-and-steam emissions and plumes that rose as high as 3 km above the crater rim. Many weekly OVSICORI-UNA bulletins included the previous week's number of explosions and emissions (table 9). For many explosions, the time of explosion was given (table 10). Frequent seismic activity (long-period earthquakes, volcano-tectonic earthquakes, and tremor) accompanied the phreatic activity.
Table 9. Number of reported weekly phreatic explosions and gas-and-steam emissions at Rincón de la Vieja, July-December 2023. Counts are reported for the week before the Weekly Bulletin date; not all reports included these data. Courtesy of OVSICORI-UNA.
| OVSICORI Weekly Bulletin |
Number of explosions |
Number of emissions |
| 28 Jul 2023 |
6 |
14 |
| 4 Aug 2023 |
10 |
12 |
| 1 Sep 2023 |
13 |
11 |
| 22 Sep 2023 |
12 |
13 |
| 29 Sep 2023 |
6 |
11 |
| 6 Oct 2023 |
12 |
5 |
| 13 Oct 2023 |
7 |
9 |
| 20 Oct 2023 |
1 |
15 |
| 27 Oct 2023 |
3 |
23 |
| 3 Nov 2023 |
3 |
10 |
| 17 Nov 2023 |
0 |
Some |
| 24 Nov 2023 |
0 |
14 |
| 8 Dec 2023 |
4 |
16 |
| 22 Dec 2023 |
8 |
18 |
Table 10. Summary of activity at Rincón de la Vieja during July-December 2023. Weak phreatic explosions and gas emissions are noted where the time of explosion was indicated in the weekly or daily bulletins. Height of plumes or emissions are distance above the crater rim. Courtesy of OVSICORI-UNA.
| Date |
Time |
Description of Activity |
| 1 Jul 2023 |
0156 |
Explosion. |
| 2 Jul 2023 |
0305 |
Explosion. |
| 4 Jul 2023 |
0229, 0635 |
Event at 0635 produced a gas-and-steam plume that rose 700 m and drifted W; seen by residents in Liberia (21 km SW). |
| 9 Jul 2023 |
1843 |
Explosion. |
| 21 Jul 2023 |
0705 |
Explosion. |
| 26 Jul 2023 |
1807 |
Explosion. |
| 28 Jul 2023 |
0802 |
Explosion generated a gas-and-steam plume that rose 500 m. |
| 30 Jul 2023 |
1250 |
Explosion. |
| 31 Jul 2023 |
2136 |
Explosion. |
| 11 Aug 2023 |
0828 |
Explosion. |
| 18 Aug 2023 |
1304 |
Explosion. |
| 21 Aug 2023 |
1224 |
Explosion generated gas-and-steam plumes rose 500-600 m. |
| 22 Aug 2023 |
0749 |
Explosion generated gas-and-steam plumes rose 500-600 m. |
| 24 Aug 2023 |
1900 |
Explosion. |
| 25 Aug 2023 |
0828 |
Event produced a steam-and-gas plume that rose 3 km and drifted NW. |
| 27-28 Aug 2023 |
0813 |
Four small events; the event at 0813 on 28 August lasted two minutes and generated a steam-and-gas plume that rose 2.5 km. |
| 1 Sep 2023 |
1526 |
Explosion generated plume that rose 2 km and ejected material onto the flanks. |
| 2-3 Sep 2023 |
- |
Small explosions detected in infrasound data. |
| 4 Sep 2023 |
1251 |
Gas-and-steam plume rose 1 km and drifted W. |
| 7 Nov 2023 |
1113 |
Explosion. |
| 8 Nov 2023 |
0722 |
Explosion. |
| 12 Nov 2023 |
0136 |
Small gas emissions. |
| 14 Nov 2023 |
0415 |
Small gas emissions. |
According to OVSICORI-UNA, during July-October the average weekly sulfur dioxide (SO2) flux ranged from 68 to 240 tonnes/day. However, in mid-November the flux increased to as high as 334 tonnes/day, the highest value measured in recent years. The high SO2 flux in mid-November was also detected by the TROPOMI instrument on the Sentinel-5P satellite (figure 43).
Geologic Background. Rincón de la Vieja, the largest volcano in NW Costa Rica, is a remote volcanic complex in the Guanacaste Range. The volcano consists of an elongated, arcuate NW-SE-trending ridge constructed within the 15-km-wide early Pleistocene Guachipelín caldera, whose rim is exposed on the south side. Sometimes known as the "Colossus of Guanacaste," it has an estimated volume of 130 km3 and contains at least nine major eruptive centers. Activity has migrated to the SE, where the youngest-looking craters are located. The twin cone of Santa María volcano, the highest peak of the complex, is located at the eastern end of a smaller, 5-km-wide caldera and has a 500-m-wide crater. A Plinian eruption producing the 0.25 km3 Río Blanca tephra about 3,500 years ago was the last major magmatic eruption. All subsequent eruptions, including numerous historical eruptions possibly dating back to the 16th century, have been from the prominent active crater containing a 500-m-wide acid lake located ENE of Von Seebach crater.
Information Contacts: Observatorio Vulcanológico Sismológica de Costa Rica-Universidad Nacional (OVSICORI-UNA), Apartado 86-3000, Heredia, Costa Rica (URL: http://www.ovsicori.una.ac.cr/); NASA Global Sulfur Dioxide Monitoring Page, Atmospheric Chemistry and Dynamics Laboratory, NASA Goddard Space Flight Center (NASA/GSFC), 8800 Greenbelt Road, Goddard MD 20771, USA (URL: https://so2.gsfc.nasa.gov/).
Bezymianny (Russia) — November 2023 Cite this Report
Bezymianny
Russia
55.972°N, 160.595°E; summit elev. 2882 m
All times are local (unless otherwise noted)
Explosion on 18 October 2023 sends ash plume 8 km high; lava flows and incandescent avalanches
Bezymianny, located on Russia’s Kamchatka Peninsula, has had eruptions since 1955 characterized by dome growth, explosions, pyroclastic flows, ash plumes, and ashfall. Activity during November 2022-April 2023 included gas-and-steam emissions, lava dome collapses generating avalanches, and persistent thermal activity. Similar eruptive activity continued from May through October 2023, described here based on information from weekly and daily reports of the Kamchatka Volcano Eruptions Response Team (KVERT), notices from Tokyo VAAC (Volcanic Ash Advisory Center), and from satellite data.
Overall activity decreased after the strong period of activity in late March through April 2023, which included ash explosions during 29 March and 7-8 April 2023 that sent plumes as high as 10-12 km altitude, along with dome growth and lava flows (BGVN 48:05). This reduced activity can be seen in the MIROVA thermal detection system graph (figure 56), which was consistent with data from the MODVOLC thermal detection system and with Sentinel-2 satellite images that showed persistent hotspots in the summit crater when conditions allowed observations. A renewed period of strong activity began in mid-October 2023.
Activity increased significantly on 17 October 2023 when large collapses began during 0700-0830 on the E flanks of the lava dome and continued to after 0930 the next day (figure 57). Ash plumes rose to an altitude of 4.5-5 km, extending 220 km NNE by 18 October. A large explosion at 1630 on 18 October produced an ash plume that rose to an altitude of 11 km (8 km above the summit) and drifted NNE and then NW, extending 900 km NW within two days at an altitude of 8 km. Minor ashfall was noted in Kozyrevsk (45 km WNW). At 0820 on 20 October an ash plume was identified in satellite images drifting 100 km ENE at altitudes of 4-4.5 km.
Lava flows and hot avalanches from the dome down the SE flank continued over the next few days, including 23 October when clear conditions allowed good observations (figures 58 and 59). A large thermal anomaly was observed over the volcano through 24 October, and in the summit crater on 30 October (figure 60). Strong fumarolic activity continued, with numerous avalanches and occasional incandescence. By the last week of October, volcanic activity had decreased to a level consistent with that earlier in the reporting period.
Aviation warnings were frequently updated during 17-20 October. KVERT issued a Volcano Observatory Notice for Aviation (VONA) on 17 October at 1419 and 1727 (0219 and 0527 UTC) raising the Aviation Color Code (ACC) from Yellow to Orange (second highest level). The next day, KVERT issued a VONA at 1705 (0505 UTC) raising the ACC to Red (highest level) but lowered it back to Orange at 2117 (0917 UTC). After another decrease to Yellow and back to Orange, the ACC was reduced to Yellow on 20 October at 1204 (0004 UTC). In addition, the Tokyo VAAC issued a series of Volcanic Ash Advisories beginning on 16 October and continuing through 30 October.
Geologic Background. The modern Bezymianny, much smaller than its massive neighbors Kamen and Kliuchevskoi on the Kamchatka Peninsula, was formed about 4,700 years ago over a late-Pleistocene lava-dome complex and an edifice built about 11,000-7,000 years ago. Three periods of intensified activity have occurred during the past 3,000 years. The latest period, which was preceded by a 1,000-year quiescence, began with the dramatic 1955-56 eruption. This eruption, similar to that of St. Helens in 1980, produced a large open crater that was formed by collapse of the summit and an associated lateral blast. Subsequent episodic but ongoing lava-dome growth, accompanied by intermittent explosive activity and pyroclastic flows, has largely filled the 1956 crater.
Information Contacts: Kamchatka Volcanic Eruptions Response Team (KVERT), Far Eastern Branch, Russian Academy of Sciences, 9 Piip Blvd., Petropavlovsk-Kamchatsky, 683006, Russia (URL: http://www.kscnet.ru/ivs/kvert/); Kamchatka Volcanological Station, Kamchatka Branch of Geophysical Survey, (KB GS RAS), Klyuchi, Kamchatka Krai, Russia (URL: http://volkstat.ru/); Tokyo Volcanic Ash Advisory Center (VAAC), 1-3-4 Otemachi, Chiyoda-ku, Tokyo 100-8122, Japan (URL: http://ds.data.jma.go.jp/svd/vaac/data/); Hawai'i Institute of Geophysics and Planetology (HIGP) - MODVOLC Thermal Alerts System, School of Ocean and Earth Science and Technology (SOEST), Univ. of Hawai'i, 2525 Correa Road, Honolulu, HI 96822, USA (URL: http://modis.higp.hawaii.edu/); MIROVA (Middle InfraRed Observation of Volcanic Activity), a collaborative project between the Universities of Turin and Florence (Italy) supported by the Centre for Volcanic Risk of the Italian Civil Protection Department (URL: http://www.mirovaweb.it/); Copernicus Browser, Copernicus Data Space Ecosystem, European Space Agency (URL: https://dataspace.copernicus.eu/browser/).chr
Kilauea (United States) — January 2023 Cite this Report
Kilauea
United States
19.421°N, 155.287°W; summit elev. 1222 m
All times are local (unless otherwise noted)
Low-level lava effusions in the lava lake at Halema’uma’u during July-December 2022
Kīlauea is the southeastern-most volcano in Hawaii and overlaps the E flank of the Mauna Loa volcano. Its East Rift Zone (ERZ) has been intermittently active for at least 2,000 years. An extended eruption period began in January 1983 and was characterized by open lava lakes and lava flows from the summit caldera and the East Rift Zone. During May 2018 magma migrated into the Lower East Rift Zone (LERZ) and opened 24 fissures along a 6-km-long NE-trending fracture zone that produced lava flows traveling in multiple directions. As lava emerged from the fissures, the lava lake at Halema'uma'u drained and explosions sent ash plumes to several kilometers altitude (BGVN 43:10).
The current eruption period started during September 2021 and has recently been characterized by lava effusions, spatter, and sulfur dioxide emissions in the active Halema’uma’u lava lake (BGVN 47:08). Lava effusions, some spatter, and sulfur dioxide emissions have continued during this reporting period of July through December 2022 using daily reports, volcanic activity notices, and abundant photo, map, and video data from the US Geological Survey's (USGS) Hawaiian Volcano Observatory (HVO).
Summary of activity during July-December 2022. Low-level effusions have continued at the western vent of the Halema’uma’u crater during July through early December 2022. Occasional weak ooze-outs (also called lava break outs) would occur along the margins of the crater floor. The overall level of the active lava lake throughout the reporting period gradually increased due to infilling, however it stagnated in mid-September (table 13). During September through November, activity began to decline, though lava effusions persisted at the western vent. By 9 December, the active part of the lava lake had completely crusted over, and incandescence was no longer visible.
Table 13. Summary of measurements taken during overflights at Kīlauea that show a gradual increase in the active lava lake level and the volume of lava effused since 29 September 2021. Lower activity was reported during September-October. Data collected during July-December 2022. Courtesy of HVO.
| Date: |
Level of the active lava lake (m): |
Cumulative volume of lava effused (million cubic meters): |
| 7 Jul 2022 |
130 |
95 |
| 19 Jul 2022 |
133 |
98 |
| 4 Aug 2022 |
136 |
102 |
| 16 Aug 2022 |
137 |
104 |
| 12 Sep 2022 |
143 |
111 |
| 5 Oct 2022 |
143 |
111 |
| 28 Oct 2022 |
143 |
111 |
Activity during July 2022. Lava effusions were reported from the western vent in the Halema’uma’u crater, along with occasional weak ooze-outs along the margins of the crater floor. The height of the lava lake was variable due to deflation-inflation tilt events; for example, the lake level dropped approximately 3-4 m during a summit deflation-inflation event reported on 1 July. Webcam images taken during the night of 6-12 July showed intermittent low-level spattering at the western vent that rose less than 10 m above the vent (figure 519). Measurements made during an overflight on 7 July indicated that the crater floor was infilled about 130 m and that 95 million cubic meters of lava had been effused since 29 September 2021. A single, relatively small lava ooze-out was active to the S of the lava lake. Around midnight on 8 July there were two brief periods of lava overflow onto the lake margins. On 9 July lava ooze-outs were reported near the SE and NE edges of the crater floor and during 10-11 July they occurred near the E, NE, and NW edges. On 16 July crater incandescence was reported, though the ooze-outs and spattering were not visible. On 18 July overnight webcam images showed incandescence in the western vent complex and two ooze-outs were reported around 0000 and 0200 on 19 July. By 0900 there were active ooze-outs along the SW edge of the crater floor. Measurements made from an overflight on 19 July indicated that the crater floor was infilled about 133 m and 98 million cubic meters of lava had erupted since 29 September 2021 (figure 520). On 20 July around 1600 active ooze-outs were visible along the N edge of the crater, which continued through the next day. Extensive ooze-outs occurred along the W margin during 24 July until 1900; on 26 July minor ooze-outs were noted along the N margin. Minor spattering was visible on 29 July along the E margin of the lake. The sulfur dioxide emission rates ranged 650-2,800 tons per day (t/d), the higher of which was measured on 8 July (figure 519).
Activity during August 2022. The eruption continued in the Halema’uma’u crater at the western vent. According to HVO the lava in the active lake remained at the level of the bounding levees. Occasional minor ooze-outs were observed along the margins of the crater floor. Strong nighttime crater incandescence was visible after midnight on 6 August over the western vent cone. During 6-7 August scattered small lava lobes were active along the crater floor and incandescence persisted above the western vent through 9 August. During 7-9 August HVO reported a single lava effusion source was active along the NW margin of the crater floor. Measurements from an overflight on 4 August indicated that the crater floor was infilled about 136 m total and that 102 million cubic meters of lava had been erupted since the start of the eruption. Lava breakouts were reported along the N, NE, E, S, and W margins of the crater during 10-16 August. Another overflight survey conducted on 16 August indicated that the crater floor infilled about 137 m and 104 million cubic meters of lava had been erupted since September 2021. Measured sulfur dioxide emissions rates ranged 1,150-2,450 t/d, the higher of which occurred on 8 August.
Activity during September 2022. During September, lava effusion continued from the western vent into the active lava lake and onto the crater floor. Intermittent minor ooze-outs were reported through the month. A small ooze-out was visible on the W crater floor margin at 0220 on 2 September, which showed decreasing surface activity throughout the day, but remained active through 3 September. On 3 September around 1900 a lava outbreak occurred along the NW margin of the crater floor but had stopped by the evening of 4 September. Field crews monitoring the summit lava lake on 9 September observed spattering on the NE margin of the lake that rose no higher than 10 m, before falling back onto the lava lake crust (figure 521). Overflight measurements on 12 September indicated that the crater floor was infilled a total of 143 m and 111 million cubic meters of lava had been erupted since September 2021. Extensive breakouts in the W and N part of the crater floor were reported at 1600 on 20 September and continued into 26 September. The active part of the lava lake dropped by 10 m while other parts of the crater floor dropped by several meters. Summit tiltmeters recorded a summit seismic swarm of more than 80 earthquakes during 1500-1800 on 21 September, which occurred about 1.5 km below Halema’uma’u; a majority of these were less than Mw 2. By 22 September the active part of the lava lake was infilled about 2 m. On 23 September the western vent areas exhibited several small spatter cones with incandescent openings, along with weak, sporadic spattering (figure 522). The sulfur dioxide emission rate ranged from 930 t/d to 2,000 t/d, the higher of which was measured on 6 September.
Activity during October 2022. Activity during October declined slightly compared to previous months, though lava effusions persisted from the western vent into the active lava lake and onto the crater floor during October (figure 523). Slight variations in the lava lake were noted throughout the month. HVO reported that around 0600 on 3 October the level of the lava lake has lowered slightly. Overflight measurements taken on 5 October indicated that the crater floor was infilled a total of about 143 m and that 111 million cubic meters of lava had been effused since September 2021. During 6-7 October the lake gradually rose 0.5 m. Sulfur dioxide measurements made on 22 October had an emission rate of 700 t/d. Another overflight taken on 28 October showed that there was little to no change in the elevation of the crater floor: the crater floor was infilled a total of 143 m and 111 million cubic meters of lava had erupted since the start of the eruption.
Activity during November 2022. Activity remained low during November, though HVO reported that lava from the western vent continued to effuse into the active lava lake and onto the crater floor throughout the month. The rate of sulfur dioxide emissions during November ranged from 300-600 t/d, the higher amount of which occurred on 9 November.
Activity during December 2022. Similar low activity was reported during December, with lava effusing from the western vent into the active lava lake and onto the crater floor. During 4-5 December the active part of the lava lake was slightly variable in elevation and fluctuated within 1 m. On 9 December HVO reported that lava was no longer erupting from the western vent in the Halema’uma’u crater and that sulfur dioxide emissions had returned to near pre-eruption background levels; during 10-11 December, the lava lake had completely crusted over, and no incandescence was visible (figure 524). Time lapse camera images covering the 4-10 December showed that the crater floor showed weak deflation and no inflation. Some passive events of crustal overturning were reported during 14-15 December, which brought fresh incandescent lava to the lake surface. The sulfur dioxide emission rate was approximately 200 t/d on 14 December. A smaller overturn event on 17 December and another that occurred around 0000 and into the morning of 20 December were also detected. A small seismic swarm was later detected on 30 December.
Geologic Background. Kilauea overlaps the E flank of the massive Mauna Loa shield volcano in the island of Hawaii. Eruptions are prominent in Polynesian legends; written documentation since 1820 records frequent summit and flank lava flow eruptions interspersed with periods of long-term lava lake activity at Halemaumau crater in the summit caldera until 1924. The 3 x 5 km caldera was formed in several stages about 1,500 years ago and during the 18th century; eruptions have also originated from the lengthy East and Southwest rift zones, which extend to the ocean in both directions. About 90% of the surface of the basaltic shield volcano is formed of lava flows less than about 1,100 years old; 70% of the surface is younger than 600 years. The long-term eruption from the East rift zone between 1983 and 2018 produced lava flows covering more than 100 km2, destroyed hundreds of houses, and added new coastline.
Information Contacts: Hawaiian Volcano Observatory (HVO), U.S. Geological Survey, PO Box 51, Hawai'i National Park, HI 96718, USA (URL: http://hvo.wr.usgs.gov/).
Nyamulagira (DR Congo) — November 2023 Cite this Report
Nyamulagira
DR Congo
1.408°S, 29.2°E; summit elev. 3058 m
All times are local (unless otherwise noted)
Lava flows and thermal activity during May-October 2023
Nyamulagira (also known as Nyamuragira) is a shield volcano in the Democratic Republic of Congo with the summit truncated by a small 2 x 2.3 km caldera with walls up to about 100 m high. Documented eruptions have occurred within the summit caldera, as well as from numerous flank fissures and cinder cones. The current eruption period began in April 2018 and has more recently been characterized by summit crater lava flows and thermal activity (BGVN 48:05). This report describes lava flows and variable thermal activity during May through October 2023, based on information from the Observatoire Volcanologique de Goma (OVG) and various satellite data.
Lava lake activity continued during May. The MIROVA (Middle InfraRed Observation of Volcanic Activity) system recorded moderate-to-strong thermal activity throughout the reporting period; activity was more intense during May and October and relatively weaker from June through September (figure 95). The MODVOLC thermal algorithm, detected a total of 209 thermal alerts. There were 143 hotspots detected during May, eight during June, nine during September, and 49 during October. This activity was also reflected in infrared satellite images, where a lava flow was visible in the NW part of the crater on 7 May and strong activity was seen in the center of the crater on 4 October (figure 96). Another infrared satellite image taken on 12 May showed still active lava flows along the NW margin of the crater. According to OVG lava effusions were active during 7-29 May and moved to the N and NW parts of the crater beginning on 9 May. Strong summit crater incandescence was visible from Goma (27 km S) during the nights of 17, 19, and 20 May (figure 97). On 17 May there was an increase in eruptive activity, which peaked at 0100 on 20 May. Notable sulfur dioxide plumes drifted NW and W during 19-20 May (figure 98). Drone footage acquired in partnership with the USGS (United States Geological Survey) on 20 May captured images of narrow lava flows that traveled about 100 m down the W flank (figure 99). Data from the Rumangabo seismic station indicated a decreasing trend in activity during 17-21 May. Although weather clouds prevented clear views of the summit, a strong thermal signature on the NW flank was visible in an infrared satellite image on 22 May, based on an infrared satellite image. On 28 May the lava flows on the upper W flank began to cool and solidify. By 29 May seismicity returned to levels similar to those recorded before the 17 May increase. Lava effusion continued but was confined to the summit crater; periodic crater incandescence was observed.
Low-level activity was noted during June through October. On 1 June OVG reported that seismicity remained at lower levels and that crater incandescence had been absent for three days, though infrared satellite imagery showed continued lava effusion in the summit crater. The lava flows on the flanks covered an estimated 0.6 km2. Satellite imagery continued to show thermal activity confined to the lava lake through October (figure 96), although no lava flows or significant sulfur dioxide emissions were reported.
Geologic Background. Africa's most active volcano, Nyamulagira (also known as Nyamuragira), is a massive high-potassium basaltic shield about 25 km N of Lake Kivu and 13 km NNW of the steep-sided Nyiragongo volcano. The summit is truncated by a small 2 x 2.3 km caldera that has walls up to about 100 m high. Documented eruptions have occurred within the summit caldera, as well as from the numerous flank fissures and cinder cones. A lava lake in the summit crater, active since at least 1921, drained in 1938, at the time of a major flank eruption. Recent lava flows extend down the flanks more than 30 km from the summit as far as Lake Kivu; extensive lava flows from this volcano have covered 1,500 km2 of the western branch of the East African Rift.
Information Contacts: Observatoire Volcanologique de Goma (OVG), Departement de Geophysique, Centre de Recherche en Sciences Naturelles, Lwiro, D.S. Bukavu, DR Congo; Hawai'i Institute of Geophysics and Planetology (HIGP) - MODVOLC Thermal Alerts System, School of Ocean and Earth Science and Technology (SOEST), Univ. of Hawai'i, 2525 Correa Road, Honolulu, HI 96822, USA (URL: http://modis.higp.hawaii.edu/); MIROVA (Middle InfraRed Observation of Volcanic Activity), a collaborative project between the Universities of Turin and Florence (Italy) supported by the Centre for Volcanic Risk of the Italian Civil Protection Department (URL: http://www.mirovaweb.it/); NASA Global Sulfur Dioxide Monitoring Page, Atmospheric Chemistry and Dynamics Laboratory, NASA Goddard Space Flight Center (NASA/GSFC), 8800 Greenbelt Road, Goddard, Maryland, USA (URL: https://so2.gsfc.nasa.gov/); Copernicus Browser, Copernicus Data Space Ecosystem, European Space Agency (URL: https://dataspace.copernicus.eu/browser/); Charles Balagizi, Goma Volcano Observatory, Departement de Geophysique, Centre de Recherche en Sciences Naturelles, Lwiro, D.S. Bukavu, DR Congo.
Bagana (Papua New Guinea) — October 2023 Cite this Report
Bagana
Papua New Guinea
6.137°S, 155.196°E; summit elev. 1855 m
All times are local (unless otherwise noted)
Explosions, ash plumes, ashfall, and lava flows during April-September 2023
The remote volcano of Bagana is located in central Bougainville Island, Papua New Guinea. Recorded eruptions date back to 1842 and activity has consisted of effusive activity that has built a small lava dome in the summit crater and occasional explosions that produced pyroclastic flows. The most recent eruption has been ongoing since February 2000 and has produced occasional explosions, ash plumes, and lava flows. More recently, activity has been characterized by ongoing effusive activity and ash emissions (BGVN 48:04). This report updates activity from April through September 2023 that has consisted of explosions, ash plumes, ashfall, and lava flows, using information from the Darwin Volcanic Ash Advisory Center (VAAC) and satellite data.
An explosive eruption was reported on 7 July that generated a large gas-and-ash plume to high altitudes and caused significant ashfall in local communities; the eruption plume had reached upper tropospheric (16-18 km altitude) altitudes by 2200, according to satellite images. Sulfur dioxide plumes were detected in satellite images on 8 July and indicated that the plume was likely a mixture of gas, ice, and ash. A report issued by the Autonomous Bougainville Government (ABG) (Torokina District, Education Section) on 10 July noted that significant ash began falling during 2000-2100 on 7 July and covered most areas in the Vuakovi, Gotana (9 km SW), Koromaketo, Laruma (25 km W) and Atsilima (27 km NW) villages. Pyroclastic flows also occurred, according to ground-based reports; small deposits confined to one drainage were inspected by RVO during an overflight on 17 July and were confirmed to be from the 7 July event. Ashfall continued until 10 July and covered vegetation, which destroyed bushes and gardens and contaminated rivers and streams.
RVO reported another eruption on 14 July. The Darwin VAAC stated that an explosive event started around 0830 on 15 July and produced an ash plume that rose to 16.5 km altitude by 1000 and drifted N, according to satellite images. The plume continued to drift N and remained visible through 1900, and by 2150 it had dissipated.
Ashfall likely from both the 7 and 15 July events impacted about 8,111 people in Torokina (20 km SW), including Tsito/Vuakovi, Gotana, Koromaketo, Kenaia, Longkogari, Kenbaki, Piva (13 km SW), and Atsinima, and in the Tsitovi district, according to ABG. Significant ashfall was also reported in Ruruvu (22 km N) in the Wakunai District of Central Bougainville, though the thickness of these deposits could not be confirmed. An evacuation was called for the villages in Wakunai, where heavy ashfall had contaminated water sources; the communities of Ruruvu, Togarau, Kakarapaia, Karauturi, Atao, and Kuritaturi were asked to evacuate to a disaster center at the Wakunai District Station, and communities in Torokina were asked to evacuate to the Piva District station. According to a news article, more than 7,000 people needed temporary accommodations, with about 1,000 people in evacuation shelters. Ashfall had deposited over a broad area, contaminating water supplies, affecting crops, and collapsing some roofs and houses in rural areas. Schools were temporarily shut down. Intermittent ash emissions continued through the end of July and drifted NNW, NW, and SW. Fine ashfall was reported on the coast of Torokina, and ash plumes also drifted toward Laruma and Atsilima.
A small explosive eruption occurred at 2130 on 28 July that ejected material from the crater vents, according to reports from Torokina, in addition to a lava flow that contained two lobes. A second explosion was detected at 2157. Incandescence from the lava flow was visible from Piva as it descended the W flank around 2000 on 29 July (figure 47). The Darwin VAAC reported that a strong thermal anomaly was visible in satellite images during 30-31 July and that ash emissions rose to 2.4 km altitude and drifted WSW on 30 July. A ground report from RVO described localized emissions at 0900 on 31 July.
The Darwin VAAC reported that ash plumes were identified in satellite imagery at 0800 and 1220 on 12 August and rose to 2.1 km and 3 km altitude and drifted NW and W, respectively. A news report stated that aid was sent to more than 6,300 people that were adversely affected by the eruption. Photos taken during 17-19 August showed ash emissions rising no higher than 1 km above the summit and drifting SE. A small explosion generated an ash plume during the morning of 19 August. Deposits from small pyroclastic flows were also captured in the photos. Satellite images captured lava flows and pyroclastic flow deposits. Two temporary seismic stations were installed near Bagana on 17 August at distances of 7 km WSW (Vakovi station) and 11 km SW (Kepox station). The Kepox station immediately started to record continuous, low-frequency background seismicity.
Satellite data. Little to no thermal activity was detected during April through mid-July 2023; only one anomaly was recorded during early April and one during early June, according to MIROVA (Middle InfraRed Observation of Volcanic Activity) data (figure 48). Thermal activity increased in both power and frequency during mid-July through September, although there were still some short gaps in detected activity. MODVOLC also detected increased thermal activity during August; thermal hotspots were detected a total of five times on 19, 20, and 27 August. Weak thermal anomalies were also captured in infrared satellite images on clear weather days throughout the reporting period on 7, 12, and 17 April, 27 May, 1, 6, 16, and 31 July, and 19 September (figure 48); a strong thermal anomaly was visible on 31 July. Distinct sulfur dioxide plumes that drifted generally NW were intermittently captured by the TROPOMI instrument on the Sentinel-5P satellite and sometimes exceeded two Dobson Units (DUs) (figure 49).
Geologic Background. Bagana volcano, in a remote portion of central Bougainville Island, is frequently active. This massive symmetrical cone was largely constructed by an accumulation of viscous andesitic lava flows. The entire edifice could have been constructed in about 300 years at its present rate of lava production. Eruptive activity is characterized by non-explosive effusion of viscous lava that maintains a small lava dome in the summit crater, although occasional explosive activity produces pyroclastic flows. Lava flows with tongue-shaped lobes up to 50 m thick and prominent levees descend the flanks on all sides.
Information Contacts: Rabaul Volcano Observatory (RVO), Geohazards Management Division, Department of Mineral Policy and Geohazards Management (DMPGM), PO Box 3386, Kokopo, East New Britain Province, Papua New Guinea; Darwin Volcanic Ash Advisory Centre (VAAC), Bureau of Meteorology, Northern Territory Regional Office, PO Box 40050, Casuarina, NT 0811, Australia (URL: http://www.bom.gov.au/info/vaac/); MIROVA (Middle InfraRed Observation of Volcanic Activity), a collaborative project between the Universities of Turin and Florence (Italy) supported by the Centre for Volcanic Risk of the Italian Civil Protection Department (URL: http://www.mirovaweb.it/); Hawai'i Institute of Geophysics and Planetology (HIGP) - MODVOLC Thermal Alerts System, School of Ocean and Earth Science and Technology (SOEST), Univ. of Hawai'i, 2525 Correa Road, Honolulu, HI 96822, USA (URL: http://modis.higp.hawaii.edu/); NASA Global Sulfur Dioxide Monitoring Page, Atmospheric Chemistry and Dynamics Laboratory, NASA Goddard Space Flight Center (NASA/GSFC), 8800 Greenbelt Road, Goddard, Maryland, USA (URL: https://so2.gsfc.nasa.gov/); Copernicus Browser, Copernicus Data Space Ecosystem, European Space Agency (URL: https://dataspace.copernicus.eu/browser/); Autonomous Bougainville Government, P.O Box 322, Buka, AROB, PNG (URL: https://abg.gov.pg/); Andrew Tupper (Twitter: @andrewcraigtupp); Simon Carn, Geological and Mining Engineering and Sciences, Michigan Technological University, 1400 Townsend Drive, Houghton, MI 49931, USA (URL: http://www.volcarno.com/, Twitter: @simoncarn); Radio NZ (URL: https://www.rnz.co.nz/news/pacific/494464/more-than-7-000-people-in-bougainville-need-temporary-accommodation-after-eruption); USAID, 1300 Pennsylvania Ave, NW, Washington DC 20004, USA (URL: https://www.usaid.gov/pacific-islands/press-releases/aug-08-2023-united-states-provides-immediate-emergency-assistance-support-communities-affected-mount-bagana-volcanic-eruptions).
Mayon (Philippines) — October 2023 Cite this Report
Mayon
Philippines
13.257°N, 123.685°E; summit elev. 2462 m
All times are local (unless otherwise noted)
Lava flows, pyroclastic flows, ash emissions, and seismicity during April-September 2023
Mayon is located in the Philippines and has steep upper slopes capped by a small summit crater. Historical eruptions date back to 1616 CE that have been characterized by Strombolian eruptions, lava flows, pyroclastic flows, and mudflows. Eruptions mostly originated from a central conduit. Pyroclastic flows and mudflows have commonly descended many of the approximately 40 drainages that surround the volcano. The most recent eruption occurred during June through October 2022 and consisted of lava dome growth and gas-and-steam emissions (BGVN 47:12). A new eruption was reported during late April 2023 and has included lava flows, pyroclastic density currents, ash emissions, and seismicity. This report covers activity during April through September 2023 based on daily bulletins from the Philippine Institute of Volcanology and Seismology (PHIVOLCS).
During April through September 2023, PHIVOLCS reported near-daily rockfall events, frequent volcanic earthquakes, and sulfur dioxide measurements. Gas-and-steam emissions rose 100-900 m above the crater and drifted in different directions. Nighttime crater incandescence was often visible during clear weather and was accompanied by incandescent avalanches of material. Activity notably increased during June when lava flows were reported on the S, SE, and E flanks (figure 52). The MIROVA graph (Middle InfraRed Observation of Volcanic Activity) showed strong thermal activity coincident with these lava flows, which remained active through September (figure 53). According to the MODVOLC thermal algorithm, a total of 110 thermal alerts were detected during the reporting period: 17 during June, 40 during July, 27 during August, and 26 during September. During early June, pyroclastic density currents (PDCs) started to occur more frequently.
Low activity was reported during much of April and May; gas-and-steam emissions rose 100-900 m above the crater and generally drifted in different directions. A total of 52 rockfall events and 18 volcanic earthquakes were detected during April and 147 rockfall events and 13 volcanic events during May. Sulfur dioxide flux measurements ranged between 400-576 tons per day (t/d) during April, the latter of which was measured on 29 April and between 162-343 t/d during May, the latter of which was measured on 13 May.
Activity during June increased, characterized by lava flows, pyroclastic density currents (PDCs), crater incandescence and incandescent rockfall events, gas-and-steam emissions, and continued seismicity. Weather clouds often prevented clear views of the summit, but during clear days, moderate gas-and-steam emissions rose 100-2,500 m above the crater and drifted in multiple directions. A total of 6,237 rockfall events and 288 volcanic earthquakes were detected. The rockfall events often deposited material on the S and SE flanks within 700-1,500 m of the summit crater and ash from the events drifted SW, S, SE, NE, and E. Sulfur dioxide emissions ranged between 149-1,205 t/d, the latter of which was measured on 10 June. Short-term observations from EDM and electronic tiltmeter monitoring indicated that the upper slopes were inflating since February 2023. Longer-term ground deformation parameters based on EDM, precise leveling, continuous GPS, and electronic tilt monitoring indicated that the volcano remained inflated, especially on the NW and SE flanks. At 1000 on 5 June the Volcano Alert Level (VAL) was raised to 2 (on a 0-5 scale). PHIVOLCS noted that although low-level volcanic earthquakes, ground deformation, and volcanic gas emissions indicated unrest, the steep increase in rockfall frequency may indicate increased dome activity.
A total of 151 dome-collapse PDCs occurred during 8-9 and 11-30 June, traveled 500-2,000 m, and deposited material on the S flank within 2 km of the summit crater. During 8-9 June the VAL was raised to 3. At approximately 1947 on 11 June lava flow activity was reported; two lobes traveled within 500 m from the crater and deposited material on the S (Mi-isi), SE (Bonga), and E (Basud) flanks. Weak seismicity accompanied the lava flow and slight inflation on the upper flanks. This lava flow remained active through 30 June, moving down the S and SE flank as far as 2.5 km and 1.8 km, respectively and depositing material up to 3.3 km from the crater. During 15-16 June traces of ashfall from the PDCs were reported in Sitio Buga, Nabonton, City of Ligao and Purok, and San Francisco, Municipality of Guinobatan. During 28-29 June there were two PDCs generated by the collapse of the lava flow front, which generated a light-brown ash plume 1 km high. Satellite monitors detected significant concentrations of sulfur dioxide beginning on 29 June. On 30 June PDCs primarily affected the Basud Gully on the E flank, the largest of which occurred at 1301 and lasted eight minutes, based on the seismic record. Four PDCs generated between 1800 and 2000 that lasted approximately four minutes each traveled 3-4 km on the E flank and generated an ash plume that rose 1 km above the crater and drifted N and NW. Ashfall was recorded in Tabaco City.
Similar strong activity continued during July; slow lava effusion remained active on the S and SE flanks and traveled as far as 2.8 km and 2.8 km, respectively and material was deposited as far as 4 km from the crater. There was a total of 6,983 rockfall events and 189 PDCs that affected the S, SE, and E flanks. The volcano network detected a total of 2,124 volcanic earthquakes. Continuous gas-and-steam emissions rose 200-2,000 m above the crater and drifted in multiple directions. Sulfur dioxide emissions averaged 792-4,113 t/d, the latter of which was measured on 28 July. During 2-4 July three PDCs were generated from the collapse of the lava flow and resulting light brown plumes rose 200-300 m above the crater. Continuous tremor pulses were reported beginning at 1547 on 3 July through 7 July at 1200, at 2300 on 8 July and going through 0300 on 10 July, and at 2300 on 16 July, as recorded by the seismic network. During 6-9 July there were 10 lava flow-collapse-related PDCs that generated light brown plumes 300-500 m above the crater. During 10-11 July light ashfall was reported in some areas of Mabinit, Legazpi City, Budiao and Salvacion, Daraga, and Camalig, Albay. By 18 July the lava flow advanced 600 m on the E flank as well.
During 1733 on 18 July and 0434 on 19 July PHIVOLCS reported 30 “ashing” events, which are degassing events accompanied by audible thunder-like sounds and entrained ash at the crater, which produced short, dark plumes that drifted SW. These events each lasted 20-40 seconds, and plume heights ranged from 150-300 m above the crater, as recorded by seismic, infrasound, visual, and thermal monitors. Three more ashing events occurred during 19-20 July. Short-term observations from electronic tilt and GPS monitoring indicate deflation on the E lower flanks in early July and inflation on the NW middle flanks during the third week of July. Longer-term ground deformation parameters from EDM, precise leveling, continuous GPS, and electronic tilt monitoring indicated that the volcano was still generally inflated relative to baseline levels. A short-lived lava pulse lasted 28 seconds at 1956 on 21 July, which was accompanied by seismic and infrasound signals. By 22 July, the only lava flow that remained active was on the SE flank, and continued to extend 3.4 km, while those on the S and E flanks weakened markedly. One ashing event was detected during 30-31 July, whereas there were 57 detected during 31 July-1 August; according to PHIVOLCS beginning at approximately 1800 on 31 July eruptive activity was dominated by phases of intermittent ashing, as well as increased in the apparent rates of lava effusion from the summit crater. The ashing phases consisted of discrete events recorded as low-frequency volcanic earthquakes (LFVQ) typically 30 seconds in duration, based on seismic and infrasound signals. Gray ash plume rose 100 m above the crater and generally drifted NE. Shortly after these ashing events began, new lava began to effuse rapidly from the crater, feeding the established flowed on the SE, E, and E flanks and generating frequent rockfall events.
Intensified unrest persisted during August. There was a total of 4,141 rockfall events, 2,881 volcanic earthquakes, which included volcanic tremor events, 32 ashing events, and 101 PDCs detected throughout the month. On clear weather days, gas-and-steam emissions rose 300-1,500 m above the crater and drifted in different directions (figure 54). Sulfur dioxide emissions averaged 735-4,756 t/d, the higher value of which was measured on 16 August. During 1-2 August the rate of lava effusion decreased, but continued to feed the flows on the SE, S, and E flanks, maintaining their advances to 3.4 km, 2.8 km, and 1.1 km from the crater, respectively (figure 55). Rockfall and PDCs generated by collapses at the lava flow margins and from the summit dome deposited material within 4 km of the crater. During 3-4 August there were 10 tremor events detected that lasted 1-4 minutes. Short-lived lava pulse lasted 35 seconds and was accompanied by seismic and infrasound signals at 0442 on 6 August. Seven collapses were recorded at the front of the lava flow during 12-14 August.
During September, similar activity of slow lava effusion, PDCs, gas-and-steam emissions, and seismicity continued. There was a total of 4,452 rockfall events, 329 volcanic earthquakes, which included volcanic tremor events, two ashing events, and 85 PDCs recorded throughout the month. On clear weather days, gas-and-steam emissions rose 100-1,500 m above the crater and drifted in multiple directions. Sulfur dioxide emissions averaged 609-2,252 t/d, the higher average of which was measured on 6 September. Slow lava effusion continued advancing on the SE, S, and E flanks, maintaining lengths of 3.4 km, 2.8 km, and 1.1 km, respectively. Rockfall and PDC events generated by collapses along the lava flow margins and at the summit dome deposited material within 4 km of the crater.
Geologic Background. Symmetrical Mayon, which rises above the Albay Gulf NW of Legazpi City, is the most active volcano of the Philippines. The steep upper slopes are capped by a small summit crater. Recorded eruptions since 1616 CE range from Strombolian to basaltic Plinian, with cyclical activity beginning with basaltic eruptions, followed by longer periods of andesitic lava flows. Eruptions occur predominately from the central conduit and have also produced lava flows that travel far down the flanks. Pyroclastic density currents and mudflows have commonly swept down many of the approximately 40 ravines that radiate from the summit and have often damaged populated lowland areas. A violent eruption in 1814 killed more than 1,200 people and devastated several towns.
Information Contacts: Philippine Institute of Volcanology and Seismology (PHIVOLCS), Department of Science and Technology, University of the Philippines Campus, Diliman, Quezon City, Philippines (URL: http://www.phivolcs.dost.gov.ph/); MIROVA (Middle InfraRed Observation of Volcanic Activity), a collaborative project between the Universities of Turin and Florence (Italy) supported by the Centre for Volcanic Risk of the Italian Civil Protection Department (URL: http://www.mirovaweb.it/); Hawai'i Institute of Geophysics and Planetology (HIGP) - MODVOLC Thermal Alerts System, School of Ocean and Earth Science and Technology (SOEST), Univ. of Hawai'i, 2525 Correa Road, Honolulu, HI 96822, USA (URL: http://modis.higp.hawaii.edu/); Copernicus Browser, Copernicus Data Space Ecosystem, European Space Agency (URL: https://dataspace.copernicus.eu/browser/); William Rogers, Legazpi City, Albay Province, Philippines.
Nishinoshima (Japan) — October 2023 Cite this Report
Nishinoshima
Japan
27.247°N, 140.874°E; summit elev. 100 m
All times are local (unless otherwise noted)
Eruption plumes and gas-and-steam plumes during May-August 2023
Nishinoshima, located about 1,000 km S of Tokyo, is a small island in the Ogasawara Arc in Japan. The island is the summit of a massive submarine volcano that has prominent submarine peaks to the S, W, and NE. Eruptions date back to 1973 and the current eruption period began in October 2022. Recent activity has consisted of small ash plumes and fumarolic activity (BGVN 48:07). This report covers activity during May through August 2023, using information from monthly reports of the Japan Meteorological Agency (JMA) monthly reports and satellite data.
Activity during May through June was relatively low. The Japan Coast Guard (JCG) did overflights on 14 and 22 June and reported white gas-and-steam emissions rising 600 m and 1,200 m from the central crater of the pyroclastic cone, respectively (figure 125). In addition, multiple white gas-and-steam emissions rose from the inner rim of the W side of the crater and from the SE flank of the pyroclastic cone. Discolored brown-to-green water was observed around almost the entire perimeter of the island; on 22 June light green discolored water was observed off the S coast of the island.
Observations from the Himawari meteorological satellite confirmed an eruption on 9 and 10 July. An eruption plume rose 1.6 km above the crater and drifted N around 1300 on 9 July. Satellite images acquired at 1420 and 2020 on 9 July and at 0220 on 10 July showed continuing emissions that rose 1.3-1.6 km above the crater and drifted NE and N. The Tokyo VAAC reported that an ash plume seen by a pilot and identified in a satellite image at 0630 on 21 July rose to 3 km altitude and drifted S.
Aerial observations conducted by JCG on 8 August showed a white-and-gray plume rising from the central crater of the pyroclastic cone, and multiple white gas-and-steam emissions were rising from the inner edge of the western crater and along the NW-SE flanks of the island (figure 126). Brown-to-green discolored water was also noted around the perimeter of the island.
Intermittent low-to-moderate power thermal anomalies were recorded in the MIROVA graph (Middle InfraRed Observation of Volcanic Activity), showing an increase in both frequency and power beginning in July (figure 127). This increase in activity coincides with eruptive activity on 9 and 10 July, characterized by eruption plumes. According to the MODVOLC thermal alert algorithm, one thermal hotspot was recorded on 20 July. Weak thermal anomalies were also detected in infrared satellite imagery, accompanied by strong gas-and-steam plumes (figure 128).
Geologic Background. The small island of Nishinoshima was enlarged when several new islands coalesced during an eruption in 1973-74. Multiple eruptions that began in 2013 completely covered the previous exposed surface and continued to enlarge the island. The island is the summit of a massive submarine volcano that has prominent peaks to the S, W, and NE. The summit of the southern cone rises to within 214 m of the ocean surface 9 km SSE.
Information Contacts: Japan Meteorological Agency (JMA), 1-3-4 Otemachi, Chiyoda-ku, Tokyo 100-8122, Japan (URL: http://www.jma.go.jp/jma/indexe.html); Tokyo Volcanic Ash Advisory Center (VAAC), 1-3-4 Otemachi, Chiyoda-ku, Tokyo 100-8122, Japan (URL: http://ds.data.jma.go.jp/svd/vaac/data/); MIROVA (Middle InfraRed Observation of Volcanic Activity), a collaborative project between the Universities of Turin and Florence (Italy) supported by the Centre for Volcanic Risk of the Italian Civil Protection Department (URL: http://www.mirovaweb.it/); Copernicus Browser, Copernicus Data Space Ecosystem, European Space Agency (URL: https://dataspace.copernicus.eu/browser/).
Krakatau (Indonesia) — October 2023 Cite this Report
Krakatau
Indonesia
6.1009°S, 105.4233°E; summit elev. 285 m
All times are local (unless otherwise noted)
White gas-and-steam plumes and occasional ash plumes during May-August 2023
Krakatau is located in the Sunda Strait between Java and Sumatra, Indonesia. Caldera collapse during the catastrophic 1883 eruption destroyed Danan and Perbuwatan cones and left only a remnant of Rakata. The post-collapse cone of Anak Krakatau (Child of Krakatau) was constructed within the 1883 caldera at a point between the former Danan and Perbuwatan cones; it has been the site of frequent eruptions since 1927. The current eruption period began in May 2021 and has recently consisted of Strombolian eruptions and ash plumes (BGVN 48:07). This report describes lower levels of activity consisting of ash and white gas-and-steam plumes during May through August 2023, based on information provided by the Indonesian Center for Volcanology and Geological Hazard Mitigation, referred to as Pusat Vulkanologi dan Mitigasi Bencana Geologi (PVMBG), MAGMA Indonesia, and satellite data.
Activity was relatively low during May and June. Daily white gas-and-steam emissions rose 25-200 m above the crater and drifted in different directions. Five ash plumes were detected at 0519 on 10 May, 1241 on 11 May, 0920 on 12 May, 2320 on 12 May, and at 0710 on 13 May, and rose 1-2.5 km above the crater and drifted SW. A webcam image taken on 12 May showed ejection of incandescent material above the vent. A total of nine ash plumes were detected during 6-11 June: at 1434 and 00220 on 6 and 7 June the ash plumes rose 500 m above the crater and drifted NW, at 1537 on 8 June the ash plume rose 1 km above the crater and drifted SW, at 0746 and at 0846 on 9 June the ash plumes rose 800 m and 3 km above the crater and drifted SW, respectively, at 0423, 1431, and 1750 on 10 June the ash plumes rose 2 km, 1.5 km, and 3.5 km above the crater and drifted NW, respectively, and at 0030 on 11 June an ash plume rose 2 km above the crater and drifted NW. Webcam images taken on 10 and 11 June at 0455 and 0102, respectively, showed incandescent material ejected above the vent. On 19 June an ash plume at 0822 rose 1.5 km above the crater and drifted SE.
Similar low activity of white gas-and-steam emissions and few ash plumes were reported during July and August. Daily white gas-and-steam emissions rose 25-300 m above the crater and drifted in multiple directions. Three ash plumes were reported at 0843, 0851, and 0852 on 20 July that rose 500-2,000 m above the crater and drifted NW.
The MIROVA (Middle InfraRed Observation of Volcanic Activity) graph of MODIS thermal anomaly data showed intermittent low-to-moderate power thermal anomalies during May through August 2023 (figure 140). Although activity was often obscured by weather clouds, a thermal anomaly was visible in an infrared satellite image of the crater on 12 May, accompanied by an eruption plume that drifted SW (figure 141).
Geologic Background. The renowned Krakatau (frequently mis-named as Krakatoa) volcano lies in the Sunda Strait between Java and Sumatra. Collapse of an older edifice, perhaps in 416 or 535 CE, formed a 7-km-wide caldera. Remnants of that volcano are preserved in Verlaten and Lang Islands; subsequently the Rakata, Danan, and Perbuwatan cones were formed, coalescing to create the pre-1883 Krakatau Island. Caldera collapse during the catastrophic 1883 eruption destroyed Danan and Perbuwatan, and left only a remnant of Rakata. This eruption caused more than 36,000 fatalities, most as a result of tsunamis that swept the adjacent coastlines of Sumatra and Java. Pyroclastic surges traveled 40 km across the Sunda Strait and reached the Sumatra coast. After a quiescence of less than a half century, the post-collapse cone of Anak Krakatau (Child of Krakatau) was constructed within the 1883 caldera at a point between the former Danan and Perbuwatan cones. Anak Krakatau has been the site of frequent eruptions since 1927.
Information Contacts: Pusat Vulkanologi dan Mitigasi Bencana Geologi (PVMBG, also known as Indonesian Center for Volcanology and Geological Hazard Mitigation, CVGHM), Jalan Diponegoro 57, Bandung 40122, Indonesia (URL: http://www.vsi.esdm.go.id/); MAGMA Indonesia, Kementerian Energi dan Sumber Daya Mineral (URL: https://magma.esdm.go.id/v1); MIROVA (Middle InfraRed Observation of Volcanic Activity), a collaborative project between the Universities of Turin and Florence (Italy) supported by the Centre for Volcanic Risk of the Italian Civil Protection Department (URL: http://www.mirovaweb.it/); Copernicus Browser, Copernicus Data Space Ecosystem, European Space Agency (URL: https://dataspace.copernicus.eu/browser/).
Villarrica (Chile) — October 2023 Cite this Report
Villarrica
Chile
39.42°S, 71.93°W; summit elev. 2847 m
All times are local (unless otherwise noted)
Strombolian activity, gas-and-ash emissions, and crater incandescence during April-September 2023
Villarrica, in central Chile, consists of a 2-km-wide caldera that formed about 3,500 years ago and is located at the base of the presently active cone at the NW margin of a 6-km-wide caldera. Historical eruptions eruptions date back to 1558 and have been characterized by mild-to-moderate explosive activity with occasional lava effusions. The current eruption period began in December 2014 and has recently consisted of nighttime crater incandescence, ash emissions, and seismicity (BGVN 48:04). This report covers activity during April through September 2023 and describes occasional Strombolian activity, gas-and-ash emissions, and nighttime crater incandescence. Information for this report primarily comes from the Southern Andes Volcano Observatory (Observatorio Volcanológico de Los Andes del Sur, OVDAS), part of Chile's National Service of Geology and Mining (Servicio Nacional de Geología y Minería, SERNAGEOMIN) and satellite data.
Seismicity during April consisted of long period (LP) events and tremor (TRE); a total of 9,413 LP-type events and 759 TR-type events were detected throughout the month. Nighttime crater incandescence persisted and was visible in the degassing column. Sulfur dioxide data was obtained using Differential Absorption Optical Spectroscopy Equipment (DOAS) that showed an average value of 1,450 ± 198 tons per day (t/d) during 1-15 April and 1,129 ± 201 t/d during 16-30 April, with a maximum daily value of 2,784 t/d on 9 April. Gas-and-steam emissions of variable intensities rose above the active crater as high as 1.3 km above the crater on 13 April. Strombolian explosions were not observed and there was a slight decrease in the lava lake level.
There were 14,123 LP-type events and 727 TR-type events detected during May. According to sulfur dioxide measurements taken with DOAS equipment, the active crater emitted an average value of 1,826 ± 482 t/d during 1-15 May and 912 ± 41 t/d during 16-30 May, with a daily maximum value of 5,155 t/d on 13 May. Surveillance cameras showed continuous white gas-and-steam emissions that rose as high as 430 m above the crater on 27 May. Nighttime incandescence illuminated the gas column less than 300 m above the crater rim was and no pyroclastic emissions were reported. A landslide was identified on 13 May on the E flank of the volcano 50 m from the crater rim and extending 300 m away; SERNAGEOMIN noted that this event may have occurred on 12 May. During the morning of 27 and 28 May minor Strombolian explosions characterized by incandescent ejecta were recorded at the crater rim; the last reported Strombolian explosions had occurred at the end of March.
Seismic activity during June consisted of five volcano-tectonic (VT)-type events, 21,606 LP-type events, and 2,085 TR-type events. The average value of sulfur dioxide flux obtained by DOAS equipment was 1,420 ± 217 t/d during 1-15 June and 2,562 ± 804 t/d, with a maximum daily value of 4,810 t/d on 17 June. White gas-and-steam emissions rose less than 480 m above the crater; frequent nighttime crater incandescence was reflected in the degassing plume. On 12 June an emission rose 100 m above the crater and drifted NNW. On 15 June one or several emissions resulted in ashfall to the NE as far as 5.5 km from the crater, based on a Skysat satellite image. Several Strombolian explosions occurred within the crater; activity on 15 June was higher energy and ejected blocks 200-300 m on the NE slope. Surveillance cameras showed white gas-and-steam emissions rising 480 m above the crater on 16 June. On 19 and 24 June low-intensity Strombolian activity was observed, ejecting material as far as 200 m from the center of the crater to the E.
During July, seismicity included 29,319 LP-type events, 3,736 TR-type events, and two VT-type events. DOAS equipment recorded two days of sulfur dioxide emissions of 4,220 t/d and 1,009 t/d on 1 and 13 July, respectively. Constant nighttime incandescence was also recorded and was particularly noticeable when accompanied by eruptive columns on 12 and 16 July. Minor explosive events were detected in the crater. According to Skysat satellite images taken on 12, 13, and 16 July, ashfall deposits were identified 155 m S of the crater. According to POVI, incandescence was visible from two vents on the crater floor around 0336 on 12 July. Gas-and-ash emissions rose as high as 1.2 km above the crater on 13 July and drifted E and NW. A series of gas-and-steam pulses containing some ash deposited material on the upper E flank around 1551 on 13 July. During 16-31 July, average sulfur dioxide emissions of 1,679 ± 406 t/d were recorded, with a maximum daily value of 2,343 t/d on 28 July. Fine ash emissions were also reported on 16, 17, and 23 July.
Seismicity persisted during August, characterized by 27,011 LP-type events, 3,323 TR-type events, and three VT-type events. The average value of sulfur dioxide measurements taken during 1-15 August was 1,642 ± 270 t/d and 2,207 ± 4,549 t/d during 16-31 August, with a maximum daily value of 3,294 t/d on 27 August. Nighttime crater incandescence remained visible in degassing columns. White gas-and-steam emissions rose 480 m above the crater on 6 August. According to a Skysat satellite image from 6 August, ash accumulation was observed proximal to the crater and was mainly distributed toward the E slope. White gas-and-steam emissions rose 320 m above the crater on 26 August. Nighttime incandescence and Strombolian activity that generated ash emissions were reported on 27 August.
Seismicity during September was characterized by five VT-type events, 12,057 LP-type events, and 2,058 TR-type events. Nighttime incandescence persisted. On 2 September an ash emission rose 180 m above the crater and drifted SE at 1643 (figure 125) and a white gas-and-steam plume rose 320 m above the crater. According to the Buenos Aires VAAC, periods of continuous gas-and-ash emissions were visible in webcam images from 1830 on 2 September to 0110 on 3 September. Strombolian activity was observed on 2 September and during the early morning of 3 September, the latter event of which generated an ash emission that rose 60 m above the crater and drifted 100 m from the center of the crater to the NE and SW. Ashfall was reported to the SE and S as far as 750 m from the crater. The lava lake was active during 3-4 September and lava fountaining was visible for the first time since 26 March 2023, according to POVI. Fountains captured in webcam images at 2133 on 3 September and at 0054 on 4 September rose as high as 60 m above the crater rim and ejected material onto the upper W flank. Sulfur dioxide flux of 1,730 t/d and 1,281 t/d was measured on 3 and 4 September, respectively, according to data obtained by DOAS equipment.
Strong Strombolian activity and larger gas-and-ash plumes were reported during 18-20 September. On 18 September activity was also associated with energetic LP-type events and notable sulfur dioxide fluxes (as high as 4,277 t/d). On 19 September Strombolian activity and incandescence were observed. On 20 September at 0914 ash emissions rose 50 m above the crater and drifted SSE, accompanied by Strombolian activity that ejected material less than 100 m SSE, causing fall deposits on that respective flank. SERNAGEOMIN reported that a Planet Scope satellite image taken on 20 September showed the lava lake in the crater, measuring 32 m x 35 m and an area of 0.001 km2. Several ash emissions were recorded at 0841, 0910, 1251, 1306, 1312, 1315, and 1324 on 23 September and rose less than 150 m above the crater. The sulfur dioxide flux value was 698 t/d on 23 September and 1,097 t/d on 24 September. On 24 September the Volcanic Alert Level (VAL) was raised to Orange (the third level on a four-color scale). SENAPRED maintained the Alert Level at Yellow (the middle level on a three-color scale) for the communities of Villarrica, Pucón (16 km N), Curarrehue, and Panguipulli.
During 24-25 September there was an increase in seismic energy (observed at TR-events) and acoustic signals, characterized by 1 VT-type event, 213 LP-type events, and 124 TR-type events. Mainly white gas-and-steam emissions, in addition to occasional fine ash emissions were recorded. During the early morning of 25 September Strombolian explosions were reported and ejected material 250 m in all directions, though dominantly toward the NW. On 25 September the average value of sulfur dioxide flux was 760 t/d. Seismicity during 25-30 September consisted of five VT-type events, 1,937 LP-type events, and 456 TR-type events.
During 25-29 September moderate Strombolian activity was observed and ejected material as far as the crater rim. In addition, ash pulses lasting roughly 50 minutes were observed around 0700 and dispersed ENE. During 26-27 September a TR episode lasted 6.5 hours and was accompanied by discrete acoustic signals. Satellite images from 26 September showed a spatter cone on the crater floor with one vent that measured 10 x 14 m and a smaller vent about 35 m NE of the cone. SERNAGEOMIN reported an abundant number of bomb-sized blocks up to 150 m from the crater, as well as impact marks on the snow, which indicated explosive activity. A low-altitude ash emission was observed drifting NW around 1140 on 28 September, based on webcam images. Between 0620 and 0850 on 29 September an ash emission rose 60 m above the crater and drifted NW. During an overflight taken around 1000 on 29 September scientists observed molten material in the vent, a large accumulation of pyroclasts inside the crater, and energetic degassing, some of which contained a small amount of ash. Block-sized pyroclasts were deposited on the internal walls and near the crater, and a distal ash deposit was also visible. The average sulfur dioxide flux measured on 28 September was 344 t/d. Satellite images taken on 29 September ashfall was deposited roughly 3 km WNW from the crater and nighttime crater incandescence remained visible. The average sulfur dioxide flux value from 29 September was 199 t/d. On 30 September at 0740 a pulsating ash emission rose 1.1 km above the crater and drifted NNW (figure 126). Deposits on the S flank extended as far as 4.5 km from the crater rim, based on satellite images from 30 September.
Infrared MODIS satellite data processed by MIROVA (Middle InfraRed Observation of Volcanic Activity) showed intermittent thermal activity during April through September, with slightly stronger activity detected during late September (figure 127). Small clusters of thermal activity were detected during mid-June, early July, early August, and late September. According to the MODVOLC thermal alert system, a total of four thermal hotspots were detected on 7 July and 3 and 23 September. This activity was also intermittently captured in infrared satellite imagery on clear weather days (figure 128).
Geologic Background. The glacier-covered Villarrica stratovolcano, in the northern Lakes District of central Chile, is ~15 km south of the city of Pucon. A 2-km-wide caldera that formed about 3,500 years ago is located at the base of the presently active, dominantly basaltic to basaltic andesite cone at the NW margin of a 6-km-wide Pleistocene caldera. More than 30 scoria cones and fissure vents are present on the flanks. Plinian eruptions and pyroclastic flows that have extended up to 20 km from the volcano were produced during the Holocene. Lava flows up to 18 km long have issued from summit and flank vents. Eruptions documented since 1558 CE have consisted largely of mild-to-moderate explosive activity with occasional lava effusion. Glaciers cover 40 km2 of the volcano, and lahars have damaged towns on its flanks.
Information Contacts: Servicio Nacional de Geología y Minería (SERNAGEOMIN), Observatorio Volcanológico de Los Andes del Sur (OVDAS), Avda Sta María No. 0104, Santiago, Chile (URL: http://www.sernageomin.cl/); Proyecto Observación Villarrica Internet (POVI) (URL: http://www.povi.cl/); Sistema y Servicio Nacional de Prevención y Repuesta Ante Desastres (SENAPRED), Av. Beauchef 1671, Santiago, Chile (URL: https://web.senapred.cl/); Buenos Aires Volcanic Ash Advisory Center (VAAC), Servicio Meteorológico Nacional-Fuerza Aérea Argentina, 25 de mayo 658, Buenos Aires, Argentina (URL: http://www.smn.gov.ar/vaac/buenosaires/inicio.php); MIROVA (Middle InfraRed Observation of Volcanic Activity), a collaborative project between the Universities of Turin and Florence (Italy) supported by the Centre for Volcanic Risk of the Italian Civil Protection Department (URL: http://www.mirovaweb.it/); Hawai'i Institute of Geophysics and Planetology (HIGP) - MODVOLC Thermal Alerts System, School of Ocean and Earth Science and Technology (SOEST), Univ. of Hawai'i, 2525 Correa Road, Honolulu, HI 96822, USA (URL: http://modis.higp.hawaii.edu/); Copernicus Browser, Copernicus Data Space Ecosystem, European Space Agency (URL: https://dataspace.copernicus.eu/browser/).
Merapi (Indonesia) — October 2023 Cite this Report
Merapi
Indonesia
7.54°S, 110.446°E; summit elev. 2910 m
All times are local (unless otherwise noted)
Frequent incandescent avalanches during April-September 2023
Merapi, located just north of the major city of Yogyakarta in central Java, Indonesia, has had activity within the last 20 years characterized by pyroclastic flows and lahars accompanying growth and collapse of the steep-sided active summit lava dome. The current eruption period began in late December 2020 and has more recently consisted of ash plumes, intermittent incandescent avalanches of material, and pyroclastic flows (BGVN 48:04). This report covers activity during April through September 2023, based on information from Balai Penyelidikan dan Pengembangan Teknologi Kebencanaan Geologi (BPPTKG), the Center for Research and Development of Geological Disaster Technology, a branch of PVMBG which specifically monitors Merapi. Additional information comes from the Pusat Vulkanologi dan Mitigasi Bencana Geologi (PVMBG, also known as Indonesian Center for Volcanology and Geological Hazard Mitigation, CVGHM), MAGMA Indonesia, the Darwin Volcanic Ash Advisory Centre (VAAC), and various satellite data.
Activity during April through September 2023 primarily consisted of incandescent avalanches of material that mainly affected the SW and W flanks and traveled as far as 2.3 km from the summit (table 25) and white gas-and-steam emissions that rose 10-1,000 m above the crater.
Table 25. Monthly summary of avalanches and avalanche distances recorded at Merapi during April through September 2023. The number of reported avalanches does not include instances where possible avalanches were heard but could not be visually confirmed as a result of inclement weather. Data courtesy of BPPTKG (April-September 2023 daily reports).
| Month |
Average number of avalanches per day |
Distance avalanches traveled (m) |
| Apr 2023 |
19 |
1,200-2,000 |
| May 2023 |
22 |
500-2,000 |
| Jun 2023 |
18 |
1,200-2,000 |
| Jul 2023 |
30 |
300-2,000 |
| Aug 2023 |
25 |
400-2,300 |
| Sep 2023 |
23 |
600-2,000 |
BPPTKG reported that during April and May white gas-and-steam emissions rose 10-750 m above the crater, incandescent avalanches descended 500-2,000 m on the SW and W flanks (figure 135). Cloudy weather often prevented clear views of the summit, and sometimes avalanches could not be confirmed. According to a webcam image, a pyroclastic flow was visible on 17 April at 0531. During the week of 28 April and 4 May a pyroclastic flow was reported on the SW flank, traveling up to 2.5 km. According to a drone overflight taken on 17 May the SW lava dome volume was an estimated 2,372,800 cubic meters and the dome in the main crater was an estimated 2,337,300 cubic meters.
During June and July similar activity persisted with white gas-and-steam emissions rising 10-350 m above the crater and frequent incandescent avalanches that traveled 300-2,000 m down the SW, W, and S flanks (figure 136). Based on an analysis of aerial photos taken on 24 June the volume of the SW lava dome was approximately 2.5 million cubic meters. A pyroclastic flow was observed on 5 July that traveled 2.7 km on the SW flank. According to the Darwin VAAC multiple minor ash plumes were identified in satellite images on 19 July that rose to 3.7 km altitude and drifted S and SW. During 22, 25, and 26 July a total of 17 avalanches descended as far as 1.8 km on the S flank.
Frequent white gas-and-steam emissions continued during August and September, rising 10-450 m above the crater. Incandescent avalanches mainly affected the SW and W flanks and traveled 400-2,300 m from the vent (figure 137). An aerial survey conducted on 10 August was analyzed and reported that estimates of the SW dome volume was 2,764,300 cubic meters and the dome in the main crater was 2,369,800 cubic meters.
Frequent and moderate-power thermal activity continued throughout the reporting period, according to a MIROVA (Middle InfraRed Observation of Volcanic Activity) analysis of MODIS satellite data (figure 138). There was an increase in the number of detected anomalies during mid-May. The MODVOLC thermal algorithm recorded a total of 47 thermal hotspots: six during April, nine during May, eight during June, 15 during July, four during August, and five during September. Some of this activity was captured in infrared satellite imagery on clear weather days, sometimes accompanied by incandescent material on the SW flank (figure 139).
Geologic Background. Merapi, one of Indonesia's most active volcanoes, lies in one of the world's most densely populated areas and dominates the landscape immediately north of the major city of Yogyakarta. It is the youngest and southernmost of a volcanic chain extending NNW to Ungaran volcano. Growth of Old Merapi during the Pleistocene ended with major edifice collapse perhaps about 2,000 years ago, leaving a large arcuate scarp cutting the eroded older Batulawang volcano. Subsequent growth of the steep-sided Young Merapi edifice, its upper part unvegetated due to frequent activity, began SW of the earlier collapse scarp. Pyroclastic flows and lahars accompanying growth and collapse of the steep-sided active summit lava dome have devastated cultivated lands on the western-to-southern flanks and caused many fatalities.
Information Contacts: Balai Penyelidikan dan Pengembangan Teknologi Kebencanaan Geologi (BPPTKG), Center for Research and Development of Geological Disaster Technology (URL: http://merapi.bgl.esdm.go.id/, Twitter: @BPPTKG); MAGMA Indonesia, Kementerian Energi dan Sumber Daya Mineral (URL: https://magma.esdm.go.id/v1); Pusat Vulkanologi dan Mitigasi Bencana Geologi (PVMBG, also known as Indonesian Center for Volcanology and Geological Hazard Mitigation, CVGHM), Jalan Diponegoro 57, Bandung 40122, Indonesia (URL: http://www.vsi.esdm.go.id/); Darwin Volcanic Ash Advisory Centre (VAAC), Bureau of Meteorology, Northern Territory Regional Office, PO Box 40050, Casuarina, NT 0811, Australia (URL: http://www.bom.gov.au/info/vaac/); MIROVA (Middle InfraRed Observation of Volcanic Activity), a collaborative project between the Universities of Turin and Florence (Italy) supported by the Centre for Volcanic Risk of the Italian Civil Protection Department (URL: http://www.mirovaweb.it/); Hawai'i Institute of Geophysics and Planetology (HIGP) - MODVOLC Thermal Alerts System, School of Ocean and Earth Science and Technology (SOEST), Univ. of Hawai'i, 2525 Correa Road, Honolulu, HI 96822, USA (URL: http://modis.higp.hawaii.edu/); Copernicus Browser, Copernicus Data Space Ecosystem, European Space Agency (URL: https://dataspace.copernicus.eu/browser/); Øystein Lund Andersen (URL: https://www.oysteinlundandersen.com/, https://twitter.com/oysteinvolcano).
Ebeko
Russia
50.686°N, 156.014°E; summit elev. 1103 m
All times are local (unless otherwise noted)
Moderate explosive activity with ash plumes continued during June-November 2023
Ebeko, located on the N end of Paramushir Island in Russia’s Kuril Islands just S of the Kamchatka Peninsula, consists of three summit craters along a SSW-NNE line at the northern end of a complex of five volcanic cones. Observed eruptions date back to the late 18th century and have been characterized as small-to-moderate explosions from the summit crater, accompanied by intense fumarolic activity. The current eruptive period began in June 2022, consisting of frequent explosions, ash plumes, and thermal activity (BGVN 47:10, 48:06). This report covers similar activity during June-November 2023, based on information from the Kamchatka Volcanic Eruptions Response Team (KVERT) and satellite data.
Moderate explosive activity continued during June-November 2023 (figures 50 and 51). According to visual data from Severo-Kurilsk, explosions sent ash 2-3.5 km above the summit (3-4.5 km altitude) during most days during June through mid-September. Activity after mid-September was slightly weaker, with ash usually reaching less than 2 km above the summit. According to KVERT the volcano in October and November was, with a few exceptions, either quiet or obscured by clouds that prevented satellite observations. KVERT issued Volcano Observatory Notices for Aviation (VONA) on 8 and 12 June, 13 and 22 July, 3 and 21 August, and 31 October warning of potential aviation hazards from ash plumes drifting 3-15 km from the volcano. Based on satellite data, KVERT reported a persistent thermal anomaly whenever weather clouds permitted viewing.
Geologic Background. The flat-topped summit of the central cone of Ebeko volcano, one of the most active in the Kuril Islands, occupies the northern end of Paramushir Island. Three summit craters located along a SSW-NNE line form Ebeko volcano proper, at the northern end of a complex of five volcanic cones. Blocky lava flows extend west from Ebeko and SE from the neighboring Nezametnyi cone. The eastern part of the southern crater contains strong solfataras and a large boiling spring. The central crater is filled by a lake about 20 m deep whose shores are lined with steaming solfataras; the northern crater lies across a narrow, low barrier from the central crater and contains a small, cold crescentic lake. Historical activity, recorded since the late-18th century, has been restricted to small-to-moderate explosive eruptions from the summit craters. Intense fumarolic activity occurs in the summit craters, on the outer flanks of the cone, and in lateral explosion craters.
Information Contacts: Kamchatka Volcanic Eruptions Response Team (KVERT), Far Eastern Branch, Russian Academy of Sciences, 9 Piip Blvd., Petropavlovsk-Kamchatsky, 683006, Russia (URL: http://www.kscnet.ru/ivs/kvert/).
Search Bulletin Archive by Publication Date
Select a month and year from the drop-downs and click "Show Issue" to have that issue displayed in this tab.
The default month and year is the latest issue available.
Bulletin of the Global Volcanism Network - Volume 35, Number 04 (April 2010)
Managing Editor: Edward Venzke
Dukono (Indonesia)
Intermittent ash plumes from January 2009 through May 2010
Eyjafjallajokull (Iceland)
Large explosions from the summit crater; ash plumes close airspace in Europe
Nyiragongo (DR Congo)
Lava fountaining, gas plumes, and tremor during January-May 2009
San Cristobal (Nicaragua)
Intermittent ash plumes and gas emissions during April 2006-June 2009
Ubinas (Peru)
Frequent ash plumes between July 2008 and August 2009
Villarrica (Chile)
Lava lake in summit crater very active beginning in April 2010
Dukono
Indonesia
1.6992°N, 127.8783°E; summit elev. 1273 m
All times are local (unless otherwise noted)
Intermittent ash plumes from January 2009 through May 2010
Minor ash plumes had continued to be intermittently reported from this long-active volcano during October 2008-January 2009 (BGVN 33:11). The Darwin VAAC has provided continuous monitoring of the activity through satellite surveillance (table 10).
Table 10. Ash plumes reported from Dukono between 7 January 2009 and 30 May 2010 (UTC). Data from the Darwin Volcanic Ash Advisory Centre.
| Date (UTC) |
Plume Altitude |
Plume Direction |
Plume Distance |
| 07 Jan 2009 |
1.8 km |
E and SE |
-- |
| 18 Jan 2009 |
3 km |
NE and N |
-- |
| 09-11 Feb 2009 |
3 km |
E and SE |
-- |
| 12 Apr 2009 |
3 km |
NW |
55 km |
| 28 Apr 2009 |
4.5 km |
E |
150 km |
| 29 Apr-04 May 2009 |
3.7-4.5 km (pilot report) |
E and NE |
45-165 km |
| 05-07 May 2009 |
3-3.7 km |
SE |
20-110 km |
| 14 May 2009 |
3 km |
N |
110 km |
| 26 May 2009 |
3 km |
N |
90 km |
| 27-28 May 2009 |
3 km |
NE |
55-110 km |
| 06-08 Jun 2009 |
? |
NW and N |
20-75 km |
| 16 Jun 2009 |
1.5 km |
NE |
40 km |
| 28 Jun 2009 |
2.4 km |
N |
75 km |
| 05 Jul 2009 |
2.4 km |
E |
65 km |
| 07-08 Jul 2009 |
2.4 km |
NE |
85 km |
| 06-07, 10 Aug 2009 |
2.4-3 km |
NE |
45-130 km |
| 15 Aug 2009 |
3 km |
NW |
90 km |
| 26 Aug-01 Sep 2009 |
2.1 km |
NE |
20-65 km |
| 07-08 Sep 2009 |
2.1 km |
E and SE |
35-75 km |
| 12, 14 Sep 2009 |
2.4 km |
W and SW |
25-75 km |
| 17-20 Sep 2009 |
2.4 km |
NE and ESE |
25-75 km |
| 24 Sep 2009 |
2.4 km |
NW |
65 km |
| 02 Oct 2009 |
2.7 km |
NE |
75 km |
| 06 Oct 2009 |
3 km |
NE |
55 km |
| 07 Oct 2009 |
3 km |
NW |
74 km |
| 15 Oct 2009 |
2.4 km |
NW |
45 km |
| 22-23, 26-27 Oct 2009 |
2.1-2.4 km |
NE and E |
45-95 km |
| 31 Oct 2009 |
1.5 km |
NE and N |
35-110 km |
| 08 Nov 2009 |
3 km |
NW |
35 km |
| 30 Nov 2009 |
3 km |
E |
75 km |
| 05-06 Dec 2009 |
3 km |
E and SE |
55-85 km |
| 09-11 Dec 2009 |
3 km |
E and SE |
90-130 km |
| 05-06, 10 Feb 2010 |
2.4 km |
SW and W |
55-150 km |
| 13 Mar 2010 |
2.7 km |
E |
75 km |
| 22 Mar 2010 |
2.4 km |
SE |
45 km |
| 02 Apr 2010 |
2.4 km |
S |
55 km |
| 09 Apr 2010 |
3.7 km |
NE |
220 km |
| 10-12 Apr 2010 |
1.5-2.1 km |
NE |
20-75 km |
| 27 Apr 2010 |
3 km |
NW |
45 km |
| 03 May 2010 |
3 km |
W |
90 km |
| 04 May 2010 |
3 km |
NW, NE, SE |
25-100 km |
| 06 May 2010 |
4.6 km (pilot report) |
NW |
-- |
| 08-10 May 2010 |
3 km |
NW, NE, SE |
25-100 km |
| 16 May 2010 |
3 km |
W |
165 km |
| 18 May 2010 |
3 km |
NW |
165 km |
Dukono's visible plume was almost continuous between January 2009 and February 2010 with only two short periods of quiescence for about eight weeks between mid-February and mid-April 2009 and eight weeks from 11 December 2009 to 5 February 2010. Three periods of relatively stronger activity occurred in late April through 28 May 2009 and created ash plumes that drifted the greatest distances, 110-150 km. A higher level of activity occurred again in early to mid-August and in early December 2009 just before the second period of reduced activity. Two recent MODVOLC thermal alerts occurred on 30 May 2010; they were detected on both the Terra and Aqua satellites.
Geologic Background. The Dukono complex in northern Halmahera is on an edifice with a broad, low profile containing multiple peaks and overlapping craters. Almost continuous explosive eruptions, sometimes accompanied by lava flows, have occurred since 1933. During a major eruption in 1550 CE, a lava flow filled in the strait between Halmahera and the Gunung Mamuya cone, 10 km NE. Malupang Wariang, 1 km SW of the summit crater complex, contains a 700 x 570 m crater that has also had reported eruptions.
Information Contacts: Darwin Volcanic Ash Advisory Centre (VAAC), Bureau of Meteorology, Northern Territory Regional Office, PO Box 40050, Casuarina, NT 0811, Australia (URL: http://www.bom.gov.au/info/vaac/); Center of Volcanology and Geological Hazard Mitigation (CVGHM), Jalan Diponegoro 57, Bandung 40122, Indonesia (URL: http://vsi.esdm.go.id/); Hawai'i Institute of Geophysics and Planetology (HIGP) Thermal Alerts System, School of Ocean and Earth Science and Technology (SOEST), University of Hawai'i, 2525 Correa Road, Honolulu, HI 96822, USA (URL: http://modis.higp.hawaii.edu/).
Eyjafjallajokull (Iceland) — April 2010 Cite this Report
Eyjafjallajokull
Iceland
63.633°N, 19.633°W; summit elev. 1651 m
All times are local (unless otherwise noted)
Large explosions from the summit crater; ash plumes close airspace in Europe
During March 2010 the Icelandic Meteorological Office (IMO) and the Nordic Volcanological Center of the University of Iceland Institute of Earth Sciences (IES) reported seismic activity followed by an eruption of Eyjafjallajökull (BGVN 35:03), the first since 1823. During an initial eruptive phase from 20 March to 12 April 2010, lava flowed from fissures on Eyjafjallajökull's ENE flank. After a short hiatus in eruptive activity, an explosive eruptive phase began on 14 April under the ice-covered central summit caldera. The resulting plume caused an unprecedented disruption of air traffic and closure of airspace over northern and central Europe.
In the early morning of 14 April, the ash-loaded eruption plume rose to more than 8 km altitude and blew E. The eruption plume reached mainland Europe on 15 April, triggering the closure of airspace over large areas. Closure decisions by civil authorities were based on ash dispersal modeling provided by the London Volcanic Ash Advisory Center (VAAC), which is based in the United Kingdom's Met Office (figure 11). On 16 April some variability occurred in seismic tremor and tephra generation, but overall the eruptive pace remained stable and large closures of airspace continued.
The IES estimated the amount of erupted material during the first 72 hours of the eruption at the summit caldera (14-17 April 2010). Erupted products consisted of fragmental material, the majority being fine-grained airborne tephra. Some of the tephra came to rest in the ice cauldrons around the vents (in terms of uncompacted volume, 30 x 106 m3), some began filling the Gígjökulslón lagoon after transport by floods down the N-flank Gígjökull outlet glacier (10 x 106 m3), and airborne tephra blown to the E and S (100 x 106 m3). These uncompacted tephra volumes correspond to 70-80 x 106 m3 of dense magma, leading to an average magma discharge rate of ~ 300 m3/s. This was 10-20 times the average discharge rate in the preceeding flank eruption at Fimmvörduháls. Chemical analyses of ash samples revealed fluorine-rich intermediate eruptive products with silica content of 58%, more evolved than in the initial lava-producing phase of the eruptive activity (see table in BGVN 34:03).
On 17 April the ash plume rose to over 8 km altitude, blowing first to the E, and then, after about 0341 that day, blowing to the S. Ash fell around the volcano and there were at least 115 lightning strikes in vicinity of the eruption. When ash emissions on 17 April (figure 12) blew S they created an optically thicker band of ash that appeared to be surrounded by a much wider, less optically dense plume (figure 13). NASA analysts determined that the ash plumes were at two different altitudes, the narrow, more concentrated plume was above the more diffuse cloud, casting a shadow on the ash below. They said that according to the Icelandic Met Office, the upper parts of 17 April ash puffs reached 4.9-7.3 km altitude.
The 17 April example illustrates the difficulty of estimating the critical 'source terms' (boundary conditions) for modeling ash plume dispersal. Such models, which are regularly run by groups such as VAACs, volcano observatories, and their associated agencies, help assess where plumes might go in conditions such as darkness and overcast weather.
After about 1100 on 18 April, tremor intensified beyond levels maintained since 16 April. Daily solutions from continuous, 15-second GPS stations operated by IMO and IES, revealed centimeter-scale horizontal movements toward the center of the volcano, with some stations also registering centimeter-scale vertical elevation decreases. Tremor with a dominant frequency of 0.5 Hz remained continuous during this second eruptive phase.
During overflights on 19 April it was apparent that the ice cauldrons over the eruption site had melted back, forming a much larger cauldron ~ 2.5 km in diameter. Following an initial period of glacial flooding on 14-15 April, relatively little water drained from the ice cap's N flank. A largely open pathway for drainage in that direction, over and through the Gígjökull glacier, suggested significant meltwater would not pond at the eruption site.
On 19 April the plume rose only 600-900 m above the volcano's 1.7-km-high summit, yet as it drifted S it ascended to an altitude of 6.1 km. Later in the afternoon reports indicated maximum plume height around 4.6 km with ash clearly visible in the clouds. Samples collected 19 April show the same composition as early in the explosive phase, but the fluorine content was higher. Tephra deposited next to the craters was 20-30 m thick. Analogous conditions continued to exist for the following week.
Although there had been magma spatter at the vent area by 20 April, no significant lava flow had yet been detected. Heavy sound blasts were heard nearby, especially S and E of the mountain. Radar images acquired that day by the Icelandic Coast Guard showed no changes in the size of the cauldron since 19 April. Latest results from GPS stations showed deflation.
On 21 April, the eruption continued with less explosive activity. The eruption rate, estimated to be less than 30 m3/s (with a large uncertainty), was inferred to have declined over last few days to become an order of magnitude smaller than during the initial 72 hours of this phase. The northernmost one of two main craters in the summit caldera was active, and phreatomagmatic explosions occurred with some lava spatter at craters. Plume altitude was ~ 3-4 km, with local tephra dispersal towards the S.
Lava flows towards the N were thought to have begun around noon on 21 April. Evidence for this was the onset of semi-continuous discharge of meltwater from Gígjökull, steam rising from the N margin of the ice cauldron, and variations in tremor amplitude.
Beginning about 24 April the IES website contained detailed daily status reports of the eruption. Over the next few days there was little change, with the N crater remaining active, generating mild explosive activity and spatter. Steam plumes were rising where the N-flowing lava met ice.
The eruption site was seen clearly during an overflight on 27 April. The eruptive activity in the N ice cauldron was seen to be similar to conditions during the preceding four days, but a new crater had formed in the cauldron's SW corner. Erupted material continued to accumulate on the flanks of the crater. The rim of the crater was ~ 50 m lower than the surface of the surrounding ice cauldron. Spatter escaped the vent, reaching heights of 100-200 m. Unstable plumes of ash rose regularly from the vent. Lava continued to flow N, advancing ~ 1 km from the crater.
After an slight decrease in explosive activity early in May, activity then increased somewhat. The eruption was mixed, with the lava-producing phase being larger than the explosive phase. During this time, the plume was darker and wider than in the preceding week. Near-source tephra fall-out increased. On 4 May a flight by the Icelandic Coast Guard showed that the crater continued buildup in the northern-most ice cauldron. Lava flowed N and spread at an elevation of 500 m. The lava flow was about 200 m wide and lava channels that enter this flow were ~ 30-60 m wide. Increased seismicity up to 13 May suggested that new material was intruding from depth, and GPS observations indicated inflation.
Little change in activity was observed during 11-17 May. On 18 May an ongoing explosive eruption plume was mostly steady at 7 km altitude; the rate of magma eruption was over 200 tonnes/second. Tephra fallout was detected mainly to the NE, with some reaching the coast. Some tephra dispersed towards the W in the afternoon. The height of the ash plume decreased from 18-21 May, suggesting magma emission rates considerably less than 50 tonnes/second. By 21-22 May only a weak plume rose from the W part of the crater; both explosions and lava flows from the crater were absent. During 23-25 May there was no apparent eruptive activity, though there was still a considerable amount of steam coming from the crater. Aerial observers on 25 May (figure 14) saw blue smog (sulfuric gases) and smelled sulfur. Scientists who went to the crater on 25 May saw a small blast of ash, but mostly steam.
On a 26 May IES expedition to the summit, tephra deposits in and around the E half of the crater were measured to be ~ 40 m thick close to the craters. Intense steam rose from the craters, with occasional small ashy explosions. Noise of intense boiling and or degassing came from the craters. Visibility to the bottom was limited due to steam. The crater rim was coated with fine ash that extended ~ 20 m out from the edge. A strong smell of sulfur came from around the craters.
IES and IMO reported widespread drifting of existing ash SW on 1 June, with abundant airborne dust in the capitol, Reykjavík. No lightning strikes were detected, and there was low discharge of meltwater from Gígjökull. Volcanic tremor was still higher than before the eruption, being rather steady since 22 May, but small pulses, mostly on the lowest frequency, were detected. Several small and shallow earthquakes under the volcano occurred on a daily basis. No significant GPS deformation was measured. There was still a considerable amount of steam coming from the crater.
Recent precursory intrusions. According to Sturkell and others (2009), "In 1994, and again in 1999, magma intrusion was detected under the southern slopes of Eyjafjallajokull. These intrusions had their center of uplift approximately 4 km southeast of the summit crater of the volcano and were associated with considerable seismic activity. After the intrusion event in 1999, crustal deformation and earthquake activity at Eyjafjallajokull have remained low." However, according to Pall Einarsson of IES, earthquake swarms and two more sill intrusions took place in 2009 (Einarsson, 2010).
Aviation impacts. According to Wall and Flottau (2010), more than 100,000 flights were canceled after the ash plume caused aviation authorities in many parts of Europe to close their airspace for several days. As compared with the same day of the previous week, flights decreased from about 27% on 15 April 2010 to almost 80% on 17-18 April, returning to 21% by 22 April. Wall, Flottau, and Mecham (2010) noted the difficulty if assessing the risk of flying through volcanic ash plumes which can have varying particulate concenrations and compositions.
The Finnish Air Force (FAF) Command Operations Division released a report of 21 April discussing jet engine damage from airborne ash from Iceland; at the time of this writing, the report was only available in Finnish. Routes of several FAF aircraft (figure 15) suggest that the flight distances were on the order of a few hundred kilometers. The Flightglobal website reported the FAF released images showing the effects of volcanic dust ingestion from inside the engines of a jet fighter that flew through the ash cloud on the morning of 15 April. One aircraft engine showed melted ash clearly visible on an interior surface. Another jet trainer flew through the plume carrying an air sampling pod to collect dust from the atmosphere at various altitudes, however the measurements have yet to be reported.
References. Einarsson, P., 2010, The Eyjafjallajökull volcano, Iceland: Tectonic setting, structure, and magma plumbing during the current activity, Cities on Volcanoes (COV6), 30 May to 4 June 2010, Tenerife; 4.1-O-10.
Sturkell, E., Einarsson, P., Sigmundsson, F., Hooper, A., Ófeigsson, B.G., Geirsson, H., and Ólafsson, H., 2009, Katla and Eyjafjallajökull volcanoes, in Schomacker, A., Krüger. J., and Kjr, K.H., eds., The Mrdalsjökull Ice cap, Iceland - Glacial processes, sediments and landforms on an active volcano: Developments in Quaternary Sciences, v. 13, p. 5-12.
Wall, R., and Flottau, J., 2010. Out of the ashes: Rising losses and recriminations rile Europe's air transport sector: Aviation Week & Space Technology, v. 172, no. 16, p.23-25.
Wall, R., Flottau, J., and Mecham, M., 2010, Dirty little secret: Volcanic eruption raises more than dust as questions about flight safety fly: Aviation Week & Space Technology, v. 172, no. 16, p. 24-26.
Geologic Background. Eyjafjallajökull (also known as Eyjafjöll) is located west of Katla volcano. It consists of an elongated ice-covered stratovolcano with a 2.5-km-wide summit caldera. Fissure-fed lava flows occur on both the E and W flanks, but are more prominent on the western side. Although the volcano has erupted during historical time, it has been less active than other volcanoes of Iceland's eastern volcanic zone, and relatively few Holocene lava flows are known. An intrusion beneath the S flank from July-December 1999 was accompanied by increased seismic activity. The last historical activity prior to an eruption in 2010 produced intermediate-to-silicic tephra from the central caldera during December 1821 to January 1823.
Information Contacts: University of Iceland Institute of Earth Sciences (EIS), Nordic Volcanological Center, Sturlugata 7, Askja, 101 Reykjavik, Iceland (URL: http://www.earthice.hi.is/page/ies_volcanoes) [contributors:Páll Einarsson, ásta Rut Hjartardóttir, Magnus Tumi Gudmundsson, Freysteinn Sigmundsson, Eyjólfur Magnússon, Niels Oskarsson, Gudrun Larsen, Sigrun Hreinsdottir, Rikke Pedersen, Ingibjörg Jónsdóttir]; Icelandic Meteorological Office (IMO) (URL: http://en.vedur.is/) [Contributors:Steinunn Jakobsdóttir, Kristin S. Vogfjord, Sigurlaug Hjaltadottir, Gunnar B. Gudmundsson, Matthew J. Roberts; London VAAC (URL: http://www.metoffice.gov.uk/aviation/vaac/vaacup_vag.html); NASA Earth Observatory (URL: http://earthobservatory.nasa.gov/); Flightglobal (URL: http://www.flightglobal.com/articles/2010/04/16/340727/pictures-finnish-F-18-engine-check reveals effects of volcanic dust-16-04-2010-London-Flightglobal_com.mht).
Nyiragongo (DR Congo) — April 2010 Cite this Report
Nyiragongo
DR Congo
1.52°S, 29.25°E; summit elev. 3470 m
All times are local (unless otherwise noted)
Lava fountaining, gas plumes, and tremor during January-May 2009
The last major eruption from Nyiragongo, in January 2002, sent lava flows into the city of Goma (BGVN 26:12). Prior to that eruption the status of the lava lake in the summit crater, active almost continuously since 1894, had been uncertain. However, fieldworkers in mid-May 2002 noted lava fountaining on the crater floor (BGVN 27:05), and the lava lake has been active since that time. Our most recent report on Nyiragongo in January 2009 (BGVN 34:01) discussed the persistent lava lake, which at the time was visually observed to be rising.
This report is an abridgment of three separate reports to the Governor of the North Kivu Province of Democratic Republic of the Congo which were produced by the Goma Volcano Observatory (GVO). These reports cover January-March, 1-15 April, and 16 April-5 May 2009. Direct observations of the summit crater and the S-flank Shaheru crater, were also carried out in late March.
Seismicity. During January through 5 May, volcanic earthquake swarms and intermittent volcanic tremors were observed at the Bulengo and Rusayo stations (figure 39). Earthquakes generated high-amplitude tremor in March and April, as recorded at the Rusayu seismic station (figure 40). Approximately 80-190 long-period seismic events were recorded daily at the Rusayu station between January and April 2009. Long-period seismicity, which prevailed at the beginning of April, declined toward the end of the month, when long-duration tremor appeared.
During 1 April-5 May, five seismic stations were operational: Bulengo, Goma, Kibumba, Luboga, and Rusayu. Volcanic activity remained very intense (figure 41) and was characterized by long-period earthquakes (average of 140 per day). Several swarms were registered at Bulengo and at Kibumba. Intense activity was recorded at the Bulengo station during 16 April-5 May included tremor that lasted for days. At the Rusayu station, bands of tremors and short-period seismic events (tectonic-volcanic seismic events) were recorded. Short duration (seismic-tectonic) events were observed at the Luboga station, situated N of the Virunga region, which produced a 5.2-magnitude seismic event in October 2008.
Lava lake. Activity in the lava lake during January-March 2009 was characterized by large lava fountains, gas emissions, and ejections of scoria and Pele's hair. In late March, observers noted that the lake level had dropped by ~ 20 m since 27 February, and it remained 600 m below the summit through the rest of the reporting period. Typically the lake remained crusted over in its depression (figure 42), but significant lava fountaining occurred that was consistent with the night glow that was observed at times. Fountaining during 1-15 April increased in intensity along with the incandescence at the summit. Observers during 16 April-5 May noted that the lava lake overflowed from the current pit at several points along the NW and SW rims, and lava fountaining continued.
Gas plume. During January-March a large, almost permanent, gas plume above the volcano mixed with atmospheric clouds to produce acid rain that fell on nearby inhabited zones. On 1 April 2009, the gas plume changed direction toward the E (figure 43) and then toward the SE, while normally it blows W. The plume later became denser and at times appeared very black. Also visible at this time was the reflection of the lava fountains on the gas plume above the crater. The dense plume caused by the lava fountaining in the crater continued through 5 May (figure 44).
Additional observations. During the reporting period, observers noted that the edges of the crater were becoming more unstable. During late March, some collapse of material was seen toward the E part of the crater, and during 16 April-5 May collapse was reported to the SW. A team of scientists from the Goma Volcano Observatory conducted fieldwork from 22 to 24 March 2009.
Measurements at the summit taken on 27 March 2009 revealed a dilation (extension) of approximately 1 mm relative to October 2008. The Mugara fissure underwent a slight compression since that time. Additional measurements through 5 May showed no more than a 0.02 mm change.
Significant fumarolic activity was observed at the S-flank Shaheru crater on 24 March, along the fissures linking Shaheru to the central crater. Shaheru is one of three cones that make up the volcanic complex; the other cones are Baruta and Nyiragongo Central. During 16 April-5 May intermittent but abundant fumaroles along the length of the Shaheru fissure were observed. Also during this period, despite bad weather which obscured visibility, fumarolic columns were observed from the summit.
References. Tedesco, D., Badiali, L., Boschi, E., Papale, P., Tassi, F., Vaselli, O., Kasereka, C., Durieux, J., Denatale, G., Amato, A., Cattaneo, M., Ciraba, H., Chirico, G., Delladio, A., Demartin, M., Favalli, G., Franceschi, D., Lauciani, V., Mavonga, G., Onachesi, G., Pagliuca, N.M., Sorrentino, D., and Yalire, M., 2007, Cooperation on Congo Volcanic and Environmental Risks, Eos, Transactions, American Geophysical Union, v. 88, no. 16, p. 177, 181.
Geologic Background. The Nyiragongo stratovolcano contained a lava lake in its deep summit crater that was active for half a century before draining catastrophically through its outer flanks in 1977. The steep slopes contrast to the low profile of its neighboring shield volcano, Nyamuragira. Benches in the steep-walled, 1.2-km-wide summit crater mark levels of former lava lakes, which have been observed since the late-19th century. Two older stratovolcanoes, Baruta and Shaheru, are partially overlapped by Nyiragongo on the north and south. About 100 cones are located primarily along radial fissures south of Shaheru, east of the summit, and along a NE-SW zone extending as far as Lake Kivu. Many cones are buried by voluminous lava flows that extend long distances down the flanks, which is characterized by the eruption of foiditic rocks. The extremely fluid 1977 lava flows caused many fatalities, as did lava flows that inundated portions of the major city of Goma in January 2002.
Information Contacts: Dieudonné Wafula Mifundu and Célestin Kasereka Mahinda, Observatoire Volcanologique de Goma, Departement de Geophysique, Centre de Recherche en Sciences Naturelles, Lwiro, D.S. Bukavu, DR Congo.
San Cristobal (Nicaragua) — April 2010 Cite this Report
San Cristobal
Nicaragua
12.702°N, 87.004°W; summit elev. 1745 m
All times are local (unless otherwise noted)
Intermittent ash plumes and gas emissions during April 2006-June 2009
Activity at San Cristóbal reported by the Instituto Nicarag?ense de Estudios Territoriales (INETER) included ash explosions in December 2004 and November 2005 (BGVN 31:09). Activity continued in 2006, with frequent gas explosions, some with minor amounts of ash during January (80 explosions) and February (47 explosions). Ash explosions were noted in news reports on 6 March 2006, and additional phreatic explosions caused ashfall on 23 April (BGVN 31:09). Fieldwork by INETER staff, typically Vicente Perez, was usually done once per month to make crater observations and take fumarole temperatures. Tremor recorded from 2006 through 2009 was variable, corresponding largely to changes in gas output.
Activity during late April-December 2006. Seismicity remained high through 27 April, and an ash plume was photographed on the 25th (figure 13). Seismicity declined, but increased again during another episode of phreatic explosions that began on 18 May and continued until 27 May 2006. Observations at the summit crater during June-September 2006 revealed very little change, but rockfalls were heard. During fieldwork on 12 November there was abundant gas in the crater, and fumarole temperatures were unchanged.
Activity during 2007. Rockfall noises from landslides within the crater were heard on 12 January and 6 February 2007. Landslides from the E crater wall continued on 6 March. Crater visits on 21 May and 10 June were hampered by gas emissions, especially SO2 fumes. Water levels in the crater lakes, located in the western and southern parts of the crater, were high on 22 July because of the rainy season, resulting in increased gas emissions.
On 11 August Perez observed the main crater where he noted ongoing abundant gas emissions, fan-like sounds inside the new crater, and landslides on the S crater wall. Activity on 15 September consisted of landslides on the S and W slopes, and a strong sulfur odor. Visitors to the summit on 10 November reported abundant gas and saw ash and blocks ejected during explosive activity days earlier (days were not specified). The size of the ejecta ranged from 20 x 40 cm up to 120 x 90 cm. Perez reported on 6 December that abundant gas emissions were continuing in the N part of the inner crater, accompanied by loud noises. Small landslides on the N flank were seen later in the month.
Activity during 2008. The abundant gas emission continued into January 2008 but declined in February and March. Gas emissions in April appeared heavier. On 30 April heavy gas emanation accompanied jet engine noises from within the crater. On 4 May there were continuing abundant gas emissions.
On 11 June loud sounds from the bottom of the crater occurred at intervals of 15-20 minutes accompanied by abundant degassing. On 22 June a moderate explosion generated a gas-and-ash plume. The Civil Defence Center in Managua reported minor ashfall in the city of Chinandega (~ 16 km SW) and in the communities of La Bolsa, Valle de los Morenos, and Cosmapa. Weeks before the explosion on 22 June, the number of volcano-tectonic earthquakes had slowly increased to 300 earthquakes per day (figure 14). The slightly elevated activity continued during July. A gas-rich cloud continued being expelled from the crater, accompanied by loud rumbling. On the night of July 10 an episode of seismic tremors lasted several hours. The next morning, 11 July, a series of explosions ejected gas and ash that was blown W. Local residents reported minor ashfall in the cities of El Viejo (~ 18 km WSW) Chinandega.
In early August several small explosions of ash and gas occurred. Abundant degassing continued throughout September and October. On 18 October some collapse of the crater walls was noted. Throughout that period, seismicity was high and steadily increasing from 90 earthquakes/day in August to 120 per day in September and October. During October, audible noises were heard from the crater and landslides again occurred along the crater walls.
On 6 November degassing and strong noises originated from the crater floor. Seismic tremor began to increase on 13 November; a seismic swarm took place 17-19 November with earthquakes (magnitudes 3.5-4.0) felt by residents in communities surrounding the volcano. Scans on 21 November through the volcanic plume yielded an average sulfur dioxide flux of 1,124.5 ? 212.5 metric tons /day (t/d). Small explosions that afternoon caused ashfall in Las Moras, La Bolsa, and Belén, located S of the volcano. When climbing to the crater on 10 December, Perez noted abundant ash and rocks of variable sizes expelled by the 21 November activity was deposited in the S and NE part of the crater. Abundant gas emissions from the crater continued.
Activity during 2009. January, February, and March were notable for their consistency in heavy gas emissions. In late March there were notable temperature increases at most of the vents. Eight measurements using a Mobile Mini DOAS over about 2 hours resulted in an average SO2 flux of 650 t/d. May, June, July and August were months of sustained abundant gas emission (figure 15) with very little other notable activity beyond occasional landslides, some of which obstructed gas vents. Average SO2 flux on 30 July was 1,249 t/d. Measurements made in May 2009 (274.7 t/d) were much lower. Based on analysis of satellite imagery, the Washington VAAC reported that on 19 May a diffuse plume drifted 45 km SW.
A seismic swarm on 4 September lasted about 30 minutes, and a strong explosion took place on 6 September (figure 16). An explosion on 6 September 2009 at 1350 created an ash column that reached an approximate height of 200 m; four explosions of lesser intensity followed. The Washington VAAC issued an advisory noting ash up to an altitude of 8.5 km that was drifting 75 km W. This activity continued until approximately 1440. The material ejected affected communities between the towns of Grecia and El Piloto, and along the road from Chinandega to the Guasaule border post. Perez, during a visit on 11 September, heard loud rumbling landslides into the crater and observed gas emissions. The number of daily seismic events increased on 11 September, then gradually declined throughout the month (figure 17).
On 14 September an explosion at approximately 1050 was recorded by the seismic station located on the SW flank. The column rose ~ 350 m, and ejected material fell on the Las Rojas farm and in the towns of Las Banderas and Mokoron. On 18 September the average SO2 gas-flux was 319 t/d, a significant decrease with respect to July. However, on 6 September, when about eight explosions occurred, the average SO2 flux was 1,657 t/d.
Abundant gas emissions from the NE part of the crater were see during 18 October fieldwork, though landslides had obstructed vents. On 22 October the measured SO2 flux had decreased further compared to September. Abundant emission of gases continued and the widening of the crater in the S was noted on 24 November; there were ash deposits on the solar panels of the S-flank seismic station. Landslides around the crater and gas emissions were continuing on 8 December.
Based on analyses of satellite imagery, the Washington VAAC reported that on 6 December a gas-and-steam plume, possibly containing ash, drifted SW; smoke from local fires was also noted. Based on METAR weather reports, the Washington VAAC again reported that a gas-and-steam plume possibly contained ash on 22 December. Satellite imagery from 26 December showed an ash plume drifting 90 km WSW.
Activity during January-June 2010. Gas emissions continued in 2010, with fieldwork observations on 7 January, 14 February, and 14 March. No activity was reported by Perez following a visit on 27 April. Based on analyses of satellite imagery, the Washington VAAC reported that on 9 June a well-defined ash plume drifted about 115 km WNW.
Geologic Background. The San Cristóbal volcanic complex, consisting of five principal volcanic edifices, forms the NW end of the Marrabios Range. The symmetrical 1745-m-high youngest cone, named San Cristóbal (also known as El Viejo), is Nicaragua's highest volcano and is capped by a 500 x 600 m wide crater. El Chonco, with several flank lava domes, is located 4 km W of San Cristóbal; it and the eroded Moyotepe volcano, 4 km NE of San Cristóbal, are of Pleistocene age. Volcán Casita, containing an elongated summit crater, lies immediately east of San Cristóbal and was the site of a catastrophic landslide and lahar in 1998. The Plio-Pleistocene La Pelona caldera is located at the eastern end of the complex. Historical eruptions from San Cristóbal, consisting of small-to-moderate explosive activity, have been reported since the 16th century. Some other 16th-century eruptions attributed to Casita volcano are uncertain and may pertain to other Marrabios Range volcanoes.
Information Contacts: Instituto Nicaraguense de Estudios Territoriales (INETER), Apartado Postal 2110, Managua, Nicaragua (URL: http://www.ineter.gob.ni/); Washington Volcanic Ash Advisory Center, Satellite Analysis Branch (SAB), NOAA/NESDIS E/SP23, NOAA Science Center Room 401, 5200 Auth Rd, Camp Springs, MD 20746, USA (URL: http://www.ospo.noaa.gov/Products/atmosphere/vaac/).
Ubinas
Peru
16.345°S, 70.8972°W; summit elev. 5608 m
All times are local (unless otherwise noted)
Frequent ash plumes between July 2008 and August 2009
Eruptions at Ubinas between March 2006 and July 2008 caused ashfall in local villages and damaged crops (BGVN 31:03, 31:05, 31:10, 33:01, 33:06). Families from the village of San Pedro de Querapi had been relocated, however they returned to their fields to pursue their agricultural activities. Local authorities have discussed the possible relocation, over several years, of about 650 families from six towns (Escacha, Tonoaya, San Migues, San Pedro de Querapi, Huataga and Ubinas).
Persistent fumarolic plumes continued through 2008 (figure 15) along with intermittent ash explosions (figure 16). Pilot reports and satellite imagery resulted in frequent aviation warnings of ash plumes (table 5) during July-November 2008, January-March 2009, and May-August 2009. It is likely that additional explosion plumes were not observed; for example, a dark ash plume on 8 January 2008 (figure 16) was not previously reported. Most plumes rose a short distance above the summit, although a few went to about 10 km altitude (4.4 km above the summit), including one on 15 March 2009 (figure 17).
Table 5. Compilation of Volcanic Ash Advisories for aviation from Ubinas during 23 July 2008 through 23 August 2009. All reported plumes were reported as ash-bearing unless otherwise noted. Altitudes are approximate; note that the summit is above 5.6 km elevation. Courtesy of the Buenos Aires Volcanic Ash Advisory Center (VAAC) and the Instituto Geológical Minero y Metalúrgico (INGEMMET).
| Date |
Plume altitude (km) |
Plume direction |
Remarks |
| 23 Jul 2008 |
5.5-5.8 |
SE |
-- |
| 18 Aug 2008 |
5.5-6.4 |
W |
Pilot report |
| 26-27 Aug 2008 |
5.5-6.1 |
N |
Satellite imagery, pilot report |
| 02 Sep 2008 |
5.5-6.1 |
S |
Satellite imagery, pilot report |
| 05-06 Sep 2008 |
5.5-6.4 |
NE, SE |
-- |
| 10, 13-15 Sep 2008 |
5.5-10.1 |
SW, S, SE,NE |
-- |
| 17 Sep 2008 |
10.1 |
NE |
-- |
| 18 Sep 2008 |
5.5-6.4 |
-- |
-- |
| 30 Sep 2008 |
5.5-8.8 |
SSE |
-- |
| 01-03 Oct 2008 |
5.5-6.1 |
N, NE |
-- |
| 11-13 Oct 2008 |
5.5-7.0 |
SE, W |
-- |
| 15-21 Oct 2008 |
4.9-7.0 |
SE, NW |
-- |
| 22 Oct 2008 |
5.5-6.7 |
S |
-- |
| 31 Oct 2008 |
5.5-6.7 |
E |
-- |
| 30 Nov 2008 |
5.5-6.1 |
SW |
-- |
| 05 Jan 2009 |
5.5 |
SE |
-- |
| 11 Jan 2009 |
7.3 |
NE |
-- |
| 31 Jan 2009 |
6.7 |
SW |
-- |
| 11-16 Feb 2009 |
5.7-6.5 |
NE, N, W, SW |
Steam, steam-and-ash |
| 23 Feb 2009 |
6.2-7.6 |
S |
-- |
| 04 Mar 2009 |
5.8 |
SW |
-- |
| 11-12 Mar 2009 |
5.5-7.3 |
NE |
-- |
| 15 Mar 2009 |
9.1-9.8 |
-- |
-- |
| 18 Mar 2009 |
7.9 |
-- |
Pilot report |
| 15-19 May 2009 |
5.5-7.6 |
SW, NW, SSE |
Pilot report |
| 20 May 2009 |
5.3 |
NE |
-- |
| 25 May 2009 |
-- |
-- |
Two explosions (news report) |
| 29, 31 May 2009 |
5.5-6.7 |
NE, SW |
-- |
| 01 Jun 2009 |
-- |
-- |
Blue gas plume with some ash |
| 02 Jun 2009 |
0.9-1.5 |
E |
Explosion, gas-and-ash plume |
| 05-06 Jun 2009 |
6.1-7.9 |
W, SW, S |
Satellite imagery, pilot report |
| 09 Jun 2009 |
6.1-7.6 |
NE |
Satellite imagery |
| 11 Jun 2009 |
5.5-7.9 |
NE, E, SE |
Satellite imagery |
| 13 Jun 2009 |
6.7 |
SE |
No satellite confirmation |
| 14 Jun 2009 |
7.6 |
E |
GOES-12 satellite imagery |
| 15 Jun 2009 |
7.9 |
NE |
Satellite imagery |
| 04 Jul 2009 |
6.7-9.1 |
NE |
-- |
| 06, 15, 23 Aug 2009 |
-- |
-- |
No satellite confirmation |
Geologic Background. The truncated appearance of Ubinas, Perú's most active volcano, is a result of a 1.4-km-wide crater at the summit. It is the northernmost of three young volcanoes located along a regional structural lineament about 50 km behind the main volcanic front. The growth and destruction of Ubinas I was followed by construction of Ubinas II beginning in the mid-Pleistocene. The upper slopes of the andesitic-to-rhyolitic Ubinas II stratovolcano are composed primarily of andesitic and trachyandesitic lava flows and steepen to nearly 45°. The steep-walled, 150-m-deep summit crater contains an ash cone with a 500-m-wide funnel-shaped vent that is 200 m deep. Debris-avalanche deposits from the collapse of the SE flank about 3,700 years ago extend 10 km from the volcano. Widespread Plinian pumice-fall deposits include one from about 1,000 years ago. Holocene lava flows are visible on the flanks, but activity documented since the 16th century has consisted of intermittent minor-to-moderate explosive eruptions.
Information Contacts: Instituto Geológical Minero y Metalúrgico (INGEMMET), Av. Canadá 1470, San Borja, Lima 41, Perú (URL: http://www.ingemmet.gob.pe/); Buenos Aires Volcanic Ash Advisory Center (VAAC), Argentina (URL: http://www.smn.gov.ar/vaac/buenosaires/productos.php); La República Online (URL: http://www.larepublica.com.pe/).
Villarrica
Chile
39.42°S, 71.93°W; summit elev. 2847 m
All times are local (unless otherwise noted)
Lava lake in summit crater very active beginning in April 2010
Villarrica has been relatively quiet since 4 September 2006. However, there were reports of minor activity, with occasional ash plumes and thermal anomalies through 10 February 2009 (BGVN 34:01). According to the Observatorio Volcanológico de los Andes (OVDAS-SERNAGEOMIN), during February 2009 through February 2010, the volcano experienced frequent tremor and occasional long-period earthquakes, with infrequent tectonic and hybrid earthquakes. Persistent Strombolian activity, with frequent detection of thermal anomalies, began in April 2010.
Photographs and video posted on the Projecto Observación Visual Volcán Villarrica (POVI) website demonstrate weak fumarolic activity during January-March, September, and December 2009. Climbers also documented diffuse gas plumes rising from the crater in early 2009 (figures 22 and 23). Fumaroles may have been active during other months as well; according to POVI, such emissions are a recurrent phenomenon at Villarrica, especially during times of thaw. The POVI photos and captions specifically noted that there was a phreatomagmatic explosion on 29 January. A small ash plume seen on 19 March was due to small collapses within the crater. A pyroclastic flow deposit was photographed on the upper NE flank on 22 November. Observations during an overflight on 11 December showed bombs and ashfall near the crater rim.
Visitors in January 2010 recorded similar degassing conditions (figure 24) as that often seen in 2009. According to a January 2010 report by OVDAS, the only part of the crater that showed signs of heat without the presence of fresh snow was a fumarole on the SE margin of the crater. On 1 January 2010, the POVI webcam imaged a dark low-altitude plume. Incandescence was seen at night during January and February. According to the Buenos Aires Volcanic Ash Advisory Center, on 11 March a diffuse gas-and-ash plume drifted near the crater; ash was not detected on satellite imagery. OVDAS reported that, during an overflight, scientists saw a typical-looking gas plume drifting SW that day and tephra deposits on the flanks.
On 24 March, the webcam recorded steam emanating from the crater; the steam was caused by the heating and then condensation of snow from a recent storm. In April, seismic activity increased somewhat, accompanied by a rise in the lava lake level, more vigorous fumarolic activity, and more frequent incandescence at night. Strombolian activity was seen by climbers on the crater rim on 23 April (figure 25). Additional videos and photographs taken during 24-25 April, and 8 and 10 May (posted on the POVI website) showed continuing Strombolian activity in the crater. Bursts of lava did not rise above the crater rim, but gas plumes rose from the crater. The increased activity prompted OVDAS to increase the Alert Level from Green Level 1 to Green Level 2. According to POVI, on 10 May the spattering lava lake was about 100 m below the crater rim.
During 2009 thermal anomalies detected using MODIS/MODVOLC data occurred on 24 March, 9 April, and 26 November. An ASTER image also showed an anomaly on 8 March 2009. Detection of thermal anomalies continued in early 2010, with hot spots on 6 and 22 January, 10, 14, 16, and 23-26 February, and 11 March. Beginning on 5 April 2010, thermal anomalies became more frequent, with detections on 18 days in April, and 14 days in May.
Geologic Background. The glacier-covered Villarrica stratovolcano, in the northern Lakes District of central Chile, is ~15 km south of the city of Pucon. A 2-km-wide caldera that formed about 3,500 years ago is located at the base of the presently active, dominantly basaltic to basaltic andesite cone at the NW margin of a 6-km-wide Pleistocene caldera. More than 30 scoria cones and fissure vents are present on the flanks. Plinian eruptions and pyroclastic flows that have extended up to 20 km from the volcano were produced during the Holocene. Lava flows up to 18 km long have issued from summit and flank vents. Eruptions documented since 1558 CE have consisted largely of mild-to-moderate explosive activity with occasional lava effusion. Glaciers cover 40 km2 of the volcano, and lahars have damaged towns on its flanks.
Information Contacts: Observatorio Volcanológico de los Andes del Sur-Servico Nacional de Geologia y Mineria (OVDAS-SERNAGEOMIN) (Southern Andes Volcanological Observatory-National Geology and Mining Service), Avda Sta María No. 0104, Santiago, Chile (URL: http://www.sernageomin.cl/); Buenos Aires Volcanic Ash Advisory Center (VAAC), Servicio Meteorológico Nacional-Fuerza Aérea Argentina, 25 de mayo 658, Buenos Aires, Argentina (URL: http://www.smn.gov.ar/vaac/buenosaires/productos.php); Projecto Observación Visual Volcán Villarrica (POVI) (URL: http://www.povi.cl/villarrica.html); Oficina Nacional de Emergencia del Ministerio del Interior (ONEMI), Beauchef 1637 /1671, Santiago, Chile (URL: http://www.onemi.cl/); Flickr.com (Photographers: elrentaplats, http://www.flickr.com/photos/elrentaplats/); Liam and Hels, http://www.flickr.com/photos/liam-hels-big-trip/); Szymon Kochanski, http://www.flickr.com/photos/mywayaround/); James Byrum, http://www.flickr.com/photos/jimmybyrum/).