Recently Published Bulletin Reports
Manam (Papua New Guinea) Few ash plumes during November-December 2022
Krakatau (Indonesia) Strombolian activity and ash plumes during November 2022-April 2023
Stromboli (Italy) Strombolian explosions and lava flows continue during January-April 2023
Nishinoshima (Japan) Small ash plumes and fumarolic activity during November 2022 through April 2023
Karangetang (Indonesia) Lava flows, incandescent avalanches, and ash plumes during January-June 2023
Ahyi (United States) Intermittent hydroacoustic signals and discolored plumes during November 2022-June 2023
Kadovar (Papua New Guinea) An ash plume and weak thermal anomaly during May 2023
San Miguel (El Salvador) Small gas-and-ash explosions during March and May 2023
Semisopochnoi (United States) Occasional explosions, ash deposits, and gas-and-steam plumes during December 2022-May 2023
Ebeko (Russia) Continued explosions, ash plumes, and ashfall during October 2022-May 2023
Home Reef (Tonga) Discolored plumes continued during November 2022-April 2023
Ambae (Vanuatu) New lava flow, ash plumes, and sulfur dioxide plumes during February-May 2023
Manam (Papua New Guinea) — July 2023  Cite this Report
Manam
Papua New Guinea
4.08°S, 145.037°E; summit elev. 1807 m
All times are local (unless otherwise noted)
Few ash plumes during November-December 2022
Manam is a 10-km-wide island that consists of two active summit craters: the Main summit crater and the South summit crater and is located 13 km off the northern coast of mainland Papua New Guinea. Frequent mild-to-moderate eruptions have been recorded since 1616. The current eruption period began during June 2014 and has more recently been characterized by intermittent ash plumes and thermal activity (BGVN 47:11). This report updates activity that occurred from November 2022 through May 2023 based on information from the Darwin Volcanic Ash Advisory Center (VAAC) and various satellite data.
Ash plumes were reported during November and December 2022 by the Darwin VAAC. On 7 November an ash plume rose to 2.1 km altitude and drifted NE based on satellite images and weather models. On 14 November an ash plume rose to 2.1 km altitude and drifted W based on RVO webcam images. On 20 November ash plumes rose to 1.8 km altitude and drifted NW. On 26 December an ash plume rose to 3 km altitude and drifted S and SSE.
Intermittent sulfur dioxide plumes were detected using the TROPOMI instrument on the Sentinel-5P satellite, some of which exceeded at least two Dobson Units (DU) and drifted in different directions (figure 93). Occasional low-to-moderate power thermal anomalies were recorded by the MIROVA (Middle InfraRed Observation of Volcanic Activity) system; less than five anomalies were recorded each month during November 2022 through May 2023 (figure 94). Two thermal hotspots were detected by the MODVOLC thermal alerts system on 10 December 2022. On clear weather days, thermal activity was also captured in infrared satellite imagery in both the Main and South summit craters, accompanied by gas-and-steam emissions (figure 95).
Geologic Background. The 10-km-wide island of Manam, lying 13 km off the northern coast of mainland Papua New Guinea, is one of the country's most active volcanoes. Four large radial valleys extend from the unvegetated summit of the conical basaltic-andesitic stratovolcano to its lower flanks. These valleys channel lava flows and pyroclastic avalanches that have sometimes reached the coast. Five small satellitic centers are located near the island's shoreline on the northern, southern, and western sides. Two summit craters are present; both are active, although most observed eruptions have originated from the southern crater, concentrating eruptive products during much of the past century into the SE valley. Frequent eruptions, typically of mild-to-moderate scale, have been recorded since 1616. Occasional larger eruptions have produced pyroclastic flows and lava flows that reached flat-lying coastal areas and entered the sea, sometimes impacting populated areas.
Information Contacts: Rabaul Volcano Observatory (RVO), Geohazards Management Division, Department of Mineral Policy and Geohazards Management (DMPGM), PO Box 3386, Kokopo, East New Britain Province, Papua New Guinea; Darwin Volcanic Ash Advisory Centre (VAAC), Bureau of Meteorology, Northern Territory Regional Office, PO Box 40050, Casuarina, NT 0811, Australia (URL: http://www.bom.gov.au/info/vaac/); MIROVA (Middle InfraRed Observation of Volcanic Activity), a collaborative project between the Universities of Turin and Florence (Italy) supported by the Centre for Volcanic Risk of the Italian Civil Protection Department (URL: http://www.mirovaweb.it/); Hawai'i Institute of Geophysics and Planetology (HIGP) - MODVOLC Thermal Alerts System, School of Ocean and Earth Science and Technology (SOEST), Univ. of Hawai'i, 2525 Correa Road, Honolulu, HI 96822, USA (URL: http://modis.higp.hawaii.edu/); NASA Global Sulfur Dioxide Monitoring Page, Atmospheric Chemistry and Dynamics Laboratory, NASA Goddard Space Flight Center (NASA/GSFC), 8800 Greenbelt Road, Goddard, Maryland, USA (URL: https://so2.gsfc.nasa.gov/); Copernicus Browser, Copernicus Data Space Ecosystem, European Space Agency (URL: https://dataspace.copernicus.eu/browser/).
Krakatau (Indonesia) — July 2023 Cite this Report
Krakatau
Indonesia
6.1009°S, 105.4233°E; summit elev. 285 m
All times are local (unless otherwise noted)
Strombolian activity and ash plumes during November 2022-April 2023
Krakatau is located in the Sunda Strait between Java and Sumatra, Indonesia. Caldera collapse during the catastrophic 1883 eruption destroyed Danan and Perbuwatan cones and left only a remnant of Rakata. The post-collapse cone of Anak Krakatau (Child of Krakatau) was constructed within the 1883 caldera at a point between the former Danan and Perbuwatan cones; it has been the site of frequent eruptions since 1927. The current eruption period began in May 2021 and has recently consisted of explosions, ash plumes, and thermal activity (BGVN 47:11). This report covers activity during November 2022 through April 2023 based on information provided by the Indonesian Center for Volcanology and Geological Hazard Mitigation, referred to as Pusat Vulkanologi dan Mitigasi Bencana Geologi (PVMBG), MAGMA Indonesia, the Darwin Volcanic Ash Advisory Center (VAAC), and several sources of satellite data.
Activity was relatively low during November and December 2022. Daily white gas-and-steam plumes rose 25-100 m above the summit and drifted in different directions. Gray ash plumes rose 200 m above the summit and drifted NE at 1047 and at 2343 on 11 November. On 14 November at 0933 ash plumes rose 300 m above the summit and drifted E. An ash plume was reported at 0935 on 15 December that rose 100 m above the summit and drifted NE. An eruptive event at 1031 later that day generated an ash plume that rose 700 m above the summit and drifted NE. A gray ash plume at 1910 rose 100 m above the summit and drifted E. Incandescent material was ejected above the vent based on an image taken at 1936.
During January 2023 daily white gas-and-steam plumes rose 25-300 m above the summit and drifted in multiple directions. Gray-to-brown ash plumes were reported at 1638 on 3 January, at 1410 and 1509 on 4 January, and at 0013 on 5 January that rose 100-750 m above the summit and drifted NE and E; the gray-to-black ash plume at 1509 on 4 January rose as high as 3 km above the summit and drifted E. Gray ash plumes were recorded at 1754, 2241, and 2325 on 11 January and at 0046 on 12 January and rose 200-300 m above the summit and drifted NE. Toward the end of January, PVMBG reported that activity had intensified; Strombolian activity was visible in webcam images taken at 0041, 0043, and 0450 on 23 January. Multiple gray ash plumes throughout the day rose 200-500 m above the summit and drifted E and SE (figure 135). Webcam images showed progressively intensifying Strombolian activity at 1919, 1958, and 2113 on 24 January; a gray ash plume at 1957 rose 300 m above the summit and drifted E (figure 135). Eruptive events at 0231 and 2256 on 25 January and at 0003 on 26 January ejected incandescent material from the vent, based on webcam images. Gray ash plumes observed during 26-27 January rose 300-500 m above the summit and drifted NE, E, and SE.
Low levels of activity were reported during February and March. Daily white gas-and-steam plumes rose 25-300 m above the summit and drifted in different directions. The Darwin VAAC reported that continuous ash emissions rose to 1.5-1.8 km altitude and drifted W and NW during 1240-1300 on 10 March, based on satellite images, weather models, and PVMBG webcams. White-and-gray ash plumes rose 500 m and 300 m above the summit and drifted SW at 1446 and 1846 on 18 March, respectively. An eruptive event was recorded at 2143, though it was not visible due to darkness. Multiple ash plumes were reported during 27-29 March that rose as high as 2.5 km above the summit and drifted NE, W, and SW (figure 136). Webcam images captured incandescent ejecta above the vent at 0415 and around the summit area at 2003 on 28 March and at 0047 above the vent on 29 March.
Daily white gas-and-steam plumes rose 25-300 m above the summit and drifted in multiple directions during April and May. White-and-gray and black plumes rose 50-300 m above the summit on 2 and 9 April. On 11 May at 1241 a gray ash plume rose 1-3 km above the summit and drifted SW. On 12 May at 0920 a gray ash plume rose 2.5 km above the summit and drifted SW and at 2320 an ash plume rose 1.5 km above the summit and drifted SW. An accompanying webcam image showed incandescent ejecta. On 13 May at 0710 a gray ash plume rose 2 km above the summit and drifted SW (figure 137).
The MIROVA (Middle InfraRed Observation of Volcanic Activity) graph of MODIS thermal anomaly data showed intermittent low-to-moderate power thermal anomalies during November 2022 through April 2023 (figure 138). Some of this thermal activity was also visible in infrared satellite imagery at the crater, accompanied by gas-and-steam and ash plumes that drifted in different directions (figure 139).
Geologic Background. The renowned Krakatau (frequently mis-named as Krakatoa) volcano lies in the Sunda Strait between Java and Sumatra. Collapse of an older edifice, perhaps in 416 or 535 CE, formed a 7-km-wide caldera. Remnants of that volcano are preserved in Verlaten and Lang Islands; subsequently the Rakata, Danan, and Perbuwatan cones were formed, coalescing to create the pre-1883 Krakatau Island. Caldera collapse during the catastrophic 1883 eruption destroyed Danan and Perbuwatan, and left only a remnant of Rakata. This eruption caused more than 36,000 fatalities, most as a result of tsunamis that swept the adjacent coastlines of Sumatra and Java. Pyroclastic surges traveled 40 km across the Sunda Strait and reached the Sumatra coast. After a quiescence of less than a half century, the post-collapse cone of Anak Krakatau (Child of Krakatau) was constructed within the 1883 caldera at a point between the former Danan and Perbuwatan cones. Anak Krakatau has been the site of frequent eruptions since 1927.
Information Contacts: Pusat Vulkanologi dan Mitigasi Bencana Geologi (PVMBG, also known as Indonesian Center for Volcanology and Geological Hazard Mitigation, CVGHM), Jalan Diponegoro 57, Bandung 40122, Indonesia (URL: http://www.vsi.esdm.go.id/); MAGMA Indonesia, Kementerian Energi dan Sumber Daya Mineral (URL: https://magma.esdm.go.id/v1); Darwin Volcanic Ash Advisory Centre (VAAC), Bureau of Meteorology, Northern Territory Regional Office, PO Box 40050, Casuarina, NT 0811, Australia (URL: http://www.bom.gov.au/info/vaac/); MIROVA (Middle InfraRed Observation of Volcanic Activity), a collaborative project between the Universities of Turin and Florence (Italy) supported by the Centre for Volcanic Risk of the Italian Civil Protection Department (URL: http://www.mirovaweb.it/); Copernicus Browser, Copernicus Data Space Ecosystem, European Space Agency (URL: https://dataspace.copernicus.eu/browser/).
Stromboli
Italy
38.789°N, 15.213°E; summit elev. 924 m
All times are local (unless otherwise noted)
Strombolian explosions and lava flows continue during January-April 2023
Stromboli, located in Italy, has exhibited nearly constant lava fountains for the past 2,000 years; recorded eruptions date back to 350 BCE. Eruptive activity occurs at the summit from multiple vents, which include a north crater area (N area) and a central-southern crater (CS area) on a terrace known as the ‘terrazza craterica’ at the head of the Sciara del Fuoco, a large scarp that runs from the summit down the NW side of the volcano-island. Activity typically consists of Strombolian explosions, incandescent ejecta, lava flows, and pyroclastic flows. Thermal and visual monitoring cameras are located on the nearby Pizzo Sopra La Fossa, above the terrazza craterica, and at multiple flank locations. The current eruption period has been ongoing since 1934 and recent activity has consisted of frequent Strombolian explosions and lava flows (BGVN 48:02). This report updates activity during January through April 2023 primarily characterized by Strombolian explosions and lava flows based on reports from Italy's Istituto Nazionale di Geofisica e Vulcanologia (INGV) and various satellite data.
Frequent explosive activity continued throughout the reporting period, generally in the low-to-medium range, based on the number of hourly explosions in the summit crater (figure 253, table 16). Intermittent thermal activity was recorded by the MIROVA (Middle InfraRed Observation of Volcanic Activity) analysis of MODIS satellite data (figure 254). According to data collected by the MODVOLC thermal algorithm, a total of 9 thermal alerts were detected: one on 2 January 2023, one on 1 February, five on 24 March, and two on 26 March. The stronger pulses of thermal activity likely reflected lava flow events. Infrared satellite imagery captured relatively strong thermal hotspots at the two active summit craters on clear weather days, showing an especially strong event on 8 March (figure 255).
Table 16. Summary of type, frequency, and intensity of explosive activity at Stromboli by month during January-April 2023; information from webcam observations. Courtesy of INGV weekly reports.
| Month |
Explosive Activity |
| Jan 2023 |
Typical Strombolian activity with spattering and lava overflows in the N crater area. Explosions were reported from 4 vents in the N area and 1-2 vents in the CS area. The average hourly frequency of explosions was low-to-medium (1-12 events/hour). The intensity of the explosions varied from low (less than 80 m high) to medium (less than 150 m high) in the N crater area and up to high (greater than 150 m high) in the CS crater area. |
| Feb 2023 |
Typical Strombolian activity with spattering in the N crater area. Explosions were reported from 2-3 vents in the N area and 1-4 vents in the CS area. The average hourly frequency of explosions was low-to-medium (1-14 events/hour). The intensity of the explosions varied from low (less than 80 m high) to medium (less than 150 m high) in the N crater area and up to high (greater than 150 m high) in the CS crater area. |
| Mar 2023 |
Typical Strombolian activity with spattering and lava overflows in the N crater area. Explosions were reported from 2-3 vents in the N area and 2-4 vents in the CS area. The average hourly frequency of explosions was low-to-medium (1-18 events/hour). The intensity of the explosions varied from low (less than 80 m high) to medium (less than 150 m high) in the N crater area and up to high (greater than 150 m high) in the CS crater area. |
| Apr 2023 |
Typical Strombolian activity. Explosions were reported from 2 vents in the N area and 2-3 vents in the CS area. The average hourly frequency of explosions was low-to-high (1-16 events/hour). The intensity of the explosions varied from low (less than 80 m high) to medium (less than 150 m high) in both the N and CS crater areas. |
Activity during January-February 2023. Strombolian explosions were reported in the N crater area, as well as lava effusion. Explosive activity in the N crater area ejected coarse material (bombs and lapilli). Intense spattering was observed in both the N1 and N2 craters. In the CS crater area, explosions generally ejected fine material (ash), sometimes to heights greater than 250 m. The intensity of the explosions was characterized as low-to-medium in the N crater and medium-to-high in the CS crater. After intense spattering activity from the N crater area, a lava overflow began at 2136 on 2 January that flowed part way down the Sciara del Fuoco, possibly moving down the drainage that formed in October, out of view from webcams. The flow remained active for a couple of hours before stopping and beginning to cool. A second lava flow was reported at 0224 on 4 January that similarly remained active for a few hours before stopping and cooling. Intense spattering was observed on 11 and 13 January from the N1 crater. After intense spattering activity at the N2 crater at 1052 on 17 January another lava flow started to flow into the upper part of the Sciara del Fuoco (figure 256), dividing into two: one that traveled in the direction of the drainage formed in October, and the other one moving parallel to the point of emission. By the afternoon, the rate of the flow began to decrease, and at 1900 it started to cool. A lava flow was reported at 1519 on 24 January following intense spattering in the N2 area, which began to flow into the upper part of the Sciara del Fuoco. By the morning of 25 January, the lava flow had begun to cool. During 27 January the frequency of eruption in the CS crater area increased to 6-7 events/hour compared to the typical 1-7 events/hour; the following two days showed a decrease in frequency to less than 1 event/hour. Starting at 1007 on 30 January a high-energy explosive sequence was produced by vents in the CS crater area. The sequence began with an initial energetic pulse that lasted 45 seconds, ejecting predominantly coarse products 300 m above the crater that fell in an ESE direction. Subsequent and less intense explosions ejected material 100 m above the crater. The total duration of this event lasted approximately two minutes. During 31 January through 6, 13, and 24 February spattering activity was particularly intense for short periods in the N2 crater.
An explosive sequence was reported on 16 February that was characterized by a major explosion in the CS crater area (figure 257). The sequence began at 1817 near the S2 crater that ejected material radially. A few seconds later, lava fountains were observed in the central part of the crater. Three explosions of medium intensity (material was ejected less than 150 m high) were recorded at the S2 crater. The first part of this sequence lasted approximately one minute, according to INGV, and material rose 300 m above the crater and then was deposited along the Sciara del Fuoco. The second phase began at 1818 at the S1 crater; it lasted seven seconds and material was ejected 150 m above the crater. Another event 20 seconds later lasted 12 seconds, also ejecting material 150 m above the crater. The sequence ended with at least three explosions of mostly fine material from the S1 crater. The total duration of this sequence was about two minutes.
Short, intense spattering activity was noted above the N1 crater on 27 and 28 February. A lava overflow was first reported at 0657 from the N2 crater on 27 February that flowed into the October 2022 drainage. By 1900 the flow had stopped. A second lava overflow also in the N crater area occurred at 2149, which overlapped the first flow and then stopped by 0150 on 28 February. Material detached from both the lava overflows rolled down the Sciara del Fuoco, some of which was visible in webcam images.
Activity during March-April 2023. Strombolian activity continued with spattering activity and lava overflows in the N crater area during March. Explosive activity at the N crater area varied from low (less than 80 m high) to medium (less than 150 m high) and ejected coarse material, such as bombs and lapilli. Spattering was observed above the N1 crater, while explosive activity at the CS crater area varied from medium to high (greater than 150 m high) and ejected coarse material. Intense spattering activity was observed for short periods on 6 March above the N1 crater. At approximately 0610 a lava overflow was reported around the N2 crater on 8 March, which then flowed into the October 2022 drainage. By 1700 the flow started to cool. A second overflow began at 1712 on 9 March and overlapped the previous flow. It had stopped by 2100. Material from both flows was deposited along the Sciara del Fuoco, though much of the activity was not visible in webcam images. On 11 March a lava overflow was observed at 0215 that overlapped the two previous flows in the October 2022 drainage. By late afternoon on 12 March, it had stopped.
During a field excursion on 16 March, scientists noted that a vent in the central crater area was degassing. Another vent showed occasional Strombolian activity that emitted ash and lapilli. During 1200-1430 low-to-medium intense activity was reported; the N1 crater emitted ash emissions and the N2 crater emitted both ash and coarse material. Some explosions also occurred in the CS crater area that ejected coarse material. The C crater in the CS crater area occasionally showed gas jetting and low intensity explosions on 17 and 22 March; no activity was observed at the S1 crater. Intense, longer periods of spattering were reported in the N1 crater on 19, 24, and 25 March. Around 2242 on 23 March a lava overflow began from the N1 crater that, after about an hour, began moving down the October 2022 drainage and flow along the Sciara del Fuoco (figure 258). Between 0200 and 0400 on 26 March the flow rate increased, which generated avalanches of material from collapses at the advancing flow front. By early afternoon, the flow began to cool. On 25 March at 1548 an explosive sequence began from one of the vents at S2 in the CS crater area (figure 258). Fine ash mixed with coarse material was ejected 300 m above the crater rim and drifted SSE. Some modest explosions around Vent C were detected at 1549 on 25 March, which included an explosion at 1551 that ejected coarse material. The entire explosive sequence lasted approximately three minutes.
During April explosions persisted in both the N and CS crater areas. Fine material was ejected less than 80 m above the N crater rim until 6 April, followed by ejection of coarser material. Fine material was also ejected less than 80 m above the CS crater rim. The C and S2 crater did not show significant eruptive activity. On 7 April an explosive sequence was detected in the CS crater area at 1203 (figure 259). The first explosion lasted approximately 18 seconds and ejected material 400 m above the crater rim, depositing pyroclastic material in the upper part of the Sciara del Fuoco. At 1204 a second, less intense explosion lasted approximately four seconds and deposited pyroclastic products outside the crater area and near Pizzo Sopra La Fossa. A third explosion at 1205 was mainly composed of ash that rose about 150 m above the crater and lasted roughly 20 seconds. A fourth explosion occurred at 1205 about 28 seconds after the third explosion and ejected a mixture of coarse and fine material about 200 m above the crater; the explosion lasted roughly seven seconds. Overall, the entire explosive sequence lasted about two minutes and 20 seconds. After the explosive sequence on 7 April, explosions in both the N and CS crater areas ejected material as high as 150 m above the crater.
On 21 April research scientists from INGV made field observations in the summit area of Stromboli, and some lapilli samples were collected. In the N crater area near the N1 crater, a small cone was observed with at least two active vents, one of which was characterized by Strombolian explosions. The other vent produced explosions that ejected ash and chunks of cooled lava. At the N2 crater at least one vent was active and frequently emitted ash. In the CS crater area, a small cone contained 2-3 degassing vents and a smaller, possible fissure area also showed signs of degassing close to the Pizzo Sopra La Fossa. In the S part of the crater, three vents were active: a small hornito was characterized by modest and rare explosions, a vent that intermittently produced weak Strombolian explosions, and a vent at the end of the terrace that produced frequent ash emissions. Near the S1 crater there was a hornito that generally emitted weak gas-and-steam emissions, sometimes associated with “gas rings”. On 22 April another field inspection was carried out that reported two large sliding surfaces on the Sciara del Fuoco that showed where blocks frequently descended toward the sea. A thermal anomaly was detected at 0150 on 29 April.
Geologic Background. Spectacular incandescent nighttime explosions at Stromboli have long attracted visitors to the "Lighthouse of the Mediterranean" in the NE Aeolian Islands. This volcano has lent its name to the frequent mild explosive activity that has characterized its eruptions throughout much of historical time. The small island is the emergent summit of a volcano that grew in two main eruptive cycles, the last of which formed the western portion of the island. The Neostromboli eruptive period took place between about 13,000 and 5,000 years ago. The active summit vents are located at the head of the Sciara del Fuoco, a prominent scarp that formed about 5,000 years ago due to a series of slope failures which extends to below sea level. The modern volcano has been constructed within this scarp, which funnels pyroclastic ejecta and lava flows to the NW. Essentially continuous mild Strombolian explosions, sometimes accompanied by lava flows, have been recorded for more than a millennium.
Information Contacts: Istituto Nazionale di Geofisica e Vulcanologia (INGV), Sezione di Catania, Piazza Roma 2, 95123 Catania, Italy, (URL: http://www.ct.ingv.it/en/); MIROVA (Middle InfraRed Observation of Volcanic Activity), a collaborative project between the Universities of Turin and Florence (Italy) supported by the Centre for Volcanic Risk of the Italian Civil Protection Department (URL: http://www.mirovaweb.it/); Hawai'i Institute of Geophysics and Planetology (HIGP) - MODVOLC Thermal Alerts System, School of Ocean and Earth Science and Technology (SOEST), Univ. of Hawai'i, 2525 Correa Road, Honolulu, HI 96822, USA (URL: http://modis.higp.hawaii.edu/); Copernicus Browser, Copernicus Data Space Ecosystem, European Space Agency (URL: https://dataspace.copernicus.eu/browser/).
Nishinoshima (Japan) — July 2023 Cite this Report
Nishinoshima
Japan
27.247°N, 140.874°E; summit elev. 100 m
All times are local (unless otherwise noted)
Small ash plumes and fumarolic activity during November 2022 through April 2023
Nishinoshima is a small island located about 1,000 km S of Tokyo in the Ogasawara Arc in Japan. The island is the summit of a massive submarine volcano that has prominent peaks to the S, W, and NE. Eruptions date back to 1973; the most recent eruption period began in October 2022 and was characterized by ash plumes and fumarolic activity (BGVN 47:12). This report describes ash plumes and fumarolic activity during November 2022 through April 2023 based on monthly reports from the Japan Meteorological Agency (JMA) monthly reports and satellite data.
The most recent eruptive activity prior to the reporting internal occurred on 12 October 2022, when an ash plume rose 3.5 km above the crater rim. An aerial observation conducted by the Japan Coast Guard (JCG) on 25 November reported that white fumaroles rose approximately 200 m above the central crater of a pyroclastic cone (figure 119), and multiple plumes were observed on the ESE flank of the cone. Discolored water ranging from reddish-brown to brown and yellowish-green were visible around the perimeter of the island (figure 119). No significant activity was reported in December.
During an overflight conducted by JCG on 25 January 2023 intermittent activity and small, blackish-gray plumes rose 900 m above the central part of the crater were observed (figure 120). The fumarolic zone of the E flank and base of the cone had expanded and emissions had intensified. Dark brown discolored water was visible around the perimeter of the island.
No significant activity was reported during February through March. Ash plumes at 1050 and 1420 on 11 April rose 1.9 km above the crater rim and drifted NW and N. These were the first ash plumes observed since 12 October 2022. On 14 April JCG carried out an overflight and reported that no further eruptive activity was visible, although white gas-and-steam plumes were visible from the central crater and rose 900 m high (figure 121). Brownish and yellow-green discolored water surrounded the island.
Intermittent low-to-moderate power thermal anomalies were recorded in the MIROVA graph (Middle InfraRed Observation of Volcanic Activity) during November 2022 through April 2023 (figure 123). A cluster of six to eight anomalies were detected during November while a smaller number were detected during the following months: two to three during December, one during mid-January 2023, one during February, five during March, and two during April. Thermal activity was also reflected in infrared satellite data at the summit crater, accompanied by occasional gas-and-steam plumes (figure 124).
Geologic Background. The small island of Nishinoshima was enlarged when several new islands coalesced during an eruption in 1973-74. Multiple eruptions that began in 2013 completely covered the previous exposed surface and continued to enlarge the island. The island is the summit of a massive submarine volcano that has prominent peaks to the S, W, and NE. The summit of the southern cone rises to within 214 m of the ocean surface 9 km SSE.
Information Contacts: Japan Meteorological Agency (JMA), 1-3-4 Otemachi, Chiyoda-ku, Tokyo 100-8122, Japan (URL: http://www.jma.go.jp/jma/indexe.html); MIROVA (Middle InfraRed Observation of Volcanic Activity), a collaborative project between the Universities of Turin and Florence (Italy) supported by the Centre for Volcanic Risk of the Italian Civil Protection Department (URL: http://www.mirovaweb.it/); Copernicus Browser, Copernicus Data Space Ecosystem, European Space Agency (URL: https://dataspace.copernicus.eu/browser/).
Karangetang (Indonesia) — July 2023 Cite this Report
Karangetang
Indonesia
2.781°N, 125.407°E; summit elev. 1797 m
All times are local (unless otherwise noted)
Lava flows, incandescent avalanches, and ash plumes during January-June 2023
Karangetang (also known as Api Siau), at the northern end of the island of Siau, Indonesia, contains five summit craters along a N-S line. More than 40 eruptions have been recorded since 1675; recent eruptions have included frequent explosive activity, sometimes accompanied by pyroclastic flows and lahars. Lava dome growth has occurred in the summit craters and collapses of lava flow fronts have produced pyroclastic flows. The two active summit craters are Kawah Dua (the N crater) and Kawah Utama (the S crater, also referred to as the “Main Crater”). The most recent eruption began in late November 2018 and has more recently consisted of weak thermal activity and gas-and-steam emissions (BGVN 48:01). This report updates activity characterized by lava flows, incandescent avalanches, and ash plumes during January through June 2023 using reports from Pusat Vulkanologi dan Mitigasi Bencana Geologi (PVMBG, also known as CVGHM, or the Center of Volcanology and Geological Hazard Mitigation), MAGMA Indonesia, the Darwin VAAC (Volcano Ash Advisory Center), and satellite data.
Activity during January was relatively low and mainly consisted of white gas-and-steam emissions that rose 25-150 m above Main Crater (S crater) and drifted in different directions. Incandescence was visible from the lava dome in Kawah Dua (the N crater). Weather conditions often prevented clear views of the summit. On 18 January the number of seismic signals that indicated avalanches of material began to increase. In addition, there were a total of 71 earthquakes detected during the month.
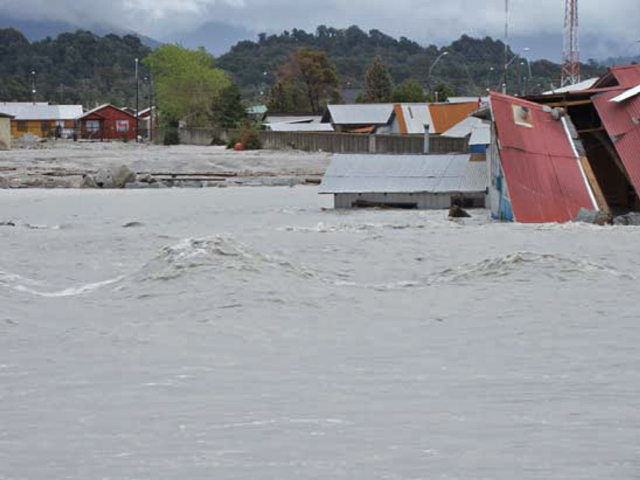
Activity continued to increase during the first week of February. Material from Main Crater traveled as far as 800 m down the Batuawang (S) and Batang (W) drainages and as far as 1 km W down the Beha (W) drainage on 4 February. On 6 February 43 earthquake events were recorded, and on 7 February, 62 events were recorded. White gas-and-steam emissions rose 25-250 m above both summit craters throughout the month. PVMBG reported an eruption began during the evening of 8 February around 1700. Photos showed incandescent material at Main Crater. Incandescent material had also descended the flank in at least two unconfirmed directions as far as 2 km from Main Crater, accompanied by ash plumes (figure 60). As a result, PVMBG increased the Volcano Alert Level (VAL) to 3 (the second highest level on a 1-4 scale).
Occasional nighttime webcam images showed three main incandescent lava flows of differing lengths traveling down the S, SW, and W flanks (figure 61). Incandescent rocks were visible on the upper flanks, possibly from ejected or collapsed material from the crater, and incandescence was the most intense at the summit. Based on analyses of satellite imagery and weather models, the Darwin VAAC reported that daily ash plumes during 16-20 February rose to 2.1-3 km altitude and drifted NNE, E, and SE. BNPB reported on 16 February that as many as 77 people were evacuated and relocated to the East Siau Museum. A webcam image taken at 2156 on 17 February possibly showed incandescent material descending the SE flank. Ash plumes rose to 2.1 km altitude and drifted SE during 22-23 February, according to the Darwin VAAC.
Incandescent avalanches of material and summit incandescence at Main Crater continued during March. White gas-and-steam emissions during March generally rose 25-150 m above the summit crater; on 31 March gas-and-steam emissions rose 200-400 m high. An ash plume rose to 2.4 km altitude and drifted S at 1710 on 9 March and a large thermal anomaly was visible in images taken at 0550 and 0930 on 10 March. Incandescent material was visible at the summit and on the flanks based on webcam images taken at 0007 and 2345 on 16 March, at 1828 on 17 March, at 1940 on 18 March, at 2311 on 19 March, and at 2351 on 20 March. Incandescence was most intense on 18 and 20 March and webcam images showed possible Strombolian explosions (figure 62). An ash plume rose to 2.4 km altitude and drifted SW on 18 March, accompanied by a thermal anomaly.
Summit crater incandescence at Main Crater and on the flanks persisted during April. Incandescent material at the S crater and on the flanks was reported at 0016 on 1 April. The lava flows had stopped by 1 April according to PVMBG, although incandescence was still visible up to 10 m high. Seismic signals indicating effusion decreased and by 6 April they were no longer detected. Incandescence was visible from both summit craters. On 26 April the VAL was lowered to 2 (the second lowest level on a 1-4 scale). White gas-and-steam emissions rose 25-200 m above the summit crater.
During May white gas-and-steam emissions generally rose 50-250 m above the summit, though it was often cloudy, which prevented clear views; on 21 May gas-and-steam emissions rose 50-400 m high. Nighttime N summit crater incandescence rose 10-25 m above the lava dome, and less intense incandescence was noted above Main Crater, which reached about 10 m above the dome. Sounds of falling rocks at Main Crater were heard on 15 May and the seismic network recorded 32 rockfall events in the crater on 17 May. Avalanches traveled as far as 1.5 km down the SW and S flanks, accompanied by rumbling sounds on 18 May. Incandescent material descending the flanks was captured in a webcam image at 2025 on 19 May (figure 63) and on 29 May; summit crater incandescence was observed in webcam images at 2332 on 26 May and at 2304 on 29 May. On 19 May the VAL was again raised to 3.
Occasional Main Crater incandescence was reported during June, as well as incandescent material on the flanks. White gas-and-steam emissions rose 10-200 m above the summit crater. Ash plumes rose to 2.1 km altitude and drifted SE and E during 2-4 June, according to the Darwin VAAC. Material on the flanks of Main Crater were observed at 2225 on 7 June, at 2051 on 9 June, at 0007 on 17 June, and at 0440 on 18 June. Webcam images taken on 21, 25, and 27 June showed incandescence at Main Crater and from material on the flanks.
MIROVA (Middle InfraRed Observation of Volcanic Activity) analysis of MODIS satellite data showed strong thermal activity during mid-February through March and mid-May through June, which represented incandescent avalanches and lava flows (figure 64). During April through mid-May the power of the anomalies decreased but frequent anomalies were still detected. Brief gaps in activity occurred during late March through early April and during mid-June. Infrared satellite images showed strong lava flows mainly affecting the SW and S flanks, accompanied by gas-and-steam emissions (figure 65). According to data recorded by the MODVOLC thermal algorithm, there were a total of 79 thermal hotspots detected: 28 during February, 24 during March, one during April, five during May, and 21 during June.
Geologic Background. Karangetang (Api Siau) volcano lies at the northern end of the island of Siau, about 125 km NNE of the NE-most point of Sulawesi. The stratovolcano contains five summit craters along a N-S line. It is one of Indonesia's most active volcanoes, with more than 40 eruptions recorded since 1675 and many additional small eruptions that were not documented (Neumann van Padang, 1951). Twentieth-century eruptions have included frequent explosive activity sometimes accompanied by pyroclastic flows and lahars. Lava dome growth has occurred in the summit craters; collapse of lava flow fronts have produced pyroclastic flows.
Information Contacts: Pusat Vulkanologi dan Mitigasi Bencana Geologi (PVMBG, also known as Indonesian Center for Volcanology and Geological Hazard Mitigation, CVGHM), Jalan Diponegoro 57, Bandung 40122, Indonesia (URL: http://www.vsi.esdm.go.id/); MAGMA Indonesia, Kementerian Energi dan Sumber Daya Mineral (URL: https://magma.esdm.go.id/v1); Badan Nasional Penanggulangan Bencana (BNPB), National Disaster Management Agency, Graha BNPB - Jl. Scout Kav.38, East Jakarta 13120, Indonesia (URL: http://www.bnpb.go.id/); Darwin Volcanic Ash Advisory Centre (VAAC), Bureau of Meteorology, Northern Territory Regional Office, PO Box 40050, Casuarina, NT 0811, Australia (URL: http://www.bom.gov.au/info/vaac/); MIROVA (Middle InfraRed Observation of Volcanic Activity), a collaborative project between the Universities of Turin and Florence (Italy) supported by the Centre for Volcanic Risk of the Italian Civil Protection Department (URL: http://www.mirovaweb.it/); Hawai'i Institute of Geophysics and Planetology (HIGP) - MODVOLC Thermal Alerts System, School of Ocean and Earth Science and Technology (SOEST), Univ. of Hawai'i, 2525 Correa Road, Honolulu, HI 96822, USA (URL: http://modis.higp.hawaii.edu/); Copernicus Browser, Copernicus Data Space Ecosystem, European Space Agency (URL: https://dataspace.copernicus.eu/browser/); IDN Times, Jl. Jend. Gatot Subroto Kav. 27 3rd Floor Kuningan, Jakarta, Indonesia 12950, Status of Karangetang Volcano in Sitaro Islands Increases (URL: https://sulsel.idntimes.com/news/indonesia/savi/status-gunung-api-karangetang-di-kepulauan-sitaro-meningkat?page=all).
Ahyi (United States) — July 2023 Cite this Report
Ahyi
United States
20.42°N, 145.03°E; summit elev. -75 m
All times are local (unless otherwise noted)
Intermittent hydroacoustic signals and discolored plumes during November 2022-June 2023
Ahyi seamount is a large, conical submarine volcano that rises to within 75 m of the ocean surface about 18 km SE of the island of Farallon de Pajaros in the Northern Marianas. The remote location of the seamount has made eruptions difficult to document, but seismic stations installed in the region confirmed an eruption in the vicinity in 2001. No new activity was detected until April-May 2014 when an eruption was detected by NOAA (National Oceanic and Atmospheric Administration) divers, hydroacoustic sensors, and seismic stations (BGVN 42:04). New activity was first detected on 15 November by hydroacoustic sensors that were consistent with submarine volcanic activity. This report covers activity during November 2022 through June 2023 based on daily and weekly reports from the US Geological Survey.
Starting in mid-October, hydroacoustic sensors at Wake Island (2.2 km E) recorded signals consistent with submarine volcanic activity, according to a report from the USGS issued on 15 November 2022. A combined analysis of the hydroacoustic signals and seismic stations located at Guam and Chichijima Island, Japan, suggested that the source of this activity was at or near the Ahyi seamount. After a re-analysis of a satellite image of the area that was captured on 6 November, USGS confirmed that there was no evidence of discoloration at the ocean surface. Few hydroacoustic and seismic signals continued through November, including on 18 November, which USGS suggested signified a decline or pause in unrest. A VONA (Volcano Observatory Notice for Aviation) reported that a discolored water plume was persistently visible in satellite data starting on 18 November (figure 6). Though clouds often obscured clear views of the volcano, another discolored water plume was captured in a satellite image on 26 November. The Aviation Color Code (ACC) was raised to Yellow (the second lowest level on a four-color scale) and the Volcano Alert Level (VAL) was raised to Advisory (the second lowest level on a four-level scale) on 29 November.
During December, occasional detections were recorded on the Wake Island hydrophone sensors and discolored water over the seamount remained visible. During 2-7, 10-12, and 16-31 December possible explosion signals were detected. A small area of discolored water was observed in high-resolution Sentinel-2 satellite images during 1-6 December (figure 7). High-resolution satellite images recorded discolored water plumes on 13 December that originated from the summit region; no observations indicated that activity breached the ocean surface. A possible underwater plume was visible in satellite images on 18 December, and during 19-20 December a definite but diffuse underwater plume located SSE from the main vent was reported. An underwater plume was visible in a satellite image taken on 26 December (figure 7).
Hydrophone sensors continued to detect signals consistent with possible explosions during 1-8 January 2023. USGS reported that the number of detections decreased during 4-5 January. The hydrophone sensors experienced a data outage that started at 0118 on 8 January and continued through 10 January, though according to USGS, possible explosions were recorded prior to the data outage and likely continued during the outage. A discolored water plume originating from the summit region was detected in a partly cloudy satellite image on 8 January. On 11-12 and 15-17 January possible explosion signals were recorded again. One small signal was detected during 22-23 January and several signals were recorded on 25 and 31 January. During 27-31 January a plume of discolored water was observed above the seamount in satellite imagery (figure 8).
Low levels of activity continued during February and March, based on data from pressure sensors on Wake Island. During 1 and 4-6 February activity was reported, and a submarine plume was observed on 4 February (figure 8). Possible explosion signals were detected during 7-8, 10, 13-14, and 24 February. During 1-2 and 3-5 March a plume of discolored water was observed in satellite imagery (figure 8). Almost continuous hydroacoustic signals were detected in remote pressure sensor data on Wake Island 2,270 km E from the volcano during 7-13 March. During 12-13 March water discoloration around the seamount was observed in satellite imagery, despite cloudy weather. By 14 March discolored water extended about 35 km, but no direction was noted. USGS reported that the continuous hydroacoustic signals detected during 13-14 March stopped abruptly on 14 March and no new detections were observed. Three 30 second hydroacoustic detections were reported during 17-19 March, but no activity was visible due to cloudy weather. A data outage was reported during 21-22 March, making pressure sensor data unavailable; a discolored water plume was, however, visible in satellite data. A possible underwater explosion signal was detected by pressure sensors at Wake Island on 26, 29, and 31 March, though the cause and origin of these events were unclear.
Similar low activity continued during April, May, and June. Several signals were detected during 1-3 April in pressure sensors at Wake Island. USGS suggested that these may be related to underwater explosions or earthquakes at the volcano, but no underwater plumes were visible in clear satellite images. The pressure sensors had data outages during 12-13 April and no data were recorded; no underwater plumes were visible in satellite images, although cloudy weather obscured most clear views. Eruptive activity was reported starting at 2210 on 21 May. On 22 May a discolored water plume that extended 4 km was visible in satellite images, though no direction was recorded. During 23-24 May some signals were detected by the underwater pressure sensors. Possible hydroacoustic signals were detected during 2-3 and 6-8 June. Multiple hydroacoustic signals were detected during 9-11 and 16-17 June, although no activity was visible in satellite images. One hydroacoustic signal was detected during 23-24 June, but there was some uncertainty about its association with volcanic activity. A single possible hydroacoustic signal was detected during 30 June to 1 July.
Geologic Background. Ahyi seamount is a large conical submarine volcano that rises to within 75 m of the ocean surface ~18 km SE of the island of Farallon de Pajaros in the northern Marianas. Water discoloration has been observed there, and in 1979 the crew of a fishing boat felt shocks over the summit area, followed by upwelling of sulfur-bearing water. On 24-25 April 2001 an explosive eruption was detected seismically by a station on Rangiroa Atoll, Tuamotu Archipelago. The event was well constrained (+/- 15 km) at a location near the southern base of Ahyi. An eruption in April-May 2014 was detected by NOAA divers, hydroacoustic sensors, and seismic stations.
Information Contacts: US Geological Survey, Volcano Hazards Program (USGS-VHP), 12201 Sunrise Valley Drive, Reston, VA, USA, https://volcanoes.usgs.gov/index.html; Copernicus Browser, Copernicus Data Space Ecosystem, European Space Agency (URL: https://dataspace.copernicus.eu/browser/).
Kadovar (Papua New Guinea) — June 2023 Cite this Report
Kadovar
Papua New Guinea
3.608°S, 144.588°E; summit elev. 365 m
All times are local (unless otherwise noted)
An ash plume and weak thermal anomaly during May 2023
Kadovar is a 2-km-wide island that is the emergent summit of a Bismarck Sea stratovolcano. It lies off the coast of New Guinea, about 25 km N of the mouth of the Sepik River. Prior to an eruption that began in 2018, a lava dome formed the high point of the volcano, filling an arcuate landslide scarp open to the S. Submarine debris-avalanche deposits occur to the S of the island. The current eruption began in January 2018 and has comprised lava effusion from vents at the summit and at the E coast; more recent activity has consisted of ash plumes, weak thermal activity, and gas-and-steam plumes (BGVN 48:02). This report covers activity during February through May 2023 using information from the Darwin Volcanic Ash Advisory Center (VAAC) and satellite data.
Activity during the reporting period was relatively low and mainly consisted of white gas-and-steam plumes that were visible in natural color satellite images on clear weather days (figure 67). According to a Darwin VAAC report, at 2040 on 6 May an ash plume rose to 4.6 km altitude and drifted W; by 2300 the plume had dissipated. MODIS satellite instruments using the MODVOLC thermal algorithm detected a single thermal hotspot on the SE side of the island on 7 May. Weak thermal activity was also detected in a satellite image on the E side of the island on 14 May, accompanied by a white gas-and-steam plume that drifted SE (figure 68).
Geologic Background. The 2-km-wide island of Kadovar is the emergent summit of a Bismarck Sea stratovolcano of Holocene age. It is part of the Schouten Islands, and lies off the coast of New Guinea, about 25 km N of the mouth of the Sepik River. Prior to an eruption that began in 2018, a lava dome formed the high point of the andesitic volcano, filling an arcuate landslide scarp open to the south; submarine debris-avalanche deposits occur in that direction. Thick lava flows with columnar jointing forms low cliffs along the coast. The youthful island lacks fringing or offshore reefs. A period of heightened thermal phenomena took place in 1976. An eruption began in January 2018 that included lava effusion from vents at the summit and at the E coast.
Information Contacts: Darwin Volcanic Ash Advisory Centre (VAAC), Bureau of Meteorology, Northern Territory Regional Office, PO Box 40050, Casuarina, NT 0811, Australia (URL: http://www.bom.gov.au/info/vaac/); Hawai'i Institute of Geophysics and Planetology (HIGP) - MODVOLC Thermal Alerts System, School of Ocean and Earth Science and Technology (SOEST), Univ. of Hawai'i, 2525 Correa Road, Honolulu, HI 96822, USA (URL: http://modis.higp.hawaii.edu/); Copernicus Browser, Copernicus Data Space Ecosystem, European Space Agency (URL: https://dataspace.copernicus.eu/browser/).
San Miguel (El Salvador) — June 2023 Cite this Report
San Miguel
El Salvador
13.434°N, 88.269°W; summit elev. 2130 m
All times are local (unless otherwise noted)
Small gas-and-ash explosions during March and May 2023
San Miguel in El Salvador is a broad, deep crater complex that has been frequently modified by eruptions recorded since the early 16th century and consists of the summit known locally as Chaparrastique. Flank eruptions have produced lava flows that extended to the N, NE, and SE during the 17-19th centuries. The most recent activity has consisted of minor ash eruptions from the summit crater. The current eruption period began in November 2022 and has been characterized by frequent phreatic explosions, gas-and-ash emissions, and sulfur dioxide plumes (BGVN 47:12). This report describes small gas-and-ash explosions during December 2022 through May 2023 based on special reports from the Ministero de Medio Ambiente y Recursos Naturales (MARN).
Activity has been relatively low since the last recorded explosions on 29 November 2022. Seismicity recorded by the San Miguel Volcano Station (VSM) located on the N flank at 1.7 km elevation had decreased by 7 December. Sulfur dioxide gas measurements taken with DOAS (Differential Optical Absorption Spectroscopy) mobile equipment were below typical previously recorded values: 300 tons per day (t/d). During December, small explosions were recorded by the seismic network and manifested as gas-and-steam emissions.
Gas-and-ash explosions in the crater occurred during January 2023, which were recorded by the seismic network. Sulfur dioxide values remained low, between 300-400 t/d through 10 March. At 0817 on 14 January a gas-and-ash emission was visible in webcam images, rising just above the crater rim. Some mornings during February, small gas-and-steam plumes were visible in the crater. On 7 March at 2252 MARN noted an increase in degassing from the central crater; gas emissions were constantly observed through the early morning hours on 8 March. During the early morning of 8 March through the afternoon on 9 March, 12 emissions were registered, some accompanied by ash. The last gas-and-ash emission was recorded at 1210 on 9 March; very fine ashfall was reported in El Tránsito (10 km S), La Morita (6 km W), and La Piedrita (3 km W). The smell of sulfur was reported in Piedra Azul (5 km SW). On 16 March MARN reported that gas-and-steam emissions decreased.
Low degassing and very low seismicity were reported during April; no explosions have been detected between 9 March and 27 May. The sulfur dioxide emissions remained between 350-400 t/d; during 13-20 April sulfur dioxide values fluctuated between 30-300 t/d. Activity remained low through most of May; on 23 May seismicity increased. An explosion was detected at 1647 on 27 May generated a gas-and-ash plume that rose 700 m high (figure 32); a decrease in seismicity and gas emissions followed. The DOAS station installed on the W flank recorded sulfur dioxide values that reached 400 t/d on 27 May; subsequent measurements showed a decrease to 268 t/d on 28 May and 100 t/d on 29 May.
Geologic Background. The symmetrical cone of San Miguel, one of the most active volcanoes in El Salvador, rises from near sea level to form one of the country's most prominent landmarks. A broad, deep, crater complex that has been frequently modified by eruptions recorded since the early 16th century caps the truncated unvegetated summit, also known locally as Chaparrastique. Flanks eruptions of the basaltic-andesitic volcano have produced many lava flows, including several during the 17th-19th centuries that extended to the N, NE, and SE. The SE-flank flows are the largest and form broad, sparsely vegetated lava fields crossed by highways and a railroad skirting the base of the volcano. Flank vent locations have migrated higher on the edifice during historical time, and the most recent activity has consisted of minor ash eruptions from the summit crater.
Information Contacts: Ministero de Medio Ambiente y Recursos Naturales (MARN), Km. 5½ Carretera a Nueva San Salvador, Avenida las Mercedes, San Salvador, El Salvador (URL: http://www.snet.gob.sv/ver/vulcanologia).
Semisopochnoi (United States) — June 2023 Cite this Report
Semisopochnoi
United States
51.93°N, 179.58°E; summit elev. 1221 m
All times are local (unless otherwise noted)
Occasional explosions, ash deposits, and gas-and-steam plumes during December 2022-May 2023
Semisopochnoi is located in the western Aleutians, is 20-km-wide at sea level, and contains an 8-km-wide caldera. The three-peaked Mount Young (formerly Cerberus) was constructed within the caldera during the Holocene. Each of these peaks contains a summit crater; the lava flows on the N flank appear younger than those on the S side. The current eruption period began in early February 2021 and has more recently consisted of intermittent explosions and ash emissions (BGVN 47:12). This report updates activity during December 2022 through May 2023 using daily, weekly, and special reports from the Alaska Volcano Observatory (AVO). AVO monitors the volcano using local seismic and infrasound sensors, satellite data, web cameras, and remote infrasound and lightning networks.
Activity during most of December 2022 was relatively quiet; according to AVO no eruptive or explosive activity was observed since 7 November 2022. Intermittent tremor and occasional small earthquakes were observed in geophysical data. Continuous gas-and-steam emissions were observed from the N crater of Mount Young in webcam images on clear weather days (figure 25). On 24 December, there was a slight increase in earthquake activity and several small possible explosion signals were detected in infrasound data. Eruptive activity resumed on 27 December at the N crater of Mount Young; AVO issued a Volcano Activity Notice (VAN) that reported minor ash deposits on the flanks of Mount Young that extended as far as 1 km from the vent, according to webcam images taken during 27-28 December (figure 26). No ash plumes were observed in webcam or satellite imagery, but a persistent gas-and-steam plume that might have contained some ash rose to 1.5 km altitude. As a result, AVO raised the Aviation Color Code (ACC) to Orange (the second highest level on a four-color scale) and the Volcano Alert Level (VAL) to Watch (the second highest level on a four-level scale). Possible explosions were detected during 21 December 2022 through 1 January 2023 and seismic tremor was recorded during 30-31 December.
During January 2023 eruptive activity continued at the active N crater of Mount Young. Minor ash deposits were observed on the flanks, extending about 2 km SSW, based on webcam images from 1 and 3 January. A possible explosion occurred during 1-2 January based on elevated seismicity recorded on local seismometers and an infrasound signal recorded minutes later by an array at Adak. Though no ash plumes were observed in webcam or satellite imagery, a persistent gas-and-steam plume rose to 1.5 km altitude that might have carried minor traces of ash. Ash deposits were accompanied by periods of elevated seismicity and infrasound signals from the local geophysical network, which AVO reported were likely due to weak explosive activity. Low-level explosive activity was also detected during 2-3 January, with minor gas-and-steam emissions and a new ash deposit that was visible in webcam images. Low-level explosive activity was detected in geophysical data during 4-5 January, with elevated seismicity and infrasound signals observed on local stations. Volcanic tremor was detected during 7-9 January and very weak explosive activity was detected in seismic and infrasound data on 9 January. Weak seismic and infrasound signals were recorded on 17 January, which indicated minor explosive activity, but no ash emissions were observed in clear webcam images; a gas-and-steam plume continued to rise to 1.5 km altitude. During 29-30 January, ash deposits near the summit were observed on fresh snow, according to webcam images.
The active N cone at Mount Young continued to produce a gas-and-steam plume during February, but no ash emissions or explosive events were detected. Seismicity remained elevated with faint tremor during early February. Gas-and-steam emissions from the N crater were observed in clear webcam images on 11-13 and 16 February; no explosive activity was detected in seismic, infrasound, or satellite data. Seismicity has also decreased, with no significant seismic tremor observed since 25 January. Therefore, the ACC was lowered to Yellow (the second lowest level on a four-color scale) and the VAL was lowered to Advisory (the second lowest level on a four-color scale) on 22 February.
Gas-and-steam emissions persisted during March from the N cone of Mount Young, based on clear webcam images. A few brief episodes of weak tremor were detected in seismic data, although seismicity decreased over the month. A gas-and-steam plume detected in satellite data extended 150 km on 18 March. Low-level ash emissions from the N cone at Mount Young were observed in several webcam images during 18-19 March, in addition to small explosions and volcanic tremor. The ACC was raised to Orange and the VAL increased to Watch on 19 March. A small explosion was detected in seismic and infrasound data on 21 March.
Low-level unrest continued during April, although cloudy weather often obscured views of the summit; periods of seismic tremor and local earthquakes were recorded. During 3-4 April a gas-and-steam plume was visible traveling more than 200 km overnight; no ash was evident in the plume, according to AVO. A gas-and-steam plume was observed during 4-6 April that extended 400 km but did not seem to contain ash. Small explosions were detected in seismic and infrasound data on 5 April. Occasional clear webcam images showed continuing gas-and-steam emissions rose from Mount Young, but no ash deposits were observed on the snow. On 19 April small explosions and tremor were detected in seismic and infrasound data. A period of seismic tremor was detected during 22-25 April, with possible weak explosions on 25 April. Ash deposits were visible near the crater rim, but it was unclear if these deposits were recent or due to older deposits.
Occasional small earthquakes were recorded during May, but there were no signs of explosive activity seen in geophysical data. Gas-and-steam emissions continued from the N crater of Mount Young, based on webcam images, and seismicity remained slightly elevated. A new, light ash deposit was visible during the morning of 5 May on fresh snow on the NW flank of Mount Young. During 10 May periods of volcanic tremor were observed. The ACC was lowered to Yellow and the VAL to Advisory on 17 May due to no additional evidence of activity.
Geologic Background. Semisopochnoi, the largest subaerial volcano of the western Aleutians, is 20 km wide at sea level and contains an 8-km-wide caldera. It formed as a result of collapse of a low-angle, dominantly basaltic volcano following the eruption of a large volume of dacitic pumice. The high point of the island is Anvil Peak, a double-peaked late-Pleistocene cone that forms much of the island's northern part. The three-peaked Mount Cerberus (renamed Mount Young in 2023) was constructed within the caldera during the Holocene. Each of the peaks contains a summit crater; lava flows on the N flank appear younger than those on the south side. Other post-caldera volcanoes include the symmetrical Sugarloaf Peak SSE of the caldera and Lakeshore Cone, a small cinder cone at the edge of Fenner Lake in the NE part of the caldera. Most documented eruptions have originated from Young, although Coats (1950) considered that both Sugarloaf and Lakeshore Cone could have been recently active.
Information Contacts: Alaska Volcano Observatory (AVO), a cooperative program of a) U.S. Geological Survey, 4200 University Drive, Anchorage, AK 99508-4667 USA (URL: https://avo.alaska.edu/), b) Geophysical Institute, University of Alaska, PO Box 757320, Fairbanks, AK 99775-7320, USA, and c) Alaska Division of Geological & Geophysical Surveys, 794 University Ave., Suite 200, Fairbanks, AK 99709, USA (URL: http://dggs.alaska.gov/).
Ebeko
Russia
50.686°N, 156.014°E; summit elev. 1103 m
All times are local (unless otherwise noted)
Continued explosions, ash plumes, and ashfall during October 2022-May 2023
Ebeko, located on the N end of Paramushir Island in the Kuril Islands, consists of three summit craters along a SSW-NNE line at the northern end of a complex of five volcanic cones. Eruptions date back to the late 18th century and have been characterized as small-to-moderate explosions from the summit crater, accompanied by intense fumarolic activity. The current eruption period began in June 2022 and has recently consisted of frequent explosions, ash plumes, and thermal activity (BGVN 47:10). This report covers similar activity during October 2022 through May 2023, based on information from the Kamchatka Volcanic Eruptions Response Team (KVERT) and satellite data.
Activity during October consisted of explosive activity, ash plumes, and occasional thermal anomalies. Visual data by volcanologists from Severo-Kurilsk showed explosions producing ash clouds up to 2.1-3 km altitude which drifted E, N, NE, and SE during 1-8, 10, 16, and 18 October. KVERT issued several Volcano Observatory Notices for Aviation (VONA) on 7, 13-15, and 27 October 2022, stating that explosions generated ash plumes that rose to 2.3-4 km altitude and drifted 5 km E, NE, and SE. Ashfall was reported in Severo-Kurilsk (Paramushir Island, about 7 km E) on 7 and 13 October. Satellite data showed a thermal anomaly over the volcano on 15-16 October. Visual data showed ash plumes rising to 2.5-3.6 km altitude on 22, 25-29, and 31 October and moving NE due to constant explosions.
Similar activity continued during November, with explosions, ash plumes, and ashfall occurring. KVERT issued VONAs on 1-2, 4, 6-7, 9, 13, and 16 November that reported explosions and resulting ash plumes that rose to 1.7-3.6 km altitude and drifted 3-5 km SE, ESE, E, and NE. On 1 November ash plumes extended as far as 110 km SE. On 5, 8, 12, and 24-25 November explosions and ash plumes rose to 2-3.1 km altitude and drifted N and E. Ashfall was observed in Severo-Kurilsk on 7 and 16 November. A thermal anomaly was visible during 1-4, 16, and 20 November. Explosions during 26 November rose as high as 2.7 km altitude and drifted NE (figure 45).
Explosions and ash plumes continued to occur in December. During 1-2 and 4 December volcanologists from Severo-Kurilsk observed explosions that sent ash to 1.9-2.5 km altitude and drifted NE and SE (figure 46). VONAs were issued on 5, 9, and 16 December reporting that explosions generated ash plumes rising to 1.9 km, 2.6 km, and 2.4 km altitude and drifted 5 km SE, E, and NE, respectively. A thermal anomaly was visible in satellite imagery on 16 December. On 18 and 27-28 December explosions produced ash plumes that rose to 2.5 km altitude and drifted NE and SE. On 31 December an ash plume rose to 2 km altitude and drifted NE.
Explosions continued during January 2023, based on visual observations by volcanologists from Severo-Kurilsk. During 1-7 January explosions generated ash plumes that rose to 4 km altitude and drifted NE, E, W, and SE. According to VONAs issued by KVERT on 2, 4, 10, and 23 January, explosions produced ash plumes that rose to 2-4 km altitude and drifted 5 km N, NE, E, and ENE; the ash plume that rose to 4 km altitude occurred on 10 January (figure 47). Satellite data showed a thermal anomaly during 3-4, 10, 13, 16, 21, 22, and 31 January. KVERT reported that an ash cloud on 4 January moved 12 km NE. On 6 and 9-11 January explosions sent ash plumes to 4.5 km altitude and drifted W and ESE. On 13 January an ash plume rose to 3 km altitude and drifted SE. During 20-24 January ash plumes from explosions rose to 3.7 km altitude and drifted SE, N, and NE. On 21 January the ash plume drifted as far as 40 km NE. During 28-29 and 31 January and 1 February ash plumes rose to 4 km altitude and drifted NE.
During February, explosions, ash plumes, and ashfall were reported. During 1, 4-5 and 7-8 February explosions generated ash plumes that rose to 4.5 km altitude and drifted E and NE; ashfall was observed on 5 and 8 February. On 6 February an explosion produced an ash plume that rose to 3 km altitude and drifted 7 km E, causing ashfall in Severo-Kurilsk. A thermal anomaly was visible in satellite data on 8, 9, 13, and 21 February. Explosions on 9 and 12-13 February produced ash plumes that rose to 4 km altitude and drifted E and NE; the ash cloud on 12 February extended as far as 45 km E. On 22 February explosions sent ash to 3 km altitude that drifted E. During 24 and 26-27 February ash plumes rose to 4 km altitude and drifted E. On 28 February an explosion sent ash to 2.5-3 km altitude and drifted 5 km E; ashfall was observed in Severo-Kurilsk.
Activity continued during March; visual observations showed that explosions generated ash plumes that rose to 3.6 km altitude on 3, 5-7, and 9-12 March and drifted E, NE, and NW. Thermal anomalies were visible on 10, 13, and 29-30 March in satellite imagery. On 18, 21-23, 26, and 29-30 March explosions produced ash plumes that rose to 2.8 km altitude and drifted NE and E; the ash plumes during 22-23 March extended up to 76 km E. A VONA issued on 21 March reported an explosion that produced an ash plume that rose to 2.8 km altitude and drifted 5 km E. Another VONA issued on 23 March reported that satellite data showed an ash plume rising to 3 km altitude and drifted 14 km E.
Explosions during April continued to generate ash plumes. On 1 and 4 April an ash plume rose to 2.8-3.5 km altitude and drifted SE and NE. A thermal anomaly was visible in satellite imagery during 1-6 April. Satellite data showed ash plumes and clouds rising to 2-3 km altitude and drifting up to 12 km SW and E on 3 and 6 April (figure 48). KVERT issued VONAs on 3, 5, 14, 16 April describing explosions that produced ash plumes rising to 3 km, 3.5 km, 3.5 km, and 3 km altitude and drifting 5 km S, 5 km NE and SE, 72 km NNE, and 5 km NE, respectively. According to satellite data, the resulting ash cloud from the explosion on 14 April was 25 x 7 km in size and drifted 72-104 km NNE during 14-15 April. According to visual data by volcanologists from Severo-Kurilsk explosions sent ash up to 3.5 km altitude that drifted NE and E during 15-16, 22, 25-26, and 29 April.
The explosive eruption continued during May. Explosions during 3-4, 6-7, and 9-10 May generated ash plumes that rose to 4 km altitude and drifted SW and E. Satellite data showed a thermal anomaly on 3, 9, 13-14, and 24 May. During 12-16, 23-25, and 27-28 May ash plumes rose to 3.5 km altitude and drifted in different directions due to explosions. Two VONA notices were issued on 16 and 25 May, describing explosions that generated ash plumes rising to 3 km and 3.5 km altitude, respectively and extending 5 km E. The ash cloud on 25 May drifted 75 km SE.
Thermal activity in the summit crater, occasionally accompanied by ash plumes and ash deposits on the SE and E flanks due to frequent explosions, were visible in infrared and true color satellite images (figure 49).
Geologic Background. The flat-topped summit of the central cone of Ebeko volcano, one of the most active in the Kuril Islands, occupies the northern end of Paramushir Island. Three summit craters located along a SSW-NNE line form Ebeko volcano proper, at the northern end of a complex of five volcanic cones. Blocky lava flows extend west from Ebeko and SE from the neighboring Nezametnyi cone. The eastern part of the southern crater contains strong solfataras and a large boiling spring. The central crater is filled by a lake about 20 m deep whose shores are lined with steaming solfataras; the northern crater lies across a narrow, low barrier from the central crater and contains a small, cold crescentic lake. Historical activity, recorded since the late-18th century, has been restricted to small-to-moderate explosive eruptions from the summit craters. Intense fumarolic activity occurs in the summit craters, on the outer flanks of the cone, and in lateral explosion craters.
Information Contacts: Kamchatka Volcanic Eruptions Response Team (KVERT), Far Eastern Branch, Russian Academy of Sciences, 9 Piip Blvd., Petropavlovsk-Kamchatsky, 683006, Russia (URL: http://www.kscnet.ru/ivs/kvert/); MIROVA (Middle InfraRed Observation of Volcanic Activity), a collaborative project between the Universities of Turin and Florence (Italy) supported by the Centre for Volcanic Risk of the Italian Civil Protection Department (URL: http://www.mirovaweb.it/); Copernicus Browser, Copernicus Data Space Ecosystem, European Space Agency (URL: https://dataspace.copernicus.eu/browser/).
Home Reef
Tonga
18.992°S, 174.775°W; summit elev. -10 m
All times are local (unless otherwise noted)
Discolored plumes continued during November 2022-April 2023
Home Reef is a submarine volcano located in the central Tonga islands between Lateiki (Metis Shoal) and Late Island. The first recorded eruption occurred in the mid-19th century, when an ephemeral island formed. An eruption in 1984 produced a 12-km-high eruption plume, a large volume of floating pumice, and an ephemeral island 500 x 1,500 m wide, with cliffs 30-50 m high that enclosed a water-filled crater. Another island-forming eruption in 2006 produced widespread pumice rafts that drifted as far as Australia; by 2008 the island had eroded below sea level. The previous eruption occurred during October 2022 and was characterized by a new island-forming eruption, lava effusion, ash plumes, discolored water, and gas-and-steam plumes (BGVN 47:11). This report covers discolored water plumes during November 2022 through April 2023 using satellite data.
Discolored plumes continued during the reporting period and were observed in true color satellite images on clear weather days. Satellite images show light green-yellow discolored water extending W on 8 and 28 November 2022 (figure 31), and SW on 18 November. Light green-yellow plumes extended W on 3 December, S on 13 December, SW on 18 December, and W and S on 23 December (figure 31). On 12 January 2023 discolored green-yellow plumes extended to the NE, E, SE, and N. The plume moved SE on 17 January and NW on 22 January. Faint discolored water in February was visible moving NE on 1 February. A discolored plume extended NW on 8 and 28 March and NW on 13 March (figure 31). During April, clear weather showed green-blue discolored plumes moving S on 2 April, W on 7 April, and NE and S on 12 April. A strong green-yellow discolored plume extended E and NE on 22 April for several kilometers (figure 31).
Geologic Background. Home Reef, a submarine volcano midway between Metis Shoal and Late Island in the central Tonga islands, was first reported active in the mid-19th century, when an ephemeral island formed. An eruption in 1984 produced a 12-km-high eruption plume, large amounts of floating pumice, and an ephemeral 500 x 1,500 m island, with cliffs 30-50 m high that enclosed a water-filled crater. In 2006 an island-forming eruption produced widespread dacitic pumice rafts that drifted as far as Australia. Another island was built during a September-October 2022 eruption.
Information Contacts: Copernicus Browser, Copernicus Data Space Ecosystem, European Space Agency (URL: https://dataspace.copernicus.eu/browser/).
Ambae
Vanuatu
15.389°S, 167.835°E; summit elev. 1496 m
All times are local (unless otherwise noted)
New lava flow, ash plumes, and sulfur dioxide plumes during February-May 2023
Ambae, also known as Aoba, is a large basaltic shield volcano in Vanuatu. A broad pyroclastic cone containing three crater lakes (Manaro Ngoru, Voui, and Manaro Lakua) is located at the summit within the youngest of at least two nested calderas. Periodic phreatic and pyroclastic explosions have been reported since the 16th century. A large eruption more than 400 years ago resulted in a volcanic cone within the summit crater that is now filled by Lake Voui; the similarly sized Lake Manaro fills the western third of the caldera. The previous eruption ended in August 2022 that was characterized by gas-and-steam and ash emissions and explosions of wet tephra (BGVN 47:10). This report covers a new eruption during February through May 2023 that consisted of a new lava flow, ash plumes, and sulfur dioxide emissions, using information from the Vanuatu Meteorology and Geo-Hazards Department (VMGD) and satellite data.
During the reporting period, the Alert Level remained at a 2 (on a scale of 0-5), which has been in place since December 2021. Activity during October 2022 through March 2023 remained relatively low and mostly consisted of gas-and-steam emissions in Lake Voui. VMGD reported that at 1300 on 15 November a satellite image captured a strong amount of sulfur dioxide rising above the volcano (figure 99), and that seismicity slightly increased. The southern and northern part of the island reported a strong sulfur dioxide smell and heard explosions. On 20 February 2023 a gas-and-ash plume rose 1.3 km above the summit and drifted SSW, according to a webcam image (figure 100). Gas-and-steam and possibly ash emissions continued on 23 February and volcanic earthquakes were recorded by the seismic network.
During April, volcanic earthquakes and gas-and-steam and ash emissions were reported from the cone in Lake Voui. VMGD reported that activity increased during 5-7 April; high gas-and-steam and ash plumes were visible, accompanied by nighttime incandescence. According to a Wellington VAAC report, a low-level ash plume rose as high as 2.5 km above the summit and drifted W and SW on 5 April, based on satellite imagery. Reports in Saratamata stated that a dark ash plume drifted to the WSW, but no loud explosion was heard. Webcam images from 2100 showed incandescence above the crater and reflected in the clouds. According to an aerial survey, field observations, and satellite data, water was no longer present in the lake. A lava flow was reported effusing from the vent and traveling N into the dry Lake Voui, which lasted three days. The next morning at 0745 on 6 April a gas-and-steam and ash plume rose 5.4 km above the summit and drifted ESE, based on information from VMGD (figure 101). The Wellington VAAC also reported that light ashfall was observed on the island. Intermittent gas-and-steam and ash emissions were visible on 7 April, some of which rose to an estimated 3 km above the summit and drifted E. Webcam images during 0107-0730 on 7 April showed continuing ash emissions. A gas-and-steam and ash plume rose 695 m above the summit crater at 0730 on 19 April and drifted ESE, based on a webcam image (figure 102).
According to visual and infrared satellite data, water was visible in Lake Voui as late as 24 March 2023 (figure 103). The vent in the caldera showed a gas-and-steam plume drifted SE. On 3 April thermal activity was first detected, accompanied by a gas-and-ash plume that drifted W (figure 103). The lava flow moved N within the dry lake and was shown cooling by 8 April. By 23 April much of the water in the lake had returned. Occasional sulfur dioxide plumes were detected by the TROPOMI instrument on the Sentinel-5P satellite that exceeded 2 Dobson Units (DU) and drifted in different directions (figure 104).
Geologic Background. The island of Ambae, also known as Aoba, is a massive 2,500 km3 basaltic shield that is the most voluminous volcano of the New Hebrides archipelago. A pronounced NE-SW-trending rift zone with numerous scoria cones gives the 16 x 38 km island an elongated form. A broad pyroclastic cone containing three crater lakes (Manaro Ngoru, Voui, and Manaro Lakua) is located at the summit within the youngest of at least two nested calderas, the largest of which is 6 km in diameter. That large central edifice is also called Manaro Voui or Lombenben volcano. Post-caldera explosive eruptions formed the summit craters about 360 years ago. A tuff cone was constructed within Lake Voui (or Vui) about 60 years later. The latest known flank eruption, about 300 years ago, destroyed the population of the Nduindui area near the western coast.
Information Contacts: Geo-Hazards Division, Vanuatu Meteorology and Geo-Hazards Department (VMGD), Ministry of Climate Change Adaptation, Meteorology, Geo-Hazards, Energy, Environment and Disaster Management, Private Mail Bag 9054, Lini Highway, Port Vila, Vanuatu (URL: http://www.vmgd.gov.vu/, https://www.facebook.com/VanuatuGeohazardsObservatory/); Wellington Volcanic Ash Advisory Centre (VAAC), Meteorological Service of New Zealand Ltd (MetService), PO Box 722, Wellington, New Zealand (URL: http://www.metservice.com/vaac/, http://www.ssd.noaa.gov/VAAC/OTH/NZ/messages.html); MIROVA (Middle InfraRed Observation of Volcanic Activity), a collaborative project between the Universities of Turin and Florence (Italy) supported by the Centre for Volcanic Risk of the Italian Civil Protection Department (URL: http://www.mirovaweb.it/); Global Sulfur Dioxide Monitoring Page, Atmospheric Chemistry and Dynamics Laboratory, NASA Goddard Space Flight Center (NASA/GSFC), 8800 Greenbelt Road, Goddard, Maryland, USA (URL: https://so2.gsfc.nasa.gov/); Copernicus Browser, Copernicus Data Space Ecosystem, European Space Agency (URL: https://dataspace.copernicus.eu/browser/).
Search Bulletin Archive by Publication Date
Select a month and year from the drop-downs and click "Show Issue" to have that issue displayed in this tab.
The default month and year is the latest issue available.
Bulletin of the Global Volcanism Network - Volume 35, Number 12 (December 2010)
Managing Editor: Richard Wunderman
Chaiten (Chile)
During June-November2008 dome continues to enlarge despite a lateral blast
Kirishimayama (Japan)
Large eruption of Shinmoe-dake begins in January 2011
Pagan (United States)
Quiet with only minor steam emissions in October and November 2010
Poas (Costa Rica)
Occasional minor phreatic eruptions during December 2009-November 2010
Chaiten
Chile
42.8349°S, 72.6514°W; summit elev. 1122 m
All times are local (unless otherwise noted)
During June-November2008 dome continues to enlarge despite a lateral blast
What follows summarizes official agency reporting on Chaitén's behavior from 26 July 2008 through early November 2008. Noteworthy events included a large scar that developed on the E dome area by 31 July 2008 from an inferred lateral blast, observance of a new lava dome (or dome lobe), ongoing seismicity, the emergence of the new dome as the highest point in the complex, dome growth to a point where the dome crossed the moat to impinge on the caldera wall, ongoing destruction to the town of Chaitén (10 km SW) by debris-laden floodwaters, and changes in the river system due to lahars. The hazard status remained at Volcanic Alert Red, Level 6—the highest level—throughout the reporting period.
The bulk of this report came from those issued by the Servicio Nacional de Geología y Minería (SERNAGEOMIN) with collaboration from the Oficina Nacional de Emergencia—Ministerio del Interior (ONEMI). Collectively, they and partner organizations listed below under Information Contacts issued over 20 reports we used in discussions here. Below, we reference the four reports from which we extracted figures (ONEMI-SERNAGEOMIN, 2008a, b, c, and d). Respectively, these four reports covered these respective date ranges in 2008: (a, no. 45) 31 July-1 August; (b, no. 55) 23-30 September; (c, no. 58) 14-20 September; and (d, no. 60) 31 October-7 November.
As previously reported, activity at Chaitén during June-July 2008 included diminished plumes compared with earlier activity, substantial seismicity, and lateral blasts that devastated ~25 km2 of native forest (BGVN 33:06).
Seismicity, dominated by volcano-tectonic earthquakes, increased in July 2008, with some higher-magnitude earthquakes felt by the residents of the town of Chaitén. According to Carn and others (2009), "During July [2008], ash and steam emissions subsided while lava extrusion continued, accompanied daily by up to 300 hybrid earthquakes, which have characteristics transitional between low- and high-frequency events. Earthquake magnitudes increased from less than 2.5 to 4 by the end of July, raising concerns about renewed explosive eruptions, but seismicity declined in August. By late September 2008, the new lava dome volume was about half a cubic kilometer."
Clouds often obscured the view of Chaitén during 23 July-25 November. However, when visible, gas-and-ash plumes generally rose to an altitude of 1.4-4 km. In one of many examples, a modest (2 km high) plume dropped minor ash on 15 October, leaving plant leaves with a thin sprinkling of ash. Plumes reached over 4 km altitude on 13 August (up to 6-7 km), 27-28 September (5 km), and 26-28 October (7 km). Ash fell in the town of Chaitén at times. Noteworthy cases of ash accumulation including those on 24 July (3 cm thick); 27 July (thickness unstated); and 13 August (1.5 cm thick).
An overflight on 24 July revealed a 2-km-altitude plume that escaped from an area S of a previous vent, a zone on the S flank of the new lava dome. That plume contained emissions from various areas on the dome and included ash-bearing plumes generated by explosions. A gas-and-steam plume was emitted from a depression, also on the S flank, that was possibly formed by an explosion or partial collapse the previous day or two.
The Buenos Aires Volcanic Ash Advisory Center saw thermal anomalies over the lava dome in satellite imagery. Detections occurred during 22-23 August, 20-22 and 25-27 September, 27 and 30 October, and 2, 10, and 12 November 2008.
Scar in the dome. A Twin Otter aircraft flew past the volcano on 31 July 2008, and observers first saw a large scar on the E side of the dome. At some point in the flight they also saw a 2-km-altitude, languid, light-colored plume, which contained a small proportion of ash and blew NE. The plume vented most strongly from the growing dome's upper area. The scar was horseshoe-shaped, ~500 m wide, and ~200 m high, and had formed on an unknown date near the end of July 2008 (figure 17). The scar was inferred to have formed by a lateral explosion rather than collapse, because hummocky morphology typical of landslide deposits was absent on the caldera's floor (the moat) below the scar (OVDAS-SERNAGEOMIN, 2008a). Recent pyroclastic flow deposits associated with the scar also were not conspicuous. The location of the scar on the E dome was judged fortunate; if the same volume of material had blasted from the S dome, it would have traveled into the Chaitén (Blanco) River, and accordingly, to the town of Chaitén. Material from the explosion was transported into drainages that eventually flowed N into the Rayas River, and also entered small lakes at the S base of the dome (figure 18). However a significant volume of the material broken loose from the dome by the directed blast was visible in and adjacent to the SE moat. In the E moat, there were both a lake and a steep erosional scarp (figure 18). Thus, after the blast, the valley's SE drainage became obstructed, whereas the SW drainage remained open. Debris-charged water was visible in many parts of the moat.
Observations during August-November 2008. On 1 August, a N-facing camera situated ~1 km SE of town at the Chaitén airfield showed an active eruption plume in the morning, but weather obstructed the plume in the afternoon. This is one of two such web cameras at that airfield in a national system supported by the Chilean civil aviation agency DGAC. The other web camera shows the town of Chaitén (for more information see IFIS, 2011, in References below).
Seismicity decreased beginning in August and remained relatively low and variable through mid-September 2008. Hybrid earthquakes dominated, and, after 20 September, they increased in number and magnitude. SERNAGEOMIN interpreted seismicity during this time within the system as associated with movements of magmatic fluids and rock rupture. In late September, a seismic station was reinstalled in the volcano's N sector (previously sited at Auchemó, on an island 8 km SSW of the town of Chaitén). The new location was chosen in hopes that it would enable seismologists to better assess the volcano's seismic signals.
Although visual observations revealed comparative quiet during 23-25 September with weak plumes of mainly steam to 1.5-km altitude, the intensity of activity rose on the 27 and 28 September, when a series of columns emitted in separate puffs reached to 3- and sometimes 4-km altitude. The plumes were conspicuous from the settlements of Chaitén and Queilen and contained steam and fine ash.
On 30 September, the new dome had grown, but it lacked both any new scars (like the one seen on 31 July) and signs of further collapse at the 31 July scar. Small lakes remained on the N moat (arrow at left, figure 19). Portions of the older dome were still exposed (arrow at right, figure 19).
An overflight occurred on 30 September, thanks to a Presidential Delegation, during which the emissions remained similar to those previously described. Observers found it hard to define a single vent area for the emissions, although it appeared that abundant vapor escaped in the N dome area (figure 19).
Observers also commented that the scar on the E dome had changed morphology due to erosion. A photo documented that, by 30 September, new dome growth was sufficient in the NE sector to have reached the NE wall. By this time, the report authors noted, the growing dome's height had exceeded that of the caldera's topographic margin (the summit, 1,112 m elevation, a point on the S rim).
The number of hybrid earthquakes increased beginning on 20 September through early October. Beginning on 4 October, the number of earthquakes over M 3.0 decreased, a decline interpreted as related to slowed dome growth. Seismicity continued to decrease through mid-October, and was concentrated mainly in the volcano's S sector. Volcano-tectonic earthquakes did not exceed 3 per day, with magnitudes less than 1.5. Epicenters plotted on a map for 14-16 November scattered along a broad ~3-km-long line trending tangent to the ESE rim of the caldera, with several on the SE dome. Their focal depths were 0.5-3 km.
A miniDoas (a portable spectrometer based largely on differential optical absorption, Nadeau and Williams-Jones, 2008) was used for ground-based transects of the plume on 15 October 2008 to assess SO2 fluxes. After several transects along a N65°W path and wind estimates of 5 m/s (from the Chilean Meteorological Directorate), the resulting flux estimate was 190 metric tons per day.
On 29 October, activity at Chaitén increased, characterized by several explosions that darkened the plume and caused it to rise from ~1.6 km to ~3.1 km. SERNAGEOMIN reported that variations in seismicity remained similar to patterns detected during the previous weeks.
On a 30 October flight, scientists observed a landslide that had originated from the active lava dome. The next day, observers described a plume emitted from multiple areas that rose to an altitude of 2.1 km. The white component of the plume (steam and gas) emitted mainly from the center and S portions of the dome. Vents on the dome's N and NE areas produced a gray plume.
An ONEMI-SERNAGEOMIN report (2008d) covered the date range 31 October-7 November 2008. Owing to bad weather, only on 2 November did observers or cameras in the town of Chatén manage to obtain a reasonable view of the volcano (figure 20). That day, they also saw an appreciable white column that appeared to be predominantly steam, similar to many of the plumes of recent months. The plume blew E, and its top reached ~2 km above the dome.
On 4 November, ONEMI-SERNAGEOMIN reported that a recent overflight confirmed the presence of a second new lava dome. The new dome grew in the NE part of the first dome that started to form in May 2008 and had a diameter of ~300 m and a height of ~150 m. Spines protruded from the top. Seismicity was concentrated underneath the dome.
Seismicity during 31 October-7 November 2008. Elevated seismicity prevailed during the first week of November. Hybrid earthquakes dominated, averaging 2-5 events per hour. Those over M 3 occurred 1-2 times per hour. They typically had long, low-frequency (1 Hz) codas and focal depths of 0.5-2 km at points below and alongside the caldera.
Volcano-tectonic earthquakes were predominantly of low magnitude (under M 1). A larger event, M 2.2, occurred on 5 November; this was the first event of this type and magnitude in over a month. It was located 2 km W of the caldera margin at 7 km below the surface. The focus was close to, and possibly related to, a major structural lineament that trends NE across the Chaitén substructure at depths below 5 km.
Regarding the town of Chaitén. Heavy rains struck the region on 3 November, and, by 5 November, flooding had inundated parts of the town on the S banks of the Chaitén (Blanco) River (figure 21). One of the drainages with headwaters in the caldera feed into this river, and the moving water carried great quantities of volcanic material downstream. Lahars followed the river, leaving abundant sediments along their path, and they reached the sea at the river's mouth.
According to ONEMI-SERNAGEOMIN, during dry conditions, both wind and vehicular traffic in Chaitén kicked up fine ash, which remained suspended in the atmosphere. This ash had obliged the town's few remaining inhabitants to don dust masks. The requisite masks needed to filter out material down to 5 microns in diameter.
References. IFIS (Internet Flight Information Service), 2011, Location map showing camera at Chaitén airfield (URL: http://www.aipchile.cl/aerodromo/ubicacion/designador/SCTN; Images of the volcano, http://www.aipchile.cl/camara/show/id/14); Images of the river and town, http://www.aipchile.cl/camara/show/id/15).
Carn, S. A., Pallister, J. S., Lara, L., Ewert, J. W., Watt, S., Prata, A. J., Thomas, R. J., and Villarosa, G., 2009, The Unexpected Awakening of Chaitén Volcano, Chile, Eos, Transactions, American Geophysical Union, Vol. 90, No. 24, 16 JUNE 2009, pp. 205-206.
Nadeau, P. A. and Williams-Jones, G., 2008, Beyond COSPECRecent advances in SO2 monitoring technology. In: Williams-Jones, G., Stix, J. & Hickson, C. (eds.) The COSPEC Cookbook: Making SO2 Measurements at Active Volcanoes. IAVCEI, Methods in Volcanology, 1, 219-233.
OVDAS-SERNAGEOMIN, 2008a, Erupción del volcán Chaitén, Cuadragésimo Quinto Informe Técnico, 31 de julio al 01 de agosto de 2008, 4 pp., Issued 1 August 2008 (in Spanish) [file name: Informe_45_Chaitén_al_01.08.08[1].pdf].
OVDAS-SERNAGEOMIN, 2008b, Erupción del volcán Chaitén, Informe Técnico No. 55, 23-30 de septiembre de 2008, 4 pp., (Issued 30 September 2008 (in Spanish) [file name: Informe_55_Chaitén_al_30.09.08[1].pdf].
OVDAS-SERNAGEOMIN, 2008c, Erupción del volcán Chaitén, Informe Técnico No. 58, 14-20 de Septiembre de 2008, 3 pp. Issued 20 October 2008 (in Spanish), [file name: Informe_58_Chaitén_al_20.10.08.pdf].
OVDAS-SERNAGEOMIN, 2008d, Erupción del volcán Chaitén, Informe Técnico No. 60, 31 de octubre-07 de noviembre de 2008; 3 pp., Issued 8 November 2008 (in Spanish), [file name: Informe_60_Chaitén_al_07.11.08.pdf].
Geologic Background. Chaitén is a small caldera (~3 km in diameter) located 10 km NE of the town of Chaitén on the Gulf of Corcovado. Multiple explosive eruptions throughout the Holocene have been identified. A rhyolitic obsidian lava dome occupies much of the caldera floor. Obsidian cobbles from this dome found in the Blanco River are the source of artifacts from archaeological sites along the Pacific coast as far as 400 km from the volcano to the N and S. The caldera is breached on the SW side by a river that drains to the bay of Chaitén. The first recorded eruption, beginning in 2008, produced major rhyolitic explosive activity and building a new dome and tephra cone on the older rhyolite dome.
Information Contacts: Oficina Nacional de Emergencia - Ministerio del Interior (ONEMI), Beaucheff 1637 / 1671, Santiago, Chile (URL: http://www.onemi.cl/); Observatorio Volcanológico de los Andes del Sur-Servico Nacional de Geologia y Mineria (OVDAS-SERNAGEOMIN), Avda Sta María No. 0104, Santiago, Chile (URL: http://www.sernageomin.cl/); Buenos Aires Volcanic Ash Advisory Center (VAAC), Servicio Meteorológico Nacional-Fuerza Aérea Argentina, 25 de mayo 658, Buenos Aires, Argentina (URL: http://www.smn.gov.ar/vaac/buenosaires/productos.php).
Kirishimayama (Japan) — December 2010 Cite this Report
Kirishimayama
Japan
31.934°N, 130.862°E; summit elev. 1700 m
All times are local (unless otherwise noted)
Large eruption of Shinmoe-dake begins in January 2011
Setsuya Nakada (Volcano Research Center, University of Tokyo) reported that Subplinian and Vulcanian explosions occurred in the Kirishima Volcano Group in mid-January and at least as late as early February 2011. The event followed a year of inflation. The eruption occurred at Shinmoe-dake (Shinmoedake) volcano and included both airfall ash as well as the the birth and rapid growth of a lava dome. Small pyroclastic flows occurred, and over 1,000 residents evacuated.
After its 22 August 2008 eruption (BGVN 33:09), Shinmoe-dake went on to generate small phreatic explosions. These explosions took place on 15 November 2009 and 30 March, 11 April, and 27 May 2010.
Inflation preceded the 2011 eruption. the Geographical Survey Institute of Japan evaluated global positioning system (GPS) data for one year before the 2011 eruption. They found sufficient inflation to indicate the injection of 20 x 106 m3 of material.
According to the Japan Meteorological Agency (JMA), the eruption began, with a phreatomagmatic explosion from Shinmoe-dake on 19 January 2011. It produced a shock wave detected 12 km NE of the volcano, and an ash plume drifted SE. Ashfall up to 5 mm thick was reported in Miyakonojo (30 km SE) and in Nichinan City (60 km SE). Nakada reported that products of that explosion contained ~10% juvenile pumice.
Another explosion on 22 January 2011 ejected material 200 m above the vent. Based on reports from JMA and pilot observations, the Tokyo Volcanic Ash Advisory Center (VAAC) reported that ash plumes rose to altitudes of 1.8-2.1 km and drifted SE.
A third explosion began at 0731 on 26 January, and Subplinian explosions occurred at 1850 on 26 January, at 1541 on 27 January, and at 1247 on 28 January. Volcanic ash was emitted continuously until 30 January, when lava covered the crater floor.
The heights of the three major explosions during 26-28 January, confirmed with Doppler radar by JMA, were up to 8.5 km above the crater. Ashfall deposits were found ~17 cm thick at a distance of ~3 km SW of the crater, and ~8 cm thick at a distance of ~6 km from the crater.
Figures 11 and 12 are photos taken on 27 January amid the three major explosions of 26-28 January.
According to the Earthquake Research Institute (ERI), the explosion on 26 January 2011 prompted JMA to raise the Alert Level to 3 (on a scale of 1-5). Lightning in the ash plume was visible in video footage that same day. Based on reports from JMA, analyses of satellite imagery, and pilot observations, the Tokyo VAAC reported that on 27 January ash plumes rose to altitudes of 1.8-2.1 km and drifted SE. According to news articles, tephra fell as far away as 8 km on 27 January and disrupted flights and train service. Some people in Miyazaki (55 km E from the volcano) voluntarily evacuated, and about 30 people in Takaharu (15 km E) spent the night in an evacuation center.
On 28 January, a small lava dome 200 m in diameter appeared on the crater floor near the vent (figure 13). In three days, it grew to ~600 m in diameter and attained a volume of more than 107 m3. ALOS satellite images disclosed that the dome grew to the point where it completely covered the active vent. Figure 14 shows the concentrically ringed and steaming lava dome on the crater floor as it appeared on 30 January.
During an overflight on 29 January 2011, scientists from the ERI observed freshly erupted dome material on the crater floor and saw that the crater lake was gone. Fresh pyroclastic flow deposits in the SW crater had runout distances of 500-600 m.
On the night of 31 January, 1,158 people who lived in the Takaharu Town, ~12 km W of the crater and subject to potential pyroclastic flows, were ordered to evacuate due to a possibility of a Plinian explosion. As of 5 February, 73 people who lived less than 8 km from the crater were still in the process of evacuating.
A Vulcanian explosion started on 1 February 2011, destroying part of the dome. Volcanic ash rose about 7 km above the crater, according to JMA. Large ballistics 0.7 m in diameter landed 3.2 km W of the crater. Authorities established a zone of limited access within 4 km the crater. During subsequent Vulcanian explosions, the dome stopped growing. Its morphology flattened, and it became covered with its own ejecta.
Strong steam emanated from the dome's center on 4 February (figure 14). That day, Japan's Prime Minister delivered an address on the eruption at a meeting of government officials. They outlined responses and approaches to the crisis, including expanding the hazard zone, evacuation routes, countermeasures to lahars, and the danger of pyroclastic flows.
Pumice from this eruption was composed of pyroxene-bearing andesite (57 to 62% SiO2), showing mingling of two magmas with different colors. The progress of this eruption seemed similar, Nakada noted, to the early stage of the volcano's 1716-1717 eruption. That eruption included a 3-month explosive phase, including five events with pyroclastic flows, for a total volume of erupted products amounting to 67 km3 DRE ('dense-rock equivalent,' the volume assuming no porosity, i.e., no bubbles). That eruption lasted for 1½ years (Imura and Kobayashi, 1991).
The eruption was studied from many perspectives, including satellite, seismic, magnetometer, GPS, tiltmeter, and infrasonic. Significant illustrations of data relating to the eruption have emerged, describing spatial distribution of plumes and deposits, geophysical, geochemical, petrographic, and other information only briefly covered here (ERI, 2011). Outstanding still and video images of the eruption appeared widely in the news and on the internet. No fatalities were cited in news reports accessed at press time in late February 2011.
References. ERI, 2011, Eruption of Shinmoe-dake (Kirishima volcano group), Japan, 2011; Earthquake Research Institute (ERI), Univ. of Tokyo (URL: outreach.eri.u-tokyo.ac.jp/eqvolc/201101_shinmoe/eng/).
Imura, R. and Kobayashi, T., 2001, Geological map of Kirishima Volcano (1:50,000), Geological Survey of Japan.
Imura, R. and Kobayashi, T., 1991. Eruptions of Shinmoedake Volcano, Kirishima Volcano Group, in the last 300 years, Bulletin of Volcanological Society of Japan, v. 36, pp.135-148 (in Japanese with abstract in English).
Geologic Background. Kirishimayama is a large group of more than 20 Quaternary volcanoes located north of Kagoshima Bay. The late-Pleistocene to Holocene dominantly andesitic group consists of stratovolcanoes, pyroclastic cones, maars, and underlying shield volcanoes located over an area of 20 x 30 km. The larger stratovolcanoes are scattered throughout the field, with the centrally located Karakunidake being the highest. Onamiike and Miike, the two largest maars, are located SW of Karakunidake and at its far eastern end, respectively. Holocene eruptions have been concentrated along an E-W line of vents from Miike to Ohachi, and at Shinmoedake to the NE. Frequent small-to-moderate explosive eruptions have been recorded since the 8th century.
Information Contacts: Setsuya Nakada, Volcano Research Center, Earthquake Research Institute (VRC-ERI), University of Tokyo, Yayoi 1-1-1, Bunkyo-ku, Tokyo 113, Japan (URL: http://www.eri.u-tokyo.ac.jp/topics/ASAMA2004/index-e.html); Tetsuo Kobayashi, Graduate School of Science and Engineering, Kagoshima University, Kagoshima, Japan 890-006; Japan Meteorological Agency (JMA), Otemachi, 1-3-4, Chiyoda-ku Tokyo 100-8122, Japan (URL: http://www.jma.go.jp/); Tokyo Volcanic Ash Advisory Center (VAAC), Tokyo, Japan (URL: http://ds.data.jma.go.jp/svd/vaac/data/).
Pagan (United States) — December 2010 Cite this Report
Pagan
United States
18.13°N, 145.8°E; summit elev. 570 m
All times are local (unless otherwise noted)
Quiet with only minor steam emissions in October and November 2010
During 24 and 26-27 October and 1-4 November 2010, low-level gas-and-steam plumes were observed in satellite imagery. On 23 February 2011, the Aviation Color Code for Pagan was downgraded from Yellow to Unassigned, and the Volcano Alert Level from Advisory to Unassigned.
No MODVOLC thermal alert for Pagan has been issued for the last 10 years; however, infrequent thermal anomalies from other systems that have less stringent criteria than MODVOLC have been reported.
As background, following a small eruption in 2006 and in subsequent behavior through September 2010, Pagan has been mostly quiet, with plumes that occasionally contained some ash (BGVN 32:01, 34:09, and 35:07). Pagan is not monitored with ground-based geophysical instrumentation. The only sources of information are satellite observations and occasional reports from observers who pass or visit the island.
General References. Koyanagi, R., Kojima, G., Chong, F., and Chong, R., 1993, Seismic monitoring of earthquakes and volcanoes in the Northern Mariana Islands: 1993 summary report: Prepared for the Office of the Governor, Commonwealth of the Northern Mariana Islands, Capitol Hill, Saipan MP 96950 (revised 21 February 1993), 34 p.
Trusdell, F. A., Moore, R. B., and Sako, M. K., 2006, Preliminary Geologic Map of Mount Pagan Volcano, Pagan Island, Commonwealth of the Northern Mariana Islands, U.S. Geological Survey, Open-File Report 2006-1386 (URL: http://pubs.usgs.gov/of/2006/1386/).
Geologic Background. Pagan Island, the largest and one of the most active of the Mariana Islands volcanoes, consists of two stratovolcanoes connected by a narrow isthmus. Both North and South Pagan stratovolcanoes were constructed within calderas, 7 and 4 km in diameter, respectively. North Pagan at the NE end of the island rises above the flat floor of the northern caldera, which may have formed less than 1,000 years ago. South Pagan is a stratovolcano with an elongated summit containing four distinct craters. Almost all of the recorded eruptions, which date back to the 17th century, have originated from North Pagan. The largest eruption during historical time took place in 1981 and prompted the evacuation of the sparsely populated island.
Information Contacts: Emergency Management Office of the Commonwealth of the Northern Mariana Islands (EMO-CNMI) and USGS Volcano Hazards Program, PO Box 100007, Saipan, MP 96950, USA (URL: http://www.cnmihsem.gov.mp/ and http://volcanoes.usgs.gov/nmi/activity/); Washington Volcanic Ash Advisory Center (VAAC), Satellite Analysis Branch (SAB), NOAA/NESDIS E/SP23, NOAA Science Center Room 401, 5200 Auth Rd, Camp Springs, MD 20746, USA (URL: http://www.ospo.noaa.gov/Products/atmosphere/vaac/); Hawai'i Institute of Geophysics and Planetology (HIGP) Thermal Alerts System, School of Ocean and Earth Science and Technology (SOEST), Univ. of Hawai'i, 2525 Correa Road, Honolulu, HI 96822, USA (URL: http://modis.higp.hawaii.edu/).
Poas (Costa Rica) — December 2010 Cite this Report
Poas
Costa Rica
10.2°N, 84.233°W; summit elev. 2697 m
All times are local (unless otherwise noted)
Occasional minor phreatic eruptions during December 2009-November 2010
This report discusses the behavior of Poás during January 2009-February 2011. Several minor phreatic eruptions occurred, and fumaroles on the dome at times had temperatures over 800°C (figures 92 and 93). As reported earlier (BGVN 34:01), earthquakes on 8 January 2009 caused a number of significant landslides and destruction; a phreatic eruption occurred on 12 January 2009.
According to the Observatorio Vulcanologico y Sismologico de Costa Rica-Universidad Nacional (OVSICORI-UNA), seismic data indicated that a phreatic eruption from Laguna Caliente, one of two summit lakes at Poás, occurred on 21 March 2009, the first one since 12 January 2009. Observation shortly after the March phreatic eruption revealed that water in Laguna Caliente was gray and measured 49°C. Convection cells disturbed in the steaming lake's central area. There was continuous bubbling along the crater's SW wall. Fumarolic activity at the N crater wall had a temperature of 93°C and emitted constant steam that rose up to 400 m above the crater floor. One of the fumaroles produced a noise similar to steam escaping from a safety valve.
In November, OVSICORI-UNA reported several phreatic eruptions from the central part of Laguna Caliente. They ejected material that fell back into the lake, occasionally producing small waves. Dark-colored gas plumes rose a few meters to several ten's of meters above the lake surface. The temperature of the lava dome was 630°C at accessible areas. Fumarolic plumes from the dome rose 1 km and drifted W and SW. Some foliage on the SW flank ~3.5 km from the crater showed signs of gas damage.
Another phreatic eruption was observed on 25 December 2009. Steam and lake water mixed with sediment and blocks were ejected 550-600 m above Laguna Caliente and fell in the vicinity of the lake, within the crater. The amount of steam emitted from lava-dome fumaroles at the S edge of the lake increased subsequent to the eruption (figure 92), and the smell of H2S was strong.
OVSICORI-UNA reported another phreatic eruption from Laguna Caliente on 23 February 2010. The eruption ejected gray and sulfur-smelling sediment onto the southern flanks. The event was seen by a scientist collecting samples in the low part of the crater and by visitors at the viewpoint area. Seismographs showed no precursory signals.
An observation of the Laguna Caliente in April 2010 noted that the water temperature was 48°C and that the water level in the lake had decreased 28 cm between 7 and 27 April 2010. The area of fumarolic activity was also noted to have increased. Two new fumaroles emerged in the N wall. They produced sulfur deposits and bluish gas emissions (temperature ~838°C) that rose ~1 km above the crater floor.
In September 2010, the temperature of the lava dome was 810°C at accessible areas. OVSICORI-UNA reported that several phreatic eruptions occurred from the central part of the lake and again, ejected material fell back into the lake and gas plumes rose up to ~100 m above the water surface.
OVSICORI-UNA reported that in November 2010 several phreatic eruptions occurred; plumes from the eruptions rose ~1 km and drifted W and SW. Some foliage on the SW flank ~3.5 km from the crater showed signs of gas damage. By this time, the temperature of the lava dome had declined to ~630°C.
According to OVSICORI-UNA, a small phreatic eruption occurred from the central part of Laguna Caliente on 2 February 2011. Solid dark material was ejected 6 m and fell back into the lake. Before, during, and after the eruption, a concentric area of the lake surface ~15 m in diameter was disturbed by a convecting cell. Bubbles of gas rose from the agitated area, and upwelling sediments were observed.
Geologic Background. The broad vegetated edifice of Poás, one of the most active volcanoes of Costa Rica, contains three craters along a N-S line. The frequently visited multi-hued summit crater lakes of the basaltic-to-dacitic volcano are easily accessible by vehicle from the nearby capital city of San José. A N-S-trending fissure cutting the complex stratovolcano extends to the lower N flank, where it has produced the Congo stratovolcano and several lake-filled maars. The southernmost of the two summit crater lakes, Botos, last erupted about 7,500 years ago. The more prominent geothermally heated northern lake, Laguna Caliente, is one of the world's most acidic natural lakes, with a pH of near zero. It has been the site of frequent phreatic and phreatomagmatic eruptions since an eruption was reported in 1828. Eruptions often include geyser-like ejections of crater-lake water.
Information Contacts: Observatorio Vulcanologico Sismologica de Costa Rica-Universidad Nacional (OVSICORI-UNA), Apartado 86-3000, Heredia, Costa Rica (URL: http://www.ovsicori.una.ac.cr/).