Recently Published Bulletin Reports
Erebus (Antarctica) Lava lake remains active; most thermal alerts recorded since 2019
Rincon de la Vieja (Costa Rica) Frequent phreatic explosions during July-December 2023
Bezymianny (Russia) Explosion on 18 October 2023 sends ash plume 8 km high; lava flows and incandescent avalanches
Kilauea (United States) Low-level lava effusions in the lava lake at Halema’uma’u during July-December 2022
Nyamulagira (DR Congo) Lava flows and thermal activity during May-October 2023
Bagana (Papua New Guinea) Explosions, ash plumes, ashfall, and lava flows during April-September 2023
Mayon (Philippines) Lava flows, pyroclastic flows, ash emissions, and seismicity during April-September 2023
Nishinoshima (Japan) Eruption plumes and gas-and-steam plumes during May-August 2023
Krakatau (Indonesia) White gas-and-steam plumes and occasional ash plumes during May-August 2023
Villarrica (Chile) Strombolian activity, gas-and-ash emissions, and crater incandescence during April-September 2023
Merapi (Indonesia) Frequent incandescent avalanches during April-September 2023
Ebeko (Russia) Moderate explosive activity with ash plumes continued during June-November 2023
Erebus (Antarctica) — January 2024  Cite this Report
Erebus
Antarctica
77.53°S, 167.17°E; summit elev. 3794 m
All times are local (unless otherwise noted)
Lava lake remains active; most thermal alerts recorded since 2019
The lava lake in the summit crater of Erebus has been active since at least 1972. Located in Antarctica overlooking the McMurdo Station on Ross Island, it is the southernmost active volcano on the planet. Because of the remote location, activity is primarily monitored by satellites. This report covers activity during 2023.
The number of thermal alerts recorded by the Hawai'i Institute of Geophysics and Planetology’s MODVOLC Thermal Alerts System increased considerably in 2023 compared to the years 2020-2022 (table 9). In contrast to previous years, the MODIS instruments aboard the Aqua and Terra satellites captured data from Erebus every month during 2023. Consistent with previous years, the lowest number of anomalous pixels were recorded in January, November, and December.
Table 9. Number of monthly MODIS-MODVOLC thermal alert pixels recorded at Erebus during 2017-2023. See BGVN 42:06 for data from 2000 through 2016. The table was compiled using data provided by the HIGP – MODVOLC Thermal Alerts System.
| Year |
Jan |
Feb |
Mar |
Apr |
May |
Jun |
Jul |
Aug |
Sep |
Oct |
Nov |
Dec |
SUM |
| 2017 |
0 |
21 |
9 |
0 |
0 |
1 |
11 |
61 |
76 |
52 |
0 |
3 |
234 |
| 2018 |
0 |
21 |
58 |
182 |
55 |
17 |
137 |
172 |
103 |
29 |
0 |
0 |
774 |
| 2019 |
2 |
21 |
162 |
151 |
55 |
56 |
75 |
53 |
29 |
19 |
1 |
0 |
624 |
| 2020 |
0 |
2 |
16 |
18 |
4 |
4 |
1 |
3 |
18 |
3 |
1 |
6 |
76 |
| 2021 |
0 |
9 |
1 |
0 |
2 |
56 |
46 |
47 |
35 |
52 |
5 |
3 |
256 |
| 2022 |
1 |
13 |
55 |
22 |
15 |
32 |
39 |
19 |
31 |
11 |
0 |
0 |
238 |
| 2023 |
2 |
33 |
49 |
82 |
41 |
32 |
70 |
64 |
42 |
17 |
5 |
11 |
448 |
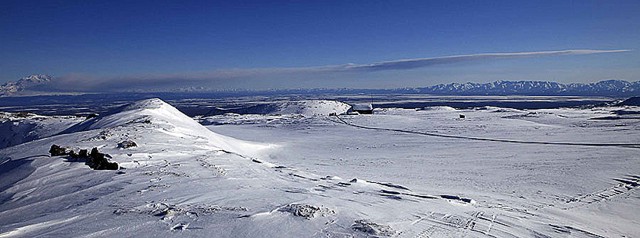
Sentinel-2 infrared images showed one or two prominent heat sources within the summit crater, accompanied by adjacent smaller sources, similar to recent years (see BGVN 46:01, 47:02, and 48:01). A unique image was obtained on 25 November 2023 by the OLI-2 (Operational Land Imager-2) on Landsat 9, showing the upper part of the volcano surrounded by clouds (figure 32).
Geologic Background. Mount Erebus, the world's southernmost historically active volcano, overlooks the McMurdo research station on Ross Island. It is the largest of three major volcanoes forming the crudely triangular Ross Island. The summit of the dominantly phonolitic volcano has been modified by one or two generations of caldera formation. A summit plateau at about 3,200 m elevation marks the rim of the youngest caldera, which formed during the late-Pleistocene and within which the modern cone was constructed. An elliptical 500 x 600 m wide, 110-m-deep crater truncates the summit and contains an active lava lake within a 250-m-wide, 100-m-deep inner crater; other lava lakes are sometimes present. The glacier-covered volcano was erupting when first sighted by Captain James Ross in 1841. Continuous lava-lake activity with minor explosions, punctuated by occasional larger Strombolian explosions that eject bombs onto the crater rim, has been documented since 1972, but has probably been occurring for much of the volcano's recent history.
Information Contacts: Hawai'i Institute of Geophysics and Planetology (HIGP) - MODVOLC Thermal Alerts System, School of Ocean and Earth Science and Technology (SOEST), Univ. of Hawai'i, 2525 Correa Road, Honolulu, HI 96822, USA (URL: http://modis.higp.hawaii.edu/); Copernicus Browser, Copernicus Data Space Ecosystem, European Space Agency (URL: https://dataspace.copernicus.eu/browser/); NASA Earth Observatory, EOS Project Science Office, NASA Goddard Space Flight Center, Goddard, Maryland, USA (URL: https://earthobservatory.nasa.gov/images/152134/erebus-breaks-through).
Rincon de la Vieja (Costa Rica) — January 2024 Cite this Report
Rincon de la Vieja
Costa Rica
10.83°N, 85.324°W; summit elev. 1916 m
All times are local (unless otherwise noted)
Frequent phreatic explosions during July-December 2023
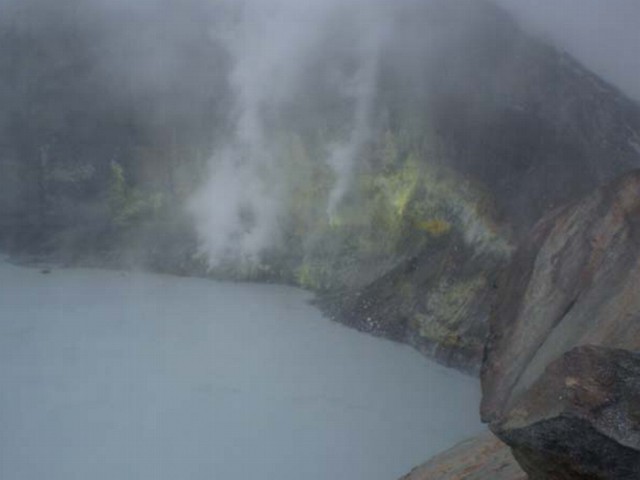
Rincón de la Vieja is a volcanic complex in Costa Rica with a hot convecting acid lake that exhibits frequent weak phreatic explosions, gas-and-steam emissions, and occasional elevated sulfur dioxide levels (BGVN 45:10, 46:03, 46:11). The current eruption period began June 2021. This report covers activity during July-December 2023 and is based on weekly bulletins and occasional daily reports from the Observatorio Vulcanologico Sismologica de Costa Rica-Universidad Nacional (OVSICORI-UNA).
Numerous weak phreatic explosions continued during July-December 2023, along with gas-and-steam emissions and plumes that rose as high as 3 km above the crater rim. Many weekly OVSICORI-UNA bulletins included the previous week's number of explosions and emissions (table 9). For many explosions, the time of explosion was given (table 10). Frequent seismic activity (long-period earthquakes, volcano-tectonic earthquakes, and tremor) accompanied the phreatic activity.
Table 9. Number of reported weekly phreatic explosions and gas-and-steam emissions at Rincón de la Vieja, July-December 2023. Counts are reported for the week before the Weekly Bulletin date; not all reports included these data. Courtesy of OVSICORI-UNA.
| OVSICORI Weekly Bulletin |
Number of explosions |
Number of emissions |
| 28 Jul 2023 |
6 |
14 |
| 4 Aug 2023 |
10 |
12 |
| 1 Sep 2023 |
13 |
11 |
| 22 Sep 2023 |
12 |
13 |
| 29 Sep 2023 |
6 |
11 |
| 6 Oct 2023 |
12 |
5 |
| 13 Oct 2023 |
7 |
9 |
| 20 Oct 2023 |
1 |
15 |
| 27 Oct 2023 |
3 |
23 |
| 3 Nov 2023 |
3 |
10 |
| 17 Nov 2023 |
0 |
Some |
| 24 Nov 2023 |
0 |
14 |
| 8 Dec 2023 |
4 |
16 |
| 22 Dec 2023 |
8 |
18 |
Table 10. Summary of activity at Rincón de la Vieja during July-December 2023. Weak phreatic explosions and gas emissions are noted where the time of explosion was indicated in the weekly or daily bulletins. Height of plumes or emissions are distance above the crater rim. Courtesy of OVSICORI-UNA.
| Date |
Time |
Description of Activity |
| 1 Jul 2023 |
0156 |
Explosion. |
| 2 Jul 2023 |
0305 |
Explosion. |
| 4 Jul 2023 |
0229, 0635 |
Event at 0635 produced a gas-and-steam plume that rose 700 m and drifted W; seen by residents in Liberia (21 km SW). |
| 9 Jul 2023 |
1843 |
Explosion. |
| 21 Jul 2023 |
0705 |
Explosion. |
| 26 Jul 2023 |
1807 |
Explosion. |
| 28 Jul 2023 |
0802 |
Explosion generated a gas-and-steam plume that rose 500 m. |
| 30 Jul 2023 |
1250 |
Explosion. |
| 31 Jul 2023 |
2136 |
Explosion. |
| 11 Aug 2023 |
0828 |
Explosion. |
| 18 Aug 2023 |
1304 |
Explosion. |
| 21 Aug 2023 |
1224 |
Explosion generated gas-and-steam plumes rose 500-600 m. |
| 22 Aug 2023 |
0749 |
Explosion generated gas-and-steam plumes rose 500-600 m. |
| 24 Aug 2023 |
1900 |
Explosion. |
| 25 Aug 2023 |
0828 |
Event produced a steam-and-gas plume that rose 3 km and drifted NW. |
| 27-28 Aug 2023 |
0813 |
Four small events; the event at 0813 on 28 August lasted two minutes and generated a steam-and-gas plume that rose 2.5 km. |
| 1 Sep 2023 |
1526 |
Explosion generated plume that rose 2 km and ejected material onto the flanks. |
| 2-3 Sep 2023 |
- |
Small explosions detected in infrasound data. |
| 4 Sep 2023 |
1251 |
Gas-and-steam plume rose 1 km and drifted W. |
| 7 Nov 2023 |
1113 |
Explosion. |
| 8 Nov 2023 |
0722 |
Explosion. |
| 12 Nov 2023 |
0136 |
Small gas emissions. |
| 14 Nov 2023 |
0415 |
Small gas emissions. |
According to OVSICORI-UNA, during July-October the average weekly sulfur dioxide (SO2) flux ranged from 68 to 240 tonnes/day. However, in mid-November the flux increased to as high as 334 tonnes/day, the highest value measured in recent years. The high SO2 flux in mid-November was also detected by the TROPOMI instrument on the Sentinel-5P satellite (figure 43).
Geologic Background. Rincón de la Vieja, the largest volcano in NW Costa Rica, is a remote volcanic complex in the Guanacaste Range. The volcano consists of an elongated, arcuate NW-SE-trending ridge constructed within the 15-km-wide early Pleistocene Guachipelín caldera, whose rim is exposed on the south side. Sometimes known as the "Colossus of Guanacaste," it has an estimated volume of 130 km3 and contains at least nine major eruptive centers. Activity has migrated to the SE, where the youngest-looking craters are located. The twin cone of Santa María volcano, the highest peak of the complex, is located at the eastern end of a smaller, 5-km-wide caldera and has a 500-m-wide crater. A Plinian eruption producing the 0.25 km3 Río Blanca tephra about 3,500 years ago was the last major magmatic eruption. All subsequent eruptions, including numerous historical eruptions possibly dating back to the 16th century, have been from the prominent active crater containing a 500-m-wide acid lake located ENE of Von Seebach crater.
Information Contacts: Observatorio Vulcanológico Sismológica de Costa Rica-Universidad Nacional (OVSICORI-UNA), Apartado 86-3000, Heredia, Costa Rica (URL: http://www.ovsicori.una.ac.cr/); NASA Global Sulfur Dioxide Monitoring Page, Atmospheric Chemistry and Dynamics Laboratory, NASA Goddard Space Flight Center (NASA/GSFC), 8800 Greenbelt Road, Goddard MD 20771, USA (URL: https://so2.gsfc.nasa.gov/).
Bezymianny (Russia) — November 2023 Cite this Report
Bezymianny
Russia
55.972°N, 160.595°E; summit elev. 2882 m
All times are local (unless otherwise noted)
Explosion on 18 October 2023 sends ash plume 8 km high; lava flows and incandescent avalanches
Bezymianny, located on Russia’s Kamchatka Peninsula, has had eruptions since 1955 characterized by dome growth, explosions, pyroclastic flows, ash plumes, and ashfall. Activity during November 2022-April 2023 included gas-and-steam emissions, lava dome collapses generating avalanches, and persistent thermal activity. Similar eruptive activity continued from May through October 2023, described here based on information from weekly and daily reports of the Kamchatka Volcano Eruptions Response Team (KVERT), notices from Tokyo VAAC (Volcanic Ash Advisory Center), and from satellite data.
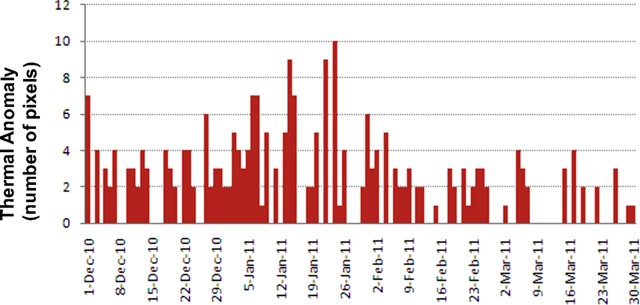
Overall activity decreased after the strong period of activity in late March through April 2023, which included ash explosions during 29 March and 7-8 April 2023 that sent plumes as high as 10-12 km altitude, along with dome growth and lava flows (BGVN 48:05). This reduced activity can be seen in the MIROVA thermal detection system graph (figure 56), which was consistent with data from the MODVOLC thermal detection system and with Sentinel-2 satellite images that showed persistent hotspots in the summit crater when conditions allowed observations. A renewed period of strong activity began in mid-October 2023.
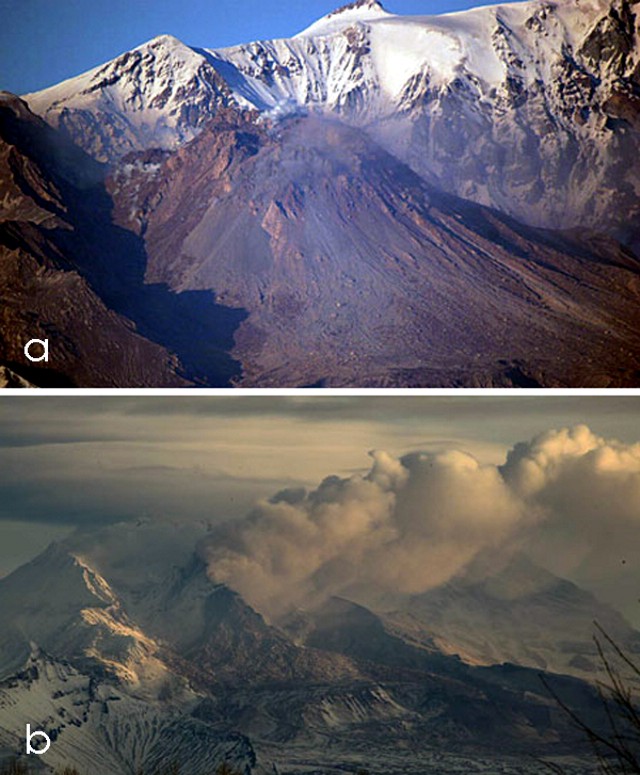
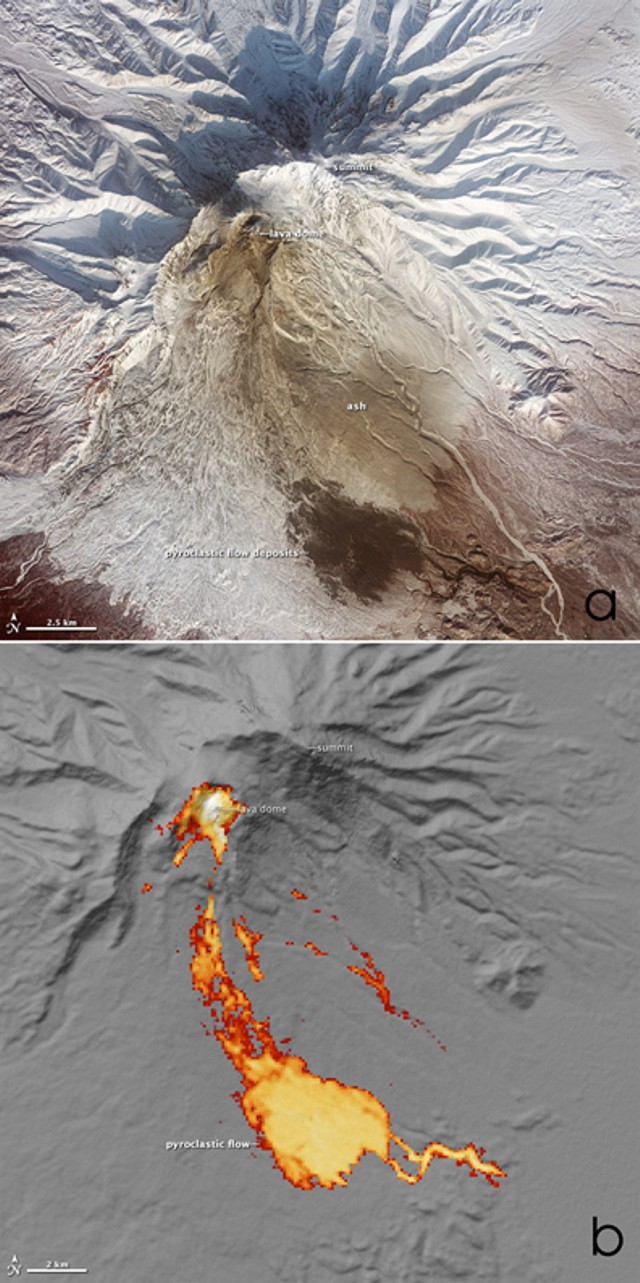
Activity increased significantly on 17 October 2023 when large collapses began during 0700-0830 on the E flanks of the lava dome and continued to after 0930 the next day (figure 57). Ash plumes rose to an altitude of 4.5-5 km, extending 220 km NNE by 18 October. A large explosion at 1630 on 18 October produced an ash plume that rose to an altitude of 11 km (8 km above the summit) and drifted NNE and then NW, extending 900 km NW within two days at an altitude of 8 km. Minor ashfall was noted in Kozyrevsk (45 km WNW). At 0820 on 20 October an ash plume was identified in satellite images drifting 100 km ENE at altitudes of 4-4.5 km.
Lava flows and hot avalanches from the dome down the SE flank continued over the next few days, including 23 October when clear conditions allowed good observations (figures 58 and 59). A large thermal anomaly was observed over the volcano through 24 October, and in the summit crater on 30 October (figure 60). Strong fumarolic activity continued, with numerous avalanches and occasional incandescence. By the last week of October, volcanic activity had decreased to a level consistent with that earlier in the reporting period.
Aviation warnings were frequently updated during 17-20 October. KVERT issued a Volcano Observatory Notice for Aviation (VONA) on 17 October at 1419 and 1727 (0219 and 0527 UTC) raising the Aviation Color Code (ACC) from Yellow to Orange (second highest level). The next day, KVERT issued a VONA at 1705 (0505 UTC) raising the ACC to Red (highest level) but lowered it back to Orange at 2117 (0917 UTC). After another decrease to Yellow and back to Orange, the ACC was reduced to Yellow on 20 October at 1204 (0004 UTC). In addition, the Tokyo VAAC issued a series of Volcanic Ash Advisories beginning on 16 October and continuing through 30 October.
Geologic Background. The modern Bezymianny, much smaller than its massive neighbors Kamen and Kliuchevskoi on the Kamchatka Peninsula, was formed about 4,700 years ago over a late-Pleistocene lava-dome complex and an edifice built about 11,000-7,000 years ago. Three periods of intensified activity have occurred during the past 3,000 years. The latest period, which was preceded by a 1,000-year quiescence, began with the dramatic 1955-56 eruption. This eruption, similar to that of St. Helens in 1980, produced a large open crater that was formed by collapse of the summit and an associated lateral blast. Subsequent episodic but ongoing lava-dome growth, accompanied by intermittent explosive activity and pyroclastic flows, has largely filled the 1956 crater.
Information Contacts: Kamchatka Volcanic Eruptions Response Team (KVERT), Far Eastern Branch, Russian Academy of Sciences, 9 Piip Blvd., Petropavlovsk-Kamchatsky, 683006, Russia (URL: http://www.kscnet.ru/ivs/kvert/); Kamchatka Volcanological Station, Kamchatka Branch of Geophysical Survey, (KB GS RAS), Klyuchi, Kamchatka Krai, Russia (URL: http://volkstat.ru/); Tokyo Volcanic Ash Advisory Center (VAAC), 1-3-4 Otemachi, Chiyoda-ku, Tokyo 100-8122, Japan (URL: http://ds.data.jma.go.jp/svd/vaac/data/); Hawai'i Institute of Geophysics and Planetology (HIGP) - MODVOLC Thermal Alerts System, School of Ocean and Earth Science and Technology (SOEST), Univ. of Hawai'i, 2525 Correa Road, Honolulu, HI 96822, USA (URL: http://modis.higp.hawaii.edu/); MIROVA (Middle InfraRed Observation of Volcanic Activity), a collaborative project between the Universities of Turin and Florence (Italy) supported by the Centre for Volcanic Risk of the Italian Civil Protection Department (URL: http://www.mirovaweb.it/); Copernicus Browser, Copernicus Data Space Ecosystem, European Space Agency (URL: https://dataspace.copernicus.eu/browser/).chr
Kilauea (United States) — January 2023 Cite this Report
Kilauea
United States
19.421°N, 155.287°W; summit elev. 1222 m
All times are local (unless otherwise noted)
Low-level lava effusions in the lava lake at Halema’uma’u during July-December 2022
Kīlauea is the southeastern-most volcano in Hawaii and overlaps the E flank of the Mauna Loa volcano. Its East Rift Zone (ERZ) has been intermittently active for at least 2,000 years. An extended eruption period began in January 1983 and was characterized by open lava lakes and lava flows from the summit caldera and the East Rift Zone. During May 2018 magma migrated into the Lower East Rift Zone (LERZ) and opened 24 fissures along a 6-km-long NE-trending fracture zone that produced lava flows traveling in multiple directions. As lava emerged from the fissures, the lava lake at Halema'uma'u drained and explosions sent ash plumes to several kilometers altitude (BGVN 43:10).
The current eruption period started during September 2021 and has recently been characterized by lava effusions, spatter, and sulfur dioxide emissions in the active Halema’uma’u lava lake (BGVN 47:08). Lava effusions, some spatter, and sulfur dioxide emissions have continued during this reporting period of July through December 2022 using daily reports, volcanic activity notices, and abundant photo, map, and video data from the US Geological Survey's (USGS) Hawaiian Volcano Observatory (HVO).
Summary of activity during July-December 2022. Low-level effusions have continued at the western vent of the Halema’uma’u crater during July through early December 2022. Occasional weak ooze-outs (also called lava break outs) would occur along the margins of the crater floor. The overall level of the active lava lake throughout the reporting period gradually increased due to infilling, however it stagnated in mid-September (table 13). During September through November, activity began to decline, though lava effusions persisted at the western vent. By 9 December, the active part of the lava lake had completely crusted over, and incandescence was no longer visible.
Table 13. Summary of measurements taken during overflights at Kīlauea that show a gradual increase in the active lava lake level and the volume of lava effused since 29 September 2021. Lower activity was reported during September-October. Data collected during July-December 2022. Courtesy of HVO.
| Date: |
Level of the active lava lake (m): |
Cumulative volume of lava effused (million cubic meters): |
| 7 Jul 2022 |
130 |
95 |
| 19 Jul 2022 |
133 |
98 |
| 4 Aug 2022 |
136 |
102 |
| 16 Aug 2022 |
137 |
104 |
| 12 Sep 2022 |
143 |
111 |
| 5 Oct 2022 |
143 |
111 |
| 28 Oct 2022 |
143 |
111 |
Activity during July 2022. Lava effusions were reported from the western vent in the Halema’uma’u crater, along with occasional weak ooze-outs along the margins of the crater floor. The height of the lava lake was variable due to deflation-inflation tilt events; for example, the lake level dropped approximately 3-4 m during a summit deflation-inflation event reported on 1 July. Webcam images taken during the night of 6-12 July showed intermittent low-level spattering at the western vent that rose less than 10 m above the vent (figure 519). Measurements made during an overflight on 7 July indicated that the crater floor was infilled about 130 m and that 95 million cubic meters of lava had been effused since 29 September 2021. A single, relatively small lava ooze-out was active to the S of the lava lake. Around midnight on 8 July there were two brief periods of lava overflow onto the lake margins. On 9 July lava ooze-outs were reported near the SE and NE edges of the crater floor and during 10-11 July they occurred near the E, NE, and NW edges. On 16 July crater incandescence was reported, though the ooze-outs and spattering were not visible. On 18 July overnight webcam images showed incandescence in the western vent complex and two ooze-outs were reported around 0000 and 0200 on 19 July. By 0900 there were active ooze-outs along the SW edge of the crater floor. Measurements made from an overflight on 19 July indicated that the crater floor was infilled about 133 m and 98 million cubic meters of lava had erupted since 29 September 2021 (figure 520). On 20 July around 1600 active ooze-outs were visible along the N edge of the crater, which continued through the next day. Extensive ooze-outs occurred along the W margin during 24 July until 1900; on 26 July minor ooze-outs were noted along the N margin. Minor spattering was visible on 29 July along the E margin of the lake. The sulfur dioxide emission rates ranged 650-2,800 tons per day (t/d), the higher of which was measured on 8 July (figure 519).
Activity during August 2022. The eruption continued in the Halema’uma’u crater at the western vent. According to HVO the lava in the active lake remained at the level of the bounding levees. Occasional minor ooze-outs were observed along the margins of the crater floor. Strong nighttime crater incandescence was visible after midnight on 6 August over the western vent cone. During 6-7 August scattered small lava lobes were active along the crater floor and incandescence persisted above the western vent through 9 August. During 7-9 August HVO reported a single lava effusion source was active along the NW margin of the crater floor. Measurements from an overflight on 4 August indicated that the crater floor was infilled about 136 m total and that 102 million cubic meters of lava had been erupted since the start of the eruption. Lava breakouts were reported along the N, NE, E, S, and W margins of the crater during 10-16 August. Another overflight survey conducted on 16 August indicated that the crater floor infilled about 137 m and 104 million cubic meters of lava had been erupted since September 2021. Measured sulfur dioxide emissions rates ranged 1,150-2,450 t/d, the higher of which occurred on 8 August.
Activity during September 2022. During September, lava effusion continued from the western vent into the active lava lake and onto the crater floor. Intermittent minor ooze-outs were reported through the month. A small ooze-out was visible on the W crater floor margin at 0220 on 2 September, which showed decreasing surface activity throughout the day, but remained active through 3 September. On 3 September around 1900 a lava outbreak occurred along the NW margin of the crater floor but had stopped by the evening of 4 September. Field crews monitoring the summit lava lake on 9 September observed spattering on the NE margin of the lake that rose no higher than 10 m, before falling back onto the lava lake crust (figure 521). Overflight measurements on 12 September indicated that the crater floor was infilled a total of 143 m and 111 million cubic meters of lava had been erupted since September 2021. Extensive breakouts in the W and N part of the crater floor were reported at 1600 on 20 September and continued into 26 September. The active part of the lava lake dropped by 10 m while other parts of the crater floor dropped by several meters. Summit tiltmeters recorded a summit seismic swarm of more than 80 earthquakes during 1500-1800 on 21 September, which occurred about 1.5 km below Halema’uma’u; a majority of these were less than Mw 2. By 22 September the active part of the lava lake was infilled about 2 m. On 23 September the western vent areas exhibited several small spatter cones with incandescent openings, along with weak, sporadic spattering (figure 522). The sulfur dioxide emission rate ranged from 930 t/d to 2,000 t/d, the higher of which was measured on 6 September.
Activity during October 2022. Activity during October declined slightly compared to previous months, though lava effusions persisted from the western vent into the active lava lake and onto the crater floor during October (figure 523). Slight variations in the lava lake were noted throughout the month. HVO reported that around 0600 on 3 October the level of the lava lake has lowered slightly. Overflight measurements taken on 5 October indicated that the crater floor was infilled a total of about 143 m and that 111 million cubic meters of lava had been effused since September 2021. During 6-7 October the lake gradually rose 0.5 m. Sulfur dioxide measurements made on 22 October had an emission rate of 700 t/d. Another overflight taken on 28 October showed that there was little to no change in the elevation of the crater floor: the crater floor was infilled a total of 143 m and 111 million cubic meters of lava had erupted since the start of the eruption.
Activity during November 2022. Activity remained low during November, though HVO reported that lava from the western vent continued to effuse into the active lava lake and onto the crater floor throughout the month. The rate of sulfur dioxide emissions during November ranged from 300-600 t/d, the higher amount of which occurred on 9 November.
Activity during December 2022. Similar low activity was reported during December, with lava effusing from the western vent into the active lava lake and onto the crater floor. During 4-5 December the active part of the lava lake was slightly variable in elevation and fluctuated within 1 m. On 9 December HVO reported that lava was no longer erupting from the western vent in the Halema’uma’u crater and that sulfur dioxide emissions had returned to near pre-eruption background levels; during 10-11 December, the lava lake had completely crusted over, and no incandescence was visible (figure 524). Time lapse camera images covering the 4-10 December showed that the crater floor showed weak deflation and no inflation. Some passive events of crustal overturning were reported during 14-15 December, which brought fresh incandescent lava to the lake surface. The sulfur dioxide emission rate was approximately 200 t/d on 14 December. A smaller overturn event on 17 December and another that occurred around 0000 and into the morning of 20 December were also detected. A small seismic swarm was later detected on 30 December.
Geologic Background. Kilauea overlaps the E flank of the massive Mauna Loa shield volcano in the island of Hawaii. Eruptions are prominent in Polynesian legends; written documentation since 1820 records frequent summit and flank lava flow eruptions interspersed with periods of long-term lava lake activity at Halemaumau crater in the summit caldera until 1924. The 3 x 5 km caldera was formed in several stages about 1,500 years ago and during the 18th century; eruptions have also originated from the lengthy East and Southwest rift zones, which extend to the ocean in both directions. About 90% of the surface of the basaltic shield volcano is formed of lava flows less than about 1,100 years old; 70% of the surface is younger than 600 years. The long-term eruption from the East rift zone between 1983 and 2018 produced lava flows covering more than 100 km2, destroyed hundreds of houses, and added new coastline.
Information Contacts: Hawaiian Volcano Observatory (HVO), U.S. Geological Survey, PO Box 51, Hawai'i National Park, HI 96718, USA (URL: http://hvo.wr.usgs.gov/).
Nyamulagira (DR Congo) — November 2023 Cite this Report
Nyamulagira
DR Congo
1.408°S, 29.2°E; summit elev. 3058 m
All times are local (unless otherwise noted)
Lava flows and thermal activity during May-October 2023
Nyamulagira (also known as Nyamuragira) is a shield volcano in the Democratic Republic of Congo with the summit truncated by a small 2 x 2.3 km caldera with walls up to about 100 m high. Documented eruptions have occurred within the summit caldera, as well as from numerous flank fissures and cinder cones. The current eruption period began in April 2018 and has more recently been characterized by summit crater lava flows and thermal activity (BGVN 48:05). This report describes lava flows and variable thermal activity during May through October 2023, based on information from the Observatoire Volcanologique de Goma (OVG) and various satellite data.
Lava lake activity continued during May. The MIROVA (Middle InfraRed Observation of Volcanic Activity) system recorded moderate-to-strong thermal activity throughout the reporting period; activity was more intense during May and October and relatively weaker from June through September (figure 95). The MODVOLC thermal algorithm, detected a total of 209 thermal alerts. There were 143 hotspots detected during May, eight during June, nine during September, and 49 during October. This activity was also reflected in infrared satellite images, where a lava flow was visible in the NW part of the crater on 7 May and strong activity was seen in the center of the crater on 4 October (figure 96). Another infrared satellite image taken on 12 May showed still active lava flows along the NW margin of the crater. According to OVG lava effusions were active during 7-29 May and moved to the N and NW parts of the crater beginning on 9 May. Strong summit crater incandescence was visible from Goma (27 km S) during the nights of 17, 19, and 20 May (figure 97). On 17 May there was an increase in eruptive activity, which peaked at 0100 on 20 May. Notable sulfur dioxide plumes drifted NW and W during 19-20 May (figure 98). Drone footage acquired in partnership with the USGS (United States Geological Survey) on 20 May captured images of narrow lava flows that traveled about 100 m down the W flank (figure 99). Data from the Rumangabo seismic station indicated a decreasing trend in activity during 17-21 May. Although weather clouds prevented clear views of the summit, a strong thermal signature on the NW flank was visible in an infrared satellite image on 22 May, based on an infrared satellite image. On 28 May the lava flows on the upper W flank began to cool and solidify. By 29 May seismicity returned to levels similar to those recorded before the 17 May increase. Lava effusion continued but was confined to the summit crater; periodic crater incandescence was observed.
Low-level activity was noted during June through October. On 1 June OVG reported that seismicity remained at lower levels and that crater incandescence had been absent for three days, though infrared satellite imagery showed continued lava effusion in the summit crater. The lava flows on the flanks covered an estimated 0.6 km2. Satellite imagery continued to show thermal activity confined to the lava lake through October (figure 96), although no lava flows or significant sulfur dioxide emissions were reported.
Geologic Background. Africa's most active volcano, Nyamulagira (also known as Nyamuragira), is a massive high-potassium basaltic shield about 25 km N of Lake Kivu and 13 km NNW of the steep-sided Nyiragongo volcano. The summit is truncated by a small 2 x 2.3 km caldera that has walls up to about 100 m high. Documented eruptions have occurred within the summit caldera, as well as from the numerous flank fissures and cinder cones. A lava lake in the summit crater, active since at least 1921, drained in 1938, at the time of a major flank eruption. Recent lava flows extend down the flanks more than 30 km from the summit as far as Lake Kivu; extensive lava flows from this volcano have covered 1,500 km2 of the western branch of the East African Rift.
Information Contacts: Observatoire Volcanologique de Goma (OVG), Departement de Geophysique, Centre de Recherche en Sciences Naturelles, Lwiro, D.S. Bukavu, DR Congo; Hawai'i Institute of Geophysics and Planetology (HIGP) - MODVOLC Thermal Alerts System, School of Ocean and Earth Science and Technology (SOEST), Univ. of Hawai'i, 2525 Correa Road, Honolulu, HI 96822, USA (URL: http://modis.higp.hawaii.edu/); MIROVA (Middle InfraRed Observation of Volcanic Activity), a collaborative project between the Universities of Turin and Florence (Italy) supported by the Centre for Volcanic Risk of the Italian Civil Protection Department (URL: http://www.mirovaweb.it/); NASA Global Sulfur Dioxide Monitoring Page, Atmospheric Chemistry and Dynamics Laboratory, NASA Goddard Space Flight Center (NASA/GSFC), 8800 Greenbelt Road, Goddard, Maryland, USA (URL: https://so2.gsfc.nasa.gov/); Copernicus Browser, Copernicus Data Space Ecosystem, European Space Agency (URL: https://dataspace.copernicus.eu/browser/); Charles Balagizi, Goma Volcano Observatory, Departement de Geophysique, Centre de Recherche en Sciences Naturelles, Lwiro, D.S. Bukavu, DR Congo.
Bagana (Papua New Guinea) — October 2023 Cite this Report
Bagana
Papua New Guinea
6.137°S, 155.196°E; summit elev. 1855 m
All times are local (unless otherwise noted)
Explosions, ash plumes, ashfall, and lava flows during April-September 2023
The remote volcano of Bagana is located in central Bougainville Island, Papua New Guinea. Recorded eruptions date back to 1842 and activity has consisted of effusive activity that has built a small lava dome in the summit crater and occasional explosions that produced pyroclastic flows. The most recent eruption has been ongoing since February 2000 and has produced occasional explosions, ash plumes, and lava flows. More recently, activity has been characterized by ongoing effusive activity and ash emissions (BGVN 48:04). This report updates activity from April through September 2023 that has consisted of explosions, ash plumes, ashfall, and lava flows, using information from the Darwin Volcanic Ash Advisory Center (VAAC) and satellite data.
An explosive eruption was reported on 7 July that generated a large gas-and-ash plume to high altitudes and caused significant ashfall in local communities; the eruption plume had reached upper tropospheric (16-18 km altitude) altitudes by 2200, according to satellite images. Sulfur dioxide plumes were detected in satellite images on 8 July and indicated that the plume was likely a mixture of gas, ice, and ash. A report issued by the Autonomous Bougainville Government (ABG) (Torokina District, Education Section) on 10 July noted that significant ash began falling during 2000-2100 on 7 July and covered most areas in the Vuakovi, Gotana (9 km SW), Koromaketo, Laruma (25 km W) and Atsilima (27 km NW) villages. Pyroclastic flows also occurred, according to ground-based reports; small deposits confined to one drainage were inspected by RVO during an overflight on 17 July and were confirmed to be from the 7 July event. Ashfall continued until 10 July and covered vegetation, which destroyed bushes and gardens and contaminated rivers and streams.
RVO reported another eruption on 14 July. The Darwin VAAC stated that an explosive event started around 0830 on 15 July and produced an ash plume that rose to 16.5 km altitude by 1000 and drifted N, according to satellite images. The plume continued to drift N and remained visible through 1900, and by 2150 it had dissipated.
Ashfall likely from both the 7 and 15 July events impacted about 8,111 people in Torokina (20 km SW), including Tsito/Vuakovi, Gotana, Koromaketo, Kenaia, Longkogari, Kenbaki, Piva (13 km SW), and Atsinima, and in the Tsitovi district, according to ABG. Significant ashfall was also reported in Ruruvu (22 km N) in the Wakunai District of Central Bougainville, though the thickness of these deposits could not be confirmed. An evacuation was called for the villages in Wakunai, where heavy ashfall had contaminated water sources; the communities of Ruruvu, Togarau, Kakarapaia, Karauturi, Atao, and Kuritaturi were asked to evacuate to a disaster center at the Wakunai District Station, and communities in Torokina were asked to evacuate to the Piva District station. According to a news article, more than 7,000 people needed temporary accommodations, with about 1,000 people in evacuation shelters. Ashfall had deposited over a broad area, contaminating water supplies, affecting crops, and collapsing some roofs and houses in rural areas. Schools were temporarily shut down. Intermittent ash emissions continued through the end of July and drifted NNW, NW, and SW. Fine ashfall was reported on the coast of Torokina, and ash plumes also drifted toward Laruma and Atsilima.
A small explosive eruption occurred at 2130 on 28 July that ejected material from the crater vents, according to reports from Torokina, in addition to a lava flow that contained two lobes. A second explosion was detected at 2157. Incandescence from the lava flow was visible from Piva as it descended the W flank around 2000 on 29 July (figure 47). The Darwin VAAC reported that a strong thermal anomaly was visible in satellite images during 30-31 July and that ash emissions rose to 2.4 km altitude and drifted WSW on 30 July. A ground report from RVO described localized emissions at 0900 on 31 July.
The Darwin VAAC reported that ash plumes were identified in satellite imagery at 0800 and 1220 on 12 August and rose to 2.1 km and 3 km altitude and drifted NW and W, respectively. A news report stated that aid was sent to more than 6,300 people that were adversely affected by the eruption. Photos taken during 17-19 August showed ash emissions rising no higher than 1 km above the summit and drifting SE. A small explosion generated an ash plume during the morning of 19 August. Deposits from small pyroclastic flows were also captured in the photos. Satellite images captured lava flows and pyroclastic flow deposits. Two temporary seismic stations were installed near Bagana on 17 August at distances of 7 km WSW (Vakovi station) and 11 km SW (Kepox station). The Kepox station immediately started to record continuous, low-frequency background seismicity.
Satellite data. Little to no thermal activity was detected during April through mid-July 2023; only one anomaly was recorded during early April and one during early June, according to MIROVA (Middle InfraRed Observation of Volcanic Activity) data (figure 48). Thermal activity increased in both power and frequency during mid-July through September, although there were still some short gaps in detected activity. MODVOLC also detected increased thermal activity during August; thermal hotspots were detected a total of five times on 19, 20, and 27 August. Weak thermal anomalies were also captured in infrared satellite images on clear weather days throughout the reporting period on 7, 12, and 17 April, 27 May, 1, 6, 16, and 31 July, and 19 September (figure 48); a strong thermal anomaly was visible on 31 July. Distinct sulfur dioxide plumes that drifted generally NW were intermittently captured by the TROPOMI instrument on the Sentinel-5P satellite and sometimes exceeded two Dobson Units (DUs) (figure 49).
Geologic Background. Bagana volcano, in a remote portion of central Bougainville Island, is frequently active. This massive symmetrical cone was largely constructed by an accumulation of viscous andesitic lava flows. The entire edifice could have been constructed in about 300 years at its present rate of lava production. Eruptive activity is characterized by non-explosive effusion of viscous lava that maintains a small lava dome in the summit crater, although occasional explosive activity produces pyroclastic flows. Lava flows with tongue-shaped lobes up to 50 m thick and prominent levees descend the flanks on all sides.
Information Contacts: Rabaul Volcano Observatory (RVO), Geohazards Management Division, Department of Mineral Policy and Geohazards Management (DMPGM), PO Box 3386, Kokopo, East New Britain Province, Papua New Guinea; Darwin Volcanic Ash Advisory Centre (VAAC), Bureau of Meteorology, Northern Territory Regional Office, PO Box 40050, Casuarina, NT 0811, Australia (URL: http://www.bom.gov.au/info/vaac/); MIROVA (Middle InfraRed Observation of Volcanic Activity), a collaborative project between the Universities of Turin and Florence (Italy) supported by the Centre for Volcanic Risk of the Italian Civil Protection Department (URL: http://www.mirovaweb.it/); Hawai'i Institute of Geophysics and Planetology (HIGP) - MODVOLC Thermal Alerts System, School of Ocean and Earth Science and Technology (SOEST), Univ. of Hawai'i, 2525 Correa Road, Honolulu, HI 96822, USA (URL: http://modis.higp.hawaii.edu/); NASA Global Sulfur Dioxide Monitoring Page, Atmospheric Chemistry and Dynamics Laboratory, NASA Goddard Space Flight Center (NASA/GSFC), 8800 Greenbelt Road, Goddard, Maryland, USA (URL: https://so2.gsfc.nasa.gov/); Copernicus Browser, Copernicus Data Space Ecosystem, European Space Agency (URL: https://dataspace.copernicus.eu/browser/); Autonomous Bougainville Government, P.O Box 322, Buka, AROB, PNG (URL: https://abg.gov.pg/); Andrew Tupper (Twitter: @andrewcraigtupp); Simon Carn, Geological and Mining Engineering and Sciences, Michigan Technological University, 1400 Townsend Drive, Houghton, MI 49931, USA (URL: http://www.volcarno.com/, Twitter: @simoncarn); Radio NZ (URL: https://www.rnz.co.nz/news/pacific/494464/more-than-7-000-people-in-bougainville-need-temporary-accommodation-after-eruption); USAID, 1300 Pennsylvania Ave, NW, Washington DC 20004, USA (URL: https://www.usaid.gov/pacific-islands/press-releases/aug-08-2023-united-states-provides-immediate-emergency-assistance-support-communities-affected-mount-bagana-volcanic-eruptions).
Mayon (Philippines) — October 2023 Cite this Report
Mayon
Philippines
13.257°N, 123.685°E; summit elev. 2462 m
All times are local (unless otherwise noted)
Lava flows, pyroclastic flows, ash emissions, and seismicity during April-September 2023
Mayon is located in the Philippines and has steep upper slopes capped by a small summit crater. Historical eruptions date back to 1616 CE that have been characterized by Strombolian eruptions, lava flows, pyroclastic flows, and mudflows. Eruptions mostly originated from a central conduit. Pyroclastic flows and mudflows have commonly descended many of the approximately 40 drainages that surround the volcano. The most recent eruption occurred during June through October 2022 and consisted of lava dome growth and gas-and-steam emissions (BGVN 47:12). A new eruption was reported during late April 2023 and has included lava flows, pyroclastic density currents, ash emissions, and seismicity. This report covers activity during April through September 2023 based on daily bulletins from the Philippine Institute of Volcanology and Seismology (PHIVOLCS).
During April through September 2023, PHIVOLCS reported near-daily rockfall events, frequent volcanic earthquakes, and sulfur dioxide measurements. Gas-and-steam emissions rose 100-900 m above the crater and drifted in different directions. Nighttime crater incandescence was often visible during clear weather and was accompanied by incandescent avalanches of material. Activity notably increased during June when lava flows were reported on the S, SE, and E flanks (figure 52). The MIROVA graph (Middle InfraRed Observation of Volcanic Activity) showed strong thermal activity coincident with these lava flows, which remained active through September (figure 53). According to the MODVOLC thermal algorithm, a total of 110 thermal alerts were detected during the reporting period: 17 during June, 40 during July, 27 during August, and 26 during September. During early June, pyroclastic density currents (PDCs) started to occur more frequently.
Low activity was reported during much of April and May; gas-and-steam emissions rose 100-900 m above the crater and generally drifted in different directions. A total of 52 rockfall events and 18 volcanic earthquakes were detected during April and 147 rockfall events and 13 volcanic events during May. Sulfur dioxide flux measurements ranged between 400-576 tons per day (t/d) during April, the latter of which was measured on 29 April and between 162-343 t/d during May, the latter of which was measured on 13 May.
Activity during June increased, characterized by lava flows, pyroclastic density currents (PDCs), crater incandescence and incandescent rockfall events, gas-and-steam emissions, and continued seismicity. Weather clouds often prevented clear views of the summit, but during clear days, moderate gas-and-steam emissions rose 100-2,500 m above the crater and drifted in multiple directions. A total of 6,237 rockfall events and 288 volcanic earthquakes were detected. The rockfall events often deposited material on the S and SE flanks within 700-1,500 m of the summit crater and ash from the events drifted SW, S, SE, NE, and E. Sulfur dioxide emissions ranged between 149-1,205 t/d, the latter of which was measured on 10 June. Short-term observations from EDM and electronic tiltmeter monitoring indicated that the upper slopes were inflating since February 2023. Longer-term ground deformation parameters based on EDM, precise leveling, continuous GPS, and electronic tilt monitoring indicated that the volcano remained inflated, especially on the NW and SE flanks. At 1000 on 5 June the Volcano Alert Level (VAL) was raised to 2 (on a 0-5 scale). PHIVOLCS noted that although low-level volcanic earthquakes, ground deformation, and volcanic gas emissions indicated unrest, the steep increase in rockfall frequency may indicate increased dome activity.
A total of 151 dome-collapse PDCs occurred during 8-9 and 11-30 June, traveled 500-2,000 m, and deposited material on the S flank within 2 km of the summit crater. During 8-9 June the VAL was raised to 3. At approximately 1947 on 11 June lava flow activity was reported; two lobes traveled within 500 m from the crater and deposited material on the S (Mi-isi), SE (Bonga), and E (Basud) flanks. Weak seismicity accompanied the lava flow and slight inflation on the upper flanks. This lava flow remained active through 30 June, moving down the S and SE flank as far as 2.5 km and 1.8 km, respectively and depositing material up to 3.3 km from the crater. During 15-16 June traces of ashfall from the PDCs were reported in Sitio Buga, Nabonton, City of Ligao and Purok, and San Francisco, Municipality of Guinobatan. During 28-29 June there were two PDCs generated by the collapse of the lava flow front, which generated a light-brown ash plume 1 km high. Satellite monitors detected significant concentrations of sulfur dioxide beginning on 29 June. On 30 June PDCs primarily affected the Basud Gully on the E flank, the largest of which occurred at 1301 and lasted eight minutes, based on the seismic record. Four PDCs generated between 1800 and 2000 that lasted approximately four minutes each traveled 3-4 km on the E flank and generated an ash plume that rose 1 km above the crater and drifted N and NW. Ashfall was recorded in Tabaco City.
Similar strong activity continued during July; slow lava effusion remained active on the S and SE flanks and traveled as far as 2.8 km and 2.8 km, respectively and material was deposited as far as 4 km from the crater. There was a total of 6,983 rockfall events and 189 PDCs that affected the S, SE, and E flanks. The volcano network detected a total of 2,124 volcanic earthquakes. Continuous gas-and-steam emissions rose 200-2,000 m above the crater and drifted in multiple directions. Sulfur dioxide emissions averaged 792-4,113 t/d, the latter of which was measured on 28 July. During 2-4 July three PDCs were generated from the collapse of the lava flow and resulting light brown plumes rose 200-300 m above the crater. Continuous tremor pulses were reported beginning at 1547 on 3 July through 7 July at 1200, at 2300 on 8 July and going through 0300 on 10 July, and at 2300 on 16 July, as recorded by the seismic network. During 6-9 July there were 10 lava flow-collapse-related PDCs that generated light brown plumes 300-500 m above the crater. During 10-11 July light ashfall was reported in some areas of Mabinit, Legazpi City, Budiao and Salvacion, Daraga, and Camalig, Albay. By 18 July the lava flow advanced 600 m on the E flank as well.
During 1733 on 18 July and 0434 on 19 July PHIVOLCS reported 30 “ashing” events, which are degassing events accompanied by audible thunder-like sounds and entrained ash at the crater, which produced short, dark plumes that drifted SW. These events each lasted 20-40 seconds, and plume heights ranged from 150-300 m above the crater, as recorded by seismic, infrasound, visual, and thermal monitors. Three more ashing events occurred during 19-20 July. Short-term observations from electronic tilt and GPS monitoring indicate deflation on the E lower flanks in early July and inflation on the NW middle flanks during the third week of July. Longer-term ground deformation parameters from EDM, precise leveling, continuous GPS, and electronic tilt monitoring indicated that the volcano was still generally inflated relative to baseline levels. A short-lived lava pulse lasted 28 seconds at 1956 on 21 July, which was accompanied by seismic and infrasound signals. By 22 July, the only lava flow that remained active was on the SE flank, and continued to extend 3.4 km, while those on the S and E flanks weakened markedly. One ashing event was detected during 30-31 July, whereas there were 57 detected during 31 July-1 August; according to PHIVOLCS beginning at approximately 1800 on 31 July eruptive activity was dominated by phases of intermittent ashing, as well as increased in the apparent rates of lava effusion from the summit crater. The ashing phases consisted of discrete events recorded as low-frequency volcanic earthquakes (LFVQ) typically 30 seconds in duration, based on seismic and infrasound signals. Gray ash plume rose 100 m above the crater and generally drifted NE. Shortly after these ashing events began, new lava began to effuse rapidly from the crater, feeding the established flowed on the SE, E, and E flanks and generating frequent rockfall events.
Intensified unrest persisted during August. There was a total of 4,141 rockfall events, 2,881 volcanic earthquakes, which included volcanic tremor events, 32 ashing events, and 101 PDCs detected throughout the month. On clear weather days, gas-and-steam emissions rose 300-1,500 m above the crater and drifted in different directions (figure 54). Sulfur dioxide emissions averaged 735-4,756 t/d, the higher value of which was measured on 16 August. During 1-2 August the rate of lava effusion decreased, but continued to feed the flows on the SE, S, and E flanks, maintaining their advances to 3.4 km, 2.8 km, and 1.1 km from the crater, respectively (figure 55). Rockfall and PDCs generated by collapses at the lava flow margins and from the summit dome deposited material within 4 km of the crater. During 3-4 August there were 10 tremor events detected that lasted 1-4 minutes. Short-lived lava pulse lasted 35 seconds and was accompanied by seismic and infrasound signals at 0442 on 6 August. Seven collapses were recorded at the front of the lava flow during 12-14 August.
During September, similar activity of slow lava effusion, PDCs, gas-and-steam emissions, and seismicity continued. There was a total of 4,452 rockfall events, 329 volcanic earthquakes, which included volcanic tremor events, two ashing events, and 85 PDCs recorded throughout the month. On clear weather days, gas-and-steam emissions rose 100-1,500 m above the crater and drifted in multiple directions. Sulfur dioxide emissions averaged 609-2,252 t/d, the higher average of which was measured on 6 September. Slow lava effusion continued advancing on the SE, S, and E flanks, maintaining lengths of 3.4 km, 2.8 km, and 1.1 km, respectively. Rockfall and PDC events generated by collapses along the lava flow margins and at the summit dome deposited material within 4 km of the crater.
Geologic Background. Symmetrical Mayon, which rises above the Albay Gulf NW of Legazpi City, is the most active volcano of the Philippines. The steep upper slopes are capped by a small summit crater. Recorded eruptions since 1616 CE range from Strombolian to basaltic Plinian, with cyclical activity beginning with basaltic eruptions, followed by longer periods of andesitic lava flows. Eruptions occur predominately from the central conduit and have also produced lava flows that travel far down the flanks. Pyroclastic density currents and mudflows have commonly swept down many of the approximately 40 ravines that radiate from the summit and have often damaged populated lowland areas. A violent eruption in 1814 killed more than 1,200 people and devastated several towns.
Information Contacts: Philippine Institute of Volcanology and Seismology (PHIVOLCS), Department of Science and Technology, University of the Philippines Campus, Diliman, Quezon City, Philippines (URL: http://www.phivolcs.dost.gov.ph/); MIROVA (Middle InfraRed Observation of Volcanic Activity), a collaborative project between the Universities of Turin and Florence (Italy) supported by the Centre for Volcanic Risk of the Italian Civil Protection Department (URL: http://www.mirovaweb.it/); Hawai'i Institute of Geophysics and Planetology (HIGP) - MODVOLC Thermal Alerts System, School of Ocean and Earth Science and Technology (SOEST), Univ. of Hawai'i, 2525 Correa Road, Honolulu, HI 96822, USA (URL: http://modis.higp.hawaii.edu/); Copernicus Browser, Copernicus Data Space Ecosystem, European Space Agency (URL: https://dataspace.copernicus.eu/browser/); William Rogers, Legazpi City, Albay Province, Philippines.
Nishinoshima (Japan) — October 2023 Cite this Report
Nishinoshima
Japan
27.247°N, 140.874°E; summit elev. 100 m
All times are local (unless otherwise noted)
Eruption plumes and gas-and-steam plumes during May-August 2023
Nishinoshima, located about 1,000 km S of Tokyo, is a small island in the Ogasawara Arc in Japan. The island is the summit of a massive submarine volcano that has prominent submarine peaks to the S, W, and NE. Eruptions date back to 1973 and the current eruption period began in October 2022. Recent activity has consisted of small ash plumes and fumarolic activity (BGVN 48:07). This report covers activity during May through August 2023, using information from monthly reports of the Japan Meteorological Agency (JMA) monthly reports and satellite data.
Activity during May through June was relatively low. The Japan Coast Guard (JCG) did overflights on 14 and 22 June and reported white gas-and-steam emissions rising 600 m and 1,200 m from the central crater of the pyroclastic cone, respectively (figure 125). In addition, multiple white gas-and-steam emissions rose from the inner rim of the W side of the crater and from the SE flank of the pyroclastic cone. Discolored brown-to-green water was observed around almost the entire perimeter of the island; on 22 June light green discolored water was observed off the S coast of the island.
Observations from the Himawari meteorological satellite confirmed an eruption on 9 and 10 July. An eruption plume rose 1.6 km above the crater and drifted N around 1300 on 9 July. Satellite images acquired at 1420 and 2020 on 9 July and at 0220 on 10 July showed continuing emissions that rose 1.3-1.6 km above the crater and drifted NE and N. The Tokyo VAAC reported that an ash plume seen by a pilot and identified in a satellite image at 0630 on 21 July rose to 3 km altitude and drifted S.
Aerial observations conducted by JCG on 8 August showed a white-and-gray plume rising from the central crater of the pyroclastic cone, and multiple white gas-and-steam emissions were rising from the inner edge of the western crater and along the NW-SE flanks of the island (figure 126). Brown-to-green discolored water was also noted around the perimeter of the island.
Intermittent low-to-moderate power thermal anomalies were recorded in the MIROVA graph (Middle InfraRed Observation of Volcanic Activity), showing an increase in both frequency and power beginning in July (figure 127). This increase in activity coincides with eruptive activity on 9 and 10 July, characterized by eruption plumes. According to the MODVOLC thermal alert algorithm, one thermal hotspot was recorded on 20 July. Weak thermal anomalies were also detected in infrared satellite imagery, accompanied by strong gas-and-steam plumes (figure 128).
Geologic Background. The small island of Nishinoshima was enlarged when several new islands coalesced during an eruption in 1973-74. Multiple eruptions that began in 2013 completely covered the previous exposed surface and continued to enlarge the island. The island is the summit of a massive submarine volcano that has prominent peaks to the S, W, and NE. The summit of the southern cone rises to within 214 m of the ocean surface 9 km SSE.
Information Contacts: Japan Meteorological Agency (JMA), 1-3-4 Otemachi, Chiyoda-ku, Tokyo 100-8122, Japan (URL: http://www.jma.go.jp/jma/indexe.html); Tokyo Volcanic Ash Advisory Center (VAAC), 1-3-4 Otemachi, Chiyoda-ku, Tokyo 100-8122, Japan (URL: http://ds.data.jma.go.jp/svd/vaac/data/); MIROVA (Middle InfraRed Observation of Volcanic Activity), a collaborative project between the Universities of Turin and Florence (Italy) supported by the Centre for Volcanic Risk of the Italian Civil Protection Department (URL: http://www.mirovaweb.it/); Copernicus Browser, Copernicus Data Space Ecosystem, European Space Agency (URL: https://dataspace.copernicus.eu/browser/).
Krakatau (Indonesia) — October 2023 Cite this Report
Krakatau
Indonesia
6.1009°S, 105.4233°E; summit elev. 285 m
All times are local (unless otherwise noted)
White gas-and-steam plumes and occasional ash plumes during May-August 2023
Krakatau is located in the Sunda Strait between Java and Sumatra, Indonesia. Caldera collapse during the catastrophic 1883 eruption destroyed Danan and Perbuwatan cones and left only a remnant of Rakata. The post-collapse cone of Anak Krakatau (Child of Krakatau) was constructed within the 1883 caldera at a point between the former Danan and Perbuwatan cones; it has been the site of frequent eruptions since 1927. The current eruption period began in May 2021 and has recently consisted of Strombolian eruptions and ash plumes (BGVN 48:07). This report describes lower levels of activity consisting of ash and white gas-and-steam plumes during May through August 2023, based on information provided by the Indonesian Center for Volcanology and Geological Hazard Mitigation, referred to as Pusat Vulkanologi dan Mitigasi Bencana Geologi (PVMBG), MAGMA Indonesia, and satellite data.
Activity was relatively low during May and June. Daily white gas-and-steam emissions rose 25-200 m above the crater and drifted in different directions. Five ash plumes were detected at 0519 on 10 May, 1241 on 11 May, 0920 on 12 May, 2320 on 12 May, and at 0710 on 13 May, and rose 1-2.5 km above the crater and drifted SW. A webcam image taken on 12 May showed ejection of incandescent material above the vent. A total of nine ash plumes were detected during 6-11 June: at 1434 and 00220 on 6 and 7 June the ash plumes rose 500 m above the crater and drifted NW, at 1537 on 8 June the ash plume rose 1 km above the crater and drifted SW, at 0746 and at 0846 on 9 June the ash plumes rose 800 m and 3 km above the crater and drifted SW, respectively, at 0423, 1431, and 1750 on 10 June the ash plumes rose 2 km, 1.5 km, and 3.5 km above the crater and drifted NW, respectively, and at 0030 on 11 June an ash plume rose 2 km above the crater and drifted NW. Webcam images taken on 10 and 11 June at 0455 and 0102, respectively, showed incandescent material ejected above the vent. On 19 June an ash plume at 0822 rose 1.5 km above the crater and drifted SE.
Similar low activity of white gas-and-steam emissions and few ash plumes were reported during July and August. Daily white gas-and-steam emissions rose 25-300 m above the crater and drifted in multiple directions. Three ash plumes were reported at 0843, 0851, and 0852 on 20 July that rose 500-2,000 m above the crater and drifted NW.
The MIROVA (Middle InfraRed Observation of Volcanic Activity) graph of MODIS thermal anomaly data showed intermittent low-to-moderate power thermal anomalies during May through August 2023 (figure 140). Although activity was often obscured by weather clouds, a thermal anomaly was visible in an infrared satellite image of the crater on 12 May, accompanied by an eruption plume that drifted SW (figure 141).
Geologic Background. The renowned Krakatau (frequently mis-named as Krakatoa) volcano lies in the Sunda Strait between Java and Sumatra. Collapse of an older edifice, perhaps in 416 or 535 CE, formed a 7-km-wide caldera. Remnants of that volcano are preserved in Verlaten and Lang Islands; subsequently the Rakata, Danan, and Perbuwatan cones were formed, coalescing to create the pre-1883 Krakatau Island. Caldera collapse during the catastrophic 1883 eruption destroyed Danan and Perbuwatan, and left only a remnant of Rakata. This eruption caused more than 36,000 fatalities, most as a result of tsunamis that swept the adjacent coastlines of Sumatra and Java. Pyroclastic surges traveled 40 km across the Sunda Strait and reached the Sumatra coast. After a quiescence of less than a half century, the post-collapse cone of Anak Krakatau (Child of Krakatau) was constructed within the 1883 caldera at a point between the former Danan and Perbuwatan cones. Anak Krakatau has been the site of frequent eruptions since 1927.
Information Contacts: Pusat Vulkanologi dan Mitigasi Bencana Geologi (PVMBG, also known as Indonesian Center for Volcanology and Geological Hazard Mitigation, CVGHM), Jalan Diponegoro 57, Bandung 40122, Indonesia (URL: http://www.vsi.esdm.go.id/); MAGMA Indonesia, Kementerian Energi dan Sumber Daya Mineral (URL: https://magma.esdm.go.id/v1); MIROVA (Middle InfraRed Observation of Volcanic Activity), a collaborative project between the Universities of Turin and Florence (Italy) supported by the Centre for Volcanic Risk of the Italian Civil Protection Department (URL: http://www.mirovaweb.it/); Copernicus Browser, Copernicus Data Space Ecosystem, European Space Agency (URL: https://dataspace.copernicus.eu/browser/).
Villarrica (Chile) — October 2023 Cite this Report
Villarrica
Chile
39.42°S, 71.93°W; summit elev. 2847 m
All times are local (unless otherwise noted)
Strombolian activity, gas-and-ash emissions, and crater incandescence during April-September 2023
Villarrica, in central Chile, consists of a 2-km-wide caldera that formed about 3,500 years ago and is located at the base of the presently active cone at the NW margin of a 6-km-wide caldera. Historical eruptions eruptions date back to 1558 and have been characterized by mild-to-moderate explosive activity with occasional lava effusions. The current eruption period began in December 2014 and has recently consisted of nighttime crater incandescence, ash emissions, and seismicity (BGVN 48:04). This report covers activity during April through September 2023 and describes occasional Strombolian activity, gas-and-ash emissions, and nighttime crater incandescence. Information for this report primarily comes from the Southern Andes Volcano Observatory (Observatorio Volcanológico de Los Andes del Sur, OVDAS), part of Chile's National Service of Geology and Mining (Servicio Nacional de Geología y Minería, SERNAGEOMIN) and satellite data.
Seismicity during April consisted of long period (LP) events and tremor (TRE); a total of 9,413 LP-type events and 759 TR-type events were detected throughout the month. Nighttime crater incandescence persisted and was visible in the degassing column. Sulfur dioxide data was obtained using Differential Absorption Optical Spectroscopy Equipment (DOAS) that showed an average value of 1,450 ± 198 tons per day (t/d) during 1-15 April and 1,129 ± 201 t/d during 16-30 April, with a maximum daily value of 2,784 t/d on 9 April. Gas-and-steam emissions of variable intensities rose above the active crater as high as 1.3 km above the crater on 13 April. Strombolian explosions were not observed and there was a slight decrease in the lava lake level.
There were 14,123 LP-type events and 727 TR-type events detected during May. According to sulfur dioxide measurements taken with DOAS equipment, the active crater emitted an average value of 1,826 ± 482 t/d during 1-15 May and 912 ± 41 t/d during 16-30 May, with a daily maximum value of 5,155 t/d on 13 May. Surveillance cameras showed continuous white gas-and-steam emissions that rose as high as 430 m above the crater on 27 May. Nighttime incandescence illuminated the gas column less than 300 m above the crater rim was and no pyroclastic emissions were reported. A landslide was identified on 13 May on the E flank of the volcano 50 m from the crater rim and extending 300 m away; SERNAGEOMIN noted that this event may have occurred on 12 May. During the morning of 27 and 28 May minor Strombolian explosions characterized by incandescent ejecta were recorded at the crater rim; the last reported Strombolian explosions had occurred at the end of March.
Seismic activity during June consisted of five volcano-tectonic (VT)-type events, 21,606 LP-type events, and 2,085 TR-type events. The average value of sulfur dioxide flux obtained by DOAS equipment was 1,420 ± 217 t/d during 1-15 June and 2,562 ± 804 t/d, with a maximum daily value of 4,810 t/d on 17 June. White gas-and-steam emissions rose less than 480 m above the crater; frequent nighttime crater incandescence was reflected in the degassing plume. On 12 June an emission rose 100 m above the crater and drifted NNW. On 15 June one or several emissions resulted in ashfall to the NE as far as 5.5 km from the crater, based on a Skysat satellite image. Several Strombolian explosions occurred within the crater; activity on 15 June was higher energy and ejected blocks 200-300 m on the NE slope. Surveillance cameras showed white gas-and-steam emissions rising 480 m above the crater on 16 June. On 19 and 24 June low-intensity Strombolian activity was observed, ejecting material as far as 200 m from the center of the crater to the E.
During July, seismicity included 29,319 LP-type events, 3,736 TR-type events, and two VT-type events. DOAS equipment recorded two days of sulfur dioxide emissions of 4,220 t/d and 1,009 t/d on 1 and 13 July, respectively. Constant nighttime incandescence was also recorded and was particularly noticeable when accompanied by eruptive columns on 12 and 16 July. Minor explosive events were detected in the crater. According to Skysat satellite images taken on 12, 13, and 16 July, ashfall deposits were identified 155 m S of the crater. According to POVI, incandescence was visible from two vents on the crater floor around 0336 on 12 July. Gas-and-ash emissions rose as high as 1.2 km above the crater on 13 July and drifted E and NW. A series of gas-and-steam pulses containing some ash deposited material on the upper E flank around 1551 on 13 July. During 16-31 July, average sulfur dioxide emissions of 1,679 ± 406 t/d were recorded, with a maximum daily value of 2,343 t/d on 28 July. Fine ash emissions were also reported on 16, 17, and 23 July.
Seismicity persisted during August, characterized by 27,011 LP-type events, 3,323 TR-type events, and three VT-type events. The average value of sulfur dioxide measurements taken during 1-15 August was 1,642 ± 270 t/d and 2,207 ± 4,549 t/d during 16-31 August, with a maximum daily value of 3,294 t/d on 27 August. Nighttime crater incandescence remained visible in degassing columns. White gas-and-steam emissions rose 480 m above the crater on 6 August. According to a Skysat satellite image from 6 August, ash accumulation was observed proximal to the crater and was mainly distributed toward the E slope. White gas-and-steam emissions rose 320 m above the crater on 26 August. Nighttime incandescence and Strombolian activity that generated ash emissions were reported on 27 August.
Seismicity during September was characterized by five VT-type events, 12,057 LP-type events, and 2,058 TR-type events. Nighttime incandescence persisted. On 2 September an ash emission rose 180 m above the crater and drifted SE at 1643 (figure 125) and a white gas-and-steam plume rose 320 m above the crater. According to the Buenos Aires VAAC, periods of continuous gas-and-ash emissions were visible in webcam images from 1830 on 2 September to 0110 on 3 September. Strombolian activity was observed on 2 September and during the early morning of 3 September, the latter event of which generated an ash emission that rose 60 m above the crater and drifted 100 m from the center of the crater to the NE and SW. Ashfall was reported to the SE and S as far as 750 m from the crater. The lava lake was active during 3-4 September and lava fountaining was visible for the first time since 26 March 2023, according to POVI. Fountains captured in webcam images at 2133 on 3 September and at 0054 on 4 September rose as high as 60 m above the crater rim and ejected material onto the upper W flank. Sulfur dioxide flux of 1,730 t/d and 1,281 t/d was measured on 3 and 4 September, respectively, according to data obtained by DOAS equipment.
Strong Strombolian activity and larger gas-and-ash plumes were reported during 18-20 September. On 18 September activity was also associated with energetic LP-type events and notable sulfur dioxide fluxes (as high as 4,277 t/d). On 19 September Strombolian activity and incandescence were observed. On 20 September at 0914 ash emissions rose 50 m above the crater and drifted SSE, accompanied by Strombolian activity that ejected material less than 100 m SSE, causing fall deposits on that respective flank. SERNAGEOMIN reported that a Planet Scope satellite image taken on 20 September showed the lava lake in the crater, measuring 32 m x 35 m and an area of 0.001 km2. Several ash emissions were recorded at 0841, 0910, 1251, 1306, 1312, 1315, and 1324 on 23 September and rose less than 150 m above the crater. The sulfur dioxide flux value was 698 t/d on 23 September and 1,097 t/d on 24 September. On 24 September the Volcanic Alert Level (VAL) was raised to Orange (the third level on a four-color scale). SENAPRED maintained the Alert Level at Yellow (the middle level on a three-color scale) for the communities of Villarrica, Pucón (16 km N), Curarrehue, and Panguipulli.
During 24-25 September there was an increase in seismic energy (observed at TR-events) and acoustic signals, characterized by 1 VT-type event, 213 LP-type events, and 124 TR-type events. Mainly white gas-and-steam emissions, in addition to occasional fine ash emissions were recorded. During the early morning of 25 September Strombolian explosions were reported and ejected material 250 m in all directions, though dominantly toward the NW. On 25 September the average value of sulfur dioxide flux was 760 t/d. Seismicity during 25-30 September consisted of five VT-type events, 1,937 LP-type events, and 456 TR-type events.
During 25-29 September moderate Strombolian activity was observed and ejected material as far as the crater rim. In addition, ash pulses lasting roughly 50 minutes were observed around 0700 and dispersed ENE. During 26-27 September a TR episode lasted 6.5 hours and was accompanied by discrete acoustic signals. Satellite images from 26 September showed a spatter cone on the crater floor with one vent that measured 10 x 14 m and a smaller vent about 35 m NE of the cone. SERNAGEOMIN reported an abundant number of bomb-sized blocks up to 150 m from the crater, as well as impact marks on the snow, which indicated explosive activity. A low-altitude ash emission was observed drifting NW around 1140 on 28 September, based on webcam images. Between 0620 and 0850 on 29 September an ash emission rose 60 m above the crater and drifted NW. During an overflight taken around 1000 on 29 September scientists observed molten material in the vent, a large accumulation of pyroclasts inside the crater, and energetic degassing, some of which contained a small amount of ash. Block-sized pyroclasts were deposited on the internal walls and near the crater, and a distal ash deposit was also visible. The average sulfur dioxide flux measured on 28 September was 344 t/d. Satellite images taken on 29 September ashfall was deposited roughly 3 km WNW from the crater and nighttime crater incandescence remained visible. The average sulfur dioxide flux value from 29 September was 199 t/d. On 30 September at 0740 a pulsating ash emission rose 1.1 km above the crater and drifted NNW (figure 126). Deposits on the S flank extended as far as 4.5 km from the crater rim, based on satellite images from 30 September.
Infrared MODIS satellite data processed by MIROVA (Middle InfraRed Observation of Volcanic Activity) showed intermittent thermal activity during April through September, with slightly stronger activity detected during late September (figure 127). Small clusters of thermal activity were detected during mid-June, early July, early August, and late September. According to the MODVOLC thermal alert system, a total of four thermal hotspots were detected on 7 July and 3 and 23 September. This activity was also intermittently captured in infrared satellite imagery on clear weather days (figure 128).
Geologic Background. The glacier-covered Villarrica stratovolcano, in the northern Lakes District of central Chile, is ~15 km south of the city of Pucon. A 2-km-wide caldera that formed about 3,500 years ago is located at the base of the presently active, dominantly basaltic to basaltic andesite cone at the NW margin of a 6-km-wide Pleistocene caldera. More than 30 scoria cones and fissure vents are present on the flanks. Plinian eruptions and pyroclastic flows that have extended up to 20 km from the volcano were produced during the Holocene. Lava flows up to 18 km long have issued from summit and flank vents. Eruptions documented since 1558 CE have consisted largely of mild-to-moderate explosive activity with occasional lava effusion. Glaciers cover 40 km2 of the volcano, and lahars have damaged towns on its flanks.
Information Contacts: Servicio Nacional de Geología y Minería (SERNAGEOMIN), Observatorio Volcanológico de Los Andes del Sur (OVDAS), Avda Sta María No. 0104, Santiago, Chile (URL: http://www.sernageomin.cl/); Proyecto Observación Villarrica Internet (POVI) (URL: http://www.povi.cl/); Sistema y Servicio Nacional de Prevención y Repuesta Ante Desastres (SENAPRED), Av. Beauchef 1671, Santiago, Chile (URL: https://web.senapred.cl/); Buenos Aires Volcanic Ash Advisory Center (VAAC), Servicio Meteorológico Nacional-Fuerza Aérea Argentina, 25 de mayo 658, Buenos Aires, Argentina (URL: http://www.smn.gov.ar/vaac/buenosaires/inicio.php); MIROVA (Middle InfraRed Observation of Volcanic Activity), a collaborative project between the Universities of Turin and Florence (Italy) supported by the Centre for Volcanic Risk of the Italian Civil Protection Department (URL: http://www.mirovaweb.it/); Hawai'i Institute of Geophysics and Planetology (HIGP) - MODVOLC Thermal Alerts System, School of Ocean and Earth Science and Technology (SOEST), Univ. of Hawai'i, 2525 Correa Road, Honolulu, HI 96822, USA (URL: http://modis.higp.hawaii.edu/); Copernicus Browser, Copernicus Data Space Ecosystem, European Space Agency (URL: https://dataspace.copernicus.eu/browser/).
Merapi (Indonesia) — October 2023 Cite this Report
Merapi
Indonesia
7.54°S, 110.446°E; summit elev. 2910 m
All times are local (unless otherwise noted)
Frequent incandescent avalanches during April-September 2023
Merapi, located just north of the major city of Yogyakarta in central Java, Indonesia, has had activity within the last 20 years characterized by pyroclastic flows and lahars accompanying growth and collapse of the steep-sided active summit lava dome. The current eruption period began in late December 2020 and has more recently consisted of ash plumes, intermittent incandescent avalanches of material, and pyroclastic flows (BGVN 48:04). This report covers activity during April through September 2023, based on information from Balai Penyelidikan dan Pengembangan Teknologi Kebencanaan Geologi (BPPTKG), the Center for Research and Development of Geological Disaster Technology, a branch of PVMBG which specifically monitors Merapi. Additional information comes from the Pusat Vulkanologi dan Mitigasi Bencana Geologi (PVMBG, also known as Indonesian Center for Volcanology and Geological Hazard Mitigation, CVGHM), MAGMA Indonesia, the Darwin Volcanic Ash Advisory Centre (VAAC), and various satellite data.
Activity during April through September 2023 primarily consisted of incandescent avalanches of material that mainly affected the SW and W flanks and traveled as far as 2.3 km from the summit (table 25) and white gas-and-steam emissions that rose 10-1,000 m above the crater.
Table 25. Monthly summary of avalanches and avalanche distances recorded at Merapi during April through September 2023. The number of reported avalanches does not include instances where possible avalanches were heard but could not be visually confirmed as a result of inclement weather. Data courtesy of BPPTKG (April-September 2023 daily reports).
| Month |
Average number of avalanches per day |
Distance avalanches traveled (m) |
| Apr 2023 |
19 |
1,200-2,000 |
| May 2023 |
22 |
500-2,000 |
| Jun 2023 |
18 |
1,200-2,000 |
| Jul 2023 |
30 |
300-2,000 |
| Aug 2023 |
25 |
400-2,300 |
| Sep 2023 |
23 |
600-2,000 |
BPPTKG reported that during April and May white gas-and-steam emissions rose 10-750 m above the crater, incandescent avalanches descended 500-2,000 m on the SW and W flanks (figure 135). Cloudy weather often prevented clear views of the summit, and sometimes avalanches could not be confirmed. According to a webcam image, a pyroclastic flow was visible on 17 April at 0531. During the week of 28 April and 4 May a pyroclastic flow was reported on the SW flank, traveling up to 2.5 km. According to a drone overflight taken on 17 May the SW lava dome volume was an estimated 2,372,800 cubic meters and the dome in the main crater was an estimated 2,337,300 cubic meters.
During June and July similar activity persisted with white gas-and-steam emissions rising 10-350 m above the crater and frequent incandescent avalanches that traveled 300-2,000 m down the SW, W, and S flanks (figure 136). Based on an analysis of aerial photos taken on 24 June the volume of the SW lava dome was approximately 2.5 million cubic meters. A pyroclastic flow was observed on 5 July that traveled 2.7 km on the SW flank. According to the Darwin VAAC multiple minor ash plumes were identified in satellite images on 19 July that rose to 3.7 km altitude and drifted S and SW. During 22, 25, and 26 July a total of 17 avalanches descended as far as 1.8 km on the S flank.
Frequent white gas-and-steam emissions continued during August and September, rising 10-450 m above the crater. Incandescent avalanches mainly affected the SW and W flanks and traveled 400-2,300 m from the vent (figure 137). An aerial survey conducted on 10 August was analyzed and reported that estimates of the SW dome volume was 2,764,300 cubic meters and the dome in the main crater was 2,369,800 cubic meters.
Frequent and moderate-power thermal activity continued throughout the reporting period, according to a MIROVA (Middle InfraRed Observation of Volcanic Activity) analysis of MODIS satellite data (figure 138). There was an increase in the number of detected anomalies during mid-May. The MODVOLC thermal algorithm recorded a total of 47 thermal hotspots: six during April, nine during May, eight during June, 15 during July, four during August, and five during September. Some of this activity was captured in infrared satellite imagery on clear weather days, sometimes accompanied by incandescent material on the SW flank (figure 139).
Geologic Background. Merapi, one of Indonesia's most active volcanoes, lies in one of the world's most densely populated areas and dominates the landscape immediately north of the major city of Yogyakarta. It is the youngest and southernmost of a volcanic chain extending NNW to Ungaran volcano. Growth of Old Merapi during the Pleistocene ended with major edifice collapse perhaps about 2,000 years ago, leaving a large arcuate scarp cutting the eroded older Batulawang volcano. Subsequent growth of the steep-sided Young Merapi edifice, its upper part unvegetated due to frequent activity, began SW of the earlier collapse scarp. Pyroclastic flows and lahars accompanying growth and collapse of the steep-sided active summit lava dome have devastated cultivated lands on the western-to-southern flanks and caused many fatalities.
Information Contacts: Balai Penyelidikan dan Pengembangan Teknologi Kebencanaan Geologi (BPPTKG), Center for Research and Development of Geological Disaster Technology (URL: http://merapi.bgl.esdm.go.id/, Twitter: @BPPTKG); MAGMA Indonesia, Kementerian Energi dan Sumber Daya Mineral (URL: https://magma.esdm.go.id/v1); Pusat Vulkanologi dan Mitigasi Bencana Geologi (PVMBG, also known as Indonesian Center for Volcanology and Geological Hazard Mitigation, CVGHM), Jalan Diponegoro 57, Bandung 40122, Indonesia (URL: http://www.vsi.esdm.go.id/); Darwin Volcanic Ash Advisory Centre (VAAC), Bureau of Meteorology, Northern Territory Regional Office, PO Box 40050, Casuarina, NT 0811, Australia (URL: http://www.bom.gov.au/info/vaac/); MIROVA (Middle InfraRed Observation of Volcanic Activity), a collaborative project between the Universities of Turin and Florence (Italy) supported by the Centre for Volcanic Risk of the Italian Civil Protection Department (URL: http://www.mirovaweb.it/); Hawai'i Institute of Geophysics and Planetology (HIGP) - MODVOLC Thermal Alerts System, School of Ocean and Earth Science and Technology (SOEST), Univ. of Hawai'i, 2525 Correa Road, Honolulu, HI 96822, USA (URL: http://modis.higp.hawaii.edu/); Copernicus Browser, Copernicus Data Space Ecosystem, European Space Agency (URL: https://dataspace.copernicus.eu/browser/); Øystein Lund Andersen (URL: https://www.oysteinlundandersen.com/, https://twitter.com/oysteinvolcano).
Ebeko
Russia
50.686°N, 156.014°E; summit elev. 1103 m
All times are local (unless otherwise noted)
Moderate explosive activity with ash plumes continued during June-November 2023
Ebeko, located on the N end of Paramushir Island in Russia’s Kuril Islands just S of the Kamchatka Peninsula, consists of three summit craters along a SSW-NNE line at the northern end of a complex of five volcanic cones. Observed eruptions date back to the late 18th century and have been characterized as small-to-moderate explosions from the summit crater, accompanied by intense fumarolic activity. The current eruptive period began in June 2022, consisting of frequent explosions, ash plumes, and thermal activity (BGVN 47:10, 48:06). This report covers similar activity during June-November 2023, based on information from the Kamchatka Volcanic Eruptions Response Team (KVERT) and satellite data.
Moderate explosive activity continued during June-November 2023 (figures 50 and 51). According to visual data from Severo-Kurilsk, explosions sent ash 2-3.5 km above the summit (3-4.5 km altitude) during most days during June through mid-September. Activity after mid-September was slightly weaker, with ash usually reaching less than 2 km above the summit. According to KVERT the volcano in October and November was, with a few exceptions, either quiet or obscured by clouds that prevented satellite observations. KVERT issued Volcano Observatory Notices for Aviation (VONA) on 8 and 12 June, 13 and 22 July, 3 and 21 August, and 31 October warning of potential aviation hazards from ash plumes drifting 3-15 km from the volcano. Based on satellite data, KVERT reported a persistent thermal anomaly whenever weather clouds permitted viewing.
Geologic Background. The flat-topped summit of the central cone of Ebeko volcano, one of the most active in the Kuril Islands, occupies the northern end of Paramushir Island. Three summit craters located along a SSW-NNE line form Ebeko volcano proper, at the northern end of a complex of five volcanic cones. Blocky lava flows extend west from Ebeko and SE from the neighboring Nezametnyi cone. The eastern part of the southern crater contains strong solfataras and a large boiling spring. The central crater is filled by a lake about 20 m deep whose shores are lined with steaming solfataras; the northern crater lies across a narrow, low barrier from the central crater and contains a small, cold crescentic lake. Historical activity, recorded since the late-18th century, has been restricted to small-to-moderate explosive eruptions from the summit craters. Intense fumarolic activity occurs in the summit craters, on the outer flanks of the cone, and in lateral explosion craters.
Information Contacts: Kamchatka Volcanic Eruptions Response Team (KVERT), Far Eastern Branch, Russian Academy of Sciences, 9 Piip Blvd., Petropavlovsk-Kamchatsky, 683006, Russia (URL: http://www.kscnet.ru/ivs/kvert/).
Search Bulletin Archive by Publication Date
Select a month and year from the drop-downs and click "Show Issue" to have that issue displayed in this tab.
The default month and year is the latest issue available.
Bulletin of the Global Volcanism Network - Volume 36, Number 04 (April 2011)
Managing Editor: Richard Wunderman
Arenal (Costa Rica)
Activity and seismicity decrease; new analysis of acid-rain
Endeavour Segment (Canada)
Acoustic imaging of ongoing hydrothermal venting
Eyjafjallajokull (Iceland)
Eruption ended in late June 2010; sample of growing literature on the eruption
Irazu (Costa Rica)
Crater lake dries and regional acid-rain report
Machin (Colombia)
Seismic and non-eruptive unrest detected in 2004, 2008, 2009, and again in 2010
Poas (Costa Rica)
Photos of phreatic eruptions from acid lake; surrounding vegetation damaged by gases
Ranau (Indonesia)
Fish kill in April 2011 strikes hot-spring areas of intra-caldera lake
Rincon de la Vieja (Costa Rica)
Fumarolically active but non-eruptive through January 2011
Sheveluch (Russia)
Ongoing dome growth into early 2011; and pyroclastic flows of 27 October 2010
Arenal (Costa Rica) — April 2011 Cite this Report
Arenal
Costa Rica
10.463°N, 84.703°W; summit elev. 1670 m
All times are local (unless otherwise noted)
Activity and seismicity decrease; new analysis of acid-rain
Our previous report about Arenal discussed ongoing sporadic eruptive behavior, preliminary information about the 24 May 2010 dome collapse, and the higher frequency of rockfalls through September 2010 (BGVN 35:07). Since October 2010, volcanic activity at Arenal appears to be decreasing. Events like the explosion on 24 July 2010, discussed below (see figure 110) have become rare. Reports from Costa Rica's Volcanological and Seismological Observatory and National University (OVSICORI-UNA) include direct observations of summit activity, seismic analysis, and acid-rain data and provide the basis for this report covering the 24 May, 2010 event in addition to activity from October 2010 to May 2011.
Incandescent avalanche of 24 May 2010. Sudden activity down Arenal's SW flank on 24 May 2010 produced long, incandescent avalanches and pyroclastic flows, forcing the National Park to evacuate visitors on this day. No injuries or damage to infrastructure had been reported during Arenal's activity in May 2010. Previous pyroclastic events had also caused evacuations in June 2009, June 2008, and September 2007.
Beginning at noon on 24 May, incandescent avalanches descended from the summit dome. They affected a sector that has been subject to avalanches in the last 3 years (see figure 111). A field investigation by OVSICORI on 31 May found that material fell from the summit down to 1,200 m elevation and accumulating in a toe 400 m x 80 m. The majority of blocks surpassed 2 m in diameter. Deposits from the dome collapse were still hot when they arrived at the forest that borders Río Agua Caliente. The OVSICORI-UNA field report of 31 May 2010 contains photos and additional details. Several sections of the river scarp show signs of being struck and eroded by direct impact of the incandescent blocks that arrived with high speed. The dome that supplied the block-and-ash flows became visibly deflated but activity culminated through the week with the formation of a new dome toward the E side of the summit. The formation and destruction of domes at the top of Crater C is very common. These domes reach ten's of meters in size and frequently collapse violently, especially when they are destabilized at the crater rim.
Decreasing activity. The number of explosive events peaked in February 2010, became regular up to October, but since mid-October they have become sporadic. No lava flows or night-time incandescence was observed on the flanks. Gas emission continued at the active Crater C and fumarolic activity was continuous at Crater D, the pre-1968 summit crater.
Acid-rain affected Arenal's flanks and the NE, E, and SE flanks showed a loss of vegetation. These conditions plus the high amounts of rainfall aggravated erosion on the steep slopes; rockfalls and landslides continued to occur in these valleys: Calle de Arenas, Manolo, Guillermina, and Río Agua Caliente. OVSICORI-UNA released a report on acid-rain measurements that began on 9 April 2003 and ended on 30 November 2010; data from four stations showed generally decreasing acidity with time (figure 112). The trend steadily increased from pH ~4 to ~4.5 for all stations. Although irregular spikes are recorded, the low outliers were generally less acidic with time.
Waldo Taylor assessed seismic data from the local network. The 2010 mid-year ICE report discussed seismicity and the general trend shown in table 26. The large spike in seismic events from 2009 dropped off abruptly the following year.
Table 26. Earthquakes counted at Arenal during 2005-2010. Courtesy of ICE.
| Year |
Number of earthquakes |
| 2005 |
3 |
| 2006 |
12 |
| 2007 |
15 |
| 2008 |
47 |
| 2009 |
239 |
| 2010 |
56 |
Gerardo J. Soto discussed Arenal seismicity. "In general terms, the average magnitude increased from 2.0 in 2006 to 2.3 in 2010. The biggest was M 4.1 in 1 November 2009. Mean [focal] depth deepened from 5.5 km in 2006 to about 2 km in 2010. Most of them were between 2 and 5 km deep in 2009-2010, and down to 9 km deep in 2010.
"The number of [respective] earthquakes from September through December 2010 decreased monthly [in the sequence] 24, 12, 9, 3. Epicenters shifted from SE to NW quadrangle of the volcano through time.
"We preliminarily interpret this as a possible withdrawal of magma below the volcano, [on the basis of] focal mechanisms."
Secondary hazards. With Arenal's decrease in explosive activity, no ash collection has been possible this year (2011). A network of seven stations exists for regular sampling. The most effusive event occurred in 1968 when roughly 2 x 10⁵ metric tons of ash fell on the flanks. Later, a hydroelectric project was completed in the 1970s and filled the basin below the volcano with 2.416 x 10⁶ m3 of water (the maximum storage capacity), forming Lake Arenal. From 1992 to 1997, the annual sediment load into the lake contained 1.4% remobilized material from Arenal.
Future activity at Arenal within the next 100 years may include large eruptions with the potential to produce 10 million metric tons of volcanic sediments; within the next 200 years an extreme event could contribute 107 metric tons of volcaniclastics to Lake Arenal (Soto, 1998). The distribution of volcaniclastic sediments is largely controlled by the Río Agua Caliente, a drainage connecting tributaries from Arenal's southern flank. Roughly every 2-5 years there are relatively large debris flows along this river. As recently as the first week of May 2011, intense flooding damaged a bridge by severely undermining the concrete abutments (G.J. Soto, personal communication).
Satellite thermal alerts. Since 15 September 2010 there have been no MODVOLC satellite thermal alerts through February 2011.
References. Soto, G.J., 1998, Cálculo de ceniza eyectada por el Volcán Arenal y ceniza caída en el embalse durante el período 1992-1997; Informe OSV.98.05.ICE, 18 pp. (in Spanish)
OVSICORI-UNA, 2010, Cambios Morfológicos y Avalanchas Incandescentes del 24 de Mayo en el Volcán Arenal. (in Spanish) (URL: http://www.ovsicori.una.ac.cr/vulcanologia/informeDeCampo/2010/InfcampAremayo10.pdf)
Geologic Background. Conical Volcán Arenal is the youngest stratovolcano in Costa Rica and one of its most active. The 1670-m-high andesitic volcano towers above the eastern shores of Lake Arenal, which has been enlarged by a hydroelectric project. Arenal lies along a volcanic chain that has migrated to the NW from the late-Pleistocene Los Perdidos lava domes through the Pleistocene-to-Holocene Chato volcano, which contains a 500-m-wide, lake-filled summit crater. The earliest known eruptions of Arenal took place about 7000 years ago, and it was active concurrently with Cerro Chato until the activity of Chato ended about 3500 years ago. Growth of Arenal has been characterized by periodic major explosive eruptions at several-hundred-year intervals and periods of lava effusion that armor the cone. An eruptive period that began with a major explosive eruption in 1968 ended in December 2010; continuous explosive activity accompanied by slow lava effusion and the occasional emission of pyroclastic flows characterized the eruption from vents at the summit and on the upper western flank.
Information Contacts: Phil Slosberg and Eliecer Duarte, Observatorio Vulcanologico Sismologica de Costa Rica-Universidad Nacional (OVSICORI-UNA), Apartado 86-3000, Heredia, Costa Rica (URL: http://www.ovsicori.una.ac.cr/); Gerardo J. Soto, Instituto Costarricense de Electricidad (ICE), Apartado 10032-1000, San José, Costa Rica; Waldo Taylor, Sismológico y Vulcanológico de Arenal y Miravalles (OSIVAM), Oficina de Sismología y Vulcanología (OSV), Instituto Costarricense de Electricidad (ICE), Apartado 10032-1000, San José, Costa Rica.
Endeavour Segment (Canada) — April 2011 Cite this Report
Endeavour Segment
Canada
47.95°N, 129.1°W; summit elev. -2050 m
All times are local (unless otherwise noted)
Acoustic imaging of ongoing hydrothermal venting
The Grotto vent cluster contains an assemblage of black smoker vents that lie within the Main Endeavour Field on the northern Juan de Fuca ridge (Bemis, 2001; Rona and others, 2001, 2010a; Bobbitt, 2007) (figure 4). New imagery of submarine plume behavior and properties was achieved with a new acoustic system that extends underwater observational distances beyond those of light to image buoyant plumes of submarine black smokers in 3-dimensions and image areas of diffuse flow seeping from the sea floor in 2-dimensions (Rona, 2011; Rona and others, 2010a, 2010b, and 2011).
The Cabled Observatory Vent Imaging Sonar (COVIS) was installed in September 2010 (Light, 2011). Operations were initiated with in situ sensors in the NEPTUNE (North-East Pacific Time-Series Underwater Networked Experiments) Canada Program cabled observatory on the Main Endeavour Field (MEF) of the Juan de Fuca Ridge, nearly 370 km (200 nautical miles) off British Columbia, Canada, in the NE Pacific Ocean (figures 5 and 6). NEPTUNE is a Canadian research facility designed for regional-scale underwater ocean investigations focusing on continuous monitoring of temperature, chemistry, biodiversity, and motion. This data will be broadcast via the Internet for scientists, students, educators and the public to collaborate and promote investigations into: underwater volcanic processes; earthquakes and tsunamis; minerals, metals, and hydrocarbons; ocean-atmosphere interactions; climate change; greenhouse gas cycling in the ocean; marine ecosystems; long-term changes in ocean productivity; marine mammals; fish stocks; pollution and toxic blooms. The public can gain a more in-depth understanding of the seafloor, while ocean scientists can run deep-water experiments from labs and universities anywhere around the world.
During a research cruise in September-October 2010, scientists from the University of Washington and Rutgers University connected COVIS to the NEPTUNE Canada cable system for the first time and initiated data acquisition on 29 September 2010. COVIS, equipped with a customized multibeam sonar, 400/200 kHz projectors, and a rotator system to orient acoustic transducers, was positioned to acquire acoustic data from a fixed site on the floor of the ridge's axial valley at a range of tens of meters from the Grotto vent cluster in the MEF (figure 6).
The purpose of the COVIS experiment was to acoustically image, quantify, and monitor seafloor hydrothermal flow on time scales of hours (response to ocean tides) to weeks-months-years (response to volcanic and tectonic events); this advances our understanding of these interrelated processes. According to Rona and others (2003), net volume flux of a plume can be calculated by integrating the vertical flux through a plume cross-section, which can then be converted to heat and particle flux if coordinated with in-situ measurements of temperature and particle properties (concentration, size distribution, density). To achieve this, COVIS acquired acoustic data from a projector mounted on a tripod ~4 m above the seafloor at a fixed position. A computer controlled, 3- degrees-of-freedom (yaw, pitch, and roll), positioning system was used to point the sonar transducers providing a large coverage area at the site. Sonar data is collected at ranges of tens of meters from targets to make three types of measurements: 1) volume backscatter intensity from suspended particulate matter and temperature fluctuations in black smoker plumes which was used to reconstruct the size and shape of the buoyant portion of a plume; 2) Doppler phase shift which was used to obtain the flow rise velocity at various levels in a buoyant plume; 3) scintillation which was used to image the area of diffuse flow seeping from the seafloor.
References. Bemis, K.G., Rona, P.A., Jackson, D.R., Jones, C., Mitsuzawa, K., Palmer, D., Silver, D., and Gudlavalletti, R., 2001, Time-averaged images and quantifications of seafloor hydrothermal plumes from acoustic imaging data: a case study at Grotto Vent, Endeavour Segment Seafloor Observatory, Abstract OS21B-0446 presented at American Geophysical Union, Fall Meeting 2001, San Francisco, CA, December.
Bobbitt, A., 2007, NeMO 2007 Cruise Report: Axial Volcano, Endeavour Segment, and Cobb Segment, Juan de Fuca Ridge, R/V Atlantis Cruise AT 15-21, August 3-20, 2007, Astoria, Oregon, to Astoria Oregon, Jason dives J2-286 to J2-295, unpublished report (URL: http://www.pmel.noaa.gov/vents/nemo/NeMO2007-cruise-report.pdf)
Jackson, D.R., Jones, C.D., Rona, P.A., and Bemis, K.G., 2003, A method for Doppler acoustic measurement of black smoker flow fields, Geochemistry Geophysics Geosystems (G3), v. 4, no. 11, p. 1095 (DOI: 10.1029/2003GC000509, 2003).
Light, R., Miller, V., Rona, P., and Bemis, K., 2010, Acoustic Instrumentation for Imaging and Quantifying Hydrothermal Flow in the NEPTUNE Canada Regional Cabled Observatory at Main Endeavour Field (unpublished paper - URL: http://www.apl.washington.edu/projects/apl_presents/topics/covis/covis.php).
Light, R., Miller, V., Jackson, D.R., Rona, P.A., and Bemis, K.G., 2011, Cabled observatory vent imaging sonar (abstract of presentation), Journal of the Acoustical Society of America, v. 129, no. 4, p. 2373.
Merle, S. (compiler), 2006, NeMO 2006 Cruise Report, NOAA Vents Program, Axial Volcano and the Endeavour Segment, Juan de Fuca Ridge, R/V THOMPSON Cruise TN-199, August 22 - September 7, 2006. Seattle WA to Seattle WA; ROPOS dives R1008 - R1014 (URL: http://www.pmel.noaa.gov/vents/nemo2006/nemo06-crrpt-final.pdf).
NEPTUNE Canada, 2011, Transforming Ocean Science; Ocean Networks Canada. (URL: http://www.neptunecanada.ca/about-neptune-canada/neptune-canada-101/)
Rona, P.A., Bemis, K.G., Jackson, D.R., Jones, C.D., Mitsuzawa, K., Palmer, D.R., and Silver, D., 2001, Acoustic Imaging Time Series of Plume Behavior at Grotto Vent, Endeavour Observatory, Juan de Fuca Ridge, Abstract OS21B-0445 presented at American Geophysical Union, Fall Meeting 2001, San Francisco, CA, December.
Rona, P.A., Jackson, D.J., Bemis, K.G., Jones, C.D., Mitsuzawa, K., Palmer, D.R., and Silver, D., 2003, A New Dimension in Investigation of Seafloor Hydrothermal Flows, Ridge 2000 Events, v. 1, no. 1, p. 26 (URL: http://ridge2000.bio.psu.edu).
Rona, P.A., Bemis, K.G., Jones, C., Jackson, D. R., Mitsuzawa, K, and Palmer, D. R., 2010a, Partitioning Between Plume and Diffuse Flow at the Grotto Vent Cluster, Main Endeavour Vent Field, Juan de Fuca Ridge: Past and Present, Abstract OS21C-1519 presented at American Geophysical Union, Fall Meeting 2010, San Francisco, Calif., December.
Rona, P., Light, R., Miller, V., Jackson, D., Bemis, K., Jones, C., and KenneyM., 2010b, Cabled Observatory Vent Imaging Sonar (COVIS) Connected to NEPTUNE Canada Cabled Observatory (poster abstract), 2010 R2K (Ridge 2000) Community Meeting, Portland, OR, 29-31 October 2010 (URL: http://ridge2000.marine-geo.org/community-meeting/october-2010/2010-r2k-community-meeting).
Rona, P., 2011, Sonar images hydrothermal vents in seafloor observatory, EOS Transactions, American Geophysical Union, v. 92, no., 20, p. 169-170.
Rona, P.A., Benis, K.G., Jones, C.D., and Jackson, D.R., 2011, Multibeam sonar observations of hydrothermal flows at the Main Endeavour Field (abstract of presentation), Journal of the Acoustical Society of America, v. 129, no. 4, p. 2373.
Geologic Background. The Endeavour Segment (or Ridge) lies near the northern end of the Juan de Fuca Ridge, W of the coast of Washington and SW of Vancouver Island. The northern end is offset to the east with respect to the West Valley Segment, which extends north to the triple junction with the Sovanco Fracture Zone and the Nootka Fault. The 90-km-long, NNE-SSW-trending segment lies at a depth of more than 2,000 m and is the site of vigorous high-temperature hydrothermal vent systems that were discovered in 1981. Five major vent fields that include sulfide chimneys and black smoker vents are spaced at about 2-km intervals in a 1-km-wide axial valley at the center of the ridge. Preliminary uranium-series dates of Holocene age were obtained on basaltic lava flows, and other younger "zero-age" flows were sampled. Seismic swarms were detected in 1991 and 2005.
Information Contacts: Peter Rona, Institute of Marine and Coastal Sciences and Department of Earth and Planetary Sciences, Rutgers University, New Brunswick, NJ; NEPTUNE Canada (URL: http://www.oceannetworks.ca/).
Eyjafjallajokull (Iceland) — April 2011 Cite this Report
Eyjafjallajokull
Iceland
63.633°N, 19.633°W; summit elev. 1651 m
All times are local (unless otherwise noted)
Eruption ended in late June 2010; sample of growing literature on the eruption
Gudmundsson and others (2010a) noted that the last day of sustained activity at Eyjafjallajökull took place on 22 May 2010. By 23 June 2010, the Iceland Meteorological Office (IMO) and the University of Iceland Institute of Earth Sciences (IES) ceased issuing regular status reports. In addition to discussing the eruption and its final stages, this report also cites a small sample of abstracts and papers from the numerous conferences, sessions, and publications that have thus far emerged on the eruption.
The eruption's initial phase, 20 March-12 April 2010, occurred at Fimmvörðuháls, a spot on the E flanks of Eyjafjallajökull (figure 16, and "F" and "E" on figure 17). Venting at Fimmvörðuháls took place on an exposed ridge cropping out in a region with extensive glaciers to the E and W. Eruptions began in the initially ice-capped summit crater of Eyjafjallajökull on 14 April 2010 (BGVN 35:03 and 35:04). After melting overlying portions of the icecap, the summit crater then emitted clouds of fine-grained ash that remained suspended in the atmosphere for long distances. The ash blew both over the Atlantic and for considerable intervals passed directly over Europe, halting flights of most commercial aircraft for nearly a week in a controversial shutdown with economic impacts in the billions.
In terms of satellite thermal data on the overall eruption, the MODVOLC system measured extensive (multi-pixel) daily alerts during 21 March-21 May 2010, but the alerts became absent thereafter.
Venting at Fimmvörðuháls. At a 15-19 September 2010 conference on the eruption, Höskuldsson and others (2010a) characterized the course of events during the 20 March to 12 April basaltic Fimmvörðuháls flank eruption at Eyjafjallajökull as follows: "At the beginning the eruption featured as many as 15 lava fountains with maximum height of 150 m. On March 24 only four vents were active with fountains reaching to heights of 100 m. On March 31 and April 1 the activity was characterized by relatively weak fountaining through a forcefully stirring pool of lava. The vents were surrounded by 60-80 m high ramparts and the level of lava stood at approximately 40 m. This high stand led to opening of a new fissure trending northwest from the central segment of the original fissure. As activity on the new fissure intensified, the discharge from the original fissure declined and stopped on April 7.
"The intensity of the lava fountains varied significantly on the time scale of hours and was strongly influenced the level of the lava pond in the vents, producing narrow, gas-charged, piston-like fountains during periods of low lava levels, but spray-like fountains when the lava level was high . . ..
"The eruption produced a fountain-fed lava flow field with an area of about 1.3 km2. Initially (20-25 March), the lava advanced towards northeast, but on March 26 the lava began advancing to the west and northwest, especially after April 1 when the activity became concentrated on the new fissure. The flow field morphology is dominantly 'a'a, but domains of pahoehoe and slabby pahoehoe are present, particularly in the western sector of the flow field. The advance of the lava from the vents was episodic; when the lava stood high the lava surged out of the vents, but at low stand there was a lull in the advance. The lava discharged from the vents through open channels as well as internal pathways. The open channels were the most visible part of the transport system, feeding lava to active 'a'a flow fronts and producing spectacular lava falls when cascading into deep gullies just north of the vents. The role of internal pathways was much less noticeable, yet an important contribution to the overall growth of the flow field as it fed significant surface breakouts emerging on the surface of what otherwise looked like stagnant lava. When activity stopped on April 12 the fissure had issued about 0.025 km3 of magma, giving a mean discharge of 13 m3/s."
Summit eruption. The second eruption occurred within the initially ice-covered caldera of Eyjafjallajökull. Opening of the ice cover and explosivity into the atmosphere was amplified by magma-ice interaction that produced a fine ash capable of suspension in the atmosphere for prolonged periods.
Höskuldsson and others (2010b) described the eruption at Eyjafjallajökull's summit (beginning 14 April 2010) as consisting of three phases (table 2). They also stated that at the summit the "Total amount of tephra produced in the eruption is about 0.11 km3 and that of lava 0.025 km3 DRE [dense-rock equivalent]. Average discharge rate in the eruption was about 40 m3/s DRE or about 4 times that of Fimmvörðuháls eruption."
Table 2. Three phases of the eruption at Eyjafjallajökull volcano's summit beginning 14 April 2010 as summarized and condensed by Höskuldsson and others (2010b).
| Dates |
Phase |
Description of Activity |
| 14 Apr-17 Apr 2010 |
I |
Plumes often under 6 km but up to ~9 km altitude. |
| 18 Apr-04 May 2010 |
II |
High tremor with lava flows; generally weak and ash-poor plumes. Pulsating activity with small discrete explosions every few seconds. Tephra grains had fluidal shapes suggesting magmatic fragmentation and decreased viscosity of erupting magma. Plumes on 28th to 7 km altitude. |
| 05 May-22 May 2010 |
III |
Plumes up to 5 km altitude. |
The summit area was still steaming and geothermally active, and the eruption channel was still very hot in October 2010 (figure 18). Investigators expected that cooling to ambient temperatures would take a few years . As noted below, during June 2010, hot lava could still be seen in cracks in the cooled rock on Fimmvörðuháls, and inside craters, but that was not the case at the ice-engulfed summit caldera.
According to Gudmundsson and others (2010b) the summit eruption produced 0.1-0.2 km3 (dense rock equivalent) of tephra. IES reported that by 11 June 2010 a lake about 300 m in diameter had formed in the large summit crater, and by 23 June water was slowly accumulating in the crater because ice was no longer in contact with hot material.
Intrusion triggering. Sigmundsson and others (2010) noted that the 2010 eruptions came after 18 years of intermittent volcanic unrest. The deformation associated with the eruptions was unusual because it did not relate to pressure changes within a single source. Deformation was rapid before the flank eruption (0.5 mm per day after 4 March 2010), but negligible during it.
During the summit eruption (beginning 14 April 2010) gradual contraction of a source, distinct from the pre-eruptive inflation sources, was evident from geodetic data. Thus, clear signals of volcanic unrest may occur over years to weeks, indicating reawakening of such volcanoes, whereas immediate short-term eruption precursors may be subtle and difficult to detect.
Figure 19 shows a cross-sectional model of the shallow crust by Sigmundsson and others (2010) based deformation and seismic analyses of the 2010 event. A previous issue of the Bulletin (BGVN 35:03) contained an alternate model by Paul Einarsson.
Processed satellite image. Vincent J. Realmuto created two composite figures generated from the MODIS-Terra satellite data acquired 15 April 2010 at 1135 UTC (figure 20). Outlined in black in each image are Iceland on the upper left side (W), Faroe Islands in the center, Scotland and N Ireland in the lower center, and part of the Scandinavian peninsula on the right side (E). An ash plume can be seen in each image extending from Iceland SW toward Europe. The left-hand image is the true-color RGB (red-green-blue) composite and the right-hand image is a false-color composite; in the right-hand rendition the ash plume appears red and the ice-rich clouds appear blue. The right-hand image puts obvious emphasis on the ash plume and shows it streaming and more or less intact for several hundreds of kilometers E of Iceland.
Conference field trip. Following The Atlantic Conference on Eyjafjallajökull and Aviation in Iceland, 15-16 September 2010 (discussed below), a field trip brought scientists to accessible areas on the volcano, including the flank vent on Fimmvörðuháls ridge where the eruption began. John and Liudmila Eichelberger provided some photographs from this trip (figure 21). The same base map appeared in BGVN 35:03, with the key and other data. The horseshoe shape of the lava distribution in this figure is the feature imaged by an ASTER satellite thermal signature as active lava flows on 19 April 2010 in BGVN 35:03.
More on conferences and publications. Recently, several conferences have been held and many publications have been issued relevant to the eruption. What follows is a mere sample of the available resources, many of which emphasized plume research. At the American Geophysical Union (AGU) 2010 Fall Meeting, several sessions focused on the 2010 eruption (eg., Carn and others, 2010; see References for the link to abstracts volume).
The Workshop on Ash Dispersal Forecast and Civil Aviation held in Geneva, 18-20 October 2010, addressed the characteristics and range of application of different volcanic ash transport and dispersal models (VATDM), identifying the needs of the modeling community, investigating new data acquisition strategies, and discussing how to improve communication between the volcanology community and operational agencies (eg., Bonadonna and others, 2011).
The Cities on Volcanoes conference (COV-6; Tenerife, Canary Islands, Spain, 31 May-4 June 2010) included both papers (eg. Fischer and others, 2010) and a forum on the "Assessment of volcanic ash threat: learning and considerations from the Eyjafjallajökull eruption."
In addition, several other papers relevant to the eruption were presented during this meeting, as well as at the Annual Meeting of the American Meteorological Society (AMS) in Seattle, WA, in January 2011, and at the European Geosciences Union (EGU) 2011 General Assembly in Vienna, Austria.
The journal Atmospheric Chemisrty and Physics published multiple issues with a section entitled "Atmospheric implications of the volcanic eruptions of Eyjafjallajökull, Iceland 2010." These and other papers discussed various means of plume detection, and in some cases, sampling, including on the ground, in ultralight aircraft, and on satellites; models of plume dispersion were evaluated (Flentje and others, 2010; Emeis and others, 2011; Vogel and others, 2011; Fischer and others, 2010).
According to Loughlin (2010), scientists from the British Geological Survey found large ash particles from the eruption in the United Kingdom. Most of the very small ash particles in volcanic plumes fell as clusters of particles known as aggregates. The aggregation could have resulted from a number of mechanisms, including electrostatic attraction, particle collisions, condensation of liquid films and secondary mineralization. The process of aggregation effectively removed very small particles from the plume and was therefore one variable on how long ash particles stay in the atmosphere. Ripley (2010) and Chivers (2010) published articles on the U.K. Met Office's tracking and prediction of movements of volcanic ash based on observations from the Eyjafjallajökull eruption.
Gislason and others (2011) reported on analyses of two sets of fresh, comparatively dry ash samples that fell in Iceland and were collected rapidly on 15 and 27 April, during more and less explosive phases, respectively. Both sets of samples were kept dry and analyzed swiftly to minimize issues with hydration and alteration, particularly to salts on the ash surfaces. The ash was dominantly glass of andesitic composition (57-58% SiO2). They found the ash particles especially sharp and abrasive over their entire size range, from submillimeter to tens of nanometers.
References. Bonadonna, C., Folch, A., and Loughlin, S., 2011, Future Developments in Modeling and Monitoring of Volcanic Ash Clouds, Eos, Transactions of the American Geophysical Union (AGU), v. 92, no. 10; pp. 85-86, DOI: 10.1029/2011EO100008 (URL: http://www.agu.org/pub/eos/).
Carn, S.A., Karlsdottir, S., and Prata, F., 2010, The 2010 Eruption of Eyjafjallajokull: A Landmark Event for Volcanic Cloud Hazards I, II, and III, Abstracts V41E, V53F, and V54C presented at 2010 Fall Meeting, American Geophysical Union, San Francisco, CA, 13-17 December 2010 (URL: http://www.agu.org/meetings/fm10/program/index.php).
Chivers, H., 2010, Dark Cloud: VAAC and predicting the movement of volcanic ash, Meterological Technology International, June 2010, pp. 62-65.
Emeis, S., Forkel, R., Junkermann, W., Schäfer, K., Flentje, H., Gilge, S., Fricke, W., Wiegner, M., Freudenthaler, V., Groß, S., Ries, L., Meinhardt, F., Birmili, W., Münkel, C., Obleitner, F., and Suppan, P., 2011, Measurement and simulation of the 16/17 April 2010 Eyjafjallajökull volcanic ash layer dispersion in the northern Alpine region, Atmospheric Chemistry and Physics, v. 11, pp. 2689-2701.
Fischer, C., van Haren, G., Pohl, T., Vogel, A., and Weber, K., 2010, Airborne in-situ measurements of the volcanic ash dust plume over a part of Germany caused by the volcano eruption of the Eyjafjallajökull (Iceland) by means of an optical particle counter and a light
sport aircraft, Abstract, Session 1.3, p. 229, Cities on Volcanoes 6 Conference (URL: http://www.citiesonvolcanoes6.com/ver.php).
Flentje, H., Claude, H., Elste, T., Gilge, S., Köhler, U., Plass-Dülmer, C., Steinbrecht, W., Thomas, W., Werner, A., and Fricke W., 2010, The Eyjafjallajökull eruption in April 2010 - detection of volcanic plume using in-situ measurements, ozone sondes and lidar-ceilometer profiles, Atmospheric Chemistry and Physics, v. 10, pp. 10085-10092, DOI: 10.5194.
Gasteiger, J., Groß, S., Freudenthaler, V., and Wiegner, M., 2011, Volcanic ash from Iceland over Munich: mass concentration retrieved from ground-based remote sensing measurements, Atmospheric Chemistry and Physics, v. 11, pp. 2209-2223.
Gislason, S.R., Hassenkam, T., Nedel, S., Bovet, N., Eiriksdottir, E.S., Alfredsson, H.A., Hem, C.P., Balogh, Z.I., Dideriksen, K., Oskarsson, N., Sigfusson, B., Larsen, G., and Stipp, S.L.S., 2011, Characterization of Eyjafjallajökull volcanic ash particles and a protocol for rapid risk assessment, Proceedings of the National Academy of Sciences, v. 108, no. 18, p. 7303-7312.
Gudmundsson, M. T., Pedersen, R., Vogfjörd, K., Thorbjarnardóttir, B., Jakobsdóttir, S., and Roberts, M.J., 2010a, Eruptions of Eyjafjallajökull Volcano, Iceland, Eos, Transactions of the American Geophysical Union (AGU), v. 91, no. 21, p. 190, DOI: 10.1029/2010EO210002.
Gudmundsson, M.T., Thordarson, T., Hoskuldsson, A., Larsen, G., Jónsdóttir, I., Oddsson, B., Magnusson, E., Hognadottir, T., Sverrisdottir, G., Oskarsson, N., Thorsteinsson, T., Vogfjord, K., Bjornsson, H., Pedersen, G.N., Jakobsdottir, S., Hjaltadottir, S., Roberts, M.J., Gudmundsson, G.B., Zophoniasson, S., and Hoskuldsson, F., 2010b, The Eyjafjallajökull eruption in April-May 2010; course of events, ash generation and ash dispersal, EOS, Transactions of the American Geophysical Union (AGU), V. 91, no. 21, Abstract V53F-01, 2010 Fall Meeting, AGU, San Francisco, Calif., 13-17 December (URL: http://www.agu.org/cgi-bin).
Heue, K.-P., Brenninkmeijer,C.A.M., Baker, A. K., Rauthe-Schöch, A., Walter, D., Wagner, T., Hörmann, C., Sihler, H., Dix, B., Frieß, U., Platt, U., Martinsson, B. G., van Velthoven, P.F.J., Zahn, A., and Ebinghaus, R., 2011, SO2 and BrO observation in the plume of the Eyjafjallajökull volcano 2010: CARIBIC and GOME-2 retrievals, Atmospheric Chemistry and Physics, v. 11, pp. 2973-2989.
Höskuldsson, A., Magnusson, E., Guðmundsson, M.T., Sigmundsson, F., and Sigmarsson, O., 2010a, The 20 March to 12 April basaltic Fimmvörðuháls flank eruption at Eyjafjallajökull volcano, Iceland: Course of events, abstract of presentation in Program of the Eyjafjallajökull and Aviation Conference (15-16 September 2010) and associated Eyjafjallajökull Eruption Workshop (Hotel Hvolsvellir, 17-19 September 2010); (URL: http://en.keilir.net/keilir/conferences/eyjafjallajokull/volcanological-workshop).
Höskuldsson, Á., Larsen, G., Gudmundsson, M.T., Oddsson, B., Magnússon, E., Sigmarsson, O., Óskarsson, N., Jónsdóttir, I., Sigmundsson, F., Einarsson, P., Hreinsdóttir, S., Pedersen, R., Högnadóttir, Þ., Thordarson, T., Hayward, C., Hartley, M., Meara, R., Arason, Þ., Karlsdóttir, S., and Petersen, G.N., 2010b, The Eyjafjallajökull eruption April to May 2010: Magma fragmentation, plume and tephra transport, and course of events, abstract of presentation in Program of the Eyjafjallajökull and Aviation Conference (15-16 September 2010) and associated Eyjafjallajökull Eruption Workshop (17-19 September 2010); (URL: http://en.keilir.net/keilir/conferences/eyjafjallajokull/volcanological-workshop).
Laursen, L., 2010, Iceland eruptions fuel interest in volcanic gas monitoring, Science, v. 328, no. 5977, p. 410-411.
Loughlin, S., 2010, Modelling of Iceland volcanic ash particles, news item from British Geological Survey (URL: http://www.bgs.ac.uk/research/highlights/IcelandAshParticles.html?src=sfb).
Ripley, T., 2010, Cloud Busting: How the UK is tracking the volcanic ash cloud, Meterological Technology International, June 2010, pp. 6-10.
Schumann, U., Weinzierl, B., Reitebuch, O., Schlager, H., Minikin, A., Forster, C., Baumann, R., Sailer, T., Graf, K., Mannstein, H., Voigt, C., Rahm, S., Simmet, R., Scheibe, M., Lichtenstern, M., Stock, P., Rüba, H., Schäuble, D., Tafferner, A., Rautenhaus, M., Gerz, T., Ziereis, H., Krautstrunk, M., Mallaun, C., Gayet, J.-F., Lieke, K., Kandler, K., Ebert, M., Weinbruch, S., Stohl, A., Gasteiger, J., Groß, S., Freudenthaler, V., Wiegner, M., Ansmann, A., Tesche, M., Olafsson, H., and Sturm, K., 2011, Airborne observations of the Eyjafjalla volcano ash cloud over Europe during air space closure in April and May 2010, Atmospheric Chemistry and Physics, v. 11, pp. 2245-2279.
Sigmundsson, F., Hreinsdóttir, S., Hooper, A., Árnadóttir, T., Pedersen, R., Roberts, M.J., Óskarsson, N., Auriac, A., Decriem, J., Einarsson, P., Geirsson, H., Hensch, M., Ófeigsson, B.G., Sturkell, E., Sveinbjörnsson, H., and Feigl, K.L., 2010, Letter: Intrusion triggering of the 2010 Eyjafjallajökull explosive eruption, Nature, v. 468, pp. 426-430.
Stohl, A., Prata, A.J., Eckhardt, S., Clarisse, L., Durant, A., Henne, S., Kristiansen, N.I., Minikin, A., Schumann, U., Seibert, P., Stebel, K., Thomas, H.E., Thorsteinsson, T., Tørseth, K., and Weinzierl, B., 2011, Determination of time- and height-resolved volcanic ash emissions and their use for quantitative ash dispersion modeling: the 2010 Eyjafjallajökull eruption, Atmospheric Chemistry and Physics, v. 11, pp. 4333-4351.
Vogel, A., Weber, K., Fischer, C., van Haren, G., Pohl, T., Grobety, B., and Meier, M., 2011, Airborne in-situ measurements of the Eyjafjallojökull ash plume with a small aircraft and optical particle spectrometers over north-western Germany - comparison between the aircraft measurements and the VAAC-model calculations, European Geophysical Union General Assembly, Geophysical Research Abstracts, v. 13, p. EGU2011-13253.
Geologic Background. Eyjafjallajökull (also known as Eyjafjöll) is located west of Katla volcano. It consists of an elongated ice-covered stratovolcano with a 2.5-km-wide summit caldera. Fissure-fed lava flows occur on both the E and W flanks, but are more prominent on the western side. Although the volcano has erupted during historical time, it has been less active than other volcanoes of Iceland's eastern volcanic zone, and relatively few Holocene lava flows are known. An intrusion beneath the S flank from July-December 1999 was accompanied by increased seismic activity. The last historical activity prior to an eruption in 2010 produced intermediate-to-silicic tephra from the central caldera during December 1821 to January 1823.
Information Contacts: Institute of Earth Sciences (IES), University of Iceland, Sturlugata 7, Askja , 101 Reykjavík (URL: http://www.earthice.hi.is/); Icelandic Meteorological Office (IMO) (URL: http://en.vedur.is/earthquakes-and-volcanism/articles/nr/1884); U.K. Meteorological Office (URL: http://www.metoffice.gov.uk); ármann Höskuldsson, Institute of Earth Sciences (IES), University of Iceland, Sturlugata 7, Askja , 101 Reykjavík (URL: http://www.earthice.hi.is); Hawai'i Institute of Geophysics and Planetology (HIGP) MODVOLC Thermal Alerts System, School of Ocean and Earth Science and Technology (SOEST), Univ. of Hawai'i, 2525 Correa Road, Honolulu, HI 96822, USA (URL: http://modis.higp.hawaii.edu/); Sue C. Loughlin, The British Geological Survey, Murchison House, West Mains Road, Edinburgh EH9 3LA, Scotland, UK (URL: http://www.bgs.ac.uk/); Vincent J. Realmuto, Jet Propulsion Laboratory, California Institute of Technology, M/S 183-501, 4800 Oak Grove Drive, Pasadena, CA 91109 USA; John Eichelberger, U.S. Geological Survey, Volcano Hazards Program, Reston, VA (URL: http://volcanoes.usgs.gov/); Ludmilla Eichelberger, Global Volcanism Program, National Museum of Natural History, 10th and Constitution Ave., NW, Washington, DC 20560 USA; Iceland Review (URL: http://icelandreview.com/icelandreview/daily_news/).
Irazu
Costa Rica
9.979°N, 83.852°W; summit elev. 3436 m
All times are local (unless otherwise noted)
Crater lake dries and regional acid-rain report
In April 2010 the lake within Irazú's crater dwindled to only a few centimeters depth and from May to August the lake was dry enough to allow plants to grow up to 10 cm high. Water began to accumulate in September 2010 but disappeared again during the following month. Since November 2010 water returned to the crater and as late as April 2011, a shallow turquoise-blue lake was maintained. Continuous monitoring of acid rain on Irazú's flanks reflected contributions from Turrialba. Often called Irazú's "twin volcano," Turrialba is less than 10 km to the ENE and during the past 4 years it has caused a region-wide increase in acid rain. Covering January 2004 through September 2007, the last Bulletin report on Irazú (BGVN 32:11) highlighted decreasing lake levels, fumarolic changes, and minor mass wasting on the crater walls during January 2004 to March 2007 (see table 8 for a summary of lake changes).
Table 8. Changing lake conditions based on observations of Irazú's crater. Double asterisks indicate times when the lake disappeared; "--" fills cells where no data is available; lake levels are reported qualitatively except for the 7 October to 12 March 2010 time interval when absolute values were measured. This summary is based on ICE data and OVSICORI Monthly Reports.
| Date |
Lake level |
Temp. °C |
Water color |
Notes |
| ** Apr 1990 |
Empty |
-- |
-- |
-- |
| 1991-1994 |
Stable |
-- |
green |
Infrequent Bubbles |
| 08 Dec 1994 |
~VEI 2 explosion from the NW outer flank fumarole~ |
-- |
-- |
-- |
| 1994-1996 |
Stable |
-- |
green |
Bubbles |
| May 2000 |
Decreasing |
18 |
yellow-green |
Bubbles |
| Jan 2001 |
~30 |
-- |
green |
Bubbles |
| 08 Feb 2003 |
Stable |
15 |
reddish |
Rockslide into lake |
| Jan-Dec 2004 |
Stable |
-- |
green |
Convection cells at edges |
| Jan-Nov 2005 |
Stable |
-- |
green |
Convection cells in center |
| Mar-Dec 2006 |
Stable |
-- |
increasingly yellow-green |
Convection cells in various locations |
| Mar-Sep 2007 |
Decreasing |
145 |
light-green |
Convection cells at edges and center; bubbles |
| 20 Sep 2007-Mar 2008 |
Decreasing |
17 |
-- |
Bubbles |
| 05 Mar 2008-07 Oct 2009 |
Decreasing |
14 |
dark green |
Bubbles |
| 07 Oct 2009-12 Mar 2010 |
1.4 m |
16 |
dark-to-light green |
-- |
| Apr 2010 |
Only few cm |
-- |
-- |
-- |
| ** May-Aug 2010 |
Empty |
-- |
-- |
Plants on crater floor |
| Sep 2010 |
Re-forming |
-- |
-- |
-- |
| ** Oct 2010 |
Empty |
-- |
-- |
-- |
| Nov 2010-Jan 2011 |
Forming |
-- |
turquoise |
-- |
| Feb-Apr 2011 |
Few meters |
-- |
turquoise-to-blue |
-- |
On 22 July 2010 a team of investigators from Observatorio Vulcanologico Sismologica de Costa Rica-Universidad Nacional (OVSICORI-UNA) descended to the dry crater floor. They documented changes in vegetation, fumaroles, and clay deposition on the crater floor. Photos taken during prior trips provided comparisons with previous conditions (figure 14). Rockfalls and minor mass wasting had been occurring regularly and the long runout of debris across the crater floor was visible during this investigation. Most of the debris fell from the E and SW walls. On the NE side of the dry crater a rocky area emitted low temperature (24°C) sulfur-smelling gases from three aligned vents. Higher temperatures (86°C) were measured from fumaroles on the N side of the crater but they appeared to be releasing gas with less energy than observed in the past years when bubbles were visible within the lake. Another interesting finding was a waterfall on the inside of the crater on the SW wall; this small waterfall did not have sufficient volume to pool on the crater floor and instead soaked directly into the surrounding clay.
The water level in Irazú's crater has been variable throughout time; the Bulletin recorded a dry crater during February 1977 and June 1987 (SEAN 12:07), and April 1990 (BGVN 15:04). Factors highlighted during the IAVCEI CVL-7 ("Commission of Volcanic Lakes" Costa Rica, 10-19 March 2010) included complex connections with Turrialba, seasonal effects, infiltration within the crater, and the role of mass wasting. The mechanism for the recent disappearance of the lake is still under investigation by OVSICORI-UNA and ICE investigators (Guillermo Alvarado, personal communication).
Erosion. Mass wasting had been an ongoing process for at least 10 years. Material is primarily shed from the E and SW walls and the lake contained islands of black and red material formed from the debris. In February 2003 a major rockslide into the lake caused the water color to change from green to shades of red. An analysis of seismicity during that month showed no correlation to these slope failures (BGVN 28:12). Cracks along the NW rim formed and widened since December 2007; these cracks caused blocks up to 3 x 20 m to fall from the rim in March 2008.
Local gas measurements. Since the large phreatic explosion in December 1994 (BGVN 19:12), the NW fumarole has been releasing low gas emissions regularly. Different temperature measurements recorded since June 2010 ranged between 90°C to 86°C. To monitor changes in sulfur dioxide output from Irazú, a network of three stations collected rain samples from sites along the volcano's flanks.
The pH data from September 2004 through July 2010 were plotted in the OVSICORI-UNA July 2010 monthly report. The results correlate pH changes to much larger degassing events occurring at Turrialba, a neighboring volcano that began major degassing in 2007. Only the "Borde Sur" station was sampling continuously but the other two stations reflected similar trends in acidity. Despite irregular fluctuations, a decreasing pH trend began in 2007. The lowest point of the trend was measured by "Borde Este" at approximately pH 3.25. Where there "Pacayas" station data began, the trend appeared to have stabilized between pH 3.25 and 4.75.
References. D. Rouwet, R.A. Mora-Amador, C.J. Ramírez-Umaña, G. González, Seepage of "aggressive" fluids reduce volcano flank stability: the Irazú and Turrialba case, Costa Rica, Abstract, CVL 7 Workshop Costa Rica, IAVCEI-Commission of Volcanic Lakes, March 2010.
Geologic Background. The massive Irazú volcano in Costa Rica, immediately E of the capital city of San José, covers an area of 500 km2 and is vegetated to within a few hundred meters of its broad summit crater complex. At least 10 satellitic cones are located on its S flank. No lava effusion is known since the eruption of the Cervantes lava flows from S-flank vents about 14,000 years ago, and all known Holocene eruptions have been explosive. The focus of eruptions at the summit crater complex has migrated to the W towards the main crater, which contains a small lake. The first well-documented eruption occurred in 1723, and frequent explosive eruptions have occurred since. Ashfall from the last major eruption during 1963-65 caused significant disruption to San José and surrounding areas. Phreatic activity reported in 1994 may have been a landslide event from the fumarolic area on the NW summit (Fallas et al., 2018).
Information Contacts: E. Duarte, Observatorio Vulcanologico Sismologica de Costa Rica-Universidad Nacional (OVSICORI-UNA), Apartado 86-3000, Heredia, Costa Rica (URL: http://www.ovsicori.una.ac.cr/); G. Alvarado and G.J. Soto, Oficina de Sismologia y Vulcanologia del Arenal y Miravalles (OSIVAM), Instituto Costarricense de Electricidad (ICE), Apartado 10032-1000, San Jose, Costa Rica.
Machin
Colombia
4.487°N, 75.389°W; summit elev. 2749 m
All times are local (unless otherwise noted)
Seismic and non-eruptive unrest detected in 2004, 2008, 2009, and again in 2010
This is the first Bulletin report on Cerro Machín volcano, the site of seismic unrest for many years, most recently, 1992, 1999, 2002, 2004, 2008, 2009, and 2010. This activity did not lead to eruptions. Instrumental monitoring by INGEOMINAS began in 1987 and has determined Machín's background seismicity ranged from 1 to10 earthquakes/day, but during intervals of unrest, seismicity sometimes reached several hundred earthquakes per day.
This is a small but explosive volcano located at the S end of the Ruiz-Tolima massif, 185 km NNE of the Nevado del Huila volcano and 147 km WSW of Bogotá, the capital (figure 1). (Tolima volcano, not shown, lies ~22 km NNE of Machín.)
Machín caldera contains three dacitic domes; the 3-km-wide caldera is breached to the S. According to Mendez and others (2002), there have been six eruptions within the past 10,000 years. In the same report, the authors noted geomorphological similarities between Machín and Pinatubo prior to its large 1991 eruption. The seismic events have drawn increased attention to Machín from the Volcanic and Seismological Observatory of Manizales, Colombia Institute of Geology and Mining (INGEOMINAS).
According to news articles published in mid-May 2004, INGEOMINAS reported that there had been an increase in seismicity at Machín in April. About 60 earthquakes were recorded daily (in comparison to the 1-10 earthquakes normally recorded); however, no surface changes were seen at that time at the volcano.
There was no further significant seismic activity until the first week of January 2008 when INGEOMINAS reported unusual seismicity at Machín during 6-8 January. Long-period earthquakes were detected S of the main lava dome. On 7 January, the volcano-tectonic seismic signals were occasionally felt and reported by nearby residents. The simultaneous occurrence of both types of seismic signals was unusual for Machín. Again, the activity diminished to the previous background levels until 9 November when INGEOMINAS reported a cluster of ~375 earthquakes, the majority of which were located towards the E sector and below the dome of the volcano with depths between 2.5 and 5 km. The earthquake activity occurred underneath the central and E parts of the lava dome complex in the summit caldera and fumarolic activity in the area increased. During 8-10 November 2008, Machín registered 1,210 volcano-tectonic earthquakes, 9 of which were M 2.5. According to news articles, approximately 400-450 people evacuated to shelters or other safe areas. There were also reports of landslides that blocked a highway.
Table 1 and figure 2 detail the local villages in proximity to Machín.
Table 1. Villages in proximity to Machín and the respective distances from the caldera (approximate). Taken from web sources such as Google Earth.
| Village/town |
Crater distance (km) |
Direction |
| El Rodeo |
96 |
NNW |
| Santa Marte |
15 |
NNE |
| Aguacaliente |
23 |
SSW |
| Toche |
62 |
NW |
| Cajamarca |
8 |
SSW |
| Ibague |
17 |
ESE |
| Salento |
24 |
NW |
| Circasia |
31 |
WNW |
| Calarca |
30 |
W |
On 10 November the seismic activity of the volcano diminished to background conditions. On 17 December INGEOMINAS reported that a swarm of 98 earthquakes occurred at Machín SE of the lava domes at depths of 2-6 km. The largest earthquake was M 2.6 at a depth of ~4 km.
There were two significant seismic events at Machín during 2009. On 31 July there was in increase in seismic activity, which consisted of ~200 events. Initially the increase was gradual, however, during the last hour the activity increased abruptly and included an earthquake of M 2.7. This subsided to a background level until early December when INGEOMINAS detected 54 earthquakes, some M ~ 1.3. Authorities issued a "Yellow" alert (Yellow; "changes in the behavior of volcanic activity") for Machín. The Tolima Regional Emergency Committee conducted evacuation training with local communities as a precaution.
INGEOMINAS reported that on 24 July 2010 a seismic crisis at Machín was characterized by volcano-tectonic earthquakes. An M 2.6 earthquake was located S of the main lava dome at a depth of ~4 km. The next day an M 4.1 volcano-tectonic earthquake occurred 0.8 km S of the main dome at a depth of ~3.9 km. The Yellow alert remained in effect following the increase in registered seismic activity in the area. On 29 July the number of volcano-tectonic events again increased; the earthquakes were a maximum M 1.7 and between 3 and 4 km depth, S of the main dome.
On 17 September 2010, INGEOMINAS again reported increased seismicity. About 140 volcano-tectonic earthquakes as large as M 1.85 were located S and SW of the main lava dome at depths of 2-4 km. On 4 October there was an M 3.5 tectonic earthquake located 0.37 km S of the main dome at a depth of ~4.14 km. Residents near the volcano felt this earthquake. The Alert Level remained at Yellow.
On 3 December 2010 about 340 volcano-tectonic earthquakes with low magnitudes were located SW of the main lava dome, at an average depth of 4 km. The largest event, a M 3.7 earthquake located SW of the dome at a depth of about 3.5 km, was felt by local residents. On 31 December INGEOMINAS reported a period of increased seismicity. A total of 346 volcano-tectonic events no stronger than M 2.1 were located S and SW of the main lava dome.
On 1 January 2011 seismicity again increased, and at the time of the report, 367 events had been detected. The low-magnitude events were located S and SW of the main dome at depths between 2.5 and 4.5 km. The largest event, M 2.3, was located S of the dome at a depth of about 3.3 km and felt by residents near the volcano and in the municipality of Cajamarca, 8 km SSW. On 13 January an increased number of earthquakes were located to the W and SW of the main dome at depth of 2.5-3.5 km. The largest event registered M ~2.6 and was reported to have been felt by residents near the volcano.
Since 1989, INGEOMINAS noted a gradual increase in seismicity has been following the events closely in order to report any changes on the volcano's activities (figure 3). All the local emergency committees were activated in the area near Machín volcano in addition to the regional emergency committees in Tolima District.
References. Méndez, RA; Cortés, GP; and Cepeda, H; [Calvache, ML, Project Chief], 2002, Evaluacíon de la Amenaza Volcánica Potencial del Cerro Machín (Departamento del Tolima, Colombia), Manizales, Sept. 2002, INGEOMINAS, 66 p. (in Spanish).
Méndez, RA, Cortés, GP, and Cepeda, H., 2007, Evaluacíon amenazas potencial de volcan Cerro Machín [Large map in Spanish taken from 2002 report of same name. Name in English, 'Evaluation of potenial hazards from volcan Cerro Machín'] Mapa Amenaza Volcán Machín, INGEOMINAS (URL: http://intranet.ingeominas.gov.co/manizales/images/5/55/MAPA_AMENAZA_VOLCAN_MACHIN.jpg)
Geologic Background. The small Cerro Machín stratovolcano lies at the southern end of the Ruiz-Tolima massif about 20 km WNW of the city of Ibagué. A 3-km-wide caldera is breached to the south and contains three forested dacitic lava domes. Voluminous pyroclastic flows traveled up to 40 km away during eruptions in the mid-to-late Holocene, perhaps associated with formation of the caldera. Late-Holocene eruptions produced dacitic block-and-ash flows that traveled through the breach in the caldera rim to the west and south. The latest known eruption of took place about 800 years ago.
Information Contacts: Instituto Colombiano de Geologia y Mineria (INGEOMINAS), Observatorio Vulcanológico y Sismológico de Manizales, Manizales, Colombia; Relief Web (URL: https://reliefweb.int/); International Federation of Red Cross And Red Crescent Societies (IFRC) (URL: http://www.ifrc.org/); Caracol Radio; El Tiempo:Portafolio (URL: http://columbiareports.com).
Poas
Costa Rica
10.2°N, 84.233°W; summit elev. 2697 m
All times are local (unless otherwise noted)
Photos of phreatic eruptions from acid lake; surrounding vegetation damaged by gases
Occasional, typically minor phreatic eruptions occurred at Poás through at least early February 2011 (BGVN 35:12). They emerged from the active crater lake, Lago Caliente. The Observatorio Vulcanologico y Sismologico de Costa Rica-Universidad Nacional (OVSICORI-UNA) illuminated intervals of phreatic eruptions and relations on the chemistry of Lago Caliente's waters over a period of more than 30 years (figure 94). This report includes photos of phreatic eruptions in 2009, 2010, and early 2011, and reviews events through March 2011.
Volcanic gases and associated condensate and rainfall led to increasing areal extent and degree of damage to vegetation in nearby areas. In studying the Lago Caliente's waters, Martinez and others (2011) found in solution a variety of oxo-anions of sulfur called polythionates (SnO6-2, where n can be 20 or larger), which they found to vary in concentration from undetectable to 8,000 mg/L. They considered polythionates to be "highly relevant for monitoring purposes at Poás, in particular because they may signal impending phreatic eruptions."
More on the 25 December 2009 phreatic eruption. A previous report (BGVN 35:12) discussed a phreatic eruption on 25 December 2009 but some further comments are worth adding. As previously noted (BGVN 35:12), "Steam and lake water mixed with sediment and blocks were ejected 550-600 m above Laguna Caliente and fell in the vicinity of the lake, within the crater." No mention was previously made of a 24 December 2009 phreatic eruption discussed by OVSICORI-UNA. It took place in the morning at 0808 and all erupted material fell back in the crater.
Photos taken on 25 December 2009 and recently posted on the Picasa website have come to our attention. The four photos on figure 95 come from a set of nine taken from the S rim. The earliest of the set depict a very tranquil lake with steaming at or near the dome (not shown here). The next photo, taken 129 seconds after that tranquil scene, portrays the advancing eruption (figure 95a). The subsequent two photos (figure 95b and c) captured the interval closest to the peak of the eruptive vigor.
An exact assessment of the photos is complicated by several factors. There were shifts in the focal length of the lens (documented in camera metadata found on the website). Also, in detail, the camera's time record indicated 0252 hrs, clearly incorrect for this daylight scene. That problem is reconciled by a photo featured in the OVSICORI-UNA report, which showed a plume photo by another photographer at a stage nearly identical to figure 95b and the text indicated the eruption occurred at 0952 hrs local time.
An email response from Cindy Doire provided these comments about witnessing the phreatic eruption.
"We arrived at the volcano early in the morning. We were one of the first to arrive that day. Our group and a few other tourists were looking at it and NOTHING was happening. The people finished looking and started leaving that spot. It was just about 4 of us still there, when suddenly the volcano started to erupt. There was NO warning at all. Even the rangers were surprised. At the beginning, white steam (gas?) shot up, then black rock and dirt started exploding out. I believe that everything that shot up, fell back into the crater . . . the gas could be smelled and was strong . . .."
In an email to GVP regarding the 25 December 2009 eruption, Eliecer Duarte commented: "It seems that this [25 December 2009] eruption opened a more permanent vent at the bottom of the lake. Since that event the frequency of phreatic ones increased and remained like this for [a] year and a half. We still have dozens of smaller ones daily.
More on crater degassing. Field visits during 2010 and 2011 allowed scientists to see the expanding effects of Poás volcanic gases on vegetation (figures 96 and 97). Dry conditions resulted in winds carrying the gases considerable distances from the volcano. The area most affected was an elongate zone downwind of the active crater and extending ~4 km SW. Figure 97 portrays transitional zones with intermediate effects.
Starting just beyond the elongate zone of harsh effects, the areas of discolored vegetation had increased impact and areal extent. One such impacted area was a nature preserve called Providencia, which is seen in figure 97 to the left of Poás. Farther from the volcano lies Cerro Pelón (2.5 km distance and direction SW of the crater) , which also showed the effects of chemical burning from volcanic gases (figure 97).
In the past, activity centers have migrated within the crater. OVSICORI-UNA reported that, for at least the past year (ending March 2011), the points of degassing have been concentrated in the hot crater lake and dome (figure 98). The emanating steam and gases, often carried by wind, have affected areas up to several hundred meters around the crater (figures 96-98).
OVSICORI-UNA reported that through at least March 2011 small phreatic eruptions occurred daily at Lago Caliente. These eruptions sometimes only reached the lake's surface, but at other times reached a few meters above the lake, and occasionally, tens of meters above the lake. The majority of the erupted sediments fell back into the lake. The fine sediments sometimes remained suspended in the lake water and caused its gray color. The majority of eruptions occurred in the central part of the crater, with a few originating slightly more to the N or S of the center. Because of the phreatic activity and high temperature of the lake (57°C), strong evaporation occurred and plumes traveled long distances in the wind (figure 99).
A comparison of vegetation in the area between Cerro Pelón and Providencia (designated "F1" in figure 97) made during August 2010 to January 2011 found that most plant species were resistant at certain levels of acidification. However, when their tolerance thresholds were reached, the affected species decayed quickly and were sometimes unable to recover. Certain species, including eucalyptus, pine, alder, and cypress, were particularly sensitive to the volcanic gases. Minor effects from gases were observed on Cypress trees as far as 9 km SW of the emission source. OVSICORI-UNA reports contained several photos showing more details on the effects of acidic gases on vegetation. One of their later reports, from April 2011, discussed ongoing phreatic eruptions and dome temperature of 560°C.
References. Cindy and JM's Gallery, undated, "Poas volcano eruption, December 25th, 2009" [9 photos] Picassa (URL: https://picasaweb.google.com/cjmdoire); [includes camera-related metadata].
Len (Barfbag), undated, "Wednesday, April 28, 2010, Mt Poas, Costa Rica" ; in Viewsfrom the left seat, A look at the airline world ... ride along in the cockpit (URL: http://viewsfromtheleftseat.blogspot.com/2010/04/mt-poas-costa-rica.html)
Martínez, M., van Bergen, M.J., Fernández, E., and Takano, B., 2011, Polythionates monitoring at the acid crater lake of Poás Volcano, IAVCEI-COMMISSION OF VOLCANIC LAKES, CVL7 Workshop, Costa Rica, 10-19 March 2010, Online Abstracts volume (May 2011), p. 12 (URL: http://www.ulb.ac.be/sciences/cvl/)
Geologic Background. The broad vegetated edifice of Poás, one of the most active volcanoes of Costa Rica, contains three craters along a N-S line. The frequently visited multi-hued summit crater lakes of the basaltic-to-dacitic volcano are easily accessible by vehicle from the nearby capital city of San José. A N-S-trending fissure cutting the complex stratovolcano extends to the lower N flank, where it has produced the Congo stratovolcano and several lake-filled maars. The southernmost of the two summit crater lakes, Botos, last erupted about 7,500 years ago. The more prominent geothermally heated northern lake, Laguna Caliente, is one of the world's most acidic natural lakes, with a pH of near zero. It has been the site of frequent phreatic and phreatomagmatic eruptions since an eruption was reported in 1828. Eruptions often include geyser-like ejections of crater-lake water.
Information Contacts: E. Duarte and E. Fernández, Observatorio Vulcanologico Sismologica de Costa Rica-Universidad Nacional (OVSICORI-UNA), Apartado 86-3000, Heredia, Costa Rica (URL: http://www.ovsicori.una.ac.cr/); Cindy Doire (address withheld by request).
Ranau
Indonesia
4.871°S, 103.925°E; summit elev. 1854 m
All times are local (unless otherwise noted)
Fish kill in April 2011 strikes hot-spring areas of intra-caldera lake
This report on Ranau, a Pleistocene caldera that lies along the Great Sumatran fault, is based on accounts of fish kills, including one on 4 April 2011. The fish died near hot springs in Lake Ranau, a large caldera lake, and their deaths were attributed to seismically induced H2S releases by the Center of Volcanology and Geological Hazard Mitigation (CVGHM). CVGHM reported the surface area of Lake Ranau to be ~127 km2, and noted that the Lake Ranau complex is geothermally active, with hot springs that emerge at the foot of Mount Seminung on the banks of Lake Ranau. In addition to the 2011 event, fish kills have been recorded in Lake Ranau (figure 1) for the past five decades (table 1).
Table 1. Previous fish kills in Lake Ranau reported during the past five decades. (Note that there is no mention of any correlation between seismicity and geochemical anomalies.) Courtesy of CVGHM.
| Year |
Description |
| 1962 |
Residents in Sende Simpang Village noted that the lake water became milky white in color and all of the fish died. |
| 1993 |
One or more fish kills over 3 months. |
| 1995 |
Small-scale fish kill accompanied by a rotten smell (presumably H2S). |
| 1998 |
Large-scale fish kill occurred. According to the head of the village, the event began with turbulent water in Lake Ranau that lasted for approximately 30 minutes. |
Reports stated that the 4 April 2011 fish kill was large in scale. According to the head of a nearby village, Sugih Sane, the event began with turbulent water in Lake Ranau that lasted for approximately 30 minutes. Local residents reported that the fish kill occurred during a relatively short time in portions of the lake surrounding hot springs. At the time of the incident, the water in the affected areas appeared milky white, and wind spread the smell of sulfur to surrounding areas.
Geochemistry. Scientists conducted field work near the three hot springs Kota Batu, Ujung, and Way Wahid during 16-19 April 2011. At that time they reported the following: No dead algae were found on the lake's surface. There was no smell of sulfur, the water was clear, and the water around the hot springs was bubbling and warm. * Dead fish were no longer present. The pH of the lake water was 7.74, and the temperature was 26.1°C. The water near the hot springs had a pH of 6.32-7.06, with a temperature of 47.8-62°C. The water of the river that empties into Lake Ranau (input) had a pH of 8.07-8.10, and the lake water discharge (output) had a pH of 7.86. The result of ambient gas examination showed no gases associated with magmatic gases, such as CH4, CO2, CO, and H2S, in the vicinity of the hot springs discharge. The degree to which the above measurements were anomalous was unstated.
Seismicity. Seismic data recorded during 16-20 April 2011 showed microearthquake activity around Lake Ranau. The earthquakes were located along a fault line oriented in the SE-NW direction along Lake Ranau, at depths of 0.6 and 10 km below the surface of the lake. The Berkelulusan location coincides with the location of the Kota Batu hot springs. Prior to the fish kill at Lake Ranau on 4 April, an M 5.1 earthquake was recorded on 29 March 2011 in Bengkulu, ~160 km W of Lake Ranau.
Cause of the fish kill. CVGHM concluded that, based on the results of the field work (location of dead fish near hot springs, sulfur smell carried by wind up to 3 km away, absence of dead algae, and changing color of the lake water to milky white during the event), the fish kill in Lake Ranau was caused by the release of H2S gas into the lake water, which caused imbalances in lake water chemistry. They said that hydrothermal gas was trapped over time and escaped to the surface after the pressure due to tectonic disturbances. CVGHM concluded that the M 5.1 earthquake in Bengkulu on 29 March 2011 led to increased pressure on the fault in the vicinity of Lake Ranau; then, H2S gas was released to the surface in the vicinity of the hot springs. According to CVGHM, the occurrence of microearthquakes is a result of the fault in the vicinity of Lake Ranau, and are neither dangerous nor destructive. However, CVGHM asked residents to report future fish kills to the local government.
Geologic Background. Ranau is an 8 x 13 km Pleistocene caldera partially filled by the crescent-shaped Lake Ranau. The caldera lies along the Great Sumatran Fault that extends the length of Sumatra. Incremental formation of the caldera culminated in the eruption of the voluminous Ranau Tuff about 0.55 million years ago. A morphologically young post-caldera stratovolcano, Gunung Semuning, was constructed within the SE side of the caldera to a height of more than 1,200 m above the lake surface. The volcano has not been mapped in sufficient detail to determine the age of its latest eruptions, although fish kills and sulfur smells in the late 19th and early 20th centuries may be related to volcanism.
Information Contacts: Center of Volcanology and Geological Hazard Mitigation (CVGHM), Jalan Diponegoro 57, Bandung 40122, Indonesia (URL: http://vsi.esdm.go.id/); Masternewstoday (URL: http://hot-breaking-news-masternewstoday.blogspot.com).
Rincon de la Vieja (Costa Rica) — April 2011 Cite this Report
Rincon de la Vieja
Costa Rica
10.83°N, 85.324°W; summit elev. 1916 m
All times are local (unless otherwise noted)
Fumarolically active but non-eruptive through January 2011
Low-frequency earthquakes and tremor were reported at Rincón de la Vieja during the first half of 2008 (BGVN 33:07). Since then, Observatorio Vulcanologico Sismologica de Costa Rica-Universidad Nacional (OVSICORI-UNA) had issued intermittent reports of activity through January 2011. Those reports are summarized in the following sections, with much of the discussion centered around fumaroles and behavior of the geothermally warmed lake in the active crater. Occasional, typically small phreatic eruptions had occurred here in past years, for example in the 1990s (eg., BGVN 21:02, 21:03, 22:01, and 23:03) but were absent in the current reporting interval (last half of 2008 through January 2011).
August 2008. OVSICORI-UNA reported that the level of the lake was at a high level, with a bluish color, generated convection cells with evaporation, and had sulfur particles visible on it's surface. Sulfur deposition and fumarolic activity continued along the SW wall.
March 2009. In mid-March 2009, scientists visited the S and SW flank, collected samples, and noted some temperatures of 75-78°C. Because the visit occurred during the dry season, most areas encountered were dry. The scientists examined an area of acidification to the W of Von Seebach crater, ~3 km SW of the active crater. Strong winds common in that direction sometimes carried volcanic gases. Consequently, most of this narrow expanse only contained patches of grassland and shrubs that barely covered the rocky surface.
October 2009. OVSICORI-UNA reported that seismographic station RIN3, located ~5 km SW of the main crater, registered volcano-tectonic events and tremor lasting for minutes.
Weak ongoing fumarolic activity during 2010 through January 2011. OVSICORI-UNA reported that the level of the crater lake remained high during 2010, with constant evaporation. Geochemical, seismic, and deformation data did not show significant changes in physico-chemical parameters during 2010. The changing color of the lake, from blue to gray, was attributed to intense rains and fumarolic activity in the crater.
Later reporting. Reports during 2010 through at least January 2011 described fumarolic activity along the S and SW walls of the crater, with sulfur deposition and moderate gas discharge. The lake remained a gray color, with sulfur particles in suspension. Figure 15 shows a photo taken in April of the crater looking at the SW wall with fumarolic activity along with sulfur deposition. In April 2010, OVSICORI-UNA reported that the temperature of the lake was 49°C. A fumarole sometimes seen active along the N flank had stopped discharging gas.
OVSICORI-UNA reported that 2010 was unusual in that four domestic volcanoes were active: Arenal, Poás, Turrialba, and Rincón de la Vieja. Irazú was comparatively inactive (see separate report in this issue of the Bulletin).
Geologic Background. Rincón de la Vieja, the largest volcano in NW Costa Rica, is a remote volcanic complex in the Guanacaste Range. The volcano consists of an elongated, arcuate NW-SE-trending ridge constructed within the 15-km-wide early Pleistocene Guachipelín caldera, whose rim is exposed on the south side. Sometimes known as the "Colossus of Guanacaste," it has an estimated volume of 130 km3 and contains at least nine major eruptive centers. Activity has migrated to the SE, where the youngest-looking craters are located. The twin cone of Santa María volcano, the highest peak of the complex, is located at the eastern end of a smaller, 5-km-wide caldera and has a 500-m-wide crater. A Plinian eruption producing the 0.25 km3 Río Blanca tephra about 3,500 years ago was the last major magmatic eruption. All subsequent eruptions, including numerous historical eruptions possibly dating back to the 16th century, have been from the prominent active crater containing a 500-m-wide acid lake located ENE of Von Seebach crater.
Information Contacts: E. Fernández, W. Sáenz, E. Duarte, M. Martínez, S. Miranda, F. Robichaud, T. Marino, M. Villegas, and J. Barquero, Observatorio Vulcanologico Sismologica de Costa Rica-Universidad Nacional (OVSICORI-UNA), Apartado 86-3000, Heredia, Costa Rica (URL: http://www.ovsicori.una.ac.cr/).
Sheveluch
Russia
56.653°N, 161.36°E; summit elev. 3283 m
All times are local (unless otherwise noted)
Ongoing dome growth into early 2011; and pyroclastic flows of 27 October 2010
This report first describes activity seen at Shiveluch during December 2010-March 2011. Data from that interval included several ash plumes visible as they blew to over 100 km from the volcano. Thermal imagery analysis showed the character of the dome and the path of pyroclastic-flow deposits during that interval. After that, we provide a follow-up to the 27 October 2010 eruption (BGVN 35:11), adding some previously unmentioned details. That eruption destroyed the dome's SE sector and generated pyroclastic flows.
During December 2010-March 2011, KVERT reported that Shiveluch both underwent moderate seismicity and emitted bright thermal anomalies conspicuous in satellite imagery (figure 27). Details of significant explosions and ash plumes during that time appear on table 10. Figure 28 shows a photo with the distant skyline dominated by a long Shiveluch ash plume.
Table 10. An inexhaustive synopsis of significant plumes at Shiveluch visible on satellite imagery from December 2010 through 26 March 2011 (times and dates are UTC). Courtesy KVERT.
| Date |
Comments |
| 03 Dec 2010 |
Ash plumes drifted 322 km SE. |
| 14 Dec 2010 |
Ash plume drifted 230 km NE, 2-km-long pyroclastic flow. |
| 23-24 Dec 2010 |
Ash plumes rose to altitudes as high as 4.5 km |
| 02 Jan 2011 |
Ash plumes rose to altitudes as high as 8 km and drifted 92 km S. |
| 18 Jan 2011 |
Ash plumes rose to altitudes as high as 7 km and drifted W. |
| 26 Jan 2011 |
Ash plume drifted 54 km S. |
| 31 Jan-1 Feb, 4 Feb 2011 |
Ash plume drifted 120 km NE, E. Ash plumes rose 7.5 km |
| 23-24 Feb 2011 |
Ash plumes altitudes below 6 km and drifted 220 km SE (figure 28). |
| 26-27 Feb 2011 |
Ash plumes drifted over 140 km N. |
| 10, 16 Mar 2011 |
Ash plumes drifted 312 km W, NW. |
| 18-20 Mar 2011 |
Ash plumes drifted 373 km SE, N. |
| 26 Mar 2011 |
Ash plumes drifted 57 km SE. |
More on the 27 October 2010PFs. As previously reported, an explosive eruption on 27 October 2010 (BGVN 35:11) vented at the dome and destroyed its SE portion, generating pyroclastic flows laden with many fragments of dome material (figure 29). The associated eruptive plume extended more than 1,500 km from the volcano. The pyroclastic flows traveled SSE in a radial direction, as far as 20 km from the source.
Near the dome, visiting scientists found agglomerate deposits of fragmental dome material spread widely down the SE slope. The character of the deposits was similar to debris avalanches, since so much dome material suddenly traveled down slope. The pyroclastic flow deposits retraced numerous upslope tributaries along the Kabeku River. The deposits filled small valleys and other low-lying areas, leveling landscapes that had prior to the eruption been rough (figure 30).
Figures 31a and b, satellite images, illustrate the trail of hot material descending to the S. They formed a large, complex, and widely distributed deposit following the recent collapse of the lava dome. A sub-circular area about ~4 km in diameter at about 9-14 km distance from the dome may reflect denser deposition (figure 31a). The images make clear that pyroclastic flow deposits descended yet farther, leaving dense, thermally radiant tracks over narrower valleys trending to the SE. The images are from ASTER (Advanced Spaceborne Thermal Emission and Reflection Radiometer). Figure 31b shows the flow's heat signature as measured in thermal infrared energy. The white area at the lava dome was very hot, while the red areas on the edge of the flow were merely warmer than the surrounding snow.
Fieldwork in the distal area revealed that the most powerful pyroclastic flow went into the headwaters of two narrow valleys, then merged into a single stream down into the Kabeku Valley river almost to its confluence with the Bekesh river (5 km N of the Kluchi-Ust'-Kamchatsk road, figures 32 and 33).
Water in the bed of the Bekesh river ran down the same path as thick pyroclastic flows and continued to be fed by melting snow on the upper slopes. Water also seeped through the loose pyroclastic flow deposit, resulting in large amounts of steam escaping at the surface in the form of fumaroles, degassing pipes, and zones of jetting emissions. This created the impression that the river water was boiling; on its surface rose a wall of steam (figure 34). Walking over the pyroclastic flow deposit was difficult and potentially dangerous, since the deposit's upper portion remained hot and gas saturated (figure 34b).
Reference. Ovsyannikov, A., Manevich, A., 2010, Eruption Shiveluch in October 2010, Bulletin of Kamchatka Regional Association (Educational-Scientific Center); Earth Sciences (in Russian), IV&S FEB RAS, Petropavlovsk-Kamchatsky, 2010, vol. 2, no. 16, ISSN 1816-5532 (Online).
Geologic Background. The high, isolated massif of Sheveluch volcano (also spelled Shiveluch) rises above the lowlands NNE of the Kliuchevskaya volcano group. The 1,300 km3 andesitic volcano is one of Kamchatka's largest and most active volcanic structures, with at least 60 large eruptions during the Holocene. The summit of roughly 65,000-year-old Stary Shiveluch is truncated by a broad 9-km-wide late-Pleistocene caldera breached to the south. Many lava domes occur on its outer flanks. The Molodoy Shiveluch lava dome complex was constructed during the Holocene within the large open caldera; Holocene lava dome extrusion also took place on the flanks of Stary Shiveluch. Widespread tephra layers from these eruptions have provided valuable time markers for dating volcanic events in Kamchatka. Frequent collapses of dome complexes, most recently in 1964, have produced debris avalanches whose deposits cover much of the floor of the breached caldera.
Information Contacts: Kamchatka Volcanic Eruptions Response Team (KVERT), Institute Volcanolohy and Seismology Far East Division, Russian Academy of Sciences (IVS FED RAS), Kamchatka Branch of the Geophysical Service, Russian Academy of Sciences (KB GS RAS) (URL: http://www.emsd.iks.ru/index-e.php). 9 Piip Blvd., Petropavlovsk-Kamchatsky, 683006, Russia (URL: http://www.kscnet.ru/ivs/); Y. Demyanchuk, A. Ovsyannikov, A. Manevich (IVS FED RAS); Alaska Volcano Observatory (AVO), a cooperative program of the U.S. Geological Survey, 4200 University Drive, Anchorage, AK 99508-4667, USA (URL: http://www.avo.alaska.edu/); Tokyo Volcanic Ash Advisory Centre (VAAC), Tokyo, Japan (URL: http://ds.data.jma.go.jp/svd/vaac/data/); NASA Earth Observatory (URL: http://earthobservatory.nasa.gov/).