Recently Published Bulletin Reports
Manam (Papua New Guinea) Few ash plumes during November-December 2022
Krakatau (Indonesia) Strombolian activity and ash plumes during November 2022-April 2023
Stromboli (Italy) Strombolian explosions and lava flows continue during January-April 2023
Nishinoshima (Japan) Small ash plumes and fumarolic activity during November 2022 through April 2023
Karangetang (Indonesia) Lava flows, incandescent avalanches, and ash plumes during January-June 2023
Ahyi (United States) Intermittent hydroacoustic signals and discolored plumes during November 2022-June 2023
Kadovar (Papua New Guinea) An ash plume and weak thermal anomaly during May 2023
San Miguel (El Salvador) Small gas-and-ash explosions during March and May 2023
Semisopochnoi (United States) Occasional explosions, ash deposits, and gas-and-steam plumes during December 2022-May 2023
Ebeko (Russia) Continued explosions, ash plumes, and ashfall during October 2022-May 2023
Home Reef (Tonga) Discolored plumes continued during November 2022-April 2023
Ambae (Vanuatu) New lava flow, ash plumes, and sulfur dioxide plumes during February-May 2023
Manam (Papua New Guinea) — July 2023  Cite this Report
Manam
Papua New Guinea
4.08°S, 145.037°E; summit elev. 1807 m
All times are local (unless otherwise noted)
Few ash plumes during November-December 2022
Manam is a 10-km-wide island that consists of two active summit craters: the Main summit crater and the South summit crater and is located 13 km off the northern coast of mainland Papua New Guinea. Frequent mild-to-moderate eruptions have been recorded since 1616. The current eruption period began during June 2014 and has more recently been characterized by intermittent ash plumes and thermal activity (BGVN 47:11). This report updates activity that occurred from November 2022 through May 2023 based on information from the Darwin Volcanic Ash Advisory Center (VAAC) and various satellite data.
Ash plumes were reported during November and December 2022 by the Darwin VAAC. On 7 November an ash plume rose to 2.1 km altitude and drifted NE based on satellite images and weather models. On 14 November an ash plume rose to 2.1 km altitude and drifted W based on RVO webcam images. On 20 November ash plumes rose to 1.8 km altitude and drifted NW. On 26 December an ash plume rose to 3 km altitude and drifted S and SSE.
Intermittent sulfur dioxide plumes were detected using the TROPOMI instrument on the Sentinel-5P satellite, some of which exceeded at least two Dobson Units (DU) and drifted in different directions (figure 93). Occasional low-to-moderate power thermal anomalies were recorded by the MIROVA (Middle InfraRed Observation of Volcanic Activity) system; less than five anomalies were recorded each month during November 2022 through May 2023 (figure 94). Two thermal hotspots were detected by the MODVOLC thermal alerts system on 10 December 2022. On clear weather days, thermal activity was also captured in infrared satellite imagery in both the Main and South summit craters, accompanied by gas-and-steam emissions (figure 95).
Geologic Background. The 10-km-wide island of Manam, lying 13 km off the northern coast of mainland Papua New Guinea, is one of the country's most active volcanoes. Four large radial valleys extend from the unvegetated summit of the conical basaltic-andesitic stratovolcano to its lower flanks. These valleys channel lava flows and pyroclastic avalanches that have sometimes reached the coast. Five small satellitic centers are located near the island's shoreline on the northern, southern, and western sides. Two summit craters are present; both are active, although most observed eruptions have originated from the southern crater, concentrating eruptive products during much of the past century into the SE valley. Frequent eruptions, typically of mild-to-moderate scale, have been recorded since 1616. Occasional larger eruptions have produced pyroclastic flows and lava flows that reached flat-lying coastal areas and entered the sea, sometimes impacting populated areas.
Information Contacts: Rabaul Volcano Observatory (RVO), Geohazards Management Division, Department of Mineral Policy and Geohazards Management (DMPGM), PO Box 3386, Kokopo, East New Britain Province, Papua New Guinea; Darwin Volcanic Ash Advisory Centre (VAAC), Bureau of Meteorology, Northern Territory Regional Office, PO Box 40050, Casuarina, NT 0811, Australia (URL: http://www.bom.gov.au/info/vaac/); MIROVA (Middle InfraRed Observation of Volcanic Activity), a collaborative project between the Universities of Turin and Florence (Italy) supported by the Centre for Volcanic Risk of the Italian Civil Protection Department (URL: http://www.mirovaweb.it/); Hawai'i Institute of Geophysics and Planetology (HIGP) - MODVOLC Thermal Alerts System, School of Ocean and Earth Science and Technology (SOEST), Univ. of Hawai'i, 2525 Correa Road, Honolulu, HI 96822, USA (URL: http://modis.higp.hawaii.edu/); NASA Global Sulfur Dioxide Monitoring Page, Atmospheric Chemistry and Dynamics Laboratory, NASA Goddard Space Flight Center (NASA/GSFC), 8800 Greenbelt Road, Goddard, Maryland, USA (URL: https://so2.gsfc.nasa.gov/); Copernicus Browser, Copernicus Data Space Ecosystem, European Space Agency (URL: https://dataspace.copernicus.eu/browser/).
Krakatau (Indonesia) — July 2023 Cite this Report
Krakatau
Indonesia
6.1009°S, 105.4233°E; summit elev. 285 m
All times are local (unless otherwise noted)
Strombolian activity and ash plumes during November 2022-April 2023
Krakatau is located in the Sunda Strait between Java and Sumatra, Indonesia. Caldera collapse during the catastrophic 1883 eruption destroyed Danan and Perbuwatan cones and left only a remnant of Rakata. The post-collapse cone of Anak Krakatau (Child of Krakatau) was constructed within the 1883 caldera at a point between the former Danan and Perbuwatan cones; it has been the site of frequent eruptions since 1927. The current eruption period began in May 2021 and has recently consisted of explosions, ash plumes, and thermal activity (BGVN 47:11). This report covers activity during November 2022 through April 2023 based on information provided by the Indonesian Center for Volcanology and Geological Hazard Mitigation, referred to as Pusat Vulkanologi dan Mitigasi Bencana Geologi (PVMBG), MAGMA Indonesia, the Darwin Volcanic Ash Advisory Center (VAAC), and several sources of satellite data.
Activity was relatively low during November and December 2022. Daily white gas-and-steam plumes rose 25-100 m above the summit and drifted in different directions. Gray ash plumes rose 200 m above the summit and drifted NE at 1047 and at 2343 on 11 November. On 14 November at 0933 ash plumes rose 300 m above the summit and drifted E. An ash plume was reported at 0935 on 15 December that rose 100 m above the summit and drifted NE. An eruptive event at 1031 later that day generated an ash plume that rose 700 m above the summit and drifted NE. A gray ash plume at 1910 rose 100 m above the summit and drifted E. Incandescent material was ejected above the vent based on an image taken at 1936.
During January 2023 daily white gas-and-steam plumes rose 25-300 m above the summit and drifted in multiple directions. Gray-to-brown ash plumes were reported at 1638 on 3 January, at 1410 and 1509 on 4 January, and at 0013 on 5 January that rose 100-750 m above the summit and drifted NE and E; the gray-to-black ash plume at 1509 on 4 January rose as high as 3 km above the summit and drifted E. Gray ash plumes were recorded at 1754, 2241, and 2325 on 11 January and at 0046 on 12 January and rose 200-300 m above the summit and drifted NE. Toward the end of January, PVMBG reported that activity had intensified; Strombolian activity was visible in webcam images taken at 0041, 0043, and 0450 on 23 January. Multiple gray ash plumes throughout the day rose 200-500 m above the summit and drifted E and SE (figure 135). Webcam images showed progressively intensifying Strombolian activity at 1919, 1958, and 2113 on 24 January; a gray ash plume at 1957 rose 300 m above the summit and drifted E (figure 135). Eruptive events at 0231 and 2256 on 25 January and at 0003 on 26 January ejected incandescent material from the vent, based on webcam images. Gray ash plumes observed during 26-27 January rose 300-500 m above the summit and drifted NE, E, and SE.
Low levels of activity were reported during February and March. Daily white gas-and-steam plumes rose 25-300 m above the summit and drifted in different directions. The Darwin VAAC reported that continuous ash emissions rose to 1.5-1.8 km altitude and drifted W and NW during 1240-1300 on 10 March, based on satellite images, weather models, and PVMBG webcams. White-and-gray ash plumes rose 500 m and 300 m above the summit and drifted SW at 1446 and 1846 on 18 March, respectively. An eruptive event was recorded at 2143, though it was not visible due to darkness. Multiple ash plumes were reported during 27-29 March that rose as high as 2.5 km above the summit and drifted NE, W, and SW (figure 136). Webcam images captured incandescent ejecta above the vent at 0415 and around the summit area at 2003 on 28 March and at 0047 above the vent on 29 March.
Daily white gas-and-steam plumes rose 25-300 m above the summit and drifted in multiple directions during April and May. White-and-gray and black plumes rose 50-300 m above the summit on 2 and 9 April. On 11 May at 1241 a gray ash plume rose 1-3 km above the summit and drifted SW. On 12 May at 0920 a gray ash plume rose 2.5 km above the summit and drifted SW and at 2320 an ash plume rose 1.5 km above the summit and drifted SW. An accompanying webcam image showed incandescent ejecta. On 13 May at 0710 a gray ash plume rose 2 km above the summit and drifted SW (figure 137).
The MIROVA (Middle InfraRed Observation of Volcanic Activity) graph of MODIS thermal anomaly data showed intermittent low-to-moderate power thermal anomalies during November 2022 through April 2023 (figure 138). Some of this thermal activity was also visible in infrared satellite imagery at the crater, accompanied by gas-and-steam and ash plumes that drifted in different directions (figure 139).
Geologic Background. The renowned Krakatau (frequently mis-named as Krakatoa) volcano lies in the Sunda Strait between Java and Sumatra. Collapse of an older edifice, perhaps in 416 or 535 CE, formed a 7-km-wide caldera. Remnants of that volcano are preserved in Verlaten and Lang Islands; subsequently the Rakata, Danan, and Perbuwatan cones were formed, coalescing to create the pre-1883 Krakatau Island. Caldera collapse during the catastrophic 1883 eruption destroyed Danan and Perbuwatan, and left only a remnant of Rakata. This eruption caused more than 36,000 fatalities, most as a result of tsunamis that swept the adjacent coastlines of Sumatra and Java. Pyroclastic surges traveled 40 km across the Sunda Strait and reached the Sumatra coast. After a quiescence of less than a half century, the post-collapse cone of Anak Krakatau (Child of Krakatau) was constructed within the 1883 caldera at a point between the former Danan and Perbuwatan cones. Anak Krakatau has been the site of frequent eruptions since 1927.
Information Contacts: Pusat Vulkanologi dan Mitigasi Bencana Geologi (PVMBG, also known as Indonesian Center for Volcanology and Geological Hazard Mitigation, CVGHM), Jalan Diponegoro 57, Bandung 40122, Indonesia (URL: http://www.vsi.esdm.go.id/); MAGMA Indonesia, Kementerian Energi dan Sumber Daya Mineral (URL: https://magma.esdm.go.id/v1); Darwin Volcanic Ash Advisory Centre (VAAC), Bureau of Meteorology, Northern Territory Regional Office, PO Box 40050, Casuarina, NT 0811, Australia (URL: http://www.bom.gov.au/info/vaac/); MIROVA (Middle InfraRed Observation of Volcanic Activity), a collaborative project between the Universities of Turin and Florence (Italy) supported by the Centre for Volcanic Risk of the Italian Civil Protection Department (URL: http://www.mirovaweb.it/); Copernicus Browser, Copernicus Data Space Ecosystem, European Space Agency (URL: https://dataspace.copernicus.eu/browser/).
Stromboli
Italy
38.789°N, 15.213°E; summit elev. 924 m
All times are local (unless otherwise noted)
Strombolian explosions and lava flows continue during January-April 2023
Stromboli, located in Italy, has exhibited nearly constant lava fountains for the past 2,000 years; recorded eruptions date back to 350 BCE. Eruptive activity occurs at the summit from multiple vents, which include a north crater area (N area) and a central-southern crater (CS area) on a terrace known as the ‘terrazza craterica’ at the head of the Sciara del Fuoco, a large scarp that runs from the summit down the NW side of the volcano-island. Activity typically consists of Strombolian explosions, incandescent ejecta, lava flows, and pyroclastic flows. Thermal and visual monitoring cameras are located on the nearby Pizzo Sopra La Fossa, above the terrazza craterica, and at multiple flank locations. The current eruption period has been ongoing since 1934 and recent activity has consisted of frequent Strombolian explosions and lava flows (BGVN 48:02). This report updates activity during January through April 2023 primarily characterized by Strombolian explosions and lava flows based on reports from Italy's Istituto Nazionale di Geofisica e Vulcanologia (INGV) and various satellite data.
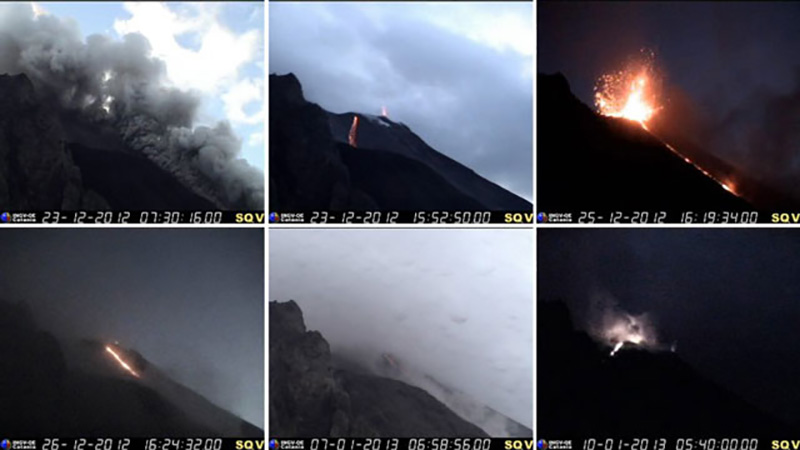
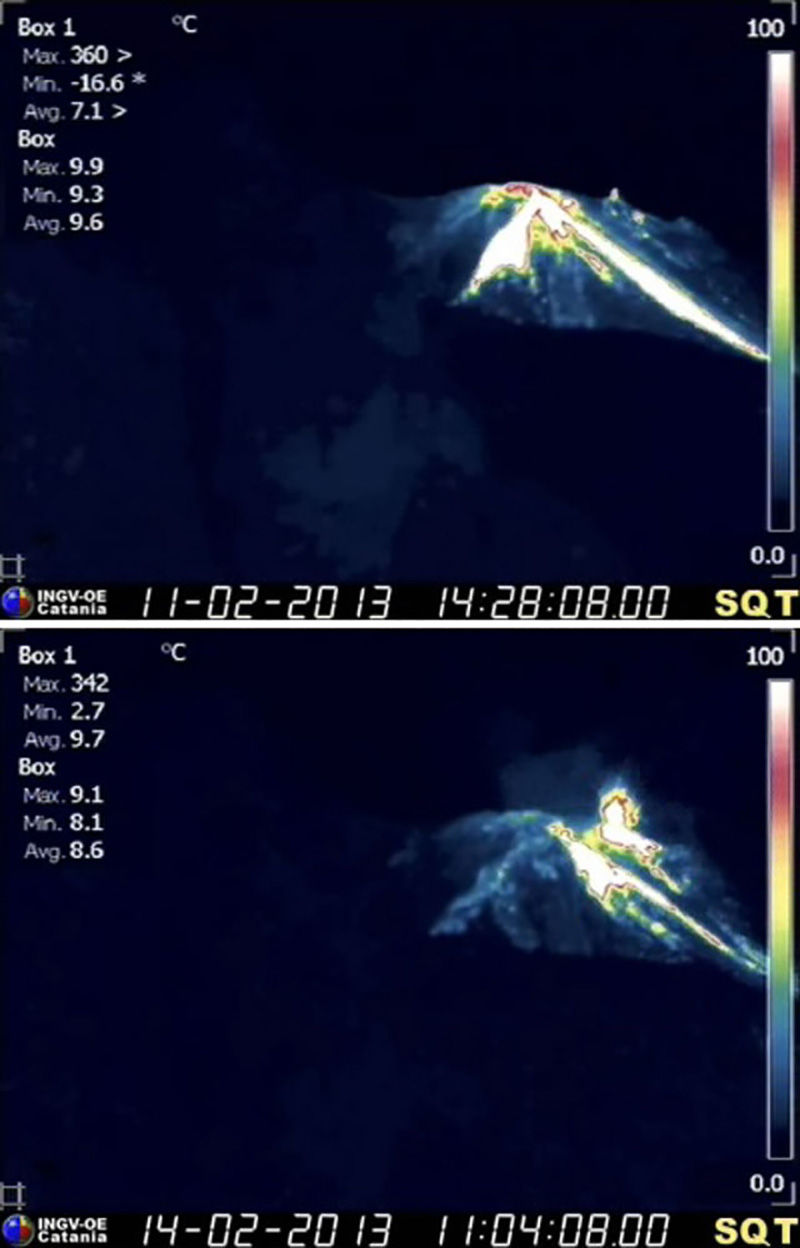
Frequent explosive activity continued throughout the reporting period, generally in the low-to-medium range, based on the number of hourly explosions in the summit crater (figure 253, table 16). Intermittent thermal activity was recorded by the MIROVA (Middle InfraRed Observation of Volcanic Activity) analysis of MODIS satellite data (figure 254). According to data collected by the MODVOLC thermal algorithm, a total of 9 thermal alerts were detected: one on 2 January 2023, one on 1 February, five on 24 March, and two on 26 March. The stronger pulses of thermal activity likely reflected lava flow events. Infrared satellite imagery captured relatively strong thermal hotspots at the two active summit craters on clear weather days, showing an especially strong event on 8 March (figure 255).
Table 16. Summary of type, frequency, and intensity of explosive activity at Stromboli by month during January-April 2023; information from webcam observations. Courtesy of INGV weekly reports.
| Month |
Explosive Activity |
| Jan 2023 |
Typical Strombolian activity with spattering and lava overflows in the N crater area. Explosions were reported from 4 vents in the N area and 1-2 vents in the CS area. The average hourly frequency of explosions was low-to-medium (1-12 events/hour). The intensity of the explosions varied from low (less than 80 m high) to medium (less than 150 m high) in the N crater area and up to high (greater than 150 m high) in the CS crater area. |
| Feb 2023 |
Typical Strombolian activity with spattering in the N crater area. Explosions were reported from 2-3 vents in the N area and 1-4 vents in the CS area. The average hourly frequency of explosions was low-to-medium (1-14 events/hour). The intensity of the explosions varied from low (less than 80 m high) to medium (less than 150 m high) in the N crater area and up to high (greater than 150 m high) in the CS crater area. |
| Mar 2023 |
Typical Strombolian activity with spattering and lava overflows in the N crater area. Explosions were reported from 2-3 vents in the N area and 2-4 vents in the CS area. The average hourly frequency of explosions was low-to-medium (1-18 events/hour). The intensity of the explosions varied from low (less than 80 m high) to medium (less than 150 m high) in the N crater area and up to high (greater than 150 m high) in the CS crater area. |
| Apr 2023 |
Typical Strombolian activity. Explosions were reported from 2 vents in the N area and 2-3 vents in the CS area. The average hourly frequency of explosions was low-to-high (1-16 events/hour). The intensity of the explosions varied from low (less than 80 m high) to medium (less than 150 m high) in both the N and CS crater areas. |
Activity during January-February 2023. Strombolian explosions were reported in the N crater area, as well as lava effusion. Explosive activity in the N crater area ejected coarse material (bombs and lapilli). Intense spattering was observed in both the N1 and N2 craters. In the CS crater area, explosions generally ejected fine material (ash), sometimes to heights greater than 250 m. The intensity of the explosions was characterized as low-to-medium in the N crater and medium-to-high in the CS crater. After intense spattering activity from the N crater area, a lava overflow began at 2136 on 2 January that flowed part way down the Sciara del Fuoco, possibly moving down the drainage that formed in October, out of view from webcams. The flow remained active for a couple of hours before stopping and beginning to cool. A second lava flow was reported at 0224 on 4 January that similarly remained active for a few hours before stopping and cooling. Intense spattering was observed on 11 and 13 January from the N1 crater. After intense spattering activity at the N2 crater at 1052 on 17 January another lava flow started to flow into the upper part of the Sciara del Fuoco (figure 256), dividing into two: one that traveled in the direction of the drainage formed in October, and the other one moving parallel to the point of emission. By the afternoon, the rate of the flow began to decrease, and at 1900 it started to cool. A lava flow was reported at 1519 on 24 January following intense spattering in the N2 area, which began to flow into the upper part of the Sciara del Fuoco. By the morning of 25 January, the lava flow had begun to cool. During 27 January the frequency of eruption in the CS crater area increased to 6-7 events/hour compared to the typical 1-7 events/hour; the following two days showed a decrease in frequency to less than 1 event/hour. Starting at 1007 on 30 January a high-energy explosive sequence was produced by vents in the CS crater area. The sequence began with an initial energetic pulse that lasted 45 seconds, ejecting predominantly coarse products 300 m above the crater that fell in an ESE direction. Subsequent and less intense explosions ejected material 100 m above the crater. The total duration of this event lasted approximately two minutes. During 31 January through 6, 13, and 24 February spattering activity was particularly intense for short periods in the N2 crater.
An explosive sequence was reported on 16 February that was characterized by a major explosion in the CS crater area (figure 257). The sequence began at 1817 near the S2 crater that ejected material radially. A few seconds later, lava fountains were observed in the central part of the crater. Three explosions of medium intensity (material was ejected less than 150 m high) were recorded at the S2 crater. The first part of this sequence lasted approximately one minute, according to INGV, and material rose 300 m above the crater and then was deposited along the Sciara del Fuoco. The second phase began at 1818 at the S1 crater; it lasted seven seconds and material was ejected 150 m above the crater. Another event 20 seconds later lasted 12 seconds, also ejecting material 150 m above the crater. The sequence ended with at least three explosions of mostly fine material from the S1 crater. The total duration of this sequence was about two minutes.
Short, intense spattering activity was noted above the N1 crater on 27 and 28 February. A lava overflow was first reported at 0657 from the N2 crater on 27 February that flowed into the October 2022 drainage. By 1900 the flow had stopped. A second lava overflow also in the N crater area occurred at 2149, which overlapped the first flow and then stopped by 0150 on 28 February. Material detached from both the lava overflows rolled down the Sciara del Fuoco, some of which was visible in webcam images.
Activity during March-April 2023. Strombolian activity continued with spattering activity and lava overflows in the N crater area during March. Explosive activity at the N crater area varied from low (less than 80 m high) to medium (less than 150 m high) and ejected coarse material, such as bombs and lapilli. Spattering was observed above the N1 crater, while explosive activity at the CS crater area varied from medium to high (greater than 150 m high) and ejected coarse material. Intense spattering activity was observed for short periods on 6 March above the N1 crater. At approximately 0610 a lava overflow was reported around the N2 crater on 8 March, which then flowed into the October 2022 drainage. By 1700 the flow started to cool. A second overflow began at 1712 on 9 March and overlapped the previous flow. It had stopped by 2100. Material from both flows was deposited along the Sciara del Fuoco, though much of the activity was not visible in webcam images. On 11 March a lava overflow was observed at 0215 that overlapped the two previous flows in the October 2022 drainage. By late afternoon on 12 March, it had stopped.
During a field excursion on 16 March, scientists noted that a vent in the central crater area was degassing. Another vent showed occasional Strombolian activity that emitted ash and lapilli. During 1200-1430 low-to-medium intense activity was reported; the N1 crater emitted ash emissions and the N2 crater emitted both ash and coarse material. Some explosions also occurred in the CS crater area that ejected coarse material. The C crater in the CS crater area occasionally showed gas jetting and low intensity explosions on 17 and 22 March; no activity was observed at the S1 crater. Intense, longer periods of spattering were reported in the N1 crater on 19, 24, and 25 March. Around 2242 on 23 March a lava overflow began from the N1 crater that, after about an hour, began moving down the October 2022 drainage and flow along the Sciara del Fuoco (figure 258). Between 0200 and 0400 on 26 March the flow rate increased, which generated avalanches of material from collapses at the advancing flow front. By early afternoon, the flow began to cool. On 25 March at 1548 an explosive sequence began from one of the vents at S2 in the CS crater area (figure 258). Fine ash mixed with coarse material was ejected 300 m above the crater rim and drifted SSE. Some modest explosions around Vent C were detected at 1549 on 25 March, which included an explosion at 1551 that ejected coarse material. The entire explosive sequence lasted approximately three minutes.
During April explosions persisted in both the N and CS crater areas. Fine material was ejected less than 80 m above the N crater rim until 6 April, followed by ejection of coarser material. Fine material was also ejected less than 80 m above the CS crater rim. The C and S2 crater did not show significant eruptive activity. On 7 April an explosive sequence was detected in the CS crater area at 1203 (figure 259). The first explosion lasted approximately 18 seconds and ejected material 400 m above the crater rim, depositing pyroclastic material in the upper part of the Sciara del Fuoco. At 1204 a second, less intense explosion lasted approximately four seconds and deposited pyroclastic products outside the crater area and near Pizzo Sopra La Fossa. A third explosion at 1205 was mainly composed of ash that rose about 150 m above the crater and lasted roughly 20 seconds. A fourth explosion occurred at 1205 about 28 seconds after the third explosion and ejected a mixture of coarse and fine material about 200 m above the crater; the explosion lasted roughly seven seconds. Overall, the entire explosive sequence lasted about two minutes and 20 seconds. After the explosive sequence on 7 April, explosions in both the N and CS crater areas ejected material as high as 150 m above the crater.
On 21 April research scientists from INGV made field observations in the summit area of Stromboli, and some lapilli samples were collected. In the N crater area near the N1 crater, a small cone was observed with at least two active vents, one of which was characterized by Strombolian explosions. The other vent produced explosions that ejected ash and chunks of cooled lava. At the N2 crater at least one vent was active and frequently emitted ash. In the CS crater area, a small cone contained 2-3 degassing vents and a smaller, possible fissure area also showed signs of degassing close to the Pizzo Sopra La Fossa. In the S part of the crater, three vents were active: a small hornito was characterized by modest and rare explosions, a vent that intermittently produced weak Strombolian explosions, and a vent at the end of the terrace that produced frequent ash emissions. Near the S1 crater there was a hornito that generally emitted weak gas-and-steam emissions, sometimes associated with “gas rings”. On 22 April another field inspection was carried out that reported two large sliding surfaces on the Sciara del Fuoco that showed where blocks frequently descended toward the sea. A thermal anomaly was detected at 0150 on 29 April.
Geologic Background. Spectacular incandescent nighttime explosions at Stromboli have long attracted visitors to the "Lighthouse of the Mediterranean" in the NE Aeolian Islands. This volcano has lent its name to the frequent mild explosive activity that has characterized its eruptions throughout much of historical time. The small island is the emergent summit of a volcano that grew in two main eruptive cycles, the last of which formed the western portion of the island. The Neostromboli eruptive period took place between about 13,000 and 5,000 years ago. The active summit vents are located at the head of the Sciara del Fuoco, a prominent scarp that formed about 5,000 years ago due to a series of slope failures which extends to below sea level. The modern volcano has been constructed within this scarp, which funnels pyroclastic ejecta and lava flows to the NW. Essentially continuous mild Strombolian explosions, sometimes accompanied by lava flows, have been recorded for more than a millennium.
Information Contacts: Istituto Nazionale di Geofisica e Vulcanologia (INGV), Sezione di Catania, Piazza Roma 2, 95123 Catania, Italy, (URL: http://www.ct.ingv.it/en/); MIROVA (Middle InfraRed Observation of Volcanic Activity), a collaborative project between the Universities of Turin and Florence (Italy) supported by the Centre for Volcanic Risk of the Italian Civil Protection Department (URL: http://www.mirovaweb.it/); Hawai'i Institute of Geophysics and Planetology (HIGP) - MODVOLC Thermal Alerts System, School of Ocean and Earth Science and Technology (SOEST), Univ. of Hawai'i, 2525 Correa Road, Honolulu, HI 96822, USA (URL: http://modis.higp.hawaii.edu/); Copernicus Browser, Copernicus Data Space Ecosystem, European Space Agency (URL: https://dataspace.copernicus.eu/browser/).
Nishinoshima (Japan) — July 2023 Cite this Report
Nishinoshima
Japan
27.247°N, 140.874°E; summit elev. 100 m
All times are local (unless otherwise noted)
Small ash plumes and fumarolic activity during November 2022 through April 2023
Nishinoshima is a small island located about 1,000 km S of Tokyo in the Ogasawara Arc in Japan. The island is the summit of a massive submarine volcano that has prominent peaks to the S, W, and NE. Eruptions date back to 1973; the most recent eruption period began in October 2022 and was characterized by ash plumes and fumarolic activity (BGVN 47:12). This report describes ash plumes and fumarolic activity during November 2022 through April 2023 based on monthly reports from the Japan Meteorological Agency (JMA) monthly reports and satellite data.
The most recent eruptive activity prior to the reporting internal occurred on 12 October 2022, when an ash plume rose 3.5 km above the crater rim. An aerial observation conducted by the Japan Coast Guard (JCG) on 25 November reported that white fumaroles rose approximately 200 m above the central crater of a pyroclastic cone (figure 119), and multiple plumes were observed on the ESE flank of the cone. Discolored water ranging from reddish-brown to brown and yellowish-green were visible around the perimeter of the island (figure 119). No significant activity was reported in December.
During an overflight conducted by JCG on 25 January 2023 intermittent activity and small, blackish-gray plumes rose 900 m above the central part of the crater were observed (figure 120). The fumarolic zone of the E flank and base of the cone had expanded and emissions had intensified. Dark brown discolored water was visible around the perimeter of the island.
No significant activity was reported during February through March. Ash plumes at 1050 and 1420 on 11 April rose 1.9 km above the crater rim and drifted NW and N. These were the first ash plumes observed since 12 October 2022. On 14 April JCG carried out an overflight and reported that no further eruptive activity was visible, although white gas-and-steam plumes were visible from the central crater and rose 900 m high (figure 121). Brownish and yellow-green discolored water surrounded the island.
Intermittent low-to-moderate power thermal anomalies were recorded in the MIROVA graph (Middle InfraRed Observation of Volcanic Activity) during November 2022 through April 2023 (figure 123). A cluster of six to eight anomalies were detected during November while a smaller number were detected during the following months: two to three during December, one during mid-January 2023, one during February, five during March, and two during April. Thermal activity was also reflected in infrared satellite data at the summit crater, accompanied by occasional gas-and-steam plumes (figure 124).
Geologic Background. The small island of Nishinoshima was enlarged when several new islands coalesced during an eruption in 1973-74. Multiple eruptions that began in 2013 completely covered the previous exposed surface and continued to enlarge the island. The island is the summit of a massive submarine volcano that has prominent peaks to the S, W, and NE. The summit of the southern cone rises to within 214 m of the ocean surface 9 km SSE.
Information Contacts: Japan Meteorological Agency (JMA), 1-3-4 Otemachi, Chiyoda-ku, Tokyo 100-8122, Japan (URL: http://www.jma.go.jp/jma/indexe.html); MIROVA (Middle InfraRed Observation of Volcanic Activity), a collaborative project between the Universities of Turin and Florence (Italy) supported by the Centre for Volcanic Risk of the Italian Civil Protection Department (URL: http://www.mirovaweb.it/); Copernicus Browser, Copernicus Data Space Ecosystem, European Space Agency (URL: https://dataspace.copernicus.eu/browser/).
Karangetang (Indonesia) — July 2023 Cite this Report
Karangetang
Indonesia
2.781°N, 125.407°E; summit elev. 1797 m
All times are local (unless otherwise noted)
Lava flows, incandescent avalanches, and ash plumes during January-June 2023
Karangetang (also known as Api Siau), at the northern end of the island of Siau, Indonesia, contains five summit craters along a N-S line. More than 40 eruptions have been recorded since 1675; recent eruptions have included frequent explosive activity, sometimes accompanied by pyroclastic flows and lahars. Lava dome growth has occurred in the summit craters and collapses of lava flow fronts have produced pyroclastic flows. The two active summit craters are Kawah Dua (the N crater) and Kawah Utama (the S crater, also referred to as the “Main Crater”). The most recent eruption began in late November 2018 and has more recently consisted of weak thermal activity and gas-and-steam emissions (BGVN 48:01). This report updates activity characterized by lava flows, incandescent avalanches, and ash plumes during January through June 2023 using reports from Pusat Vulkanologi dan Mitigasi Bencana Geologi (PVMBG, also known as CVGHM, or the Center of Volcanology and Geological Hazard Mitigation), MAGMA Indonesia, the Darwin VAAC (Volcano Ash Advisory Center), and satellite data.
Activity during January was relatively low and mainly consisted of white gas-and-steam emissions that rose 25-150 m above Main Crater (S crater) and drifted in different directions. Incandescence was visible from the lava dome in Kawah Dua (the N crater). Weather conditions often prevented clear views of the summit. On 18 January the number of seismic signals that indicated avalanches of material began to increase. In addition, there were a total of 71 earthquakes detected during the month.
Activity continued to increase during the first week of February. Material from Main Crater traveled as far as 800 m down the Batuawang (S) and Batang (W) drainages and as far as 1 km W down the Beha (W) drainage on 4 February. On 6 February 43 earthquake events were recorded, and on 7 February, 62 events were recorded. White gas-and-steam emissions rose 25-250 m above both summit craters throughout the month. PVMBG reported an eruption began during the evening of 8 February around 1700. Photos showed incandescent material at Main Crater. Incandescent material had also descended the flank in at least two unconfirmed directions as far as 2 km from Main Crater, accompanied by ash plumes (figure 60). As a result, PVMBG increased the Volcano Alert Level (VAL) to 3 (the second highest level on a 1-4 scale).
Occasional nighttime webcam images showed three main incandescent lava flows of differing lengths traveling down the S, SW, and W flanks (figure 61). Incandescent rocks were visible on the upper flanks, possibly from ejected or collapsed material from the crater, and incandescence was the most intense at the summit. Based on analyses of satellite imagery and weather models, the Darwin VAAC reported that daily ash plumes during 16-20 February rose to 2.1-3 km altitude and drifted NNE, E, and SE. BNPB reported on 16 February that as many as 77 people were evacuated and relocated to the East Siau Museum. A webcam image taken at 2156 on 17 February possibly showed incandescent material descending the SE flank. Ash plumes rose to 2.1 km altitude and drifted SE during 22-23 February, according to the Darwin VAAC.
Incandescent avalanches of material and summit incandescence at Main Crater continued during March. White gas-and-steam emissions during March generally rose 25-150 m above the summit crater; on 31 March gas-and-steam emissions rose 200-400 m high. An ash plume rose to 2.4 km altitude and drifted S at 1710 on 9 March and a large thermal anomaly was visible in images taken at 0550 and 0930 on 10 March. Incandescent material was visible at the summit and on the flanks based on webcam images taken at 0007 and 2345 on 16 March, at 1828 on 17 March, at 1940 on 18 March, at 2311 on 19 March, and at 2351 on 20 March. Incandescence was most intense on 18 and 20 March and webcam images showed possible Strombolian explosions (figure 62). An ash plume rose to 2.4 km altitude and drifted SW on 18 March, accompanied by a thermal anomaly.
Summit crater incandescence at Main Crater and on the flanks persisted during April. Incandescent material at the S crater and on the flanks was reported at 0016 on 1 April. The lava flows had stopped by 1 April according to PVMBG, although incandescence was still visible up to 10 m high. Seismic signals indicating effusion decreased and by 6 April they were no longer detected. Incandescence was visible from both summit craters. On 26 April the VAL was lowered to 2 (the second lowest level on a 1-4 scale). White gas-and-steam emissions rose 25-200 m above the summit crater.
During May white gas-and-steam emissions generally rose 50-250 m above the summit, though it was often cloudy, which prevented clear views; on 21 May gas-and-steam emissions rose 50-400 m high. Nighttime N summit crater incandescence rose 10-25 m above the lava dome, and less intense incandescence was noted above Main Crater, which reached about 10 m above the dome. Sounds of falling rocks at Main Crater were heard on 15 May and the seismic network recorded 32 rockfall events in the crater on 17 May. Avalanches traveled as far as 1.5 km down the SW and S flanks, accompanied by rumbling sounds on 18 May. Incandescent material descending the flanks was captured in a webcam image at 2025 on 19 May (figure 63) and on 29 May; summit crater incandescence was observed in webcam images at 2332 on 26 May and at 2304 on 29 May. On 19 May the VAL was again raised to 3.
Occasional Main Crater incandescence was reported during June, as well as incandescent material on the flanks. White gas-and-steam emissions rose 10-200 m above the summit crater. Ash plumes rose to 2.1 km altitude and drifted SE and E during 2-4 June, according to the Darwin VAAC. Material on the flanks of Main Crater were observed at 2225 on 7 June, at 2051 on 9 June, at 0007 on 17 June, and at 0440 on 18 June. Webcam images taken on 21, 25, and 27 June showed incandescence at Main Crater and from material on the flanks.
MIROVA (Middle InfraRed Observation of Volcanic Activity) analysis of MODIS satellite data showed strong thermal activity during mid-February through March and mid-May through June, which represented incandescent avalanches and lava flows (figure 64). During April through mid-May the power of the anomalies decreased but frequent anomalies were still detected. Brief gaps in activity occurred during late March through early April and during mid-June. Infrared satellite images showed strong lava flows mainly affecting the SW and S flanks, accompanied by gas-and-steam emissions (figure 65). According to data recorded by the MODVOLC thermal algorithm, there were a total of 79 thermal hotspots detected: 28 during February, 24 during March, one during April, five during May, and 21 during June.
Geologic Background. Karangetang (Api Siau) volcano lies at the northern end of the island of Siau, about 125 km NNE of the NE-most point of Sulawesi. The stratovolcano contains five summit craters along a N-S line. It is one of Indonesia's most active volcanoes, with more than 40 eruptions recorded since 1675 and many additional small eruptions that were not documented (Neumann van Padang, 1951). Twentieth-century eruptions have included frequent explosive activity sometimes accompanied by pyroclastic flows and lahars. Lava dome growth has occurred in the summit craters; collapse of lava flow fronts have produced pyroclastic flows.
Information Contacts: Pusat Vulkanologi dan Mitigasi Bencana Geologi (PVMBG, also known as Indonesian Center for Volcanology and Geological Hazard Mitigation, CVGHM), Jalan Diponegoro 57, Bandung 40122, Indonesia (URL: http://www.vsi.esdm.go.id/); MAGMA Indonesia, Kementerian Energi dan Sumber Daya Mineral (URL: https://magma.esdm.go.id/v1); Badan Nasional Penanggulangan Bencana (BNPB), National Disaster Management Agency, Graha BNPB - Jl. Scout Kav.38, East Jakarta 13120, Indonesia (URL: http://www.bnpb.go.id/); Darwin Volcanic Ash Advisory Centre (VAAC), Bureau of Meteorology, Northern Territory Regional Office, PO Box 40050, Casuarina, NT 0811, Australia (URL: http://www.bom.gov.au/info/vaac/); MIROVA (Middle InfraRed Observation of Volcanic Activity), a collaborative project between the Universities of Turin and Florence (Italy) supported by the Centre for Volcanic Risk of the Italian Civil Protection Department (URL: http://www.mirovaweb.it/); Hawai'i Institute of Geophysics and Planetology (HIGP) - MODVOLC Thermal Alerts System, School of Ocean and Earth Science and Technology (SOEST), Univ. of Hawai'i, 2525 Correa Road, Honolulu, HI 96822, USA (URL: http://modis.higp.hawaii.edu/); Copernicus Browser, Copernicus Data Space Ecosystem, European Space Agency (URL: https://dataspace.copernicus.eu/browser/); IDN Times, Jl. Jend. Gatot Subroto Kav. 27 3rd Floor Kuningan, Jakarta, Indonesia 12950, Status of Karangetang Volcano in Sitaro Islands Increases (URL: https://sulsel.idntimes.com/news/indonesia/savi/status-gunung-api-karangetang-di-kepulauan-sitaro-meningkat?page=all).
Ahyi (United States) — July 2023 Cite this Report
Ahyi
United States
20.42°N, 145.03°E; summit elev. -75 m
All times are local (unless otherwise noted)
Intermittent hydroacoustic signals and discolored plumes during November 2022-June 2023
Ahyi seamount is a large, conical submarine volcano that rises to within 75 m of the ocean surface about 18 km SE of the island of Farallon de Pajaros in the Northern Marianas. The remote location of the seamount has made eruptions difficult to document, but seismic stations installed in the region confirmed an eruption in the vicinity in 2001. No new activity was detected until April-May 2014 when an eruption was detected by NOAA (National Oceanic and Atmospheric Administration) divers, hydroacoustic sensors, and seismic stations (BGVN 42:04). New activity was first detected on 15 November by hydroacoustic sensors that were consistent with submarine volcanic activity. This report covers activity during November 2022 through June 2023 based on daily and weekly reports from the US Geological Survey.
Starting in mid-October, hydroacoustic sensors at Wake Island (2.2 km E) recorded signals consistent with submarine volcanic activity, according to a report from the USGS issued on 15 November 2022. A combined analysis of the hydroacoustic signals and seismic stations located at Guam and Chichijima Island, Japan, suggested that the source of this activity was at or near the Ahyi seamount. After a re-analysis of a satellite image of the area that was captured on 6 November, USGS confirmed that there was no evidence of discoloration at the ocean surface. Few hydroacoustic and seismic signals continued through November, including on 18 November, which USGS suggested signified a decline or pause in unrest. A VONA (Volcano Observatory Notice for Aviation) reported that a discolored water plume was persistently visible in satellite data starting on 18 November (figure 6). Though clouds often obscured clear views of the volcano, another discolored water plume was captured in a satellite image on 26 November. The Aviation Color Code (ACC) was raised to Yellow (the second lowest level on a four-color scale) and the Volcano Alert Level (VAL) was raised to Advisory (the second lowest level on a four-level scale) on 29 November.
During December, occasional detections were recorded on the Wake Island hydrophone sensors and discolored water over the seamount remained visible. During 2-7, 10-12, and 16-31 December possible explosion signals were detected. A small area of discolored water was observed in high-resolution Sentinel-2 satellite images during 1-6 December (figure 7). High-resolution satellite images recorded discolored water plumes on 13 December that originated from the summit region; no observations indicated that activity breached the ocean surface. A possible underwater plume was visible in satellite images on 18 December, and during 19-20 December a definite but diffuse underwater plume located SSE from the main vent was reported. An underwater plume was visible in a satellite image taken on 26 December (figure 7).
Hydrophone sensors continued to detect signals consistent with possible explosions during 1-8 January 2023. USGS reported that the number of detections decreased during 4-5 January. The hydrophone sensors experienced a data outage that started at 0118 on 8 January and continued through 10 January, though according to USGS, possible explosions were recorded prior to the data outage and likely continued during the outage. A discolored water plume originating from the summit region was detected in a partly cloudy satellite image on 8 January. On 11-12 and 15-17 January possible explosion signals were recorded again. One small signal was detected during 22-23 January and several signals were recorded on 25 and 31 January. During 27-31 January a plume of discolored water was observed above the seamount in satellite imagery (figure 8).
Low levels of activity continued during February and March, based on data from pressure sensors on Wake Island. During 1 and 4-6 February activity was reported, and a submarine plume was observed on 4 February (figure 8). Possible explosion signals were detected during 7-8, 10, 13-14, and 24 February. During 1-2 and 3-5 March a plume of discolored water was observed in satellite imagery (figure 8). Almost continuous hydroacoustic signals were detected in remote pressure sensor data on Wake Island 2,270 km E from the volcano during 7-13 March. During 12-13 March water discoloration around the seamount was observed in satellite imagery, despite cloudy weather. By 14 March discolored water extended about 35 km, but no direction was noted. USGS reported that the continuous hydroacoustic signals detected during 13-14 March stopped abruptly on 14 March and no new detections were observed. Three 30 second hydroacoustic detections were reported during 17-19 March, but no activity was visible due to cloudy weather. A data outage was reported during 21-22 March, making pressure sensor data unavailable; a discolored water plume was, however, visible in satellite data. A possible underwater explosion signal was detected by pressure sensors at Wake Island on 26, 29, and 31 March, though the cause and origin of these events were unclear.
Similar low activity continued during April, May, and June. Several signals were detected during 1-3 April in pressure sensors at Wake Island. USGS suggested that these may be related to underwater explosions or earthquakes at the volcano, but no underwater plumes were visible in clear satellite images. The pressure sensors had data outages during 12-13 April and no data were recorded; no underwater plumes were visible in satellite images, although cloudy weather obscured most clear views. Eruptive activity was reported starting at 2210 on 21 May. On 22 May a discolored water plume that extended 4 km was visible in satellite images, though no direction was recorded. During 23-24 May some signals were detected by the underwater pressure sensors. Possible hydroacoustic signals were detected during 2-3 and 6-8 June. Multiple hydroacoustic signals were detected during 9-11 and 16-17 June, although no activity was visible in satellite images. One hydroacoustic signal was detected during 23-24 June, but there was some uncertainty about its association with volcanic activity. A single possible hydroacoustic signal was detected during 30 June to 1 July.
Geologic Background. Ahyi seamount is a large conical submarine volcano that rises to within 75 m of the ocean surface ~18 km SE of the island of Farallon de Pajaros in the northern Marianas. Water discoloration has been observed there, and in 1979 the crew of a fishing boat felt shocks over the summit area, followed by upwelling of sulfur-bearing water. On 24-25 April 2001 an explosive eruption was detected seismically by a station on Rangiroa Atoll, Tuamotu Archipelago. The event was well constrained (+/- 15 km) at a location near the southern base of Ahyi. An eruption in April-May 2014 was detected by NOAA divers, hydroacoustic sensors, and seismic stations.
Information Contacts: US Geological Survey, Volcano Hazards Program (USGS-VHP), 12201 Sunrise Valley Drive, Reston, VA, USA, https://volcanoes.usgs.gov/index.html; Copernicus Browser, Copernicus Data Space Ecosystem, European Space Agency (URL: https://dataspace.copernicus.eu/browser/).
Kadovar (Papua New Guinea) — June 2023 Cite this Report
Kadovar
Papua New Guinea
3.608°S, 144.588°E; summit elev. 365 m
All times are local (unless otherwise noted)
An ash plume and weak thermal anomaly during May 2023
Kadovar is a 2-km-wide island that is the emergent summit of a Bismarck Sea stratovolcano. It lies off the coast of New Guinea, about 25 km N of the mouth of the Sepik River. Prior to an eruption that began in 2018, a lava dome formed the high point of the volcano, filling an arcuate landslide scarp open to the S. Submarine debris-avalanche deposits occur to the S of the island. The current eruption began in January 2018 and has comprised lava effusion from vents at the summit and at the E coast; more recent activity has consisted of ash plumes, weak thermal activity, and gas-and-steam plumes (BGVN 48:02). This report covers activity during February through May 2023 using information from the Darwin Volcanic Ash Advisory Center (VAAC) and satellite data.
Activity during the reporting period was relatively low and mainly consisted of white gas-and-steam plumes that were visible in natural color satellite images on clear weather days (figure 67). According to a Darwin VAAC report, at 2040 on 6 May an ash plume rose to 4.6 km altitude and drifted W; by 2300 the plume had dissipated. MODIS satellite instruments using the MODVOLC thermal algorithm detected a single thermal hotspot on the SE side of the island on 7 May. Weak thermal activity was also detected in a satellite image on the E side of the island on 14 May, accompanied by a white gas-and-steam plume that drifted SE (figure 68).
Geologic Background. The 2-km-wide island of Kadovar is the emergent summit of a Bismarck Sea stratovolcano of Holocene age. It is part of the Schouten Islands, and lies off the coast of New Guinea, about 25 km N of the mouth of the Sepik River. Prior to an eruption that began in 2018, a lava dome formed the high point of the andesitic volcano, filling an arcuate landslide scarp open to the south; submarine debris-avalanche deposits occur in that direction. Thick lava flows with columnar jointing forms low cliffs along the coast. The youthful island lacks fringing or offshore reefs. A period of heightened thermal phenomena took place in 1976. An eruption began in January 2018 that included lava effusion from vents at the summit and at the E coast.
Information Contacts: Darwin Volcanic Ash Advisory Centre (VAAC), Bureau of Meteorology, Northern Territory Regional Office, PO Box 40050, Casuarina, NT 0811, Australia (URL: http://www.bom.gov.au/info/vaac/); Hawai'i Institute of Geophysics and Planetology (HIGP) - MODVOLC Thermal Alerts System, School of Ocean and Earth Science and Technology (SOEST), Univ. of Hawai'i, 2525 Correa Road, Honolulu, HI 96822, USA (URL: http://modis.higp.hawaii.edu/); Copernicus Browser, Copernicus Data Space Ecosystem, European Space Agency (URL: https://dataspace.copernicus.eu/browser/).
San Miguel (El Salvador) — June 2023 Cite this Report
San Miguel
El Salvador
13.434°N, 88.269°W; summit elev. 2130 m
All times are local (unless otherwise noted)
Small gas-and-ash explosions during March and May 2023
San Miguel in El Salvador is a broad, deep crater complex that has been frequently modified by eruptions recorded since the early 16th century and consists of the summit known locally as Chaparrastique. Flank eruptions have produced lava flows that extended to the N, NE, and SE during the 17-19th centuries. The most recent activity has consisted of minor ash eruptions from the summit crater. The current eruption period began in November 2022 and has been characterized by frequent phreatic explosions, gas-and-ash emissions, and sulfur dioxide plumes (BGVN 47:12). This report describes small gas-and-ash explosions during December 2022 through May 2023 based on special reports from the Ministero de Medio Ambiente y Recursos Naturales (MARN).
Activity has been relatively low since the last recorded explosions on 29 November 2022. Seismicity recorded by the San Miguel Volcano Station (VSM) located on the N flank at 1.7 km elevation had decreased by 7 December. Sulfur dioxide gas measurements taken with DOAS (Differential Optical Absorption Spectroscopy) mobile equipment were below typical previously recorded values: 300 tons per day (t/d). During December, small explosions were recorded by the seismic network and manifested as gas-and-steam emissions.
Gas-and-ash explosions in the crater occurred during January 2023, which were recorded by the seismic network. Sulfur dioxide values remained low, between 300-400 t/d through 10 March. At 0817 on 14 January a gas-and-ash emission was visible in webcam images, rising just above the crater rim. Some mornings during February, small gas-and-steam plumes were visible in the crater. On 7 March at 2252 MARN noted an increase in degassing from the central crater; gas emissions were constantly observed through the early morning hours on 8 March. During the early morning of 8 March through the afternoon on 9 March, 12 emissions were registered, some accompanied by ash. The last gas-and-ash emission was recorded at 1210 on 9 March; very fine ashfall was reported in El Tránsito (10 km S), La Morita (6 km W), and La Piedrita (3 km W). The smell of sulfur was reported in Piedra Azul (5 km SW). On 16 March MARN reported that gas-and-steam emissions decreased.
Low degassing and very low seismicity were reported during April; no explosions have been detected between 9 March and 27 May. The sulfur dioxide emissions remained between 350-400 t/d; during 13-20 April sulfur dioxide values fluctuated between 30-300 t/d. Activity remained low through most of May; on 23 May seismicity increased. An explosion was detected at 1647 on 27 May generated a gas-and-ash plume that rose 700 m high (figure 32); a decrease in seismicity and gas emissions followed. The DOAS station installed on the W flank recorded sulfur dioxide values that reached 400 t/d on 27 May; subsequent measurements showed a decrease to 268 t/d on 28 May and 100 t/d on 29 May.
Geologic Background. The symmetrical cone of San Miguel, one of the most active volcanoes in El Salvador, rises from near sea level to form one of the country's most prominent landmarks. A broad, deep, crater complex that has been frequently modified by eruptions recorded since the early 16th century caps the truncated unvegetated summit, also known locally as Chaparrastique. Flanks eruptions of the basaltic-andesitic volcano have produced many lava flows, including several during the 17th-19th centuries that extended to the N, NE, and SE. The SE-flank flows are the largest and form broad, sparsely vegetated lava fields crossed by highways and a railroad skirting the base of the volcano. Flank vent locations have migrated higher on the edifice during historical time, and the most recent activity has consisted of minor ash eruptions from the summit crater.
Information Contacts: Ministero de Medio Ambiente y Recursos Naturales (MARN), Km. 5½ Carretera a Nueva San Salvador, Avenida las Mercedes, San Salvador, El Salvador (URL: http://www.snet.gob.sv/ver/vulcanologia).
Semisopochnoi (United States) — June 2023 Cite this Report
Semisopochnoi
United States
51.93°N, 179.58°E; summit elev. 1221 m
All times are local (unless otherwise noted)
Occasional explosions, ash deposits, and gas-and-steam plumes during December 2022-May 2023
Semisopochnoi is located in the western Aleutians, is 20-km-wide at sea level, and contains an 8-km-wide caldera. The three-peaked Mount Young (formerly Cerberus) was constructed within the caldera during the Holocene. Each of these peaks contains a summit crater; the lava flows on the N flank appear younger than those on the S side. The current eruption period began in early February 2021 and has more recently consisted of intermittent explosions and ash emissions (BGVN 47:12). This report updates activity during December 2022 through May 2023 using daily, weekly, and special reports from the Alaska Volcano Observatory (AVO). AVO monitors the volcano using local seismic and infrasound sensors, satellite data, web cameras, and remote infrasound and lightning networks.
Activity during most of December 2022 was relatively quiet; according to AVO no eruptive or explosive activity was observed since 7 November 2022. Intermittent tremor and occasional small earthquakes were observed in geophysical data. Continuous gas-and-steam emissions were observed from the N crater of Mount Young in webcam images on clear weather days (figure 25). On 24 December, there was a slight increase in earthquake activity and several small possible explosion signals were detected in infrasound data. Eruptive activity resumed on 27 December at the N crater of Mount Young; AVO issued a Volcano Activity Notice (VAN) that reported minor ash deposits on the flanks of Mount Young that extended as far as 1 km from the vent, according to webcam images taken during 27-28 December (figure 26). No ash plumes were observed in webcam or satellite imagery, but a persistent gas-and-steam plume that might have contained some ash rose to 1.5 km altitude. As a result, AVO raised the Aviation Color Code (ACC) to Orange (the second highest level on a four-color scale) and the Volcano Alert Level (VAL) to Watch (the second highest level on a four-level scale). Possible explosions were detected during 21 December 2022 through 1 January 2023 and seismic tremor was recorded during 30-31 December.
During January 2023 eruptive activity continued at the active N crater of Mount Young. Minor ash deposits were observed on the flanks, extending about 2 km SSW, based on webcam images from 1 and 3 January. A possible explosion occurred during 1-2 January based on elevated seismicity recorded on local seismometers and an infrasound signal recorded minutes later by an array at Adak. Though no ash plumes were observed in webcam or satellite imagery, a persistent gas-and-steam plume rose to 1.5 km altitude that might have carried minor traces of ash. Ash deposits were accompanied by periods of elevated seismicity and infrasound signals from the local geophysical network, which AVO reported were likely due to weak explosive activity. Low-level explosive activity was also detected during 2-3 January, with minor gas-and-steam emissions and a new ash deposit that was visible in webcam images. Low-level explosive activity was detected in geophysical data during 4-5 January, with elevated seismicity and infrasound signals observed on local stations. Volcanic tremor was detected during 7-9 January and very weak explosive activity was detected in seismic and infrasound data on 9 January. Weak seismic and infrasound signals were recorded on 17 January, which indicated minor explosive activity, but no ash emissions were observed in clear webcam images; a gas-and-steam plume continued to rise to 1.5 km altitude. During 29-30 January, ash deposits near the summit were observed on fresh snow, according to webcam images.
The active N cone at Mount Young continued to produce a gas-and-steam plume during February, but no ash emissions or explosive events were detected. Seismicity remained elevated with faint tremor during early February. Gas-and-steam emissions from the N crater were observed in clear webcam images on 11-13 and 16 February; no explosive activity was detected in seismic, infrasound, or satellite data. Seismicity has also decreased, with no significant seismic tremor observed since 25 January. Therefore, the ACC was lowered to Yellow (the second lowest level on a four-color scale) and the VAL was lowered to Advisory (the second lowest level on a four-color scale) on 22 February.
Gas-and-steam emissions persisted during March from the N cone of Mount Young, based on clear webcam images. A few brief episodes of weak tremor were detected in seismic data, although seismicity decreased over the month. A gas-and-steam plume detected in satellite data extended 150 km on 18 March. Low-level ash emissions from the N cone at Mount Young were observed in several webcam images during 18-19 March, in addition to small explosions and volcanic tremor. The ACC was raised to Orange and the VAL increased to Watch on 19 March. A small explosion was detected in seismic and infrasound data on 21 March.
Low-level unrest continued during April, although cloudy weather often obscured views of the summit; periods of seismic tremor and local earthquakes were recorded. During 3-4 April a gas-and-steam plume was visible traveling more than 200 km overnight; no ash was evident in the plume, according to AVO. A gas-and-steam plume was observed during 4-6 April that extended 400 km but did not seem to contain ash. Small explosions were detected in seismic and infrasound data on 5 April. Occasional clear webcam images showed continuing gas-and-steam emissions rose from Mount Young, but no ash deposits were observed on the snow. On 19 April small explosions and tremor were detected in seismic and infrasound data. A period of seismic tremor was detected during 22-25 April, with possible weak explosions on 25 April. Ash deposits were visible near the crater rim, but it was unclear if these deposits were recent or due to older deposits.
Occasional small earthquakes were recorded during May, but there were no signs of explosive activity seen in geophysical data. Gas-and-steam emissions continued from the N crater of Mount Young, based on webcam images, and seismicity remained slightly elevated. A new, light ash deposit was visible during the morning of 5 May on fresh snow on the NW flank of Mount Young. During 10 May periods of volcanic tremor were observed. The ACC was lowered to Yellow and the VAL to Advisory on 17 May due to no additional evidence of activity.
Geologic Background. Semisopochnoi, the largest subaerial volcano of the western Aleutians, is 20 km wide at sea level and contains an 8-km-wide caldera. It formed as a result of collapse of a low-angle, dominantly basaltic volcano following the eruption of a large volume of dacitic pumice. The high point of the island is Anvil Peak, a double-peaked late-Pleistocene cone that forms much of the island's northern part. The three-peaked Mount Cerberus (renamed Mount Young in 2023) was constructed within the caldera during the Holocene. Each of the peaks contains a summit crater; lava flows on the N flank appear younger than those on the south side. Other post-caldera volcanoes include the symmetrical Sugarloaf Peak SSE of the caldera and Lakeshore Cone, a small cinder cone at the edge of Fenner Lake in the NE part of the caldera. Most documented eruptions have originated from Young, although Coats (1950) considered that both Sugarloaf and Lakeshore Cone could have been recently active.
Information Contacts: Alaska Volcano Observatory (AVO), a cooperative program of a) U.S. Geological Survey, 4200 University Drive, Anchorage, AK 99508-4667 USA (URL: https://avo.alaska.edu/), b) Geophysical Institute, University of Alaska, PO Box 757320, Fairbanks, AK 99775-7320, USA, and c) Alaska Division of Geological & Geophysical Surveys, 794 University Ave., Suite 200, Fairbanks, AK 99709, USA (URL: http://dggs.alaska.gov/).
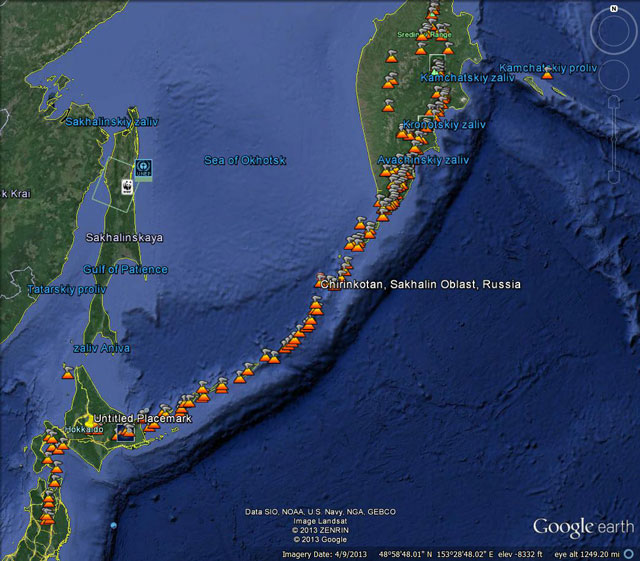
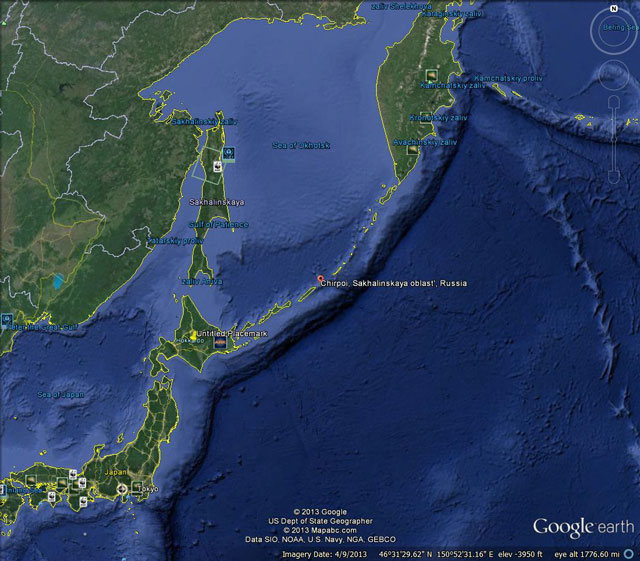
Ebeko
Russia
50.686°N, 156.014°E; summit elev. 1103 m
All times are local (unless otherwise noted)
Continued explosions, ash plumes, and ashfall during October 2022-May 2023
Ebeko, located on the N end of Paramushir Island in the Kuril Islands, consists of three summit craters along a SSW-NNE line at the northern end of a complex of five volcanic cones. Eruptions date back to the late 18th century and have been characterized as small-to-moderate explosions from the summit crater, accompanied by intense fumarolic activity. The current eruption period began in June 2022 and has recently consisted of frequent explosions, ash plumes, and thermal activity (BGVN 47:10). This report covers similar activity during October 2022 through May 2023, based on information from the Kamchatka Volcanic Eruptions Response Team (KVERT) and satellite data.
Activity during October consisted of explosive activity, ash plumes, and occasional thermal anomalies. Visual data by volcanologists from Severo-Kurilsk showed explosions producing ash clouds up to 2.1-3 km altitude which drifted E, N, NE, and SE during 1-8, 10, 16, and 18 October. KVERT issued several Volcano Observatory Notices for Aviation (VONA) on 7, 13-15, and 27 October 2022, stating that explosions generated ash plumes that rose to 2.3-4 km altitude and drifted 5 km E, NE, and SE. Ashfall was reported in Severo-Kurilsk (Paramushir Island, about 7 km E) on 7 and 13 October. Satellite data showed a thermal anomaly over the volcano on 15-16 October. Visual data showed ash plumes rising to 2.5-3.6 km altitude on 22, 25-29, and 31 October and moving NE due to constant explosions.
Similar activity continued during November, with explosions, ash plumes, and ashfall occurring. KVERT issued VONAs on 1-2, 4, 6-7, 9, 13, and 16 November that reported explosions and resulting ash plumes that rose to 1.7-3.6 km altitude and drifted 3-5 km SE, ESE, E, and NE. On 1 November ash plumes extended as far as 110 km SE. On 5, 8, 12, and 24-25 November explosions and ash plumes rose to 2-3.1 km altitude and drifted N and E. Ashfall was observed in Severo-Kurilsk on 7 and 16 November. A thermal anomaly was visible during 1-4, 16, and 20 November. Explosions during 26 November rose as high as 2.7 km altitude and drifted NE (figure 45).
Explosions and ash plumes continued to occur in December. During 1-2 and 4 December volcanologists from Severo-Kurilsk observed explosions that sent ash to 1.9-2.5 km altitude and drifted NE and SE (figure 46). VONAs were issued on 5, 9, and 16 December reporting that explosions generated ash plumes rising to 1.9 km, 2.6 km, and 2.4 km altitude and drifted 5 km SE, E, and NE, respectively. A thermal anomaly was visible in satellite imagery on 16 December. On 18 and 27-28 December explosions produced ash plumes that rose to 2.5 km altitude and drifted NE and SE. On 31 December an ash plume rose to 2 km altitude and drifted NE.
Explosions continued during January 2023, based on visual observations by volcanologists from Severo-Kurilsk. During 1-7 January explosions generated ash plumes that rose to 4 km altitude and drifted NE, E, W, and SE. According to VONAs issued by KVERT on 2, 4, 10, and 23 January, explosions produced ash plumes that rose to 2-4 km altitude and drifted 5 km N, NE, E, and ENE; the ash plume that rose to 4 km altitude occurred on 10 January (figure 47). Satellite data showed a thermal anomaly during 3-4, 10, 13, 16, 21, 22, and 31 January. KVERT reported that an ash cloud on 4 January moved 12 km NE. On 6 and 9-11 January explosions sent ash plumes to 4.5 km altitude and drifted W and ESE. On 13 January an ash plume rose to 3 km altitude and drifted SE. During 20-24 January ash plumes from explosions rose to 3.7 km altitude and drifted SE, N, and NE. On 21 January the ash plume drifted as far as 40 km NE. During 28-29 and 31 January and 1 February ash plumes rose to 4 km altitude and drifted NE.
During February, explosions, ash plumes, and ashfall were reported. During 1, 4-5 and 7-8 February explosions generated ash plumes that rose to 4.5 km altitude and drifted E and NE; ashfall was observed on 5 and 8 February. On 6 February an explosion produced an ash plume that rose to 3 km altitude and drifted 7 km E, causing ashfall in Severo-Kurilsk. A thermal anomaly was visible in satellite data on 8, 9, 13, and 21 February. Explosions on 9 and 12-13 February produced ash plumes that rose to 4 km altitude and drifted E and NE; the ash cloud on 12 February extended as far as 45 km E. On 22 February explosions sent ash to 3 km altitude that drifted E. During 24 and 26-27 February ash plumes rose to 4 km altitude and drifted E. On 28 February an explosion sent ash to 2.5-3 km altitude and drifted 5 km E; ashfall was observed in Severo-Kurilsk.
Activity continued during March; visual observations showed that explosions generated ash plumes that rose to 3.6 km altitude on 3, 5-7, and 9-12 March and drifted E, NE, and NW. Thermal anomalies were visible on 10, 13, and 29-30 March in satellite imagery. On 18, 21-23, 26, and 29-30 March explosions produced ash plumes that rose to 2.8 km altitude and drifted NE and E; the ash plumes during 22-23 March extended up to 76 km E. A VONA issued on 21 March reported an explosion that produced an ash plume that rose to 2.8 km altitude and drifted 5 km E. Another VONA issued on 23 March reported that satellite data showed an ash plume rising to 3 km altitude and drifted 14 km E.
Explosions during April continued to generate ash plumes. On 1 and 4 April an ash plume rose to 2.8-3.5 km altitude and drifted SE and NE. A thermal anomaly was visible in satellite imagery during 1-6 April. Satellite data showed ash plumes and clouds rising to 2-3 km altitude and drifting up to 12 km SW and E on 3 and 6 April (figure 48). KVERT issued VONAs on 3, 5, 14, 16 April describing explosions that produced ash plumes rising to 3 km, 3.5 km, 3.5 km, and 3 km altitude and drifting 5 km S, 5 km NE and SE, 72 km NNE, and 5 km NE, respectively. According to satellite data, the resulting ash cloud from the explosion on 14 April was 25 x 7 km in size and drifted 72-104 km NNE during 14-15 April. According to visual data by volcanologists from Severo-Kurilsk explosions sent ash up to 3.5 km altitude that drifted NE and E during 15-16, 22, 25-26, and 29 April.
The explosive eruption continued during May. Explosions during 3-4, 6-7, and 9-10 May generated ash plumes that rose to 4 km altitude and drifted SW and E. Satellite data showed a thermal anomaly on 3, 9, 13-14, and 24 May. During 12-16, 23-25, and 27-28 May ash plumes rose to 3.5 km altitude and drifted in different directions due to explosions. Two VONA notices were issued on 16 and 25 May, describing explosions that generated ash plumes rising to 3 km and 3.5 km altitude, respectively and extending 5 km E. The ash cloud on 25 May drifted 75 km SE.
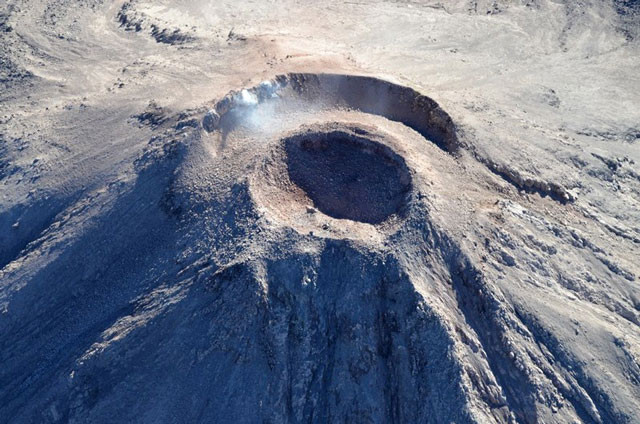
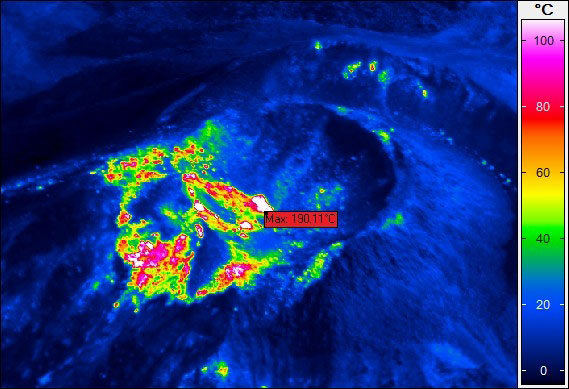
Thermal activity in the summit crater, occasionally accompanied by ash plumes and ash deposits on the SE and E flanks due to frequent explosions, were visible in infrared and true color satellite images (figure 49).
Geologic Background. The flat-topped summit of the central cone of Ebeko volcano, one of the most active in the Kuril Islands, occupies the northern end of Paramushir Island. Three summit craters located along a SSW-NNE line form Ebeko volcano proper, at the northern end of a complex of five volcanic cones. Blocky lava flows extend west from Ebeko and SE from the neighboring Nezametnyi cone. The eastern part of the southern crater contains strong solfataras and a large boiling spring. The central crater is filled by a lake about 20 m deep whose shores are lined with steaming solfataras; the northern crater lies across a narrow, low barrier from the central crater and contains a small, cold crescentic lake. Historical activity, recorded since the late-18th century, has been restricted to small-to-moderate explosive eruptions from the summit craters. Intense fumarolic activity occurs in the summit craters, on the outer flanks of the cone, and in lateral explosion craters.
Information Contacts: Kamchatka Volcanic Eruptions Response Team (KVERT), Far Eastern Branch, Russian Academy of Sciences, 9 Piip Blvd., Petropavlovsk-Kamchatsky, 683006, Russia (URL: http://www.kscnet.ru/ivs/kvert/); MIROVA (Middle InfraRed Observation of Volcanic Activity), a collaborative project between the Universities of Turin and Florence (Italy) supported by the Centre for Volcanic Risk of the Italian Civil Protection Department (URL: http://www.mirovaweb.it/); Copernicus Browser, Copernicus Data Space Ecosystem, European Space Agency (URL: https://dataspace.copernicus.eu/browser/).
Home Reef
Tonga
18.992°S, 174.775°W; summit elev. -10 m
All times are local (unless otherwise noted)
Discolored plumes continued during November 2022-April 2023
Home Reef is a submarine volcano located in the central Tonga islands between Lateiki (Metis Shoal) and Late Island. The first recorded eruption occurred in the mid-19th century, when an ephemeral island formed. An eruption in 1984 produced a 12-km-high eruption plume, a large volume of floating pumice, and an ephemeral island 500 x 1,500 m wide, with cliffs 30-50 m high that enclosed a water-filled crater. Another island-forming eruption in 2006 produced widespread pumice rafts that drifted as far as Australia; by 2008 the island had eroded below sea level. The previous eruption occurred during October 2022 and was characterized by a new island-forming eruption, lava effusion, ash plumes, discolored water, and gas-and-steam plumes (BGVN 47:11). This report covers discolored water plumes during November 2022 through April 2023 using satellite data.
Discolored plumes continued during the reporting period and were observed in true color satellite images on clear weather days. Satellite images show light green-yellow discolored water extending W on 8 and 28 November 2022 (figure 31), and SW on 18 November. Light green-yellow plumes extended W on 3 December, S on 13 December, SW on 18 December, and W and S on 23 December (figure 31). On 12 January 2023 discolored green-yellow plumes extended to the NE, E, SE, and N. The plume moved SE on 17 January and NW on 22 January. Faint discolored water in February was visible moving NE on 1 February. A discolored plume extended NW on 8 and 28 March and NW on 13 March (figure 31). During April, clear weather showed green-blue discolored plumes moving S on 2 April, W on 7 April, and NE and S on 12 April. A strong green-yellow discolored plume extended E and NE on 22 April for several kilometers (figure 31).
Geologic Background. Home Reef, a submarine volcano midway between Metis Shoal and Late Island in the central Tonga islands, was first reported active in the mid-19th century, when an ephemeral island formed. An eruption in 1984 produced a 12-km-high eruption plume, large amounts of floating pumice, and an ephemeral 500 x 1,500 m island, with cliffs 30-50 m high that enclosed a water-filled crater. In 2006 an island-forming eruption produced widespread dacitic pumice rafts that drifted as far as Australia. Another island was built during a September-October 2022 eruption.
Information Contacts: Copernicus Browser, Copernicus Data Space Ecosystem, European Space Agency (URL: https://dataspace.copernicus.eu/browser/).
Ambae
Vanuatu
15.389°S, 167.835°E; summit elev. 1496 m
All times are local (unless otherwise noted)
New lava flow, ash plumes, and sulfur dioxide plumes during February-May 2023
Ambae, also known as Aoba, is a large basaltic shield volcano in Vanuatu. A broad pyroclastic cone containing three crater lakes (Manaro Ngoru, Voui, and Manaro Lakua) is located at the summit within the youngest of at least two nested calderas. Periodic phreatic and pyroclastic explosions have been reported since the 16th century. A large eruption more than 400 years ago resulted in a volcanic cone within the summit crater that is now filled by Lake Voui; the similarly sized Lake Manaro fills the western third of the caldera. The previous eruption ended in August 2022 that was characterized by gas-and-steam and ash emissions and explosions of wet tephra (BGVN 47:10). This report covers a new eruption during February through May 2023 that consisted of a new lava flow, ash plumes, and sulfur dioxide emissions, using information from the Vanuatu Meteorology and Geo-Hazards Department (VMGD) and satellite data.
During the reporting period, the Alert Level remained at a 2 (on a scale of 0-5), which has been in place since December 2021. Activity during October 2022 through March 2023 remained relatively low and mostly consisted of gas-and-steam emissions in Lake Voui. VMGD reported that at 1300 on 15 November a satellite image captured a strong amount of sulfur dioxide rising above the volcano (figure 99), and that seismicity slightly increased. The southern and northern part of the island reported a strong sulfur dioxide smell and heard explosions. On 20 February 2023 a gas-and-ash plume rose 1.3 km above the summit and drifted SSW, according to a webcam image (figure 100). Gas-and-steam and possibly ash emissions continued on 23 February and volcanic earthquakes were recorded by the seismic network.
During April, volcanic earthquakes and gas-and-steam and ash emissions were reported from the cone in Lake Voui. VMGD reported that activity increased during 5-7 April; high gas-and-steam and ash plumes were visible, accompanied by nighttime incandescence. According to a Wellington VAAC report, a low-level ash plume rose as high as 2.5 km above the summit and drifted W and SW on 5 April, based on satellite imagery. Reports in Saratamata stated that a dark ash plume drifted to the WSW, but no loud explosion was heard. Webcam images from 2100 showed incandescence above the crater and reflected in the clouds. According to an aerial survey, field observations, and satellite data, water was no longer present in the lake. A lava flow was reported effusing from the vent and traveling N into the dry Lake Voui, which lasted three days. The next morning at 0745 on 6 April a gas-and-steam and ash plume rose 5.4 km above the summit and drifted ESE, based on information from VMGD (figure 101). The Wellington VAAC also reported that light ashfall was observed on the island. Intermittent gas-and-steam and ash emissions were visible on 7 April, some of which rose to an estimated 3 km above the summit and drifted E. Webcam images during 0107-0730 on 7 April showed continuing ash emissions. A gas-and-steam and ash plume rose 695 m above the summit crater at 0730 on 19 April and drifted ESE, based on a webcam image (figure 102).
According to visual and infrared satellite data, water was visible in Lake Voui as late as 24 March 2023 (figure 103). The vent in the caldera showed a gas-and-steam plume drifted SE. On 3 April thermal activity was first detected, accompanied by a gas-and-ash plume that drifted W (figure 103). The lava flow moved N within the dry lake and was shown cooling by 8 April. By 23 April much of the water in the lake had returned. Occasional sulfur dioxide plumes were detected by the TROPOMI instrument on the Sentinel-5P satellite that exceeded 2 Dobson Units (DU) and drifted in different directions (figure 104).
Geologic Background. The island of Ambae, also known as Aoba, is a massive 2,500 km3 basaltic shield that is the most voluminous volcano of the New Hebrides archipelago. A pronounced NE-SW-trending rift zone with numerous scoria cones gives the 16 x 38 km island an elongated form. A broad pyroclastic cone containing three crater lakes (Manaro Ngoru, Voui, and Manaro Lakua) is located at the summit within the youngest of at least two nested calderas, the largest of which is 6 km in diameter. That large central edifice is also called Manaro Voui or Lombenben volcano. Post-caldera explosive eruptions formed the summit craters about 360 years ago. A tuff cone was constructed within Lake Voui (or Vui) about 60 years later. The latest known flank eruption, about 300 years ago, destroyed the population of the Nduindui area near the western coast.
Information Contacts: Geo-Hazards Division, Vanuatu Meteorology and Geo-Hazards Department (VMGD), Ministry of Climate Change Adaptation, Meteorology, Geo-Hazards, Energy, Environment and Disaster Management, Private Mail Bag 9054, Lini Highway, Port Vila, Vanuatu (URL: http://www.vmgd.gov.vu/, https://www.facebook.com/VanuatuGeohazardsObservatory/); Wellington Volcanic Ash Advisory Centre (VAAC), Meteorological Service of New Zealand Ltd (MetService), PO Box 722, Wellington, New Zealand (URL: http://www.metservice.com/vaac/, http://www.ssd.noaa.gov/VAAC/OTH/NZ/messages.html); MIROVA (Middle InfraRed Observation of Volcanic Activity), a collaborative project between the Universities of Turin and Florence (Italy) supported by the Centre for Volcanic Risk of the Italian Civil Protection Department (URL: http://www.mirovaweb.it/); Global Sulfur Dioxide Monitoring Page, Atmospheric Chemistry and Dynamics Laboratory, NASA Goddard Space Flight Center (NASA/GSFC), 8800 Greenbelt Road, Goddard, Maryland, USA (URL: https://so2.gsfc.nasa.gov/); Copernicus Browser, Copernicus Data Space Ecosystem, European Space Agency (URL: https://dataspace.copernicus.eu/browser/).
Search Bulletin Archive by Publication Date
Select a month and year from the drop-downs and click "Show Issue" to have that issue displayed in this tab.
The default month and year is the latest issue available.
Bulletin of the Global Volcanism Network - Volume 38, Number 12 (December 2013)
Managing Editor: Richard Wunderman
Chirinkotan (Russia)
Gas-and-steam emissions and occasional thermal anomalies, beginning May 2013
Chirpoi (Russia)
Periodic steam-and-gas emissions and thermal anomalies, November 2012-April 2014
Colima (Mexico)
Episode of lava effusion following the January 2013 sequence of explosions
Hudson, Cerro (Chile)
October 2011 earthquakes and eruption with ash, causing evacuation
Karthala (Comoros)
Increased nighttime incandescence during 9-10 May 2012
Mauna Kea (United States)
In repose; background conditions and hazards
San Cristobal (Nicaragua)
Explosions on 7 June 2013; gas-and-ash emissions in early 2014
Stromboli (Italy)
Small-to-moderate eruptions continue through February 2013
Chirinkotan (Russia) — December 2013 Cite this Report
Chirinkotan
Russia
48.98°N, 153.48°E; summit elev. 724 m
All times are local (unless otherwise noted)
Gas-and-steam emissions and occasional thermal anomalies, beginning May 2013
In 1979-1980, an eruption at Chirinkotan included a series of ash explosions and a lava flow (SEAN 05:06). In October and November 1986, airborne observers saw a column of thick gas and ash, and then fumarolic activity (SEAN 12:04). This report discusses events during 2013 through April 2014. The location of Chirinkotan in the Kuril Islands is shown in figure 1.
According to the Sakhalin Volcanic Eruption Response Team (SVERT), gas-and-steam emissions occurred frequently in 2013-2014 (table 1). The Aviation Color Code was Green on 24-25 May 2013, when emissions were first reported, but raised to Yellow during early June 2013, where it has remained through April 2014, the end of this report. The volcano was often obscured by clouds.
According to the U.S. Geological Survey, an M 8.3 earthquake occurred on 24 May 2013 beneath the Sea of Okhotsk, at a point is 656 km N of the volcano. The focal depth of the earthquake was ~ 600 km. The first reported gas-and-steam emission from Chirinkotan, which is in the Sea of Okhotsk, was on 24-25 May, suggesting a possible link between the two events.
Table 1. SVERT-reported dates on which gas-and-steam emissions were observed from 24 May 2013 through 30 April 2014, based on analysis of satellite images. Thermal alerts detected by SVERT and the MODVOLC satellite thermal alert system are also noted.
| Date |
Comments |
| 24-25 May 2013 |
Gas-and-steam emissions |
| 05, 07, 09 Jun |
Gas-and-steam emissions |
| 11 Jun |
Strong gas-and-steam emission, possibly with ash |
| 13 Jun |
SVERT-reported thermal alert |
| 16 Jun |
Gas-and-steam emissions |
| 21 Jun |
SVERT-reported thermal alert |
| 23 Jun |
Gas-and-steam emissions |
| 03 Jul |
Gas-and-steam emissions |
| 04 Jul |
SVERT-reported thermal alert |
| 12 Jul |
Gas-and-steam emissions and SVERT-reported thermal alert on 12-13 Jul |
| 16, 18 Jul |
Gas-and-steam emissions and SVERT-reported thermal alert |
| 22 Jul |
MODVOLC thermal alert and SVERT-reported thermal alert |
| 25 Jul |
Gas-and-steam emissions |
| 29-31 Jul |
SVERT-reported thermal alert |
| 02 Aug |
MODVOLC thermal alert |
| 05-09 Aug |
Gas-and-steam emissions and SVERT-reported thermal alerts on 5, 7, and 9 Aug |
| 12 Aug |
SVERT-reported thermal alert |
| 01 Sep |
MODVOLC thermal alert (twice) and SVERT-reported thermal alert |
| 28 Sep |
MODVOLC thermal alert |
| 04 Oct |
MODVOLC thermal alert (3 pixels) |
| 17-19 Oct |
Gas-and-steam emissions drifted 30-60 km SE and SVERT-reported thermal alert |
| 21-25 Oct |
Gas-and-steam emissions and SVERT-reported thermal alert on 24 Oct |
| 29-31 Oct |
Gas-and-steam emissions and SVERT-reported thermal alert |
| 04 Nov |
MODVOLC thermal alert (2 pixels) and SVERT-reported thermal alert |
| 05-06 Nov |
Gas-and-steam emissions drifted 55-100 km SE and SVERT-reported thermal alerts |
| 11 Nov |
MODVOLC thermal alert (2 pixels) |
| 13 Nov |
MODVOLC thermal alert (2 times) and SVERT-reported thermal alert |
| 14-15 Nov |
Gas-and-steam emissions and SVERT-reported thermal alert |
| 22 Nov |
SVERT-reported thermal alert |
| 25 Nov |
Gas-and-steam emissions drifted more than 50 km SE |
| 27 Nov |
MODVOLC thermal alert |
| 01 Dec |
MODVOLC thermal alert (4 pixels) |
| 02-04, 9 Dec |
SVERT-reported thermal alerts |
| 11 Dec |
MODVOLC thermal alert |
| 12, 15 Dec |
SVERT-reported thermal alerts |
| 18 Dec |
Gas-and-steam emissions |
| 25-26 Dec |
SVERT-reported thermal alert |
| 09, 12, 15 Jan 2014 |
SVERT-reported thermal alert |
| 17 Jan |
Gas-and-steam emissions and SVERT-reported thermal alert |
| 21 Jan |
SVERT-reported thermal alert |
| 08 Feb |
MODVOLC thermal alert and SVERT-reported thermal alert |
| 09 Feb |
Gas-and-steam emissions |
| 12, 15 Feb |
SVERT-reported thermal alerts |
| 16 Feb |
Gas-and-steam emissions |
| 20, 25 Feb |
SVERT-reported thermal alert |
| 27 Feb |
Gas-and-steam emissions |
| 04 Mar |
SVERT-reported thermal alert |
| 07 Mar |
MODVOLC thermal alert |
| 08 Mar |
MODVOLC thermal alert (2 times, 3 pixels on Terra satellite) |
| 12 Mar |
Gas-and-steam emissions drifted 80 km SE and MODVOLC thermal alert |
| 17 Mar |
MODVOLC thermal alert |
| 20 Mar |
Gas-and-steam emissions drifted 80 km SE |
| 21-24 Mar |
Gas-and-steam emissions |
| 26 Mar |
Gas-and-steam emissions drifted 80 km SE |
| 27 Mar |
Gas-and-steam emissions drifted 170 km SE |
| 09 Apr |
Gas-and-steam emissions drifted 170 km SE |
| 14, 15, 17 Apr |
SVERT-reported thermal alert |
| 20, 25, 27 Apr |
Gas-and-steam emissions |
| 29 Apr |
SVERT-reported thermal alert |
Geologic Background. The small, mostly unvegetated 3-km-wide island of Chirinkotan occupies the far end of an E-W volcanic chain that extends nearly 50 km W of the central part of the main Kuril Islands arc. It is the emergent summit of a volcano that rises 3000 m from the floor of the Kuril Basin. A small 1-km-wide caldera about 300-400 m deep is open to the SW. Lava flows from a cone within the breached crater reached the shore of the island. Historical eruptions have been recorded since the 18th century. Lava flows were observed by the English fur trader Captain Snow in the 1880s.
Information Contacts: Sakhalin Volcanic Eruption Response Team (SVERT) (URL in English: http://www.imgg.ru/?id_d=659); Hawai'i Institute of Geophysics and Planetology (HIGP), MODVOLC Thermal Alerts System, School of Ocean and Earth Science and Technology (SOEST), Univ. of Hawai'i, 2525 Correa Road, Honolulu, HI 96822, USA (URL: http://modis.higp.hawaii.edu/); and Earthquake Hazards Program, US Geological Survey (URL: http://earthquake.usgs.gov/).
Chirpoi (Russia) — December 2013 Cite this Report
Chirpoi
Russia
46.532°N, 150.871°E; summit elev. 742 m
All times are local (unless otherwise noted)
Periodic steam-and-gas emissions and thermal anomalies, November 2012-April 2014
On 6 November 1986, weak fumarolic activity was observed during an aerial survey (SEAN 12:04). The Sakhalin Volcanic Eruption Response Team (SVERT) noted that emissions were again observed in November 2012. This report covers steam-and-gas plumes and emissions and thermal alerts between 20 November 2012 and 30 April 2014.
SVERT's monitoring of Chirpoi is hampered by the lack of surface instruments or seismic network. The volcano is primarily monitored by satellites; cloud cover, however, often prevents space-borne observations. The location of Chirpoi in the Kuril Islands is shown in figure 1.
SVERT reported thermal anomalies at a volcano of Chirpoi called Snow, starting on 17 November 2012. Periods of steam-and-gas began on 15 December 2012. This activity continued through at least April 2014, based upon analysis of satellite images (table 1). Cloud cover often obscured views of the volcano.
Table 1. Steam-and-gas plumes and emissions from Snow, a Chirpoi volcano, between 21 November 2012 and 30 April 2014, based on analysis of satellite images. Cloud cover frequently prevented observations. Courtesy of SVERT.
| Year |
Dates |
Plume drift |
| 2012 |
15 and 19 Dec |
-- |
| 2013 |
9 and 11 Jan |
-- |
| 2013 |
1, 7, 10, 14-15, 19-22, 25 Feb |
-- |
| 2013 |
1, 3, 5 Mar |
-- |
| 2013 |
23 Jul |
-- |
| 2013 |
9 and 12 Aug |
-- |
| 2013 |
22-23, 29-31 Oct |
-- |
| 2013 |
4, 6, 25 Nov |
Drifted 90 km SE on 25 Nov |
| 2014 |
15, 20, and 27 Mar |
-- |
| 2014 |
13 Apr |
-- |
A search of MODVOLC thermal alerts at Chirpoi since 1980 found no such alerts until a they began at Snow on 11 November 2012. Between that date and 24 December 2012, many thermal alerts were reported. According to SVERT, this may have indicated a lava flow on the SE flank. No further alerts were reported until 8 July 2013; between 8 July and October 2013, thermal alerts were issued on six days. The only alerts between November 2013 and 30 April 2014 were on 10 March, 27-28 March, and 14, 16, 18, 21, 27, 29-30 April 2014.
Based on SVERT weekly reports on 12 and 19 November 2012, the Aviation Color Code increased from Green to Yellow between 5 and 19 November 2012, and remained Yellow through at least April 2014. (Green indicates a normal, non-eruptive state; Yellow indicates elevated unrest above background level.)
Geologic Background. Chirpoi, a small island lying between the larger islands of Simushir and Urup, contains a half dozen volcanic edifices constructed within an 8-9 km wide, partially submerged caldera. The southern rim of the caldera is exposed on nearby Brat Chirpoev Island. The symmetrical Cherny volcano, which forms the central cone of the island, erupted twice during the 18th and 19th centuries. The youngest volcano, Snow, originated between 1770 and 1810. It is composed almost entirely of lava flows, many of which have reached the sea on the southern coast. No recorded eruptions are known from Brat Chirpoev, but its youthful morphology suggests recent Strombolian activity.
Information Contacts: Sakhalin Volcanic Eruption Response Team (SVERT) (URL in English: http://www.imgg.ru/?id_d=659); and Hawai'i Institute of Geophysics and Planetology (HIGP), MODVOLC Thermal Alerts System, School of Ocean and Earth Science and Technology (SOEST), Univ. of Hawai'i, 2525 Correa Road, Honolulu, HI 96822, USA (URL: http://modis.higp.hawaii.edu/).
Colima
Mexico
19.514°N, 103.62°W; summit elev. 3850 m
All times are local (unless otherwise noted)
Episode of lava effusion following the January 2013 sequence of explosions
[Following 18-months of calm at Volcán de Colima (BGVN 38:04), a sequence of intermediate-to-small size Vulcanian explosions began in January 2013.] This sequence of explosions excavated a 250,000 m3 crater in the 2007-2011 lava dome (figure 105). Episodes of effusive activity within the new crater were recorded between the explosive events. An infrared image shows fresh magma at the crater base (figure 106).
Activity during 2013. [There were three stages of activity at Colima during 2013, defined based on data from seismic and video monitoring (figure 107).] The first stage (St. 1) refers to the sequence of explosions described in (BGVN 38:04). On 15 February and the end of March (St. 2), video observations indicated continued gradual lava dome growth in the new crater. The dome increased in height at the rate of ~1 m/day. As a result, during this interval the [summit elevation] increased from 3,843 to 3,874 m. The dome continued to fill the crater through the end of March (figure 108). During April-November 2013 the third stage (St. 3) of significant dome growth stopped. The February-March lava dome growth was accompanied by an increase in the frequency and energy of the small explosions. Once the dome filled the crater a small lava flow traveled toward the W. Due to the steepness of this flank, much of the fresh material descended as rockfalls, whose frequency increased from April.
During the third stage, the daily number of small explosions and rockfalls was quite stable. This stage was associated with the occurrence of 14 lahars that began with the rainy season being registered between 11 June and 8 October 2013 descending the flanks of the volcano (figure 109). The largest, lasting around 6 hours, occurred on 16 September 2013, when the Pacific coast was affected by tropical cyclone Manuel.
Activity during 2014. On 21 January 2014 the Washington VAAC first reported scattered ash emissions drifting S at 4.9 km altitude followed by a second and third emission that drifted SSW and S, respectively. Smaller ash emissions were noted throughout the following weeks. For example, Washington VAAC reported that on 7 February a small emission rose and drifted E then SE, followed by a later one the same day that drifted SE. From data provided by the Mexico Meteorological Watch Office, on 28 February an ash emission drifted 15 km SE at altitudes up to 4.6 km, and the following day, on 1 March, two emissions were reported drifting NNW, followed by three other plumes later the same day. The Washington VACC continued to report on activity as seen from satellite imaging, noting another emission on 6 March that drifted NE before dissipating and ; an emission on 12 March that drifted 25 km NNE before similarly dissipating; and a 19 March emission, which rose to 4.6 km and drifted E before dissipating 30 km from the source. A separate later plume followed on 22 March and drifted N.
Geologic Background. The Colima complex is the most prominent volcanic center of the western Mexican Volcanic Belt. It consists of two southward-younging volcanoes, Nevado de Colima (the high point of the complex) on the north and the historically active Volcán de Colima at the south. A group of late-Pleistocene cinder cones is located on the floor of the Colima graben west and east of the complex. Volcán de Colima (also known as Volcán Fuego) is a youthful stratovolcano constructed within a 5-km-wide scarp, breached to the south, that has been the source of large debris avalanches. Major slope failures have occurred repeatedly from both the Nevado and Colima cones, producing thick debris-avalanche deposits on three sides of the complex. Frequent recorded eruptions date back to the 16th century. Occasional major explosive eruptions have destroyed the summit (most recently in 1913) and left a deep, steep-sided crater that was slowly refilled and then overtopped by lava dome growth.
Information Contacts: Observatorio Vulcanologico de la Universidad de Colima (Colima Volcanological Observatory), Calle Manuel Payno, 209 Colima, Col., 28045 Mexico (URL: http://www.ucol.mex/volc/); Facultad de Ciencias, Universidad de Colima; and Washington Volcanic Ash Advisory Center (VAAC), NOAA Science Center Room 401, 5200 Auth road, Camp Springs, MD 20746, USA (URL: http://www.ospo.noaa.gov/Products/atmosphere/vaac/).
Cerro Hudson (Chile) — December 2013 Cite this Report
Cerro Hudson
Chile
45.9°S, 72.97°W; summit elev. 1905 m
All times are local (unless otherwise noted)
October 2011 earthquakes and eruption with ash, causing evacuation
A large eruption occurred at Cerro Hudson on 8 August 1991 (BGVN 16:07-18:02), which was followed by minor non-eruptive activity that caused sulfurous odors, increased river flows and turbidity, and noise at least through early 1995 (BGVN 20:02). This report describes a minor eruption during 25-26 October 2011. Cerro Hudson is located in Patagonia in the Aysén Region of Chile (figure 1).
According to the Southern Andes Volcanological Observatory-National Geology and Mining Service (OVDAS-SERNAGEOMIN), seismicity increased during 25-26 October 2011. On 25 October, an M 4.6 volcano-tectonic earthquake occurred at a depth of 19 km, followed by a seismic swarm. More than 100 events, with depths ranging from 15 to 25 km, were recorded through the next day; twelve were M 3, and three were M 4. Most of the earthquakes were volcano-tectonic events with magnitudes below 3.6 and located W of the caldera at depths between 3 and 25 km. The earthquake hypocenters became shallower over time. OVDAS-SERNAGEOMIN did not detect any explosive event or episodes of high intensity harmonic tremor (as reported on 28 October).
During a 24-hour period beginning at 1600 on 27 October, an average of one earthquake per hour was recorded. Most were long-period with magnitudes less than 2.2. On 27 October, an M 3.6 VT earthquake occurred on the SW edge of the crater.
On 26 and 27 October, OVDAS-SERNAGEOMIN and local authorities flew over the caldera and observed three new craters along the SSE edge of the caldera, with approximate diameters of 200, 300, and 500 m. Mostly white plumes rose above the two smaller craters. The largest, southern-most crater emitted a plume with more ash that rose more than 5 km above the crater. Satellite imagery showed a plume drifting 12 km SE. The scientists also observed lahars in the Huemules river, to the W. In response, OVDAS-SERNAGEOMIN raised the Alert Level to 5 (Red), the highest level. According to the Oficina Nacional de Emergencia - Ministerio del Interior (ONEMI), 140 people were evacuated from areas within a 45-km radius of the volcano, defined as a high-risk zone. The hazard lay not only with earthquakes and eruption, but also with the possibility of flooding resulting from to glacier melt.
During another overflight on 28 October scientists observed a gas plume with a very low ash content rising 3-4 km above the craters. Seismicity continued to decrease during 28-29 October. Plumes were observed on 29 October (figure 9). Scientists conducting an overflight noted that one ash plume rose 1 km above the craters and drifted 5-8 km NE. They also confirmed that a large lahar descended the volcano and flowed into the drainage system including the Huemules river during the initial phase of the eruption. During another observation flight on 30 October, scientists saw ash plumes rising 0.8 km from two of the three craters.
On 31 October, scientists observed gas plumes rising 0.5 km above the craters and drifting SE. Around 31 October, they also noted subsequent minor explosions and ash emissions. On 1 November, scientists observed an explosion and an accompanying ash plume that rose 1.5 km above the active craters.
On 2 November, OVDAS-SERNAGEOMIN reported that the Alert Level for Cerro Hudson had been lowered to 4 (Yellow), noting that the eruption that began on 26 October had ceased. ONEMI reported that the 140 evacuees were permitted to return home. Analysis of ash deposited on the edge of the crater during the eruption indicated the presence of juvenile basalt. During 1-6 November between 16 and 110 earthquakes per day were recorded, and satellite images showed drifting plumes daily.
According to OVDAS-SERNAGEOMIN, satellite imagery and an area web camera showed no plumes during 7-15 November. Seismic activity decreased significantly, reaching no more than four earthquakes per hour.
The NASA Earth Observatory photographed Cerro Hudson on 17 November 2011 (figure 10) and weeks later (figure 11).
Geologic Background. The ice-filled, 10-km-wide caldera of Cerro Hudson volcano was not recognized until its first 20th-century eruption in 1971. It is the southernmost volcano in the Chilean Andes, related to subduction of the Nazca plate beneath the South American plate. The massive volcano covers an area of 300 km2. The compound caldera is drained through a breach on its NW rim, which has been the source of mudflows down the Río de Los Huemeles. Two cinder cones occur N of the volcano and others occupy the SW and SE flanks. This volcano has been the source of several major Holocene explosive eruptions. An eruption about 6,700 years ago was one of the largest known in the southern Andes during the Holocene; another eruption about 3,600 years ago also produced more than 10 km3 of tephra. An eruption in 1991 formed a new 800-m-wide crater in the SW portion of the caldera.
Information Contacts: SERNAGEOMIN (Southern Andes Volcanological Observatory-National Geology and Mining Service), Avda Sta María No. 0104, Santiago, Chile (URL: http://www.sernageomin.cl/); NASA Earth Observatory, EOS Project Science Office, NASA Goddard Space Flight Center, Goddard, Maryland, USA (URL: http://earthobservatory.nasa.gov/); Oficina Nacional de Emergencia - Ministerio del Interior (ONEMI), Beaucheff 1637 / 1671, Santiago, Chile (URL: http://www.onemi.cl/); and El Mercurio (URL: http://www.elmercurio.cl/).
Karthala (Comoros) — December 2013 Cite this Report
Karthala
Comoros
11.75°S, 43.38°E; summit elev. 2361 m
All times are local (unless otherwise noted)
Increased nighttime incandescence during 9-10 May 2012
Our last report on activity at Karthala, located in the Comoros Islands, covered elevated seismicity and a subsequent eruption in January 2007 (BGVN 32:01). The volcano was then quiet until May 2012.
U.S. Embassy Comoros Officer, Michael Zorick informed us that residents on Karthala's W flank, in the villages of Mde and Mkazi (each ~12 km from the summit), reported observing intensified red glow toward the volcano summit during the night of 9-10 May 2012. He further indicated that there was no perceptible seismic activity.
A search for thermal alerts on the MODVOLC website revealed an absence of alerts after those associated with the 2007 eruption.
Geologic Background. The southernmost and largest of the two shield volcanoes forming Grand Comore Island (also known as Ngazidja Island), Karthala contains a 3 x 4 km summit caldera generated by repeated collapse. Elongated rift zones extend to the NNW and SE from the summit of the Hawaiian-style basaltic shield, which has an asymmetrical profile that is steeper to the S. The lower SE rift zone forms the Massif du Badjini, a peninsula at the SE tip of the island. Historical eruptions have modified the morphology of the compound, irregular summit caldera. More than twenty eruptions have been recorded since the 19th century from the summit caldera and vents on the N and S flanks. Many lava flows have reached the sea on both sides of the island. An 1860 lava flow from the summit caldera traveled ~13 km to the NW, reaching the W coast to the N of the capital city of Moroni.
Information Contacts: Michael P. Zorick, Comoros Officer, Embassy of the United States of America, Antananarivo, Madagascar; and Hawai'i Institute of Geophysics and Planetology (HIGP), MODVOLC Thermal Alerts System, School of Ocean and Earth Science and Technology (SOEST), Univ. of Hawai'i, 2525 Correa Road, Honolulu, HI 96822, USA (URL: http://modis.higp.hawaii.edu/).
Mauna Kea (United States) — December 2013 Cite this Report
Mauna Kea
United States
19.82°N, 155.47°W; summit elev. 4205 m
All times are local (unless otherwise noted)
In repose; background conditions and hazards
This is the first Bulletin report for Mauna Kea, the tallest volcano on the Island of Hawai`i (figures 1, 2, and 3). Although the most recent eruption occurred ~4,500 years ago, this volcano has the potential to reawaken. This report presents early observations by Western explorers; discussions from Hawaiian Volcano Observatory (HVO) scientists focusing on the potential for future eruptions; seismicity during 2000-2013; and a recent report by HVO scientists highlighting drastic changes at an alpine lake, Lake Waiau.
Eruptive style and activity status. Mauna Kea is presently considered a volcano exhibiting quiescence that has, according to the known geologic record, an extensive history of lapsed activity. Between 6,000 and 4,000 years ago, eruptions occurred at at least seven separate vents. The record indicates that compared with Mauna Loa, which erupted every few years to few tens of years, and Hualalai, which erupted every few hundred years, Mauna Kea has exhibited long breaks in activity (USGS, 2002).
Based on the occurrence of 12 eruptions within a 10,000 year period, Mauna Kea's recurrence interval is ~1,000 years (Geohazards Consultants International, Inc., 2000). According to the Mauna Kea Science Reserve Master Plan released by the Geohazards Consultants International, Inc. in March 2000:
"Mauna Kea's post-glacial eruptions have been episodic rather than periodic, however, with a particular concentration of eruptive activity between 4,400-5,600 years ago. The 1,000 year recurrence interval of the past 10,000 years does not thus indicate that an eruption is 'overdue', but does reinforce the likelihood that eruptions will occur sporadically in the future."
This pattern of activity might also imply that the next eruption of Mauna Kea could be followed by others at much shorter intervals, representing a potential clustering of events in the given time interval (Jim Kauahikaua, personal communication, 30 May 2014).
Mauna Kea's most recent eruption occurred ~4,500 years ago, generating both lava flows and cinder cones. This activity is considered characteristic of a volcanic system that had evolved past the shield-building stage to the post-shield stage (Hoover and Fodor, 1997). The above-stated age determinations were made based on radiocarbon dating of charcoal collected within the Humu`ula soil (Porter, 1971; Wolfe and others, 1997); this soil lies directly beneath the S flank lava flows of Pu`ukole and Pu`u Loa Loa (figure 4).
The designations of shield-building and post-shield stages come from a system of structural development that represents the current understanding of Hawaiian volcanism. Significant cinder cone eruptions are a hallmark of the post-shield stage as well as: "(1) the absence of a summit caldera and elongated fissure vents that radiate across its summit; (2) steeper and more irregular topography (for example, the upper flanks of Mauna Kea are twice as steep as those of Mauna Loa; [figure 5]); and (3) different chemical compositions of the lava" (Clague and Dalrymple, 1987; USGS, 2002).
Gravity model. Investigations by Kauahikaua and others (2000) determined a three-dimensional gravity model for the Island of Hawai`i distinguished the five volcanic centers comprising the island: Kohala, Mauna Kea, Hualalai, Mauna Loa, and Kīlauea (figure 6). The base data for that map came from more than 3,300 gravity measurements made above sea level. Positive gravity anomalies define gravitationally dense zones caused by intrusions and cumulates beneath the summit and known rift zones of each of the five volcanoes composing the island. Figure 6 maps the 3-dimensional structure as modeled from the gravity data and expresses the gravity anomalies in terms of elevation from the overlying ground surface.
"Mauna Kea has an elliptical-shaped core, slightly elongated east-west, with a broad, linear feature trending southeast. This linear feature may be a buried rift zone of Mauna Kea, although no surface expressions of those rift zones have been mapped (Kauahikaua and others, 2000)."
The submarine feature known as the Hilo Ridge was also included in the density study with data contributed by GLORIA (a side-scan sonar) as well as satellites ERS-1, Geosat, and Seasat. Prior to this investigation, the Hilo Ridge had been attributed to Mauna Kea as its possible rift zone; however, the authors determined a stronger connection with Kohala due to multiple factors including the strongly NW-trending linear zone that extends ~80 km from the modelled core of Kohala.
Early European observations. An early survey of Hawai`i was conducted by Archibald Menzies, a botanist who accompanied Captain George Vancouver during the cruises of 1792-1794. Menzies successfully ascended Mauna Loa in February 1794 (a team from Captain Cook's crew had unsuccessfully attempted the summit in 1779; see figure 7). Menzies estimated the heights of Mauna Loa and Mauna Kea to within 31 m of the currently accepted value, "a remarkable surveying feat for that time" (Wright and others, 1992b).
The first petrologist to study Mauna Kea, R.A. Daly, determined not only that Mauna Kea's upper flanks were dominated by lava flows more rich in silica (he called them "andesite" although current classifications label them "hawaiite"), but also that the edifice had been modified by glaciers (Wolfe and others, 1997; Daly, 1911). Stearns and Macdonald (1946) and Washington (1923) expanded the knowledge base of Mauna Kea's geochemistry, and Gregory and Wentworth (1937) established that the glacial features from the most recent glacial episode (40,000 to 13,000 years ago) were interspersed with primary volcanic material. Wolfe and others (1997) determined that "eruptive activity of Mauna Kea was partly contemporaneous with that at Kohala, Hualalai, and Mauna Loa, and the volcano boundaries are undoubtedly complex."
HVO Volcano Watch article highlights a Mauna Kea forecast. The potential for a future eruption from Mauna Kea was addressed in a Volcano Watch article posted in June 2000 by then Scientist-in-Charge, Don Swanson, from the Hawaiian Volcano Observatory (HVO) (Swanson, 2000ab). The article addresses not only eruption frequency but also trends in eruption style, the potential response of the telescope installation at Mauna Kea's summit, and a general forecast for a likely scenario in the future.
"The next eruption of Mauna Kea."
"Mauna Kea's peaceful appearance is misleading. The volcano is not dead. It erupted many times between 60,000 and 4,000 years ago, and some periods of quiet during that time apparently lasted longer than 4,000 years. Given that record, future eruptions seem almost certain.
"Before the next one, we should have ample warning provided by our current seismic and geodetic monitoring systems. A number of earthquakes occur beneath Mauna Kea each year, and you can bet that we pay close attention to them. However, they all appear to be associated with tectonic faulting rather than movement of magma.
"The telescopes on top of the volcano may be the first to indicate that something is amiss. The coordinates used for tracking their observations will begin to drift unexpectedly as the volcano is swelling. In a sense, the telescopes will serve as very expensive tiltmeters.
"We cannot now say when the next eruption will take place, except that it is unlikely to be in the next several months, given the current lack of any precursory signs. Whether the timing is years, centuries, or millennia is entirely unclear.
"But we can say something about the probable nature of the next eruption, because we know what the most recent ones were like, thanks to recently published research by Ed Wolfe [see Wolfe and others, 1997], former staff member of HVO, and colleagues.
"The next eruption could take place anywhere on the upper flanks of the volcano. As Mauna Kea evolved from its early shield stage (equivalent to Kīlauea and Mauna Loa today) to its present postshield stage, the volcano lost its rift zones. Consequently, the postshield eruptions are not concentrated along narrow zones but instead are scattered across the mountain. [See figure 6.]
"For example, the most recent eruptive period, 6,000-4,000 years ago, involved eight vents on the south flank of the volcano between Kala`i`eha cone (near Humu`ula) and Pu`ukole (east of Hale Pohaku). During this same period, eruptions took place on the northeast flank at Pu`u Lehu and Pu`u Kanakaleonui. Lava from Pu`u Kanakaleonui flowed more than 20 km (12 miles) northeastward, entering the sea to form Laupahoehoe Point.
"The next eruption will likely produce a lava flow, because each eruption in the past 60,000 years has done so. The longest flows will reach 15-25 km (9-15 miles) downslope. Most of each flow will be `a`a, but pahoehoe may form near vents.
"A prominent cinder cone will probably be constructed at each vent. The cinder cones responsible for the "bumpy" appearance of Mauna Kea's surface formed during the 60,000-4,000-year interval. The cones mentioned by name above, and several others, were built during the latest eruptive period 6,000-4,000 years ago. The next eruption will likely produce a similar cone.
"Cinder cones form at vents that are point sources, not elongate fissures. All activity is concentrated at one place, so that fountaining and spattering build a high cone rather than a long rampart. Past eruptions-and hence future ones--probably lasted months to several years, providing enough time to construct a substantial cone. Those eruptions spread voluminous ash deposits far beyond the cinder cones themselves, and the next eruption will probably do so, too.
"Possibly, however, there will not be enough spattering to build a lasting cone. Such an eruption happened about 1 km (0.6 miles) southeast of Hale Pohaku, when a vent put out a moderate volume of lava without building a spatter or cinder cone.
"The next eruption of Mauna Kea is unlikely to occur in our lifetimes, but it could. There is no reason to fear such an eruption. It would not threaten human life, provided due care were taken, though it could prove devastating to property and infrastructure, particularly if a lava flow traveled to the Hamakua coast or the Waimea area."
Mauna Kea's seismicity. HVO has monitored and maintained the record of seismicity for the entire region of Hawai`i. The seismicity detected beneath Mauna Kea has been characterized as "infrequent and sparse." Notable seismicity occurred in 1994, 2001, and 2011, when earthquakes were large enough to be felt by the general public. Island-wide instrumentation allowed excellent location data for the local seismicity (figure 8).
HVO reported that, several times each year, earthquakes from Mauna Kea cause shaking that is noted by local populations - especially the operators of the Mauna Kea astronomical observatory, who rely on stable instrumentation in order to make precise observations. Reports of felt earthquakes from Mauna Kea correlated with magnitude 2.1-4.9 earthquakes during 1973-2012.
Elevated seismicity during October-December 2011 resulted in 30 felt earthquakes. Approximately 570 people reported the M 4.5 earthquake that occurred on 20 October 2011 and also 10 of the aftershocks that followed (figure 9). HVO reported that, like many of Mauna Kea's earthquakes, these earthquakes were "most likely caused by structural adjustments within the Earth's crust due to the heavy load of Mauna Kea." With an estimated volume of >30,000 km3, Mauna Kea rises ~10,000 m above the seafloor, causing stress to accumulate from the mass of the volcano (Lockwood and Hazlett, 2010).
Earthquake swarms at Mauna Kea. HVO reported that earthquake swarms occasionally occur at Mauna Kea. On 23 February 2001, a swarm of ~15 events was detected within a 21-hour period. These earthquakes were mainly located ~15 km S of Pa`auilo (~3 km NW of Kuka`iau, figure 10), at a depth of 8-11 km.
Lake Waiau recedes. The cinder cone Pu`uwaiau, located within 2 km of the summit, has contained a freshwater lake that was considered permanent by Wolfe and others (1997) (figures 11 and 12). Lake Waiau has likely persisted due to the once-glassy cinders and bombs that have weathered to smectite with zeolites within the void spaces. These alteration products may serve as a weak cement between the pyroclasts and reduce the permeability of the cinder cone's base. Sporadic winter storms have provided most, if not all, of the water captured in this considerably arid region (Patrick and Delparte, 2014). Contributions from permafrost were also proposed by Woodcock (1980), but the presence of permafrost has not been confirmed near Lake Waiau.
Patrick and Delparte (2014) reported that the lake size before 2010 was 5,000-7,000 m2 with a depth of ~3 m, but recently, the size has been decreasing rapidly. In the recent past, the lake was known to overflow through the Pohakuloa Gulch when water levels exceeded the rim (as recently as February 2002) (Ehlmann and others, 2005).
Researchers have determined that Lake Waiau is sensitive to precipitation levels (Woodcock, 1980) and that ongoing drought conditions could be driving the lake's change (Patrick and Delparte, 2014). Based on the National Drought Mitigation Center's data, since 2008, and notably in March 2010, precipitation has been sparse at the summit of Mauna Kea.
In December 2013, scientists visited the lake and observed an unprecedented sight (figure 13). Lake Waiau measured a mere 115 m2 and was roughly 10-20 cm deep (Patrick and Delparte, 2014). While the lake size was known to fluctuate over time, this dramatic reduction has caused concern, given the possibility of losing a specialized ecosystem as well as a prominent feature of Hawaiian ethnogeography. Mauna Kea's summit is considered "one of the most sacred spots in the Hawaiian Islands. Archaeological sites near the summit attest to its prolonged spiritual importance...(Patrick and Delparte, 2014)."
USGS scientists at HVO as well as collaborators, including Idaho State University, continued to study the conditions at Lake Waiau after the significant survey was conducted in December 2013. As of May 2014, strong winter rains had partially restored the lake, providing stronger evidence that the multi-year shrinkage was due to the ongoing drought as opposed to changes in the volcanic system.
A note regarding the name Mauna Kea. The popular translation of the Hawaiian name Mauna Kea is frequently "White Mountain," however, significant discussions have focused on the source of the name. There has been growing consensus that Mauna Kea is a shortened form of Mauna a Wakea, which refers to the sky father Wakea.
According to testaments presented in the Final Environmental Impact Statement of the Federal Highway Administration Project No. A-AD-6(1) which included potential cultural impacts on the island by expanding State Routes 190 and 200, "The mountain is the sacred child of Wakea, and it is the source for the land. The mountains and land were genealogically connected to native Hawaiians through the original ancestor, Wakea [sky father] and Papa [earth mother]."
Ethnographic research conducted prior to 1999 and released in the impact statement concluded that the summit area of Mauna Kea was eligible for the National Register of Historic Places due to traditional cultural property.
A note regarding Hawaiian names and nomenclature. As previously noted in other Bulletin reports, according to Runyon (2006), "The U.S. Board on Geographic Names (BGN) is responsible for establishing and maintaining uniform geographical name usage throughout all departments and agencies of the United States government. As such, the Board collects and promulgates every name that is considered official for Federal use. The official vehicle for promulgating these names and their locative attributes is the Geographic Names Information System (GNIS).
"Until the 1990's, it was also Federal policy to omit most diacritics and writing marks from placenames on Federal maps and documents. The few exceptions included the Spanish tilde and the French accent marks, but otherwise the special characters found in indigenous names were always dropped. In more recent years, however, the BGN has amended its policy to permit the inclusion of such marks, thus more accurately reflecting the true representation of the native language. An example of this has been the addition of the glottal stop (okina) and macron (kahako) to placenames of Hawaiian origin, which prior to 1995 had always been omitted. The BGN staff, under the direction and guidance of the Hawaii State Geographic Names Authority, has been restoring systemically these marks to each Hawaiian name listed in GNIS."
GVP will strive to conform to GNIS nomenclature. It remains a technological challenge, but a goal.
References: Clague, D.A., and Dalrymple, G.B., 1987, The Hawaiian-Emperor volcanic chain. Part I. Geologic evolution, chap. 1 of Decker, R.W, Wright, T.L., and Stauffer, PH., eds., Volcanism in Hawaii: U.S. Geological Survey Professional Paper 1350, v. 1, p. 5-54.
Daly, R.A., 1911, Magmatic differentiation in Hawaii: Journal of Geology, v. 19, no. 4, p. 289-316.
Federal Highway Administration, 1999, Final Environmental Impact Statement Part 1: Hawaii State Route 200, Mamalahoa Highway (SR 190) to Milepost 6 Saddle Road, County of Hawai`i, State of Hawai`i, FHWA Project No. A-AD-6(1).
Ehlmann, B.L., Arvidson, R.E., Jolliff, B.L., Johnson, S.S., Ebel, B., Lovenduski, N., Morris, J.D., Beyers, J.A., Snider, N.O., and Criss, R.E., 2005. Hydrologic and isotopic modeling of Alpine Lake Waiau, Mauna Kea, Hawai`i. University of Hawaii Press, p. 1-15.
Fitzpatrick, G.L, 1986. The early mapping of Hawaii. Honolulu: Editions Limited, vol. 1, 160 pp.
Geohazards Consultants International, Inc., Mauna Kea Science Reserve Master Plan, Volcano, HI, March 2000, 22 p.
Gregory, H.E., and Wentworth, C.K., 1937, General features and glacial geology of Mauna Kea, Hawaii: Geological Society of America Bulletin, v. 48, no. 12, p. 1719-1742.
Holt, Rinehart, and Winston (2006), Hawaii. Retrieved from http://go.hrw.com/atlas/norm_htm/hawaii.htm.
Hoover, S.R. and Fodor, R.V., 1997, Magma-reservoir crystallization processes: small-scale dikes in cumulate gabbros, Mauna Kea Volcano, Hawaii, Bulletin of Volcanology, 59, p. 186-197.
Kauahikaua, J., Hildenbrand, T., & Webring, M., 2000. Deep magmatic structures of Hawaiian volcanoes, imaged by three-dimensional gravity models. Geology, 28, 10, p. 883.
Lockwood, J.P., and Hazlett, R.W., 2010. Volcanoes: Global Perspectives, Wiley-Blackwell, Hoboken, NJ, ix, 539 p.
Okubo, P.G. and Nakata, J.S., 2011, Earthquakes in Hawai`i-An Underappreciated but Serious Hazard, Fact Sheet 2011-3013, USGS Fact Sheet, September 2011. (http://pubs.usgs.gov/fs/2011/3013/)
Patrick, M. R. and Delparte, D., 2014, Tracking Dramatic Changes at Hawaii's Only Alpine Lake: EOS (Transactions, American Geophysical Union), Vol. 95, No. 14, p. 117-118.
Porter, S.C., 1971, Holocene Eruptions of Mauna Kea Volcano, Hawaii, Science, Vol. 172 no. 3981 p. 375-377.
Stearns, H.T., and Macdonald, G.A., 1946, Geology and ground-water resources of the Island of Hawaii: Hawaii Division of Hydrography Bulletin 9, 363 p.
Swanson, D.A., (June 2000a). The next eruption of Mauna Kea. Volcano Watch. Retrieved from http://hvo.wr.usgs.gov/volcanowatch/archive/2000/00_06_01.html.
Swanson, D.A., 2000b, Don't be fooled by seemingly peaceful Mauna Kea Volcano--it could erupt again: Hawaii Tribune-Herald, June 4, p. 2.
USGS-HVO (May 2002). Mauna Kea Hawai`i's Tallest Volcano. Other Volcanoes. Retrieved from http://hvo.wr.usgs.gov/volcanoes/maunakea/.
Washington, H.S., 1923, Petrology of the Hawaiian Islands; I, Kohala and Mauna Kea, Hawaii: American Journal of Science, ser. 5, v. 5, no. 30, p. 465-502.
Wolfe, E.W., Wise, W.S., and Dalrymple, G.B., 1997, The geology and petrology of Mauna Kea volcano, Hawaii: a study of postshield volcanism. U.S. Geological Survey Professional Paper 1557, Washington, D.C.: U.S. G.P.O.
Woodcock, A., 1980. Hawaiian alpine lake level, rainfall trends, and spring flow, Pacific Science, 34, p. 195–209.
Wright, T.L., Chu, J.Y., Esposo, J., Heliker, C., Hodge, J., Lockwood, J.P., and Vogt, S.M., 1992a, Map showing lava-flow hazard zones, island of Hawaii: U.S. Geological Survey Miscellaneous Field Studies Map MF-2193, scale 1:250,000.
Wright, T.L., Takahashi, T.J., and Griggs, J.D., 1992b, Hawai`i Volcano Watch: A Pictorial History, 1779-1991, University of Hawaii Press, Honolulu, 162 p.
Geologic Background. Mauna Kea, Hawaii's highest volcano, reaches 4205 m, only 35 m above its neighbor, Mauna Loa. In contrast to Mauna Loa, Mauna Kea lacks a summit caldera and is capped by a profusion of cinder cones and pyroclastic deposits. It's rift zones are less pronounced than on neighboring volcanoes, and the eruption of voluminous, late-stage pyroclastic material has buried much of the early basaltic shield volcano, creating a steeper and more irregular profile. This transition took place about 200,000 to 250,000 years ago, and much of Mauna Kea, whose Hawaiian name means "White Mountain," was constructed during the Pleistocene. Its age and high altitude make it the only Hawaiian volcano with glacial moraines. A road that reaches a cluster of astronomical observatories on the summit also provides access to seasonal tropical skiing. The latest eruptions produced a series of cinder cones and lava flows from vents on the northern and southern flanks during the early- to mid-Holocene.
Information Contacts: Hawaiian Volcano Observatory (HVO), U.S. Geological Survey, PO Box 51, Hawai`i National Park, HI 96718, USA (URL: https://volcanoes.usgs.gov/observatories/hvo/); Richard Wainscoat, University of Hawaii at Manoa, Institute for Astronomy (URL: http://www.ifa.hawaii.edu/, http://www.ifa.hawaii.edu/images/aerial-tour-95/); Scott Rowland, University of Hawaii at Manoa, School of Ocean and Earth Science and Technology (URL: http://www.soest.hawaii.edu/); and Hawaii News Now (URL: http://www.hawaiinewsnow.com/).
San Cristobal (Nicaragua) — December 2013 Cite this Report
San Cristobal
Nicaragua
12.702°N, 87.004°W; summit elev. 1745 m
All times are local (unless otherwise noted)
Explosions on 7 June 2013; gas-and-ash emissions in early 2014
Our last Bulletin report covered seismicity and explosions at San Cristóbal through 31 December 2012 (BGVN 38:01).
2013. The Instituto Nicaragüense de Estudios Territoriales (INETER) reported that on 7 June 2013 seven explosions at San Cristóbal, that ejected gas and ash, were detected by the seismic station located on the W flank. The explosions occurred at 0615, 0645, 0653, 0911, 1137, 1139, and 1143, and were observed by civil defense and INETER staff. The largest explosion, at 1139, generated a plume that rose 100 m. Sulfur dioxide (SO2) emissions, which had been low, increased. A report later that afternoon stated that gas-and-ash explosions decreased, but RSAM values almost tripled to between 80 and 100 units due to increased tremor. INETER noted that tremor is frequently detected at San Cristóbal, and for the public not to be alarmed. A small mud flow, producing no damage, occurred at 1710.
2014. INETER reported that seismic tremor increased at 0340 on 17 January; RSAM values increased to 460 units from a baseline of 70 units. Twelve gas emissions were observed between 1259 and 1315, and RSAM climbed to 649 units. A report at 1700 noted that RSAM values decreased to 100 and no additional gas emissions were observed. The next day RSAM values fluctuated between 90 and 190 units.
INETER reported that a gas emission with small amounts of ash rose from San Cristóbal between 0641 and 0850 on 4 February. Although there was no increase noted, the report stated that seismicity decreased to background levels. By the afternoon SO2 emission values were 2,000-3,000 tons per day, the normal levels, and on 7 February, they were 1,000 tons per day. RSAM fluctuated between 20 and 140 units, which is considered normal.
Based on analysis of satellite images, the Washington VAAC reported that on 11 April a gas plume from San Cristóbal that possibly contained small amounts of ash drifted 20 km W. A thermal anomaly was present in short wave infrared satellite images. Periods of elevated seismicity were also detected.
Geologic Background. The San Cristóbal volcanic complex, consisting of five principal volcanic edifices, forms the NW end of the Marrabios Range. The symmetrical 1745-m-high youngest cone, named San Cristóbal (also known as El Viejo), is Nicaragua's highest volcano and is capped by a 500 x 600 m wide crater. El Chonco, with several flank lava domes, is located 4 km W of San Cristóbal; it and the eroded Moyotepe volcano, 4 km NE of San Cristóbal, are of Pleistocene age. Volcán Casita, containing an elongated summit crater, lies immediately east of San Cristóbal and was the site of a catastrophic landslide and lahar in 1998. The Plio-Pleistocene La Pelona caldera is located at the eastern end of the complex. Historical eruptions from San Cristóbal, consisting of small-to-moderate explosive activity, have been reported since the 16th century. Some other 16th-century eruptions attributed to Casita volcano are uncertain and may pertain to other Marrabios Range volcanoes.
Information Contacts: Instituto Nicaragüense de Estudios Territoriales (INETER), Apartado Postal 2110, Managua, Nicaragua (URL: http://www.ineter.gob.ni/); and Washington Volcanic Ash Advisory Center (VAAC), Satellite Analysis Branch (SAB), NOAA/NESDIS E/SP23, NOAA Science Center Room 401, 5200 Auth Rd, Camp Springs, MD 20746, USA (URL: http://www.ospo.noaa.gov/Products/atmosphere/vaac/).
Stromboli (Italy) — December 2013 Cite this Report
Stromboli
Italy
38.789°N, 15.213°E; summit elev. 924 m
All times are local (unless otherwise noted)
Small-to-moderate eruptions continue through February 2013
Our last report, (BGVN 36:09), covered activity at Stromboli through 11 October 2011, characterized by explosions, spattering, rockslides, and occasional lava flows. Similar activity persisted through February 2013. Stromboli (volcano and island) sits N of Sicily in the Tyrrhenian sea along the N side of the Aeolian archipelago.
Activity during 2011. The activity documented in October 2011 continued into November, December, and January 2012, and was concentrated at the two active vent areas in the northern and southern portions of the crater terrace. The wide array of activity noted above fluctuated. There were, along with frequent episodes of spattering, in particular on 10 December 2011. The spattering episodes occurred in the southern area and did not lead to the formation of any lava flows.
Activity during 2012. Stromboli exhibited two periods of isolated activity early in 2012, discussed next. On 16 February there were two sequences of up to 6 explosion earthquakes of medium-high amplitude, and ~9 Very Long Period (VLP) events per hour.
On 6 March, instruments detected both tremor coupled with a strong explosion and at least three major explosions. The first event, at 0643 UTC, presented a VLP component with amplitude ~10-times higher than the daily average. The last event, at 0645, was also of very high amplitude. The VLP events occurred at a rate of ~12 per hour, at a low level with a single event of high amplitude, corresponding to the first event in the sequence at 0643. The VLP sequence was followed by an increase in tremor lasting ~30 minutes. The tremor amplitude was medium-low with its peak corresponding to the earlier events seen around 0643.
On 22 November 2012, the persistent explosive activity at Stromboli showed a clear increase, with episodes of spattering and low lava fountains from two vents in the northern and central portions of the crater terrace.
Beginning on 23 December 2012, repeated lava overflows from the crater terrace generated small lava flows down the northern and northwestern sectors of the Sciara del Fuoco (see images below), and were accompanied by numerous landslides.
Major lava flows occurred on the evening of 23 December 2012 (to the N), during 25-27 December 2012 (to the NW), and on the morning of 7 January 2013 (to the NW). Lava vented from points just below the rim of the northernmost explosive vent on the crater terrace. During the intervals between the main effusive episodes, lava vented at extremely low, releasing numerous incandescent blocks down the Sciara del Fuoco (the area within the sector collapse). At times, small lava flows advanced for a few tens of meters before disintegrating into blocks, such as on the morning of 10 January 2013 (see the last photo in the sequence below in figure 82).
Around this time, in all cases, the effusion of lava was preceded, and often accompanied, by intense explosive activity on the crater terrace.
More insight into behavior at Stromboli during this December 2012-March 2013 eruptive phase can be found in Di Traglia and others (2014). They applied the ground-based InSAR monitoring system at Stromboli volcano, linking changes in displacement and other field-monitored observations to volcanism.
Activity during January-February 2013. A new phase of intermittent effusive activity at Stromboli consisting of small overflows of lava from the crater terrace began on 8 February 2013 and continued with significant fluctuations until the morning of 17 February. During this interval, several episodes of effusive activity occurred, which produced lava flows reaching several tens to a few hundred meters in length in the northern and northwestern sectors of the Sciara del Fuoco.
Spattering from vent N2, which lies at the top of a hornito perched on the NW rim of the crater terrace, continued for a few hours, and then diminished during the late afternoon of 14 February. See Figure 83. Subsequently, effusive activity diminished considerably, producing only very small lava overflows that extended a few tens of meters downslope to the NW. On the morning of 17 February, all effusive activity ceased and mild Strombolian activity resumed.
After an interval of 10 days of normal Strombolian activity, Stromboli again produced small lava overflows from the crater terrace from the afternoon of 27 February 2013 through the following night. A second episode of lava overflow started on the evening of 1 March and ceased the next afternoon. Both overflows were fed by continuous spattering from vent N2.
Reference. Di Traglia, F., Intrieri, E., Nolesini, T., Bardi, F., Del Ventisette, C., Ferrigno, F., Frangioni, S., Frodella, W., Gigli, G., Lotti, A., Tacconi Stefanelli, C., Tanteri, L., Leva, D., Casagli, N., 2014, The ground-based InSAR monitoring system at Stromboli volcano: linking changes in displacement rate and intensity of persistent volcanic activity, Bulletin of Volcanology 76:786DOI 10.1007/s00445-013-0786-2.
Geologic Background. Spectacular incandescent nighttime explosions at Stromboli have long attracted visitors to the "Lighthouse of the Mediterranean" in the NE Aeolian Islands. This volcano has lent its name to the frequent mild explosive activity that has characterized its eruptions throughout much of historical time. The small island is the emergent summit of a volcano that grew in two main eruptive cycles, the last of which formed the western portion of the island. The Neostromboli eruptive period took place between about 13,000 and 5,000 years ago. The active summit vents are located at the head of the Sciara del Fuoco, a prominent scarp that formed about 5,000 years ago due to a series of slope failures which extends to below sea level. The modern volcano has been constructed within this scarp, which funnels pyroclastic ejecta and lava flows to the NW. Essentially continuous mild Strombolian explosions, sometimes accompanied by lava flows, have been recorded for more than a millennium.
Information Contacts: Boris Behncke and Mauro Coltelli, Istituto Nazionale di Geofisica e Vulcanologia (INGV) Osservatorio Etneo (Catania), 95125 Catania (URL: http://www.ct.ingv.it/).