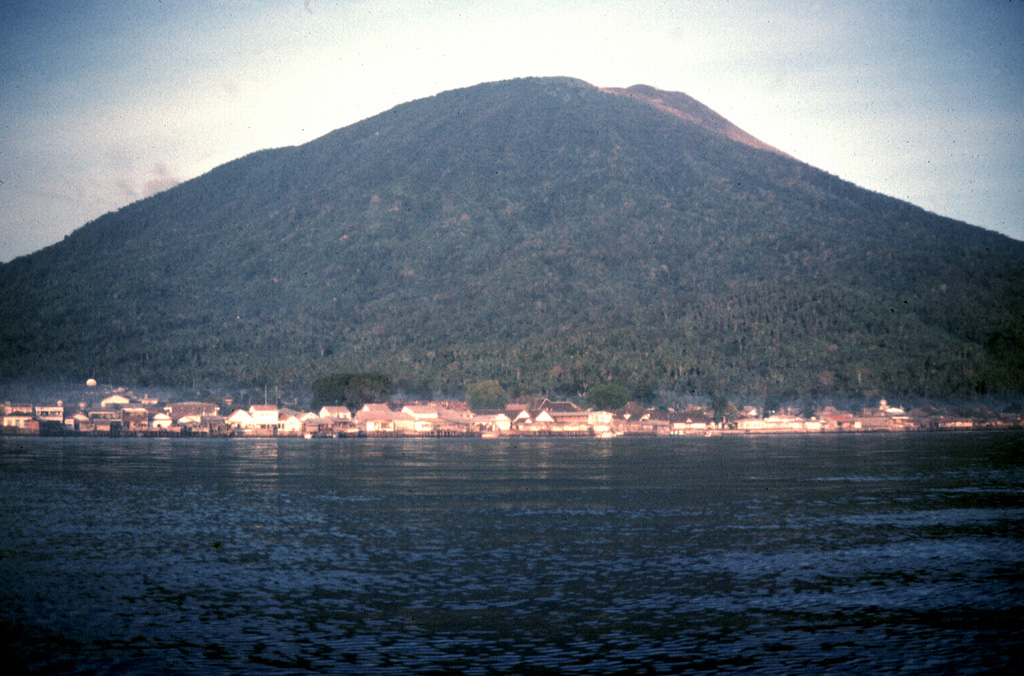
Aira | 13 September-19 September 2023 | Continuing Activity Cite this Report Cite this Report |
 Aira Aira
Kyushu (Japan)
|
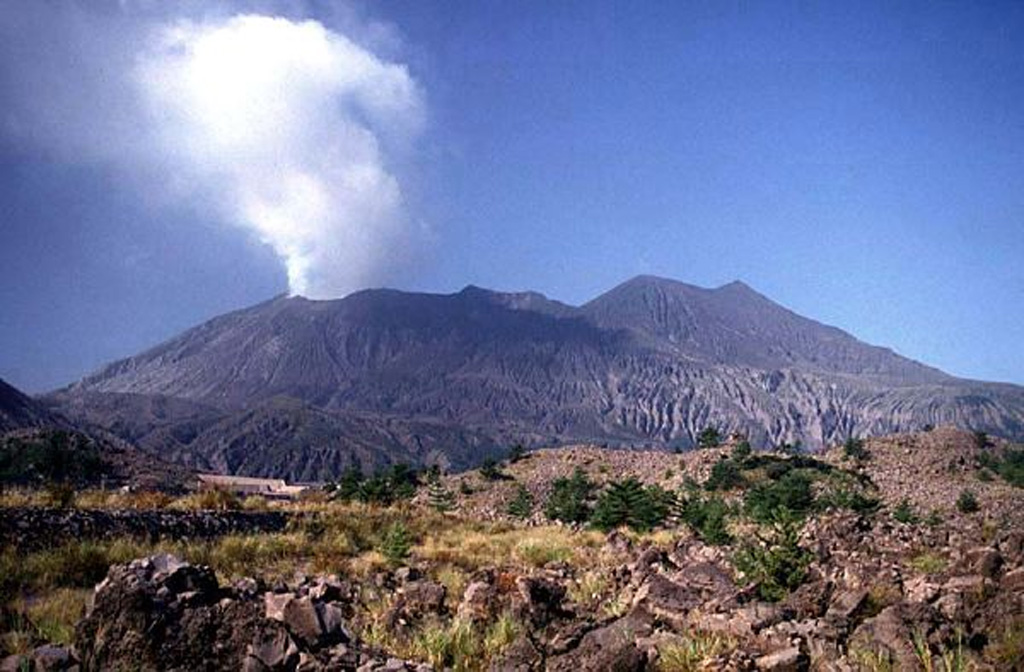
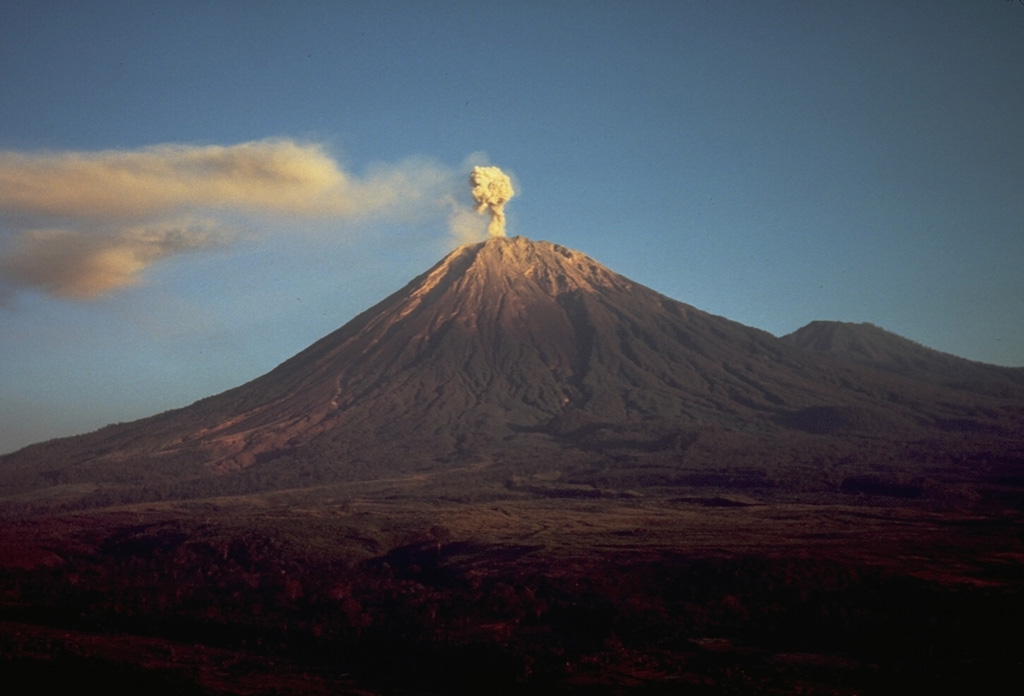
JMA reported ongoing activity at Minamidake Crater (Aira Caldera’s Sakurajima volcano) during 11-18 September and incandescence at the crater was observed nightly. Sulfur dioxide emissions averaged 1,900 tons per day on 11 September. An explosion at 0018 on 11 September produced an ash plume that rose 1.1 km above the crater rim and ejected large blocks 300-500 m from the crater. An eruptive event at 1642 produced an ash plume that rose 1.3 km. At 2211 on 13 September an explosion produced an ash plume that rose 1.7 km and drifted N and ejected large blocks 500-700 m from the crater. The Alert Level remained at 3 (on a 5-level scale), and the public was warned to stay 2 km away from both craters.
Source: Japan Meteorological Agency (JMA)
|
Dukono | 13 September-19 September 2023 | Continuing ActivityCite this Report |
 Dukono Dukono
Halmahera
|
PVMBG reported that the eruption at Dukono was ongoing during 13-17 September. Dense white-and-gray plumes rose as high as 350 m above the summit and drifted E and W. The Alert Level remained at Level 2 (on a scale of 1-4), and the public was warned to remain outside of the 2-km exclusion zone.
Source: Pusat Vulkanologi dan Mitigasi Bencana Geologi (PVMBG, also known as CVGHM)
|
Ebeko | 13 September-19 September 2023 | Continuing ActivityCite this Report |
 Ebeko Ebeko
Paramushir Island (Russia)
|
KVERT reported that moderate explosive activity at Ebeko was ongoing during 7-14 September. A thermal anomaly was identified in satellite images during 9-11 September; weather clouds obscured views on other days. According to volcanologists in Severo-Kurilsk (Paramushir Island, about 7 km E), explosions during 10-11 and 13-14 September generated ash plumes that rose as high as 3 km (10,000 ft) a.s.l and drifted to the E. The Aviation Color Code remained at Orange (the third level on a four-color scale). Dates are based on UTC times; specific events are in local time where noted.
Source: Kamchatkan Volcanic Eruption Response Team (KVERT)
|
Fuego | 13 September-19 September 2023 | Continuing ActivityCite this Report |
 Fuego Fuego
South-Central Guatemala
|
INSIVUMEH reported that 4-10 explosions per hour were recorded at Fuego during 13-19 September, generating ash-and-gas plumes that rose as high as 1.1 km above the crater rim. The ash plumes drifted as far as 30 km W and SW, causing minor ashfall in areas downwind including Morelia (9 km SW), Panimaché I and II (8 km SW), Palo Verde (10 km WSW), Sangre de Cristo (8 km W), El Porvenir (8 km SE), and Yepocapa (9 km WNW). Daily shock waves rattled structures in communities around the volcano and rumbling was often heard. Explosions caused daily block avalanches to descend the Ceniza (SSW), Seca (W), Trinidad (S), Taniluyá (SW), Honda, Las Lajas (SE), and/or El Jute (ESE) drainages. The explosions also ejected incandescent material as high as 200 m above the summit.
Source: Instituto Nacional de Sismologia, Vulcanologia, Meteorologia, e Hidrologia (INSIVUMEH)
|
Gamalama | 13 September-19 September 2023 | Continuing ActivityCite this Report |
 Gamalama Gamalama
Halmahera
|
Although there was no eruptive activity reported, in a 19 September press release, PVMBG noted that the number of daily deep volcanic earthquakes at Gamalama increased in early September and remained above average. The seismic network recorded a total of 16 deep volcanic earthquake events on 8 September and an average of nine events per day through 18 September; 1-2 events per day are generally recorded. The number of earthquakes indicating emissions also increased during 8-18 September, though diffuse white plumes only rose as high as 100 m above the summit whereas typically they can rise as high as 300 m. PVMBG noted that the most likely hazard would be a phreatic event that could ejected material within the 1.5-km radius, though ash may be carried farther by wind. The Alert Level remained at 2 (on a scale of 1-4); visitors and residents were warned not to approach the crater within a 1.5-km radius.
Source: Pusat Vulkanologi dan Mitigasi Bencana Geologi (PVMBG, also known as CVGHM)
|
Great Sitkin | 13 September-19 September 2023 | Continuing ActivityCite this Report |
 Great Sitkin Great Sitkin
Andreanof Islands (USA)
|
AVO reported that slow lava effusion likely continued at Great Sitkin during 13-19 September, producing a thick flow in the summit crater that mainly expanded E. A few daily earthquakes were recorded by the seismic network and seismicity was characterized as low. Weather clouds often prevented satellite and webcam observations, though no activity was observed on a few of the days with partly cloudy weather. The Volcano Alert Level remained at Watch (the third level on a four-level scale) and the Aviation Color Code remained at Orange (the third color on a four-color scale).
Source: US Geological Survey Alaska Volcano Observatory (AVO)
|
Karangetang | 13 September-19 September 2023 | Continuing ActivityCite this Report |
 Karangetang Karangetang
Sangihe Islands
|
PVMBG reported that dense white gas-and-steam plumes from Karangetang were visible on most days during 13-19 September rising as high as 300 m above Main and North craters and drifting mainly NW, N, and NE. Weather clouds sometimes prevented views of the summit. According to news articles, seismicity during 1-7 September indicated lava from the SW side of Main Crater (S crater) continued to effuse but at a decreased rate, and that the number of earthquakes indicating avalanches had also decreased, according to PVMBG. Lava avalanches traveled as far as 1.5 km down the Batuawang and Kahetang drainages on the S flank and rarely descended the SW flank. Lava effusion at Main Crater was not visible during 8-15 September, though sounds of avalanches were sometimes intense, and rumbling was also occasionally heard. Incandescence emanated from both Main and North craters. The number of avalanches continued to decrease. The Alert Level remained at 3 (on a scale of 1-4) and the public were advised to stay 2.5 km away from Main Crater with an extension to 3.5 km on the S and SE flanks.
Sources: Pusat Vulkanologi dan Mitigasi Bencana Geologi (PVMBG, also known as CVGHM), Antara News, Antara News, Antara News, Antara News, Antara News
|
Klyuchevskoy | 13 September-19 September 2023 | Continuing ActivityCite this Report |
 Klyuchevskoy Klyuchevskoy
Central Kamchatka (Russia)
|
KVERT reported that the explosive Strombolian eruption at Klyuchevskoy continued during 7-14 September. A daily bright thermal anomaly was identified in satellite images. Lava fountaining fed flows that advanced down the Apakhonchichsky and Kozyrevsky drainages on the SE flank. Plumes of resuspended ash drifted 550 km E and SE during 9-11 September. The Aviation Color Code remained at Yellow (the second level on a four-color scale). Dates are based on UTC times; specific events are in local time where noted.
Source: Kamchatkan Volcanic Eruption Response Team (KVERT)
|
Lewotolok | 13 September-19 September 2023 | Continuing ActivityCite this Report |
 Lewotolok Lewotolok
Lembata Island
|
PVMBG reported that the eruption at Lewotolok continued during 12-19 September. According to the Darwin VAAC an ash plume rose 600 m above the summit and drifted WNW on 12 September. PVMBG noted that white-and-gray plumes rose 250-400 m above the summit and drifted W and NW on 13 and 16 September. White steam-and-gas plumes rose as high as 300 m and drifted W and NW on the other days. Webcam images captured incandescent material being ejected above the summit at 0101 on 13 September and summit incandescence at 1830 on 16 September. The Alert Level remained at 2 (on a scale of 1-4) and the public was warned to stay at least 2 km away from the summit crater.
Sources: Pusat Vulkanologi dan Mitigasi Bencana Geologi (PVMBG, also known as CVGHM), Darwin Volcanic Ash Advisory Centre (VAAC)
|
Mayon | 13 September-19 September 2023 | Continuing ActivityCite this Report |
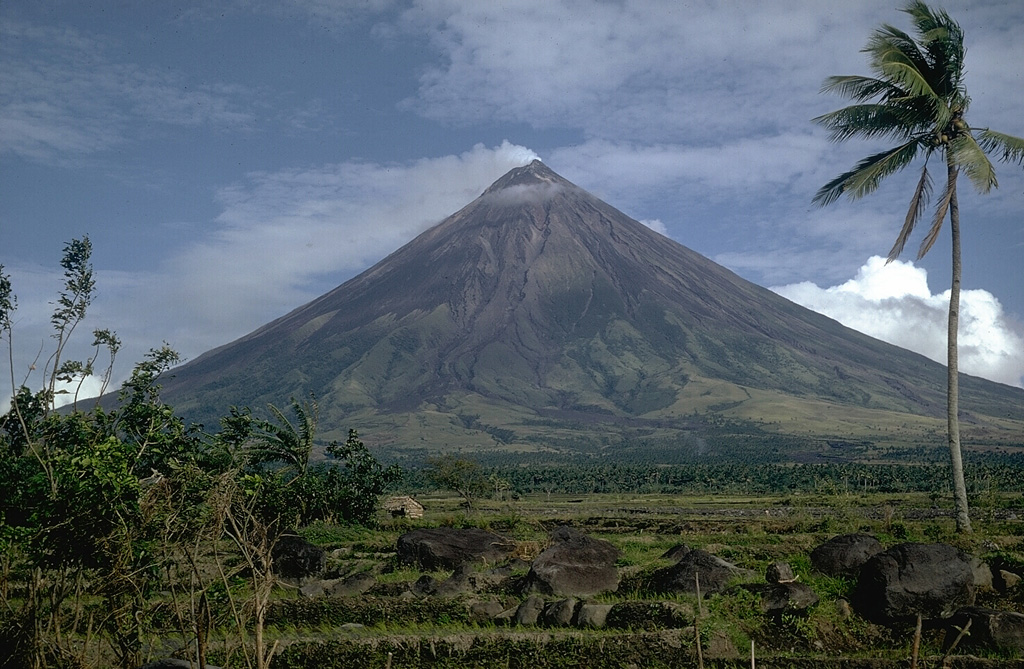 Mayon Mayon
Luzon (Philippines)
|
PHIVOLCS reported that the eruption at Mayon continued during 12-19 September. The lengths of the lava flow in the Mi-Isi (S), Bonga (SE), and Basud (E) drainages remained at 2.8 km, 3.4 km, and 1.1 km, respectively. Collapses at the lava dome and from the margins of the lava flows produced rockfalls and pyroclastic density currents (PDCs, or pyroclastic flows) that descended the flanks as far as 4 km. Each day seismic stations recorded 101-160 rockfall events, 1-6 PDC events, and 3-12 daily volcanic earthquakes. During 12-13 September the volcanic earthquake signals included one indicating an ash emission and a tremor event that lasted one minute. Daily sulfur dioxide emissions averaged between 765 and 1,551 tonnes per day, with the highest value recorded on 16 September. Electronic Distance Measuring (EDM), precise leveling, continuous GPS, and electronic tilt monitoring data showed that the volcano remained generally inflated relative to baseline levels; tilt and GPS monitoring data indicated pronounced inflation of the mid SE flank since the beginning of August 2023. The Alert Level remained at 3 (on a 0-5 scale) and residents were reminded to stay away from the 6-km-radius Permanent Danger Zone (PDZ). PHIVOLCS recommended that civil aviation authorities advise pilots to avoid flying close to the summit.
Source: Philippine Institute of Volcanology and Seismology (PHIVOLCS)
|
Merapi | 13 September-19 September 2023 | Continuing ActivityCite this Report |
 Merapi Merapi
Central Java
|
BPPTKG reported that the eruption at Merapi (on Java) continued during 8-14 September and seismicity remained at elevated levels. The SW lava dome produced a total of 162 lava avalanches that descended the S and SW flanks; 10 traveled as far as 1.5 km down the upper part of the Boyong drainage, 151 traveled as far as 2 km down the upper Bebeng drainage, and one traveled 1.2 km down the Sat/Putih drainage. Morphological changes to the SW lava dome were due to continuing collapses of material. The Alert Level remained at 3 (on a scale of 1-4), and the public was warned to stay 3-7 km away from the summit based on location.
Source: Balai Penyelidikan dan Pengembangan Teknologi Kebencanaan Geologi (BPPTKG)
|
Santa Maria | 13 September-19 September 2023 | Continuing ActivityCite this Report |
 Santa Maria Santa Maria
Southwestern Guatemala
|
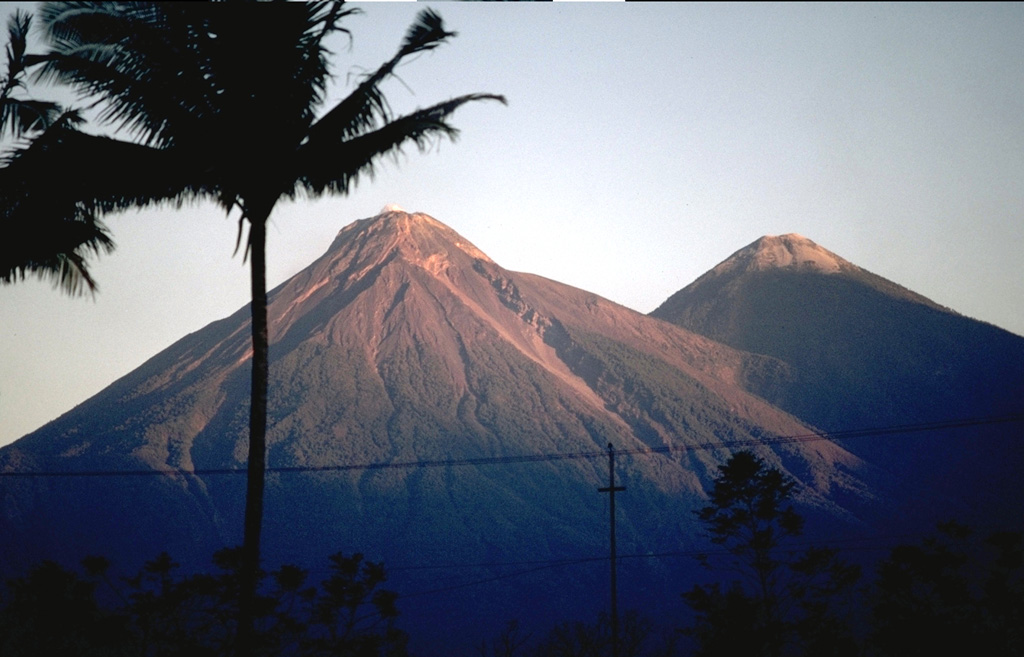
INSIVUMEH reported that eruptive activity continued at Santa Maria’s Santiaguito lava dome complex during 12-19 September. Incandescence from the dome was visible during most nights and early mornings, and occasionally from the lava flow on the WSW flank. Lava extrusion continued. Daily weak-to-moderate explosions generated gas-and-ash plumes that rose 900-1,000 m above the dome and drifted NW, W, and SW. Some explosions triggered incandescent avalanches that descended the dome’s flanks in all directions, and occasionally into drainages on the S, SE, and E flanks. Deposits from block-and-ash-flows accumulated on top of the lava flows in the Zanjón, Seco, and San Isidro drainages.
Source: Instituto Nacional de Sismologia, Vulcanologia, Meteorologia, e Hidrologia (INSIVUMEH)
|
Semeru | 13 September-19 September 2023 | Continuing ActivityCite this Report |
 Semeru Semeru
Eastern Java
|
PVMBG reported that eruptive activity continued at Semeru during 13-19 September. White-and-gray ash plumes rose 200-300 m above the summit and drifted W on 14 September. According to the Darwin VAAC a diffuse ash plume was identified in a satellite image rising to 4.2 km (14,000 ft) a.s.l. (610 m above the summit) and drifting SW at 0640 on 15 September. The Alert Level remained at 3 (third highest on a scale of 1-4). The public was warned to stay at least 5 km away from the summit in all directions, 13 km from the summit to the SE, 500 m from the banks of the Kobokan drainage as far as 17 km from the summit, and to avoid other drainages including the Bang, Kembar, and Sat, due to lahar, avalanche, and pyroclastic flow hazards.
Sources: Pusat Vulkanologi dan Mitigasi Bencana Geologi (PVMBG, also known as CVGHM), Darwin Volcanic Ash Advisory Centre (VAAC)
|
Sheveluch | 13 September-19 September 2023 | Continuing ActivityCite this Report |
 Sheveluch Sheveluch
Central Kamchatka (Russia)
|
KVERT reported that the eruption at Sheveluch continued during 7-14 September. Thermal anomalies were identified in satellite images on all days except 14 September (due to weather clouds). Plumes of resuspended ash drifted 160 km SE and E during 9-11 September. The Aviation Color Code remained at Orange (the third level on a four-color scale). Dates are based on UTC times; specific events are in local time where noted.
Source: Kamchatkan Volcanic Eruption Response Team (KVERT)
|
Shishaldin | 13 September-19 September 2023 | Continuing ActivityCite this Report |
 Shishaldin Shishaldin
Fox Islands (USA)
|
AVO reported that the eruption at Shishaldin continued during 13-19 September. Eruptive activity increased during 13-14 September. Elevated surface temperatures began to be identified in satellite images during the afternoon of 13 September and they increased later that night. Seismic tremor amplitudes began to increase at around 1800 and small explosions were detected in seismic and infrasound data. Incandescent lava at the summit was seen in a webcam image at 0134 on 14 September during a period of elevated tremor. No ash emissions were visible though high weather clouds may have obscured them.
Seismic tremor began to increase sometime around 0900 on 15 September and rapidly intensified. An explosive eruption began at around 1710, prompting AVO to the Aviation Color Code to Red (the highest color on a four-color scale) and the Volcano Alert Level to Warning (the highest level on a four-level scale). Within about 30 minutes ash plumes drifted E below a weather cloud deck at 8.2 km (27,000 ft) a.s.l., unseen in satellite views. The National Weather Service estimated that an ash-rich plume rose as high as 12.8 km (42,000 ft) a.s.l. and produced volcanic lightning. The upper parts of the plume detached by 1830, at about the same time that seismicity dramatically decreased. Lightning was again detected beginning around 1930, suggesting that ash emissions continued. Ongoing explosions were detected in infrasound data, at a lower level than during the most energetic phase of this event. Trace amounts of ash fell in False Pass (38 km ENE) during 1800-2030. Lightning was last detected at 2048. By 2124 the intensity of the eruption had decreased, and ash emissions were likely rising to altitudes less than 6.7 km (22,000 ft) a.s.l. Seismicity returned to pre-eruption levels; at 1244 on 16 September AVO lowered the Volcano Alert Level to Watch and the Aviation Color Code to Orange. A plume of sulfur dioxide emitted during 14-15 September was detected over the North Pacific. Seismicity remained elevated with tremor and small daily earthquakes occurring over 16-18 September. Elevated surface temperatures at the summit were identified in satellite data and minor steam emissions were visible in webcam views.
Source: US Geological Survey Alaska Volcano Observatory (AVO)
|
Suwanosejima | 13 September-19 September 2023 | Continuing ActivityCite this Report |
 Suwanosejima Suwanosejima
Ryukyu Islands (Japan)
|
JMA reported that the eruption at Suwanosejima's Ontake Crater continued during 11-18 September. Eruptive events at 0511 and 1228 on 15 September produced ash plumes that rose 1-1.8 km above the crater rim and drifted N and NW, respectively. Blocks were ejected as far as 300 m from the crater. The Alert Level remained at 2 (on a 5-level scale) and the public was warned to stay at least 1 km away from the crater.
Source: Japan Meteorological Agency (JMA)
|
Taal | 13 September-19 September 2023 | Continuing ActivityCite this Report |
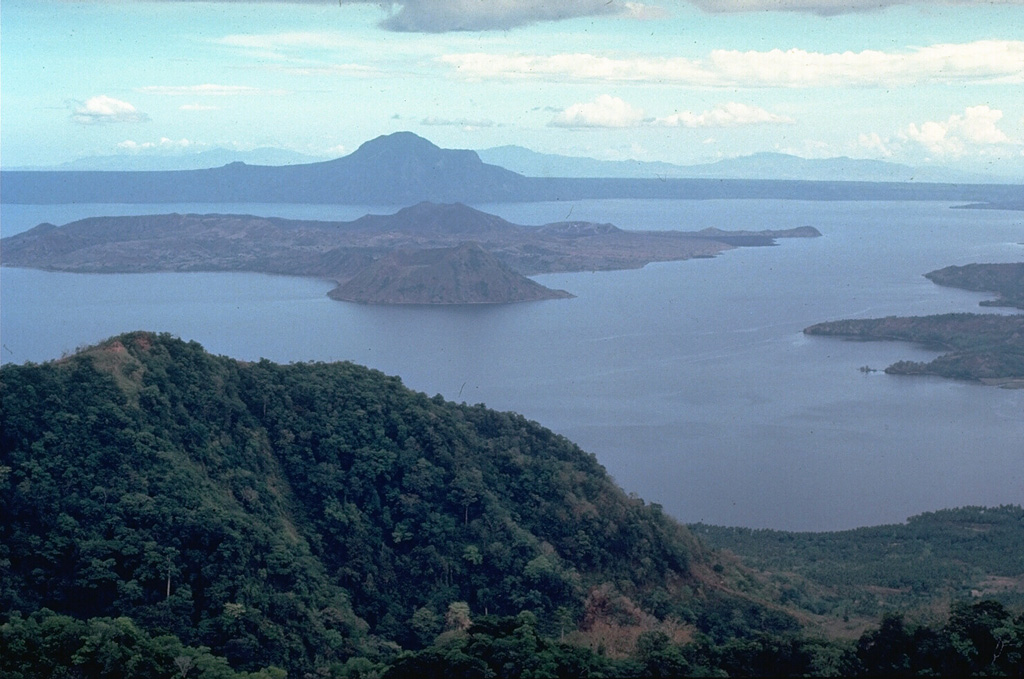 Taal Taal
Luzon (Philippines)
|
PHIVOLCS reported ongoing unrest at Taal during 13-18 September. Daily emissions of gas-and-steam rose from Main Crater Lake generally as high as 2.4 km, were sometimes voluminous, and drifted ENE, ESE, SW, and NW. Upwelling gasses and fluids in the lake were visible during daily observations. During 14-18 September there were 2-4 daily volcanic earthquakes recorded by the seismic network, including 1-3 daily periods of tremor each lasting 1-2 minutes long. Sulfur dioxide emissions averaged 3,264 tonnes per day on 15 September and coupled with taller steam-and-gas plumes that rose as high as 3 km, caused vog over Taal Lake beginning at around 1000. PHIVOLCS noted that vog had been affecting the Taal region since the first week of September. The Alert Level remained at 1 (on a scale of 0-5), and PHIVOLCS reminded the public that the entire Taal Volcano Island was a Permanent Danger Zone (PDZ).
Source: Philippine Institute of Volcanology and Seismology (PHIVOLCS)
|
Ubinas | 13 September-19 September 2023 | Continuing ActivityCite this Report |
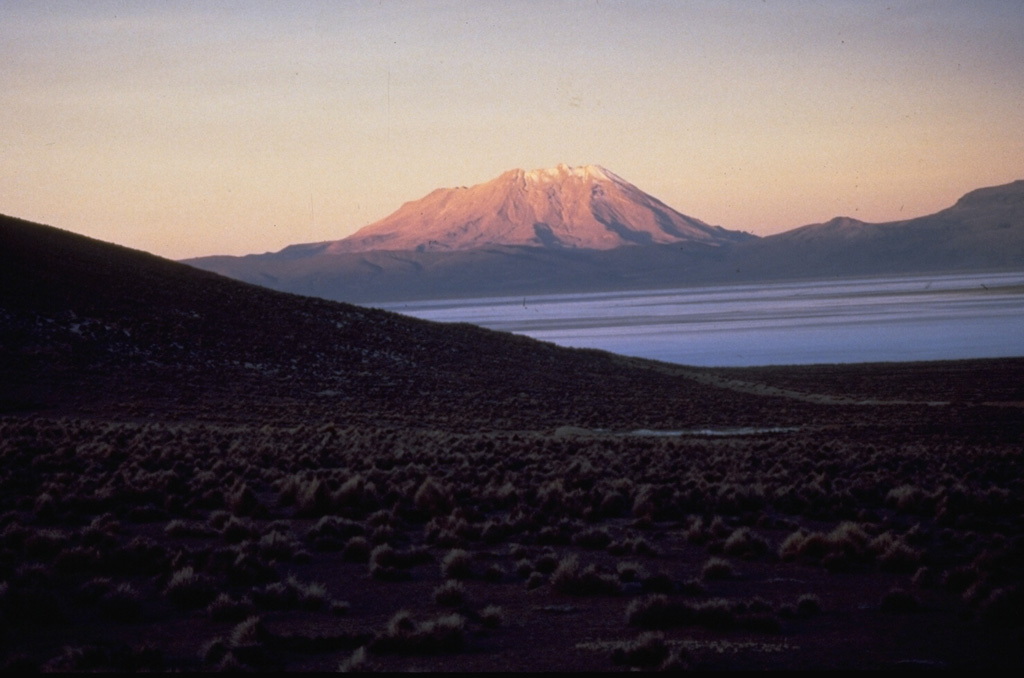 Ubinas Ubinas
Peru
|
Instituto Geofísico del Perú (IGP) reported that the eruption at Ubinas continued during 11-17 September at low-to-moderate levels. There were daily averages of 144 volcano-tectonic earthquakes indicating rock fracturing and 86 long-period earthquakes signifying the movement of gas and magma. One explosion was recorded on 14 September. INGEMMET noted that sulfur dioxide emissions were at low levels during 14-15 September, averaging 900 tons per day. Ash-and-steam plumes rose 1.6 km above the crater rim and drifted SE and NE, causing ashfall in areas within 5 km downwind. IGP noted that seismic signals associated with ash emissions were recorded for an average of three hours per day during 14-16 September. Ash, gas, and steam emissions visible in webcam images rose as high as 2.6 km above the crater rim and drifted as far as 15 km NE, E, and SE. Deformation data indicated a slight trend of inflation with variations less than 5 mm. The Alert Level remained at Orange (the third level on a four-color scale) and the public was warned to stay 4 km away from the crater.
Sources: Instituto Geofísico del Perú (IGP), Instituto Geológico Minero y Metalúrgico (INGEMMET)
|
Ulawun | 13 September-19 September 2023 | Continuing ActivityCite this Report |
 Ulawun Ulawun
New Britain (Papua New Guinea)
|
Rabaul Volcano Observatory (RVO) reported a small eruption at Ulawun during 14-15 September. Minor incandescence at the summit crater was first visible at around 2107 on 14 September from Ulamona Observatory. The incandescence intensified, and eruption plumes reflecting the glow were visible in webcam images drifting NE. Starting at about 0004 and lasting to about 0800 on 15 September there were brief periods when the plumes appeared darker, likely due to denser and more intense emissions. The plumes drifted W and WSW. Rumbling noises were reported, though they became less frequent by 0800. The Alert Level was raised to Stage 2 (the second level on the four-level scale).
Staff from the West New Britain Provincial Disaster Office conducted a field inspection on 15 September and found only minor ashfall around the volcano. During 0800 on 15 September to 1430 on 19 September the volcano was quiet; small volumes of diffuse white emissions sometimes rose from the summit and drifted W and WSW. On 19 September RVO recommended that the Alert Level should be lowered to Stage 1.
Increased seismicity coincided with the eruption. During most of 14 September RSAM values were 200-300, though they began to increase at about 1955 and reached a value of around 800 by midnight. RSAM continued to increase; values reached 1,600 by 0100 on 15 September, rapidly increased during 0100-0200, and reached a value of 4,060 almost two hours later at 0300. Seismicity was dominated by continuous low-frequency volcanic tremors. Seismicity began to decline at 0700, reached background levels by 0900, and remained low with values of 200-450. During 16-19 September seismicity was characterized by low level volcanic tremors with sporadic occurrences of discrete, small, low-frequency volcanic events. RSAM values were around 200.
Source: Rabaul Volcano Observatory (RVO)
|
Villarrica | 13 September-19 September 2023 | Continuing ActivityCite this Report |
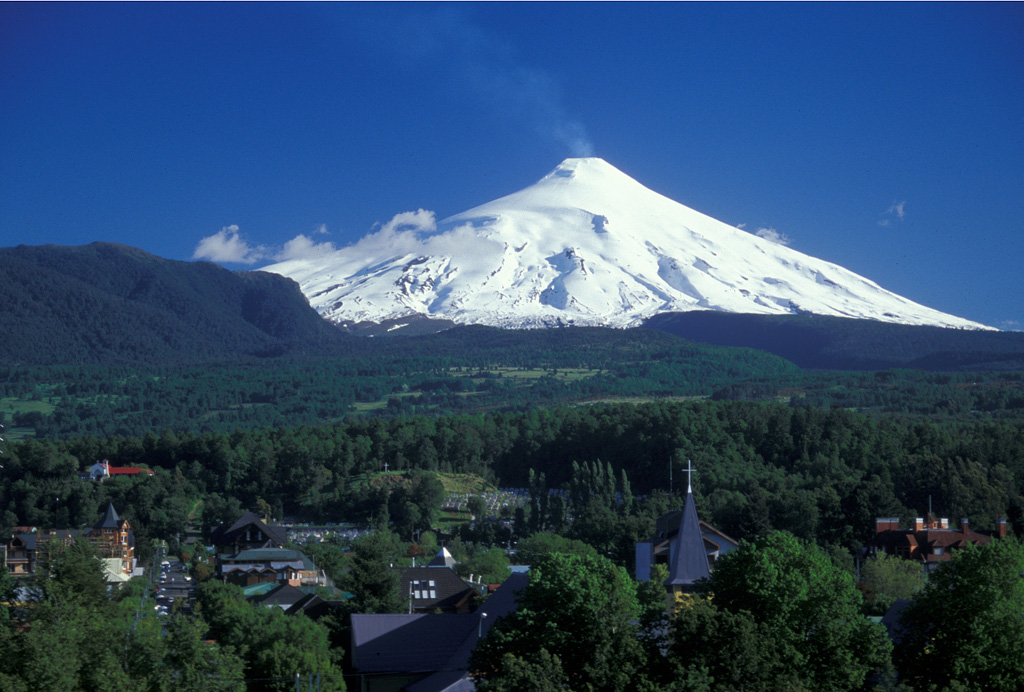 Villarrica Villarrica
Central Chile
|
SERNAGEOMIN reported that the eruption in Villarrica’s summit crater was ongoing during 13-19 September. Long-period (LP) earthquakes were recorded at 0622 on 15 September and at 0426 and 0723 on 16 September; weather conditions prevented views of the summit during these events. An LP earthquake at 0130 on 18 September was associated with crater incandescence and a gas-and-steam plume that rose 120 m above the crater rim. The Volcanic Alert level remained at Yellow (the second highest on a four-level scale) according to SERNAGEOMIN and the public was warned to stay 500 m away from the crater. SENAPRED maintained the Alert Level at Yellow (the middle level on a three-color scale) for the communities of Villarrica, Pucón (16 km N), Curarrehue, and Panguipulli.
Sources: Servicio Nacional de Geología y Minería (SERNAGEOMIN), Sistema y Servicio Nacional de Prevención y Repuesta Ante Desastres (SENAPRED)
|
Yasur | 13 September-19 September 2023 | Continuing ActivityCite this Report |
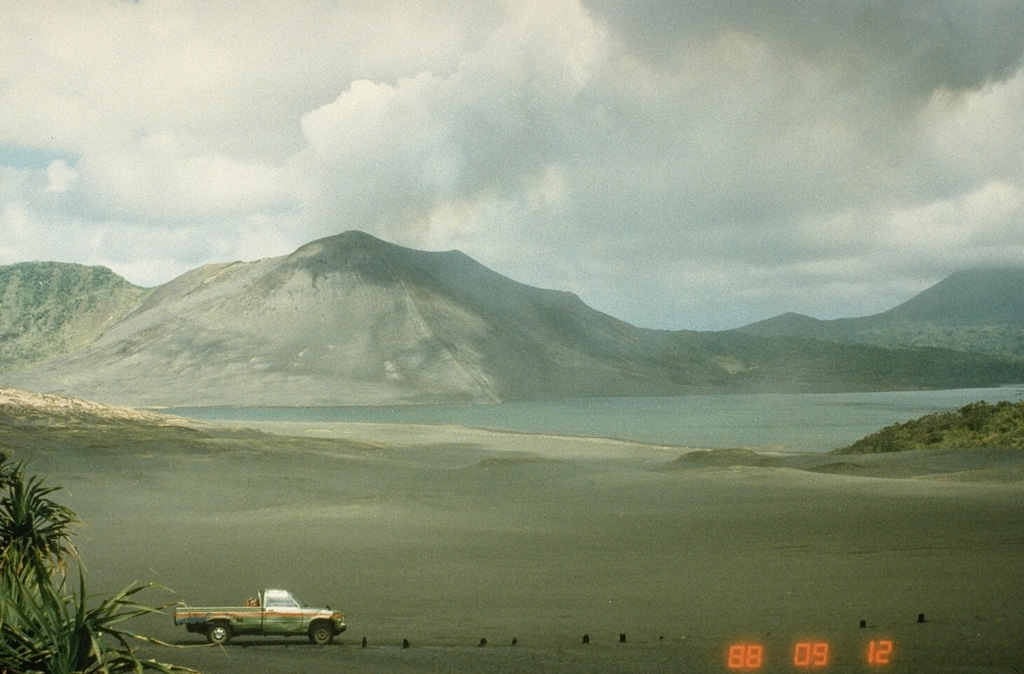 Yasur Yasur
Vanuatu
|
Vanuatu Meteorology and Geohazards Department (VMGD) reported that Yasur emitted a substantial ash cloud during 1400-1700 on 12 September based on reports from nearby observers. The plumes drifted SE; VMGD warned that areas around White Sands, 3 km N, may experience impacts from ashfall and gas. The volcano had returned to normal levels by the next day. The Alert Level remained at 2 (the middle level on a scale of 0-4).
Source: Vanuatu Meteorology and Geohazards Department (VMGD)
|
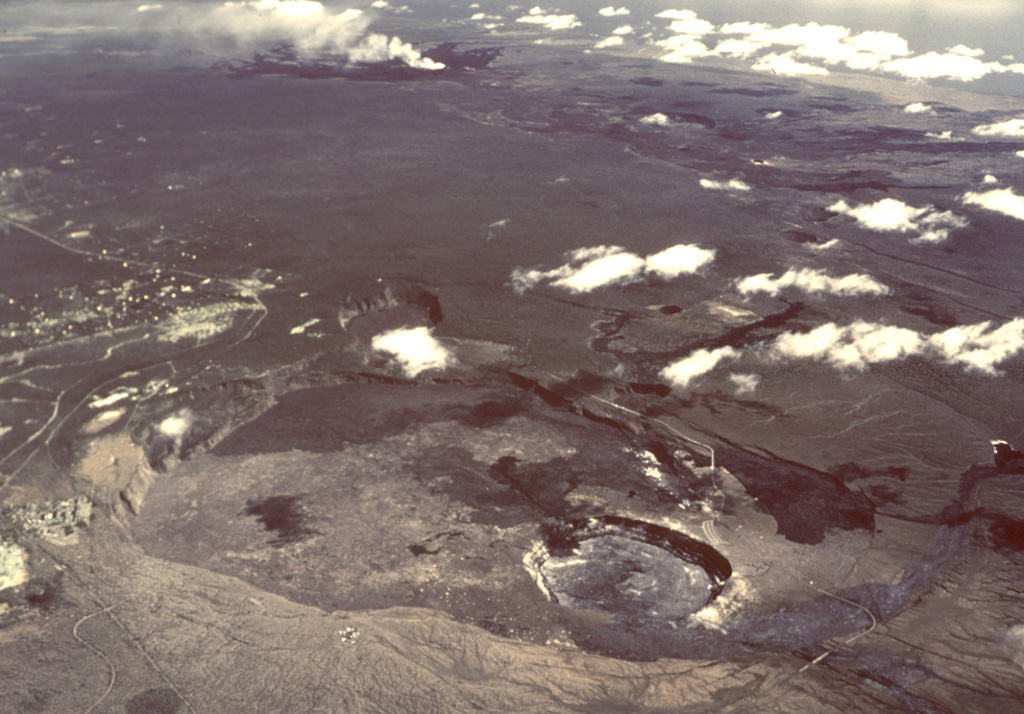 Kilauea
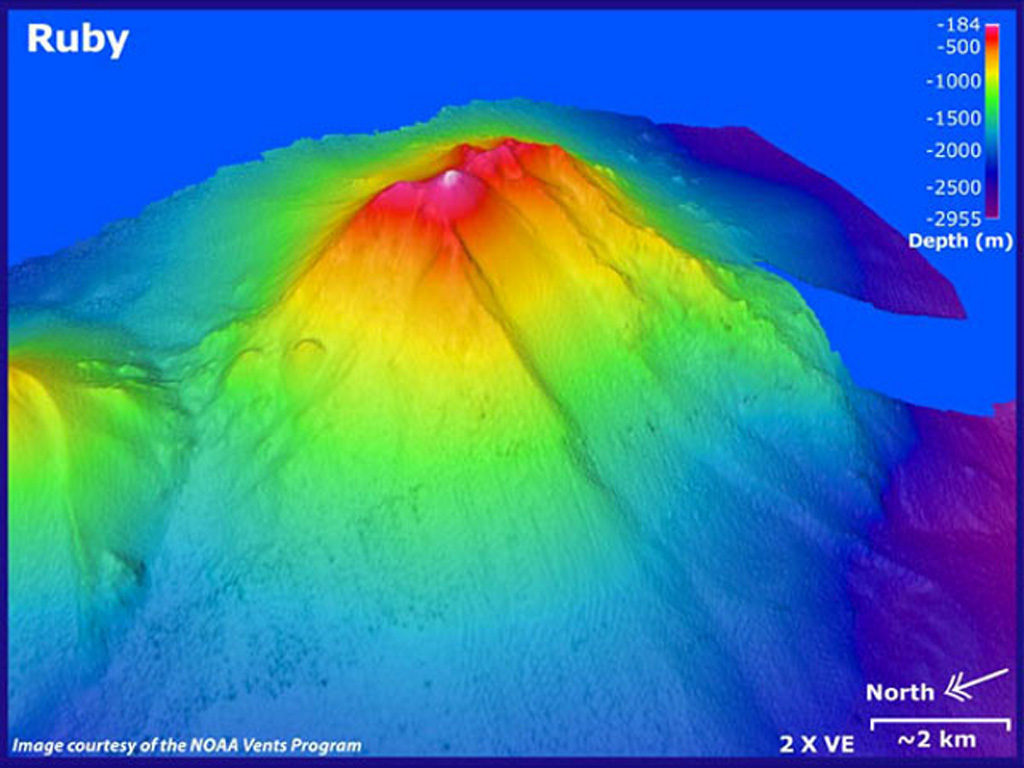 Ruby
Ruby