

According to a news article from 27 October, a scientist at the University of Iceland Institute of Earth Sciences noted that the eruption of Eyjafjallajökull, that began as a fissure eruption on 20 March 2010 and later continued from the summit caldera on 14 April, was over. Ash was last seen rising from the caldera in June.
Source: Iceland Review
Eruption ended in late June 2010; sample of growing literature on the eruption
Gudmundsson and others (2010a) noted that the last day of sustained activity at Eyjafjallajökull took place on 22 May 2010. By 23 June 2010, the Iceland Meteorological Office (IMO) and the University of Iceland Institute of Earth Sciences (IES) ceased issuing regular status reports. In addition to discussing the eruption and its final stages, this report also cites a small sample of abstracts and papers from the numerous conferences, sessions, and publications that have thus far emerged on the eruption.
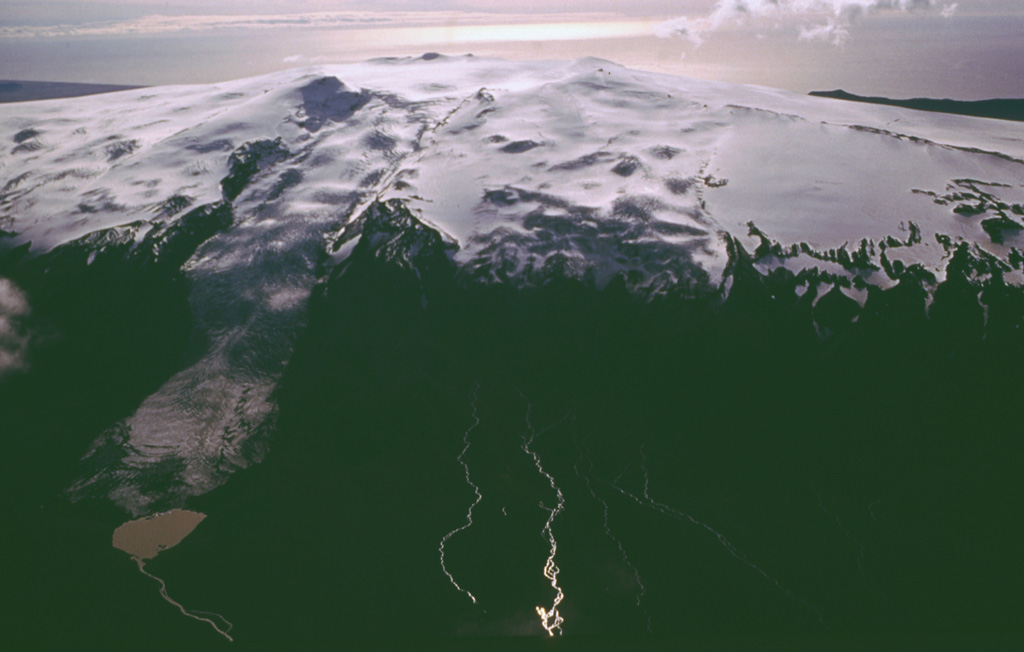
The eruption's initial phase, 20 March-12 April 2010, occurred at Fimmvörðuháls, a spot on the E flanks of Eyjafjallajökull (figure 16, and "F" and "E" on figure 17). Venting at Fimmvörðuháls took place on an exposed ridge cropping out in a region with extensive glaciers to the E and W. Eruptions began in the initially ice-capped summit crater of Eyjafjallajökull on 14 April 2010 (BGVN 35:03 and 35:04). After melting overlying portions of the icecap, the summit crater then emitted clouds of fine-grained ash that remained suspended in the atmosphere for long distances. The ash blew both over the Atlantic and for considerable intervals passed directly over Europe, halting flights of most commercial aircraft for nearly a week in a controversial shutdown with economic impacts in the billions.
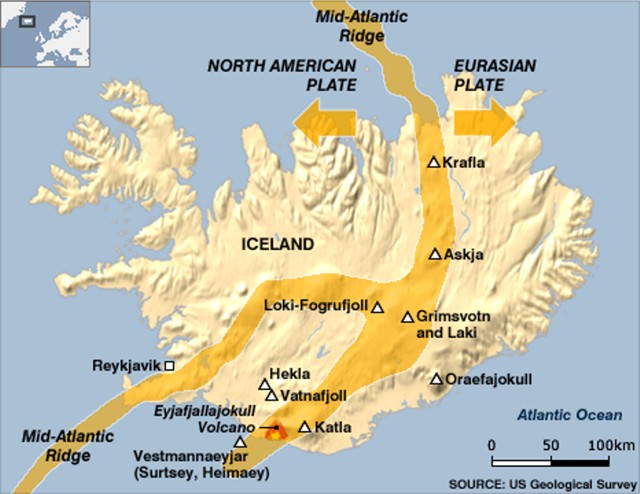 |
Figure 16. Index map showing Iceland, some major plate-tectonic features and generalized spreading directions, and the location of Eyjafjallajökull volcano. Note proximity of Eyjafjallajökull to Katla and to the volcanoes of the Vestmann island area (Vestmannaeyjar), Surtsey and Heimaey. Courtesy of USGS. |
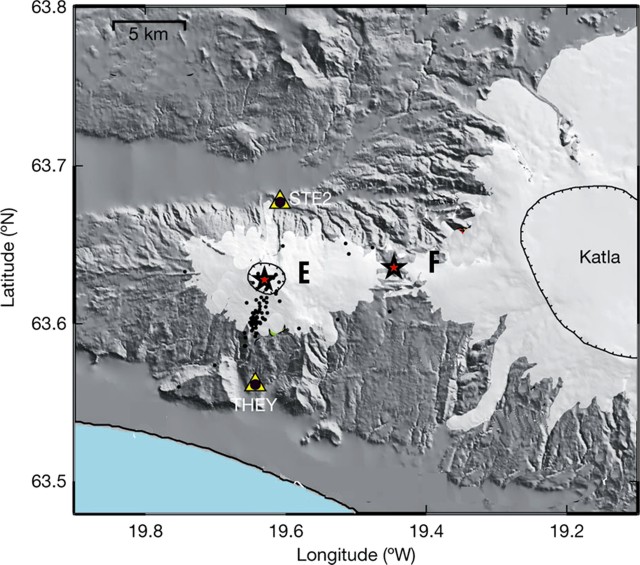 |
Figure 17. A shaded-relief map showing Eyjafjallajökull (E), and 9 km to its E, the flank vent Fimmvörðuháls (F). Stars indicate 2010 eruptive sites (map scale at top left). Glaciers cover extensive portions of both Eyjafjallajökull and Katla volcanoes (light pattern). During 14-29 April 2010 many earthquakes struck with epicenters along the N-S axis of Eyjafjallajökull (black dots). The map includes a small slice of the Atlantic ocean along the lower left-hand margin. Two of four geodetic (GPS) stations are shown (STE2 and THEY). Revised from a map by Sigmundsson and others (2010). |
In terms of satellite thermal data on the overall eruption, the MODVOLC system measured extensive (multi-pixel) daily alerts during 21 March-21 May 2010, but the alerts became absent thereafter.
Venting at Fimmvörðuháls. At a 15-19 September 2010 conference on the eruption, Höskuldsson and others (2010a) characterized the course of events during the 20 March to 12 April basaltic Fimmvörðuháls flank eruption at Eyjafjallajökull as follows: "At the beginning the eruption featured as many as 15 lava fountains with maximum height of 150 m. On March 24 only four vents were active with fountains reaching to heights of 100 m. On March 31 and April 1 the activity was characterized by relatively weak fountaining through a forcefully stirring pool of lava. The vents were surrounded by 60-80 m high ramparts and the level of lava stood at approximately 40 m. This high stand led to opening of a new fissure trending northwest from the central segment of the original fissure. As activity on the new fissure intensified, the discharge from the original fissure declined and stopped on April 7.
"The intensity of the lava fountains varied significantly on the time scale of hours and was strongly influenced the level of the lava pond in the vents, producing narrow, gas-charged, piston-like fountains during periods of low lava levels, but spray-like fountains when the lava level was high . . ..
"The eruption produced a fountain-fed lava flow field with an area of about 1.3 km2. Initially (20-25 March), the lava advanced towards northeast, but on March 26 the lava began advancing to the west and northwest, especially after April 1 when the activity became concentrated on the new fissure. The flow field morphology is dominantly 'a'a, but domains of pahoehoe and slabby pahoehoe are present, particularly in the western sector of the flow field. The advance of the lava from the vents was episodic; when the lava stood high the lava surged out of the vents, but at low stand there was a lull in the advance. The lava discharged from the vents through open channels as well as internal pathways. The open channels were the most visible part of the transport system, feeding lava to active 'a'a flow fronts and producing spectacular lava falls when cascading into deep gullies just north of the vents. The role of internal pathways was much less noticeable, yet an important contribution to the overall growth of the flow field as it fed significant surface breakouts emerging on the surface of what otherwise looked like stagnant lava. When activity stopped on April 12 the fissure had issued about 0.025 km3 of magma, giving a mean discharge of 13 m3/s."
Summit eruption. The second eruption occurred within the initially ice-covered caldera of Eyjafjallajökull. Opening of the ice cover and explosivity into the atmosphere was amplified by magma-ice interaction that produced a fine ash capable of suspension in the atmosphere for prolonged periods.
Höskuldsson and others (2010b) described the eruption at Eyjafjallajökull's summit (beginning 14 April 2010) as consisting of three phases (table 2). They also stated that at the summit the "Total amount of tephra produced in the eruption is about 0.11 km3 and that of lava 0.025 km3 DRE [dense-rock equivalent]. Average discharge rate in the eruption was about 40 m3/s DRE or about 4 times that of Fimmvörðuháls eruption."
Table 2. Three phases of the eruption at Eyjafjallajökull volcano's summit beginning 14 April 2010 as summarized and condensed by Höskuldsson and others (2010b).
| Dates | Phase | Description of Activity |
| 14 Apr-17 Apr 2010 | I | Plumes often under 6 km but up to ~9 km altitude. |
| 18 Apr-04 May 2010 | II | High tremor with lava flows; generally weak and ash-poor plumes. Pulsating activity with small discrete explosions every few seconds. Tephra grains had fluidal shapes suggesting magmatic fragmentation and decreased viscosity of erupting magma. Plumes on 28th to 7 km altitude. |
| 05 May-22 May 2010 | III | Plumes up to 5 km altitude. |
The summit area was still steaming and geothermally active, and the eruption channel was still very hot in October 2010 (figure 18). Investigators expected that cooling to ambient temperatures would take a few years . As noted below, during June 2010, hot lava could still be seen in cracks in the cooled rock on Fimmvörðuháls, and inside craters, but that was not the case at the ice-engulfed summit caldera.
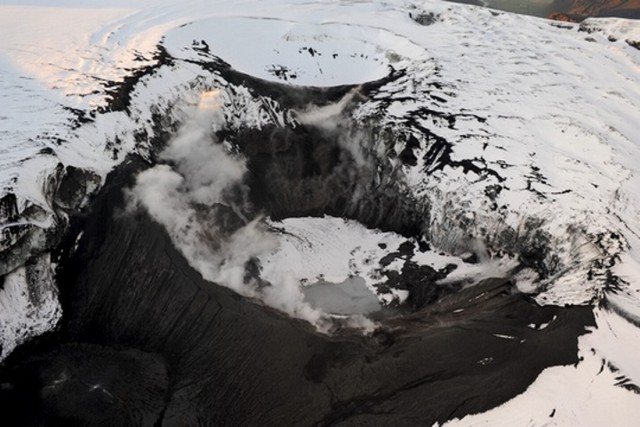 |
Figure 18. The summit crater complex of Eyjafjallajökull taken after the first winter snow, as seen from the air at 0810 on 9 October 2010. The scene helps explain the high degree of water and ice interaction with the erupting lavas. Snow had melted from numerous ash and lava-covered surfaces (black areas). Although portions of the crater emitted steam, evidence of substantial ongoing lava emissions were absent at this point in time. Photo courtesy of Ólafur Sigurjónsson, IMO. |
According to Gudmundsson and others (2010b) the summit eruption produced 0.1-0.2 km3 (dense rock equivalent) of tephra. IES reported that by 11 June 2010 a lake about 300 m in diameter had formed in the large summit crater, and by 23 June water was slowly accumulating in the crater because ice was no longer in contact with hot material.
Intrusion triggering. Sigmundsson and others (2010) noted that the 2010 eruptions came after 18 years of intermittent volcanic unrest. The deformation associated with the eruptions was unusual because it did not relate to pressure changes within a single source. Deformation was rapid before the flank eruption (0.5 mm per day after 4 March 2010), but negligible during it.
During the summit eruption (beginning 14 April 2010) gradual contraction of a source, distinct from the pre-eruptive inflation sources, was evident from geodetic data. Thus, clear signals of volcanic unrest may occur over years to weeks, indicating reawakening of such volcanoes, whereas immediate short-term eruption precursors may be subtle and difficult to detect.
Figure 19 shows a cross-sectional model of the shallow crust by Sigmundsson and others (2010) based deformation and seismic analyses of the 2010 event. A previous issue of the Bulletin (BGVN 35:03) contained an alternate model by Paul Einarsson.
 |
Figure 19. Schematic E-W cross-section across the Eyjafjallajökull summit area, with deformation sources plotted at their best-fit depth (vertical exaggeration of 2). Gray shaded background indicates source-depth uncertainties (95% confidence interval), which overlap. Courtesy of Sigmundsson and others (2010). |
Processed satellite image. Vincent J. Realmuto created two composite figures generated from the MODIS-Terra satellite data acquired 15 April 2010 at 1135 UTC (figure 20). Outlined in black in each image are Iceland on the upper left side (W), Faroe Islands in the center, Scotland and N Ireland in the lower center, and part of the Scandinavian peninsula on the right side (E). An ash plume can be seen in each image extending from Iceland SW toward Europe. The left-hand image is the true-color RGB (red-green-blue) composite and the right-hand image is a false-color composite; in the right-hand rendition the ash plume appears red and the ice-rich clouds appear blue. The right-hand image puts obvious emphasis on the ash plume and shows it streaming and more or less intact for several hundreds of kilometers E of Iceland.
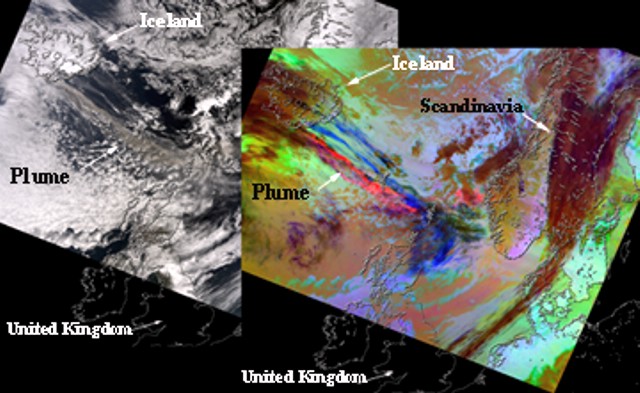 |
Figure 20. Graphics generated from the MODIS-Terra satellite data acquired 15 April 2010 at 1135 UTC. The left-hand graphic is a true-color RGB (red-green-blue) composite, and the right-hand image is a false-color composite of Bands 32, 31, and 29 (12, 11, and 8.5 um, respectively) displayed in red, green, and blue, respectively. These data were processed with the decorrelation stretch (D-stretch), a technique for enhancing spectral contrast based on principal components analysis. In this rendition the ash plume appears red and the ice-rich clouds appear blue. The D-stretch was based on scene statistics and was intended to be a quick method for discriminating material that may be volcanic in origin. Courtesy of Vincent J. Realmuto, Jet Propulsion Laboratory, California Institute of Technology. |
Conference field trip. Following The Atlantic Conference on Eyjafjallajökull and Aviation in Iceland, 15-16 September 2010 (discussed below), a field trip brought scientists to accessible areas on the volcano, including the flank vent on Fimmvörðuháls ridge where the eruption began. John and Liudmila Eichelberger provided some photographs from this trip (figure 21). The same base map appeared in BGVN 35:03, with the key and other data. The horseshoe shape of the lava distribution in this figure is the feature imaged by an ASTER satellite thermal signature as active lava flows on 19 April 2010 in BGVN 35:03.
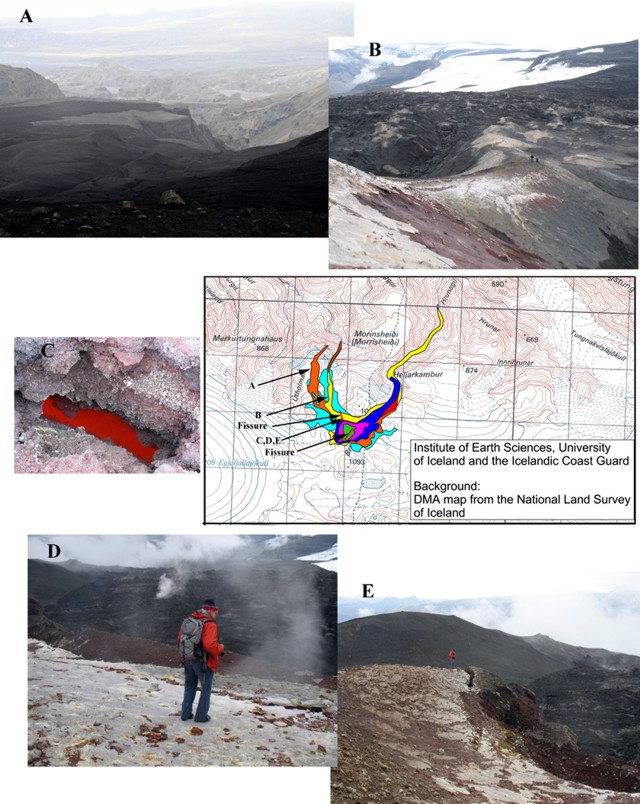 |
Figure 21. (Central panel) Map showing fissures at Fimmvörðuháls (thin red lines) and the distribution of new scoria and lava deposited at various points in time (shaded areas) during 21 March-7 April 2010. Marked arrows on the map give locations of labeled photos (A-E) taken 18 September 2010. (A) Fresh lava (darker) seen looking N. In the distance appear fresh black lava flows, some portions of which formed the lava falls down the valley walls. (B) View showing the elongate ridge as seen from the upslope perspective (people in the distance for scale). (C, looking down) Glowing lava (~1.5 m long and ~0.3 m wide) at the bottom of a fissure. This photo was taken with a flash, otherwise the fissure walls would have been very dark. (D) The fracture indicated on the map as it appeared near the rim of the ridge of newly erupted lava. (E) The same fracture seen in D from another perspective. Courtesy of John and Ludmilla Eichelberger. |
More on conferences and publications. Recently, several conferences have been held and many publications have been issued relevant to the eruption. What follows is a mere sample of the available resources, many of which emphasized plume research. At the American Geophysical Union (AGU) 2010 Fall Meeting, several sessions focused on the 2010 eruption (eg., Carn and others, 2010; see References for the link to abstracts volume).
The Workshop on Ash Dispersal Forecast and Civil Aviation held in Geneva, 18-20 October 2010, addressed the characteristics and range of application of different volcanic ash transport and dispersal models (VATDM), identifying the needs of the modeling community, investigating new data acquisition strategies, and discussing how to improve communication between the volcanology community and operational agencies (eg., Bonadonna and others, 2011).
The Cities on Volcanoes conference (COV-6; Tenerife, Canary Islands, Spain, 31 May-4 June 2010) included both papers (eg. Fischer and others, 2010) and a forum on the "Assessment of volcanic ash threat: learning and considerations from the Eyjafjallajökull eruption."
In addition, several other papers relevant to the eruption were presented during this meeting, as well as at the Annual Meeting of the American Meteorological Society (AMS) in Seattle, WA, in January 2011, and at the European Geosciences Union (EGU) 2011 General Assembly in Vienna, Austria.
The journal Atmospheric Chemisrty and Physics published multiple issues with a section entitled "Atmospheric implications of the volcanic eruptions of Eyjafjallajökull, Iceland 2010." These and other papers discussed various means of plume detection, and in some cases, sampling, including on the ground, in ultralight aircraft, and on satellites; models of plume dispersion were evaluated (Flentje and others, 2010; Emeis and others, 2011; Vogel and others, 2011; Fischer and others, 2010).
According to Loughlin (2010), scientists from the British Geological Survey found large ash particles from the eruption in the United Kingdom. Most of the very small ash particles in volcanic plumes fell as clusters of particles known as aggregates. The aggregation could have resulted from a number of mechanisms, including electrostatic attraction, particle collisions, condensation of liquid films and secondary mineralization. The process of aggregation effectively removed very small particles from the plume and was therefore one variable on how long ash particles stay in the atmosphere. Ripley (2010) and Chivers (2010) published articles on the U.K. Met Office's tracking and prediction of movements of volcanic ash based on observations from the Eyjafjallajökull eruption.
Gislason and others (2011) reported on analyses of two sets of fresh, comparatively dry ash samples that fell in Iceland and were collected rapidly on 15 and 27 April, during more and less explosive phases, respectively. Both sets of samples were kept dry and analyzed swiftly to minimize issues with hydration and alteration, particularly to salts on the ash surfaces. The ash was dominantly glass of andesitic composition (57-58% SiO2). They found the ash particles especially sharp and abrasive over their entire size range, from submillimeter to tens of nanometers.
References. Bonadonna, C., Folch, A., and Loughlin, S., 2011, Future Developments in Modeling and Monitoring of Volcanic Ash Clouds, Eos, Transactions of the American Geophysical Union (AGU), v. 92, no. 10; pp. 85-86, DOI: 10.1029/2011EO100008 (URL: http://www.agu.org/pub/eos/).
Carn, S.A., Karlsdottir, S., and Prata, F., 2010, The 2010 Eruption of Eyjafjallajokull: A Landmark Event for Volcanic Cloud Hazards I, II, and III, Abstracts V41E, V53F, and V54C presented at 2010 Fall Meeting, American Geophysical Union, San Francisco, CA, 13-17 December 2010 (URL: http://www.agu.org/meetings/fm10/program/index.php).
Chivers, H., 2010, Dark Cloud: VAAC and predicting the movement of volcanic ash, Meterological Technology International, June 2010, pp. 62-65.
Emeis, S., Forkel, R., Junkermann, W., Schäfer, K., Flentje, H., Gilge, S., Fricke, W., Wiegner, M., Freudenthaler, V., Groß, S., Ries, L., Meinhardt, F., Birmili, W., Münkel, C., Obleitner, F., and Suppan, P., 2011, Measurement and simulation of the 16/17 April 2010 Eyjafjallajökull volcanic ash layer dispersion in the northern Alpine region, Atmospheric Chemistry and Physics, v. 11, pp. 2689-2701.
Fischer, C., van Haren, G., Pohl, T., Vogel, A., and Weber, K., 2010, Airborne in-situ measurements of the volcanic ash dust plume over a part of Germany caused by the volcano eruption of the Eyjafjallajökull (Iceland) by means of an optical particle counter and a light
sport aircraft, Abstract, Session 1.3, p. 229, Cities on Volcanoes 6 Conference (URL: http://www.citiesonvolcanoes6.com/ver.php).
Flentje, H., Claude, H., Elste, T., Gilge, S., Köhler, U., Plass-Dülmer, C., Steinbrecht, W., Thomas, W., Werner, A., and Fricke W., 2010, The Eyjafjallajökull eruption in April 2010 - detection of volcanic plume using in-situ measurements, ozone sondes and lidar-ceilometer profiles, Atmospheric Chemistry and Physics, v. 10, pp. 10085-10092, DOI: 10.5194.
Gasteiger, J., Groß, S., Freudenthaler, V., and Wiegner, M., 2011, Volcanic ash from Iceland over Munich: mass concentration retrieved from ground-based remote sensing measurements, Atmospheric Chemistry and Physics, v. 11, pp. 2209-2223.
Gislason, S.R., Hassenkam, T., Nedel, S., Bovet, N., Eiriksdottir, E.S., Alfredsson, H.A., Hem, C.P., Balogh, Z.I., Dideriksen, K., Oskarsson, N., Sigfusson, B., Larsen, G., and Stipp, S.L.S., 2011, Characterization of Eyjafjallajökull volcanic ash particles and a protocol for rapid risk assessment, Proceedings of the National Academy of Sciences, v. 108, no. 18, p. 7303-7312.
Gudmundsson, M. T., Pedersen, R., Vogfjörd, K., Thorbjarnardóttir, B., Jakobsdóttir, S., and Roberts, M.J., 2010a, Eruptions of Eyjafjallajökull Volcano, Iceland, Eos, Transactions of the American Geophysical Union (AGU), v. 91, no. 21, p. 190, DOI: 10.1029/2010EO210002.
Gudmundsson, M.T., Thordarson, T., Hoskuldsson, A., Larsen, G., Jónsdóttir, I., Oddsson, B., Magnusson, E., Hognadottir, T., Sverrisdottir, G., Oskarsson, N., Thorsteinsson, T., Vogfjord, K., Bjornsson, H., Pedersen, G.N., Jakobsdottir, S., Hjaltadottir, S., Roberts, M.J., Gudmundsson, G.B., Zophoniasson, S., and Hoskuldsson, F., 2010b, The Eyjafjallajökull eruption in April-May 2010; course of events, ash generation and ash dispersal, EOS, Transactions of the American Geophysical Union (AGU), V. 91, no. 21, Abstract V53F-01, 2010 Fall Meeting, AGU, San Francisco, Calif., 13-17 December (URL: http://www.agu.org/cgi-bin).
Heue, K.-P., Brenninkmeijer,C.A.M., Baker, A. K., Rauthe-Schöch, A., Walter, D., Wagner, T., Hörmann, C., Sihler, H., Dix, B., Frieß, U., Platt, U., Martinsson, B. G., van Velthoven, P.F.J., Zahn, A., and Ebinghaus, R., 2011, SO2 and BrO observation in the plume of the Eyjafjallajökull volcano 2010: CARIBIC and GOME-2 retrievals, Atmospheric Chemistry and Physics, v. 11, pp. 2973-2989.
Höskuldsson, A., Magnusson, E., Guðmundsson, M.T., Sigmundsson, F., and Sigmarsson, O., 2010a, The 20 March to 12 April basaltic Fimmvörðuháls flank eruption at Eyjafjallajökull volcano, Iceland: Course of events, abstract of presentation in Program of the Eyjafjallajökull and Aviation Conference (15-16 September 2010) and associated Eyjafjallajökull Eruption Workshop (Hotel Hvolsvellir, 17-19 September 2010); (URL: http://en.keilir.net/keilir/conferences/eyjafjallajokull/volcanological-workshop).
Höskuldsson, Á., Larsen, G., Gudmundsson, M.T., Oddsson, B., Magnússon, E., Sigmarsson, O., Óskarsson, N., Jónsdóttir, I., Sigmundsson, F., Einarsson, P., Hreinsdóttir, S., Pedersen, R., Högnadóttir, Þ., Thordarson, T., Hayward, C., Hartley, M., Meara, R., Arason, Þ., Karlsdóttir, S., and Petersen, G.N., 2010b, The Eyjafjallajökull eruption April to May 2010: Magma fragmentation, plume and tephra transport, and course of events, abstract of presentation in Program of the Eyjafjallajökull and Aviation Conference (15-16 September 2010) and associated Eyjafjallajökull Eruption Workshop (17-19 September 2010); (URL: http://en.keilir.net/keilir/conferences/eyjafjallajokull/volcanological-workshop).
Laursen, L., 2010, Iceland eruptions fuel interest in volcanic gas monitoring, Science, v. 328, no. 5977, p. 410-411.
Loughlin, S., 2010, Modelling of Iceland volcanic ash particles, news item from British Geological Survey (URL: http://www.bgs.ac.uk/research/highlights/IcelandAshParticles.html?src=sfb).
Ripley, T., 2010, Cloud Busting: How the UK is tracking the volcanic ash cloud, Meterological Technology International, June 2010, pp. 6-10.
Schumann, U., Weinzierl, B., Reitebuch, O., Schlager, H., Minikin, A., Forster, C., Baumann, R., Sailer, T., Graf, K., Mannstein, H., Voigt, C., Rahm, S., Simmet, R., Scheibe, M., Lichtenstern, M., Stock, P., Rüba, H., Schäuble, D., Tafferner, A., Rautenhaus, M., Gerz, T., Ziereis, H., Krautstrunk, M., Mallaun, C., Gayet, J.-F., Lieke, K., Kandler, K., Ebert, M., Weinbruch, S., Stohl, A., Gasteiger, J., Groß, S., Freudenthaler, V., Wiegner, M., Ansmann, A., Tesche, M., Olafsson, H., and Sturm, K., 2011, Airborne observations of the Eyjafjalla volcano ash cloud over Europe during air space closure in April and May 2010, Atmospheric Chemistry and Physics, v. 11, pp. 2245-2279.
Sigmundsson, F., Hreinsdóttir, S., Hooper, A., Árnadóttir, T., Pedersen, R., Roberts, M.J., Óskarsson, N., Auriac, A., Decriem, J., Einarsson, P., Geirsson, H., Hensch, M., Ófeigsson, B.G., Sturkell, E., Sveinbjörnsson, H., and Feigl, K.L., 2010, Letter: Intrusion triggering of the 2010 Eyjafjallajökull explosive eruption, Nature, v. 468, pp. 426-430.
Stohl, A., Prata, A.J., Eckhardt, S., Clarisse, L., Durant, A., Henne, S., Kristiansen, N.I., Minikin, A., Schumann, U., Seibert, P., Stebel, K., Thomas, H.E., Thorsteinsson, T., Tørseth, K., and Weinzierl, B., 2011, Determination of time- and height-resolved volcanic ash emissions and their use for quantitative ash dispersion modeling: the 2010 Eyjafjallajökull eruption, Atmospheric Chemistry and Physics, v. 11, pp. 4333-4351.
Vogel, A., Weber, K., Fischer, C., van Haren, G., Pohl, T., Grobety, B., and Meier, M., 2011, Airborne in-situ measurements of the Eyjafjallojökull ash plume with a small aircraft and optical particle spectrometers over north-western Germany - comparison between the aircraft measurements and the VAAC-model calculations, European Geophysical Union General Assembly, Geophysical Research Abstracts, v. 13, p. EGU2011-13253.
Information Contacts: Institute of Earth Sciences (IES), University of Iceland, Sturlugata 7, Askja , 101 Reykjavík (URL: http://www.earthice.hi.is/); Icelandic Meteorological Office (IMO) (URL: http://en.vedur.is/earthquakes-and-volcanism/articles/nr/1884); U.K. Meteorological Office (URL: http://www.metoffice.gov.uk); ármann Höskuldsson, Institute of Earth Sciences (IES), University of Iceland, Sturlugata 7, Askja , 101 Reykjavík (URL: http://www.earthice.hi.is); Hawai'i Institute of Geophysics and Planetology (HIGP) MODVOLC Thermal Alerts System, School of Ocean and Earth Science and Technology (SOEST), Univ. of Hawai'i, 2525 Correa Road, Honolulu, HI 96822, USA (URL: http://modis.higp.hawaii.edu/); Sue C. Loughlin, The British Geological Survey, Murchison House, West Mains Road, Edinburgh EH9 3LA, Scotland, UK (URL: http://www.bgs.ac.uk/); Vincent J. Realmuto, Jet Propulsion Laboratory, California Institute of Technology, M/S 183-501, 4800 Oak Grove Drive, Pasadena, CA 91109 USA; John Eichelberger, U.S. Geological Survey, Volcano Hazards Program, Reston, VA (URL: http://volcanoes.usgs.gov/); Ludmilla Eichelberger, Global Volcanism Program, National Museum of Natural History, 10th and Constitution Ave., NW, Washington, DC 20560 USA; Iceland Review (URL: http://icelandreview.com/icelandreview/daily_news/).
2010: March
| April
| May
| June
| October
According to a news article from 27 October, a scientist at the University of Iceland Institute of Earth Sciences noted that the eruption of Eyjafjallajökull, that began as a fissure eruption on 20 March 2010 and later continued from the summit caldera on 14 April, was over. Ash was last seen rising from the caldera in June.
Source: Iceland Review
The Nordic Volcanological Center (NVC) at the Institute of Earth Sciences reported on 23 June that small ash clouds from Eyjafjallajökull's summit caldera were occasionally seen, but dispersed quickly. Water was slowly accumulating in the crater because ice was no longer in contact with hot material.
Source: Institute of Earth Sciences
The Nordic Volcanological Center (NVC) at the Institute of Earth Sciences reported that on 9 June rumbling noises were heard at Gígjökull just before a steam cloud rose from the summit crater. The crater area was not visible the next day, but a few small shallow earthquakes beneath the summit crater continued to be detected. On 11 June white steam was mainly confined to the crater, but occasionally a steam plume rose higher than the rim. Heavy rainfall during the previous few days led to flooding along the Svadbaelisa River. The water contained a large amount of mud and flowed over levees into fields. NVC also noted that a lake about 300 m in diameter had formed in the large summit crater. Steam rose as high as 1 km from the rims, especially from the N side. Two small vents above the water level on the W side emitted brown-colored clouds.
Source: Institute of Earth Sciences
The Nordic Volcanological Center (NVC) at the Institute of Earth Sciences reported that on 2 June a white steam cloud from Eyjafjallajökull's summit caldera rose to an altitude of 2.5 km (8,200 ft) a.s.l. On 3 June, scientists visited the summit and noted that the main crater remained active, though it was less active than during the previous visit on 27 May; steam rose 200-400 m above the crater rim. The next day cloud cover prevented observations. During 3-4 June remobilized ash drifted over a wide area of S and SW Iceland.
Scientists noted increased tremor on 4 June and a black plume that rose to an altitude of 4.5 km (14,800 ft) a.s.l. Considerable rumbling noises were reported from an area 10 km S. Tremor levels fluctuated during the next three days. Plumes that rose from the summit caldera were mostly white with occasional dark areas at the base following explosive activity. Plumes drifted SW during 4-5 June and S during 6-7 June at altitudes of 3-6 km (9,800-19,700 ft) a.s.l. A new crater was seen in the W part of the caldera at the site of the new explosive activity.
Sources: Institute of Earth Sciences; Iceland Review
The Nordic Volcanological Center (NVC) at the Institute of Earth Sciences reported that on 26 May steam plumes from Eyjafjallajökull rose to an altitude of 2 km (6,600 ft) a.s.l. and drifted S. The crater was not seen through the web cameras due to poor visibility from remobilized, blowing ash. Scientists conducted an expedition to the summit crater the next day. They measured the tephra deposits around the E half of the craters, and found that they were about 40 m thick closest to the craters. Steam rose from the crater, punctuated by a few small ash-bearing explosions, and a sulfur odor was strong nearby. On 31 May and 1 June, widespread drifting of existing ash was noted in SW Iceland. Meteorological clouds prevented views of the summit craters.
Source: Institute of Earth Sciences
The Nordic Volcanological Center (NVC) at the Institute of Earth Sciences reported that during 19-24 May overall activity from Eyjafjallajökull declined, and deformation measurements indicated subsidence. During 19-20 May gray ash plumes rose to altitudes of 5-6 km (16,400-19,700 ft) a.s.l. and drifted NW, N, and NE. Ashfall was reported in areas to the S, NW, and N. On 19 May heavy rainfall combined with ashfall to cause a mudslide in a local river. During 21-22 May light gray plumes with small amounts of ash rose to altitudes of 3-4 km (9,800-13,100 ft) a.s.l. No ashfall was reported. Some explosions occurred in the summit crater those days, but no lava flows. Seismicity continued to decrease and approached pre-eruption levels. White steam plumes rose from the crater during 23-25 May, though a small ash explosion was seen by scientists visiting the crater on 25 May.
Source: Institute of Earth Sciences
The Institute of Earth Sciences at the Nordic Volcanological Center (NVC) reported that during 12-18 May the eruption from Eyjafjallajökull continued to produce ash plumes from the summit vent. Based on analyses of imagery from weather satellites, scientific overflights, and pilot reports, gray ash plumes rose to altitudes of 4-9 km (13,100-29,500 ft) a.s.l. and drifted mainly ESE, SE, and S. Plumes drifted W and SW during 14-15 May, and NE and N on 18 May. Ashfall was reported in multiple areas, as far away as 40 km SE and SW, over 50 km SSE, and in Reykjavík 125 km NW. The meltwater discharge at Gígjökull glacier was low, and deformation measurements indicated subsidence. According to news reports airports in parts of multiple European countries including England, Scotland, and Ireland were closed at times during 16-17 May.
Sources: Institute of Earth Sciences; BBC News
The Institute of Earth Sciences at the Nordic Volcanological Center (NVC) reported that during 5-11 May the eruption from Eyjafjallajökull continued to produce ash plumes from the summit vent. Based on analyses of imagery from weather satellites, scientific overflights, and pilot reports, ash plumes ranging in color from light gray to black rose to altitudes of 4-9 km (13,100-29,500 ft) a.s.l. and drifted ESE, SE, and S. The cinder cone in the summit crater continued to build and was near the level of the ice on the crater rim on 8 May.
On 5 and 6 May explosive activity increased and effusive activity decreased, resulting in higher eruption plumes and increased tephra fallout. The lava flow stopped advancing, and very little steam rose from the edges of the flow. Ashfall was reported in areas 55-70 km away during 5-8 May, and was "considerable" on 6 and 7 May. Ash was reported in a few areas within 12 km E and SSE during 9-10 May. According to new articles, ash plumes again caused flight disruptions during 5-11 May in several European countries, including Scotland, Ireland, Spain, and Portugal.
Sources: Agence France-Presse (AFP); Institute of Earth Sciences; Reuters
The Institute of Earth Sciences at the Nordic Volcanological Center (NVC) reported that during 28 April-4 May the eruption from Eyjafjallajökull continued to emit lava and produce steam and ash plumes. Booming sounds in the vicinity of the volcano were often heard. Scientists continued to measure meltwater discharge that flowed down the Gígjökull glacier into the Gígjökull lake basin, then into the Markarfljót River. On 30 April steaming blocks were deposited in the basin, and on 2 May, steam rising from the delta in the lake basin suggested near-boiling water temperatures.
On 28 April the eruption plume was not detected over 4 km altitude (13,100 ft) a.s.l., the level of meteorological clouds. Steam plumes rose above the lava that advanced N down the Gígjöjkull Glacier. Ash plumes rose above the crater; ashfall was seen on the W flanks and in an area about 32 km W. The next day the eruption plume was not visible, but likely did not exceed an altitude of 3.6 km (11,800 ft) a.s.l. Ashfall was reported in areas 1.5 km SW and 12 km SSW.
Steam plumes on 30 April rose to altitude of 4.5-5.1 km (14,800-16,700 ft) a.s.l. Ash plumes rose to lower altitudes, drifted S, and deposited ash in areas 10 km away. Ash plumes rose slightly higher the next day, to an altitude of 5.4 km (17,700 ft) a.s.l. Ashfall was noted in areas 22 km SE. An active lava flow to the N continued to generate steam plumes from interaction with ice.
A report on 2 May stated that during the previous 2-3 days ash plumes had become darker and wider than in the preceding week, explosivity had increased, and tephra fall-out had increased. The location of the steam plume N of the crater indicated that the lava flow had advanced more than 3 km from the crater. Steam and ash plumes continued to rise from the crater. Ashfall was reported in an area 40 km SE. The scoria cone at the crater continued to build. Conditions on 3 May were similar. The largest eruption plume rose to an altitude of 5.5 km (18,000 ft) a.s.l. Ashfall was noted 65-70 km ESE, and ash plumes were seen over the village of Vík, 40 km SE. The eruption plume was seen in satellite imagery as far as 200 km from Eyjafjallajökull on both days.
On 4 May ash plumes rose above the crater and steam plumes rose from the N flank. Lava had traveled 4 km N from the crater, and lava was ejected a few hundred meters from the crater. Ashfall was reported in areas 65-80 km ESE, cutting visibility to less than a few kilometers. An eruption plume was seen in satellite imagery as far as 400 km ESE to SE. According to news articles, airports throughout Ireland were temporarily shut down on 4 May due to ash-plume hazards.
Sources: Institute of Earth Sciences; Associated Press
The Institute of Earth Sciences at the Nordic Volcanological Center (NVC) reported that the summit eruption from Eyjafjallajökull continued during 21-27 April. The eruption rate on 21 April was inferred to have been an order of magnitude smaller than during the initial 72 hours of the eruption, having declined over the previous few days. Phreatomagmatic activity with some lava spatter occurred from the northernmost of two craters in the summit caldera, generating plumes to an altitude of 3 km (9,800 ft) a.s.l. that drifted S. The emission of lava flows likely began around 1200 evident by the onset of semi-continuous meltwater discharge, steaming from the N edge of the ice cauldron, and changes in tremor amplitude.
Similar activity continued for the next four days, although plumes sometimes rose to 6 km (19,700 ft) a.s.l. on 22 April. On 23 April changes in the wind direction pushed the plume NW, causing airports in SW Iceland to close. The next day, mild explosive activity ejected spatter 100 m above the crater and shockwaves were detected every few seconds; an ash plume rose 4 km (13,100 ft) a.s.l. and drifted SW. A depression in the ice, formed from lava flows that had advanced 400-500 m N of the crater, was 700 m long and steaming, especially at the edges.
The N crater was active on 25 April. The eruption plume height was unknown due to meteorological cloud cover at 5.3 km (17,400 ft) a.s.l.; minor ashfall was noted at two farms 10 km NW of the vents. Explosions were also heard at locations 10-15 km NW. On 26 April plumes rose to an average altitude of 4.8 km (15,700 ft) a.s.l. and drifted E. Radar data showed a tephra crater or cone continuously building on the N crater. The structure was approximately 150 m high and 200 m wide. According to news articles, flights from Iceland's airports resumed.
On 27 April NVC reported that the eruption plume was seen during an overflight, and rose to altitudes of 3-3.6 km (10,000-11,800 ft) a.s.l. and drifted WNW. Light ashfall was noted in inhabited areas between 32 and 45 km W. Scientists also saw that a new crater had formed in the SW part of the caldera; the rim was about 50 m lower than the surrounding ice surface. Ash plumes rose from the vent and spatter was ejected 100-200 m above the vent. The lava flow front had advanced 1 km N from the vents. Flights from Iceland's airports were again disrupted.
Sources: Institute of Earth Sciences; Iceland Review; Associated Press
The Institute of Earth Sciences at the Nordic Volcanological Center (NVC) reported that a new set of craters opened in the early morning of 14 April under the ice-covered central summit caldera of Eyjafjallajökull. This eruptive phase was preceded by a swarm of earthquakes and the onset of tremor. Aerial observations revealed a series of vents along a 2-km-long N-S fissure, with meltwater flowing down both the N and S slopes of the volcano. An ash plume rose to more than 8 km altitude, and was deflected to the E by winds. Jokulhlaups (floods of meltwater) reached the lowlands around the volcano with peak flow around noon, damaging roads, infrastructure, and farmlands. There were no fatalities due to previous evacuations. Tephra-fall was reported in SE Iceland. A second jokulhlaup/lahar traveled down the Markarfljot valley that evening.
On 15 April the eruption plume reached mainland Europe, causing the closure of large areas of airspace. Activity continued during 16 April at a similar level as the previous day, with ash generation and pulses of meltwater causing jokulhlaup/lahars in the evening. The next day there was some variability in seismic tremor and tephra generation, but overall the activity remained stable. A pulsating eruptive column reached above 8 km altitude, and lightning was frequently seen within the plume.
Over the first 72 hours of explosive activity, scientists estimated that the eruption had produced 140 million cubic meters of tephra. An update from NVC on 21 April noted that activity had declined in the previous few days by an order of magnitude, though phreatomagmatic explosions were still occurring, sending plumes about 3 km high. Lava spattering was seen at the craters, and meltwater flows were minor. Seismicity was not decreasing at that time, and samples collected on 19 April were of the same intermediate composition (58% SiO2) as early in the explosive phase, but with more fluorine.
The ash cloud resulted in the cancellation of tens of thousands of daily flights, both into and out of major European cities, after 15 April. Although on 19 April the plume was only rising 1 km above the summit, it was ascending to altitudes of 5-7 km (15-20,000 ft) as it drifted to the S. Beginning on 20 April, after a decrease in activity and a significant dissipation of the plume, many previously closed areas were at least partially opened for limited service.
Sources: Institute of Earth Sciences; Iceland Review; Icelandic Meteorological Office (IMO)
The Institute of Earth Sciences reported that on 7 April the eruption from Eyjafjöll ceased from the original eruption craters and was limited to the fissure that had opened on 31 March. Lava flows covered an estimated area of 1.3 square kilometers and were on average 10-20 m thick. The largest scoria cone was 82 m high. After minor changes in deformation rates during the eruption, on 9 April deformation returned to pre-eruption levels. Eruptive activity was observed on 11 April, but tremor decreased to baseline the next day. Also on 12 April, according to a new article, the Icelandic Civil Protection Department decided to lower the preparedness level by one point, from emergency to danger because of the decreasing activity. Another article stated that a pilot saw no active lava flows, only steam plumes, during an overflight on 13 April.
At 2300 on 13 April, a seismic swarm was detected below the central part of Eyjafjöll, W of the previous eruption fissures. About an hour later, the onset of seismic tremor heralded an eruption from a new vent on the S rim of the central caldera, capped by Eyjafjallajökull glacier. The eruption was visually confirmed early in the morning on 14 April; an eruption plume rose at least 8 km above the glacier. Meltwater flowed to the N and S. News outlets reported that a circular ice-free area about 200 m in diameter was seen near the summit. Scientists conducting an overflight saw a new 2-km-long, N-S-trending fissure, and ashfall to the E. About 700 people were ordered to evacuate the area, and certain flights were banned from flying N and E of the eruption area. Flooding increased throughout the day, causing road closures and some structural damage.
Sources: Institute of Earth Sciences; Iceland Review; Icelandic Meteorological Office (IMO)
The Icelandic Met Office reported that around 1900 on 31 March a new fissure at Eyjafjöll opened NE of the first fissure that began erupting on 20 March. Activity from the second fissure was not preceded by detectable seismicity. According to a news article, the fissure was about 300 m long, and about 200 m away from the first fissure. At the time of reporting by the Icelandic Met Office on 5 April, lava fountains had remained active from both fissures. Lava mostly accumulated near the new vent but some lava flows had entered the Hruná and Hvanná gullies. News outlets reported that two people had died during the journey back from seeing the eruption. The police estimated that 25,000 people had visited the site since the eruption began.
Sources: Icelandic Meteorological Office (IMO); Iceland Review; Iceland Review; Morgunbladid News
According to news articles, the fissure eruption from Eyjafjöll continued during 24-30 March. On 24 March, steam explosions were seen. A local scientist described four or five active craters and a 200-meter-high basalt lava-fall into Hrunagil canyon. Two days later reports indicated that lava flows had changed course and had entered the Hvannárgil canyon down a 100-meter-high lava-fall; water levels in that drainage increased. From a helicopter on 28 March, scientists saw lava flowing into both canyons and noted fewer jets of lava. The next evening a swarm of earthquakes in the region measuring M 2-2.5 were detected. A geophysicist noted that seismicity was gradually decreasing. The lava covered an area of 1 square kilometer.
Sources: Iceland Review; Iceland Review; Iceland Review; Iceland Review
The Institute of Earth Sciences and the Icelandic Met Office reported that a fissure eruption from Eyjafjöll (also known as Eyjafjallajökull) began late at night on 20 March. High rates of deformation and increased seismic activity were noted during the previous three weeks; earthquakes were located between 7 and 10 km below the surface. During 19-20 March earthquakes migrated E and became more shallow, at 4-7 km depth. At 22:30 on 20 March seismicity slightly increased and, within the next two hours, reports of a volcanic eruption were received.
The first reports described incandescence reflected from a cloud above the eruption area, a 2-km-wide ice-free pass between Eyjafjöll and Katla volcano (with its overlying Myrdalsjökull ice cap). Lava fountains, seen from the air on 21 March, were ejected from a 500-m-long NE-SW trending fissure on the NE flank of Eyjafjöll at an elevation of about 1,000 m a.s.l. Lava flowed a short distance from the fissure and a minor plume rose 1 km and drifted W. Tephra fall was minor or insignificant. According to news articles, flights in and out of Reykjavík were diverted, delayed, or cancelled. Some local roads were closed and about 500 people living in nearby areas were evacuated. A steam explosion on 22 March generated a steam plume that rose to an altitude of 8 km (26,200 ft) a.s.l. Lava flowed S of the fissure into a canyon causing steam to rise from where the lava interacted with snow and ice. The eruption continued during 23-24 March.
Sources: Institute of Earth Sciences; Iceland Review; Icelandic Meteorological Office (IMO); Iceland Review; Iceland Review
Reports are organized chronologically and indexed below by Month/Year (Publication Volume:Number), and include a one-line summary. Click on the index link or scroll down to read the reports.
Fissure eruption and lava flows from E flank on 20 March
During March 2010, the Icelandic Meteorological Office (IMO) and the Nordic Volcanological Center of the University of Iceland's Institute of Earth Sciences (IES) reported the first eruption of Eyjafjallajökull volcano in southern Iceland since 1823. The following was mostly condensed from a multitude of reports on the EIS and IMO websites, and only discusses activity through the start of the explosive summit phase. Many of the satellite images featured here came from the NASA Earth Observatory.
From 20 March to 12 April 2010 the eruption's first phase occurred from a fissure 9 km ENE of the summit, an area named Fimmvörðuháls, located between the Eyjafjallajökull and Mýrdalsjökull icecaps (figure 1). These vents on the lower E slopes were snow-covered but not under the year-round icecap found at higher elevations. Lava flows filled gullies, and quickly melted adjacent winter snow, creating small steam plumes. After apparent cessation of the fissure activity on or about 12 April, a second phase of the eruption began on 14 April (figures 2 and 3, table 1), generating ash plumes that blew E to Europe and resulted in a 20-80% decrease of airline flights for as much as a week (Wall and Flottau, 2010). As of late May the eruption continued, with occasional plumes that restricted air travel in parts of Europe.
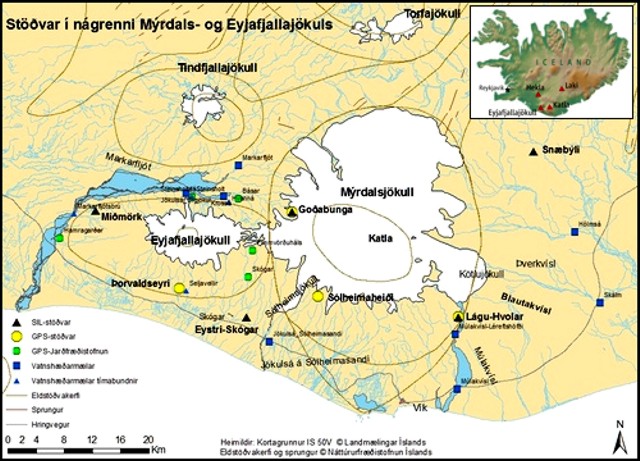 |
Figure 1. Map of southern Iceland showing Eyjafjallajökull and Katla volcanoes, towns, and locations of monitoring instruments. The Mýrdalsjökull icecap overlies Katla. ("Jökull" translates to "glacier" or "icecap" in English). Index map showing some eruptive centers is from Laursen (2010). Base map courtesy of IMO. |
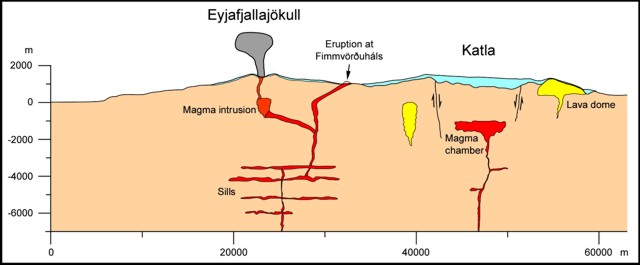 |
Figure 2. Approximately N-looking interpretive cross-section cartoon drawn between Eyjafjallajökull and Katla. The eruption of 20 March was located at Fimmvörðuháls. Starting on 14 April, eruptions took place at the summit caldera. Notice the thin upper layer (blue on colored versions) representing glacial ice and the inferred common linkage at ~ 2 km depth below sea level of the conduits feeding the two active vent areas. Courtesy of Páll Einarsson (IES). |
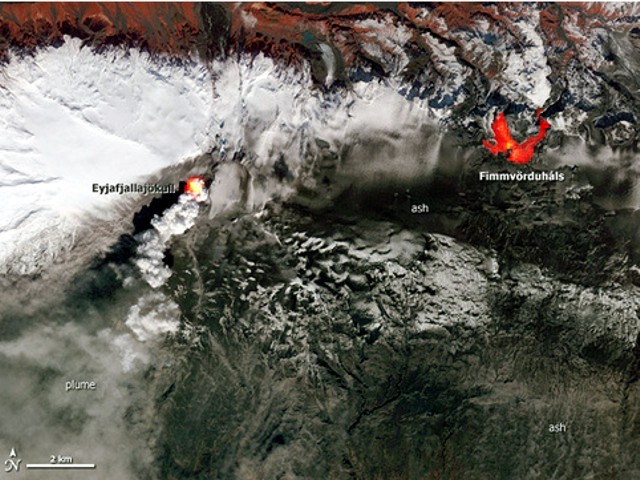 |
Figure 3. ASTER image of the Eyjafjallajökull-Fimmvörðuháls vents at 1350 local time on 19 April. The image shows both visible information and heat signatures from areas of anomalously high thermal infrared (IR) radiation (for colored versions, yellow is hottest, red, cooler). For the Fimmvörðuháls the thermal signature shows the extent of lava flows no longer extruding but still hot. At the summit, the vent is clearly active, with a thermal signature and a dense white plume blowing SSE. ASTER is the Advanced Spaceborne Thermal Emission and Reflection Radiometer flying on NASA's Terra satellite. Courtesy of Rob Simmon, the U.S./Japan ASTER Science Team, and Holli Riebeek, NASA Earth Observatory. |
Table 1. Preliminary data regarding the 2010 eruption of Eyjafjallajökull, which started at an E-flank vent (Fimmvörðuháls) and then later shifted to the ice-covered summit caldera. The grain sizes of the second phase of the eruption were quantified by The Environment Agency of Iceland; other data courtesy of IMO and IES.
| Dates | Activity | Rock type and description |
| 20 Mar-12 Apr 2010 | Fissure eruptions of lava flows at Fimmvörðuháls. | Alkali-olivine basalt (~47.7 wt % SiO2). Euhedral plagiclase, olivine, and clinopyroxene phenocrysts seem to be in equilibrium with magma. |
| 14 Apr 2010 and later | Explosions from the summit caldera of Eyjafjallajökull. Ash clouds, initially up to ~11 km altitude. | Trachyandesite (56.7-59.6 wt % SiO2). Grain size from sample at Mýrdalssandur (50 km from vent): 24%, under 10 ?m (as aerosol); 33% , 10-50 ?m; 20% , 50-146 ?m; 23%, 146-294 ?m. Fluorine: 850 mg/kg (19 April). |
Precursory observations. The IES website contained a list of scientific papers and publications including several noting restlessness at Fimmvörðuhálsat in recent years (see Further References below). The IES reports noted that the Fimmvörðuháls eruption followed weeks of high seismicity and deformation (figure 4).
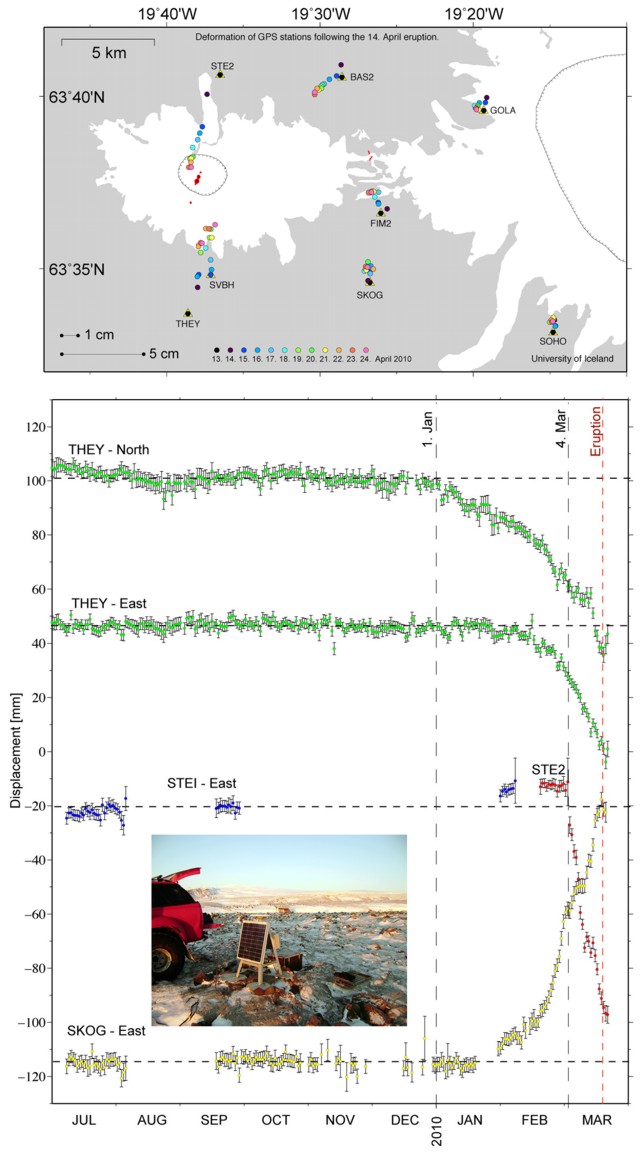 |
Figure 4. (top) Map of the southern Iceland GPS (Global Positioning System) network, including stations THEY, SKOG, STE1, and STE2. (bottom) Displacement measurements for selected continuous/semi-continuous GPS stations around Eyjafjallajökull from early July 2009 to early March 2010. Inset photograph is of station SKOG. Courtesy of IES. |
In general terms, GPS data indicated that permanent station Thorvaldseyri (THEY; S of the volcano, figure 4) started moving S in late December 2009. In the weeks prior to the eruption, there was rapid deformation at Skogaheidi (SKOG; S of the volcano) and Steinsholt (STE1 and STE2; N of the volcano). IES identified three distinct phases in the GPS data. First, at the end of December, the southward motion of THEY. Second, at the beginning of February 2010, displacement at THEY changed to SW as SKOG began E displacement. Third, after 5 March, STE2 displaced rapidly NW and up. Scientists noticed a trend after 4 March at continuous GPS sites installed within 12 km of the eruptive site; all showed deformation at rates of up to a centimeter a day.
Seismic tremor began around 2230 on 4 March, and around that time, signal sources rose slowly towards the surface. Compared to the weeks prior to the eruption, seismicity increased rather slowly immediately prior to the eruption. However, as the eruption onset neared, geophysicists saw both the depth of earthquakes decrease and the locations of earthquakes move from the area under the summit towards the Fimmvörðuháls site.
According to Laursen (2010) "Eyjafjallajökull's so-far-unpredictable behavior offers a perfect example of the challenge facing volcanologists. Before this spring's first eruption...GPS stations on the volcano had wandered several centimeters in May of 2009 and again in December, signs that rising magma was stretching the skin of the volcano in advance of an eruption. In mid-February...Steinunn Jakobsdóttir, a geophysicist at IMO, was tracking tremors ~ 5 kilometers below Eyjafjallajökull's surface. But officials didn't order evacuations because the seismic hints weren't that dire. 'Usually when an eruption starts, a low-frequency [seismic signal] is rising when the magma is coming to the surface,' says Jakobsdóttir. Although seismic tracking placed magma closer to the surface on 19 March, this low-frequency signal was absent, so civil authorities kept the alert level at its lowest setting. But the next night, southern Icelanders reported a dark cloud glowing red above the mountain: The volcano had experienced a small eruption, one that led authorities to evacuate farmers living in its floodplains."
Eruption from Fimmvörðuháls. Late on 20 March 2010 an eruption began at Fimmvörðuháls, an area around 1,000 m elevation in a ~ 2-km-wide pass of ice-free land between Eyjafjallajökull and Mýrdalsjökull. Initially detected visually, the eruption was seen at 2352 that day as a red cloud above the site.
The eruption broke out with Hawaiian-style fire fountains (figure 5) on a ~ 500-m-long, NE-oriented fissure (at 63° 38.1' N, 19° 26.4' W). Lava flowed a short distance from the eruptive site and a minor eruption plume rose to less than 1 km altitude and blew W. Tephra fall was minor or insignificant.
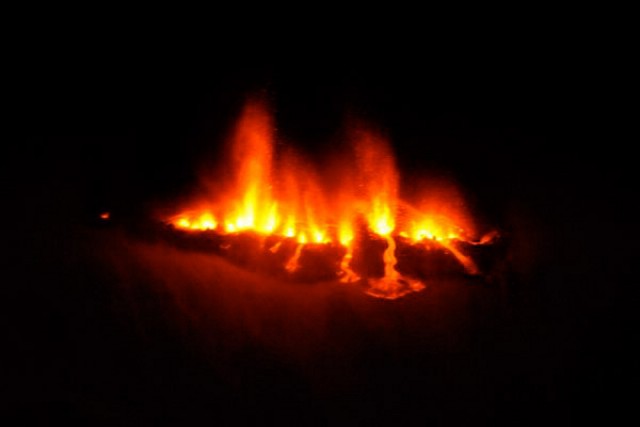 |
Figure 5. Image of fissure eruption at Eyjafjallajökull taken 21 March 2010 by Sigrún Hreinsdóttir. Courtesy of IES. |
Airborne observers during 0400-0700 on 21 March described a short eruptive fissure with fire fountaining from 10-12 vents reaching up to ~ 100 m height. Eruption tremor rose slowly until reaching a maximum at around 0700-0800 that day. No further lengthening of the fissure was detected. Lava was still limited to the immediate surroundings of the eruptive craters (runouts of less than few hundred meters). Minor ashfall occurred within a few kilometers W.
On 22 March, observations made from the ground showed lava extrusion from a series of closely-spaced vents. Prevailing E winds led to maximum scoria accumulation on a linear rim W of the NE-trending fissure. A'a lava flowed over the steep Hrunagil canyon rim creating spectacular 'lava falls.'
During 23-31 March, lava steadily issued at the initial craters, with gradual focusing towards fewer vents. Lava advanced N into the Hrunagil and Hvannárgil valleys, with continuation of intermittent lava falls (figures 6-8). Lava descending gullies generated zones of frothy rock. Extensive steam plumes occurred when advancing lava encountered water and snow. Two or three plumes were observed (one at the eruptive craters, others more pronounced in front of the advancing lava). Meltwater descended in batches into rivers valleys, and seismometers recorded relatively steady eruption tremor.
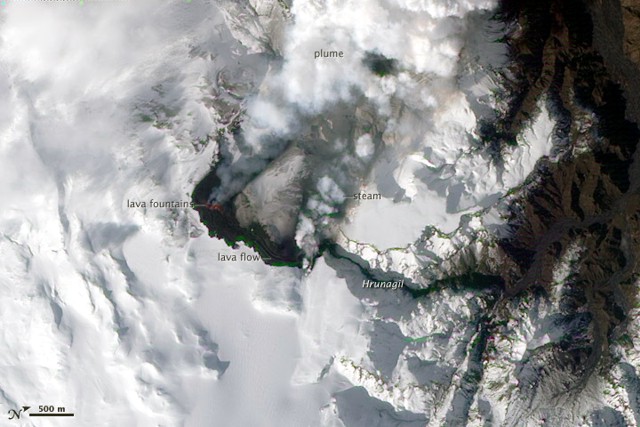 |
Figure 6. EO-1 ALI satellite image with annotations indicating path of lava flows from the Fimmvörðuháls vent, 24 March 2010. Note N arrow and scale at lower left. Courtesy of Robert Simmon, NASA Earth Observatory. |
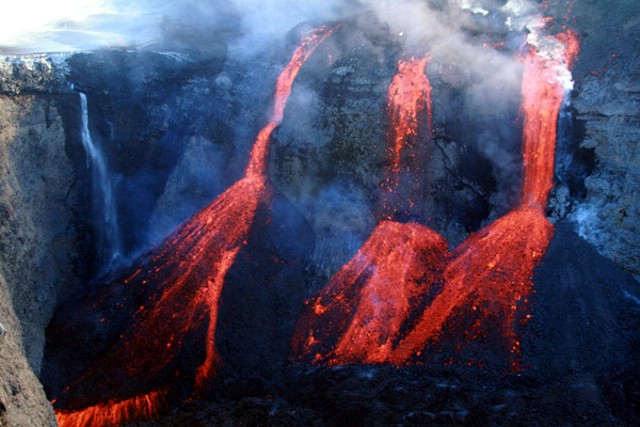 |
Figure 7. Photo showing lava falls developed when lava flows encountered steep canyon walls, 1 April 2010. Courtesy of Sigrún Hreinsdóttir, IES. |
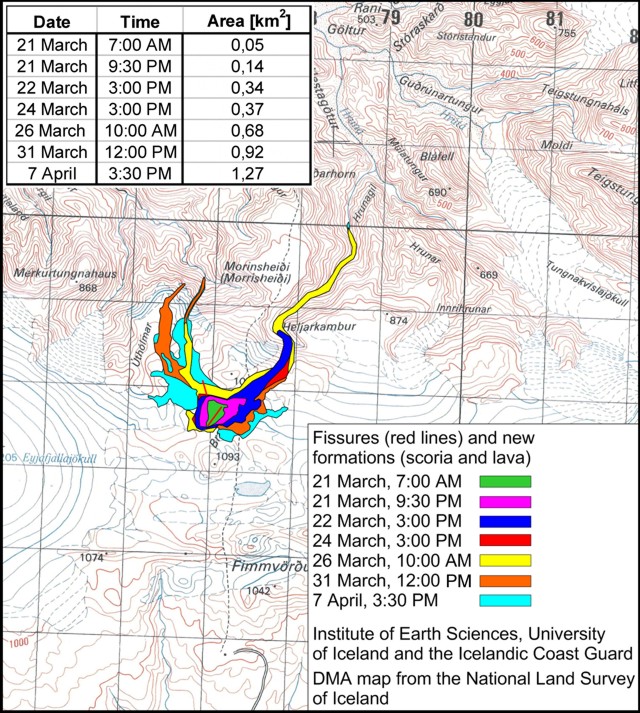 |
Figure 8. Map showing Fimmvörðuháls fissures and the distribution of new scoria and lava at various points in time during 21 March-7 April 2010. Table indicates cumulative areal extent of the deposits. Courtesy of EIS and Icelandic Coast Guard. |
On the evening of 31 March, scientists noted the opening of a new short fissure immediately N of the previous one. This change may have been a response to changes at shallow depth in the feeder channel. Eruption tremor remained unchanged. During 31 March-6 April, lava discharged in both the old and new eruptive craters in a manner similar to before. Pronounced 'lava falls' returned to Hvannárgil valley.
During 1-2 April 2010 a team from the Italian Instituto Nazionale di Geofisica e Vulcanologia (INGV) working in collaboration with the scientists from IES conducted gas measurements at Fimmvörðuháls (Burton and others, 2010). Three measurement techniques were used: open-path FTIR (Fourier transform infrared spectroscopy), DOAS (differential optical absorption spectroscopy), and a sulfur dioxide (SO2) imaging system. The FTIR spectrometer uses infrared radiation emitted from the erupting lavas as a source for absorption spectrometry of gases emitted from the explosive vents. Spectra are analyzed using a single-beam retrieval, which allows pathlength estimates of H2O, CO2, SO2, HCl, and HF. Favorable wind conditions allowed traverse measurements under the gas plume with a DOAS spectrometer for SO2 flux estimates.
The investigators found that the SO2 gas flux was ~ 3,000 metric tons per day. Approximately 70% of the SO2 flux was produced by the fissure that opened 31 March, with ~ 30% emitted by the fissure that had opened on 21 March. The overall HF flux was ~ 30 tons per day. Gas compositions emitted from the two fissures were broadly similar and rich in H2O (over 80% by mole), less than 15% CO2, and less than 3% SO2. The SO2/HCl ratio varied at the 31 March fissure on 1 and 2 April (25% and 5%, respectively).
On 5 April, eruption tremor (at 1-2 Hz recorded at the nearest seismic station, Godabunga) began to gradually decline. By 7 April lava emissions had stopped from the original craters, but continued at the 31 March fissure.
When IES surveyed the new landscape on 7 April (figure 9), they found 1.3 km2 of new lava, an average thickness of new lava there of 10-12 m, and an estimated volume of eruptive material of 22-24 x 106 m3. From this they computed an average emission rate of ~ 15 m3/s. The tallest new cone reached an elevation 1,067 m, ~ 82 m above the previous ground surface. Another cone with a rim at 1,032 m elevation was 47 m above the previous surface and the vent area glowed red.
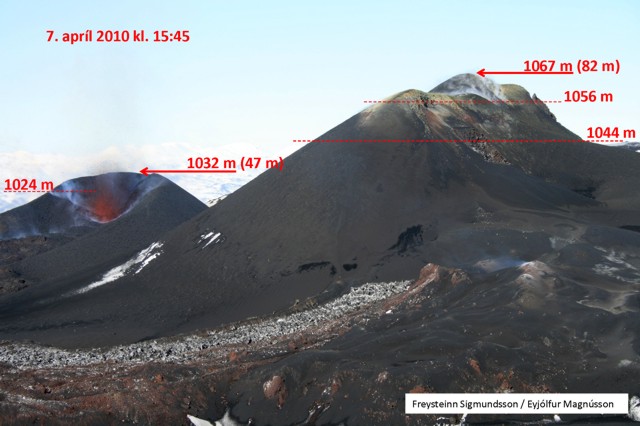 |
Figure 9. The Fimmvörðuháls as surveyed and photographed by Freysteinn Sigmundsson and Eyjólfur Magnússon on 7 April 2010. Values shown are elevations and those in parentheses refer to the approximate net gain in elevation due to fresh deposits on the pre-eruption surface. Courtesy of IES. |
By 9 April, after little change in deformation rates during the eruption, time series at continuous GPS stations N of the volcano showed sudden change, partly jumping back to pre-eruptive levels. On 11 April, eruption tremor also approached pre-eruptive levels, but visual observation revealed eruptive activity in late afternoon. Seismic tremor on 12 April reached a minimum.
Eruption from the summit caldera. The second, more explosive eruptive phase, began on 14 April 2010 at the subglacial, central summit caldera. This phase was preceded by an earthquake swarm from around 2300 on 13 April to 0100 on 14 April. Meltwater started to emanate from the icecap around 0700 on 14 April and an eruption plume was observed later that morning. The exact conditions at the summit were unknown due to cloud cover obscuring the volcano, but on 15 April an overflight imaged the erupting caldera using radar (figure 10).
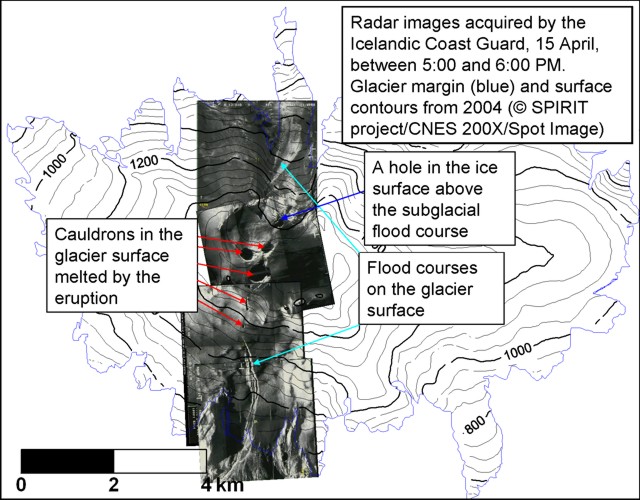 |
Figure 10. This 15 April radar image of the Eyjafjallajökull eruption depicts the otherwise hidden scene at the cloud-covered summit caldera. The glacial snow and ice had deformed and melted, forming circular depressions (ice cauldrons) in the icecap's surface. Flooding from the melting glacier had led to the various features on and below the glacier to the N and S (illustrated by labels). The data were acquired via aircraft by the Icelandic Coast Guard during 1700-1800 on 15 April 2010. The glacier margin and surface contours came from a 2004 investigation. Courtesy of Icelandic Coast Guard and IES. |
The 15 April radar image helped depict a series of vents along a 2-km-long, N-oriented fissure. Both on top of and from below, meltwater flowed down the N and S slopes. Jokulhlaups (floods of meltwater also carrying considerable debris) reached the lowlands around the volcano with peak flow around noon on 14 April, causing destruction of roads, infrastructure, and farmlands. Residents had earlier been evacuated from hazardous areas. Tephra fall began in SE Iceland. That evening, a second jokulhlaup emanated from the icecap down the Markarfljot valley, which trends E-W along the N margin of the volcano and contains extensive outwash from surrounding glaciers.
On 15 April the ash plume reached a maximum altitude of over 8 km. E-blown ash began to arrive over mainland Europe closing airspace over the British Isles and large parts of Northern Europe. Ash generation continued at a similar level. Meltwater emerged from the glacier in pulses. Debris-charged jokulhlaups were seen in the evening.
Chemical analyses of mid-April ash samples revealed fluorine-rich intermediate eruptive products with silica content of ~ 58%. The initial lavas erupted at Fimmvörðuháls had silica contents of ~ 48% (table 1).
References. Burton, M., Salerno, G., La Spina, A., Stefansson, A., and Kaasalainen, H., 2010, Gas composition and flux report, IES web site.
Laursen, L., 2010, Iceland eruptions fuel interest in volcanic gas monitoring: Science, v. 328, no. 5977, p. 410-411.
Sigmarsson, O., Óskarsson, N., Þórðarson, Þ., Larsen, and G., Höskuldsson, Á, 2010, Preliminary interpretations of chemical analysis of tephra from Eyjafjallajökull volcano (report on the IES website).
Wall, R., and Flottau, J., 2010. Out of the ashes: Rising losses and recriminations rile Europe's air transport sector: Aviation Week & Space Technology, v. 172, no. 16, p.23-25.
Further References. Dahm, T., and Brandsdóttir, B., 1997, Moment tensors of micro-earthquakes from the Eyjafjallajökull volcano in South Iceland: Geophysical Journal International, v. 130, no.1, p. 183-192, DOI:10.1111/j.1365-246X.1997.tb00997.x.
Guðmundsson, M.T., and Gylfason, A.G., 2004, H?ttumat vegna eldgosa og hlaupa frá vestanverðum Mýrdalsjökli og Eyjafjallajökli. Háskólaútgáfan og Ríkislögreglustjórinn [Volcanic risk assessment run from Mýrdalsjökli and Eyjafjallajökull measurements]: University of Iceland and the National Police, 230 p.
Hjaltadottir, S., K. S. Vogfjord and R. Slunga, 2009, Seismic signs of magma pathways through the crust at Eyjafjallajokull volcanoe, South Iceland: Icelandic Meteorological Office report, VI 2009-013 (http://www.vedur.is/media/vedurstofan/utgafa/skyrslur/2009/VI_2009_013.pdf).
Hooper, A., Pedersen, R., and Sigmundsson, F., 2009, Constraints on magma intrusion at Eyjafjallajökull and Katla volcanoes in Iceland, from time series SAR interferometry, p. 13-24 in Bean, C.J., Braiden, A.K., Lokmer, I., Martini, F., and O'Brien, G.S., eds., The VOLUME project - Volcanoes: Understanding subsurface mass movement: School of Geological Sciences, University College Dublin.
Larsen, G., 1999, Gosi í Eyjafjallajökli 1821-1823 [The eruption of the Eyjafjallajökull volcano in 1821-1823]: Science Institute Research Report RH-28-99, Reykjavík, 13 p.
Pedersen, R., Sigmundsson, F., and Einarsson, P., 2007, Controlling factors on earthquake swarms associated with magmatic intrusions; Constraints from Iceland: Journal of Volcanology and Geothermal Research, v. 162, p. 73-80.
Pedersen, R., and Sigmundsson, F., 2004, InSAR based sill model links spatially offset areas of deformation and seismicity for the 1994 unrest episode at Eyjafjallajökull volcano, Iceland: Geophysical Research Letters, v. 31, L14610 doi: 10.1029/2004GL020368.
Pedersen, R., and Sigmundsson, F., 2006, Temporal development of the 1999 intrusive episode in the Eyjafjallajökull volcano, Iceland, derived from InSAR images: Bulletin Volcanology, v. 68, p. 377-393.
Sigmundsson, F., Geirsson, H., Hooper, A. J., Hjaltadottir, S., Vogfjord, K. S., Sturkell, E. C., Pedersen, R., Pinel, V., Fabien, A., Einarsson, P., Gudmundsson, M. T., Ofeigsson, B., and Feigl, K., 2009, Magma ascent at coupled volcanoes: Episodic magma injection at Katla and Eyjafjallajökull ice-covered volcanoes in Iceland and the onset of a new unrest episode in 2009: Eos (Transactions of the American Geophysical Union), v. 90, no. 52, Fall Meeting Supplement, Abstract V32B-03.
Sturkell, E., Einarsson, P., Sigmundsson, F., Hooper, A., Ófeigsson, B.G., Geirsson, H., and Ólafsson, H., 2009, Katla and Eyjafjallajökull volcanoes, p. 5-12 in Schomacker, A., Krüger. J., and Kjr, K.H., eds., The Mrdalsjökull Ice cap, Iceland - Glacial processes, sediments and landforms on an active volcano: Developments in Quaternary Sciences, v. 13.
Information Contacts: Nordic Volcanological Center, Institute of Earth Sciences, University of Iceland, Sturlugata 7, Askja, 101 Reykjavík, Iceland (URL: http://www.earthice.hi.is/page/ies_volcanoes) [contributors:Páll Einarsson, ásta Rut Hjartardóttir, Magnus Tumi Gudmundsson, Freysteinn Sigmundsson, Niels Oskarsson, Gudrun Larsen, Sigrun Hreinsdottir, Rikke Pedersen, Ingibjörg Jónsdóttir]; Icelandic Meteorological Office (IMO), Bústaðavegur 9, 150 Reykjavík, Iceland (URL: http://en.vedur.is/) [contributors:Steinunn Jakobsdóttir, Kristin S. Vogfjord, Sigurlaug Hjaltadottir, Gunnar B. Gudmundsson, Matthew J. Roberts]; The Environment Agency of Iceland, Sudurlandsbraut 24, 108 Reykjavik, Iceland (URL: http://english.ust.is/); NASA Earth Observatory (URL: http://earthobservatory.nasa.gov/); London Volcanic Ash Advisory Centre, Met Office, FitzRoy Road, Exeter, Devon EX1 3PB, United Kingdom (URL: http://www.metoffice.gov.uk/aviation/vaac/).
Large explosions from the summit crater; ash plumes close airspace in Europe
During March 2010 the Icelandic Meteorological Office (IMO) and the Nordic Volcanological Center of the University of Iceland Institute of Earth Sciences (IES) reported seismic activity followed by an eruption of Eyjafjallajökull (BGVN 35:03), the first since 1823. During an initial eruptive phase from 20 March to 12 April 2010, lava flowed from fissures on Eyjafjallajökull's ENE flank. After a short hiatus in eruptive activity, an explosive eruptive phase began on 14 April under the ice-covered central summit caldera. The resulting plume caused an unprecedented disruption of air traffic and closure of airspace over northern and central Europe.
In the early morning of 14 April, the ash-loaded eruption plume rose to more than 8 km altitude and blew E. The eruption plume reached mainland Europe on 15 April, triggering the closure of airspace over large areas. Closure decisions by civil authorities were based on ash dispersal modeling provided by the London Volcanic Ash Advisory Center (VAAC), which is based in the United Kingdom's Met Office (figure 11). On 16 April some variability occurred in seismic tremor and tephra generation, but overall the eruptive pace remained stable and large closures of airspace continued.
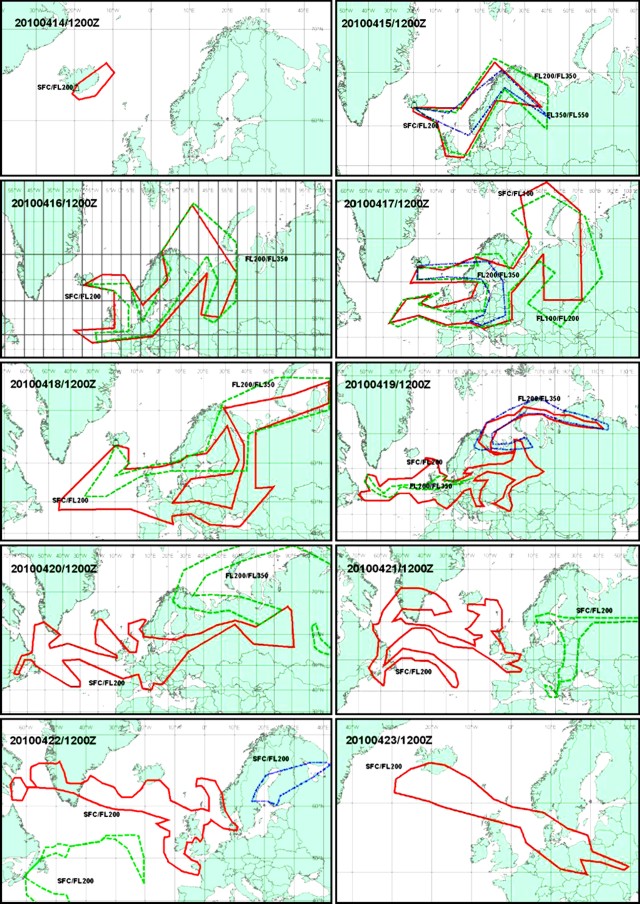 |
Figure 11. Compilation of graphic daily Volcanic Ash Advisories showing the assessed or inferred extent of ash plumes at 1200 UTC for 10 days, 14-23 April 2010. "SFC/ FL200" denotes the area covered by the ash advisories at altitudes from the surface to flight level 200 (20,000 ft, 6.1 km), "FL200/FL350" for altitudes of 20,000-35,000 ft (6.1-10.7 km), and "FL350/ FL550" for altitudes of 35,000-55,000 ft (10.7-16.8 km). Courtesy of London Volcanic Ash Advisory Center. |
The IES estimated the amount of erupted material during the first 72 hours of the eruption at the summit caldera (14-17 April 2010). Erupted products consisted of fragmental material, the majority being fine-grained airborne tephra. Some of the tephra came to rest in the ice cauldrons around the vents (in terms of uncompacted volume, 30 x 106 m3), some began filling the Gígjökulslón lagoon after transport by floods down the N-flank Gígjökull outlet glacier (10 x 106 m3), and airborne tephra blown to the E and S (100 x 106 m3). These uncompacted tephra volumes correspond to 70-80 x 106 m3 of dense magma, leading to an average magma discharge rate of ~ 300 m3/s. This was 10-20 times the average discharge rate in the preceeding flank eruption at Fimmvörduháls. Chemical analyses of ash samples revealed fluorine-rich intermediate eruptive products with silica content of 58%, more evolved than in the initial lava-producing phase of the eruptive activity (see table in BGVN 34:03).
On 17 April the ash plume rose to over 8 km altitude, blowing first to the E, and then, after about 0341 that day, blowing to the S. Ash fell around the volcano and there were at least 115 lightning strikes in vicinity of the eruption. When ash emissions on 17 April (figure 12) blew S they created an optically thicker band of ash that appeared to be surrounded by a much wider, less optically dense plume (figure 13). NASA analysts determined that the ash plumes were at two different altitudes, the narrow, more concentrated plume was above the more diffuse cloud, casting a shadow on the ash below. They said that according to the Icelandic Met Office, the upper parts of 17 April ash puffs reached 4.9-7.3 km altitude.
 |
Figure 12. Aerial photograph of the dense ash plume rising from Eyjafjallajökull on 17 April 2010. Courtesy of Eyjólfur Magnússon, IES. |
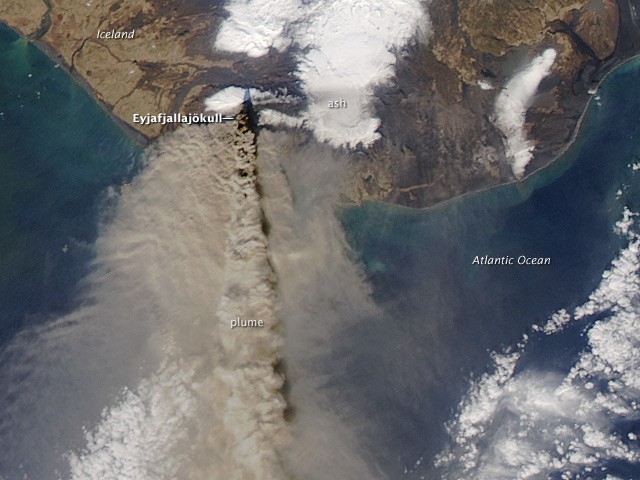 |
Figure 13. An Aqua-MODIS (Moderate Resolution Imaging Spectroradiometer) satellite image of Eyjafjallajökull taken on 17 April 2010. Ash blew S as both a dense band and a much wider, less dense plume (see text). Courtesy of NASA Earth Observatory: image by Jeff Schmaltz, MODIS Rapid Response Team; caption by Holli Riebeek. |
The 17 April example illustrates the difficulty of estimating the critical 'source terms' (boundary conditions) for modeling ash plume dispersal. Such models, which are regularly run by groups such as VAACs, volcano observatories, and their associated agencies, help assess where plumes might go in conditions such as darkness and overcast weather.
After about 1100 on 18 April, tremor intensified beyond levels maintained since 16 April. Daily solutions from continuous, 15-second GPS stations operated by IMO and IES, revealed centimeter-scale horizontal movements toward the center of the volcano, with some stations also registering centimeter-scale vertical elevation decreases. Tremor with a dominant frequency of 0.5 Hz remained continuous during this second eruptive phase.
During overflights on 19 April it was apparent that the ice cauldrons over the eruption site had melted back, forming a much larger cauldron ~ 2.5 km in diameter. Following an initial period of glacial flooding on 14-15 April, relatively little water drained from the ice cap's N flank. A largely open pathway for drainage in that direction, over and through the Gígjökull glacier, suggested significant meltwater would not pond at the eruption site.
On 19 April the plume rose only 600-900 m above the volcano's 1.7-km-high summit, yet as it drifted S it ascended to an altitude of 6.1 km. Later in the afternoon reports indicated maximum plume height around 4.6 km with ash clearly visible in the clouds. Samples collected 19 April show the same composition as early in the explosive phase, but the fluorine content was higher. Tephra deposited next to the craters was 20-30 m thick. Analogous conditions continued to exist for the following week.
Although there had been magma spatter at the vent area by 20 April, no significant lava flow had yet been detected. Heavy sound blasts were heard nearby, especially S and E of the mountain. Radar images acquired that day by the Icelandic Coast Guard showed no changes in the size of the cauldron since 19 April. Latest results from GPS stations showed deflation.
On 21 April, the eruption continued with less explosive activity. The eruption rate, estimated to be less than 30 m3/s (with a large uncertainty), was inferred to have declined over last few days to become an order of magnitude smaller than during the initial 72 hours of this phase. The northernmost one of two main craters in the summit caldera was active, and phreatomagmatic explosions occurred with some lava spatter at craters. Plume altitude was ~ 3-4 km, with local tephra dispersal towards the S.
Lava flows towards the N were thought to have begun around noon on 21 April. Evidence for this was the onset of semi-continuous discharge of meltwater from Gígjökull, steam rising from the N margin of the ice cauldron, and variations in tremor amplitude.
Beginning about 24 April the IES website contained detailed daily status reports of the eruption. Over the next few days there was little change, with the N crater remaining active, generating mild explosive activity and spatter. Steam plumes were rising where the N-flowing lava met ice.
The eruption site was seen clearly during an overflight on 27 April. The eruptive activity in the N ice cauldron was seen to be similar to conditions during the preceding four days, but a new crater had formed in the cauldron's SW corner. Erupted material continued to accumulate on the flanks of the crater. The rim of the crater was ~ 50 m lower than the surface of the surrounding ice cauldron. Spatter escaped the vent, reaching heights of 100-200 m. Unstable plumes of ash rose regularly from the vent. Lava continued to flow N, advancing ~ 1 km from the crater.
After an slight decrease in explosive activity early in May, activity then increased somewhat. The eruption was mixed, with the lava-producing phase being larger than the explosive phase. During this time, the plume was darker and wider than in the preceding week. Near-source tephra fall-out increased. On 4 May a flight by the Icelandic Coast Guard showed that the crater continued buildup in the northern-most ice cauldron. Lava flowed N and spread at an elevation of 500 m. The lava flow was about 200 m wide and lava channels that enter this flow were ~ 30-60 m wide. Increased seismicity up to 13 May suggested that new material was intruding from depth, and GPS observations indicated inflation.
Little change in activity was observed during 11-17 May. On 18 May an ongoing explosive eruption plume was mostly steady at 7 km altitude; the rate of magma eruption was over 200 tonnes/second. Tephra fallout was detected mainly to the NE, with some reaching the coast. Some tephra dispersed towards the W in the afternoon. The height of the ash plume decreased from 18-21 May, suggesting magma emission rates considerably less than 50 tonnes/second. By 21-22 May only a weak plume rose from the W part of the crater; both explosions and lava flows from the crater were absent. During 23-25 May there was no apparent eruptive activity, though there was still a considerable amount of steam coming from the crater. Aerial observers on 25 May (figure 14) saw blue smog (sulfuric gases) and smelled sulfur. Scientists who went to the crater on 25 May saw a small blast of ash, but mostly steam.
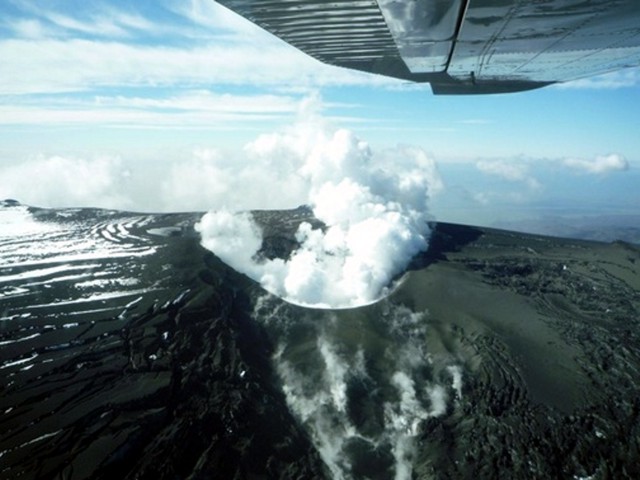 |
Figure 14. Steam discharged gently from the Eyjafjallajökull crater on 25 May 2010, with no ash. The N side of the crater was stained yellow with sulfides. Bluish fumes, sulfuric gases, blew S and SW. Using an infrared camera, IES scientists measured a temperature of 300°C in the crater and 50°C in the lava field to the N. Courtesy of Gunnar B. Gudmundsson, IES. |
On a 26 May IES expedition to the summit, tephra deposits in and around the E half of the crater were measured to be ~ 40 m thick close to the craters. Intense steam rose from the craters, with occasional small ashy explosions. Noise of intense boiling and or degassing came from the craters. Visibility to the bottom was limited due to steam. The crater rim was coated with fine ash that extended ~ 20 m out from the edge. A strong smell of sulfur came from around the craters.
IES and IMO reported widespread drifting of existing ash SW on 1 June, with abundant airborne dust in the capitol, Reykjavík. No lightning strikes were detected, and there was low discharge of meltwater from Gígjökull. Volcanic tremor was still higher than before the eruption, being rather steady since 22 May, but small pulses, mostly on the lowest frequency, were detected. Several small and shallow earthquakes under the volcano occurred on a daily basis. No significant GPS deformation was measured. There was still a considerable amount of steam coming from the crater.
Recent precursory intrusions. According to Sturkell and others (2009), "In 1994, and again in 1999, magma intrusion was detected under the southern slopes of Eyjafjallajokull. These intrusions had their center of uplift approximately 4 km southeast of the summit crater of the volcano and were associated with considerable seismic activity. After the intrusion event in 1999, crustal deformation and earthquake activity at Eyjafjallajokull have remained low." However, according to Pall Einarsson of IES, earthquake swarms and two more sill intrusions took place in 2009 (Einarsson, 2010).
Aviation impacts. According to Wall and Flottau (2010), more than 100,000 flights were canceled after the ash plume caused aviation authorities in many parts of Europe to close their airspace for several days. As compared with the same day of the previous week, flights decreased from about 27% on 15 April 2010 to almost 80% on 17-18 April, returning to 21% by 22 April. Wall, Flottau, and Mecham (2010) noted the difficulty if assessing the risk of flying through volcanic ash plumes which can have varying particulate concenrations and compositions.
The Finnish Air Force (FAF) Command Operations Division released a report of 21 April discussing jet engine damage from airborne ash from Iceland; at the time of this writing, the report was only available in Finnish. Routes of several FAF aircraft (figure 15) suggest that the flight distances were on the order of a few hundred kilometers. The Flightglobal website reported the FAF released images showing the effects of volcanic dust ingestion from inside the engines of a jet fighter that flew through the ash cloud on the morning of 15 April. One aircraft engine showed melted ash clearly visible on an interior surface. Another jet trainer flew through the plume carrying an air sampling pod to collect dust from the atmosphere at various altitudes, however the measurements have yet to be reported.
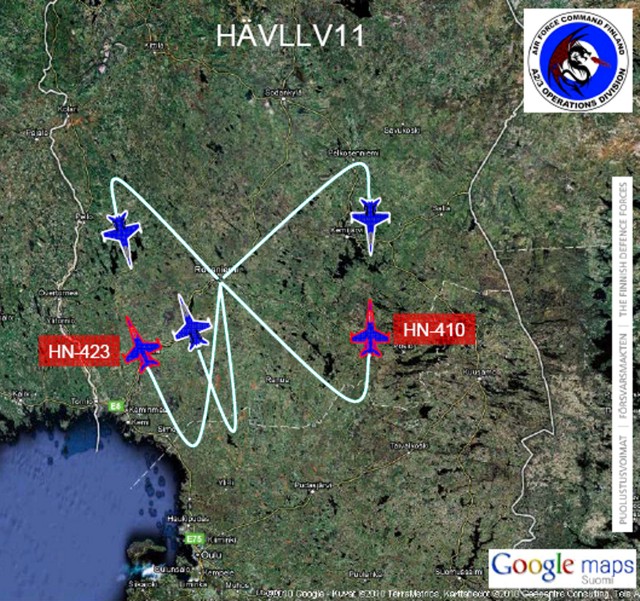 |
Figure 15. Map of southern Finland showing routes of FAF aircraft which a news report described as five Boeing F-18 Hornet fighters. The Gulf of Bothnia appears at the lower left, a water body with a NW-SE extent of ~200 km in this area. From this map it appears that the routes labeled HN-423 and HN-410 were on the order of 200 km. Courtesy of Finnish Air Force. |
References. Einarsson, P., 2010, The Eyjafjallajökull volcano, Iceland: Tectonic setting, structure, and magma plumbing during the current activity, Cities on Volcanoes (COV6), 30 May to 4 June 2010, Tenerife; 4.1-O-10.
Sturkell, E., Einarsson, P., Sigmundsson, F., Hooper, A., Ófeigsson, B.G., Geirsson, H., and Ólafsson, H., 2009, Katla and Eyjafjallajökull volcanoes, in Schomacker, A., Krüger. J., and Kjr, K.H., eds., The Mrdalsjökull Ice cap, Iceland - Glacial processes, sediments and landforms on an active volcano: Developments in Quaternary Sciences, v. 13, p. 5-12.
Wall, R., and Flottau, J., 2010. Out of the ashes: Rising losses and recriminations rile Europe's air transport sector: Aviation Week & Space Technology, v. 172, no. 16, p.23-25.
Wall, R., Flottau, J., and Mecham, M., 2010, Dirty little secret: Volcanic eruption raises more than dust as questions about flight safety fly: Aviation Week & Space Technology, v. 172, no. 16, p. 24-26.
Information Contacts: University of Iceland Institute of Earth Sciences (EIS), Nordic Volcanological Center, Sturlugata 7, Askja, 101 Reykjavik, Iceland (URL: http://www.earthice.hi.is/page/ies_volcanoes) [contributors:Páll Einarsson, ásta Rut Hjartardóttir, Magnus Tumi Gudmundsson, Freysteinn Sigmundsson, Eyjólfur Magnússon, Niels Oskarsson, Gudrun Larsen, Sigrun Hreinsdottir, Rikke Pedersen, Ingibjörg Jónsdóttir]; Icelandic Meteorological Office (IMO) (URL: http://en.vedur.is/) [Contributors:Steinunn Jakobsdóttir, Kristin S. Vogfjord, Sigurlaug Hjaltadottir, Gunnar B. Gudmundsson, Matthew J. Roberts; London VAAC (URL: http://www.metoffice.gov.uk/aviation/vaac/vaacup_vag.html); NASA Earth Observatory (URL: http://earthobservatory.nasa.gov/); Flightglobal (URL: http://www.flightglobal.com/articles/2010/04/16/340727/pictures-finnish-F-18-engine-check reveals effects of volcanic dust-16-04-2010-London-Flightglobal_com.mht).
Eruption ended in late June 2010; sample of growing literature on the eruption
Gudmundsson and others (2010a) noted that the last day of sustained activity at Eyjafjallajökull took place on 22 May 2010. By 23 June 2010, the Iceland Meteorological Office (IMO) and the University of Iceland Institute of Earth Sciences (IES) ceased issuing regular status reports. In addition to discussing the eruption and its final stages, this report also cites a small sample of abstracts and papers from the numerous conferences, sessions, and publications that have thus far emerged on the eruption.
The eruption's initial phase, 20 March-12 April 2010, occurred at Fimmvörðuháls, a spot on the E flanks of Eyjafjallajökull (figure 16, and "F" and "E" on figure 17). Venting at Fimmvörðuháls took place on an exposed ridge cropping out in a region with extensive glaciers to the E and W. Eruptions began in the initially ice-capped summit crater of Eyjafjallajökull on 14 April 2010 (BGVN 35:03 and 35:04). After melting overlying portions of the icecap, the summit crater then emitted clouds of fine-grained ash that remained suspended in the atmosphere for long distances. The ash blew both over the Atlantic and for considerable intervals passed directly over Europe, halting flights of most commercial aircraft for nearly a week in a controversial shutdown with economic impacts in the billions.
|
Figure 16. Index map showing Iceland, some major plate-tectonic features and generalized spreading directions, and the location of Eyjafjallajökull volcano. Note proximity of Eyjafjallajökull to Katla and to the volcanoes of the Vestmann island area (Vestmannaeyjar), Surtsey and Heimaey. Courtesy of USGS. |
|
Figure 17. A shaded-relief map showing Eyjafjallajökull (E), and 9 km to its E, the flank vent Fimmvörðuháls (F). Stars indicate 2010 eruptive sites (map scale at top left). Glaciers cover extensive portions of both Eyjafjallajökull and Katla volcanoes (light pattern). During 14-29 April 2010 many earthquakes struck with epicenters along the N-S axis of Eyjafjallajökull (black dots). The map includes a small slice of the Atlantic ocean along the lower left-hand margin. Two of four geodetic (GPS) stations are shown (STE2 and THEY). Revised from a map by Sigmundsson and others (2010). |
In terms of satellite thermal data on the overall eruption, the MODVOLC system measured extensive (multi-pixel) daily alerts during 21 March-21 May 2010, but the alerts became absent thereafter.
Venting at Fimmvörðuháls. At a 15-19 September 2010 conference on the eruption, Höskuldsson and others (2010a) characterized the course of events during the 20 March to 12 April basaltic Fimmvörðuháls flank eruption at Eyjafjallajökull as follows: "At the beginning the eruption featured as many as 15 lava fountains with maximum height of 150 m. On March 24 only four vents were active with fountains reaching to heights of 100 m. On March 31 and April 1 the activity was characterized by relatively weak fountaining through a forcefully stirring pool of lava. The vents were surrounded by 60-80 m high ramparts and the level of lava stood at approximately 40 m. This high stand led to opening of a new fissure trending northwest from the central segment of the original fissure. As activity on the new fissure intensified, the discharge from the original fissure declined and stopped on April 7.
"The intensity of the lava fountains varied significantly on the time scale of hours and was strongly influenced the level of the lava pond in the vents, producing narrow, gas-charged, piston-like fountains during periods of low lava levels, but spray-like fountains when the lava level was high . . ..
"The eruption produced a fountain-fed lava flow field with an area of about 1.3 km2. Initially (20-25 March), the lava advanced towards northeast, but on March 26 the lava began advancing to the west and northwest, especially after April 1 when the activity became concentrated on the new fissure. The flow field morphology is dominantly 'a'a, but domains of pahoehoe and slabby pahoehoe are present, particularly in the western sector of the flow field. The advance of the lava from the vents was episodic; when the lava stood high the lava surged out of the vents, but at low stand there was a lull in the advance. The lava discharged from the vents through open channels as well as internal pathways. The open channels were the most visible part of the transport system, feeding lava to active 'a'a flow fronts and producing spectacular lava falls when cascading into deep gullies just north of the vents. The role of internal pathways was much less noticeable, yet an important contribution to the overall growth of the flow field as it fed significant surface breakouts emerging on the surface of what otherwise looked like stagnant lava. When activity stopped on April 12 the fissure had issued about 0.025 km3 of magma, giving a mean discharge of 13 m3/s."
Summit eruption. The second eruption occurred within the initially ice-covered caldera of Eyjafjallajökull. Opening of the ice cover and explosivity into the atmosphere was amplified by magma-ice interaction that produced a fine ash capable of suspension in the atmosphere for prolonged periods.
Höskuldsson and others (2010b) described the eruption at Eyjafjallajökull's summit (beginning 14 April 2010) as consisting of three phases (table 2). They also stated that at the summit the "Total amount of tephra produced in the eruption is about 0.11 km3 and that of lava 0.025 km3 DRE [dense-rock equivalent]. Average discharge rate in the eruption was about 40 m3/s DRE or about 4 times that of Fimmvörðuháls eruption."
Table 2. Three phases of the eruption at Eyjafjallajökull volcano's summit beginning 14 April 2010 as summarized and condensed by Höskuldsson and others (2010b).
| Dates | Phase | Description of Activity |
| 14 Apr-17 Apr 2010 | I | Plumes often under 6 km but up to ~9 km altitude. |
| 18 Apr-04 May 2010 | II | High tremor with lava flows; generally weak and ash-poor plumes. Pulsating activity with small discrete explosions every few seconds. Tephra grains had fluidal shapes suggesting magmatic fragmentation and decreased viscosity of erupting magma. Plumes on 28th to 7 km altitude. |
| 05 May-22 May 2010 | III | Plumes up to 5 km altitude. |
The summit area was still steaming and geothermally active, and the eruption channel was still very hot in October 2010 (figure 18). Investigators expected that cooling to ambient temperatures would take a few years . As noted below, during June 2010, hot lava could still be seen in cracks in the cooled rock on Fimmvörðuháls, and inside craters, but that was not the case at the ice-engulfed summit caldera.
|
Figure 18. The summit crater complex of Eyjafjallajökull taken after the first winter snow, as seen from the air at 0810 on 9 October 2010. The scene helps explain the high degree of water and ice interaction with the erupting lavas. Snow had melted from numerous ash and lava-covered surfaces (black areas). Although portions of the crater emitted steam, evidence of substantial ongoing lava emissions were absent at this point in time. Photo courtesy of Ólafur Sigurjónsson, IMO. |
According to Gudmundsson and others (2010b) the summit eruption produced 0.1-0.2 km3 (dense rock equivalent) of tephra. IES reported that by 11 June 2010 a lake about 300 m in diameter had formed in the large summit crater, and by 23 June water was slowly accumulating in the crater because ice was no longer in contact with hot material.
Intrusion triggering. Sigmundsson and others (2010) noted that the 2010 eruptions came after 18 years of intermittent volcanic unrest. The deformation associated with the eruptions was unusual because it did not relate to pressure changes within a single source. Deformation was rapid before the flank eruption (0.5 mm per day after 4 March 2010), but negligible during it.
During the summit eruption (beginning 14 April 2010) gradual contraction of a source, distinct from the pre-eruptive inflation sources, was evident from geodetic data. Thus, clear signals of volcanic unrest may occur over years to weeks, indicating reawakening of such volcanoes, whereas immediate short-term eruption precursors may be subtle and difficult to detect.
Figure 19 shows a cross-sectional model of the shallow crust by Sigmundsson and others (2010) based deformation and seismic analyses of the 2010 event. A previous issue of the Bulletin (BGVN 35:03) contained an alternate model by Paul Einarsson.
|
Figure 19. Schematic E-W cross-section across the Eyjafjallajökull summit area, with deformation sources plotted at their best-fit depth (vertical exaggeration of 2). Gray shaded background indicates source-depth uncertainties (95% confidence interval), which overlap. Courtesy of Sigmundsson and others (2010). |
Processed satellite image. Vincent J. Realmuto created two composite figures generated from the MODIS-Terra satellite data acquired 15 April 2010 at 1135 UTC (figure 20). Outlined in black in each image are Iceland on the upper left side (W), Faroe Islands in the center, Scotland and N Ireland in the lower center, and part of the Scandinavian peninsula on the right side (E). An ash plume can be seen in each image extending from Iceland SW toward Europe. The left-hand image is the true-color RGB (red-green-blue) composite and the right-hand image is a false-color composite; in the right-hand rendition the ash plume appears red and the ice-rich clouds appear blue. The right-hand image puts obvious emphasis on the ash plume and shows it streaming and more or less intact for several hundreds of kilometers E of Iceland.
|
Figure 20. Graphics generated from the MODIS-Terra satellite data acquired 15 April 2010 at 1135 UTC. The left-hand graphic is a true-color RGB (red-green-blue) composite, and the right-hand image is a false-color composite of Bands 32, 31, and 29 (12, 11, and 8.5 um, respectively) displayed in red, green, and blue, respectively. These data were processed with the decorrelation stretch (D-stretch), a technique for enhancing spectral contrast based on principal components analysis. In this rendition the ash plume appears red and the ice-rich clouds appear blue. The D-stretch was based on scene statistics and was intended to be a quick method for discriminating material that may be volcanic in origin. Courtesy of Vincent J. Realmuto, Jet Propulsion Laboratory, California Institute of Technology. |
Conference field trip. Following The Atlantic Conference on Eyjafjallajökull and Aviation in Iceland, 15-16 September 2010 (discussed below), a field trip brought scientists to accessible areas on the volcano, including the flank vent on Fimmvörðuháls ridge where the eruption began. John and Liudmila Eichelberger provided some photographs from this trip (figure 21). The same base map appeared in BGVN 35:03, with the key and other data. The horseshoe shape of the lava distribution in this figure is the feature imaged by an ASTER satellite thermal signature as active lava flows on 19 April 2010 in BGVN 35:03.
|
Figure 21. (Central panel) Map showing fissures at Fimmvörðuháls (thin red lines) and the distribution of new scoria and lava deposited at various points in time (shaded areas) during 21 March-7 April 2010. Marked arrows on the map give locations of labeled photos (A-E) taken 18 September 2010. (A) Fresh lava (darker) seen looking N. In the distance appear fresh black lava flows, some portions of which formed the lava falls down the valley walls. (B) View showing the elongate ridge as seen from the upslope perspective (people in the distance for scale). (C, looking down) Glowing lava (~1.5 m long and ~0.3 m wide) at the bottom of a fissure. This photo was taken with a flash, otherwise the fissure walls would have been very dark. (D) The fracture indicated on the map as it appeared near the rim of the ridge of newly erupted lava. (E) The same fracture seen in D from another perspective. Courtesy of John and Ludmilla Eichelberger. |
More on conferences and publications. Recently, several conferences have been held and many publications have been issued relevant to the eruption. What follows is a mere sample of the available resources, many of which emphasized plume research. At the American Geophysical Union (AGU) 2010 Fall Meeting, several sessions focused on the 2010 eruption (eg., Carn and others, 2010; see References for the link to abstracts volume).
The Workshop on Ash Dispersal Forecast and Civil Aviation held in Geneva, 18-20 October 2010, addressed the characteristics and range of application of different volcanic ash transport and dispersal models (VATDM), identifying the needs of the modeling community, investigating new data acquisition strategies, and discussing how to improve communication between the volcanology community and operational agencies (eg., Bonadonna and others, 2011).
The Cities on Volcanoes conference (COV-6; Tenerife, Canary Islands, Spain, 31 May-4 June 2010) included both papers (eg. Fischer and others, 2010) and a forum on the "Assessment of volcanic ash threat: learning and considerations from the Eyjafjallajökull eruption."
In addition, several other papers relevant to the eruption were presented during this meeting, as well as at the Annual Meeting of the American Meteorological Society (AMS) in Seattle, WA, in January 2011, and at the European Geosciences Union (EGU) 2011 General Assembly in Vienna, Austria.
The journal Atmospheric Chemisrty and Physics published multiple issues with a section entitled "Atmospheric implications of the volcanic eruptions of Eyjafjallajökull, Iceland 2010." These and other papers discussed various means of plume detection, and in some cases, sampling, including on the ground, in ultralight aircraft, and on satellites; models of plume dispersion were evaluated (Flentje and others, 2010; Emeis and others, 2011; Vogel and others, 2011; Fischer and others, 2010).
According to Loughlin (2010), scientists from the British Geological Survey found large ash particles from the eruption in the United Kingdom. Most of the very small ash particles in volcanic plumes fell as clusters of particles known as aggregates. The aggregation could have resulted from a number of mechanisms, including electrostatic attraction, particle collisions, condensation of liquid films and secondary mineralization. The process of aggregation effectively removed very small particles from the plume and was therefore one variable on how long ash particles stay in the atmosphere. Ripley (2010) and Chivers (2010) published articles on the U.K. Met Office's tracking and prediction of movements of volcanic ash based on observations from the Eyjafjallajökull eruption.
Gislason and others (2011) reported on analyses of two sets of fresh, comparatively dry ash samples that fell in Iceland and were collected rapidly on 15 and 27 April, during more and less explosive phases, respectively. Both sets of samples were kept dry and analyzed swiftly to minimize issues with hydration and alteration, particularly to salts on the ash surfaces. The ash was dominantly glass of andesitic composition (57-58% SiO2). They found the ash particles especially sharp and abrasive over their entire size range, from submillimeter to tens of nanometers.
References. Bonadonna, C., Folch, A., and Loughlin, S., 2011, Future Developments in Modeling and Monitoring of Volcanic Ash Clouds, Eos, Transactions of the American Geophysical Union (AGU), v. 92, no. 10; pp. 85-86, DOI: 10.1029/2011EO100008 (URL: http://www.agu.org/pub/eos/).
Carn, S.A., Karlsdottir, S., and Prata, F., 2010, The 2010 Eruption of Eyjafjallajokull: A Landmark Event for Volcanic Cloud Hazards I, II, and III, Abstracts V41E, V53F, and V54C presented at 2010 Fall Meeting, American Geophysical Union, San Francisco, CA, 13-17 December 2010 (URL: http://www.agu.org/meetings/fm10/program/index.php).
Chivers, H., 2010, Dark Cloud: VAAC and predicting the movement of volcanic ash, Meterological Technology International, June 2010, pp. 62-65.
Emeis, S., Forkel, R., Junkermann, W., Schäfer, K., Flentje, H., Gilge, S., Fricke, W., Wiegner, M., Freudenthaler, V., Groß, S., Ries, L., Meinhardt, F., Birmili, W., Münkel, C., Obleitner, F., and Suppan, P., 2011, Measurement and simulation of the 16/17 April 2010 Eyjafjallajökull volcanic ash layer dispersion in the northern Alpine region, Atmospheric Chemistry and Physics, v. 11, pp. 2689-2701.
Fischer, C., van Haren, G., Pohl, T., Vogel, A., and Weber, K., 2010, Airborne in-situ measurements of the volcanic ash dust plume over a part of Germany caused by the volcano eruption of the Eyjafjallajökull (Iceland) by means of an optical particle counter and a light
sport aircraft, Abstract, Session 1.3, p. 229, Cities on Volcanoes 6 Conference (URL: http://www.citiesonvolcanoes6.com/ver.php).
Flentje, H., Claude, H., Elste, T., Gilge, S., Köhler, U., Plass-Dülmer, C., Steinbrecht, W., Thomas, W., Werner, A., and Fricke W., 2010, The Eyjafjallajökull eruption in April 2010 - detection of volcanic plume using in-situ measurements, ozone sondes and lidar-ceilometer profiles, Atmospheric Chemistry and Physics, v. 10, pp. 10085-10092, DOI: 10.5194.
Gasteiger, J., Groß, S., Freudenthaler, V., and Wiegner, M., 2011, Volcanic ash from Iceland over Munich: mass concentration retrieved from ground-based remote sensing measurements, Atmospheric Chemistry and Physics, v. 11, pp. 2209-2223.
Gislason, S.R., Hassenkam, T., Nedel, S., Bovet, N., Eiriksdottir, E.S., Alfredsson, H.A., Hem, C.P., Balogh, Z.I., Dideriksen, K., Oskarsson, N., Sigfusson, B., Larsen, G., and Stipp, S.L.S., 2011, Characterization of Eyjafjallajökull volcanic ash particles and a protocol for rapid risk assessment, Proceedings of the National Academy of Sciences, v. 108, no. 18, p. 7303-7312.
Gudmundsson, M. T., Pedersen, R., Vogfjörd, K., Thorbjarnardóttir, B., Jakobsdóttir, S., and Roberts, M.J., 2010a, Eruptions of Eyjafjallajökull Volcano, Iceland, Eos, Transactions of the American Geophysical Union (AGU), v. 91, no. 21, p. 190, DOI: 10.1029/2010EO210002.
Gudmundsson, M.T., Thordarson, T., Hoskuldsson, A., Larsen, G., Jónsdóttir, I., Oddsson, B., Magnusson, E., Hognadottir, T., Sverrisdottir, G., Oskarsson, N., Thorsteinsson, T., Vogfjord, K., Bjornsson, H., Pedersen, G.N., Jakobsdottir, S., Hjaltadottir, S., Roberts, M.J., Gudmundsson, G.B., Zophoniasson, S., and Hoskuldsson, F., 2010b, The Eyjafjallajökull eruption in April-May 2010; course of events, ash generation and ash dispersal, EOS, Transactions of the American Geophysical Union (AGU), V. 91, no. 21, Abstract V53F-01, 2010 Fall Meeting, AGU, San Francisco, Calif., 13-17 December (URL: http://www.agu.org/cgi-bin).
Heue, K.-P., Brenninkmeijer,C.A.M., Baker, A. K., Rauthe-Schöch, A., Walter, D., Wagner, T., Hörmann, C., Sihler, H., Dix, B., Frieß, U., Platt, U., Martinsson, B. G., van Velthoven, P.F.J., Zahn, A., and Ebinghaus, R., 2011, SO2 and BrO observation in the plume of the Eyjafjallajökull volcano 2010: CARIBIC and GOME-2 retrievals, Atmospheric Chemistry and Physics, v. 11, pp. 2973-2989.
Höskuldsson, A., Magnusson, E., Guðmundsson, M.T., Sigmundsson, F., and Sigmarsson, O., 2010a, The 20 March to 12 April basaltic Fimmvörðuháls flank eruption at Eyjafjallajökull volcano, Iceland: Course of events, abstract of presentation in Program of the Eyjafjallajökull and Aviation Conference (15-16 September 2010) and associated Eyjafjallajökull Eruption Workshop (Hotel Hvolsvellir, 17-19 September 2010); (URL: http://en.keilir.net/keilir/conferences/eyjafjallajokull/volcanological-workshop).
Höskuldsson, Á., Larsen, G., Gudmundsson, M.T., Oddsson, B., Magnússon, E., Sigmarsson, O., Óskarsson, N., Jónsdóttir, I., Sigmundsson, F., Einarsson, P., Hreinsdóttir, S., Pedersen, R., Högnadóttir, Þ., Thordarson, T., Hayward, C., Hartley, M., Meara, R., Arason, Þ., Karlsdóttir, S., and Petersen, G.N., 2010b, The Eyjafjallajökull eruption April to May 2010: Magma fragmentation, plume and tephra transport, and course of events, abstract of presentation in Program of the Eyjafjallajökull and Aviation Conference (15-16 September 2010) and associated Eyjafjallajökull Eruption Workshop (17-19 September 2010); (URL: http://en.keilir.net/keilir/conferences/eyjafjallajokull/volcanological-workshop).
Laursen, L., 2010, Iceland eruptions fuel interest in volcanic gas monitoring, Science, v. 328, no. 5977, p. 410-411.
Loughlin, S., 2010, Modelling of Iceland volcanic ash particles, news item from British Geological Survey (URL: http://www.bgs.ac.uk/research/highlights/IcelandAshParticles.html?src=sfb).
Ripley, T., 2010, Cloud Busting: How the UK is tracking the volcanic ash cloud, Meterological Technology International, June 2010, pp. 6-10.
Schumann, U., Weinzierl, B., Reitebuch, O., Schlager, H., Minikin, A., Forster, C., Baumann, R., Sailer, T., Graf, K., Mannstein, H., Voigt, C., Rahm, S., Simmet, R., Scheibe, M., Lichtenstern, M., Stock, P., Rüba, H., Schäuble, D., Tafferner, A., Rautenhaus, M., Gerz, T., Ziereis, H., Krautstrunk, M., Mallaun, C., Gayet, J.-F., Lieke, K., Kandler, K., Ebert, M., Weinbruch, S., Stohl, A., Gasteiger, J., Groß, S., Freudenthaler, V., Wiegner, M., Ansmann, A., Tesche, M., Olafsson, H., and Sturm, K., 2011, Airborne observations of the Eyjafjalla volcano ash cloud over Europe during air space closure in April and May 2010, Atmospheric Chemistry and Physics, v. 11, pp. 2245-2279.
Sigmundsson, F., Hreinsdóttir, S., Hooper, A., Árnadóttir, T., Pedersen, R., Roberts, M.J., Óskarsson, N., Auriac, A., Decriem, J., Einarsson, P., Geirsson, H., Hensch, M., Ófeigsson, B.G., Sturkell, E., Sveinbjörnsson, H., and Feigl, K.L., 2010, Letter: Intrusion triggering of the 2010 Eyjafjallajökull explosive eruption, Nature, v. 468, pp. 426-430.
Stohl, A., Prata, A.J., Eckhardt, S., Clarisse, L., Durant, A., Henne, S., Kristiansen, N.I., Minikin, A., Schumann, U., Seibert, P., Stebel, K., Thomas, H.E., Thorsteinsson, T., Tørseth, K., and Weinzierl, B., 2011, Determination of time- and height-resolved volcanic ash emissions and their use for quantitative ash dispersion modeling: the 2010 Eyjafjallajökull eruption, Atmospheric Chemistry and Physics, v. 11, pp. 4333-4351.
Vogel, A., Weber, K., Fischer, C., van Haren, G., Pohl, T., Grobety, B., and Meier, M., 2011, Airborne in-situ measurements of the Eyjafjallojökull ash plume with a small aircraft and optical particle spectrometers over north-western Germany - comparison between the aircraft measurements and the VAAC-model calculations, European Geophysical Union General Assembly, Geophysical Research Abstracts, v. 13, p. EGU2011-13253.
Information Contacts: Institute of Earth Sciences (IES), University of Iceland, Sturlugata 7, Askja , 101 Reykjavík (URL: http://www.earthice.hi.is/); Icelandic Meteorological Office (IMO) (URL: http://en.vedur.is/earthquakes-and-volcanism/articles/nr/1884); U.K. Meteorological Office (URL: http://www.metoffice.gov.uk); ármann Höskuldsson, Institute of Earth Sciences (IES), University of Iceland, Sturlugata 7, Askja , 101 Reykjavík (URL: http://www.earthice.hi.is); Hawai'i Institute of Geophysics and Planetology (HIGP) MODVOLC Thermal Alerts System, School of Ocean and Earth Science and Technology (SOEST), Univ. of Hawai'i, 2525 Correa Road, Honolulu, HI 96822, USA (URL: http://modis.higp.hawaii.edu/); Sue C. Loughlin, The British Geological Survey, Murchison House, West Mains Road, Edinburgh EH9 3LA, Scotland, UK (URL: http://www.bgs.ac.uk/); Vincent J. Realmuto, Jet Propulsion Laboratory, California Institute of Technology, M/S 183-501, 4800 Oak Grove Drive, Pasadena, CA 91109 USA; John Eichelberger, U.S. Geological Survey, Volcano Hazards Program, Reston, VA (URL: http://volcanoes.usgs.gov/); Ludmilla Eichelberger, Global Volcanism Program, National Museum of Natural History, 10th and Constitution Ave., NW, Washington, DC 20560 USA; Iceland Review (URL: http://icelandreview.com/icelandreview/daily_news/).
This compilation of synonyms and subsidiary features may not be comprehensive. Features are organized into four major categories: Cones, Craters, Domes, and Thermal Features. Synonyms of features appear indented below the primary name. In some cases additional feature type, elevation, or location details are provided.
Synonyms |
||||
| Eyafjalla | Eyjafjöll | ||||
Craters |
||||
| Feature Name | Feature Type | Elevation | Latitude | Longitude |
| Fimmvorduhals | Fissure vent | 1067 m | 63° 38' 6" N | 19° 26' 24" W |
| Hamragardarhraun | Fissure vent | 620 m | 63° 38' 0" N | 19° 48' 0" W |
| Hofdahraun | Fissure vent | 682 m | 63° 38' 0" N | 19° 51' 0" W |
| Irarhraun | Fissure vent | 63° 38' 0" N | 19° 46' 0" W | |
| Midskalarheidarhraun | Fissure vent | 994 m | 63° 36' 0" N | 19° 46' 0" W |
| Raudahraun | Fissure vent | 625 m | 63° 39' 0" N | 19° 51' 0" W |
| Skerjahraun | Fissure vent | 1100 m | 63° 39' 0" N | 19° 43' 0" W |
|
|
||||||||||||||||||||||||
There is data available for 5 confirmed Holocene eruptive periods.
2010 Mar 20 - 2010 Jun 23 Confirmed Eruption Max VEI: 4
| Episode 1 | Precursory Episode | ENE flank (Fimmvörduháls) and summit | |||||||||||||||||||
|---|---|---|---|---|---|---|---|---|---|---|---|---|---|---|---|---|---|---|---|---|
| 2010 Mar 1 - 2010 Mar 20 | Evidence from Observations: Seismicity | |||||||||||||||||||
|
List of 2 Events for Episode 1 at ENE flank (Fimmvörduháls) and summit
| ||||||||||||||||||||
| Episode 2 | Eruption Episode | ENE flank (Fimmvörduháls) and summit | ||||||||||||||||||||||||||||||||||||||||||||||||||||||||||||||||||||||||||||||||||||||||||||||||||||||||||||||||||||||||||||||||||||||||||||||||||||||||||||||||||||||||||||||||||||||||||||||||||||||||||||||||||||||||||||||||||||||||||||||||||||||||||||||||||||||||||||||||||||||||||||||||||||||||||||||||||||||||||||||||||||||||||||||||||||||||||||||||||||||||||||||||||||||||||||||||||||||||||||||||||||||||||||||||||||||||||||||||||||||||||||||||||||||||||||||||||||||||||||||||||||||||||||||||||||||||||||||||||||||||||||||||||||||||||||||||||||||||||||||||||||
|---|---|---|---|---|---|---|---|---|---|---|---|---|---|---|---|---|---|---|---|---|---|---|---|---|---|---|---|---|---|---|---|---|---|---|---|---|---|---|---|---|---|---|---|---|---|---|---|---|---|---|---|---|---|---|---|---|---|---|---|---|---|---|---|---|---|---|---|---|---|---|---|---|---|---|---|---|---|---|---|---|---|---|---|---|---|---|---|---|---|---|---|---|---|---|---|---|---|---|---|---|---|---|---|---|---|---|---|---|---|---|---|---|---|---|---|---|---|---|---|---|---|---|---|---|---|---|---|---|---|---|---|---|---|---|---|---|---|---|---|---|---|---|---|---|---|---|---|---|---|---|---|---|---|---|---|---|---|---|---|---|---|---|---|---|---|---|---|---|---|---|---|---|---|---|---|---|---|---|---|---|---|---|---|---|---|---|---|---|---|---|---|---|---|---|---|---|---|---|---|---|---|---|---|---|---|---|---|---|---|---|---|---|---|---|---|---|---|---|---|---|---|---|---|---|---|---|---|---|---|---|---|---|---|---|---|---|---|---|---|---|---|---|---|---|---|---|---|---|---|---|---|---|---|---|---|---|---|---|---|---|---|---|---|---|---|---|---|---|---|---|---|---|---|---|---|---|---|---|---|---|---|---|---|---|---|---|---|---|---|---|---|---|---|---|---|---|---|---|---|---|---|---|---|---|---|---|---|---|---|---|---|---|---|---|---|---|---|---|---|---|---|---|---|---|---|---|---|---|---|---|---|---|---|---|---|---|---|---|---|---|---|---|---|---|---|---|---|---|---|---|---|---|---|---|---|---|---|---|---|---|---|---|---|---|---|---|---|---|---|---|---|---|---|---|---|---|---|---|---|---|---|---|---|---|---|---|---|---|---|---|---|---|---|---|---|---|---|---|---|---|---|---|---|---|---|---|---|---|---|---|---|---|---|---|---|---|---|---|---|---|---|---|---|---|---|---|---|---|---|---|---|---|---|---|---|---|---|---|---|---|---|---|---|---|---|---|---|---|---|---|---|---|---|---|---|---|---|---|---|---|---|---|---|---|---|---|---|---|---|---|---|---|---|---|---|---|---|---|---|---|---|---|---|---|---|---|---|---|---|---|---|---|---|---|---|---|---|---|---|---|---|---|---|---|---|---|---|---|---|---|---|---|---|---|---|---|---|---|---|---|---|---|---|---|---|---|---|---|---|---|---|---|---|---|---|---|---|---|---|---|---|---|---|---|---|---|---|---|---|---|---|---|---|---|---|---|---|---|---|---|---|---|---|---|---|
| 2010 Mar 20 - 2010 Jun 23 | Evidence from Observations: Reported | ||||||||||||||||||||||||||||||||||||||||||||||||||||||||||||||||||||||||||||||||||||||||||||||||||||||||||||||||||||||||||||||||||||||||||||||||||||||||||||||||||||||||||||||||||||||||||||||||||||||||||||||||||||||||||||||||||||||||||||||||||||||||||||||||||||||||||||||||||||||||||||||||||||||||||||||||||||||||||||||||||||||||||||||||||||||||||||||||||||||||||||||||||||||||||||||||||||||||||||||||||||||||||||||||||||||||||||||||||||||||||||||||||||||||||||||||||||||||||||||||||||||||||||||||||||||||||||||||||||||||||||||||||||||||||||||||||||||||||||||||||||
|
List of 111 Events for Episode 2 at ENE flank (Fimmvörduháls) and summit
| |||||||||||||||||||||||||||||||||||||||||||||||||||||||||||||||||||||||||||||||||||||||||||||||||||||||||||||||||||||||||||||||||||||||||||||||||||||||||||||||||||||||||||||||||||||||||||||||||||||||||||||||||||||||||||||||||||||||||||||||||||||||||||||||||||||||||||||||||||||||||||||||||||||||||||||||||||||||||||||||||||||||||||||||||||||||||||||||||||||||||||||||||||||||||||||||||||||||||||||||||||||||||||||||||||||||||||||||||||||||||||||||||||||||||||||||||||||||||||||||||||||||||||||||||||||||||||||||||||||||||||||||||||||||||||||||||||||||||||||||||||||
1821 Dec 19 - 1823 Jan 1 Confirmed Eruption Max VEI: 2
| Episode 1 | Eruption Episode | ||||||||||||||||||||||||||||||
|---|---|---|---|---|---|---|---|---|---|---|---|---|---|---|---|---|---|---|---|---|---|---|---|---|---|---|---|---|---|---|
| 1821 Dec 19 - 1823 Jan 1 | Evidence from Observations: Reported | |||||||||||||||||||||||||||||
|
List of 4 Events for Episode 1
| ||||||||||||||||||||||||||||||
1612 Confirmed Eruption Max VEI: 2
| Episode 1 | Eruption Episode | |||||||||||||||||||||||||
|---|---|---|---|---|---|---|---|---|---|---|---|---|---|---|---|---|---|---|---|---|---|---|---|---|---|
| 1612 - Unknown | Evidence from Observations: Reported | ||||||||||||||||||||||||
|
List of 3 Events for Episode 1
| |||||||||||||||||||||||||
0920 (?) Confirmed Eruption Max VEI: 3
| Episode 1 | Eruption Episode | NW flank (Skerin ridge) | ||||||||||||||||||||||||||||||||||
|---|---|---|---|---|---|---|---|---|---|---|---|---|---|---|---|---|---|---|---|---|---|---|---|---|---|---|---|---|---|---|---|---|---|---|---|
| 0920 (?) - Unknown | Evidence from Correlation: Tephrochronology | ||||||||||||||||||||||||||||||||||
|
List of 5 Events for Episode 1 at NW flank (Skerin ridge)
| |||||||||||||||||||||||||||||||||||
0550 (?) Confirmed Eruption
| Episode 1 | Eruption Episode | ||||
|---|---|---|---|---|
| 0550 (?) - Unknown | Evidence from Correlation: Tephrochronology | |||
There is data available for 4 deformation periods. Expand each entry for additional details.
| Start Date: 2010 Apr | Stop Date: 2010 May | Direction: Subsidence | Method: GPS, InSAR |
| Magnitude: Unknown | Spatial Extent: Unknown | Latitude: Unknown | Longitude: Unknown |
Remarks: GPS and InSAR data reveal a co-eruptive deformation stage associated with the April?May summit eruption, indicating gradual deflation of a source distinct from the pre-eruptive inflation source. | |||
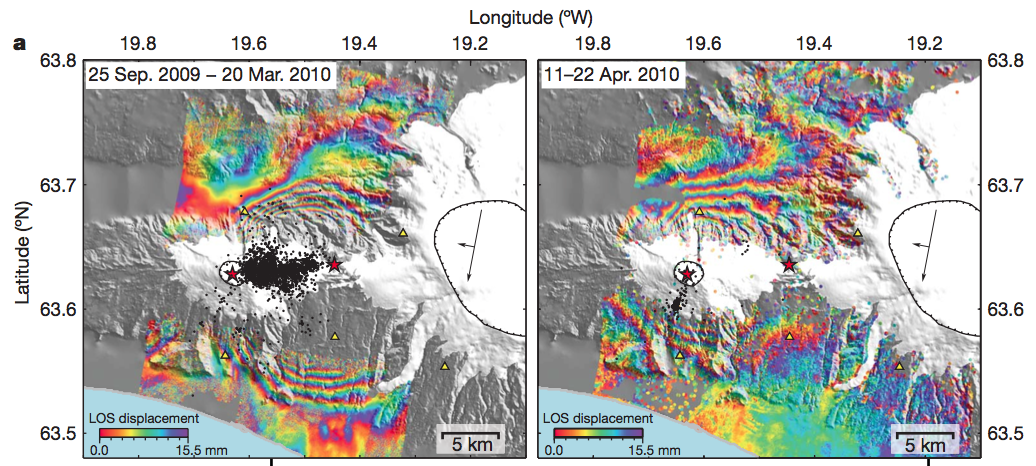 |
a, TerraSAR-X interferograms from descending satellite orbits, spanning the pre-eruptive intrusive period (left, time period 25 September 2009 to 20 March 2010 at 7:49 GMT) and the initial days of the explosive eruption (right, time period 11 to 22 April 2010). Black orthogonal arrows show the satellite flight path and look direction. One colour fringe corresponds to line-of-sight (LOS) change of 15.5 mm (positive for increasing range, that is, motion of the ground away from the satellite). Black dots show earthquake epicentres for the corresponding period. Background is shaded topography. Thick lines below indicate the time span of the interferograms. Red stars and triangles same as in Fig. 1. From: Sigmundsson et al. 2010. |
||
Reference List: Sigmundsson et al. 2010.
Full References:
Sigmundsson, F., A. Hooper, T. Árnadóttir, R. Pedersen, M. Roberts, N. Oskarsson, A. Auriac, J. Decriem, P. Einarsson, H. Geirsson, M. Hensch, B. G. Ofeigsson, E. Sturkell, H. Sveinbjörnsson & K. L. Feigl, 2010. Intrusion triggering of the 2010 Eyjafjallajökull explosive eruption. Nature, 468, 426-430.
| Start Date: 2009 Jul | Stop Date: 2010 Mar 20 | Direction: Uplift | Method: GPS, InSAR |
| Magnitude: Unknown | Spatial Extent: Unknown | Latitude: Unknown | Longitude: Unknown |
Remarks: GPS and InSAR data reveal a pre-eruptive stage of inflation due to a complicated time-evolving magma intrusion that produced variable and high rates of deformation, in particular after 4 March. | |||
|
a, TerraSAR-X interferograms from descending satellite orbits, spanning the pre-eruptive intrusive period (left, time period 25 September 2009 to 20 March 2010 at 7:49 GMT) and the initial days of the explosive eruption (right, time period 11 to 22 April 2010). Black orthogonal arrows show the satellite flight path and look direction. One colour fringe corresponds to line-of-sight (LOS) change of 15.5 mm (positive for increasing range, that is, motion of the ground away from the satellite). Black dots show earthquake epicentres for the corresponding period. Background is shaded topography. Thick lines below indicate the time span of the interferograms. Red stars and triangles same as in Fig. 1. From: Sigmundsson et al. 2010. |
||
Reference List: Sigmundsson et al. 2010.
Full References:
Sigmundsson, F., A. Hooper, T. Árnadóttir, R. Pedersen, M. Roberts, N. Oskarsson, A. Auriac, J. Decriem, P. Einarsson, H. Geirsson, M. Hensch, B. G. Ofeigsson, E. Sturkell, H. Sveinbjörnsson & K. L. Feigl, 2010. Intrusion triggering of the 2010 Eyjafjallajökull explosive eruption. Nature, 468, 426-430.
| Start Date: 1999 Jul 19 | Stop Date: 2000 May | Direction: Uplift | Method: GPS, InSAR |
| Magnitude: 35.000 cm | Spatial Extent: Unknown | Latitude: Unknown | Longitude: Unknown |
Remarks: Deformation at Eyjafjallajokull is accompanied by an earthquake swarm in 1999. | |||
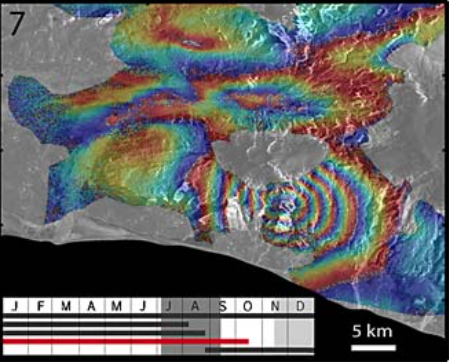 |
One of the nine interferograms selected for modeling the 1999 intrusive episode. Incoherent areas are masked. Amplitude image in background. The area corresponds to Fig. 1b. The time span insets show the relation to the period(s) of elevated seismic activity (Dark gray main seismic period; Light gray secondary seismic period). For details on dates please refer to Table 2. One full color cycle corresponds to a change in range of 2.8 cm From: Pedersen and Sigmundsson 2006. |
||
Reference List: Sturkell et al. 2003; Pedersen and Sigmundsson 2006.
Full References:
Pedersen, R., Sigmundsson, F., 2006. Temporal development of the 1999 intrusive episode in the Eyjafjallajökull volcano, Iceland, derived from InSAR images. Bull. Volc., 68, 377-393.
Sturkell, E., and P. Einarsson, F. Sigmundsson, S. Hreinsdottir, and H. Geirsson, Deformation of Grímsvötn volcano, Iceland: 1998 eruption and subsequent inflation,, 2003. Deformation of Grímsvötn volcano, Iceland: 1998 eruption and subsequent inflation. Geophysical Research Letters, 30, 1182. https://doi.org/10.1029/2002GL016460
| Start Date: 1993 Aug 03 | Stop Date: 1995 Jun 06 | Direction: Uplift | Method: InSAR, Tilt |
| Magnitude: 15.000 cm | Spatial Extent: Unknown | Latitude: Unknown | Longitude: Unknown |
Remarks: Deformation at Eyjafjallajokull is accompanied by an earthquake swarm in June 1994 and can be modeled with a horizontal sill intrusion. | |||
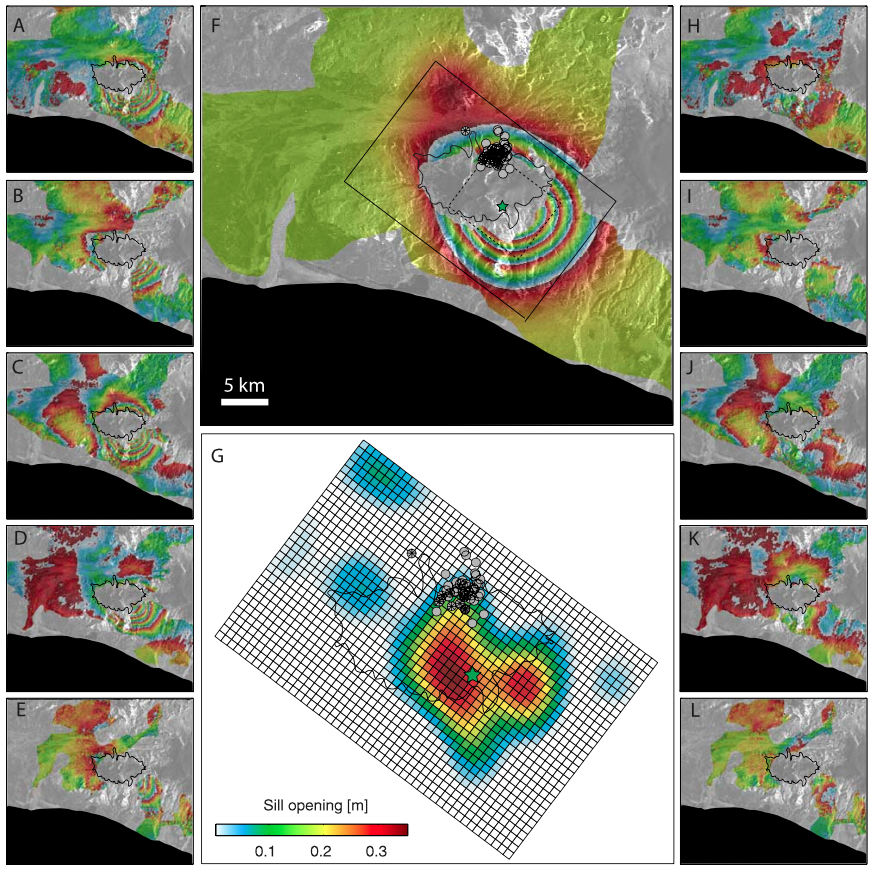 |
(a)?(e) Interferograms for modeling. All images cover the area shown in Figure 1B. Glacier outlined in black. Details on image-pairs in Table 1; (f ) Fringe pattern predicted by variable opening sill model. Dashed line shows outline of uniform sill plane. Green star: optimal Mogi source. Grey circles: best micro-earthquake locations from the swarm; (g) Variable sill opening. The three minor areas of opening disconnected from the main sill are artifacts due to atmospheric noise in the data. (h)?(l) Residual interferograms. From: Pedersen and Sigmundsson 2004. |
||
Reference List: Pedersen and Sigmundsson 2004.
Full References:
Pedersen, R., F. Sigmundsson,, 2004. InSAR based sill model links spatially offset areas of deformation and seismicity for the 1994 unrest episode at Eyjafjallajökull volcano, Iceland. Geophysical Research Letters, 31, L14610.
There is data available for 1 emission periods. Expand each entry for additional details.
| Start Date: 2010 Apr 14 | Stop Date: 2010 Apr 14 | Method: Satellite (Aura OMI) |
| SO2 Altitude Min: 9 km | SO2 Altitude Max: 9 km | Total SO2 Mass: 466 kt |
Data Details
| Date Start | Date End | Assumed SO2 Altitude | SO2 Algorithm | SO2 Mass |
| 20100414 | 9.0 | 466.000 |
The maps shown below have been scanned from the GVP map archives and include the volcano on this page. Clicking on the small images will load the full 300 dpi map. Very small-scale maps (such as world maps) are not included. The maps database originated over 30 years ago, but was only recently updated and connected to our main database. We welcome users to tell us if they see incorrect information or other problems with the maps; please use the Contact GVP link at the bottom of the page to send us email.
The following 1 samples associated with this volcano can be found in the Smithsonian's NMNH Department of Mineral Sciences collections, and may be availble for research (contact the Rock and Ore Collections Manager). Catalog number links will open a window with more information.
| Catalog Number | Sample Description | Lava Source | Collection Date |
|---|---|---|---|
| NMNH 117414 | Volcanic Ash | -- | -- |
| Catalogue of Icelandic Volcanoes (Link to Eyjafjallajökull) | The Catalogue of Icelandic Volcanoes is an interactive, web-based tool, containing information on volcanic systems that belong to the active volcanic zones of Iceland. It is a collaboration of the Icelandic Meteorological Office (the state volcano observatory), the Institute of Earth Sciences at the University of Iceland, and the Civil Protection Department of the National Commissioner of the Iceland Police, with contributions from a large number of specialists in Iceland and elsewhere. This official publication is intended to serve as an accurate and up-to-date source of information about active volcanoes in Iceland and their characteristics. The Catalogue forms a part of an integrated volcanic risk assessment project in Iceland GOSVÁ (commenced in 2012), as well as being part of the effort of FUTUREVOLC (2012-2016) on establishing an Icelandic volcano supersite. |
| Copernicus Browser | The Copernicus Browser replaced the Sentinel Hub Playground browser in 2023, to provide access to Earth observation archives from the Copernicus Data Space Ecosystem, the main distribution platform for data from the EU Copernicus missions. |
| MIROVA | Middle InfraRed Observation of Volcanic Activity (MIROVA) is a near real time volcanic hot-spot detection system based on the analysis of MODIS (Moderate Resolution Imaging Spectroradiometer) data. In particular, MIROVA uses the Middle InfraRed Radiation (MIR), measured over target volcanoes, in order to detect, locate and measure the heat radiation sourced from volcanic activity. |
| MODVOLC Thermal Alerts | Using infrared satellite Moderate Resolution Imaging Spectroradiometer (MODIS) data, scientists at the Hawai'i Institute of Geophysics and Planetology, University of Hawai'i, developed an automated system called MODVOLC to map thermal hot-spots in near real time. For each MODIS image, the algorithm automatically scans each 1 km pixel within it to check for high-temperature hot-spots. When one is found the date, time, location, and intensity are recorded. MODIS looks at every square km of the Earth every 48 hours, once during the day and once during the night, and the presence of two MODIS sensors in space allows at least four hot-spot observations every two days. Each day updated global maps are compiled to display the locations of all hot spots detected in the previous 24 hours. There is a drop-down list with volcano names which allow users to 'zoom-in' and examine the distribution of hot-spots at a variety of spatial scales. |
|
WOVOdat
Single Volcano View Temporal Evolution of Unrest Side by Side Volcanoes |
WOVOdat is a database of volcanic unrest; instrumentally and visually recorded changes in seismicity, ground deformation, gas emission, and other parameters from their normal baselines. It is sponsored by the World Organization of Volcano Observatories (WOVO) and presently hosted at the Earth Observatory of Singapore.
GVMID Data on Volcano Monitoring Infrastructure The Global Volcano Monitoring Infrastructure Database GVMID, is aimed at documenting and improving capabilities of volcano monitoring from the ground and space. GVMID should provide a snapshot and baseline view of the techniques and instrumentation that are in place at various volcanoes, which can be use by volcano observatories as reference to setup new monitoring system or improving networks at a specific volcano. These data will allow identification of what monitoring gaps exist, which can be then targeted by remote sensing infrastructure and future instrument deployments. |
| Volcanic Hazard Maps | The IAVCEI Commission on Volcanic Hazards and Risk has a Volcanic Hazard Maps database designed to serve as a resource for hazard mappers (or other interested parties) to explore how common issues in hazard map development have been addressed at different volcanoes, in different countries, for different hazards, and for different intended audiences. In addition to the comprehensive, searchable Volcanic Hazard Maps Database, this website contains information about diversity of volcanic hazard maps, illustrated using examples from the database. This site is for educational purposes related to volcanic hazard maps. Hazard maps found on this website should not be used for emergency purposes. For the most recent, official hazard map for a particular volcano, please seek out the proper institutional authorities on the matter. |
| IRIS seismic stations/networks | Incorporated Research Institutions for Seismology (IRIS) Data Services map showing the location of seismic stations from all available networks (permanent or temporary) within a radius of 0.18° (about 20 km at mid-latitudes) from the given location of Eyjafjallajökull. Users can customize a variety of filters and options in the left panel. Note that if there are no stations are known the map will default to show the entire world with a "No data matched request" error notice. |
| UNAVCO GPS/GNSS stations | Geodetic Data Services map from UNAVCO showing the location of GPS/GNSS stations from all available networks (permanent or temporary) within a radius of 20 km from the given location of Eyjafjallajökull. Users can customize the data search based on station or network names, location, and time window. Requires Adobe Flash Player. |
| DECADE Data | The DECADE portal, still in the developmental stage, serves as an example of the proposed interoperability between The Smithsonian Institution's Global Volcanism Program, the Mapping Gas Emissions (MaGa) Database, and the EarthChem Geochemical Portal. The Deep Earth Carbon Degassing (DECADE) initiative seeks to use new and established technologies to determine accurate global fluxes of volcanic CO2 to the atmosphere, but installing CO2 monitoring networks on 20 of the world's 150 most actively degassing volcanoes. The group uses related laboratory-based studies (direct gas sampling and analysis, melt inclusions) to provide new data for direct degassing of deep earth carbon to the atmosphere. |
| Large Eruptions of Eyjafjallajökull | Information about large Quaternary eruptions (VEI >= 4) is cataloged in the Large Magnitude Explosive Volcanic Eruptions (LaMEVE) database of the Volcano Global Risk Identification and Analysis Project (VOGRIPA). |
| EarthChem | EarthChem develops and maintains databases, software, and services that support the preservation, discovery, access and analysis of geochemical data, and facilitate their integration with the broad array of other available earth science parameters. EarthChem is operated by a joint team of disciplinary scientists, data scientists, data managers and information technology developers who are part of the NSF-funded data facility Integrated Earth Data Applications (IEDA). IEDA is a collaborative effort of EarthChem and the Marine Geoscience Data System (MGDS). |
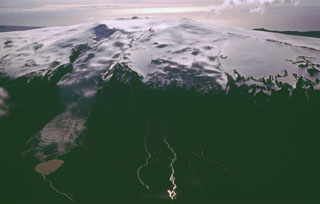 The summit ridge of Eyjafjallajökull is seen here in 1992 from the NW with a steep-sloped valley glacier descending at the left toward the Markafljot plain. The summit is truncated by a 2.5-km-wide, ice-filled caldera breached to the north (towards bottom left). Prior to 2010, the last eruption known from Eyjafjallajökull was during December 1821 to January 1823.