Image GVP-11865
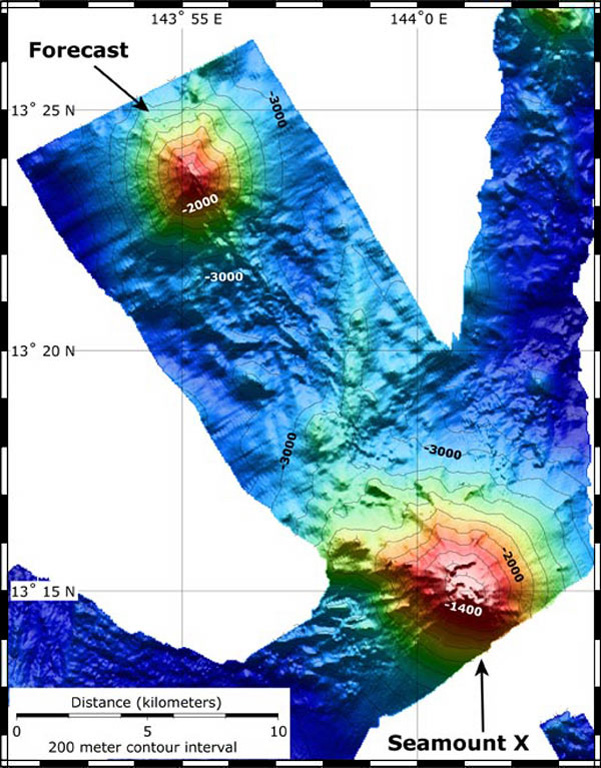
This bathymetric map shows both Forecast Seamount and Seamount X. The model is a combination of bathymetry collected on NOAA expeditions in 2004 and 2006. The contour interval is 200 m and the spatial resolution is 50 m.
Image courtesy of Susan Merle (Oregon State University/NOAA Vents Program).
![]() This image is made available as a Public Domain Work, but proper attribution is appreciated.
This image is made available as a Public Domain Work, but proper attribution is appreciated.
Galleries: Submarine Volcanoes | Technology
Keywords: submarine volcano | remote sensing | technology | model | DEM | bathymetry
Forecast Seamount