This Dynamic Planet Map
![]()
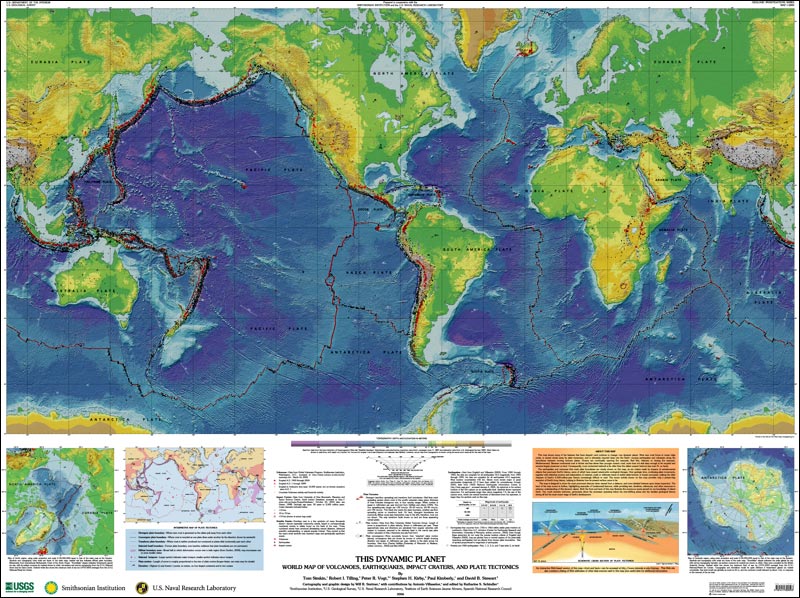
Most new crust forms at ocean ridge crests, is carried slowly away by plate movement, and is ultimately recycled deep into the earth—causing earthquakes and volcanism along the boundaries between moving tectonic plates. Oceans are continually opening (e.g., Red Sea, Atlantic) or closing (e.g., Mediterranean). Because continental crust is thicker and less dense than thinner, younger oceanic crust, most does not sink deep enough to be recycled, and remains largely preserved on land. Consequently, most continental bedrock is far older than the oldest oceanic bedrock (see back of map).
The earthquakes and volcanoes that mark plate boundaries are clearly shown on this map, as are craters made by impacts of extraterrestrial objects that punctuate Earth's history, some causing catastrophic ecological changes. Over geologic time, continuing plate movements, together with relentless erosion and redeposition of material, mask or obliterate traces of earlier plate-tectonic or impact processes, making the older chapters of Earth's 4,500-million-year history increasingly difficult to read. The recent activity shown on this map provides only a present-day snapshot of Earth's long history, helping to illustrate how its present surface came to be.
Both the front and back of this map illustrate the enormous recent growth in our knowledge of planet Earth. Yet, much remains unknown, particularly about the processes operating below the ever-shifting plates and the detailed geological history during all but the most recent stage of Earth's development.
Simkin, T., Tilling, R.I., Vogt, P.R., Kirby, S.H., Kimberly, P., and Stewart, D.B., 2006, This dynamic planet: World map of volcanoes, earthquakes, impact craters, and plate tectonics: U.S. Geological Survey Geologic Investigations Series Map I-2800, 1 two-sided sheet, scale 1:30,000,000.
Sections of the map suitable for printing were created as PDF files when this map was first published in 2006. These files are no longer available because they do not meet Smithsonian accessibility compliance requirements.
However, free full-sized PDF files of the front and back of the map are provided by the USGS Store. Due to the large size, we recommend downloading them rather than opening them in a browser.
|
|
This Dynamic Planet is accessible to a wider public thanks to a collaborative project initiated in 2009 between the authors, the Geological Survey of Canada (GSC), and the Canadian Space Agency (CSA) that led to the translation of the text on the map to French. The project was supervised by Alain Berinstain, Director for Planetary Exploration at the CSA, and coordinated by Marie-Claude Williamson, research scientist at the GSC (Ottawa), The translation files are accessible from links on the Printable Pages tab. For ease of correlation, we suggest that you start with the "Back of Map" section, then select the panel of interest. Cette planéte dynamique est désormais accessible à un plus vaste public grâce à un projet collaboratif initié en 2009 entre les auteurs, la Commission géologique du Canada (CGC) et l'Agence spatiale canadienne (ASC) dont le but était de traduire les textes de la carte en français. Le projet fut entrepris sous la direction d'Alain Berinstain, Directeur de la Division d'Exploration planétaire à l'ASC, et coordonné par Marie-Claude Williamson, chercheure scientifique à la CGC (Ottawa). Les fichiers de traduction sont accessibles à partir des liens de la section Printable Pages. Pour faciliter la corrélation entre les textes, nous vous suggérons de débuter à la section "Back of Map" et de sélectionner le champ d'intêrêt. |

|
This page contains data that generated the printed and web versions of this map in 2006, not current data. All files are in tab-delimited text format.
- Volcano data are sorted by volcano number used in Smithsonian data files.
- Earthquake data are loosely sorted first by magnitude range, then by date. EQs >=5.5 from Engdahl & Villaseñor (2002) and those <5.5 from Engdahl (personal communication, 2003).
- Earthquakes that occurred from 1750 to 1960 within stable plate interiors on continents. Data are from A.C. Johnston (Center for Earthquake Research and Information, University of Memphis, written communication, 2002).
- Notable pre-1900 earthquakes.
- Impact crater data are sorted alphabetically by crater name. From University of New Brunswick/GSC database.
Plate boundary data were plotted by Peter Vogt, Steve Kirby, and Paul Kimberly, based on data from DeMets (2002), Bird (2003), and other scientific literature. They are in lat/long ASCII text line files.
Web-based data sources, plus recommended sites for additional information.
- GENERAL
- TOPOGRAPHY
- VOLCANOES
- EARTHQUAKES
- IMPACTS
- TECTONICS
The two-sided map sells for $9.00 per copy and can be ordered from the USGS Store. Shipping and handling fees may also apply.
Visitors to the National Museum of Natural History, 10th and Constitution, NW, in Washington, DC, may purchase maps from the gift shop.
For continuing support, understanding, and help - through the 5 long years of this project - we owe great thanks to our spouses. We also express our appreciation to the many colleagues, geoscience teachers, and students who provided thoughtful comments and helpful advice on how to improve the previous editions (1989, 1994) of our map.
Affiliations are those at time of contact, largely 2002-2003, and principal author contact for each helper is identified by initials in column to right.
Authors
| Tom Simkin | Smithsonian Institution, National Museum of Natural History, Washington, DC, 20560 |
| Robert I. Tilling | U.S. Geological Survey, Menlo Park, California, 94025 |
| Peter R. Vogt | Naval Research Laboratory, Marine Physics Branch, Washington, DC, 20375 (presently affiliated with Marine Science Inst., Univ. of Calif. Santa Barbara; Smithsonian Institution; and Horn Point Environmental Lab) |
| Stephen H. Kirby | U.S. Geological Survey, Menlo Park, California, 94025 |
| Paul Kimberly | Smithsonian Institution, National Museum of Natural History, Washington, DC, 20560 |
| David B. Stewart | U.S. Geological Survey, National Center, Reston, Virginia, 20192 |
Cartography and Graphic Design
| Will R. Stettner | U.S. Geological Survey, National Center, Reston, Virginia, 20192 |
| With contributions by | |
| Antonio Villaseñor | Institute of Earth Sciences "Jaume Almera," CSIC, Barcelona, Spain |
| Editor | |
| Katharine S. Schindler | U.S. Geological Survey, National Center, Reston, Virginia, 20192 |
| Original Webmaster | |
| Paul Kimberly | Smithsonian Institution, National Museum of Natural History, Washington, DC, 20560 |
Outstanding Help
| Bilham, Roger | R G | U-Colorado, Geological Sciences | SK |
| Carbotte, Suzanne | S M | Lamont-Doherty Earth Observatory, NY | PV |
| DeMets, Chuck | D C | U-Wisconsin, Geology & Geophysics | PV |
| Engdahl, Bob | E R | U-Colorado, Geological Sciences | SK |
| Hasse, Jon | J | National Ice Center, NAVICECEN, AT-Geospatial Information | PK |
| Holzer, Missy | M | Chatham High School, Monmouth Schools, NJ | all |
| Jung, Woo-Yeol | W-Y | Naval Research Lab, Marine Physics Branch | PV PK TS |
| Keith, John | J R | USGS-Reston, VA | all |
| Robinson, Joel | J E | USGS-Menlo Park, CA | RT PK |
| Rymer, Mike | M J | USGS-Menlo Park, CA | SK |
| Schilling, Steve | S P | USGS-Cascades Volcano Observatory, WA | PK |
| Scholl, Dave | D W | USGS-Menlo Park, CA | all |
| Stein, Seth | S | Northwestern-U, Geological Sciences | all |
| Williamson, Marie-Claude | M C | Geological Survey of Canada | RT PK |
Major Help
| Aramaki, Shigeo | S | Yamanashi Institute of Environmental Sciences, Japan | RT |
| Beddoe, Marc | M | NAVOCEANO, Bay St Louis, MS | PV |
| Bentley, Charles | C R | U-Wisconsin, Geology & Geophysics | PV |
| Bhardwaj, Sunil | S | NASA-Langley Research Center | PV |
| Bird, Peter | G P | UCLA, Earth & Space Studies | SK PV PK |
| Cande, Steve | S C | Scripps Institute of Oceanography. Geosciences Res. Div. | PV |
| Collier, Michael | M P | Flagstaff, AZ | RT SK |
| Cormier, Marie-Helene | M-H | Lamont-Doherty Earth Observatory, NY | PV |
| Fornari, Dan | D J | Woods Hole Oceanographic Institution | PV |
| French, Bevan | B M | Smithsonian Institution, Paleobiology | TS |
| Gaina,Carmen | C | U-Sydney, Geosciences | PV |
| Gordon, Leslie | L C | USGS-Menlo Park, CA | RT |
| Gordon, Richard | R G | Rice-U, Geology & Geophysics | TS |
| Guffanti, Marianne | M C | USGS-Reston, VA | PK TS |
| Hall, John | J K | Geological Survey of Israel | PV |
| Hey, Dick | R N | U-Hawaii, Geology & Geophysics | PV |
| Hutchinson, Debbie | D R | USGS-Woods Hole Oceanographic Institution | PV |
| Jakobsson, Martin | M | U-New Hampshire, Earth Sciences | PV |
| James, Odette | O B | USGS-Reston, VA | RT TS |
| Johnston, Arch | A C | U-Memphis, Center for Earthquake Research & Information | SK |
| Kleinrock, Marty | M C | Vanderbilt-U, Geology | PV |
| Larter, Bob | R D | British Antarctic Survey, Cambridge | PV |
| Livermore, Roy | R A | British Antarctic Survey, Cambridge | PV |
| Luhr, Jim | J F | Smithsonian Institution, Mineral Sciences | PK TS |
| Marks, Karen | K M | NOAA-Laboratory for Satellite Altimetry | PV |
| McCoy, Tim | T J | Smithsonian Institution, Mineral Sciences | TS |
| Morgan, Jason | W J | Princeton-U, Geosciences | TS |
| Müller, Dietmar | R D | U-Sydney, Geosciences | PV |
| Newhall, Chris | C G | USGS-U-Washington, Seattle | TS RT |
| Okal, Emile | E A | Northwestern-U, Geological Sciences | SK |
| Plafker, George | G | USGS-Menlo Park, CA | RT SK |
| Purdey, Bob | R W | Smithsonian Institution, Paleobiology | TS |
| Rankin, Bill | W E | NAVOCEANO, Bay St Louis, MS | PV |
| Rona, Peter | P A | Rutgers-U, Geological Sciences | PV |
| Rossi, Philippe | P | Commission for Geological Map of World, Paris | DS |
| Scotese, Chris | C R | U-Texas-Arlington, Geology | TS |
| Shah, Anjana | A K | Naval Research Lab, Earth Physics Branch | PV |
| Shelton, John | J S | LaJolla, CA | RT |
| Siebert, Lee | L G | Smithsonian Institution, Mineral Sciences | TS SK |
| Smith, Walter | W H F | NOAA-Laboratory for Satellite Altimetry | PV |
| Sorensen, Sorena | S S | Smithsonian Institution, Mineral Sciences | TS |
| Steinthorsson, Sigurdur | S | U-Iceland, Geology | TS |
| Taylor, Brian | B | U-Hawaii, Geology & Geophysics | PV |
| Thatcher, Wayne | W R | USGS-Menlo Park, CA | SK |
| Thurnau, Ellen | E M | Smithsonian Institution, Mineral Sciences | TS PK |
| Vigil, Joe | J F | USGS-Menlo Park, CA | RT |
Specific Help
| Allan, Jamie | J F | National Science Foundation, Arlington, VA | TS |
| Anderson, Don | D L | Cal Tech | PV |
| Atwater, Brian | B F | USGS-U-Washington, Seattle | TS |
| Atwater, Tanya | T M | U-California-Santa Barbara | PV |
| Batiza, Rodey | R | National Science Foundation, Arlington, VA | PV |
| Becker, Tammy | T | USGS-Flagstaff, AZ | TS |
| Brenner, Anita | A C | NASA-Goddard, MD | PV |
| Casadevall, Tom | T J | USGS-Denver, CO | RT |
| Christiansen, Bob | R L | USGS-Menlo Park, California | RT |
| Dorling, Mike | M | Cambridge-U, Earth Sciences | TS |
| Estabrook, Jim | J R | USGS-Reston, VA | KS |
| Erwin, Doug | D H | Smithsonian Institution, Paleobiology | TS |
| Fedo, Chris | C M | George Washington-U | TS |
| Filson, John | J R | USGS-Reston, VA | TS |
| Gaddis, Lisa | L R | USGS-Flagstaff, AZ | TS |
| Geisman, John | J W | U-New Mexico, Earth & Planetary Sciences | PV |
| Grieve, Richard | R A F | Natural Resources Canada, Ottawa | TS |
| Hearn, Carter | B C | USGS-Reston, VA & Smithsonian Institution, Mineral Sciences | TS |
| Horner-Johnson, Ben | B | Rice-U, Geology & Geophysics | TS |
| Labendeira, Conrad | C | Smithsonian Institution, Paleobiology | TS |
| MacDonald, Ken | K C | U-California-Santa Barbara | PV |
| Masonic, Linda | L R | USGS-Reston, VA | DS |
| McCaffrey, Rob | R | Rensselaer Polytechnic Institute | TS |
| Morgan, Jason Phipps | JP | Cornell-U, NY, Earth and Atmospheric Sciences | TS |
| Naar, Dave | D F | U-South Florida-St Petersburg | TS |
| Newman, Andrew | A | Los Alamos National Laboratory, EES-9, NM | TS |
| Okino, Kyoko | K | U-Tokyo, Ocean Research Institute | PV |
| Palmer, Pete | A R | U-Colorado, Geological Sciences | PV |
| Potts, Rick | R | Smithsonian Institution, Anthropology | TS |
| Rowley, David | D B | U-Chicago | PV |
| Rye, Ray | R T | Smithsonian Institution, Paleobiology | TS |
| Sigurdsson, Sven | S | U-Iceland, Mathematics | TS |
| Silver, Eli | E A | U-California-Santa Cruz, Earth Sciences | TS |
| Sinton, John | J M | U-Hawaii, Geology & Geophysics | PV |
| Sleep, Norm | N H | Stanford-U, Geological & Environmental Sciences | TS |
| Sylvester, Art | A G | U-California-Santa Barbara | PV |
| Tamaki, Kensaku | K | U-Tokyo, Ocean Research Institute | PV |
| Whitehead, James | J | New Brunswick-U, Canada, Geology | TS |
| Wing, Scott | S L | Smithsonian Institution, Paleobiology | TS |
| Wu, Francis | F T | SUNY-Binghamton, Geological Sciences | TS |
Website Help
| Figueroa, Bonnie | B | ESRI, Vienna, VA | PK |
| Hasch, Dennis | D R | Smithsonian Institution, NMNH Information Technology Office | PK |
| Munson, Chris | C | ESRI, Vienna, VA | PK |
| Oh, Michael | M | Smithsonian Institution, NMNH Information Technology Office | PK |
| O'Hearn, Tim | T J | Smithsonian Institution, Mineral Sciences | PK |
| Schenkel, Cory | C | ESRI, Vienna, VA | PK |
| Venzke, Ed | E | Smithsonian Institution, Mineral Sciences | PK |
Primary Responsibilities - Overall Map
| Layout/design | WS |
| GIS | PK AV |
| Science | authors (& helpers) |
| Editing | KS RT TS |
Primary Responsibilities - Front of Map
| Topography | AV WS |
| Volcanoes | TS |
| Earthquakes | SK |
| Impact Craters | TS |
| Divergent boundaries | PV PK SK |
| Convergent boundaries | SK PK PV |
| Plate motion vectors | TS PV |
| Convergence vectors | PV |
| Notable events | (see below) |
| Arctic map | PV PK |
| Antarctic map | PV PK |
| Interpretive map | |
| Fossil boundaries | PV |
| Diffuse boundaries | TS |
| Hotspots | PV TS |
| Topographic extremes | PV |
| Schematic cross-section | RT |
| "About this map" text | TS |
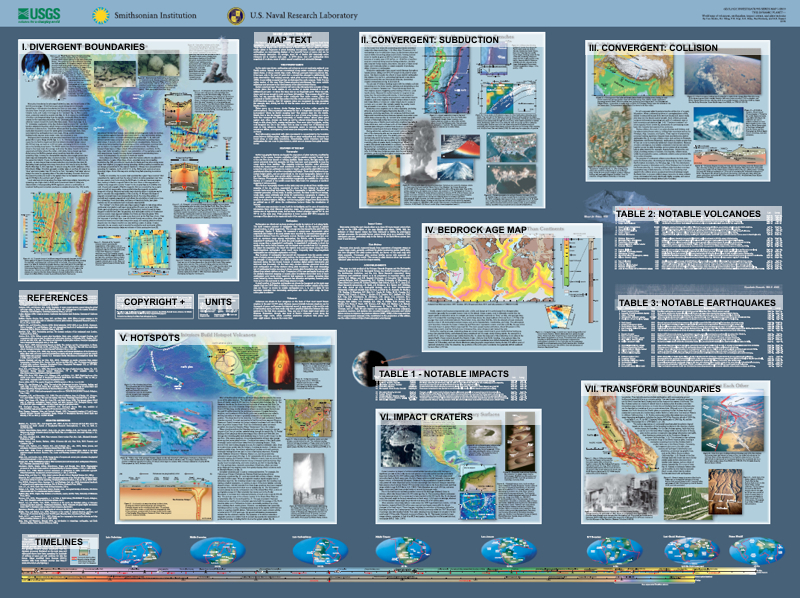
Primary Responsibilities - Back of Map
| Divergent boundaries | PV |
| Subduction boundaries | SK |
| Collision boundaries | SK |
| Transform boundaries | SK |
| Hotspots | RT |
| Impact craters | TS RT |
| Notable eruptions | TS RT |
| Notable earthquakes | SK TS |
| Notable impacts | TS |
| Plate tectonics milestones | TS PV SK RT |
| Bedrock age map | DS TS PV |
| Paleogeographic maps | RT TS |
| Timelines | TS PK |
| "More about this map" text | TS PV SK RT |
| References | TS |
Primary Responsibilities - Web Version
| Webmaster | PK |
| Design/content | PK TS |
Interactive Maps (Main, Arctic, Antarctic)
- Index Map: Toggle on/off. Shows selected area with respect to full map.
- Zoom In (default mode): Drag cursor from one corner to another of the desired area or click on the center of the desired area. The map that is returned may not be the same shape. The maximum dimension of your rectangle is retained, and "bonus" area is added to give default square. In order to get a non-square shape, change the size/shape of the browser window before zooming. Some graphics (e.g. Notable numbers) continue to scale when zooming in and appear very large with respect to surrounding data.
- Zoom Out: Click anywhere on map to zoom out by increments. Zoom out to full size by drawing a small box.
- Pan (hand): Drag cursor in direction you want map area to shift.
- Identify: To get data on a specific symbol, select its layer (from list at right margin) then click on symbol of interest. See below for explanation of data. In some cases the pop-up blocker must be disabled in order to view the "identify" results.
- Get X-Y: Click on point of interest for its decimal latitude and longitude, N and E are positive (+) and S and W are negative (-).
- Legend/Layers: Toggle to legend (for the best quality, print the main map legend via "printable pages."). To include (or exclude) a layer when constructing a map, check (or uncheck) that layer's box in the "Visible" list then click the "Refresh Map" button (most layers are visible by default). Unfortunately, earthquake depth groups cannot be selected as a layer independent of magnitude.
- Print/Save: Opens a new window with the option to either print or save the current map view. Printing via the browser's print function has mixed results. On Windows machines you can also print the current view by selecting "Alt - Print Screen" and then pasting into an image processing program.
Other Elements (Front and Back)
- Click on map or section of interest. To zoom in, select the "+" symbol at the bottom of the page, or click and drag the triangle above the "+" and "-" symbol controls to fine tune. Once zoomed in, navigate by selecting the arrows or dragging cursor. Zoom out by "-" symbol. Some are difficult to read, click on "printable page" for better resolution PDF files. Printable pages are best read with an increased zoom percentage.
- The "printable page" PDF files are best viewed using Adobe Acrobat 6.0 or later with an optimal screen setting of 1024x768.
- The Latitude/Longitude grid is 20° intervals when zoomed out beyond 1:20,000,000 and 5° intervals when zoomed in beyond 1:20,000,000. Grids labeled only at full map's margins: use "Get X-Y" tool to identify
"Identify" Data
- Volcano: Elev = summit elevation above sea level; Lat/Long of volcano center in decimal degrees, N and E are positive (+) and S and W are negative (-); Erupted = last known eruption (see main legend); VNUM = number in Smithsonian data file.
- Earthquakes: Date (Year, Month, Day); Time = UTC (GMT); Depth = kilometers below sea level; Mag = Magnitude; (see main legend). When selecting desired magnitude layer, beware scale changes of zoomed image — symbol sizes will not equal those shown in legend
- Impact Craters: Age, in million years (Ma), with uncertainty; (see main legend).
- Notable Events: 25 numbered events (see table); Red = volcanoes; Black = earthquakes; Purple = impact craters.
Boundaries
- Divergent boundaries are not shown with line width proportional to spreading rate, as on published map (see legend)
- Convergent boundaries, shown only on the interpretive map on the published map, are available here as an option. Beware, though, that many of these boundaries are broad, diffuse zones, rather than crisp, sharp junctions.
- National boundaries, not shown on the published map, are an option here for geographic reference. When selecting this layer, it is a good idea to deselect the "coastlines" layer, to avoid overlapping coastlines.
Downloaded Earthquake Data
- File sorted by date within individual magnitude ranges.