Recently Published Bulletin Reports
Agung (Indonesia) Three eruptive events reported in April, May, and December 2022
Tengger Caldera (Indonesia) Minor ash emission in December 2023; persistent weak thermal anomaly in the Bromo crater
Saunders (United Kingdom) Persistent thermal anomalies from the summit crater lava lake during February 2023-January 2024
Shishaldin (United States) New eruption with significant Strombolian explosions, ash plumes, and ashfall
Ioto (Japan) New eruption with discolored water, ejecta, and floating pumice during October-December 2023
Purace (Colombia) Gas-and-ash emission on 16 November 2023
Suwanosejima (Japan) Eruption plumes, crater incandescence, and occasional explosions during July-October 2023
Etna (Italy) Strombolian explosions, lava fountains, and lava flows during July-August 2023
Aira (Japan) Explosions, ash plumes, ash fall, and crater incandescence during July-October 2023
Nishinoshima (Japan) Gray emissions during October 2023
Kilauea (United States) Strong lava fountains, lava flows, and spatter at Halema’uma’u during January-September 2023
Tinakula (Solomon Islands) Continued lava flows and thermal activity during June through November 2023
Agung (Indonesia) — January 2024  Cite this Report
Agung
Indonesia
8.343°S, 115.508°E; summit elev. 2997 m
All times are local (unless otherwise noted)
Three eruptive events reported in April, May, and December 2022
Mount Agung, located on the E end of the island of Bali, Indonesia, rises above the SE rim of the Batur caldera. The summit area extends 1.5 km E-W, with the highest point on the W and a steep-walled 800-m-wide crater on the E. Recorded eruptions date back to the early 19th century. A large and deadly explosive and effusive eruption occurred during 1963-64, which was characterized by voluminous ashfall, pyroclastic flows, and lahars that caused extensive damage and many fatalities. More recent activity was documented during November 2017-June 2019 that consisted of multiple explosions, significant ash plumes, lava flows at the summit crater, and incandescent ejecta. This report covers activity reported during April-May 2022 and December 2022 based on data from the Darwin Volcanic Ash Advisory Center (VAAC).
Activity during 2022 was relatively low and mainly consisted of a few ash plumes during April-May and December. An ash plume on 3 April rising to 3.7 km altitude (700 m above the summit) and drifting N was reported in a Darwin VAAC notice based on a ground report, with ash seen in HIMAWARI-8 visible imagery. Another ash plume was reported at 1120 on 27 May that rose to 5.5 km altitude (2.5 m above the summit); the plume was not visible in satellite or webcam images due to weather clouds. An eruption was reported based on seismic data at 0840 on 13 December, with an estimated plume altitude of 3.7 km; however, no ash was seen using satellite imagery in clear conditions before weather clouds obscured the summit.
Geologic Background. Symmetrical Agung stratovolcano, Bali's highest and most sacred mountain, towers over the eastern end of the island. The volcano, whose name means "Paramount," rises above the SE rim of the Batur caldera, and the northern and southern flanks extend to the coast. The summit area extends 1.5 km E-W, with the high point on the W and a steep-walled 800-m-wide crater on the E. The Pawon cone is located low on the SE flank. Only a few eruptions dating back to the early 19th century have been recorded in historical time. The 1963-64 eruption, one of the largest in the 20th century, produced voluminous ashfall along with devastating pyroclastic flows and lahars that caused extensive damage and many fatalities.
Information Contacts: Darwin Volcanic Ash Advisory Centre (VAAC), Bureau of Meteorology, Northern Territory Regional Office, PO Box 40050, Casuarina, NT 0811, Australia (URL: http://www.bom.gov.au/info/vaac/).
Tengger Caldera (Indonesia) — February 2024 Cite this Report
Tengger Caldera
Indonesia
7.942°S, 112.95°E; summit elev. 2329 m
All times are local (unless otherwise noted)
Minor ash emission in December 2023; persistent weak thermal anomaly in the Bromo crater
Tengger Caldera, located at the N end of a volcanic massif in Indonesia’s East Java, consists of five overlapping stratovolcanoes. The youngest and only active cone in the 16-km-wide caldera is Bromo, which typically produces gas-and-steam plumes, occasional ash plumes and explosions, and weak thermal signals (BGVN 44:05, 47:01). This report covers activity during January 2022-December 2023, consisting of mostly white gas-and-steam emissions and persistent weak thermal anomalies. Information was provided by the Pusat Vulkanologi dan Mitigasi Bencana Geologi (PVMBG, also known as Indonesian Center for Volcanology and Geological Hazard Mitigation, CVGHM) and satellite imagery. The Alert Level remained at 2 (on a scale of 1-4), and visitors were warned to stay at least 1 km from the crater.
Activity was generally low during the reporting period, similar to that in 2021. According to almost daily images from MAGMA Indonesia (a platform developed by PVMBG), white emissions and plumes rose from 50 to 900 m above the main crater during this period (figure 24). During several days in March and June 2022, white plumes reached heights of 1-1.2 km above the crater.
After an increase in activity at 2114 on 3 February 2023, a PVMBG team that was sent to observe white emissions rising as high as 300 m during 9-12 February and heard rumbling noises. A sulfur dioxide odor was also strong near the crater and measurements indicated that levels were above the healthy (non-hazardous) threshold of 5 parts per million; differential optical absorption spectroscopy (DOAS) measurements indicated an average flux of 190 metric tons per day on 11 February. Incandescence originating from a large fumarole in the NNW part of the crater was visible at night. The team observed that vegetation on the E caldera wall was yellow and withered. The seismic network recorded continuous tremor and deep and shallow volcanic earthquakes.
According to a PVMBG press release, activity increased on 13 December 2023 with white, gray, and brown emissions rising as high as 900 m above Bromo’s crater rim and drifting in multiple directions (figure 25). The report noted that tremor was continuous and was accompanied in December by three volcanic earthquakes. Deformation data indicated inflation in December. There was no observable difference in the persistent thermal anomaly in the crater between 11 and 16 December 2023.
All clear views of the Bromo crater throughout this time, using Sentinel-2 infrared satellite images, showed a weak persistent thermal anomaly; none of the anomalies were strong enough to cause MODVOLC Thermal Alerts. A fire in the SE part of the caldera in early September 2023 resulted in a brief period of strong thermal anomalies.
Geologic Background. The 16-km-wide Tengger caldera is located at the northern end of a volcanic massif extending from Semeru volcano. The massive volcanic complex dates back to about 820,000 years ago and consists of five overlapping stratovolcanoes, each truncated by a caldera. Lava domes, pyroclastic cones, and a maar occupy the flanks of the massif. The Ngadisari caldera at the NE end of the complex formed about 150,000 years ago and is now drained through the Sapikerep valley. The most recent of the calderas is the 9 x 10 km wide Sandsea caldera at the SW end of the complex, which formed incrementally during the late Pleistocene and early Holocene. An overlapping cluster of post-caldera cones was constructed on the floor of the Sandsea caldera within the past several thousand years. The youngest of these is Bromo, one of Java's most active and most frequently visited volcanoes.
Information Contacts: Pusat Vulkanologi dan Mitigasi Bencana Geologi (PVMBG, also known as Indonesian Center for Volcanology and Geological Hazard Mitigation, CVGHM), Jalan Diponegoro 57, Bandung 40122, Indonesia (URL: http://www.vsi.esdm.go.id/); MAGMA Indonesia, Kementerian Energi dan Sumber Daya Mineral (URL: https://magma.esdm.go.id/v1); Copernicus Browser, Copernicus Data Space Ecosystem, European Space Agency (URL: https://dataspace.copernicus.eu/browser/); Hawai'i Institute of Geophysics and Planetology (HIGP) - MODVOLC Thermal Alerts System, School of Ocean and Earth Science and Technology (SOEST), Univ. of Hawai'i, 2525 Correa Road, Honolulu, HI 96822, USA (URL: http://modis.higp.hawaii.edu/).
Saunders (United Kingdom) — February 2024 Cite this Report
Saunders
United Kingdom
57.8°S, 26.483°W; summit elev. 843 m
All times are local (unless otherwise noted)
Persistent thermal anomalies from the summit crater lava lake during February 2023-January 2024
Saunders is one of eleven islands that comprise the South Sandwich Islands in the South Atlantic. The active Mount Michael volcano has been in almost continuous eruption since November 2014 (BGVN 48:02). Recent activity has resulted in intermittent thermal anomalies and gas-and-steam emissions (BGVN 47:03, 48:02). Visits are infrequent due to its remote location, and cloud cover often prevents satellite observations. Satellite thermal imagery and visual observation of incandescence during a research expedition in 2019 (BGVN 28:02 and 44:08) and a finding confirmed by a National Geographic Society research team that summited Michael in November 2022 reported the presence of a lava lake.
Although nearly constant cloud cover during February 2023 through January 2024 greatly limited satellite observations, thermal anomalies from the lava lake in the summit crater were detected on clear days, especially around 20-23 August 2023. Anomalies similar to previous years (eg. BGVN 48:02) were seen in both MIROVA (Middle InfraRed Observation of Volcanic Activity) data from MODIS instruments and in Sentinel 2 infrared imagery. The only notable sulfur dioxide plume detected near Saunders was on 25 September 2023, with the TROPOMI instrument aboard the Sentinel-5P satellite.
Geologic Background. Saunders Island consists of a large central volcanic edifice intersected by two seamount chains, as shown by bathymetric mapping (Leat et al., 2013). The young Mount Michael stratovolcano dominates the glacier-covered island, while two submarine plateaus, Harpers Bank and Saunders Bank, extend north. The symmetrical Michael has a 500-m-wide summit crater and a remnant of a somma rim to the SE. Tephra layers visible in ice cliffs surrounding the island are evidence of recent eruptions. Ash clouds were reported from the summit crater in 1819, and an effusive eruption was inferred to have occurred from a N-flank fissure around the end of the 19th century and beginning of the 20th century. A low ice-free lava platform, Blackstone Plain, is located on the north coast, surrounding a group of former sea stacks. A cluster of cones on the SE flank, the Ashen Hills, appear to have been modified since 1820 (LeMasurier and Thomson, 1990). Analysis of satellite imagery available since 1989 (Gray et al., 2019; MODVOLC) suggests frequent eruptive activity (when weather conditions allow), volcanic clouds, steam plumes, and thermal anomalies indicative of a persistent, or at least frequently active, lava lake in the summit crater. Due to this observational bias, there has been a presumption when defining eruptive periods that activity has been ongoing unless there is no evidence for at least 10 months.
Information Contacts: MIROVA (Middle InfraRed Observation of Volcanic Activity), a collaborative project between the Universities of Turin and Florence (Italy) supported by the Centre for Volcanic Risk of the Italian Civil Protection Department (URL: http://www.mirovaweb.it/); NASA Global Sulfur Dioxide Monitoring Page, Atmospheric Chemistry and Dynamics Laboratory, NASA Goddard Space Flight Center (NASA/GSFC), 8800 Greenbelt Road, Goddard MD 20771, USA (URL: https://so2.gsfc.nasa.gov/); Copernicus Browser (URL: https://dataspace.copernicus.eu/browser).
Shishaldin (United States) — December 2023 Cite this Report
Shishaldin
United States
54.756°N, 163.97°W; summit elev. 2857 m
All times are local (unless otherwise noted)
New eruption with significant Strombolian explosions, ash plumes, and ashfall
Shishaldin is located on the eastern half of Unimak Island, one of the Aleutian Islands. Frequent explosive activity, primarily consisting of Strombolian ash eruptions from the small summit crater, but sometimes producing lava flows, has been recorded since the 18th century. The previous eruption ended in May 2020 and was characterized by intermittent thermal activity, increased seismicity and surface temperatures, ash plumes, and ash deposits (BGVN 45:06). This report covers a new eruption during July through November 2023, which consisted of significant explosions, ash plumes, ashfall, and lava fountaining. Information comes from daily, weekly, and special reports from the Alaska Volcano Observatory (AVO) and various satellite data. AVO monitors the volcano using local seismic and infrasound sensors, satellite data, web cameras, and remote infrasound and lightning networks.
AVO reported that intermittent tremor and low-frequency earthquakes had gradually become more regular and consistent during 10-13 July. Strongly elevated surface temperatures at the summit were identified in satellite images during 10-13 July. On 11 July AVO raised the Aviation Color Code (ACC) to Yellow (the second color on a four-color scale) and Volcano Alert Level (VAL) to Advisory (the second level on a four-level scale) at 1439. Later in the day on 11 July summit crater incandescence was observed in webcam images. Observations of the summit suggested that lava was likely present at the crater, which prompted AVO to raise the ACC to Orange (the second highest color on a four-color scale) and the VAL to Watch (the second highest level on a four-level scale). The US Coast Guard conducted an overflight on 12 July and confirmed that lava was erupting from the summit. That same day, sulfur dioxide emissions were detected in satellite images.
A significant explosion began at 0109 on 14 July that produced an ash plume that rose to 9-12 km altitude and drifted S over the Pacific Ocean (figure 43). Webcam images and photos taken around 0700 from a ship SW off Unimak Island showed small lahar deposits, which were the result of the interaction of hot pyroclastic material and snow and ice on the flanks. There was also ashfall on the SW and N flanks. A smaller explosion at 0710 generated an ash plume that rose to 4.5 km altitude. Webcam images and pilot reports showed continued low-level ash emissions during the morning, rising to less than 4.6 km altitude; those emissions included a small ash plume near the summit around 1030 resulting from a small explosion.
Seismic tremor amplitude began increasing at around 1700 on 15 July; strongly elevated surface temperatures were also reported. An ash plume rose to 4.6 km altitude and drifted SSE at 2100, based on a satellite image. A continuous ash plume during 2150 through 2330 rose to 5 km altitude and extended 125 km S. At 2357 AVO raised the ACC to Red (the highest color on a four-color scale) and the VAL to Warning (the highest level on a four-level scale), noting that seismicity remained elevated for more than six hours and explosion signals were frequently detected by regional infrasound (pressure sensor) networks. Explosions generated an ash plume that rose to 4.9 km altitude and drifted as far as 500 km SE. Activity throughout the night declined and by 0735 the ACC was lowered to Orange and the VAL to Watch. High-resolution satellite images taken on 16 July showed pyroclastic deposits extending as far as 3 km from the vent; these deposits generated lahars that extended further down the drainages on the flanks. Ash deposits were mainly observed on the SSE flank and extended to the shore of Unimak Island. During 16-17 July lava continued to erupt at the summit, which caused strongly elevated surface temperatures that were visible in satellite imagery.
Lava effusion increased at 0100 on 18 July, as noted in elevated surface temperatures identified in satellite data, increasing seismic tremor, and activity detected on regional infrasound arrays. A significant ash plume at 0700 rose to 7 km altitude and continued until 0830, eventually reaching 9.1 km altitude and drifting SSE (figure 44). As a result, the ACC was raised to Red and the VAL to Warning. By 0930 the main plume detached, but residual low-level ash emissions continued for several hours, remaining below 3 km altitude and drifting S. The eruption gradually declined and by 1208 the ACC was lowered to Orange and the VAL was lowered to Watch. High-resolution satellite images showed ash deposits on the SW flank and pyroclastic deposits on the N, E, and S flanks, extending as far as 3 km from the vent; lahars triggered by the eruption extended farther down the flanks (figure 45). Lava continued to erupt from the summit crater on 19 July.
Elevated surface temperatures were detected in satellite images during 19-25 July, despite occasional weather cloud cover, which was consistent with increased lava effusion. During 22-23 July satellite observations acquired after the eruption from 18 July showed pyroclastic flow and lahar deposits extending as far as 3 km down the N, NW, and NE flanks and as far as 1.5 km down the S and SE flanks. Ash deposits covered the SW and NE flanks. No lava flows were observed outside the crater. On 22 July a sulfur dioxide plume was detected in satellite data midday that had an estimated mass of 10 kt. In a special notice issued at 1653 on 22 July AVO noted that eruptive activity had intensified over the previous six hours, which was characterized by an hours-long steady increase in seismic tremor, intermittent infrasound signals consistent with small explosions, and an increase in surface temperatures that were visible in satellite data. Pilots first reported low-level ash plumes at around 1900. At 2320 an ash plume had risen to 9 km altitude based on additional pilot reports and satellite images. The ACC was increased to Red and the VAL to Warning at 2343. Satellite images indicated growth of a significantly higher ash plume that rose to 11 km altitude continued until 0030 and drifted NE. During the early morning hours of 23 July ash plumes had declined to 4.6 k altitude. Seismic tremor peaked at 0030 on 23 July and began to rapidly decline at 0109; active ash emissions were no longer visible in satellite data by 0130. The ACC was lowered to Orange and the VAL to Watch at 0418; bursts of increased seismicity were recorded throughout the morning, but seismicity generally remained at low levels. Elevated surface temperatures were visible in satellite data until about 0600. On 24 July pilots reported seeing vigorous gas-and-steam plumes rising to about 3 km altitude; the plumes may have contained minor amounts of ash.
During 24-25 July low level seismicity and volcanic tremor were detected at low levels following the previous explosion on 23 July. Strongly elevated surface temperatures were observed at the summit crater in satellite data. Around 2200 on 25 July seismicity began to increase, followed by infrasound signals of explosions after 0200 on 26 July. An ash plume rose to 3 km altitude at 0500 and drifted ENE, along with an associated sulfur dioxide plume that drifted NE and had an estimated mass of 22 kt. Diffuse ash emissions were visible in satellite data and rose to 6.1-7.6 km altitude and extended 125 km from the volcano starting around 1130. These ash events were preceded by about seven hours of seismic tremor, infrasound detections of explosions, and five hours of increased surface temperatures visible in satellite data. Activity began to decline around 1327, which included low-frequency earthquakes and decreased volcanic tremor, and infrasound data no longer detected significant explosions. Surface temperatures remained elevated through the end of the month.
Seismicity, volcanic tremor, and ash emissions remained at low levels during early August. Satellite images on 1 August showed that some slumping had occurred on the E crater wall due to the recent explosive activity. Elevated surface temperatures continued, which was consistent with cooling lava. On 2 August small explosive events were detected, consistent with low-level Strombolian activity. Some episodes of volcanic tremor were reported, which reflected low-level ash emissions. Those ash emissions rose to less than 3 km altitude and drifted as far as 92.6 km N. Pilots that were located N of the volcano observed an ash plume that rose to 2.7 km altitude. Seismicity began to increase in intensity around 0900 on 3 August. Seismicity continued to increase throughout the day and through the night with strongly elevated surface temperatures, which suggested that lava was active at the surface.
An ash cloud that rose to 7.6-7.9 km altitude and drifted 60-75 km NE was visible in a satellite image at 0520 on 4 August. Pilots saw and reported the plume at 0836 (figure 46). By 0900 the plume had risen to 9.1 km altitude and extended over 100 km NE. AVO raised the ACC to Red and the VAL to Warning as a result. Seismic tremor levels peaked at 1400 and then sharply declined at 1500 to slightly elevated levels; the plume was sustained during the period of high tremor and drifted N and NE. The ACC was lowered to Orange and the VAL to Watch at 2055. During 5-14 August seismicity remained low and surface temperatures were elevated based on satellite data due to cooling lava. On 9 August a small lava flow was observed that extended from the crater rim to the upper NE flank. It had advanced to 55 m in length and appeared in satellite imagery on 11 August. Occasional gas-and-steam plumes were noted in webcam images. At 1827 AVO noted that seismic tremor had steadily increased during the afternoon and erupting lava was visible at the summit in satellite images.
Strong explosion signals were detected at 0200 on 15 August. An ash cloud that was visible in satellite data extended 100 km NE and may have risen as high as 11 km altitude around 0240. By 0335 satellite images showed the ash cloud rising to 7.6 km altitude and drifting NE. Significant seismicity and explosions were detected by the local AVO seismic and infrasound networks, and volcanic lightning was detected by the World Wide Lightning Location Network (WWLLN). A sulfur dioxide plume associated with the eruption drifted over the S Bering Sea and parts of Alaska and western Canada. Seismicity was significantly elevated during the eruption but had declined by 1322. A pilot reported that ash emissions continued, rising as high as 4.9 km altitude. Elevated surface temperatures detected in satellite data were caused by hot, eruptive material (pyroclastic debris and lava) that accumulated around the summit. Eruptive activity declined by 16 August and the associated sulfur dioxide plume had mostly dissipated; remnants continued to be identified in satellite images at least through 18 August. Surface temperatures remained elevated based on satellite images, indicating hot material on the upper parts of the volcano. Small explosions were detected in infrasound data on the morning of 19 August and were consistent with pilot reports of small, short-lived ash plumes that rose to about 4.3 km altitude. Low-level explosive activity was reported during 20-24 August, according to seismic and infrasound data, and weather clouds sometimes prevented views. Elevated surface temperatures were observed in satellite images, which indicated continued hot material on the upper parts of the volcano.
Seismic tremor began to increase at around 0300 on 25 August and was followed by elevated surface temperatures identified in satellite images, consistent with erupting lava. Small explosions were recorded in infrasound data. The ACC was raised to Red and the VAL to Warning at 1204 after a pilot reported an ash plume that rose to 9.1 km altitude. Seismicity peaked at 1630 and began to rapidly decline at around 1730. Ash plumes rose as high as 10 km altitude and drifted as far as 400 km NE. By 2020 the ash plumes had declined to 6.4 km altitude and continued to drift NE. Ash emissions were visible in satellite data until 0000 on 26 August and seismicity was at low levels. AVO lowered the ACC to Orange and the VAL to Watch at 0030. Minor explosive activity within the summit crater was detected during 26-28 August and strongly elevated surface temperatures were still visible in satellite imagery through the rest of the month. An AVO field crew working on Unimak Island observed a mass flow that descended the upper flanks beginning around 1720 on 27 August. The flow produced a short-lived ash cloud that rose to 4.5 km altitude and rapidly dissipated. The mass flow was likely caused by the collapse of spatter that accumulated on the summit crater rim.
Similar variable explosive activity was reported in September, although weather observations sometimes prevented observations. A moderate resolution satellite image from the afternoon of 1 September showed gas-and-steam emissions filling the summit crater and obscuring views of the vent. In addition, hot deposits from the previous 25-26 August explosive event were visible on the NE flank near the summit, based on a 1 September satellite image. On 2 and 4 September seismic and infrasound data showed signals of small, repetitive explosions. Variable gas-and-steam emissions from the summit were visible but there was no evidence of ash. Possible summit crater incandescence was visible in nighttime webcam images during 3-4 September.
Seismicity began to gradually increase at around 0300 on 5 September and activity escalated at around 0830. A pilot reported an ash plume that rose to 7.6 km altitude at 0842 and continued to rise as high as possibly 9.7 km altitude and drifted SSE based on satellite images (figure 47). The ACC was raised to Red and the VAL to Warning at 0900. In addition to strong tremor and sustained explosions, the eruption produced volcanic lightning that was detected by the WWLLN. Around 1100 seismicity decreased and satellite data confirmed that the altitude of the ash emissions had declined to 7.6 km altitude. By 1200 the lower-altitude portion of the ash plume had drifted 125 km E. Significant ash emissions ended by 1330 based on webcam images. The ACC was lowered to Orange and the VAL to Watch at 1440. Satellite images showed extensive pyroclastic debris flows on most of the flanks that extended 1.2-3.3 km from the crater rim.
During 6-13 September elevated surface temperatures continued to be observed in satellite data, seismicity remained elevated with weak but steady tremor, and small, low-frequency earthquakes and small explosions were reported, except on 12 September. On 6 September a low-level ash plume rose to 1.5-1.8 km altitude and drifted SSE. Occasional small and diffuse gas-and-steam emissions at the summit were visible in webcam images. Around 1800 on 13 September seismic tremor amplitudes began to increase, and small explosions were detected in seismic and infrasound data. Incandescent lava at the summit was seen in a webcam image taken at 0134 on 14 September during a period of elevated tremor. No ash emissions were reported during the period of elevated seismicity. Lava fountaining began around 0200, based on webcam images. Satellite-based radar observations showed that the lava fountaining activity led to the growth of a cone in the summit crater, which refilled most of the crater. By 0730 seismicity significantly declined and remained at low levels.
Seismic tremor began to increase around 0900 on 15 September and rapidly intensified. An explosive eruption began at around 1710, which prompted AVO to raise the ACC to Red and the VAL to Warning. Within about 30 minutes ash plumes drifted E below a weather cloud at 8.2 km altitude. The National Weather Service estimated that an ash-rich plume rose as high as 12.8 km altitude and produced volcanic lightning. The upper part of the ash plume detached from the vent around 1830 and drifted E, and was observed over the Gulf of Alaska. Around the same time, seismicity dramatically decreased. Trace ashfall was reported in the community of False Pass (38 km ENE) between 1800-2030 and also in King Cove and nearby marine waters. Activity declined at around 1830 although seismicity remained elevated, ash emissions, and ashfall continued until 2100. Lightning was again detected beginning around 1930, which suggested that ash emissions continued. Ongoing explosions were detected in infrasound data, at a lower level than during the most energetic phase of this event. Lightning was last detected at 2048. By 2124 the intensity of the eruption had decreased, and ash emissions were likely rising to less than 6.7 km altitude. Seismicity returned to pre-eruption levels. On 16 September the ACC was lowered to Orange and the VAL to Watch at 1244; the sulfur dioxide plume that was emitted from the previous eruption event was still visible over the northern Pacific Ocean. Elevated surface temperatures, gas-and-steam emissions from the vent, and new, small lahars were reported on the upper flanks based on satellite and webcam images. Minor deposits were reported on the flanks which were likely the result of collapse of previously accumulated lava near the summit crater.
Elevated seismicity with tremor, small earthquakes, and elevated surface temperatures were detected during 17-23 September. Minor gas-and-steam emissions were visible in webcam images. On 20 September small volcanic debris flows were reported on the upper flanks. On 21 September a small ash deposit was observed on the upper flanks extending to the NE based on webcam images. Seismic tremor increased significantly during 22-23 September. Regional infrasound sensors suggested that low-level eruptive activity was occurring within the summit crater by around 1800 on 23 September. Even though seismicity was at high levels, strongly elevated surface temperatures indicating lava at the surface were absent and no ash emissions were detected; weather clouds at 0.6-4.6 km altitude obscured views. At 0025 on 24 September AVO noted that seismicity continued at high levels and nearly continuous small infrasound signals began, likely from low-level eruptive activity. Strongly elevated surface temperatures were identified in satellite images by 0900 and persisted throughout the day; the higher temperatures along with infrasound and seismic data were consistent with lava erupting at the summit. Around 1700 similarly elevated surface temperatures were detected from the summit in satellite data, which suggested that more vigorous lava fountaining had started. Starting around 1800 low-level ash emissions rose to altitudes less than 4.6 km altitude and quickly dissipated.
Beginning at midnight on 25 September, a series of seismic signals consistent with volcanic flows were recorded on the N side of the volcano. A change in seismicity and infrasound signals occurred around 0535 and at 0540 a significant ash cloud formed and quickly reached 14 km altitude and drifted E along the Alaska Peninsula. The cloud generated at least 150 lightning strokes with thunder that could be heard by people in False Pass. Seismicity rapidly declined to near background levels around 0600. AVO increased the ACC to Red and the VAL to Warning at 0602. The ash cloud detached from the volcano at around 0700, rose to 11.6 km altitude, and drifted ESE. Trace to minor amounts of ashfall were reported by the communities of False Pass, King Cove, Cold Bay, and Sand Point around 0700. Ash emissions continued at lower altitudes of 6-7.6 km altitude at 0820. Small explosions at the vent area continued to be detected in infrasound data and likely represented low-level eruptive activity near the vent. Due to the significant decrease in seismicity and ash emissions the ACC was lowered to Orange and the VAL to Watch at 1234. Radar data showed significant collapses of the crater that occurred on 25 September. Satellite data also showed significant hot, degassing pyroclastic and lahar deposits on all flanks, including more extensive flows on the ENE and WSW sections below two new collapse scarps. Following the significant activity during 24-25 September, only low-level activity was observed. Seismicity decreased notably near the end of the strong activity on 25 September and continued to decrease through the end of the month, though tremor and small earthquakes were still reported. No explosive activity was detected in infrasound data through 2 October. Gas-and-steam emissions rose to 3.7 km altitude, as reported by pilots and seen in satellite images. Satellite data from 26 September showed that significant collapses had occurred at the summit crater and hot, steaming deposits from pyroclastic flows and lahars were present on all the flanks, particularly to the ENE and WSW. A small ash cloud was visible in webcam images on 27 September, likely from a collapse at the summit cone. High elevated surface temperatures were observed in satellite imagery during 27-28 September, which were likely the result of hot deposits on the flanks erupted on 25 September. Minor steaming at the summit crater and from an area on the upper flanks was visible in webcam images on 28 September.
During October, explosion events continued between periods of low activity. Seismicity significantly increased starting at around 2100 on 2 October; around the same time satellite images showed an increase in surface temperatures consistent with lava fountaining. Small, hot avalanches of rock and lava descended an unspecified flank. In addition, a distinct increase in infrasound, seismicity, and lightning detections was followed by an ash plume that rose to 12.2 km altitude and drifted S and E at 0520 on 3 October, based on satellite images. Nighttime webcam images showed incandescence due to lava fountaining at the summit and pyroclastic flows descending the NE flank. AVO reported that a notable explosive eruption started at 0547 and lasted until 0900 on 3 October, which prompted a rise in the ACC to Red and the VAL to Warning. Subsequent ash plumes rose to 6-7.6 km altitude by 0931. At 1036 the ACC was lowered back to Orange and the VAL to Watch since both seismic and infrasound data quieted substantially and were slightly above background levels. Gas-and-steam emissions were observed at the summit, based on webcam images. Trace amounts of ashfall were observed in Cold Bay. Resuspended ash was present at several kilometers altitude near the volcano. During the afternoon, low-level ash plumes were visible at the flanks, which appeared to be largely generated by rock avalanches off the summit crater following the explosive activity. These ash plumes rose to 3 km altitude and drifted W. Trace amounts of ashfall were reported by observers in Cold Bay and Unalaska and flights to these communities were disrupted by the ash cloud. Satellite images taken after the eruption showed evidence of pyroclastic flows and lahar deposits in drainages 2 km down the SW flank and about 3.2 km down the NE flank, and continued erosion of the crater rim. Small explosion craters at the end of the pyroclastic flows on the NE flank were noted for the first time, which may have resulted from gas-and-steam explosions when hot deposits interact with underlying ice.
During 4 October seismicity, including frequent small earthquakes, remained elevated, but was gradually declining. Ash plumes were produced for over eight hours until around 1400 that rose to below 3.7 km altitude. These ash plumes were primarily generated off the sides of the volcano where hot rock avalanches from the crater rim had entered drainages to the SW and NE. Two explosion craters were observed at the base of the NE deposits about 3.2 km from the crater rim. Webcam images showed the explosion craters were a source of persistent ash emissions; occasional collapse events also generated ash. Seismicity remained elevated with sulfur dioxide emissions that had a daily average of more than 1,000 tons per day, and frequent small earthquakes through the end of the month. Frequent elevated surface temperatures were identified in satellite images and gas-and-steam plumes were observed in webcam images, although weather conditions occasionally prevented clear views of the summit. Emissions were robust during 14-16 October and were likely generated by the interaction of hot material and snow and ice. During the afternoon of 21 October a strong gas-and-steam plume rose to 3-4.6 km altitude and extended 40 km WSW, based on satellite images and reports from pilots. On 31 October the ACC was lowered to Yellow and the VAL was lowered to Advisory.
Activity in November was characterized by elevated seismicity with ongoing seismic tremor and small, low-frequency earthquakes, elevated surface temperatures, and gas-and-steam emissions. There was an increase in seismic and infrasound tremor amplitudes starting at 1940 on 2 November. As a result, the ACC was again raised to Orange and the VAL was increased to Watch, although ash was not identified in satellite data. An ash cloud rose to 6.1 km altitude and drifted W according to satellite data at 2000. By 0831 on 3 November ash emissions were no longer visible in satellite images. On 6 and 9 November air pressure sensors detected signals consistent with small explosions. Small explosions were detected in infrasound data consistent with weak Strombolian activity on 19 and 21 November. Seismicity started to decrease on 21 November. On 25 November gas-and-steam emissions were emitted from the vent as well as from a scarp on the NE side of the volcano near the summit. A gas-and-steam plume extended about 50 km SSE and was observed in satellite and webcam images on 26 November. On 28 November small explosions were observed in seismic and local infrasound data and gas-and-steam emissions were visible from the summit and from the upper NE collapse scarp based on webcam images. Possible small explosions were observed in infrasound data on 30 November. Weakly elevated surface temperatures and a persistent gas-and-steam plume from the summit and collapse scarps on the upper flanks. A passing aircraft reported the gas-and-steam plume rose to 3-3.4 km altitude on 30 November, but no significant ash emissions were detected.
Satellite data. MODIS thermal anomaly data provided through MIROVA (Middle InfraRed Observation of Volcanic Activity) showed a strong pulse of thermal activity beginning in July 2023 that continued through November 2023 (figure 48). This strong activity was due to Strombolian explosions and lava fountaining events at the summit crater. According to data from MODVOLC thermal alerts, a total of 101 hotspots were detected near the summit crater in July (11-14, 16-19, 23-24 and 26), August (4, 25-26, and 29), September (5, 12, and 17), and October (3, 4, and 8). Infrared satellite data showed large lava flows descending primarily the northern and SE flanks during the reporting period (figure 49). Sulfur dioxide plumes often exceeded two Dobson Units (DUs) and drifted in different directions throughout the reporting period, based on satellite data from the TROPOMI instrument on the Sentinel-5P satellite (figure 50).
Geologic Background. The symmetrical glacier-covered Shishaldin in the Aleutian Islands is the westernmost of three large stratovolcanoes in the eastern half of Unimak Island. The Aleuts named the volcano Sisquk, meaning "mountain which points the way when I am lost." Constructed atop an older glacially dissected edifice, it is largely basaltic in composition. Remnants of an older edifice are exposed on the W and NE sides at 1,500-1,800 m elevation. There are over two dozen pyroclastic cones on its NW flank, which is covered by massive aa lava flows. Frequent explosive activity, primarily consisting of Strombolian ash eruptions from the small summit crater, but sometimes producing lava flows, has been recorded since the 18th century. A steam plume often rises from the summit crater.
Information Contacts: Alaska Volcano Observatory (AVO), a cooperative program of a) U.S. Geological Survey, 4200 University Drive, Anchorage, AK 99508-4667 USA (URL: https://avo.alaska.edu/), b) Geophysical Institute, University of Alaska, PO Box 757320, Fairbanks, AK 99775-7320, USA, and c) Alaska Division of Geological & Geophysical Surveys, 794 University Ave., Suite 200, Fairbanks, AK 99709, USA (URL: http://dggs.alaska.gov/); MIROVA (Middle InfraRed Observation of Volcanic Activity), a collaborative project between the Universities of Turin and Florence (Italy) supported by the Centre for Volcanic Risk of the Italian Civil Protection Department (URL: http://www.mirovaweb.it/); Hawai'i Institute of Geophysics and Planetology (HIGP) - MODVOLC Thermal Alerts System, School of Ocean and Earth Science and Technology (SOEST), Univ. of Hawai'i, 2525 Correa Road, Honolulu, HI 96822, USA (URL: http://modis.higp.hawaii.edu/); NASA Global Sulfur Dioxide Monitoring Page, Atmospheric Chemistry and Dynamics Laboratory, NASA Goddard Space Flight Center (NASA/GSFC), 8800 Greenbelt Road, Goddard, Maryland, USA (URL: https://so2.gsfc.nasa.gov/); Copernicus Browser, Copernicus Data Space Ecosystem, European Space Agency (URL: https://dataspace.copernicus.eu/browser/).
Ioto
Japan
24.751°N, 141.289°E; summit elev. 169 m
All times are local (unless otherwise noted)
New eruption with discolored water, ejecta, and floating pumice during October-December 2023
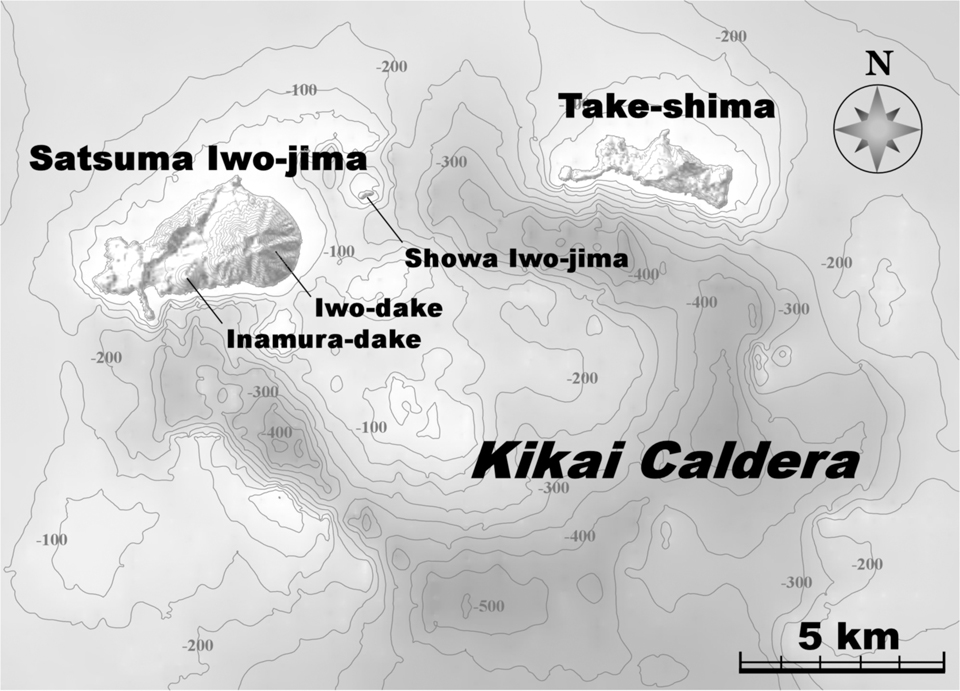
Ioto (Iwo-jima), located about 1,200 km S of Tokyo, lies within a 9-km-wide submarine caldera along the Izu-Bonin-Mariana volcanic arc. Previous eruptions date back to 1889 and have consisted of dominantly phreatic explosions, pumice deposits during 2001, and discolored water. A submarine eruption during July through December 2022 was characterized by discolored water, pumice deposits, and gas emissions (BGVN 48:01). This report covers a new eruption during October through December 2023, which consisted of explosions, black ejecta, discolored water, and floating pumice, based on information from the Japan Meteorological Association (JMA), the Japan Coast Guard (JCG), and satellite data.
JMA reported that an eruption had been occurring offshore of Okinahama on the SE side of the island since 21 October, which was characterized by volcanic tremor, according to the Japan Maritime Self-Defense Force (JMSDF) Iwo Jima Air Base (figure 22). According to an 18 October satellite image a plume of discolored water at the site of this new eruption extended NE (figure 23). During an overflight conducted on 30 October, a vent was identified about 1 km off the coast of Okinahama. Observers recorded explosions every few minutes that ejected dark material about 20 m above the ocean and as high as 150 m. Ejecta from the vent formed a black-colored island about 100 m in diameter, according to observations conducted from the air by the Earthquake Research Institute of the University of Tokyo in cooperation with the Mainichi newspaper (figure 24). Occasionally, large boulders measuring more than several meters in size were also ejected. Observations from the Advanced Land Observing Satellite Daichi-2 and Sentinel-2 satellite images also confirmed the formation of this island (figure 23). Brown discolored water and floating pumice were present surrounding the island.
The eruption continued during November. During an overflight on 3 November observers photographed the island and noted that material was ejected 169 m high, according to a news source. Explosions gradually became shorter, and, by the 3rd, they occurred every few seconds; dark and incandescent material were ejected about 800 m above the vent. On 4 November eruptions were accompanied by explosive sounds. Floating, brown-colored pumice was present in the water surrounding the island. There was a brief increase in the number of volcanic earthquakes during 8-14 November and 24-25 November. The eruption temporarily paused during 9-11 November and by 12 November eruptions resumed to the W of the island. On 10 November dark brown-to-dark yellow-green discolored water and a small amount of black floating material was observed (figure 25). A small eruption was reported on 18 November off the NE coast of the island, accompanied by white gas-and-steam plumes (figure 23). Another pause was recorded during 17-19 November, which then resumed on 20 November and continued erupting intermittently. According to a field survey conducted by the National Institute for Disaster Prevention Science and Technology on 19 November, a 30-m diameter crater was visible on the NE coast where landslides, hot water, and gray volcanic ash containing clay have occurred and been distributed previously. Erupted blocks about 10 cm in diameter were distributed about 90-120 m from the crater. JCG made observations during an overflight on 23 November and reported a phreatomagmatic eruption. Explosions at the main vent generated dark gas-and-ash plumes that rose to 200 m altitude and ejected large blocks that landed on the island and in the ocean (figure 26). Discolored water also surrounded the island. The size of the new island had grown to 450 m N-S x 200 m E-W by 23 November, according to JCG.
The eruption continued through 11 December, followed by a brief pause in activity, which then resumed on 31 December, according to JMA. Intermittent explosions produced 100-m-high black plumes at intervals of several minutes to 30 minutes during 1-10 December. Overflights were conducted on 4 and 15 December and reported that the water surrounding the new island was discolored to dark brown-to-dark yellow-green (figure 27). No floating material was reported during this time. In comparison to the observations made on 23 November, the new land had extended N and part of it had eroded away. In addition, analysis by the Geospatial Information Authority of Japan using SAR data from Daichi-2 also confirmed that the area of the new island continued to decrease between 4 and 15 December. Ejected material combined with wave erosion transformed the island into a “J” shape, 500-m-long and with the curved part about 200 m offshore of Ioto. The island was covered with brown ash and blocks, and the surrounding water was discolored to greenish-brown and contained an area of floating pumice. JCG reported from an overflight on 4 December that volcanic ash-like material found around the S vent on the NE part of the island was newly deposited since 10 November (figure 28). By 15 December the N part of the “J” shaped island had separated and migrated N, connecting to the Okinahama coast and the curved part of the “J” had eroded into two smaller islands (figure 27).
References. Ukawa, M., Fujita, E., Kobayashi, T., 2002, Recent volcanic activity of Iwo Jima and the 2001 eruption, Monthly Chikyu, Extra No. 39, 157-164.
Geologic Background. Ioto, in the Volcano Islands of Japan, lies within a 9-km-wide submarine caldera. The volcano is also known as Ogasawara-Iojima to distinguish it from several other "Sulfur Island" volcanoes in Japan. The triangular, low-elevation, 8-km-long island narrows toward its SW tip and has produced trachyandesitic and trachytic rocks that are more alkalic than those of other volcanoes in this arc. The island has undergone uplift for at least the past 700 years, accompanying resurgent doming of the caldera; a shoreline landed upon by Captain Cook's surveying crew in 1779 is now 40 m above sea level. The Motoyama plateau on the NE half of the island consists of submarine tuffs overlain by coral deposits and forms the island's high point. Many fumaroles are oriented along a NE-SW zone cutting through Motoyama. Numerous recorded phreatic eruptions, many from vents on the W and NW sides of the island, have accompanied the uplift.
Information Contacts: Japan Meteorological Agency (JMA), 1-3-4 Otemachi, Chiyoda-ku, Tokyo 100-8122, Japan (URL: http://www.jma.go.jp/jma/indexe.html); Japan Coast Guard (JCG) Volcano Database, Hydrographic and Oceanographic Department, 3-1-1, Kasumigaseki, Chiyoda-ku, Tokyo 100-8932, Japan (URL: https://www1.kaiho.mlit.go.jp/GIJUTSUKOKUSAI/kaiikiDB/kaiyo22-2.htm); Copernicus Browser, Copernicus Data Space Ecosystem, European Space Agency (URL: https://dataspace.copernicus.eu/browser/); Asahi, 5-3-2, Tsukiji, Chuo Ward, Tokyo, 104-8011, Japan (URL: https://www.asahi.com/ajw/articles/15048458).
Purace (Colombia) — December 2023 Cite this Report
Purace
Colombia
2.3095°N, 76.3948°W; summit elev. 4650 m
All times are local (unless otherwise noted)
Gas-and-ash emission on 16 November 2023
Puracé, located in Colombia, is a stratovolcano that contains a 500-m-wide summit crater. It is part of the Los Coconucos volcanic chain that is a NW-SE trending group of seven cones and craters. The most recent eruption occurred during March 2022 that was characterized by frequent seismicity and gas-and-steam emissions (BGVN 47:06). This report covers a brief eruption during November 2023 based on monthly reports from the Popayán Observatory, part of the Servicio Geologico Colombiano (SGC).
Activity during November 2022 through November 2023 primarily consisted of seismicity: VT-type events, LP-type events, HB-type events, and TR-type events (table 4). Maximum sulfur dioxide values were measured weekly and ranged from 259-5,854 tons per day (t/d) during November 2022 through April 2023. White gas-and-steam emissions were also occasionally reported.
SGC issued a report on 25 October that noted a significant increase in the number of earthquakes associated with rock fracturing. These earthquakes were located SE of the crater between Puracé and Piocollo at depths of 1-4 km. There were no reported variations in sulfur dioxide values, but SGC noted high carbon dioxide values, compared to those recorded in the first half of 2023.
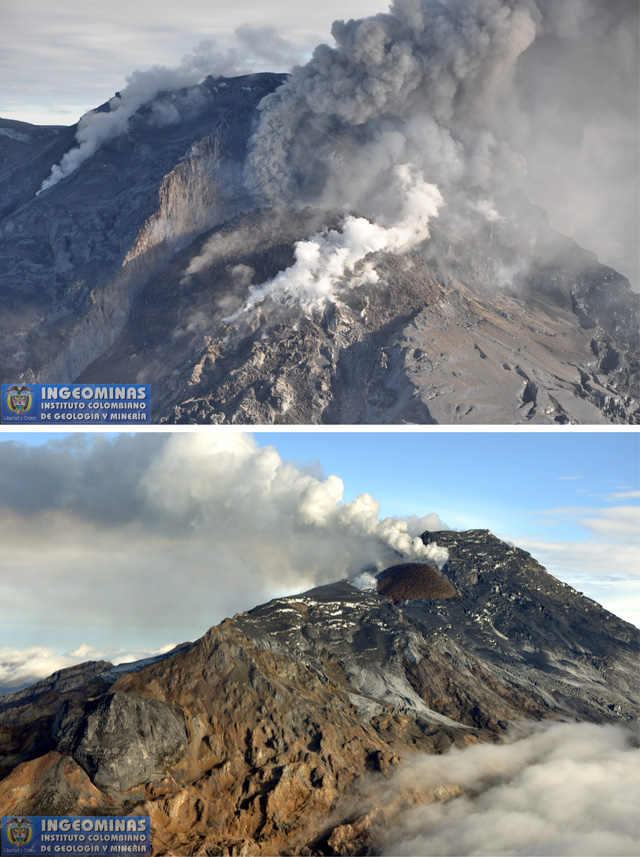
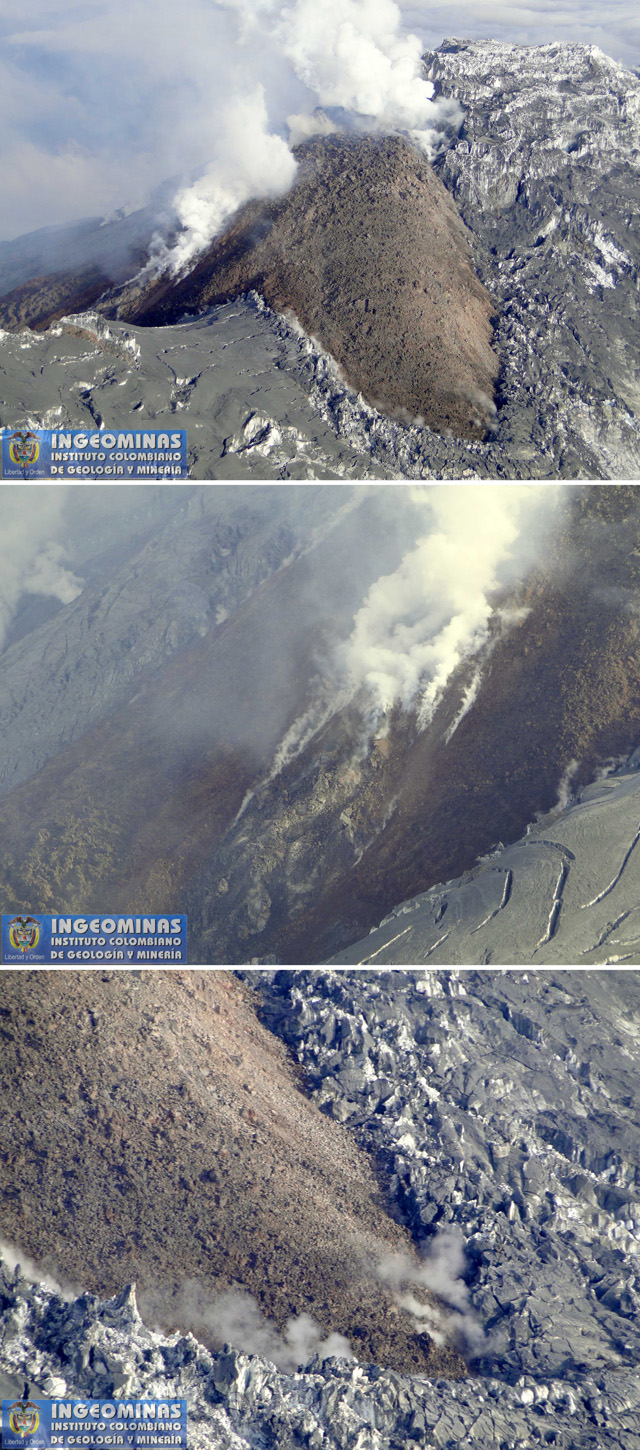
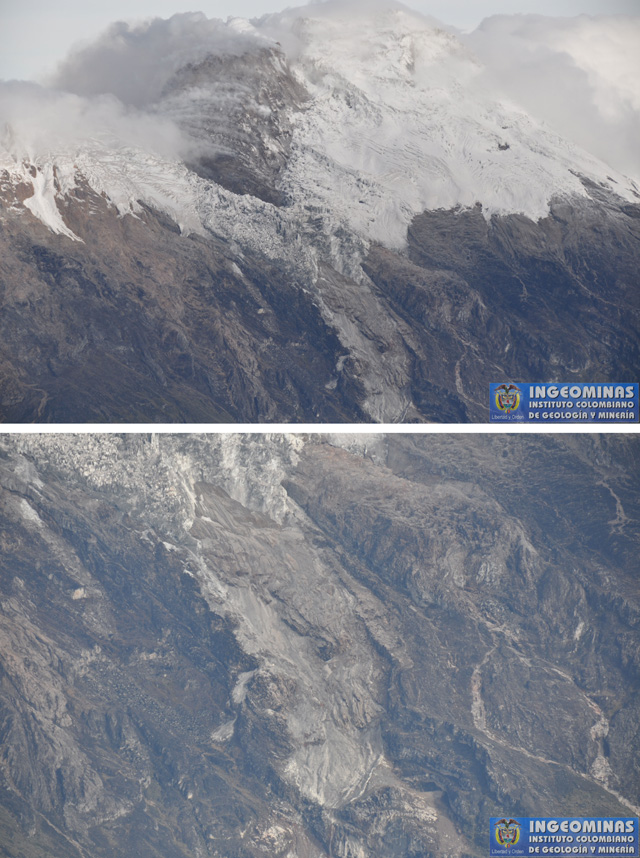
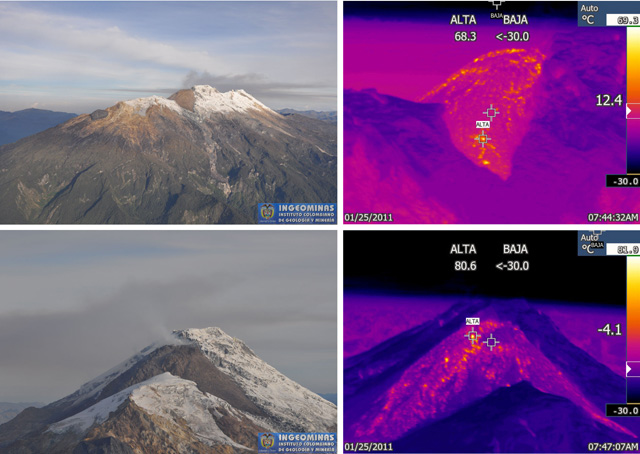
SGC reported that at 1929 on 16 November the seismic network detected a signal that was possibly associated with a gas-and-ash emission, though it was not confirmed in webcam images due to limited visibility. On 17 November an observer confirmed ash deposits on the N flank. Webcam images showed an increase in degassing both inside the crater and from the NW flank, rising 700 m above the crater.
Table 4. Seismicity at Puracé during November 2022-November 2023. Volcano-tectonic (VT), long-period (LP), hybrid (HB), and tremor (TR) events are reported each month. Courtesy of SGC.
| Month |
Volcano-tectonic |
Long-period |
Hybrid |
Tremor |
| Nov 2022 |
429 |
2,023 |
5 |
831 |
| Dec 2022 |
423 |
1,390 |
9 |
834 |
| Jan 2023 |
719 |
1,622 |
0 |
957 |
| Feb 2023 |
598 |
1,701 |
2 |
1,124 |
| Mar 2023 |
331 |
2,408 |
147 |
607 |
| Apr 2023 |
614 |
4,427 |
33 |
148 |
| May 2023 |
620 |
3,717 |
170 |
109 |
| Jun 2023 |
467 |
3,293 |
86 |
148 |
| Jul 2023 |
1,116 |
5,809 |
183 |
542 |
| Aug 2023 |
692 |
2,927 |
94 |
321 |
| Sep 2023 |
887 |
1,505 |
82 |
848 |
| Oct 2023 |
2,373 |
2,949 |
135 |
692 |
| Nov 2023 |
1,212 |
2,302 |
69 |
293 |
Geologic Background. Puracé is an active andesitic volcano with a 600-m-diameter summit crater at the NW end of the Los Coconucos Volcanic Chain. This volcanic complex includes nine composite and five monogenetic volcanoes, extending from the Puracé crater more than 6 km SE to the summit of Pan de Azúcar stratovolcano. The dacitic massif which the complex is built on extends about 13 km NW-SE and 10 km NE-SW. Frequent small to moderate explosive eruptions reported since 1816 CE have modified the morphology of the summit crater, with the largest eruptions in 1849, 1869, and 1885.
Information Contacts: Servicio Geologico Colombiano (SGC), Diagonal 53 No. 34-53 - Bogotá D.C., Colombia (URL: https://www.sgc.gov.co/volcanes).
Suwanosejima (Japan) — December 2023 Cite this Report
Suwanosejima
Japan
29.638°N, 129.714°E; summit elev. 796 m
All times are local (unless otherwise noted)
Eruption plumes, crater incandescence, and occasional explosions during July-October 2023
Suwanosejima is an 8-km-long island that consists of a stratovolcano and two active summit craters, located in the northern Ryukyu Islands, Japan. Volcanism over the past century has been characterized by Strombolian explosions, ash plumes, and ashfall. The current eruption began in October 2004 and has more recently consisted of frequent eruption plumes, explosions, and incandescent ejecta (BGVN 48:07). This report covers similar activity of ash plumes, explosions, and crater incandescence during July through October 2023 using monthly reports from the Japan Meteorological Agency (JMA) and satellite data.
Thermal activity during the reporting period was relatively low; only one low-power thermal anomaly was detected during mid-July and one during early August, based on a MIROVA (Middle InfraRed Observation of Volcanic Activity) Log Radiative Power graph of the MODIS thermal anomaly data. On two clear weather days, a thermal anomaly was visible in infrared satellite images (figure 81).
Low-level activity was reported at the Otake crater during July and no explosions were detected. Eruption plumes rose as high as 1.8 km above the crater. On 13 July an ash plume rose 1.7 km above the crater rim, based on a webcam image. During the night of the 28th crater incandescence was visible in a webcam image. An eruptive event reported on 31 July produced an eruption plume that rose 2.1 km above the crater. Seismicity consisted of 11 volcanic earthquakes on the W flank, the number of which had decreased compared to June (28) and 68 volcanic earthquakes near the Otake crater, which had decreased from 722 in the previous month. According to observations conducted by the University of Tokyo Graduate School of Science, Kyoto University Disaster Prevention Research Institute, Toshima Village, and JMA, the amount of sulfur dioxide emissions released during the month was 400-800 tons per day (t/d).
Eruptive activity in the Otake crater continued during August and no explosions were reported. An eruptive event produced a plume that rose 1 km above the crater at 1447 on 12 August. Subsequent eruptive events were recorded at 0911 on 16 August, at 1303 on 20 August, and at 0317 on 21 August, which produced ash plumes that rose 1-1.1 km above the crater and drifted SE, SW, and W. On 22 August an ash plume was captured in a webcam image rising 1.4 km above the crater (figure 82). Multiple eruptive events were detected on 25 August at 0544, 0742, 0824, 1424, and 1704, which generated ash plumes that rose 1.1-1.2 km above the crater and drifted NE, W, and SW. On 28 August a small amount of ashfall was observed as far as 1.5 km from the crater. There were 17 volcanic earthquakes recorded on the W flank of the volcano and 79 recorded at the Otake crater during the month. The amount of sulfur dioxide emissions released during the month was 400-800 t/d.
Activity continued at the Otake crater during September. Occasionally, nighttime crater incandescence was observed in webcam images and ashfall was reported. An eruptive event at 1949 on 4 September produced an ash plume that rose 1 km above the crater and drifted SW. On 9 September several eruption events were detected at 0221, 0301, and 0333, which produced ash plumes that rose 1.1-1.4 km above the crater rim and drifted W; continuous ash emissions during 0404-0740 rose to a maximum height of 2 km above the crater rim (figure 83). More eruptive events were reported at 1437 on 10 September, at 0319 on 11 September, and at 0511 and 1228 on 15 September, which generated ash plumes that rose 1-1.8 km above the crater. During 25, 27, and 30 September, ash plumes rose as high as 1.3 km above the crater rim. JMA reported that large blocks were ejected as far as 300 m from the center of the crater. There were 18 volcanic earthquakes detected beneath the W flank and 82 volcanic earthquakes detected near the Otake crater. The amount of sulfur dioxide released during the month ranged from 600 to 1,600 t/d.
Activity during early-to-mid-October consisted of occasional explosions, a total number of 13, and ash plumes that rose as high as 1.9 km above the Otake crater rim on 29 October (figure 84). These explosions are the first to have occurred since June 2023. Continuous ash emissions were reported during 0510-0555 on 1 October. Explosions were recorded at 0304, 2141, and 2359 on 2 October, at 0112 on 3 October, and at 1326 on 6 October, which produced ash plumes that rose as high as 1 km above the crater rim and drifted SW and W. An explosion was noted at 0428 on 3 October, but emission details were unknown. A total of eight explosions were recorded by the seismic network at 1522 on 14 October, at 0337, 0433, 0555, 1008, and 1539 on 15 October, and at 0454 and 0517 on 16 October. Ash plumes from these explosions rose as high as 900 m above the crater and drifted SE. Eruptive events during 25-27 and 29-30 October generated plumes that rose as high as 1.9 km above the crater and drifted SE, S, and SW. Ash was deposited in Toshima village (3.5 km SSW). Eruptive activity occasionally ejected large volcanic blocks as far as 600 m from the crater. Nighttime crater incandescence was visible in webcams. Intermittent ashfall was reported as far as 1.5 km from the crater. There were 43 volcanic earthquakes detected on the W flank during the month, and 184 volcanic earthquakes detected near the Otake crater. The amount of sulfur dioxide emitted ranged between 400 and 900 t/d.
Geologic Background. The 8-km-long island of Suwanosejima in the northern Ryukyu Islands consists of an andesitic stratovolcano with two active summit craters. The summit is truncated by a large breached crater extending to the sea on the E flank that was formed by edifice collapse. One of Japan's most frequently active volcanoes, it was in a state of intermittent Strombolian activity from Otake, the NE summit crater, between 1949 and 1996, after which periods of inactivity lengthened. The largest recorded eruption took place in 1813-14, when thick scoria deposits covered residential areas, and the SW crater produced two lava flows that reached the western coast. At the end of the eruption the summit of Otake collapsed, forming a large debris avalanche and creating an open collapse scarp extending to the eastern coast. The island remained uninhabited for about 70 years after the 1813-1814 eruption. Lava flows reached the eastern coast of the island in 1884. Only about 50 people live on the island.
Information Contacts: Japan Meteorological Agency (JMA), 1-3-4 Otemachi, Chiyoda-ku, Tokyo 100-8122, Japan (URL: http://www.jma.go.jp/jma/indexe.html); MIROVA (Middle InfraRed Observation of Volcanic Activity), a collaborative project between the Universities of Turin and Florence (Italy) supported by the Centre for Volcanic Risk of the Italian Civil Protection Department (URL: http://www.mirovaweb.it/); Hawai'i Institute of Geophysics and Planetology (HIGP) - MODVOLC Thermal Alerts System, School of Ocean and Earth Science and Technology (SOEST), Univ. of Hawai'i, 2525 Correa Road, Honolulu, HI 96822, USA (URL: http://modis.higp.hawaii.edu/); Copernicus Browser, Copernicus Data Space Ecosystem, European Space Agency (URL: https://dataspace.copernicus.eu/browser/).
Etna
Italy
37.748°N, 14.999°E; summit elev. 3357 m
All times are local (unless otherwise noted)
Strombolian explosions, lava fountains, and lava flows during July-August 2023
Etna, located on the Italian island of Sicily, has had documented eruptions dating back to 1500 BCE. Activity typically originates from multiple cones at the summit, where several craters have formed and evolved. The currently active craters are Northeast Crater (NEC), Voragine (VOR), and Bocca Nuova (BN), and the Southeast Crater (SEC); VOR and BN were previously referred to as the “Central Crater”. The original Southeast crater formed in 1978, and a second eruptive site that opened on its SE flank in 2011 was named the New Southeast Crater (NSEC). Another eruptive site between the SEC and NSEC developed during early 2017 and was referred to as the "cono della sella" (saddle cone). The current eruption period began in November 2022 and has been characterized by intermittent Strombolian activity, lava flows, and ash plumes (BGVN 48:08). This report updates activity during July through October 2023, which includes primarily gas-and-steam emissions; during July and August Strombolian explosions, lava fountains, and lava flows were reported, based on weekly and special reports by the Osservatorio Etneo (OE), part of the Catania Branch of Italy's Istituo Nazionale di Geofisica e Vulcanologica (INGV) and satellite data.
Variable fumarolic degassing was reported at all summit craters (BN, VOR, NEC, and SEC) throughout the entire reporting period (table 15). The MIROVA (Middle InfraRed Observation of Volcanic Activity) volcano hotspot detection system based on the analysis of MODIS data showed frequent low-to-moderate power thermal anomalies during the reporting period (figure 399). During mid-August there was a pulse in activity that showed an increase in the power of the anomalies due to Strombolian activity, lava fountains, and lava flows. Infrared satellite imagery captured strong thermal anomalies at the central and southeast summit crater areas (figure 400). Accompanying thermal activity were occasional sulfur dioxide plumes that exceeded 2 Dobson Units (DUs) recorded by the TROPOMI instrument on the Sentinel-5P satellite (figure 401).
Table 15. Summary of activity at the four primary crater areas at the summit of Etna during July-October 2023. Information is from INGV weekly reports.
| Month |
Bocca Nuova (BN) |
Voragine (VOR) |
Northeast Crater (NEC) |
Southeast Crater (SEC) |
| Jul 2023 |
Continuous degassing. |
No observations. |
Weak gas emissions. |
Continuous degassing. Sporadic and weak-to-moderate ash emissions. Strombolian explosions. |
| Aug 2023 |
Continuous degassing. |
No observations. |
No observations. |
Continuous degassing. Occasional ash emissions. Strombolian activity, lava fountaining, and lava flows. |
| Sep 2023 |
Variable degassing. Crater incandescence. |
Weak fumarolic activity. |
Weak fumarolic activity. |
Variable degassing. |
| Oct 2023 |
Continuous degassing. |
Weak fumarolic activity. |
Weak fumarolic activity. |
Continuous degassing. |
Activity during July and August was relatively low and mainly consisted of degassing at the summit craters, particularly at SEC and BN. Cloudy weather prevented clear views of the summit during early July. During the night of 2 July some crater incandescence was visible at SEC. Explosive activity resumed at SEC during 9-10 July, which was characterized by sporadic and weak ash emissions that rapidly dispersed in the summit area (figure 402). INGV reported moderate Strombolian activity began at 2034 on 14 July and was confined to the inside of the crater and fed by a vent located in the E part of SEC. An ash emission was detected at 2037. A new vent opened on 15 July in the SE part of BN and began to produce continuous gas-and-steam emissions. During an inspection carried out on 28 July pulsating degassing, along with audible booms, were reported at two active vents in BN. Vigorous gas-and-steam emissions intermittently generated rings. On rare occasions, fine, reddish ash was emitted from BN1 and resuspended by the gas-and-steam emissions.
Around 2000 on 13 August INGV reported a sudden increase in volcanic tremor amplitude. Significant infrasonic activity coincided with the tremor increase. Incandescent flashes were visible through the cloud cover in webcam images of SEC (figure 403). Strombolian activity at SEC began to gradually intensify starting at 2040 as seismicity continued to increase. The Aviation Color Code (ACC) was raised to Yellow (the second lowest-level on a four-color scale) at 2126 and then to Orange (the second highest-level on a four-color scale) at 2129 due to above-background activity. The activity rapidly transitioned from Strombolian activity to lava fountains around 2333 that rose 300-400 m above the crater (figure 403). Activity was initially focused on the E vent of the crater, but then the vent located above the S flank of the cone also became active. A lava flow from this vent traveled SW into the drainage created on 10 February 2022, overlapping with previous flows from 10 and 21 February 2022 and 21 May 2023, moving between Monte Barbagallo and Monte Frumento Supino (figure 404). The lava flow was 350 m long, oriented NNE-SSW, and descended to an elevation of 2.8 km. Flows covered an area of 300,000 m2 and had an estimated volume of 900,000 m3. The ACC was raised to Red at 2241 based on strong explosive activity and ashfall in Rifugio Sapienza-Piano Vetore at 1.7 km elevation on the S flank. INGV reported that pyroclastic flows accompanied this activity.
Activity peaked between 0240 and 0330 on 14 August, when roughly 5-6 vents erupted lava fountains from the E to SW flank of SEC. The easternmost vents produced lava fountains that ejected material strongly to the E, which caused heavy fallout of incandescent pyroclastic material on the underlying flank, triggering small pyroclastic flows. This event was also accompanied by lightning both in the ash column and in the ash clouds that were generated by the pyroclastic flows. A fracture characterized by a series of collapse craters (pit craters) opened on the upper SW flank of SEC. An ash cloud rose a few kilometers above the crater and drifted S, causing ash and lapilli falls in Rifugio Sapienza and expanding toward Nicolosi, Mascalucia, Catania, and up to Syracuse. Ashfall resulted in operational problems at the Catania airport (50 km S), which lasted from 0238 until 2000. By 0420 the volcanic tremor amplitude values declined to background levels. After 0500 activity sharply decreased, although the ash cloud remained for several hours and drifted S. By late morning, activity had completely stopped. The ACC was lowered to Orange as volcanic ash was confined to the summit area. Sporadic, minor ash emissions continued throughout the day. At 1415 the ACC was lowered to Yellow and then to Green at 1417.
During the night of 14-15 August only occasional flashes were observed, which were more intense during avalanches of material inside the eruptive vents. Small explosions were detected at SEC at 2346 on 14 August and at 0900 on 26 August that each produced ash clouds which rapidly dispersed into the atmosphere (figure 405). According to a webcam image, an explosive event detected at 2344 at SEC generated a modest ash cloud that was rapidly dispersed by winds. The ACC was raised to Yellow at 2355 on 14 August due to increasing unrest and was lowered to Green at 0954 on 15 August.
Activity during September and October was relatively low and mainly characterized by variable degassing from BN and SEC. Intense, continuous, and pulsating degassing was accompanied by roaring sounds and flashes of incandescence at BN both from BN1 and the new pit crater that formed during late July (figure 406). The degassing from the new pit crater sometimes emitted vapor rings. Cloudy weather during 6-8 September prevented observations of the summit craters .
Geologic Background. Mount Etna, towering above Catania on the island of Sicily, has one of the world's longest documented records of volcanism, dating back to 1500 BCE. Historical lava flows of basaltic composition cover much of the surface of this massive volcano, whose edifice is the highest and most voluminous in Italy. The Mongibello stratovolcano, truncated by several small calderas, was constructed during the late Pleistocene and Holocene over an older shield volcano. The most prominent morphological feature of Etna is the Valle del Bove, a 5 x 10 km caldera open to the east. Two styles of eruptive activity typically occur, sometimes simultaneously. Persistent explosive eruptions, sometimes with minor lava emissions, take place from one or more summit craters. Flank vents, typically with higher effusion rates, are less frequently active and originate from fissures that open progressively downward from near the summit (usually accompanied by Strombolian eruptions at the upper end). Cinder cones are commonly constructed over the vents of lower-flank lava flows. Lava flows extend to the foot of the volcano on all sides and have reached the sea over a broad area on the SE flank.
Information Contacts: Sezione di Catania - Osservatorio Etneo, Istituto Nazionale di Geofisica e Vulcanologia (INGV), Sezione di Catania, Piazza Roma 2, 95123 Catania, Italy (URL: http://www.ct.ingv.it/it/); MIROVA (Middle InfraRed Observation of Volcanic Activity), a collaborative project between the Universities of Turin and Florence (Italy) supported by the Centre for Volcanic Risk of the Italian Civil Protection Department (URL: http://www.mirovaweb.it/); NASA Global Sulfur Dioxide Monitoring Page, Atmospheric Chemistry and Dynamics Laboratory, NASA Goddard Space Flight Center (NASA/GSFC), 8800 Greenbelt Road, Goddard MD 20771, USA (URL: https://so2.gsfc.nasa.gov/); Copernicus Browser, Copernicus Data Space Ecosystem, European Space Agency (URL: https://dataspace.copernicus.eu/browser/).
Aira
Japan
31.5772°N, 130.6589°E; summit elev. 1117 m
All times are local (unless otherwise noted)
Explosions, ash plumes, ash fall, and crater incandescence during July-October 2023
Aira caldera, located in the northern half of Kagoshima Bay, Japan, contains the post-caldera Sakurajima volcano. Eruptions typically originate from the Minamidake crater, and since the 8th century, ash deposits have been recorded in the city of Kagoshima (10 km W), one of Kyushu’s largest cities. The Minamidake summit cone and crater has had persistent activity since 1955; the Showa crater on the E flank has also been intermittently active since 2006. The current eruption period began during March 2017 and has recently been characterized by intermittent explosions, eruption plumes, and ashfall (BGVN 48:07). This report updates activity during July through October 2023 and describes explosive events, ash plumes, nighttime crater incandescence, and ashfall, according to monthly activity reports from the Japan Meteorological Agency (JMA) and satellite data.
Thermal activity remained at low levels during this reporting period, according to the MIROVA (Middle InfraRed Observation of Volcanic Activity) system (figure 149). There was a slight increase in the number of anomalies during September through October. Occasional thermal anomalies were visible in infrared satellite images mainly at the Minamidake crater (Vent A is located to the left and Vent B is located to the right) (figure 150).
Table 30. Number of monthly explosive events, days of ashfall, area of ash covered, and sulfur dioxide emissions from Sakurajima’s Minamidake crater at Aira during July-October 2023. Note that smaller ash events are not listed. Ashfall days were measured at Kagoshima Local Meteorological Observatory and ashfall amounts represent material covering all the Kagoshima Prefecture. Data courtesy of JMA monthly reports.
| Month |
Explosive events |
Days of ashfall |
Ashfall amount (g/m2) |
SO2 emissions (tons/day) |
| Jul 2023 |
3 |
0 |
0 |
1,600-3,200 |
| Aug 2023 |
3 |
10 |
7 |
1,800-3,300 |
| Sep 2023 |
3 |
7 |
3 |
1,600-2,300 |
| Oct 2023 |
33 |
8 |
61 |
2,200-4,200 |
JMA reported that during July, there were eight eruptions, three of which were explosion events in the Showa crater. Large blocks were ejected as far as 600 m from the Showa crater. Very small eruptions were occasionally reported at the Minamidake crater. Nighttime incandescence was observed in both the Showa and Minamidake crater. Explosions were reported on 16 July at 2314 and on 17 July at 1224 and at 1232 (figure 151). Resulting eruption plumes rose 700-2,500 m above the crater and drifted N. On 23 July the number of volcanic earthquakes on the SW flank of the volcano increased. A strong Mw 3.1 volcanic earthquake was detected at 1054 on 26 July. The number of earthquakes recorded throughout the month was 545, which markedly increased from 73 in June. No ashfall was observed at the Kagoshima Regional Meteorological Observatory during July. According to a field survey conducted during the month, the daily amount of sulfur dioxide emissions was 1,600-3,200 tons per day (t/d).
There were three eruptions reported at the Minamidake crater during August, each of which were explosive. The explosions occurred on 9 August at 0345, on 13 August at 2205, and on 31 August at 0640, which generated ash plumes that rose 800-2,000 m above the crater and drifted W. There were two eruptions detected at Showa crater; on 4 August at 2150 ejecta traveled 800 m from the Showa crater and associated eruption plumes rose 2.3 km above the crater. The explosion at 2205 on 13 August generated an ash plume that rose 2 km above the crater and was accompanied by large blocks that were ejected 600 m from the Minamidake crater (figure 152). Nighttime crater incandescence was visible in a high-sensitivity surveillance camera at both craters. Seismicity consisted of 163 volcanic earthquakes, 84 of which were detected on the SW flank. According to the Kagoshima Regional Meteorological Observatory there was a total of 7 g/m2 of ashfall over the course of 10 days during the month. According to a field survey, the daily amount of sulfur dioxide emitted was 1,800-3,300 t/d.
During September, four eruptions were reported, three of which were explosion events. These events occurred at 1512 on 9 September, at 0018 on 11 September, and at 2211 on 13 September. Resulting ash plumes generally rose 800-1,100 m above the crater. An explosion produced an ash plume at 2211 on 13 September that rose as high as 1.7 km above the crater. Large volcanic blocks were ejected 600 m from the Minamidake crater. Smaller eruptions were occasionally observed at the Showa crater. Nighttime crater incandescence was visible at the Minamidake crater. Seismicity was characterized by 68 volcanic earthquakes, 28 of which were detected beneath the SW flank. According to the Kagoshima Regional Meteorological Observatory there was a total of 3 g/m2 of ashfall over the course of seven days during the month. A field survey reported that the daily amount of sulfur dioxide emitted was 1,600-2,300 t/d.
Eruptive activity during October consisted of 69 eruptions, 33 of which were described as explosive. These explosions occurred during 4 and 11-21 October and generated ash plumes that rose 500-3,600 m above the crater and drifted S, E, SE, and N. On 19 October at 1648 an explosion generated an ash plume that rose 3.6 km above the crater (figure 153). No eruptions were reported in the Showa crater; white gas-and-steam emissions rose 100 m above the crater from a vent on the N flank. Nighttime incandescence was observed at the Minamidake crater. On 24 October an eruption was reported from 0346 through 0430, which included an ash plume that rose 3.4 km above the crater. Ejected blocks traveled 1.2 km from the Minamidake crater. Following this eruption, small amounts of ashfall were observed from Arimura (4.5 km SE) and a varying amount in Kurokami (4 km E) (figure 154). The number of recorded volcanic earthquakes during the month was 190, of which 14 were located beneath the SW flank. Approximately 61 g/m2 of ashfall was reported over eight days of the month. According to a field survey, the daily amount of sulfur dioxide emitted was 2,200-4,200 t/d.
Geologic Background. The Aira caldera in the northern half of Kagoshima Bay contains the post-caldera Sakurajima volcano, one of Japan's most active. Eruption of the voluminous Ito pyroclastic flow accompanied formation of the 17 x 23 km caldera about 22,000 years ago. The smaller Wakamiko caldera was formed during the early Holocene in the NE corner of the caldera, along with several post-caldera cones. The construction of Sakurajima began about 13,000 years ago on the southern rim and built an island that was joined to the Osumi Peninsula during the major explosive and effusive eruption of 1914. Activity at the Kitadake summit cone ended about 4,850 years ago, after which eruptions took place at Minamidake. Frequent eruptions since the 8th century have deposited ash on the city of Kagoshima, located across Kagoshima Bay only 8 km from the summit. The largest recorded eruption took place during 1471-76.
Information Contacts: Japan Meteorological Agency (JMA), 1-3-4 Otemachi, Chiyoda-ku, Tokyo 100-8122, Japan (URL: http://www.jma.go.jp/jma/indexe.html); MIROVA (Middle InfraRed Observation of Volcanic Activity), a collaborative project between the Universities of Turin and Florence (Italy) supported by the Centre for Volcanic Risk of the Italian Civil Protection Department (URL: http://www.mirovaweb.it/); Copernicus Browser, Copernicus Data Space Ecosystem, European Space Agency (URL: https://dataspace.copernicus.eu/browser/).
Nishinoshima (Japan) — November 2023 Cite this Report
Nishinoshima
Japan
27.247°N, 140.874°E; summit elev. 100 m
All times are local (unless otherwise noted)
Gray emissions during October 2023
Nishinoshima is a small island in the Ogasawara Arc, about 1,000 km S of Tokyo, Japan. It contains prominent submarine peaks to the S, W, and NE. Recorded eruptions date back to 1973, with the current eruption period beginning in October 2022. Eruption plumes and fumarolic activity characterize recent activity (BGVN 48:10). This report covers the end of the eruption for September through October 2023, based on information from monthly reports of the Japan Meteorological Agency (JMA) monthly reports, and satellite data.
No eruptive activity was reported during September 2023, although JMA noted that the surface temperature was slightly elevated compared to the surrounding area since early March 2023. The Japan Coast Guard (JCG) conducted an overflight on 20 September and reported white gas-and-steam plumes rising 3 km above the central crater of the pyroclastic cone, as well as multiple white gas-and-steam emissions emanating from the N, E, and S flanks of the crater to the coastline. In addition, dark reddish brown-to-green discolored water was distributed around almost the entire circumference of the island.
Similar low-level activity was reported during October. Multiple white gas-and-steam emissions rose from the N, E, and S flanks of the central crater of the pyroclastic cone and along the coastline; these emissions were more intense compared to the previous overflight observations. Dark reddish brown-to-green discolored water remained visible around the circumference of the island. On 4 October aerial observations by JCG showed a small eruption consisting of continuous gas-and-steam emissions emanating from the central crater, with gray emissions rising to 1.5 km altitude (figure 129). According to observations from the marine weather observation vessel Keifu Maru on 26 October, white gas-and-steam emissions persisted from the center of the pyroclastic cone, as well as from the NW, SW, and SE coasts of the island for about five minutes. Slightly discolored water was visible up to about 1 km.
Frequent low-to-moderate power thermal anomalies were recorded in the MIROVA graph (Middle InfraRed Observation of Volcanic Activity) during September (figure 130). Occasional anomalies were detected during October, and fewer during November through December. A thermal anomaly was visible in the crater using infrared satellite imagery on 6, 8, 11, 16, 18, 21, and 23 September and 8, 13, 21, 26, and 28 October (figure 131).
Geologic Background. The small island of Nishinoshima was enlarged when several new islands coalesced during an eruption in 1973-74. Multiple eruptions that began in 2013 completely covered the previous exposed surface and continued to enlarge the island. The island is the summit of a massive submarine volcano that has prominent peaks to the S, W, and NE. The summit of the southern cone rises to within 214 m of the ocean surface 9 km SSE.
Information Contacts: Japan Meteorological Agency (JMA), 1-3-4 Otemachi, Chiyoda-ku, Tokyo 100-8122, Japan (URL: http://www.jma.go.jp/jma/indexe.html); MIROVA (Middle InfraRed Observation of Volcanic Activity), a collaborative project between the Universities of Turin and Florence (Italy) supported by the Centre for Volcanic Risk of the Italian Civil Protection Department (URL: http://www.mirovaweb.it/); Copernicus Browser, Copernicus Data Space Ecosystem, European Space Agency (URL: https://dataspace.copernicus.eu/browser/).
Kilauea (United States) — October 2023 Cite this Report
Kilauea
United States
19.421°N, 155.287°W; summit elev. 1222 m
All times are local (unless otherwise noted)
Strong lava fountains, lava flows, and spatter at Halema’uma’u during January-September 2023
Kīlauea is on the island of Hawai’i and overlaps the E flank of the Mauna Loa volcano. Its East Rift Zone (ERZ) has been intermittently active for at least 2,000 years. An extended eruption period began in January 1983 and was characterized by open lava lakes and lava flows from the summit caldera and the East Rift Zone. During May 2018 magma migrated into the Lower East Rift Zone (LERZ) and opened 24 fissures along a 6-km-long NE-trending fracture zone that produced lava flows traveling in multiple directions. As lava emerged from the fissures, the lava lake at Halema'uma'u drained and explosions sent ash plumes to several kilometers altitude (BGVN 43:10).
The current eruption period started during September 2021 and has been characterized by low-level lava effusions in the active Halema’uma’u lava lake (BGVN 48:01). This report covers three notable eruption periods during February, June, and September 2023 consisting of lava fountaining, lava flows, and spatter during January through September 2023 using information from daily reports, volcanic activity notices, and abundant photo, map, and video data from the US Geological Survey's (USGS) Hawaiian Volcano Observatory (HVO).
Activity during January 2023. Small earthquake swarms were recorded on 2 January 2023; increased seismicity and changes in the pattern of deformation were noted on the morning of 5 January. At around 1500 both the rate of deformation and seismicity drastically increased, which suggested magma movement toward the surface. HVO raised the Volcano Alert Level (VAL) to Watch (the second highest level on a four-level scale) and the Aviation Color Code (ACC) to Orange (the second highest color on a four-color scale) at 1520.
Multiple lava fountains and lava effusions from vents in the central eastern portion of the Halema’uma’u crater began on 5 January around 0434; activity was confined to the eastern half of the crater and within the basin of the western half of the crater, which was the focus of the eruption in 2021-2022 (figure 525). Incandescence was visible in webcam images at 1634 on 5 January, prompting HVO to raise the VAL to Warning (the highest level on a four-level scale) and the ACC to Red (the highest color on a four-color scale). Lava fountains initially rose as high as 50 m above the vent at the onset of the eruption (figure 526) but then declined to a more consistent 5-6 m height in the proceeding days. By 1930 that same day, lava had covered most of the crater floor (an area of about 1,200,000 m2) and the lava lake had a depth of 10 m. A higher-elevation island that formed during the initial phase of the December 2020 eruption remained exposed, appearing darker in images, along with a ring of older lava around the lava lake that was active prior to December 2022. Overnight during 5-6 January the lava fountains continued to rise 5 m high, and the lava effusion rate had slowed.
On 6 January at 0815 HVO lowered the VAL to Watch and the ACC to Orange due to the declining effusion rates. Sulfur dioxide emission rates ranged from 3,000-12,500 tonnes per day (t/d), the highest value of which was recorded on 6 January. Lava continued to erupt from the vents during 6-8 January, although the footprint of the active area had shrunk; a similar progression has been commonly observed during the early stages of recent eruptions at Halema’uma’u. On 9 January HVO reported one dominant lava fountain rising 6-7 m high in the E half of the crater. Lava flows built up the margins of the lake, causing the lake to be perched. On 10 January the eastern lava lake had an area of approximately 120,000 m2 that increased to 250,000 m2 by 17 January. During 13-31 January several small overflows occurred along the margins of the E lake. A smaller area of lava was active within the basin in the W half of the crater that had been the focus of activity during 2021-2022. On 19 January just after 0200 a small ooze-out was observed on the crater’s W edge.
Activity during February 2023. Activity continued in the E part of Halema’uma’u crater, as well as in a smaller basin in the W part of the 2021-2022 lava lake (figure 527). The E lava lake contained a single lava fountain and frequent overflows. HVO reported that during the morning of 1 February the large E lava lake began to cool and crust over in the center of the lake; two smaller areas of lava were observed on the N and S sides by the afternoon. The dominant lava fountain located in the S part of the lava lake paused for roughly 45 minutes at 2315 and resumed by midnight, rising 1-2 m. At 0100 on 2 February lava from the S part was effusing across the entire E lava lake area, covering the crusted over portion in the center of the lake and continuing across the majority of the previously measured 250,000 m2 by 0400. A small lava pond near the E lake produced an overflow around 0716 on 2 February. On 3 February some lava crust began to form against the N and E levees, which defined the 250,000 m2 eastern lava lake. The small S lava fountain remained active, rising 1-6 m high during 3-9 February; around 0400 on 5 February occasional bursts doubled the height of the lava fountain.
A large breakout occurred overnight during 2100 on 4 February to 0900 on 5 February on the N part of the crater floor, equal to or slightly larger in size than the E lava lake. A second, smaller lava fountain appeared in the same area of the E lava lake between 0300 and 0700 on 5 February and was temporarily active. This large breakout continued until 7 February. A small, brief breakout was reported in the S of the E lava lake around midnight on 7 February. In the W lake, as well as the smaller lava pond in the central portion of the crater floor, contained several overflows during 7-10 February and intermittent fountaining. Activity at the S small lava pond and the small S lava fountain within the E lake declined during 9-10 February. The lava pond in the central portion of the crater floor had nearly continuous, expansive flows during 10-13 February; channels from the small central lava pond seemed to flow into the larger E lake. During 13-18 February a small lava fountain was observed in the small lava pond in the central portion of the crater floor. Continuous overflows persisted during this time.
Activity in the eastern and central lakes began to decline in the late afternoon of 17 February. By 18 February HVO reported that the lava effusions had significantly declined, and that the eastern and central lakes were no longer erupting. The W lake in the basin remained active but at a greatly reduced level that continued to decline. HVO reported that this decrease in activity is attributed to notable deflationary tilt that began early on the morning of 17 February and lasted until early 19 February. By 19 February the W lake was mostly crusted over although some weak lava flows remained, which continued through 28 February. The sulfur dioxide emission rates ranged 250-2,800 t/d, the highest value of which was recorded on 6 February.
Activity during March 2023. The summit eruption at Halema’uma’u crater continued at greatly reduced levels compared to the previous two months. The E and central vents stopped effusing lava, and the W lava lake remained active with weak lava flows; the lake was mostly crusted over, although slowly circulating lava intermittently overturned the crust. By 6 March the lava lake in the W basin had stopped because the entire surface was crusted over. The only apparent surface eruptive activity during 5-6 March was minor ooze-outs of lava onto the crater floor, which had stopped by 7 March. Several hornitos on the crater floor still glowed through 12 March according to overnight webcam images, but they did not erupt any lava. A small ooze-out of lava was observed just after 1830 in the W lava lake on 8 March, which diminished overnight. The sulfur dioxide emission rate ranged from 155-321 t/d on 21 March. The VAL was lowered to Advisory, and the ACC was lowered to Yellow (the second lowest on a four-color scale) on 23 March due to a pause in the eruption since 7 March.
Activity during April-May 2023. The eruption at Halema’uma’u crater was paused; no lava effusions were visible on the crater floor. Sulfur dioxide emission rates ranged from 75-185 t/d, the highest of which was measured on 22 April. During May and June summit seismicity was elevated compared to seismicity that preceded the activity during January.
Activity during June 2023. Earthquake activity and changes in the patterns of ground deformation beneath the summit began during the evening of 6 June. The data indicated magma movement toward the surface, prompting HVO to raise the VAL to Watch and the ACC to Orange. At about 0444 on 7 June incandescence in Halema’uma’u crater was visible in webcam images, indicating that a new eruption had begun. HVO raised the VAL to Warning and the ACC to Red (the highest color on a four-color scale). Lava flowed from fissures that had opened on the crater floor. Multiple minor lava fountains were active in the central E portion of the Halema’uma’u crater, and one vent opened on the W wall of the caldera (figure 528). The eruptive vent on the SW wall of the crater continued to effuse into the lava lake in the far SW part of the crater (figure 529). The largest lava fountain consistently rose 15 m high; during the early phase of the eruption, fountain bursts rose as high as 60 m. Lava flows inundated much of the crater floor and added about 6 m depth of new lava within a few hours, covering approximately 10,000 m2. By 0800 on 7 June lava filled the crater floor to a depth of about 10 m. During 0800-0900 the sulfur dioxide emission rate was about 65,000 t/d. Residents of Pahala (30 km downwind of the summit) reported minor deposits of fine, gritty ash and Pele’s hair. A small spatter cone had formed at the vent on the SW wall by midday, and lava from the cone was flowing into the active lava lake. Fountain heights had decreased from the onset of the eruption and were 4-9 m high by 1600, with occasional higher bursts. Inflation switched to deflation and summit earthquake activity greatly diminished shortly after the eruption onset.
At 0837 on 8 June HVO lowered the VAL to Watch and the ACC to Orange because the initial high effusion rates had declined, and no infrastructure was threatened. The surface of the lava lake had dropped by about 2 m, likely due to gas loss by the morning of 8 June. The drop left a wall of cooled lava around the margins of the crater floor. Lava fountain heights decreased during 8-9 June but continued to rise to 10 m high. Active lava and vents covered much of the W half of Halema’uma’u crater in a broad, horseshoe-shape around a central, uplifted area (figure 530). The preliminary average effusion rate for the first 24 hours of the eruption was about 150 cubic meters per second, though the estimate did not account for vesiculated lava and variations in crater floor topography. The effusion rate during the very earliest phases of the eruption appeared significantly higher than the previous three summit eruptions based on the rapid coverage of the entire crater floor. An active lava lake, also referred to as the “western lava lake” was centered within the uplifted area and was fed by a vent in the NE corner. Two small active lava lakes were located just SE from the W lava lake and in the E portion of the crater floor.
During 8-9 June the lava in the central lava lake had a thickness of approximately 1.5 m, based on measurements from a laser rangefinder. During 9-12 June the height of the lava fountains decreased to 9 m high. HVO reported that the previously active lava lake in the E part of the crater appeared stagnant during 10-11 June. The surface of the W lake rose approximately 1 m overnight during 11-12 June, likely due to the construction of a levee around it. Only a few small fountains were active during 12-13 June; the extent of the active lava had retreated so that all activity was concentrated in the SW and central parts of Halema’uma’u crater. Intermittent spattering from the vent on the SW wall was visible in overnight webcam images during 13-18 June. On the morning of 14 June a weak lava effusion originated from near the western eruptive vent, but by 15 June there were no signs of continued activity. HVO reported that other eruptive vents in the SW lava lake had stopped during this time, following several days of waning activity; lava filled the lake by about 0.5 m. Lava circulation continued in the central lake and no active lava was reported in the northern or eastern parts of the crater. Around 0800 on 15 June the top of the SW wall spatter cone collapsed, which was followed by renewed and constant spattering from the top vent and a change in activity from the base vent; several new lava flows effused from the top of the cone, as well as from the pre-existing tube-fed flow from its base. Accumulation of lava on the floor resulted in a drop of the central basin relative to the crater floor, allowing several overflows from the SW lava lake to cascade into the basin during the night of 15 June into the morning of 16 June.
Renewed lava fountaining was reported at the eruptive vent on the SW side of the crater during 16-19 June, which effused lava into the far SW part of the crater. This activity was described as vigorous during midday on 16 June; a group of observatory geologists estimated that the lava was consistently ejected at least 10 m high, with some spatter ejected even higher and farther. Deposits from the fountain further heightened and widened the spatter cone built around the original eruptive vent in the lower section of the crater wall. Multiple lava flows from the base of the cone were fed into the SW lava lake and onto the southwestern-most block from the 2018 collapse within Halema’uma’u on 17 June (figure 531); by 18 June they focused into a single flow feeding into the SW lava lake. On the morning of 19 June a second lava flow from the base of the eruptive cone advanced into the SW lava lake.
Around 1600 on 19 June there was a rapid decline in lava fountaining and effusion at the eruptive vent on the SW side of the crater; vent activity had been vigorous up to that point (figure 532). Circulation in the lava lake also slowed, and the lava lake surface dropped by several meters. Overnight webcam images showed some previously eruptive lava still flowing onto the crater floor, which continued until those flows began to cool. By 21 June no lava was erupting in Halema’uma’u crater. Overnight webcam images during 29-30 June showed some incandescence from previously erupted lava flows as they continued to cool. Seismicity in the crater declined to low levels. Sulfur dioxide emission rates ranged 160-21,000 t/d throughout the month, the highest measurement of which was recorded on 8 June. On 30 June the VAL was lowered to Advisory (the second level on a four-level scale) and the ACC was lowered to Yellow. Gradual inflation was detected at summit tiltmeters during 19-30 June.
Activity during July-August 2023. During July, the eruption paused; no lava was erupting in Halema’uma’u crater. Nighttime webcam images showed some incandescence from previously erupted lava as it continued to cool on the crater floor. During the week of 14 August HVO reported that the rate in seismicity increased, with 467 earthquakes of Mw 3.2 and smaller occurring. Sulfur dioxide emission rates remained low, ranging from 75-86 t/d, the highest of which was recorded on 10 and 15 August. On 15 August beginning at 0730 and lasting for several hours, a swarm of approximately 50 earthquakes were detected at a depth of 2-3 km below the surface and about 2 km long directly S of Halema’uma’u crater. HVO reported that this was likely due to magma movement in the S caldera region. During 0130-0500 and 1700-2100 on 21 August two small earthquake swarms of approximately 20 and 25 earthquakes, respectively, occurred at the same location and at similar depths. Another swarm of 50 earthquakes were recorded during 0430-0830 on 23 August. Elevated seismicity continued in the S area through the end of the month.
Activity during September 2023. Elevated seismicity persisted in the S summit with occasional small, brief seismic swarms. Sulfur dioxide measurements were relatively low and were 70 t/d on 8 September. About 150 earthquakes occurred during 9-10 September, and tiltmeter and Global Positioning System (GPS) data showed inflation in the S portion of the crater.
At 0252 on 10 September HVO raised the VAL to Watch and the ACC to Orange due to increased earthquake activity and changes in ground deformation that indicated magma moving toward the surface. At 1515 the summit eruption resumed in the E part of the caldera based on field reports and webcam images. Fissures opened on the crater floor and produced multiple minor lava fountains and flows (figure 533). The VAL and ACC were raised to Warning and Red, respectively. Gas-and-steam plumes rose from the fissures and drifted downwind. A line of eruptive vents stretched approximately 1.4 km from the E part of the crater into the E wall of the down dropped block by 1900. The lava fountains at the onset of the eruption had an estimated 50 m height, which later rose 20-25 m high. Lava erupted from fissures on the down dropped block and expanded W toward Halema’uma’u crater. Data from a laser rangefinder recorded about 2.5 m thick of new lava added to the W part of the crater. Sulfur dioxide emissions were elevated in the eruptive area during 1600-1500 on 10 September, measuring at least 100,000 t/d.
At 0810 on 11 September HVO lowered the VAL and ACC back to Watch and Orange due to the style of eruption and the fissure location had stabilized. The initial extremely high effusion rates had declined (but remained at high levels) and no infrastructure was threatened. An eruption plume, mainly comprised of sulfur dioxide and particulates, rose as high as 3 km altitude. Several lava fountains were active on the W side of the down dropped block during 11-15 September, while the easternmost vents on the down dropped block and the westernmost vents in the crater became inactive on 11 September (figure 534). The remaining vents spanned approximately 750 m and trended roughly E-W. The fed channelized lava effusions flowed N and W into Halema’uma’u. The E rim of the crater was buried by new lava flows; pahoehoe lava flows covered most of the crater floor except areas of higher elevation in the SW part of the crater. The W part of the crater filled about 5 m since the start of the eruption, according to data from a laser rangefinder during 11-12 September. Lava fountaining continued, rising as high as 15 m by the morning of 12 September. During the morning of 13 September active lava flows were moving on the N and E parts of the crater. The area N of the eruptive vents that had active lava on its surface became perched and was about 3 m higher than the surrounding ground surface. By the morning of 14 September active lava was flowing on the W part of the down dropped block and the NE parts of the crater. The distances of the active flows progressively decreased. Spatter had accumulated on the S (downwind) side of the vents, forming ramparts about 20 m high.
Vigorous spattering was restricted to the westernmost large spatter cone with fountains rising 10-15 m high. Minor spattering occurred within the cone to the E of the main cone, but HVO noted that the fountains remained mostly below the rim of the cone. Lava continued to effuse from these cones and likely from several others as well, traveled N and W, confined to the W part of the down-dropped block and the NE parts of Halema’uma’u. Numerous ooze-outs of lava were visible over other parts of the crater floor at night. Laser range-finder measurements taken of the W part of the crater during 14-15 September showed that lava filled the crater by 10 m since the start of the eruption. Sulfur dioxide emissions remained elevated after the onset of the eruption, ranging 20,000-190,000 t/d during the eruption activity, the highest of which occurred on 10 September.
Field crews observed the eruptive activity on 15 September; they reported a notable decrease or stop in activity at several vents. Webcam images showed little to no fountaining since 0700 on 16 September, though intermittent spattering continued from the westernmost large cone throughout the night of 15-16 September. Thermal images showed that lava continued to flow onto the crater floor. On 16 September HVO reported that the eruption stopped around 1200 and that there was no observable activity anywhere overnight or on the morning of 17 September. HVO field crews reported that active lava was no longer flowing onto Halema’uma’u crater floor and was restricted to a ponded area N of the vents on the down dropped block. They reported that spattering stopped around 1115 on 16 September. Nighttime webcam images showed some incandescence on the crater floor as lava continued to cool. Field observations supported by geophysical data showed that eruptive tremor in the summit region decreased over 15-16 September and returned to pre-eruption levels by 1700 on 16 September. Sulfur dioxide emissions were measured at a rate of 800 t/d on 16 September while the eruption was waning, and 200 t/d on 17 September, which were markedly lower compared to measurements taken the previous week of 20,000-190,000 t/d.
Geologic Background. Kilauea overlaps the E flank of the massive Mauna Loa shield volcano in the island of Hawaii. Eruptions are prominent in Polynesian legends; written documentation since 1820 records frequent summit and flank lava flow eruptions interspersed with periods of long-term lava lake activity at Halemaumau crater in the summit caldera until 1924. The 3 x 5 km caldera was formed in several stages about 1,500 years ago and during the 18th century; eruptions have also originated from the lengthy East and Southwest rift zones, which extend to the ocean in both directions. About 90% of the surface of the basaltic shield volcano is formed of lava flows less than about 1,100 years old; 70% of the surface is younger than 600 years. The long-term eruption from the East rift zone between 1983 and 2018 produced lava flows covering more than 100 km2, destroyed hundreds of houses, and added new coastline.
Information Contacts: Hawaiian Volcano Observatory (HVO), U.S. Geological Survey, PO Box 51, Hawai'i National Park, HI 96718, USA (URL: http://hvo.wr.usgs.gov/).
Tinakula (Solomon Islands) — December 2023 Cite this Report
Tinakula
Solomon Islands
10.386°S, 165.804°E; summit elev. 796 m
All times are local (unless otherwise noted)
Continued lava flows and thermal activity during June through November 2023
Tinakula is a remote 3.5 km-wide island in the Solomon Islands, located 640 km ESE of the capital, Honiara. The current eruption period began in December 2018 and has more recently been characterized by intermittent lava flows and thermal activity (BGVN 48:06). This report covers similar activity during June through November 2023 using satellite data.
During clear weather days (20 July, 23 September, 23 October, and 12 November), infrared satellite imagery showed lava flows that mainly affected the W side of the island and were sometimes accompanied by gas-and-steam emissions (figure 54). The flow appeared more intense during July and September compared to October and November. According to the MODVOLC thermal alerts, there were a total of eight anomalies detected on 19 and 21 July, 28 and 30 October, and 16 November. Infrared MODIS satellite data processed by MIROVA (Middle InfraRed Observation of Volcanic Activity) detected a small cluster of thermal activity occurring during late July, followed by two anomalies during August, two during September, five during October, and five during November (figure 55).
Geologic Background. The small 3.5-km-wide island of Tinakula is the exposed summit of a massive stratovolcano at the NW end of the Santa Cruz islands. It has a breached summit crater that extends from the summit to below sea level. Landslides enlarged this scarp in 1965, creating an embayment on the NW coast. The Mendana cone is located on the SE side. The dominantly andesitic volcano has frequently been observed in eruption since the era of Spanish exploration began in 1595. In about 1840, an explosive eruption apparently produced pyroclastic flows that swept all sides of the island, killing its inhabitants. Recorded eruptions have frequently originated from a cone constructed within the large breached crater. These have left the upper flanks and the steep apron of lava flows and volcaniclastic debris within the breach unvegetated.
Information Contacts: MIROVA (Middle InfraRed Observation of Volcanic Activity), a collaborative project between the Universities of Turin and Florence (Italy) supported by the Centre for Volcanic Risk of the Italian Civil Protection Department (URL: http://www.mirovaweb.it/); Hawai'i Institute of Geophysics and Planetology (HIGP) - MODVOLC Thermal Alerts System, School of Ocean and Earth Science and Technology (SOEST), Univ. of Hawai'i, 2525 Correa Road, Honolulu, HI 96822, USA (URL: http://modis.higp.hawaii.edu/); Copernicus Browser, Copernicus Data Space Ecosystem, European Space Agency (URL: https://dataspace.copernicus.eu/browser/).
Search Bulletin Archive by Publication Date
Select a month and year from the drop-downs and click "Show Issue" to have that issue displayed in this tab.
The default month and year is the latest issue available.
Bulletin of the Global Volcanism Network - Volume 38, Number 01 (January 2013)
Akita-Komagatake (Japan)
Short lived plume rising to 50 m observed on 14 December 2011
Dona Juana (Colombia)
Seismic swarm in 2010 and monitoring efforts
Heard (Australia)
Satellite imagery reveals lava flows in December 2012
Huila, Nevado del (Colombia)
Dome growth and displaced glacier in 2009; decreasing activity during 2010-2012
Izu-Oshima (Japan)
Non-eruptive May 2010 surface deformation from inferred deep instrusion
Kikai (Japan)
Steam plumes rose to 800 m duing latter half of 2012
Kuchinoerabujima (Japan)
Increased seismicity, 11 December 2011-5 January 2012
San Cristobal (Nicaragua)
Ash eruption during 25-28 December 2012
Akita-Komagatake (Japan) — January 2013 Cite this Report
Akita-Komagatake
Japan
39.761°N, 140.799°E; summit elev. 1637 m
All times are local (unless otherwise noted)
Short lived plume rising to 50 m observed on 14 December 2011
The Japanese Meterological Agency (JMA) reported that a short-lived plume rose to 50 m above Akita-Komaga-take on 14 December 2011 and was recorded by a camera located to the N of Me-dake's summit.
Aerial observations were conducted in cooperation with the Japan Ground Self Defense Force on 13 December. Areas of snow melt corresponded to geothermal areas that had been previously identified. No new geothermal areas were found.
An M 2.6 earthquake on 27 December at 1234 local time occurred ~2 km W of Me-dake, with a maximum JMA Seismic Intensity of 1 in Senboku-city, Akita Prefecture. The JMA Seismic Intensity scale, used in Japan and Taiwan is classified into 10 categories; 0 to 4, 5 weak, 5 strong, 6 weak, 6 strong, and 7. The seismicity around the area had temporarily increased, but then returned to baseline levels. No volcanic activity related to this seismicity was observed.
JMA reported no activity at Akita-Komaga-take in 2012.
Geologic Background. Two calderas partially filled by basaltic cones cut the summit of Akita-Komagatake volcano. The larger southern caldera is 1.5 x 3 km wide and has a shallow sloping floor that is drained through a narrow gap cutting the SW caldera rim. On its northern side is a smaller more circular 1.2-km-wide caldera whose rim is breached widely to the NE. The two calderas were formed following explosive eruptions at the end of the Pleistocene, between about 13,500 and 11,600 years ago. Two cones, Medake and Kodake, occupy the NE corner of the southern caldera, whose long axis trends NE-SW. The Onamedake cone within the northern caldera has produced lava flows to the north and east; it has a 100-m-wide summit crater. Small-scale historical eruptions have occurred from cones and fissure vents inside the southern caldera. The temperatures of geothermal areas increased beginning in 2005, and some fumarolic plumes were observed in 2011-12.
Information Contacts: Japan Meteorological Agency (JMA), 1-3-4 Otemachi, Chiyoda-ku, Tokyo 100-8122, Japan (URL: http://www.jma.go.jp/jma/en).
Dona Juana (Colombia) — January 2013 Cite this Report
Dona Juana
Colombia
1.5°N, 76.936°W; summit elev. 4137 m
All times are local (unless otherwise noted)
Seismic swarm in 2010 and monitoring efforts
Doña Juana, a volcano in repose, is located ~50 km NE of Pasto, the provincial capital where the local Instituto Colombiano de Geología y Minería (INGEOMINAS) volcanic and seismic observatory is based (figure 1). In this report we discuss monitoring efforts that began as early as 2004, highlight elevated seismicity detected in mid-2010, and describe the relatively new national park which encompasses Doña Juana and two other volcanic centers (Petacas and Ánimas). Petacas is ~19 km NE of Doña Juana and Ánimas, 12.5 km NE. Ánimas lacks a clear Holocene age; however, Ánimas is an important landmark in this report because the recent seismicity is often found proximal to this volcano. Listed as a Quaternary volcanic center, Ánimas can be found in the "Preliminary List of Pleistocene Volcanoes" section of the Volcanoes of the World 3rd edition (Siebert and others, 2010).
Aerial observations and field investigations. Aerial observations had been collected since 2004 in collaboration with the Colombian Air Force (FAC). Overflights during clear conditions provided views of the lava domes and exposures of bare rock where high elevation and frequent rockfalls limit vegetation (figure 2). Remote sensing images of the region also captured the variations in vegetation and distribution of scree slopes (figure 3).
During 13-21 September 2006, INGEOMINAS led field investigations around Doña Juana. Four scientists focused on the area's stratigraphy and composition of volcanic deposits for development of a future hazard map as well as enhancing the knowledge of the volcano's eruptive history.
Monitoring stations. Three seismic stations were online in 2008: Lava, Florida, and Páramo (figure 4). The Páramo tiltmeter was also online in 2008. In 2009 two additional stations were online; La Cruz seismic station was installed in April and La Florida electronic tiltmeter was installed in June. In 2011, geochemical monitoring began at hot springs within 7 km of the edifice.
As of December 2012, the monitoring network consisted of four seismic stations, with radio repeaters linked to the Pasto network, and two electronic tiltmeters.
Hot spring investigations. INGEOMINAS routinely monitored six thermal springs located ~7 km N and SW from the summit (figure 4). There were three visits during 2011 (August, October, and December) and a visit in April 2012. Temperature and pH monitoring as well as geochemical analysis were the main goals for these investigations.
In their online April 2012 technical bulletin, INGEOMINAS noted that bicarbonate (HCO3) concentrations varied at all monitoring sites, and highest values were consistent between the Tajumbina (1,276-1,436 mg/L) and Ánimas II (1,159-1,229 mg/L) sites. Of all sites, Ánimas I showed an increase since August 2011 in both temperature (41.2°C to 55.3°C) and pH (6.5 to 6.83).
In April 2012, INGEOMINAS discovered a new hot spring location, Ánimas III. This site was within 1 km of Ánimas I, and at the time of sampling, had a neutral pH (7.02) and a lower temperature (56.6°C) compared to the neighboring Ánimas I and Ánimas II sites.
Seismicity. INGEOMINAS reported trends in local seismicity during 2009-2012 in technical bulletins available online. Limited seismicity was detected in 2009 and an abrupt change appeared in early 2010 (figure 5). Combined seismicity (volcano-tectonic, tremor, long period, hybrid, and a category noted as "VOL") tallied for 2010 produced an average of 241 events per month. INGEOMINAS assigned earthquakes to the "VOL" category if they did not meet the criteria of other earthquake types but could be distinguished by fracturing signals proximal to the volcanic edifice. Volcano-tectonic (VT) earthquakes occurred more frequently than other types, occurring on average 107 times per month.
Seismicity peaked in August 2010 owing to three VT swarms. That month the various earthquakes totaled more than 675 events. These were low-magnitude earthquakes (M 0-2.7) with relatively shallow depths (7-10 km below the summit).
The calculated locations of earthquakes were available for events during 2010-2012 (table 1). During this time period, epicenters were frequently dispersed between Doña Juana and Ánimas except for the mid-2010 activity and during January-February 2011. This record of information highlights the significance of August 2010 when VT earthquakes were clustered ~7 km NE of Doña Juana, slightly closer to the older volcanic edifice Ánimas (figure 6).
Table 1. During June 2010-December 2012, earthquake detection was sufficient for calculating magnitudes and locations. During several months (January-May 2010, June and October 2011, and September and November 2012) no locations were determined. "Notes" refer to epicenter characteristics such as clustering locations; "dispersed" events are those that occurred at various depths and distances from the volcanic centers. Courtesy of INGEOMINAS.
| Month |
Total Located |
Magnitude |
Depth (km below summit) |
Notes |
| Jun 2010 |
68 |
0.1-2.6 |
5-10 |
~5 km SW of Ánimas |
| Jul 2010 |
14 |
0.2-1.5 |
6-10 |
~5 km SW of Ánimas |
| Aug 2010 |
130 |
0-2.7 |
7-10 |
~5 km SW of Ánimas |
| Sep 2010 |
34 |
0.2-2.1 |
1-11 |
~5 km SW of Ánimas |
| Oct 2010 |
10 |
0.6-2.7 |
~7 |
dispersed |
| Nov 2010 |
5 |
1.1-2.3 |
3-6 |
dispersed |
| Dec 2010 |
7 |
0.2-1.8 |
4-10 |
dispersed |
| Jan 2011 |
59 |
0.1-3.1 |
3-14; 6-8 |
~8 km SW of Ánimas; many earthquakes clustered at 6-8 km depth |
| Feb 2011 |
1 |
1.2 |
7 |
2 km SW of Ánimas |
| Mar 2011 |
7 |
0.5-2.1 |
15-50 |
between Doña Juana and Ánimas |
| Apr 2011 |
2 |
-- |
5.7-6.5 |
between Doña Juana and Ánimas |
| May 2011 |
2 |
0.4, 1.7 |
8, 11 |
dispersed |
| Jun 2011 |
-- |
-- |
-- |
-- |
| Jul 2011 |
9 |
0.3-1.1 |
6-12 |
some clustering near Ánimas |
| Aug 2011 |
7 |
-- |
4-15 |
between Doña Juana and Ánimas |
| Sep 2011 |
1 |
0.7 |
4 |
between Doña Juana and Ánimas |
| Oct 2011 |
-- |
-- |
-- |
-- |
| Nov 2011 |
9 |
0.3-1.5 |
3-8 |
between Doña Juana and Ánimas |
| Dec 2011 |
2 |
0.9, 1.7 |
4-6 |
between Doña Juana and Ánimas |
| Jan 2012 |
16 |
0.3-1.5 |
1-19 |
between Doña Juana and Ánimas |
| Feb 2012 |
5 |
0.9-1.7 |
2-8 |
between Doña Juana and Ánimas |
| Mar 2012 |
2 |
0.8, 1.3 |
7 |
between Doña Juana and Ánimas |
| Apr 2012 |
5 |
0.4-1.3 |
0-18 |
dispersed |
| May 2012 |
7 |
0.5-1.4 |
3-9.5 |
dispersed |
| Jun 2012 |
20 |
0-2.3 |
1-14 |
dispersed |
| Jul 2012 |
13 |
0.7-1.9 |
1-14 |
dispersed |
| Aug 2012 |
6 |
0.2-1.9 |
0-14.5 |
SW of Doña Juana |
| Sep 2012 |
-- |
-- |
-- |
-- |
| Oct 2012 |
4 |
0.7-1.3 |
0-20 |
SW of Doña Juana |
| Nov 2012 |
-- |
-- |
-- |
-- |
| Dec 2012 |
2 |
1.1, 0.7 |
2, 20 |
~10 km S of Doña Juana |
Colombia's 52nd Natural National Park. In 2007, the Doña Juana-Cascabel Volcanic Complex Natural National Park was created both by the Ministry of Environmental, Housing and Territorial Development and the Colombian Natural National Parks (figure 7). This included Doña Juana, Ánimas, and Petacas volcano (located ~19 km NE of Doña Juana) within the 65,858 hectares of preserved land. Within this densely forested region, a series of streams and waterfalls was locally known as El Cascabel. The park was developed to protect diverse flora and fauna, including numerous endangered species such as the Andean condor, the Moor tapir, the spectacled bear, and puma; approximately 11% of the park includes alpine terrain.
References. Department of the Environment, Housing and Territorial Development Special Administration Unit of the system of Natural National Parks (UAESPNN), 2008, Doña Juana-Cascabel Volcanic Complex Natural National Park (PNN CVDJ-C) Management Plan 2008-2013, Popayán, Colombia, July 2008.
Siebert L., Simkin T., and Kimberly P., 2010, Volcanoes of the World, 3rd edition, University of California Press, Berkeley, 558 p.
Geologic Background. The forested Doña Juana stratovolcano contains two calderas, breached to the NE and SW. The summit of the andesitic-dacitic volcano is comprised of a series of post-caldera lava domes. The older caldera, open to the NE, formed during the mid-Holocene, accompanied by voluminous pyroclastic flows. The younger caldera contains the active central cone. The only historical activity took place during a long-term eruption from 1897-1906, when growth of a summit lava dome was accompanied by major pyroclastic flows.
Information Contacts: Instituto Colombiano de Geologia y Mineria (INGEOMINAS), Observatorio Vulcanológico y Sismológico de Pasto, Pasto, Colombia (URL: https://www2.sgc.gov.co/volcanes/index.html); WWF Colombia (URL: http://www.wwf.org.co/?109882/Nuevo-Parque-Nacional-Natural-en-el-piedemonte-Andino-Amazonico-colombiano); Doña Juana-Cascabel Volcanic Complex National Natural Park (URL: http://www.parquesnacionales.gov.co/).
Heard (Australia) — January 2013 Cite this Report
Heard
Australia
53.106°S, 73.513°E; summit elev. 2745 m
All times are local (unless otherwise noted)
Satellite imagery reveals lava flows in December 2012
We received an informal report from Matt Patrick (Hawaiian Volcano Observatory) on a new eruptive episode at Big Ben volcano, Heard Island (figure 16). He noted that MODVOLC thermal alerts reappeared at Heard in September 2012 after a four year hiatus (the last eruptive episode ended on 2 March 2008; BGVN 33:01), suggesting the start of a new eruptive episode at the volcano. Since Heard Island is unsettled and extremely isolated, monitoring of the volcano is possibly primarily through satellite imagery (Patrick, 2013).
EO-1 Advanced Land Imager images collected through late 2012 and early 2013 confirm that eruptive activity resumed around September 2012, in the form of a low-level effusive style eruption similar to its other recent eruptions (figures 17 and 18). Patrick noted that the vent crater had enlarged significantly over the four years following the end of the last eruptive phase, March 2006-March 2008.
The 15 December 2012 image in figure 17 shows that a short lava flow from the summit was emplaced on the SW flank. The flow was ~420 m long and had two lobes. By 28 December, a flow consisting of two lobes (presumably the same flow as in the 15 December image) had reached 770 m SW of the summit crater. In the 5 January 2013 image this flow was 780 m long and had changed little over the previous week.
Figure 18 shows that the 9 September and 13 October 2012 images suggested active lava contained with the summit crater. The 15 and 28 December 2012 images showed elevated temperatures on the lava flow SW of the summit, suggesting it was active over this interval, which was consistent with the observed elongation of the flow in the visible images. Fewer high-temperature pixels in the 5 January 2013 image and the meager advancement observed in the visible images, suggested that the flow had stalled by this point.
Overall, the activity as of mid-March 2013 had consisted of lava within the crater and a lava flow of at least 770 m long emplaced SW of the crater. This low-level effusive activity is consistent with the previous three eruptive episodes observed in satellite images at Heard Island (Patrick and Smellie, in review). These three episodes, May 2000-November 2001 (BGVN 25:11, 26:02, 26:03, and 28:01), June 2003-July 2004 (BGVN 29:12), and March 2006-March 2008 (BGVN 31:05, 31:11, 32:03, 32:06, 33:01, and 35:09), each lasted 1-2 years. On this basis, Patrick suggested that this new eruptive episode may persist for a similar duration. MODVOLC thermal alerts were measured nearly continuously from 21 September 2012 through 24 February 2013.
References. Patrick, M., 2013, A new eruptive episode at Big Ben Volcano, Heard Island, informal communication to BGVN, 23 February 2013.
Patrick, M.R., and Smellie, J.L., in review, A spaceborne inventory of volcanic activity in Antarctica and southern oceans, 2000-2010, Antarctic Science, in review in 2013.
Geologic Background. Heard Island on the Kerguelen Plateau in the southern Indian Ocean consists primarily of the emergent portion of two volcanic structures. The large glacier-covered composite basaltic-to-trachytic cone of Big Ben comprises most of the island, and the smaller Mt. Dixon lies at the NW tip of the island across a narrow isthmus. Little is known about the structure of Big Ben because of its extensive ice cover. The active Mawson Peak forms the island's high point and lies within a 5-6 km wide caldera breached to the SW side of Big Ben. Small satellitic scoria cones are mostly located on the northern coast. Several subglacial eruptions have been reported at this isolated volcano, but observations are infrequent and additional activity may have occurred.
Information Contacts: Matt Patrick, Hawaiian Volcano Observatory (HVO), U.S. Geological Survey, PO Box 51, Hawai'i National Park, HI 96718, USA (URL: https://volcanoes.usgs.gov/observatories/hvo/); Australian Antarctic Data Centre, Department of the Environment and Heritage, Commonwealth of Australia (URL: https://data.aad.gov.au/database/mapcat/heard/heard_island.gif); MODVOLC, Hawai'i Institute of Geophysics and Planetology (HIGP) Thermal Alerts System, School of Ocean and Earth Science and Technology (SOEST), Univ. of Hawai'i, 2525 Correa Road, Honolulu, HI 96822, USA (URL: http://modis.higp.hawaii.edu/).
Nevado del Huila (Colombia) — January 2013 Cite this Report
Nevado del Huila
Colombia
2.93°N, 76.03°W; summit elev. 5364 m
All times are local (unless otherwise noted)
Dome growth and displaced glacier in 2009; decreasing activity during 2010-2012
Lava dome emplacement occurred at Nevado del Huila's Pico Central (central peak) in late 2008, and was accompanied by seismic unrest and significant sulfur dioxide (SO2) emissions (BGVN 37:10). Extrusion continued between November 2008 and November 2009. Ash plumes were frequently observed by webcameras during late 2008 to December 2009, and satellite imagery reviewed by the Washington Volcanic Ash Advisory Center (VAAC) detected intermittent ash emissions between October 2009 and April 2011. From January 2009 to December 2012, the Instituto Colombiano de Geología y Minería (INGEOMINAS) reported persistent emissions from the lava dome and dramatic changes to the perched glacier as the lava dome expanded across the E and W flanks. Activity generally decreased in November 2010 through 2012.
In this report, we focus on the time period of December 2008-December 2012 and also discuss monitoring efforts overseen by INGEOMINAS with collaborators such as the Colombian Air Force (FAC), the Washington VAAC, and the Sulfur Dioxide Group's Ozone Monitoring Instrument (OMI). The following subsections review webcamera and aerial observations, thermal-camera imaging, satellite images of volcanic plumes, seismicity, SO2 measurements (DOAS, Flyspec, and OMI), acoustic flow monitoring, and new tilt data. The local monitoring network was expanded during this reporting period, adding two infrasound monitoring stations in 2009 and 2012, two webcameras in 2010 and 2012, and instrumentation at the Caloto site that included a broadband seismometer and an electronic tilt station in 2012.
Web-camera observations. From December 2008 to December 2009, the Tafxnú web-camera (located ~15 km S of the volcanic edifice) frequently recorded gas-and-ash plumes rising higher than 2,000 m above the active dome (figure 26). In 2009, plumes (frequently ash-and-gas, but in some cases gas without ash) rose to maximum heights above the dome as follows: 1,000-2,000 m in June; 1,000-2,500 m in November; and 2,000-5,000 m in December.
An additional camera was brought online in July 2010, located in the town of Maravillas (~10 km SE). A third camera, located at the Caloto site (~4 km SSW of the active dome) came online in July 2012 (figures 27 and 28).
Observations of dome growth and summit activity during 2009-2010. With support from the Colombian Air Force (FAC) during 2009-2012, INGEOMINAS monitored dome growth and geomorphological changes at Huila by conducting aerial observations with helicopters.
During February 2009 and June-December 2009, INGEOMINAS reported numerous episodes of tremor that were likely associated with ash emissions, but cloud cover and nightfall sometimes precluded direct observations. Notable ash plumes were observed on 11 February, 23 July, 3 August, 16-23 October, and 3, 9, 12, 13 and 15 November; ashfall was noted by observers on all days except 11 February. A crack that had formed along the N face of Pico Central in 2007 continued to steam during this time period.
During three overflights conducted in January 2009, INGEOMINAS determined that the Pico Central lava dome had grown since November 2008. With repeat aerial photography, scientists calculated a total dome volume of 52 x 106 m3 with dimensions of 1,000 m N-S and 250 m E-W. The fresh dome rock continuously degassed (figure 29). Tafxnú webcamera images also showed that gas emissions frequently rising above Pico Central were often blue-colored. Due to continued unrest at Nevado del Huila (note that this name is shortened to 'Huila' during the remainder of this report), especially seismicity and active dome growth at Pico Central, INGEOMINAS maintained Orange Alert (Alert Level II; the second highest Alert Level on a 4-color scale from Green/IV-Yellow/III-Orange/II-Red/I) during January-February 2009.
On 11 February 2009, a small pulse of tremor was accompanied by an ash plume discharged at Pico Central which was captured by the Taxfnú webcamera during 0745-0751. During that time period, INGEOMINAS noted a small pulse of tremor. On 23 February, an INGEOMINAS passenger on a commercial aircraft saw diffuse gas escaping from both the crater that hosts the dome and from the N-flank crack. During March, the webcamera frequently showed degassing from the crater and the lava dome. Clear conditions enabled observers on commercial flights to observe a white plume rising from Pico Central in the morning of 10 March. INGEOMINAS noted that both seismicity and remote observations of dome growth indicated decreased activity since February. Accordingly, on 31 March 2009, INGEOMINAS reduced the Alert Level to Yellow (II).
Aerial observations in April highlighted the presence of ash covering the S glacier, confirming the ongoing eruption. Elevated temperatures were concentrated at the extreme high and low points of the dome and degassing continued from the higher-elevation portion of the crater (figure 30).
During May and June 2009, the dome's surface continued to produce thermal anomalies, and dome growth was inferred based on the observable fragmentation of dome rock and a wider distribution of fresh material. INGEOMINAS noted that the color of the extruded material in the higher region of the dome had changed to a red-brown color (earlier dome rock was distinctively gray).
On 23 July ashfall was reported at the local military base in Santo Domingo and José Jair Cuspian (Caloto). They reported ashfall in the NW sector of the volcanic edifice. INGEOMINAS reported that this ash event coincided with a pulse of tremor registered that day at 0442.
On 3 August there was a pulse of tremor at 0036 and INGEOMINAS received reports of ashfall in the municipalities of Toribío and Santander de Quilichao (~30 km and ~50 km W of the edifice, respectively). Aerial observations on 16 August established that the crater had grown wider.
During September 2009 there were no major changes observed via webcam. On 16 and 23 October, reports of widespread ashfall came from various municipalities of N Cauca, Valle del Cauca, and in the foothills around the volcano (departments of Cauca, Valle, Tolima, and Huila) (figure 31). There were also reports of sulfur odors from the most proximal communities.
At 0541 on 16 October 2009, the webcamera captured images of an ash plume rising in pulses from Pico Central and drifting E. Accordingly, the Alert Level was raised from Yellow (III) to Orange (II), where it stayed until 5 January 2010. An overflight on 23 October provided views of both intense fumarolic activity from the dome and a column of ash that reached up to 1,000 m above the crater. The summit and glaciers were covered by ashfall, lava extrusion was continuing from the upper region of the crater, and there were thermal anomalies where gas emissions were concentrated. An 11-minute-long episode of tremor that began at 0200 on 28 October was thought to signify dome rock extrusion.
Based on observations during overflights on 30 October and 2 November, INGEOMINAS calculated that the dome volume had increased by ~9 x 10⁶ m3 since the previous estimate in January 2009. Aerial observers saw ash emitted in pulses.
Rapid dome growth occurred in November as witnessed during five aerial investigations (2, 4, 6, 10, and 25 November). On 3 November, an explosion was heard and ashfall was reported by the communities of Inzá, Mosoco, Jambaló y Belalcázar, and other communities SW of the volcano. New layers of ash had accumulated around the summits of Huila, often appearing brown-red as opposed to the gray material deposited in previous months (figure 32). A weekly INGEOMINAS report announced that by 10 November 2009, the dome volume had increased by ~16 x 106 m3 since the previous estimate, more than doubling the amount of growth that had occurred during January-October 2009.
Gas emissions were observed by the webcamera at Tafxnú and during four overflights in December 2009; however, fumarolic activity dropped during the first week of December. Aerial observations determined that 2008 dome rock was being covered by 2009 lava that contained fewer large blocks; the 2008 dome material was distinctively more gray and blocky. During an overflight on 29 December, clear weather allowed INGEOMINAS scientists to observe minor dome collapse events, new cracks in the glacier along the lower E dome contact, and additional dome rock extending down the E flank.
In January 2010, dome growth continued and notably expanded the dome E by ~50 m, further displacing portions of the Pico Central glacier. Gray ash continued to be deposited in the area, covering the glacier surfaces. White plumes were observed this month during overflights and from the webcamera. On 5 January, INGEOMINAS reduced the Alert Level from Orange (II) to Yellow (III); this status was maintained until 15 June 2010.
On 22 February 2010, scientists on board an FAC helicopter noted displaced glacial ice, some steaming along the dome edge, and the surface textures of the 2008 and 2009 lava domes persisted (blocky vs. smaller clast sizes, respectively; figure 33). Based on aerial observations, INGEOMINAS calculated a total dome volume of at least 70 x 106 m3.
INGEOMINAS reported that on 12 April additional ash had accumulated on the glacier and lava extrusion was continuing. Columns of gas continued to be emitted from the surface of the new dome, at the contact of 2008 and 2009 lava, and from the crack that had formed in 2007 on the N flank of Pico Central.
No overflights were conducted in June, however the Alert Level was raised to Orange (II) due to increased seismicity, primarily hybrid earthquakes and SO2 emissions (see seismic and SO2 discussion below). INGEOMINAS suggested that the marked increase in hybrid earthquakes may have been linked with the ascent of new magmatic material within the volcanic edifice.
In July, degassing continued and intermittent, small ash emissions were observed toward the end of the month by the ground-based cameras Tafxnú and Maravillas. By 16 July, INGEOMINAS reduced the Alert Level to Yellow (III), due to the reduction in seismicity and SO2 flux, where it remained through August. The Washington VAAC reported possible ash plumes drifting from Huila during 28-30 of July but an absence of such plumes during August.
A 19 August flight revealed that snow had accumulated on the dome. INGEOMINAS noted that some episodes of tremor were likely related to the process of lava dome extrusion and these conditions did not show wide variations in August. Minor ash emissions were reported toward the end of the month. The Maravillas camera detected incandescence on 26 and 29 August, possibly from hot rockfalls from the lava dome.
A pulse of tremor on 30 August at 0635 coincided with ash emissions also observed by the Tafxnú camera. In the afternoon that day, people in the town of Toribío (~30 km W) noted an ash plume. There was also a report that the Símbola River changed color due to the presence of ash. The VAAC noted a hotspot at the summit in satellite images on 31 August.
During September, webcameras imaged plumes of gas as well as gray and reddish-colored emissions attributed to volcanic ash. These plumes were not visible in satellite imagery; however, the Washington VAAC released two notices on 9 September in response to reports from INGEOMINAS that ground-based observations included continuous emissions of gases and some ash.
During the first week of September, the Maravillas webcamera and local populations observed incandescence from the active dome; INGEOMINAS attributed the activity to hot rockfalls on the dome. On 9 September, INGEOMINAS raised the Alert Level to Orange (II); seismicity (particularly energetic tremor) and frequent incandescence were considerations for this announcement. On 9 September, both webcameras captured images of ash and incandescence. On 10 September, drumbeat earthquakes (earthquake signatures related to dome extrusion) had appeared in the seismic records. The last time that drumbeat earthquakes had been detected from Huila was in November 2008 (BGVN 37:10). By 21 September, INGEOMINAS announced that 1,799 drumbeat earthquakes had been detected over the past 13 days.
An overflight on 15 September determined that conditions at the dome were continuing to change; extrusion continued from the highest part of the dome (near the contact with the crater wall). They also observed a debris flow containing rocks and ice that had originated from the edge of the dome and had traveled ~1.5 km down the E flank (figure 34). By the end of the month, gas emissions continued and incandescence was observed by the webcameras.
Aerial observations on 29 September, 1 October, and 4 November confirmed ongoing dome growth. On 1 October, the VAAC reported ash drifting from the summit. On 12 October, INGEOMINAS reduced the Alert Level to Yellow (III); they stated that conditions appeared to have stabilized, in particular local seismicity and gas-and-ash emissions. The webcameras continued to capture images of white gas emissions during the second week of October. White plumes and some incandescence were visible in October. Thermal images from 4 November found that the W-central dome's temperature was 250°C. On 11 November the Washington VAAC reported ash drifting from the summit.
Observations during January-December 2011. The webcameras continued to record images of white plumes rising from the Pico Central dome throughout 2011. Aerial observations during the year noted frequent gas emissions and infrequent ash plumes. During an overflight on 25 January, a FLIR camera detected temperatures up to 90°C from various locations on the dome (figure 35). During an overflight on 29 March, observers noted degassing and odors of sulfur.
On 19 April, the Washington VAAC reported that an ash plume was detected in enhanced multispectral imagery at 0315. The plume was drifting NNW from Huila. The announcement included a note that the ash plume did not appear to be the result of an explosive event. Later that day, after sunrise, INGEOMINAS confirmed that low seismicity was detected, a white plume was visible, but ash emissions were absent.
Aerial observations on 26 April included intense degassing from the NW side of the lava dome; the emissions were gray. A thermal camera detected temperatures of the dome in the range of 78-83°C. The glacier also appeared to have further deformed since the last aerial observations in March.
In May, degassing was observed with the webcameras on days where weather conditions permitted clear views. On 6 and 20 June, scientists confirmed that degassing continued during an overflight; they also observed the accumulation of snow on the lava dome as well as on the surrounding glacier. On 20 June, notable rockfalls were visible from the lava dome that contributed to scree along the dome's lower edges.
Degassing continued to appear in clear webcamera views and during overflights in June-July and September-December. Aerial observers on 22 October saw snow avalanches on the Pico Norte glacier and intense steaming from the upper regions of the dome.
Observations during January-December 2012. Throughout 2012, INGEOMINAS recorded observations of the dome based primarily on webcamera images. No major changes were noted in the weekly and monthly online reports; pervasive steaming and white plumes were frequently observed throughout the year by the two webcameras (Tafxnú and Maravillas). INGEOMINAS maintained Yellow Alert (III) during 2012.
One overflight was conducted by INGEOMINAS in 2012. On 14 January 2012, scientists observed the usual degassing and noted that snow had collected on the dome and glacier. That day's clear viewing conditions allowed detailed observations of the lava dome texture and INGEOMINAS attributed the spiny texture of the dome to late-stage extrusion (figure 36).
Declining seismicity during January-August 2009. During 2009, four seismometers (two broadband and two short-period stations) were maintained by INGEOMINAS. Ash emissions in October 2009 temporarily disabled the short-period Verdún 2 station, located ~5 km N of the active dome. The Cerro Negro short-period station, closest to the active dome, was not operating during this reporting period (2009-2012). In general, three to four seismic stations were operating during 2009-2012.
In 2009, a total of nine earthquakes were large enough for people nearby to feel shaking; these events had magnitudes between 2.8 and 4.8 with focal depths between 6.2 and 12 km. The epicenters were 3-25 km away from the closest seismic station, CENE, which was located ~3 km S of Pico Central. INGEOMINAS highlighted these earthquakes in their monthly technical bulletins.
From January to September 2009, INGEOMINAS reported a decreasing trend in seismicity. In particular, volcano-tectonic (VT) and long period (LP) earthquakes were becoming less frequent on a monthly basis (figure 37). INGEOMINAS described VT earthquakes as resulting from rock-fracturing events, and LP earthquakes from fluid transport processes within the volcanic edifice. Large daily counts of LP earthquakes generally became less frequent over time. Low levels of tremor, hybrid events, and superficial activity (rockfalls and explosions) were detected throughout this time interval.
Clustered epicenters in 2009. Beginning in January 2009, INGEOMINAS described a clustering of seismicity notable in distinct regions of the volcanic edifice. These consisted of three regions, the SW sector, the SE sector, and beneath the central edifice (Pico Central). This pattern was particularly clear in June, October, and December. The June 2009 map of seismicity appears in figure 38. The deepest earthquakes (8-12 km) tended to occur S of the edifice while shallow events were distributed throughout the area. Several deep and distal earthquakes occurred each month with depths between 10-20 km and epicenters up to 25 km from the edifice; these events have been attributed to regional faults.
Peaks in seismicity and ash emissions between October 2009 and May 2010. INGEOMINAS reported an abrupt increase in seismicity in October 2009. The occurrence of VT, LP, hybrid, and tremor events had more than doubled since September. On 12 October, a swarm of VT events was detected (figure 39). During the onset of elevated seismicity, INGEOMINAS reported ash emissions during 17-21 October and the Washington VAAC released reports of ash observations from satellite imagery on 16 October.
The appearance of volcanic ash in satellite images was periodically reported by the Washington VAAC from October through mid-November 2009. Aided by the web-camera Tafxnú, INGEOMINAS reported observations of ash plumes frequently occurring through November.
The Washington VAAC reported that, after 15 November 2009, volcanic ash was no longer visible in satellite images. In their monthly technical report, INGEOMINAS noted seismic signals suggesting ash emissions in December 2009, and visual observations of white plumes from the summit that were inferred to be gas-rich. As seen on figure 39, LP events peaked dramatically during 9-10 December when signals characterized as drumbeats were detected (see BGVN 37:10 for additional descriptions of drumbeat earthquakes). INGEOMINAS suggested the onset of drumbeat earthquakes was associated with the extrusion of new material to the surface and growth of the lava dome.
INGEOMINAS reported an average of 995 LP earthquakes per month during January-March 2010. VT events tallied on a monthly basis averaged 239 during that same time interval, suggesting an absence of discernible major changes in the volcanic system since the drumbeat earthquake swarm in December 2009. Tremor was detected more frequently over time and from February to May an average increase of 37 events per month was recorded.
As seen at the right on figure 39, during April-May 2010, very high LP seismicity returned. LP earthquakes peaked in May, with a total of 5,141 events. During April-May, the Washington VAAC released advisories in response to possible ash plumes from Huila, however, they did not detect ash due to frequent cloud cover, and because numerous reports indicated eruptions at night, when satellite instruments offer fewer means of detecting ash.
An ML 3.8 earthquake shook the towns of Toéz and Tálaga (15 km SSW and 22 km S respectively) at 0708 on 23 May. These towns are located SW of Pico Central. The earthquake was located 8.13 km SW of Pico Central and was 7.2 km deep (relative to the elevation of the active crater).
Seismicity and ash observations during June-December 2010. In June, direct observations of ash plumes were rare due to weather conditions; however, the Washington VAAC reported ash visible in satellite imagery on 2 June 2010. While LP seismicity remained low in early June 2010, hybrid seismicity emerged from background levels (figure 40). During January-May, typically 3-34 hybrid earthquakes were detected per month. By 14 June, more than 200 hybrid events were occurring per day; however, by 24 June, hybrid earthquakes had decreased to less than 50 events per day. Hybrid earthquakes, events INGEOMINAS attributes to the combined mechanisms of fluid transport and rock fractures, rarely dominate Huila's seismic records.
As seen on figure 40, during August-November 2010, elevated tremor persisted (630-2,576 episodes per month). LP seismicity peaked in May and then twice between September and December. For the tallest peak (September 2010), counts reached more than 1,000 events per day.
On 3 December at 2054 a felt M 3.4 earthquake within the Páez River drainage centered 6.2 km S of Pico Central had a relatively shallow focal depth of 5.2 km (as measured beneath the crater). Another felt earthquake was reported by residents in the Belalcázar-Cauca area on 29 December. This ML 2.9 event occurred at 2106 with a focal depth of 8 km, located 8.5 km SW of Pico Central. This earthquake lacked any noticeable effect on the stability of the volcanic system.
Seismicity in 2011. In 2011, INGEOMINAS noted that both LP earthquakes and tremor were decreasing over time (figure 41). Tremor persisted at low levels. In June VT and LP earthquakes notably increased to 434 and 623 events, respectively, but returned to background levels during the following month.
In November 2011, several moderate earthquakes (M≤4) struck near Huila. In particular, three events had magnitudes 2.8, 3.2, and 4.0. For example, on 26 November, inhabitants of Mesa de Toéz felt an M 4.0 event whose epicenter was 8.5 km SW of Pico Central with a depth of 7.4 km (as measured below the crater). VT epicenters in November were widely distributed throughout the edifice and local region (figure 42). Depths of these earthquakes were within the range of past VT earthquakes (0-12 km). Persistent seismicity SW of Huila also continued in November.
Seismicity in 2012. The low-level seismicity observed in the last months of 2011 continued through 2012. In a comparison with 2011, the average number of events per year was remarkably reduced in 2012 (VT, LP, and tremor); hybrid earthquakes, however, were the exceptions. The average for hybrid earthquakes per month was slightly higher in 2012 (table 4). Hybrid earthquakes were quite variable in number during 2011, ranging from 0 to 60 per month.
Table 4. Monthly counts for volcanic-tectonic, long period, tremor, and hybrid events detected at Nevado del Huila during 2011-2012. More event types and data appear in INGEOMINAS online reports. Courtesy of INGEOMINAS.
| Month |
Volcanic-tectonic |
Long-period |
Tremor |
Hybrid |
| Jan 2011 |
284 |
388 |
220 |
2 |
| Feb 2011 |
217 |
1,064 |
154 |
15 |
| Mar 2011 |
217 |
876 |
168 |
13 |
| Apr 2011 |
168 |
634 |
152 |
0 |
| May 2011 |
136 |
729 |
220 |
0 |
| Jun 2011 |
434 |
623 |
128 |
60 |
| Jul 2011 |
165 |
416 |
77 |
25 |
| Aug 2011 |
143 |
491 |
51 |
32 |
| Sep 2011 |
137 |
304 |
27 |
8 |
| Oct 2011 |
110 |
371 |
50 |
13 |
| Nov 2011 |
176 |
219 |
32 |
2 |
| Dec 2011 |
164 |
195 |
32 |
34 |
| 2011 Avg: |
196 |
526 |
109 |
17 |
| |
| Jan 2012 |
155 |
245 |
27 |
28 |
| Feb 2012 |
111 |
159 |
12 |
18 |
| Mar 2012 |
145 |
200 |
27 |
21 |
| Apr 2012 |
154 |
244 |
19 |
21 |
| May 2012 |
87 |
200 |
34 |
13 |
| Jun 2012 |
121 |
183 |
11 |
18 |
| Jul 2012 |
109 |
208 |
14 |
16 |
| Aug 2012 |
118 |
178 |
15 |
30 |
| Sep 2012 |
93 |
172 |
5 |
14 |
| Oct 2012 |
168 |
257 |
18 |
23 |
| Nov 2012 |
171 |
205 |
9 |
14 |
| Dec 2012 |
158 |
227 |
26 |
32 |
| 2012 Avg: |
133 |
207 |
18 |
21 |
The wide distribution of epicenters noted in November and December 2011 persisted during January-February 2012, but fewer earthquakes were detected during these months. From March through December, significant clustering was absent, although, in October some events appeared concentrated along Huila's N-S axis.
The largest earthquake in 2012 occurred in March; a 3.8 earthquake shook the town of Toribio (in Cauca) at 0248 on 15 March. The epicenter was 1.8 km E of Pico Central with a focal depth of approximately 3.2 km. Seismicity that month was slightly higher than February (table 4). Throughout the year, VT earthquakes were typically less than M 2.6.
Infrasound monitoring 2009-2012. Augmenting seismic monitoring efforts, an infrasound station installed at the Diablo monitoring site (located ~5 km NNW of the active dome) became operational in July 2009. An additional acoustic monitoring system was installed at the Caloto station (located ~3.7 km from the active dome) in May 2012. Data collected with infrasonic microphones complements seismic instrumentation and can be analyzed with similar techniques. The method has also detected distant explosions from volcanoes such as Sakura-jima, Japan (BGVN 20:08), Fuego, Guatemala (BGVN 36:06), and Stromboli, Italy (BGVN 26:07).
Sulfur dioxide emissions during 2009-2012. INGEOMINAS conducted routine sulfur dioxide (SO2) gas monitoring with differential optical absorption spectroscopy (DOAS) equipment from January 2009 through December 2012. With this mobile scanner, INGEOMINAS conducted traverses along the Pan-American Highway between the cities of Calí and Popayán (figure 43).
Scanning DOAS systems at fixed locations were operating during 2009-2012. During October 2009, elevated SO2 emissions were detected by the Calí and Santander de Quilichao stations (figure 44). In September 2009, a station was operating in Manantial (~53 km W of Huila).
Wind velocity has a strong bearing on the computed SO2 flux. In their December 2011 technical bulletin, INGEOMINAS discussed the variability in windspeed and direction, including the Weather Research and Forecasting (WRF) modeling system used for calculations during 2011 (figure 45). The WRF was public domain software available online and was developed in order to provide atmospheric simulations based on numerical modeling.
In May and August 2012, INGEOMINAS reported the results from FLYSPEC (a portable UV spectrometer) surveys and discussed the variations observed in SO2 flux. They emphasized that SO2 fluxes were low, a finding consistent with previous measurements during this post-crisis period (dome growth had ceased by November 2009). They also mentioned that seismicity had been low in May 2012, particularly in those events related to fluid motion (LP earthquakes, for example).
Flux calculations required wind speed data from the WRF models and daily forecasts from the Institute of Hydrology, Meteorology, and Environmental Studies (IDEAM), Colombia. Wind speeds in the range of 6-12 m/s during 8-29 May 2012 were applied to SO2 flux calculations.
Elevated SO2 emissions from Huila were detected almost daily by the OMI spectrometer during 2009-2012. The AURA satellite maps SO2 in the atmospheric column using ultraviolet solar backscatter. A flux can be estimated for the OMI spectrometer data by looking at the total mass of SO2 measured and the time it took to accumulate. On this basis, INGEOMINAS compared peaks in SO2 flux detected during traverses with DOAS (mobile and scanning) with OMI data for October 2009 (figure 46).
Lahar investigations. INGEOMINAS maintained seven early warning systems to warn of downstream flooding in vulnerable municipalities such as Belalcázar. At sites within the drainages of the Páez and Símbola rivers, flow monitoring with geophones has continued since October 2006, employing equipment installed by the INGEOMINAS Popayan Observatory in collaboration with the Nasa Kiwe Corporation (CNK). CNK is a relief group that has been active in this area of Colombia since the 1994 earthquake and resultant landslides that devastated the Cauca and Huila regions, including communities along the Páez river (BGVN 19:05). Those events also damaged the Tierradentro archaeological sites, a UNESCO World Heritage Site since 1995.
Following Huila's 2007 lahars (BGVN 33:01), Worni and others (2012) conducted fieldwork and reconstructed events in order to model future lahars for mitigation purposes. The researchers argued that large-volume lahars (tens to hundreds of millions of cubic meters) require targeted studies. The authors noted that "in 1994, 2007, and 2008, Huila volcano produced lahars with volumes of up to 320 million m3." To constrain the dimensions of simulated flows, they used inundation depths, travel duration, and observations of flow deposits from the April 2007 events and applied the two programs LAHARZ and FLO-2D for lahar modeling.
LAHARZ was developed by USGS scientists in order to provide a deterministic inundation forecasting tool; this program was designed to run in a Geographic Information System (GIS) environment (Schilling, 1998; Iverson and others, 1998). "For user-selected drainages and user-specified lahar volumes, LAHARZ can delineate a set of nested lahar-inundation zones that depict gradations in hazard in a manner that is rapid, objective, and reproducible" (Schilling, 1998). Worni and others (2012) presented results from the semi-empirical LAHARZ models along with physically-based results from FLO-2D (FLO-2D Software I, 2009) in order to forecast future inundation areas with specified flow volumes (figure 47). The authors concluded that, despite local deviations, the two models produced reasonable inundation depths (differing by only 10%) and encouraged future investigations that could address sources of uncertainty such as the effects of sediment entrainment that would cause dynamic changes in lahar volumes.
Deformation monitoring during 2009-2012. An electronic tilt station was operating in July 2009, located at the Diablo monitoring site ~6.26 km NW of Pico Central (4.1 km above sea level). Telemetered data from a new electronic tilt station became available in May 2012; the station was located in the town of Caloto, located ~4 km SSW of Pico Central (4.2 km above sea level). Data from Diablo and Caloto was presented in the monthly technical bulletins posted online by INGEOMINAS.
After seven months of calibrations, INGEOMINAS developed an initial baseline for the new tilt data. The N and E components of Caloto recorded minor fluctuations during this time period. The trend of the E component was generally stable while the N component detected a gradual excursion during 17 June-25 September 2012.
References. FLO-2D Software I, 2009, FLO-2D User's Manual. Available at: www.flo-2d.com.
Iverson, R.M., Schilling, S.R, and Vallance, J.W., 1998, Objective delineation of areas at risk from inundation by lahars, Geological Society of America Bulletin, v. 110, no. 8, pg. 972-984.
Schilling, S.P, 1998, LAHARZ: GIS programs for automated mapping of lahar-inundation hazard zones, U.S. Geological Survey Open-File Report 98-638, 80 p.
Worni, R., Huggle, C., Stoffel, M., and Pulgarín, B., 2012, Challenges of modeling current very large lahars at Nevado del Huila Volcano, Colombia, Bulletin of Volcanology, 74: 309-324.
Geologic Background. Nevado del Huila, the highest peak in the Colombian Andes, is an elongated N-S-trending volcanic chain mantled by a glacier icecap. The andesitic-dacitic volcano was constructed within a 10-km-wide caldera. Volcanism at Nevado del Huila has produced six volcanic cones whose ages in general migrated from south to north. The high point of the complex is Pico Central. Two glacier-free lava domes lie at the southern end of the volcanic complex. The first historical activity was an explosive eruption in the mid-16th century. Long-term, persistent steam columns had risen from Pico Central prior to the next eruption in 2007, when explosive activity was accompanied by damaging mudflows.
Information Contacts: Instituto Colombiano de Geologia y Mineria (INGEOMINAS), Observatorio Vulcanológico y Sismológico de Popayán, Popayán, Colombia; Washington Volcanic Ash Advisory Center (VAAC), NOAA Science Center Room 401, 5200 Auth road, Camp Springs, MD 20746, USA (URL: http://www.ospo.noaa.gov/Products/atmosphere/vaac/); Ozone Monitoring Instrument (OMI), Sulfur Dioxide Group, Joint Center for Earth Systems Technology, University of Maryland Baltimore County (UMBC), 1000 Hilltop Circle, Baltimore, MD 21250, USA (URL: https://so2.gsfc.nasa.gov/); Nasa Kiwe Corporation (CNK) (URL: http://www.nasakiwe.gov.co/index.php); Weather Research Forecasting (WRF) (URL: http://www.wrf-model.org/index.php).
Izu-Oshima (Japan) — January 2013 Cite this Report
Izu-Oshima
Japan
34.724°N, 139.394°E; summit elev. 746 m
All times are local (unless otherwise noted)
Non-eruptive May 2010 surface deformation from inferred deep instrusion
Oshima is an active volcano located on the northern tip of the Izu-Bonin volcanic arc. Our last report of activity at Oshima (BGVN 21:08) enumerated a flurry of shallow low-frequency earthquakes beneath the top and W flank of the volcano that started on 5 August 1996.
Since those relatively benign events, the Japan Meteorological Agency (JMA) had not observed any subsequent events worthy of note until May 2010 when land surface inflation was detected. The inflation was registered by a strainmeter, a Global Positioning System (GPS) network (run by the Geospatial Information Authority of Japan, GSI), and a tiltmeter network (run by the National Research Institute for Earth Science and Disaster Prevention, NIED).
In July 2010 seismicity in the shallow parts of and around Oshima began to increase. (High seismicity synchronous with inflation of the edifice was seen earlier, including in 2004 and 2007). These events were considered to be due to magma intrusion into the deeper part of the volcano. There were no remarkable changes in surface phenomenon. In September, the inflation that was detected in May began declining. Seismicity in the shallow parts of and around Oshima continued at a low level with some small earthquakes which temporally increased in the western offshore areas of Oshima on 22 December 2010.
The earthquakes increased in frequency again on 9 February 2011. GPS and strainmeter measurements indicated contraction since January, but the trend reversed to show inflation in October 2011. Seismicity remained at a low level. Very low level gas emissions were sometimes observed by a camera positioned on the NW summit. Based on a field survey on 28 October, no remarkable change in surface phenomena was observed.
No remarkable activity has been noted since October 2011. Throughout the noted activity, JMA held the Alert Level at 1.
Geologic Background. Izu-Oshima volcano in Sagami Bay, east of the Izu Peninsula, is the northernmost of the Izu Islands. The broad, low stratovolcano forms an 11 x 13 km island constructed over the remnants of three older dissected stratovolcanoes. It is capped by a 4-km-wide caldera with a central cone, Miharayama, that has been the site of numerous recorded eruptions datining back to the 7th century CE. More than 40 cones are located within the caldera and along two parallel rift zones trending NNW-SSE. Although it is a dominantly basaltic volcano, strong explosive activity has occurred at intervals of 100-150 years throughout the past few thousand years. A major eruption in 1986 produced spectacular lava fountains up to 1,600 m high and a 16-km-high eruption column; more than 12,000 people were evacuated from the island.
Information Contacts: Japan Meteorological Agency (JMA), Otemachi, 1-3-4, Chiyoda-ku Tokyo 100-8122, Japan (URL: http://www.jma.go.jp/).
Kikai
Japan
30.793°N, 130.305°E; summit elev. 704 m
All times are local (unless otherwise noted)
Steam plumes rose to 800 m duing latter half of 2012
Kikai is a 17 x 20 km mostly submarine caldera as close as ~40 km from the S margin of the island of Kyushu (see figure 1 in BGVN 37:07; also see Shinohara and others, 2002, for 16 journal articles devoted to this volcano. Maeno, 2008, offers an online overview). A few areas on the caldera rim lie above water (figure 2). Mild-to-moderate emissions have often occurred at the dome called Iwo-dake (alternately spelled Iodake, figure 2). Table 4 summarizes the seismicity and steam plume observations for July-December 2012, an interval of calm, absence of tremor, and low hazard status.
Table 4. Monthly summary of seismicity and plume observations at Kikai during July-December 2012. All reported plumes were described as white. Data courtesy of JMA.
| Month |
Earthquakes per month |
Maximum steam plume height (m above Iwo-dake crater rim) |
| Jul 2012 |
238 |
800 |
| Aug 2012 |
187 |
300 |
| Sep 2012 |
193 |
500 |
| Oct 2012 |
219 |
700 |
| Nov 2012 |
168 |
400 |
| Dec 2012 |
-- |
-- |
We last reported on Kikai activity through mid-2012 (BGVN 37:07) covering generally small steam plumes and monthly seismicity of up to ~200 earthquakes per month through June 2012. This report is a compilation of subsequent monthly reports of volcanic activity through December 2012 from Japan Meteorological Agency (JMA) monthly reports. The Alert Level remained constant at Level 2 (on a scale of 1-5: 2 = "Do not approach the crater"), before being downgraded to Level 1 in December 2012.
Between July and September 2012, plume emissions at the Iwo-dake summit crater continued (table 4). Weak incandescence was recorded at night with a high-sensitivity camera on 22 July, 28 August, 6 November and 22-24 November. Seismic activity remained at low levels. No unusual ground deformation was observed in GPS data through December 2012.
An aerial observation conducted by the Japan Maritime Self-Defense Force (JMSDF) on 11 September 2012 revealed white plumes rising from Iwo-dake's summit crater and flanks.
The results of a field survey conducted from 17-20 November 2012 showed no remarkable change in white fumes from Iwo-dake. Infrared images also found that the temperature distribution had remained essentially unchanged. Aerial monitoring conducted by the Japan Coast Guard (JCG) on 25 November 2012 revealed the presence of brown and green discolored water around the eastern coast (similar findings as a previous survey) as well as patterns of steaming similar to those observed during the field survey. SO2 emissions during 17-20 November 2012 were measured to be ~400 tons/day; a previous survey conducted in July 2012 yielded an estimated flux of ~500 tons/day.
References. Shinohara, H., Iguchi, M., Hedenquist, J.W., and Koyaguchi, T., 2002, Preface to special volume, Earth, Planets and Space 54 (3), pp. 173-174.
Maeno, F, 2008, Geology and eruptive history of Kikai Caldera, Earthquake Research Institute, University of Tokyo (URL: http://www.eri.u-tokyo.ac.jp/fmaeno/kikai/kikaicaldera.html); accessed 23 February 2013.
Geologic Background. Multiple eruption centers have exhibited recent activity at Kikai, a mostly submerged, 19-km-wide caldera near the northern end of the Ryukyu Islands south of Kyushu. It was the source of one of the world's largest Holocene eruptions about 6,300 years ago when rhyolitic pyroclastic flows traveled across the sea for a total distance of 100 km to southern Kyushu, and ashfall reached the northern Japanese island of Hokkaido. The eruption devastated southern and central Kyushu, which remained uninhabited for several centuries. Post-caldera eruptions formed Iodake (or Iwo-dake) lava dome and Inamuradake scoria cone, as well as submarine lava domes. Recorded eruptions have occurred at or near Satsuma-Iojima (also known as Tokara-Iojima), a small 3 x 6 km island forming part of the NW caldera rim. Showa-Iojima lava dome (also known as Iojima-Shinto), a small island 2 km E of Satsuma-Iojima, was formed during submarine eruptions in 1934 and 1935. Mild-to-moderate explosive eruptions have occurred during the past few decades from Iodake, a rhyolitic lava dome at the eastern end of Satsuma-Iojima.
Information Contacts: Japan Meteorological Agency (JMA), Otemachi, 1-3-4, Chiyoda-ku Tokyo 100-8122, Japan (URL: http://www.jma.go.jp/); MODVOLC, Hawai'i Institute of Geophysics and Planetology (HIGP), MODVOLC Thermal Alerts System, School of Ocean and Earth Science and Technology (SOEST), Univ. of Hawai'i, 2525 Correa Road, Honolulu, HI 96822, USA (URL: http://modis.higp.hawaii.edu/).
Kuchinoerabujima (Japan) — January 2013 Cite this Report
Kuchinoerabujima
Japan
30.443°N, 130.217°E; summit elev. 657 m
All times are local (unless otherwise noted)
Increased seismicity, 11 December 2011-5 January 2012
Since a small eruption in 1980, Kuchinoerabu-jima experienced numerous periods of elevated seismicity, with volcanic earthquakes and tremor detected at least through December 2009 (BGVN 35:11). The volcano is located in the Ryukyu Island arc, off Japan's SW coast (figure 4).
Recent monthly reports of volcanic activity from the Japan Meteorological Agency (JMA) translated into English resumed in October 2010. The only recent English-translated JMA report on Kuchinoerabu-jima available online through December 2012 was in January 2012. We know of no other recent report on this volcano's seismic activity; therefore, this report summarizes seismicity between December 2011 and January 2012.
According to JMA, seismicity increased to a relatively high level immediately after 11 December 2011, but then decreased on 5 January 2012. On 20 January 2012, the Alert Level was lowered from 2 to 1; JMA noted that the possibility of an eruption was minimal.
During the December 2011-January 2012 period, no significant change in plume activity was observed, and plume heights remained below 100 m above the crater. According to a field survey on 11 January, infrared images (compared to images obtained in December 2011) showed no significant change in temperature distribution either at the summit or on the W slope of Shin-dake (also refered to as Shin-take), the youngest and most active cone.
Field surveys found that sulfur dioxide levels were 50 and 100 metric tons/day on 12 and 13 January 2012, respectively, which were lower than those recorded in December 2011 (200 metric tons/day on 9 December 2011).
According to JMA, continuous GPS measurements have established a baseline across Shin-dake, collecting data since September 2010. Shin-dake's rate of change in surface deformation at the stations has been slowing since September 2011.
Geologic Background. A group of young stratovolcanoes forms the eastern end of the irregularly shaped island of Kuchinoerabujima in the northern Ryukyu Islands, 15 km W of Yakushima. The Furudake, Shindake, and Noikeyama cones were erupted from south to north, respectively, forming a composite cone with multiple craters. All historical eruptions have occurred from Shindake, although a lava flow from the S flank of Furudake that reached the coast has a very fresh morphology. Frequent explosive eruptions have taken place from Shindake since 1840; the largest of these was in December 1933. Several villages on the 4 x 12 km island are located within a few kilometers of the active crater and have suffered damage from eruptions.
Information Contacts: Japan Meteorological Agency (JMA), Otemachi, 1-3-4, Chiyoda-ku Tokyo 100-8122, Japan (URL: http://www.jma.go.jp/).
San Cristobal (Nicaragua) — January 2013 Cite this Report
San Cristobal
Nicaragua
12.702°N, 87.004°W; summit elev. 1745 m
All times are local (unless otherwise noted)
Ash eruption during 25-28 December 2012
Our last report highlighted monitoring efforts at San Cristóbal and the explosive eruption that began on 8 September 2012 (BGVN 37:08). By 16 September 2012, seismicity and emissions had decreased; however, the Instituto Nicaragüense de Estudios Territoriales (INETER) announced in late December 2012 that volcanic activity had re-started. In this report, we cover the time period of 25-31 December when seismicity, explosions, and gas-and-ash emissions were reported.
At 2000 on 25 December 2012, observers noted a series of gas-and-ash explosions from the summit. The wind carried the fine- to sand-sized ash SW. Several hours prior to this activity, INETER had reported that seismicity was elevated but sulfur dioxide emissions (SO2) were relatively low compared to measurements from previous days.
During the early hours of the morning on 26 December, winds dispersed fine ash NW, W, and SW. Sand-size ash was fell on the W and SW flanks (figure 28). Civil Defense authorities from the municipality of Chinandega reported an ash plume up to 500 m above the summit and described the event as a "moderate eruption" similar to the 8 September 2012 event.
On 26 December, government officials reported to Reuters that local inhabitants were evacuating. Rosario Murillo, a government spokeswoman, called on residents within a 3 km radius of the volcano to leave the area; some families had already self-evacuated.
By 1000 that day, INETER reported that seismicity had increased, and that they had received reports from Civil Defense stating that an eruption of fine ash rose to ~2,500 m above the crater. By the early afternoon, four major seismic events were detected and interpreted as explosions at the summit. Ashfall from these events primarily affected an area within a 5-6 km radius of the summit: El Viejo, Las Rojas, Banderas, Abraham Rugama, and those communities north of Chinandega's urban limit Grecia (particularly two communities called #1 and #4; see figure 19 in BGVN 36:12 for major town locations).
In their second communication on 26 December, INETER suggested that local inhabitants protect their water sources from ashfall, particularly those communities W, SW, and S of the volcano. They also announced that grazing lands would be closed in those regions due to the quantity of ash that had fallen. Research at Raupehu, New Zealand, and elsewhere has found that grazing animals can suffer damage to their teeth and poisoning due to elevated sulfur and fluorine if they consume ash-covered plants (Cronin and others, 2003). Precautions were also recommended for young children who could be adversely affected by inhaling fine ash. INETER noted that aviation traffic had been alerted to the presence of ash in the region.
The Washington Volcanic Ash Advisory Center (VAAC) detected ash from San Cristóbal during 26-28 December. Emissions were ongoing during that time period; plumes rose 2.4-4.3 km a.s.l. and drifted approximately W over the Pacific Ocean as far as 670 km WNW from the summit (figure 29).
INETER reported to local news agencies that 7 of the 13 municipalities of Chinandega were affected by ashfall by 27 December. Visibility was greatly reduced within the urban city of Chinandega. Emissions continued from the summit and reached 200 m above the crater rim in the morning. At the time of their second online notice, a plume of fine ash was visible rising up to 500 m above the crater, and small-to-moderate sized explosions of gas and ash continued.
On 28 December, the minister of Agriculture and Forestry told the local news agency, La Jornada, that while 2 millimeters of ash had fallen in some areas around the volcanic edifice, the farming areas should not be adversely affected since most of the crops had already been harvested. The public utility company, ENACAL, conducted investigations into water quality for the region.
News agencies reported that up to 20 km of highway was affected by ashfall along the Pan-American Highway between Honduras and Nicaragua. Vehicles opted to use headlights due to reduced visibility. La Jornada reported that a total of 268 people had left the area of San Cristóbal by 28 December and 68 were evacuated by the national humanitarian agency (Nicaraguan Humanitarian Rescue Unit, UHR).
INETER reported that small to moderate sized explosions had occurred in the morning of 28 December and a significant increase in SO2 flux was detected. This announcement included warnings regarding eye, skin, and respiratory irritation due to volcanic gases. There were also recommendations regarding ash removal from roofs and structures. Ash was distributed NW, W, and SW from the volcano and satellite images detected ash extending across the Pacific Ocean following the regional airstream offshore of El Salvador.
After an explosion of ash and gas at 1100 on 28 December, emissions throughout the day were ash-poor. Seismicity also decreased that day and, by 29 December, explosions had ceased and diffuse gas emissions continued. In their online bulletin, INETER reported that, as of 31 December, no ash explosions had been detected over the past two days. Gas emissions continued from the summit but SO2 levels had returned to normal.
Volcanic hazards map for San Cristóbal. A map of volcanic hazards was available on the INETER website for the region of San Cristóbal (figure 30). Volcanic ballistics, lahars, landslides, lava flows, and tephrafall were assessed and likely impacted areas were delineated. The tephrafall region corresponded to the prevailing winds and correlated well with ash-effected regions during the December 2012 events.
Reference. Cronin, S.J., Neall, V.E., Lecointre, J.A., Hedley, M.J., and Loganathan, P., 2003, Environmental hazards of fluoride in volcanic ash: a case study from Ruapehu volcano, New Zealand, Journal of Volcanology and Geothermal Research, 121, 271-291.
Geologic Background. The San Cristóbal volcanic complex, consisting of five principal volcanic edifices, forms the NW end of the Marrabios Range. The symmetrical 1745-m-high youngest cone, named San Cristóbal (also known as El Viejo), is Nicaragua's highest volcano and is capped by a 500 x 600 m wide crater. El Chonco, with several flank lava domes, is located 4 km W of San Cristóbal; it and the eroded Moyotepe volcano, 4 km NE of San Cristóbal, are of Pleistocene age. Volcán Casita, containing an elongated summit crater, lies immediately east of San Cristóbal and was the site of a catastrophic landslide and lahar in 1998. The Plio-Pleistocene La Pelona caldera is located at the eastern end of the complex. Historical eruptions from San Cristóbal, consisting of small-to-moderate explosive activity, have been reported since the 16th century. Some other 16th-century eruptions attributed to Casita volcano are uncertain and may have been from other Marrabios Range volcanoes.
Information Contacts: Instituto Nicaragüense de Estudios Territoriales (INETER), Apartado Postal 2110, Managua, Nicaragua (URL: http://www.ineter.gob.ni/); Washington Volcanic Ash Advisory Center (VAAC), Satellite Analysis Branch (SAB), NOAA/NESDIS E/SP23, NOAA Science Center Room 401, 5200 Auth Rd, Camp Springs, MD 20746, USA (URL: http://www.ospo.noaa.gov/Products/atmosphere/vaac/); La Jornada (URL: http://www.lajornadanet.com/diario/archivo/2012/diciembre/28/1.php); La Prensa de Nicaragua (URL: http://www.laprensa.com.ni/2012/12/27/ambito/128746/imprimir); Reuters.