Recently Published Bulletin Reports
Agung (Indonesia) Three eruptive events reported in April, May, and December 2022
Tengger Caldera (Indonesia) Minor ash emission in December 2023; persistent weak thermal anomaly in the Bromo crater
Saunders (United Kingdom) Persistent thermal anomalies from the summit crater lava lake during February 2023-January 2024
Shishaldin (United States) New eruption with significant Strombolian explosions, ash plumes, and ashfall
Ioto (Japan) New eruption with discolored water, ejecta, and floating pumice during October-December 2023
Purace (Colombia) Gas-and-ash emission on 16 November 2023
Suwanosejima (Japan) Eruption plumes, crater incandescence, and occasional explosions during July-October 2023
Etna (Italy) Strombolian explosions, lava fountains, and lava flows during July-August 2023
Aira (Japan) Explosions, ash plumes, ash fall, and crater incandescence during July-October 2023
Nishinoshima (Japan) Gray emissions during October 2023
Kilauea (United States) Strong lava fountains, lava flows, and spatter at Halema’uma’u during January-September 2023
Tinakula (Solomon Islands) Continued lava flows and thermal activity during June through November 2023
Agung (Indonesia) — January 2024  Cite this Report
Agung
Indonesia
8.343°S, 115.508°E; summit elev. 2997 m
All times are local (unless otherwise noted)
Three eruptive events reported in April, May, and December 2022
Mount Agung, located on the E end of the island of Bali, Indonesia, rises above the SE rim of the Batur caldera. The summit area extends 1.5 km E-W, with the highest point on the W and a steep-walled 800-m-wide crater on the E. Recorded eruptions date back to the early 19th century. A large and deadly explosive and effusive eruption occurred during 1963-64, which was characterized by voluminous ashfall, pyroclastic flows, and lahars that caused extensive damage and many fatalities. More recent activity was documented during November 2017-June 2019 that consisted of multiple explosions, significant ash plumes, lava flows at the summit crater, and incandescent ejecta. This report covers activity reported during April-May 2022 and December 2022 based on data from the Darwin Volcanic Ash Advisory Center (VAAC).
Activity during 2022 was relatively low and mainly consisted of a few ash plumes during April-May and December. An ash plume on 3 April rising to 3.7 km altitude (700 m above the summit) and drifting N was reported in a Darwin VAAC notice based on a ground report, with ash seen in HIMAWARI-8 visible imagery. Another ash plume was reported at 1120 on 27 May that rose to 5.5 km altitude (2.5 m above the summit); the plume was not visible in satellite or webcam images due to weather clouds. An eruption was reported based on seismic data at 0840 on 13 December, with an estimated plume altitude of 3.7 km; however, no ash was seen using satellite imagery in clear conditions before weather clouds obscured the summit.
Geologic Background. Symmetrical Agung stratovolcano, Bali's highest and most sacred mountain, towers over the eastern end of the island. The volcano, whose name means "Paramount," rises above the SE rim of the Batur caldera, and the northern and southern flanks extend to the coast. The summit area extends 1.5 km E-W, with the high point on the W and a steep-walled 800-m-wide crater on the E. The Pawon cone is located low on the SE flank. Only a few eruptions dating back to the early 19th century have been recorded in historical time. The 1963-64 eruption, one of the largest in the 20th century, produced voluminous ashfall along with devastating pyroclastic flows and lahars that caused extensive damage and many fatalities.
Information Contacts: Darwin Volcanic Ash Advisory Centre (VAAC), Bureau of Meteorology, Northern Territory Regional Office, PO Box 40050, Casuarina, NT 0811, Australia (URL: http://www.bom.gov.au/info/vaac/).
Tengger Caldera (Indonesia) — February 2024 Cite this Report
Tengger Caldera
Indonesia
7.942°S, 112.95°E; summit elev. 2329 m
All times are local (unless otherwise noted)
Minor ash emission in December 2023; persistent weak thermal anomaly in the Bromo crater
Tengger Caldera, located at the N end of a volcanic massif in Indonesia’s East Java, consists of five overlapping stratovolcanoes. The youngest and only active cone in the 16-km-wide caldera is Bromo, which typically produces gas-and-steam plumes, occasional ash plumes and explosions, and weak thermal signals (BGVN 44:05, 47:01). This report covers activity during January 2022-December 2023, consisting of mostly white gas-and-steam emissions and persistent weak thermal anomalies. Information was provided by the Pusat Vulkanologi dan Mitigasi Bencana Geologi (PVMBG, also known as Indonesian Center for Volcanology and Geological Hazard Mitigation, CVGHM) and satellite imagery. The Alert Level remained at 2 (on a scale of 1-4), and visitors were warned to stay at least 1 km from the crater.
Activity was generally low during the reporting period, similar to that in 2021. According to almost daily images from MAGMA Indonesia (a platform developed by PVMBG), white emissions and plumes rose from 50 to 900 m above the main crater during this period (figure 24). During several days in March and June 2022, white plumes reached heights of 1-1.2 km above the crater.
After an increase in activity at 2114 on 3 February 2023, a PVMBG team that was sent to observe white emissions rising as high as 300 m during 9-12 February and heard rumbling noises. A sulfur dioxide odor was also strong near the crater and measurements indicated that levels were above the healthy (non-hazardous) threshold of 5 parts per million; differential optical absorption spectroscopy (DOAS) measurements indicated an average flux of 190 metric tons per day on 11 February. Incandescence originating from a large fumarole in the NNW part of the crater was visible at night. The team observed that vegetation on the E caldera wall was yellow and withered. The seismic network recorded continuous tremor and deep and shallow volcanic earthquakes.
According to a PVMBG press release, activity increased on 13 December 2023 with white, gray, and brown emissions rising as high as 900 m above Bromo’s crater rim and drifting in multiple directions (figure 25). The report noted that tremor was continuous and was accompanied in December by three volcanic earthquakes. Deformation data indicated inflation in December. There was no observable difference in the persistent thermal anomaly in the crater between 11 and 16 December 2023.
All clear views of the Bromo crater throughout this time, using Sentinel-2 infrared satellite images, showed a weak persistent thermal anomaly; none of the anomalies were strong enough to cause MODVOLC Thermal Alerts. A fire in the SE part of the caldera in early September 2023 resulted in a brief period of strong thermal anomalies.
Geologic Background. The 16-km-wide Tengger caldera is located at the northern end of a volcanic massif extending from Semeru volcano. The massive volcanic complex dates back to about 820,000 years ago and consists of five overlapping stratovolcanoes, each truncated by a caldera. Lava domes, pyroclastic cones, and a maar occupy the flanks of the massif. The Ngadisari caldera at the NE end of the complex formed about 150,000 years ago and is now drained through the Sapikerep valley. The most recent of the calderas is the 9 x 10 km wide Sandsea caldera at the SW end of the complex, which formed incrementally during the late Pleistocene and early Holocene. An overlapping cluster of post-caldera cones was constructed on the floor of the Sandsea caldera within the past several thousand years. The youngest of these is Bromo, one of Java's most active and most frequently visited volcanoes.
Information Contacts: Pusat Vulkanologi dan Mitigasi Bencana Geologi (PVMBG, also known as Indonesian Center for Volcanology and Geological Hazard Mitigation, CVGHM), Jalan Diponegoro 57, Bandung 40122, Indonesia (URL: http://www.vsi.esdm.go.id/); MAGMA Indonesia, Kementerian Energi dan Sumber Daya Mineral (URL: https://magma.esdm.go.id/v1); Copernicus Browser, Copernicus Data Space Ecosystem, European Space Agency (URL: https://dataspace.copernicus.eu/browser/); Hawai'i Institute of Geophysics and Planetology (HIGP) - MODVOLC Thermal Alerts System, School of Ocean and Earth Science and Technology (SOEST), Univ. of Hawai'i, 2525 Correa Road, Honolulu, HI 96822, USA (URL: http://modis.higp.hawaii.edu/).
Saunders (United Kingdom) — February 2024 Cite this Report
Saunders
United Kingdom
57.8°S, 26.483°W; summit elev. 843 m
All times are local (unless otherwise noted)
Persistent thermal anomalies from the summit crater lava lake during February 2023-January 2024
Saunders is one of eleven islands that comprise the South Sandwich Islands in the South Atlantic. The active Mount Michael volcano has been in almost continuous eruption since November 2014 (BGVN 48:02). Recent activity has resulted in intermittent thermal anomalies and gas-and-steam emissions (BGVN 47:03, 48:02). Visits are infrequent due to its remote location, and cloud cover often prevents satellite observations. Satellite thermal imagery and visual observation of incandescence during a research expedition in 2019 (BGVN 28:02 and 44:08) and a finding confirmed by a National Geographic Society research team that summited Michael in November 2022 reported the presence of a lava lake.
Although nearly constant cloud cover during February 2023 through January 2024 greatly limited satellite observations, thermal anomalies from the lava lake in the summit crater were detected on clear days, especially around 20-23 August 2023. Anomalies similar to previous years (eg. BGVN 48:02) were seen in both MIROVA (Middle InfraRed Observation of Volcanic Activity) data from MODIS instruments and in Sentinel 2 infrared imagery. The only notable sulfur dioxide plume detected near Saunders was on 25 September 2023, with the TROPOMI instrument aboard the Sentinel-5P satellite.
Geologic Background. Saunders Island consists of a large central volcanic edifice intersected by two seamount chains, as shown by bathymetric mapping (Leat et al., 2013). The young Mount Michael stratovolcano dominates the glacier-covered island, while two submarine plateaus, Harpers Bank and Saunders Bank, extend north. The symmetrical Michael has a 500-m-wide summit crater and a remnant of a somma rim to the SE. Tephra layers visible in ice cliffs surrounding the island are evidence of recent eruptions. Ash clouds were reported from the summit crater in 1819, and an effusive eruption was inferred to have occurred from a N-flank fissure around the end of the 19th century and beginning of the 20th century. A low ice-free lava platform, Blackstone Plain, is located on the north coast, surrounding a group of former sea stacks. A cluster of cones on the SE flank, the Ashen Hills, appear to have been modified since 1820 (LeMasurier and Thomson, 1990). Analysis of satellite imagery available since 1989 (Gray et al., 2019; MODVOLC) suggests frequent eruptive activity (when weather conditions allow), volcanic clouds, steam plumes, and thermal anomalies indicative of a persistent, or at least frequently active, lava lake in the summit crater. Due to this observational bias, there has been a presumption when defining eruptive periods that activity has been ongoing unless there is no evidence for at least 10 months.
Information Contacts: MIROVA (Middle InfraRed Observation of Volcanic Activity), a collaborative project between the Universities of Turin and Florence (Italy) supported by the Centre for Volcanic Risk of the Italian Civil Protection Department (URL: http://www.mirovaweb.it/); NASA Global Sulfur Dioxide Monitoring Page, Atmospheric Chemistry and Dynamics Laboratory, NASA Goddard Space Flight Center (NASA/GSFC), 8800 Greenbelt Road, Goddard MD 20771, USA (URL: https://so2.gsfc.nasa.gov/); Copernicus Browser (URL: https://dataspace.copernicus.eu/browser).
Shishaldin (United States) — December 2023 Cite this Report
Shishaldin
United States
54.756°N, 163.97°W; summit elev. 2857 m
All times are local (unless otherwise noted)
New eruption with significant Strombolian explosions, ash plumes, and ashfall
Shishaldin is located on the eastern half of Unimak Island, one of the Aleutian Islands. Frequent explosive activity, primarily consisting of Strombolian ash eruptions from the small summit crater, but sometimes producing lava flows, has been recorded since the 18th century. The previous eruption ended in May 2020 and was characterized by intermittent thermal activity, increased seismicity and surface temperatures, ash plumes, and ash deposits (BGVN 45:06). This report covers a new eruption during July through November 2023, which consisted of significant explosions, ash plumes, ashfall, and lava fountaining. Information comes from daily, weekly, and special reports from the Alaska Volcano Observatory (AVO) and various satellite data. AVO monitors the volcano using local seismic and infrasound sensors, satellite data, web cameras, and remote infrasound and lightning networks.
AVO reported that intermittent tremor and low-frequency earthquakes had gradually become more regular and consistent during 10-13 July. Strongly elevated surface temperatures at the summit were identified in satellite images during 10-13 July. On 11 July AVO raised the Aviation Color Code (ACC) to Yellow (the second color on a four-color scale) and Volcano Alert Level (VAL) to Advisory (the second level on a four-level scale) at 1439. Later in the day on 11 July summit crater incandescence was observed in webcam images. Observations of the summit suggested that lava was likely present at the crater, which prompted AVO to raise the ACC to Orange (the second highest color on a four-color scale) and the VAL to Watch (the second highest level on a four-level scale). The US Coast Guard conducted an overflight on 12 July and confirmed that lava was erupting from the summit. That same day, sulfur dioxide emissions were detected in satellite images.
A significant explosion began at 0109 on 14 July that produced an ash plume that rose to 9-12 km altitude and drifted S over the Pacific Ocean (figure 43). Webcam images and photos taken around 0700 from a ship SW off Unimak Island showed small lahar deposits, which were the result of the interaction of hot pyroclastic material and snow and ice on the flanks. There was also ashfall on the SW and N flanks. A smaller explosion at 0710 generated an ash plume that rose to 4.5 km altitude. Webcam images and pilot reports showed continued low-level ash emissions during the morning, rising to less than 4.6 km altitude; those emissions included a small ash plume near the summit around 1030 resulting from a small explosion.
Seismic tremor amplitude began increasing at around 1700 on 15 July; strongly elevated surface temperatures were also reported. An ash plume rose to 4.6 km altitude and drifted SSE at 2100, based on a satellite image. A continuous ash plume during 2150 through 2330 rose to 5 km altitude and extended 125 km S. At 2357 AVO raised the ACC to Red (the highest color on a four-color scale) and the VAL to Warning (the highest level on a four-level scale), noting that seismicity remained elevated for more than six hours and explosion signals were frequently detected by regional infrasound (pressure sensor) networks. Explosions generated an ash plume that rose to 4.9 km altitude and drifted as far as 500 km SE. Activity throughout the night declined and by 0735 the ACC was lowered to Orange and the VAL to Watch. High-resolution satellite images taken on 16 July showed pyroclastic deposits extending as far as 3 km from the vent; these deposits generated lahars that extended further down the drainages on the flanks. Ash deposits were mainly observed on the SSE flank and extended to the shore of Unimak Island. During 16-17 July lava continued to erupt at the summit, which caused strongly elevated surface temperatures that were visible in satellite imagery.
Lava effusion increased at 0100 on 18 July, as noted in elevated surface temperatures identified in satellite data, increasing seismic tremor, and activity detected on regional infrasound arrays. A significant ash plume at 0700 rose to 7 km altitude and continued until 0830, eventually reaching 9.1 km altitude and drifting SSE (figure 44). As a result, the ACC was raised to Red and the VAL to Warning. By 0930 the main plume detached, but residual low-level ash emissions continued for several hours, remaining below 3 km altitude and drifting S. The eruption gradually declined and by 1208 the ACC was lowered to Orange and the VAL was lowered to Watch. High-resolution satellite images showed ash deposits on the SW flank and pyroclastic deposits on the N, E, and S flanks, extending as far as 3 km from the vent; lahars triggered by the eruption extended farther down the flanks (figure 45). Lava continued to erupt from the summit crater on 19 July.
Elevated surface temperatures were detected in satellite images during 19-25 July, despite occasional weather cloud cover, which was consistent with increased lava effusion. During 22-23 July satellite observations acquired after the eruption from 18 July showed pyroclastic flow and lahar deposits extending as far as 3 km down the N, NW, and NE flanks and as far as 1.5 km down the S and SE flanks. Ash deposits covered the SW and NE flanks. No lava flows were observed outside the crater. On 22 July a sulfur dioxide plume was detected in satellite data midday that had an estimated mass of 10 kt. In a special notice issued at 1653 on 22 July AVO noted that eruptive activity had intensified over the previous six hours, which was characterized by an hours-long steady increase in seismic tremor, intermittent infrasound signals consistent with small explosions, and an increase in surface temperatures that were visible in satellite data. Pilots first reported low-level ash plumes at around 1900. At 2320 an ash plume had risen to 9 km altitude based on additional pilot reports and satellite images. The ACC was increased to Red and the VAL to Warning at 2343. Satellite images indicated growth of a significantly higher ash plume that rose to 11 km altitude continued until 0030 and drifted NE. During the early morning hours of 23 July ash plumes had declined to 4.6 k altitude. Seismic tremor peaked at 0030 on 23 July and began to rapidly decline at 0109; active ash emissions were no longer visible in satellite data by 0130. The ACC was lowered to Orange and the VAL to Watch at 0418; bursts of increased seismicity were recorded throughout the morning, but seismicity generally remained at low levels. Elevated surface temperatures were visible in satellite data until about 0600. On 24 July pilots reported seeing vigorous gas-and-steam plumes rising to about 3 km altitude; the plumes may have contained minor amounts of ash.
During 24-25 July low level seismicity and volcanic tremor were detected at low levels following the previous explosion on 23 July. Strongly elevated surface temperatures were observed at the summit crater in satellite data. Around 2200 on 25 July seismicity began to increase, followed by infrasound signals of explosions after 0200 on 26 July. An ash plume rose to 3 km altitude at 0500 and drifted ENE, along with an associated sulfur dioxide plume that drifted NE and had an estimated mass of 22 kt. Diffuse ash emissions were visible in satellite data and rose to 6.1-7.6 km altitude and extended 125 km from the volcano starting around 1130. These ash events were preceded by about seven hours of seismic tremor, infrasound detections of explosions, and five hours of increased surface temperatures visible in satellite data. Activity began to decline around 1327, which included low-frequency earthquakes and decreased volcanic tremor, and infrasound data no longer detected significant explosions. Surface temperatures remained elevated through the end of the month.
Seismicity, volcanic tremor, and ash emissions remained at low levels during early August. Satellite images on 1 August showed that some slumping had occurred on the E crater wall due to the recent explosive activity. Elevated surface temperatures continued, which was consistent with cooling lava. On 2 August small explosive events were detected, consistent with low-level Strombolian activity. Some episodes of volcanic tremor were reported, which reflected low-level ash emissions. Those ash emissions rose to less than 3 km altitude and drifted as far as 92.6 km N. Pilots that were located N of the volcano observed an ash plume that rose to 2.7 km altitude. Seismicity began to increase in intensity around 0900 on 3 August. Seismicity continued to increase throughout the day and through the night with strongly elevated surface temperatures, which suggested that lava was active at the surface.
An ash cloud that rose to 7.6-7.9 km altitude and drifted 60-75 km NE was visible in a satellite image at 0520 on 4 August. Pilots saw and reported the plume at 0836 (figure 46). By 0900 the plume had risen to 9.1 km altitude and extended over 100 km NE. AVO raised the ACC to Red and the VAL to Warning as a result. Seismic tremor levels peaked at 1400 and then sharply declined at 1500 to slightly elevated levels; the plume was sustained during the period of high tremor and drifted N and NE. The ACC was lowered to Orange and the VAL to Watch at 2055. During 5-14 August seismicity remained low and surface temperatures were elevated based on satellite data due to cooling lava. On 9 August a small lava flow was observed that extended from the crater rim to the upper NE flank. It had advanced to 55 m in length and appeared in satellite imagery on 11 August. Occasional gas-and-steam plumes were noted in webcam images. At 1827 AVO noted that seismic tremor had steadily increased during the afternoon and erupting lava was visible at the summit in satellite images.
Strong explosion signals were detected at 0200 on 15 August. An ash cloud that was visible in satellite data extended 100 km NE and may have risen as high as 11 km altitude around 0240. By 0335 satellite images showed the ash cloud rising to 7.6 km altitude and drifting NE. Significant seismicity and explosions were detected by the local AVO seismic and infrasound networks, and volcanic lightning was detected by the World Wide Lightning Location Network (WWLLN). A sulfur dioxide plume associated with the eruption drifted over the S Bering Sea and parts of Alaska and western Canada. Seismicity was significantly elevated during the eruption but had declined by 1322. A pilot reported that ash emissions continued, rising as high as 4.9 km altitude. Elevated surface temperatures detected in satellite data were caused by hot, eruptive material (pyroclastic debris and lava) that accumulated around the summit. Eruptive activity declined by 16 August and the associated sulfur dioxide plume had mostly dissipated; remnants continued to be identified in satellite images at least through 18 August. Surface temperatures remained elevated based on satellite images, indicating hot material on the upper parts of the volcano. Small explosions were detected in infrasound data on the morning of 19 August and were consistent with pilot reports of small, short-lived ash plumes that rose to about 4.3 km altitude. Low-level explosive activity was reported during 20-24 August, according to seismic and infrasound data, and weather clouds sometimes prevented views. Elevated surface temperatures were observed in satellite images, which indicated continued hot material on the upper parts of the volcano.
Seismic tremor began to increase at around 0300 on 25 August and was followed by elevated surface temperatures identified in satellite images, consistent with erupting lava. Small explosions were recorded in infrasound data. The ACC was raised to Red and the VAL to Warning at 1204 after a pilot reported an ash plume that rose to 9.1 km altitude. Seismicity peaked at 1630 and began to rapidly decline at around 1730. Ash plumes rose as high as 10 km altitude and drifted as far as 400 km NE. By 2020 the ash plumes had declined to 6.4 km altitude and continued to drift NE. Ash emissions were visible in satellite data until 0000 on 26 August and seismicity was at low levels. AVO lowered the ACC to Orange and the VAL to Watch at 0030. Minor explosive activity within the summit crater was detected during 26-28 August and strongly elevated surface temperatures were still visible in satellite imagery through the rest of the month. An AVO field crew working on Unimak Island observed a mass flow that descended the upper flanks beginning around 1720 on 27 August. The flow produced a short-lived ash cloud that rose to 4.5 km altitude and rapidly dissipated. The mass flow was likely caused by the collapse of spatter that accumulated on the summit crater rim.
Similar variable explosive activity was reported in September, although weather observations sometimes prevented observations. A moderate resolution satellite image from the afternoon of 1 September showed gas-and-steam emissions filling the summit crater and obscuring views of the vent. In addition, hot deposits from the previous 25-26 August explosive event were visible on the NE flank near the summit, based on a 1 September satellite image. On 2 and 4 September seismic and infrasound data showed signals of small, repetitive explosions. Variable gas-and-steam emissions from the summit were visible but there was no evidence of ash. Possible summit crater incandescence was visible in nighttime webcam images during 3-4 September.
Seismicity began to gradually increase at around 0300 on 5 September and activity escalated at around 0830. A pilot reported an ash plume that rose to 7.6 km altitude at 0842 and continued to rise as high as possibly 9.7 km altitude and drifted SSE based on satellite images (figure 47). The ACC was raised to Red and the VAL to Warning at 0900. In addition to strong tremor and sustained explosions, the eruption produced volcanic lightning that was detected by the WWLLN. Around 1100 seismicity decreased and satellite data confirmed that the altitude of the ash emissions had declined to 7.6 km altitude. By 1200 the lower-altitude portion of the ash plume had drifted 125 km E. Significant ash emissions ended by 1330 based on webcam images. The ACC was lowered to Orange and the VAL to Watch at 1440. Satellite images showed extensive pyroclastic debris flows on most of the flanks that extended 1.2-3.3 km from the crater rim.
During 6-13 September elevated surface temperatures continued to be observed in satellite data, seismicity remained elevated with weak but steady tremor, and small, low-frequency earthquakes and small explosions were reported, except on 12 September. On 6 September a low-level ash plume rose to 1.5-1.8 km altitude and drifted SSE. Occasional small and diffuse gas-and-steam emissions at the summit were visible in webcam images. Around 1800 on 13 September seismic tremor amplitudes began to increase, and small explosions were detected in seismic and infrasound data. Incandescent lava at the summit was seen in a webcam image taken at 0134 on 14 September during a period of elevated tremor. No ash emissions were reported during the period of elevated seismicity. Lava fountaining began around 0200, based on webcam images. Satellite-based radar observations showed that the lava fountaining activity led to the growth of a cone in the summit crater, which refilled most of the crater. By 0730 seismicity significantly declined and remained at low levels.
Seismic tremor began to increase around 0900 on 15 September and rapidly intensified. An explosive eruption began at around 1710, which prompted AVO to raise the ACC to Red and the VAL to Warning. Within about 30 minutes ash plumes drifted E below a weather cloud at 8.2 km altitude. The National Weather Service estimated that an ash-rich plume rose as high as 12.8 km altitude and produced volcanic lightning. The upper part of the ash plume detached from the vent around 1830 and drifted E, and was observed over the Gulf of Alaska. Around the same time, seismicity dramatically decreased. Trace ashfall was reported in the community of False Pass (38 km ENE) between 1800-2030 and also in King Cove and nearby marine waters. Activity declined at around 1830 although seismicity remained elevated, ash emissions, and ashfall continued until 2100. Lightning was again detected beginning around 1930, which suggested that ash emissions continued. Ongoing explosions were detected in infrasound data, at a lower level than during the most energetic phase of this event. Lightning was last detected at 2048. By 2124 the intensity of the eruption had decreased, and ash emissions were likely rising to less than 6.7 km altitude. Seismicity returned to pre-eruption levels. On 16 September the ACC was lowered to Orange and the VAL to Watch at 1244; the sulfur dioxide plume that was emitted from the previous eruption event was still visible over the northern Pacific Ocean. Elevated surface temperatures, gas-and-steam emissions from the vent, and new, small lahars were reported on the upper flanks based on satellite and webcam images. Minor deposits were reported on the flanks which were likely the result of collapse of previously accumulated lava near the summit crater.
Elevated seismicity with tremor, small earthquakes, and elevated surface temperatures were detected during 17-23 September. Minor gas-and-steam emissions were visible in webcam images. On 20 September small volcanic debris flows were reported on the upper flanks. On 21 September a small ash deposit was observed on the upper flanks extending to the NE based on webcam images. Seismic tremor increased significantly during 22-23 September. Regional infrasound sensors suggested that low-level eruptive activity was occurring within the summit crater by around 1800 on 23 September. Even though seismicity was at high levels, strongly elevated surface temperatures indicating lava at the surface were absent and no ash emissions were detected; weather clouds at 0.6-4.6 km altitude obscured views. At 0025 on 24 September AVO noted that seismicity continued at high levels and nearly continuous small infrasound signals began, likely from low-level eruptive activity. Strongly elevated surface temperatures were identified in satellite images by 0900 and persisted throughout the day; the higher temperatures along with infrasound and seismic data were consistent with lava erupting at the summit. Around 1700 similarly elevated surface temperatures were detected from the summit in satellite data, which suggested that more vigorous lava fountaining had started. Starting around 1800 low-level ash emissions rose to altitudes less than 4.6 km altitude and quickly dissipated.
Beginning at midnight on 25 September, a series of seismic signals consistent with volcanic flows were recorded on the N side of the volcano. A change in seismicity and infrasound signals occurred around 0535 and at 0540 a significant ash cloud formed and quickly reached 14 km altitude and drifted E along the Alaska Peninsula. The cloud generated at least 150 lightning strokes with thunder that could be heard by people in False Pass. Seismicity rapidly declined to near background levels around 0600. AVO increased the ACC to Red and the VAL to Warning at 0602. The ash cloud detached from the volcano at around 0700, rose to 11.6 km altitude, and drifted ESE. Trace to minor amounts of ashfall were reported by the communities of False Pass, King Cove, Cold Bay, and Sand Point around 0700. Ash emissions continued at lower altitudes of 6-7.6 km altitude at 0820. Small explosions at the vent area continued to be detected in infrasound data and likely represented low-level eruptive activity near the vent. Due to the significant decrease in seismicity and ash emissions the ACC was lowered to Orange and the VAL to Watch at 1234. Radar data showed significant collapses of the crater that occurred on 25 September. Satellite data also showed significant hot, degassing pyroclastic and lahar deposits on all flanks, including more extensive flows on the ENE and WSW sections below two new collapse scarps. Following the significant activity during 24-25 September, only low-level activity was observed. Seismicity decreased notably near the end of the strong activity on 25 September and continued to decrease through the end of the month, though tremor and small earthquakes were still reported. No explosive activity was detected in infrasound data through 2 October. Gas-and-steam emissions rose to 3.7 km altitude, as reported by pilots and seen in satellite images. Satellite data from 26 September showed that significant collapses had occurred at the summit crater and hot, steaming deposits from pyroclastic flows and lahars were present on all the flanks, particularly to the ENE and WSW. A small ash cloud was visible in webcam images on 27 September, likely from a collapse at the summit cone. High elevated surface temperatures were observed in satellite imagery during 27-28 September, which were likely the result of hot deposits on the flanks erupted on 25 September. Minor steaming at the summit crater and from an area on the upper flanks was visible in webcam images on 28 September.
During October, explosion events continued between periods of low activity. Seismicity significantly increased starting at around 2100 on 2 October; around the same time satellite images showed an increase in surface temperatures consistent with lava fountaining. Small, hot avalanches of rock and lava descended an unspecified flank. In addition, a distinct increase in infrasound, seismicity, and lightning detections was followed by an ash plume that rose to 12.2 km altitude and drifted S and E at 0520 on 3 October, based on satellite images. Nighttime webcam images showed incandescence due to lava fountaining at the summit and pyroclastic flows descending the NE flank. AVO reported that a notable explosive eruption started at 0547 and lasted until 0900 on 3 October, which prompted a rise in the ACC to Red and the VAL to Warning. Subsequent ash plumes rose to 6-7.6 km altitude by 0931. At 1036 the ACC was lowered back to Orange and the VAL to Watch since both seismic and infrasound data quieted substantially and were slightly above background levels. Gas-and-steam emissions were observed at the summit, based on webcam images. Trace amounts of ashfall were observed in Cold Bay. Resuspended ash was present at several kilometers altitude near the volcano. During the afternoon, low-level ash plumes were visible at the flanks, which appeared to be largely generated by rock avalanches off the summit crater following the explosive activity. These ash plumes rose to 3 km altitude and drifted W. Trace amounts of ashfall were reported by observers in Cold Bay and Unalaska and flights to these communities were disrupted by the ash cloud. Satellite images taken after the eruption showed evidence of pyroclastic flows and lahar deposits in drainages 2 km down the SW flank and about 3.2 km down the NE flank, and continued erosion of the crater rim. Small explosion craters at the end of the pyroclastic flows on the NE flank were noted for the first time, which may have resulted from gas-and-steam explosions when hot deposits interact with underlying ice.
During 4 October seismicity, including frequent small earthquakes, remained elevated, but was gradually declining. Ash plumes were produced for over eight hours until around 1400 that rose to below 3.7 km altitude. These ash plumes were primarily generated off the sides of the volcano where hot rock avalanches from the crater rim had entered drainages to the SW and NE. Two explosion craters were observed at the base of the NE deposits about 3.2 km from the crater rim. Webcam images showed the explosion craters were a source of persistent ash emissions; occasional collapse events also generated ash. Seismicity remained elevated with sulfur dioxide emissions that had a daily average of more than 1,000 tons per day, and frequent small earthquakes through the end of the month. Frequent elevated surface temperatures were identified in satellite images and gas-and-steam plumes were observed in webcam images, although weather conditions occasionally prevented clear views of the summit. Emissions were robust during 14-16 October and were likely generated by the interaction of hot material and snow and ice. During the afternoon of 21 October a strong gas-and-steam plume rose to 3-4.6 km altitude and extended 40 km WSW, based on satellite images and reports from pilots. On 31 October the ACC was lowered to Yellow and the VAL was lowered to Advisory.
Activity in November was characterized by elevated seismicity with ongoing seismic tremor and small, low-frequency earthquakes, elevated surface temperatures, and gas-and-steam emissions. There was an increase in seismic and infrasound tremor amplitudes starting at 1940 on 2 November. As a result, the ACC was again raised to Orange and the VAL was increased to Watch, although ash was not identified in satellite data. An ash cloud rose to 6.1 km altitude and drifted W according to satellite data at 2000. By 0831 on 3 November ash emissions were no longer visible in satellite images. On 6 and 9 November air pressure sensors detected signals consistent with small explosions. Small explosions were detected in infrasound data consistent with weak Strombolian activity on 19 and 21 November. Seismicity started to decrease on 21 November. On 25 November gas-and-steam emissions were emitted from the vent as well as from a scarp on the NE side of the volcano near the summit. A gas-and-steam plume extended about 50 km SSE and was observed in satellite and webcam images on 26 November. On 28 November small explosions were observed in seismic and local infrasound data and gas-and-steam emissions were visible from the summit and from the upper NE collapse scarp based on webcam images. Possible small explosions were observed in infrasound data on 30 November. Weakly elevated surface temperatures and a persistent gas-and-steam plume from the summit and collapse scarps on the upper flanks. A passing aircraft reported the gas-and-steam plume rose to 3-3.4 km altitude on 30 November, but no significant ash emissions were detected.
Satellite data. MODIS thermal anomaly data provided through MIROVA (Middle InfraRed Observation of Volcanic Activity) showed a strong pulse of thermal activity beginning in July 2023 that continued through November 2023 (figure 48). This strong activity was due to Strombolian explosions and lava fountaining events at the summit crater. According to data from MODVOLC thermal alerts, a total of 101 hotspots were detected near the summit crater in July (11-14, 16-19, 23-24 and 26), August (4, 25-26, and 29), September (5, 12, and 17), and October (3, 4, and 8). Infrared satellite data showed large lava flows descending primarily the northern and SE flanks during the reporting period (figure 49). Sulfur dioxide plumes often exceeded two Dobson Units (DUs) and drifted in different directions throughout the reporting period, based on satellite data from the TROPOMI instrument on the Sentinel-5P satellite (figure 50).
Geologic Background. The symmetrical glacier-covered Shishaldin in the Aleutian Islands is the westernmost of three large stratovolcanoes in the eastern half of Unimak Island. The Aleuts named the volcano Sisquk, meaning "mountain which points the way when I am lost." Constructed atop an older glacially dissected edifice, it is largely basaltic in composition. Remnants of an older edifice are exposed on the W and NE sides at 1,500-1,800 m elevation. There are over two dozen pyroclastic cones on its NW flank, which is covered by massive aa lava flows. Frequent explosive activity, primarily consisting of Strombolian ash eruptions from the small summit crater, but sometimes producing lava flows, has been recorded since the 18th century. A steam plume often rises from the summit crater.
Information Contacts: Alaska Volcano Observatory (AVO), a cooperative program of a) U.S. Geological Survey, 4200 University Drive, Anchorage, AK 99508-4667 USA (URL: https://avo.alaska.edu/), b) Geophysical Institute, University of Alaska, PO Box 757320, Fairbanks, AK 99775-7320, USA, and c) Alaska Division of Geological & Geophysical Surveys, 794 University Ave., Suite 200, Fairbanks, AK 99709, USA (URL: http://dggs.alaska.gov/); MIROVA (Middle InfraRed Observation of Volcanic Activity), a collaborative project between the Universities of Turin and Florence (Italy) supported by the Centre for Volcanic Risk of the Italian Civil Protection Department (URL: http://www.mirovaweb.it/); Hawai'i Institute of Geophysics and Planetology (HIGP) - MODVOLC Thermal Alerts System, School of Ocean and Earth Science and Technology (SOEST), Univ. of Hawai'i, 2525 Correa Road, Honolulu, HI 96822, USA (URL: http://modis.higp.hawaii.edu/); NASA Global Sulfur Dioxide Monitoring Page, Atmospheric Chemistry and Dynamics Laboratory, NASA Goddard Space Flight Center (NASA/GSFC), 8800 Greenbelt Road, Goddard, Maryland, USA (URL: https://so2.gsfc.nasa.gov/); Copernicus Browser, Copernicus Data Space Ecosystem, European Space Agency (URL: https://dataspace.copernicus.eu/browser/).
Ioto
Japan
24.751°N, 141.289°E; summit elev. 169 m
All times are local (unless otherwise noted)
New eruption with discolored water, ejecta, and floating pumice during October-December 2023
Ioto (Iwo-jima), located about 1,200 km S of Tokyo, lies within a 9-km-wide submarine caldera along the Izu-Bonin-Mariana volcanic arc. Previous eruptions date back to 1889 and have consisted of dominantly phreatic explosions, pumice deposits during 2001, and discolored water. A submarine eruption during July through December 2022 was characterized by discolored water, pumice deposits, and gas emissions (BGVN 48:01). This report covers a new eruption during October through December 2023, which consisted of explosions, black ejecta, discolored water, and floating pumice, based on information from the Japan Meteorological Association (JMA), the Japan Coast Guard (JCG), and satellite data.
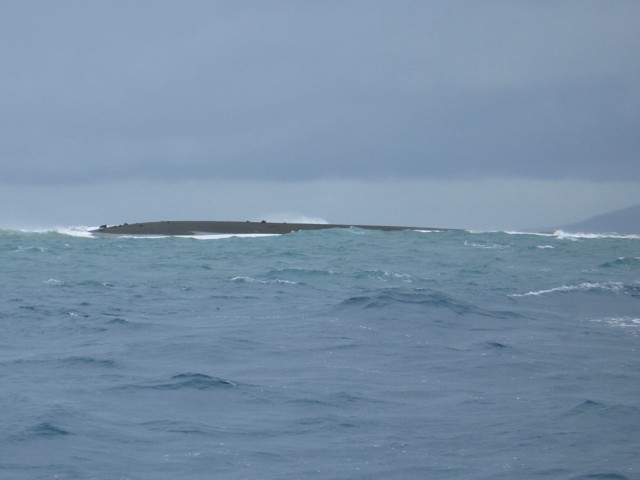
JMA reported that an eruption had been occurring offshore of Okinahama on the SE side of the island since 21 October, which was characterized by volcanic tremor, according to the Japan Maritime Self-Defense Force (JMSDF) Iwo Jima Air Base (figure 22). According to an 18 October satellite image a plume of discolored water at the site of this new eruption extended NE (figure 23). During an overflight conducted on 30 October, a vent was identified about 1 km off the coast of Okinahama. Observers recorded explosions every few minutes that ejected dark material about 20 m above the ocean and as high as 150 m. Ejecta from the vent formed a black-colored island about 100 m in diameter, according to observations conducted from the air by the Earthquake Research Institute of the University of Tokyo in cooperation with the Mainichi newspaper (figure 24). Occasionally, large boulders measuring more than several meters in size were also ejected. Observations from the Advanced Land Observing Satellite Daichi-2 and Sentinel-2 satellite images also confirmed the formation of this island (figure 23). Brown discolored water and floating pumice were present surrounding the island.
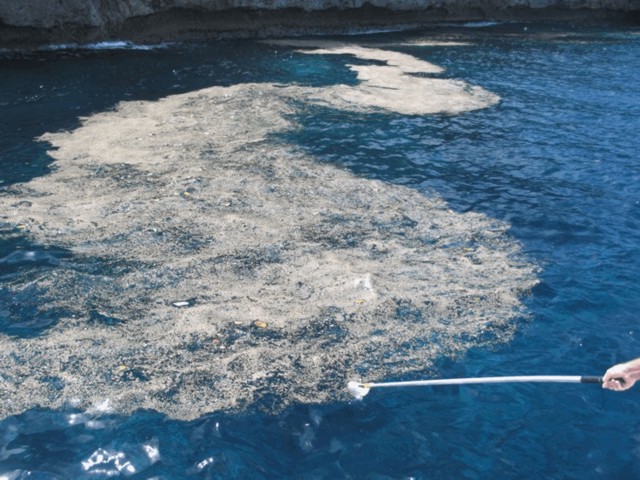
The eruption continued during November. During an overflight on 3 November observers photographed the island and noted that material was ejected 169 m high, according to a news source. Explosions gradually became shorter, and, by the 3rd, they occurred every few seconds; dark and incandescent material were ejected about 800 m above the vent. On 4 November eruptions were accompanied by explosive sounds. Floating, brown-colored pumice was present in the water surrounding the island. There was a brief increase in the number of volcanic earthquakes during 8-14 November and 24-25 November. The eruption temporarily paused during 9-11 November and by 12 November eruptions resumed to the W of the island. On 10 November dark brown-to-dark yellow-green discolored water and a small amount of black floating material was observed (figure 25). A small eruption was reported on 18 November off the NE coast of the island, accompanied by white gas-and-steam plumes (figure 23). Another pause was recorded during 17-19 November, which then resumed on 20 November and continued erupting intermittently. According to a field survey conducted by the National Institute for Disaster Prevention Science and Technology on 19 November, a 30-m diameter crater was visible on the NE coast where landslides, hot water, and gray volcanic ash containing clay have occurred and been distributed previously. Erupted blocks about 10 cm in diameter were distributed about 90-120 m from the crater. JCG made observations during an overflight on 23 November and reported a phreatomagmatic eruption. Explosions at the main vent generated dark gas-and-ash plumes that rose to 200 m altitude and ejected large blocks that landed on the island and in the ocean (figure 26). Discolored water also surrounded the island. The size of the new island had grown to 450 m N-S x 200 m E-W by 23 November, according to JCG.
The eruption continued through 11 December, followed by a brief pause in activity, which then resumed on 31 December, according to JMA. Intermittent explosions produced 100-m-high black plumes at intervals of several minutes to 30 minutes during 1-10 December. Overflights were conducted on 4 and 15 December and reported that the water surrounding the new island was discolored to dark brown-to-dark yellow-green (figure 27). No floating material was reported during this time. In comparison to the observations made on 23 November, the new land had extended N and part of it had eroded away. In addition, analysis by the Geospatial Information Authority of Japan using SAR data from Daichi-2 also confirmed that the area of the new island continued to decrease between 4 and 15 December. Ejected material combined with wave erosion transformed the island into a “J” shape, 500-m-long and with the curved part about 200 m offshore of Ioto. The island was covered with brown ash and blocks, and the surrounding water was discolored to greenish-brown and contained an area of floating pumice. JCG reported from an overflight on 4 December that volcanic ash-like material found around the S vent on the NE part of the island was newly deposited since 10 November (figure 28). By 15 December the N part of the “J” shaped island had separated and migrated N, connecting to the Okinahama coast and the curved part of the “J” had eroded into two smaller islands (figure 27).
References. Ukawa, M., Fujita, E., Kobayashi, T., 2002, Recent volcanic activity of Iwo Jima and the 2001 eruption, Monthly Chikyu, Extra No. 39, 157-164.
Geologic Background. Ioto, in the Volcano Islands of Japan, lies within a 9-km-wide submarine caldera. The volcano is also known as Ogasawara-Iojima to distinguish it from several other "Sulfur Island" volcanoes in Japan. The triangular, low-elevation, 8-km-long island narrows toward its SW tip and has produced trachyandesitic and trachytic rocks that are more alkalic than those of other volcanoes in this arc. The island has undergone uplift for at least the past 700 years, accompanying resurgent doming of the caldera; a shoreline landed upon by Captain Cook's surveying crew in 1779 is now 40 m above sea level. The Motoyama plateau on the NE half of the island consists of submarine tuffs overlain by coral deposits and forms the island's high point. Many fumaroles are oriented along a NE-SW zone cutting through Motoyama. Numerous recorded phreatic eruptions, many from vents on the W and NW sides of the island, have accompanied the uplift.
Information Contacts: Japan Meteorological Agency (JMA), 1-3-4 Otemachi, Chiyoda-ku, Tokyo 100-8122, Japan (URL: http://www.jma.go.jp/jma/indexe.html); Japan Coast Guard (JCG) Volcano Database, Hydrographic and Oceanographic Department, 3-1-1, Kasumigaseki, Chiyoda-ku, Tokyo 100-8932, Japan (URL: https://www1.kaiho.mlit.go.jp/GIJUTSUKOKUSAI/kaiikiDB/kaiyo22-2.htm); Copernicus Browser, Copernicus Data Space Ecosystem, European Space Agency (URL: https://dataspace.copernicus.eu/browser/); Asahi, 5-3-2, Tsukiji, Chuo Ward, Tokyo, 104-8011, Japan (URL: https://www.asahi.com/ajw/articles/15048458).
Purace (Colombia) — December 2023 Cite this Report
Purace
Colombia
2.3095°N, 76.3948°W; summit elev. 4650 m
All times are local (unless otherwise noted)
Gas-and-ash emission on 16 November 2023
Puracé, located in Colombia, is a stratovolcano that contains a 500-m-wide summit crater. It is part of the Los Coconucos volcanic chain that is a NW-SE trending group of seven cones and craters. The most recent eruption occurred during March 2022 that was characterized by frequent seismicity and gas-and-steam emissions (BGVN 47:06). This report covers a brief eruption during November 2023 based on monthly reports from the Popayán Observatory, part of the Servicio Geologico Colombiano (SGC).
Activity during November 2022 through November 2023 primarily consisted of seismicity: VT-type events, LP-type events, HB-type events, and TR-type events (table 4). Maximum sulfur dioxide values were measured weekly and ranged from 259-5,854 tons per day (t/d) during November 2022 through April 2023. White gas-and-steam emissions were also occasionally reported.
SGC issued a report on 25 October that noted a significant increase in the number of earthquakes associated with rock fracturing. These earthquakes were located SE of the crater between Puracé and Piocollo at depths of 1-4 km. There were no reported variations in sulfur dioxide values, but SGC noted high carbon dioxide values, compared to those recorded in the first half of 2023.
SGC reported that at 1929 on 16 November the seismic network detected a signal that was possibly associated with a gas-and-ash emission, though it was not confirmed in webcam images due to limited visibility. On 17 November an observer confirmed ash deposits on the N flank. Webcam images showed an increase in degassing both inside the crater and from the NW flank, rising 700 m above the crater.
Table 4. Seismicity at Puracé during November 2022-November 2023. Volcano-tectonic (VT), long-period (LP), hybrid (HB), and tremor (TR) events are reported each month. Courtesy of SGC.
| Month |
Volcano-tectonic |
Long-period |
Hybrid |
Tremor |
| Nov 2022 |
429 |
2,023 |
5 |
831 |
| Dec 2022 |
423 |
1,390 |
9 |
834 |
| Jan 2023 |
719 |
1,622 |
0 |
957 |
| Feb 2023 |
598 |
1,701 |
2 |
1,124 |
| Mar 2023 |
331 |
2,408 |
147 |
607 |
| Apr 2023 |
614 |
4,427 |
33 |
148 |
| May 2023 |
620 |
3,717 |
170 |
109 |
| Jun 2023 |
467 |
3,293 |
86 |
148 |
| Jul 2023 |
1,116 |
5,809 |
183 |
542 |
| Aug 2023 |
692 |
2,927 |
94 |
321 |
| Sep 2023 |
887 |
1,505 |
82 |
848 |
| Oct 2023 |
2,373 |
2,949 |
135 |
692 |
| Nov 2023 |
1,212 |
2,302 |
69 |
293 |
Geologic Background. Puracé is an active andesitic volcano with a 600-m-diameter summit crater at the NW end of the Los Coconucos Volcanic Chain. This volcanic complex includes nine composite and five monogenetic volcanoes, extending from the Puracé crater more than 6 km SE to the summit of Pan de Azúcar stratovolcano. The dacitic massif which the complex is built on extends about 13 km NW-SE and 10 km NE-SW. Frequent small to moderate explosive eruptions reported since 1816 CE have modified the morphology of the summit crater, with the largest eruptions in 1849, 1869, and 1885.
Information Contacts: Servicio Geologico Colombiano (SGC), Diagonal 53 No. 34-53 - Bogotá D.C., Colombia (URL: https://www.sgc.gov.co/volcanes).
Suwanosejima (Japan) — December 2023 Cite this Report
Suwanosejima
Japan
29.638°N, 129.714°E; summit elev. 796 m
All times are local (unless otherwise noted)
Eruption plumes, crater incandescence, and occasional explosions during July-October 2023
Suwanosejima is an 8-km-long island that consists of a stratovolcano and two active summit craters, located in the northern Ryukyu Islands, Japan. Volcanism over the past century has been characterized by Strombolian explosions, ash plumes, and ashfall. The current eruption began in October 2004 and has more recently consisted of frequent eruption plumes, explosions, and incandescent ejecta (BGVN 48:07). This report covers similar activity of ash plumes, explosions, and crater incandescence during July through October 2023 using monthly reports from the Japan Meteorological Agency (JMA) and satellite data.
Thermal activity during the reporting period was relatively low; only one low-power thermal anomaly was detected during mid-July and one during early August, based on a MIROVA (Middle InfraRed Observation of Volcanic Activity) Log Radiative Power graph of the MODIS thermal anomaly data. On two clear weather days, a thermal anomaly was visible in infrared satellite images (figure 81).
Low-level activity was reported at the Otake crater during July and no explosions were detected. Eruption plumes rose as high as 1.8 km above the crater. On 13 July an ash plume rose 1.7 km above the crater rim, based on a webcam image. During the night of the 28th crater incandescence was visible in a webcam image. An eruptive event reported on 31 July produced an eruption plume that rose 2.1 km above the crater. Seismicity consisted of 11 volcanic earthquakes on the W flank, the number of which had decreased compared to June (28) and 68 volcanic earthquakes near the Otake crater, which had decreased from 722 in the previous month. According to observations conducted by the University of Tokyo Graduate School of Science, Kyoto University Disaster Prevention Research Institute, Toshima Village, and JMA, the amount of sulfur dioxide emissions released during the month was 400-800 tons per day (t/d).
Eruptive activity in the Otake crater continued during August and no explosions were reported. An eruptive event produced a plume that rose 1 km above the crater at 1447 on 12 August. Subsequent eruptive events were recorded at 0911 on 16 August, at 1303 on 20 August, and at 0317 on 21 August, which produced ash plumes that rose 1-1.1 km above the crater and drifted SE, SW, and W. On 22 August an ash plume was captured in a webcam image rising 1.4 km above the crater (figure 82). Multiple eruptive events were detected on 25 August at 0544, 0742, 0824, 1424, and 1704, which generated ash plumes that rose 1.1-1.2 km above the crater and drifted NE, W, and SW. On 28 August a small amount of ashfall was observed as far as 1.5 km from the crater. There were 17 volcanic earthquakes recorded on the W flank of the volcano and 79 recorded at the Otake crater during the month. The amount of sulfur dioxide emissions released during the month was 400-800 t/d.
Activity continued at the Otake crater during September. Occasionally, nighttime crater incandescence was observed in webcam images and ashfall was reported. An eruptive event at 1949 on 4 September produced an ash plume that rose 1 km above the crater and drifted SW. On 9 September several eruption events were detected at 0221, 0301, and 0333, which produced ash plumes that rose 1.1-1.4 km above the crater rim and drifted W; continuous ash emissions during 0404-0740 rose to a maximum height of 2 km above the crater rim (figure 83). More eruptive events were reported at 1437 on 10 September, at 0319 on 11 September, and at 0511 and 1228 on 15 September, which generated ash plumes that rose 1-1.8 km above the crater. During 25, 27, and 30 September, ash plumes rose as high as 1.3 km above the crater rim. JMA reported that large blocks were ejected as far as 300 m from the center of the crater. There were 18 volcanic earthquakes detected beneath the W flank and 82 volcanic earthquakes detected near the Otake crater. The amount of sulfur dioxide released during the month ranged from 600 to 1,600 t/d.
Activity during early-to-mid-October consisted of occasional explosions, a total number of 13, and ash plumes that rose as high as 1.9 km above the Otake crater rim on 29 October (figure 84). These explosions are the first to have occurred since June 2023. Continuous ash emissions were reported during 0510-0555 on 1 October. Explosions were recorded at 0304, 2141, and 2359 on 2 October, at 0112 on 3 October, and at 1326 on 6 October, which produced ash plumes that rose as high as 1 km above the crater rim and drifted SW and W. An explosion was noted at 0428 on 3 October, but emission details were unknown. A total of eight explosions were recorded by the seismic network at 1522 on 14 October, at 0337, 0433, 0555, 1008, and 1539 on 15 October, and at 0454 and 0517 on 16 October. Ash plumes from these explosions rose as high as 900 m above the crater and drifted SE. Eruptive events during 25-27 and 29-30 October generated plumes that rose as high as 1.9 km above the crater and drifted SE, S, and SW. Ash was deposited in Toshima village (3.5 km SSW). Eruptive activity occasionally ejected large volcanic blocks as far as 600 m from the crater. Nighttime crater incandescence was visible in webcams. Intermittent ashfall was reported as far as 1.5 km from the crater. There were 43 volcanic earthquakes detected on the W flank during the month, and 184 volcanic earthquakes detected near the Otake crater. The amount of sulfur dioxide emitted ranged between 400 and 900 t/d.
Geologic Background. The 8-km-long island of Suwanosejima in the northern Ryukyu Islands consists of an andesitic stratovolcano with two active summit craters. The summit is truncated by a large breached crater extending to the sea on the E flank that was formed by edifice collapse. One of Japan's most frequently active volcanoes, it was in a state of intermittent Strombolian activity from Otake, the NE summit crater, between 1949 and 1996, after which periods of inactivity lengthened. The largest recorded eruption took place in 1813-14, when thick scoria deposits covered residential areas, and the SW crater produced two lava flows that reached the western coast. At the end of the eruption the summit of Otake collapsed, forming a large debris avalanche and creating an open collapse scarp extending to the eastern coast. The island remained uninhabited for about 70 years after the 1813-1814 eruption. Lava flows reached the eastern coast of the island in 1884. Only about 50 people live on the island.
Information Contacts: Japan Meteorological Agency (JMA), 1-3-4 Otemachi, Chiyoda-ku, Tokyo 100-8122, Japan (URL: http://www.jma.go.jp/jma/indexe.html); MIROVA (Middle InfraRed Observation of Volcanic Activity), a collaborative project between the Universities of Turin and Florence (Italy) supported by the Centre for Volcanic Risk of the Italian Civil Protection Department (URL: http://www.mirovaweb.it/); Hawai'i Institute of Geophysics and Planetology (HIGP) - MODVOLC Thermal Alerts System, School of Ocean and Earth Science and Technology (SOEST), Univ. of Hawai'i, 2525 Correa Road, Honolulu, HI 96822, USA (URL: http://modis.higp.hawaii.edu/); Copernicus Browser, Copernicus Data Space Ecosystem, European Space Agency (URL: https://dataspace.copernicus.eu/browser/).
Etna
Italy
37.748°N, 14.999°E; summit elev. 3357 m
All times are local (unless otherwise noted)
Strombolian explosions, lava fountains, and lava flows during July-August 2023
Etna, located on the Italian island of Sicily, has had documented eruptions dating back to 1500 BCE. Activity typically originates from multiple cones at the summit, where several craters have formed and evolved. The currently active craters are Northeast Crater (NEC), Voragine (VOR), and Bocca Nuova (BN), and the Southeast Crater (SEC); VOR and BN were previously referred to as the “Central Crater”. The original Southeast crater formed in 1978, and a second eruptive site that opened on its SE flank in 2011 was named the New Southeast Crater (NSEC). Another eruptive site between the SEC and NSEC developed during early 2017 and was referred to as the "cono della sella" (saddle cone). The current eruption period began in November 2022 and has been characterized by intermittent Strombolian activity, lava flows, and ash plumes (BGVN 48:08). This report updates activity during July through October 2023, which includes primarily gas-and-steam emissions; during July and August Strombolian explosions, lava fountains, and lava flows were reported, based on weekly and special reports by the Osservatorio Etneo (OE), part of the Catania Branch of Italy's Istituo Nazionale di Geofisica e Vulcanologica (INGV) and satellite data.
Variable fumarolic degassing was reported at all summit craters (BN, VOR, NEC, and SEC) throughout the entire reporting period (table 15). The MIROVA (Middle InfraRed Observation of Volcanic Activity) volcano hotspot detection system based on the analysis of MODIS data showed frequent low-to-moderate power thermal anomalies during the reporting period (figure 399). During mid-August there was a pulse in activity that showed an increase in the power of the anomalies due to Strombolian activity, lava fountains, and lava flows. Infrared satellite imagery captured strong thermal anomalies at the central and southeast summit crater areas (figure 400). Accompanying thermal activity were occasional sulfur dioxide plumes that exceeded 2 Dobson Units (DUs) recorded by the TROPOMI instrument on the Sentinel-5P satellite (figure 401).
Table 15. Summary of activity at the four primary crater areas at the summit of Etna during July-October 2023. Information is from INGV weekly reports.
| Month |
Bocca Nuova (BN) |
Voragine (VOR) |
Northeast Crater (NEC) |
Southeast Crater (SEC) |
| Jul 2023 |
Continuous degassing. |
No observations. |
Weak gas emissions. |
Continuous degassing. Sporadic and weak-to-moderate ash emissions. Strombolian explosions. |
| Aug 2023 |
Continuous degassing. |
No observations. |
No observations. |
Continuous degassing. Occasional ash emissions. Strombolian activity, lava fountaining, and lava flows. |
| Sep 2023 |
Variable degassing. Crater incandescence. |
Weak fumarolic activity. |
Weak fumarolic activity. |
Variable degassing. |
| Oct 2023 |
Continuous degassing. |
Weak fumarolic activity. |
Weak fumarolic activity. |
Continuous degassing. |
Activity during July and August was relatively low and mainly consisted of degassing at the summit craters, particularly at SEC and BN. Cloudy weather prevented clear views of the summit during early July. During the night of 2 July some crater incandescence was visible at SEC. Explosive activity resumed at SEC during 9-10 July, which was characterized by sporadic and weak ash emissions that rapidly dispersed in the summit area (figure 402). INGV reported moderate Strombolian activity began at 2034 on 14 July and was confined to the inside of the crater and fed by a vent located in the E part of SEC. An ash emission was detected at 2037. A new vent opened on 15 July in the SE part of BN and began to produce continuous gas-and-steam emissions. During an inspection carried out on 28 July pulsating degassing, along with audible booms, were reported at two active vents in BN. Vigorous gas-and-steam emissions intermittently generated rings. On rare occasions, fine, reddish ash was emitted from BN1 and resuspended by the gas-and-steam emissions.
Around 2000 on 13 August INGV reported a sudden increase in volcanic tremor amplitude. Significant infrasonic activity coincided with the tremor increase. Incandescent flashes were visible through the cloud cover in webcam images of SEC (figure 403). Strombolian activity at SEC began to gradually intensify starting at 2040 as seismicity continued to increase. The Aviation Color Code (ACC) was raised to Yellow (the second lowest-level on a four-color scale) at 2126 and then to Orange (the second highest-level on a four-color scale) at 2129 due to above-background activity. The activity rapidly transitioned from Strombolian activity to lava fountains around 2333 that rose 300-400 m above the crater (figure 403). Activity was initially focused on the E vent of the crater, but then the vent located above the S flank of the cone also became active. A lava flow from this vent traveled SW into the drainage created on 10 February 2022, overlapping with previous flows from 10 and 21 February 2022 and 21 May 2023, moving between Monte Barbagallo and Monte Frumento Supino (figure 404). The lava flow was 350 m long, oriented NNE-SSW, and descended to an elevation of 2.8 km. Flows covered an area of 300,000 m2 and had an estimated volume of 900,000 m3. The ACC was raised to Red at 2241 based on strong explosive activity and ashfall in Rifugio Sapienza-Piano Vetore at 1.7 km elevation on the S flank. INGV reported that pyroclastic flows accompanied this activity.
Activity peaked between 0240 and 0330 on 14 August, when roughly 5-6 vents erupted lava fountains from the E to SW flank of SEC. The easternmost vents produced lava fountains that ejected material strongly to the E, which caused heavy fallout of incandescent pyroclastic material on the underlying flank, triggering small pyroclastic flows. This event was also accompanied by lightning both in the ash column and in the ash clouds that were generated by the pyroclastic flows. A fracture characterized by a series of collapse craters (pit craters) opened on the upper SW flank of SEC. An ash cloud rose a few kilometers above the crater and drifted S, causing ash and lapilli falls in Rifugio Sapienza and expanding toward Nicolosi, Mascalucia, Catania, and up to Syracuse. Ashfall resulted in operational problems at the Catania airport (50 km S), which lasted from 0238 until 2000. By 0420 the volcanic tremor amplitude values declined to background levels. After 0500 activity sharply decreased, although the ash cloud remained for several hours and drifted S. By late morning, activity had completely stopped. The ACC was lowered to Orange as volcanic ash was confined to the summit area. Sporadic, minor ash emissions continued throughout the day. At 1415 the ACC was lowered to Yellow and then to Green at 1417.
During the night of 14-15 August only occasional flashes were observed, which were more intense during avalanches of material inside the eruptive vents. Small explosions were detected at SEC at 2346 on 14 August and at 0900 on 26 August that each produced ash clouds which rapidly dispersed into the atmosphere (figure 405). According to a webcam image, an explosive event detected at 2344 at SEC generated a modest ash cloud that was rapidly dispersed by winds. The ACC was raised to Yellow at 2355 on 14 August due to increasing unrest and was lowered to Green at 0954 on 15 August.
Activity during September and October was relatively low and mainly characterized by variable degassing from BN and SEC. Intense, continuous, and pulsating degassing was accompanied by roaring sounds and flashes of incandescence at BN both from BN1 and the new pit crater that formed during late July (figure 406). The degassing from the new pit crater sometimes emitted vapor rings. Cloudy weather during 6-8 September prevented observations of the summit craters .
Geologic Background. Mount Etna, towering above Catania on the island of Sicily, has one of the world's longest documented records of volcanism, dating back to 1500 BCE. Historical lava flows of basaltic composition cover much of the surface of this massive volcano, whose edifice is the highest and most voluminous in Italy. The Mongibello stratovolcano, truncated by several small calderas, was constructed during the late Pleistocene and Holocene over an older shield volcano. The most prominent morphological feature of Etna is the Valle del Bove, a 5 x 10 km caldera open to the east. Two styles of eruptive activity typically occur, sometimes simultaneously. Persistent explosive eruptions, sometimes with minor lava emissions, take place from one or more summit craters. Flank vents, typically with higher effusion rates, are less frequently active and originate from fissures that open progressively downward from near the summit (usually accompanied by Strombolian eruptions at the upper end). Cinder cones are commonly constructed over the vents of lower-flank lava flows. Lava flows extend to the foot of the volcano on all sides and have reached the sea over a broad area on the SE flank.
Information Contacts: Sezione di Catania - Osservatorio Etneo, Istituto Nazionale di Geofisica e Vulcanologia (INGV), Sezione di Catania, Piazza Roma 2, 95123 Catania, Italy (URL: http://www.ct.ingv.it/it/); MIROVA (Middle InfraRed Observation of Volcanic Activity), a collaborative project between the Universities of Turin and Florence (Italy) supported by the Centre for Volcanic Risk of the Italian Civil Protection Department (URL: http://www.mirovaweb.it/); NASA Global Sulfur Dioxide Monitoring Page, Atmospheric Chemistry and Dynamics Laboratory, NASA Goddard Space Flight Center (NASA/GSFC), 8800 Greenbelt Road, Goddard MD 20771, USA (URL: https://so2.gsfc.nasa.gov/); Copernicus Browser, Copernicus Data Space Ecosystem, European Space Agency (URL: https://dataspace.copernicus.eu/browser/).
Aira
Japan
31.5772°N, 130.6589°E; summit elev. 1117 m
All times are local (unless otherwise noted)
Explosions, ash plumes, ash fall, and crater incandescence during July-October 2023
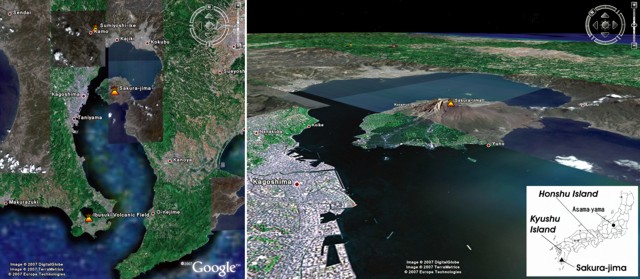
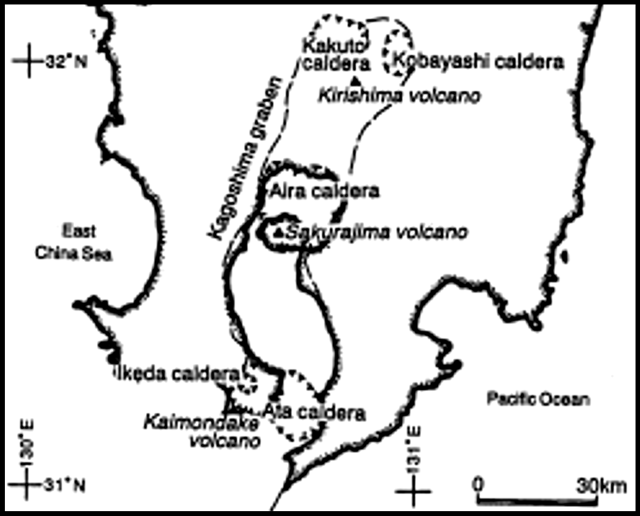
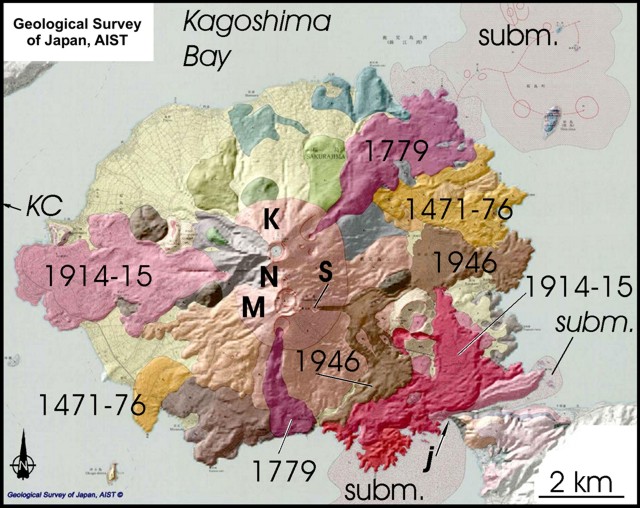
Aira caldera, located in the northern half of Kagoshima Bay, Japan, contains the post-caldera Sakurajima volcano. Eruptions typically originate from the Minamidake crater, and since the 8th century, ash deposits have been recorded in the city of Kagoshima (10 km W), one of Kyushu’s largest cities. The Minamidake summit cone and crater has had persistent activity since 1955; the Showa crater on the E flank has also been intermittently active since 2006. The current eruption period began during March 2017 and has recently been characterized by intermittent explosions, eruption plumes, and ashfall (BGVN 48:07). This report updates activity during July through October 2023 and describes explosive events, ash plumes, nighttime crater incandescence, and ashfall, according to monthly activity reports from the Japan Meteorological Agency (JMA) and satellite data.
Thermal activity remained at low levels during this reporting period, according to the MIROVA (Middle InfraRed Observation of Volcanic Activity) system (figure 149). There was a slight increase in the number of anomalies during September through October. Occasional thermal anomalies were visible in infrared satellite images mainly at the Minamidake crater (Vent A is located to the left and Vent B is located to the right) (figure 150).
Table 30. Number of monthly explosive events, days of ashfall, area of ash covered, and sulfur dioxide emissions from Sakurajima’s Minamidake crater at Aira during July-October 2023. Note that smaller ash events are not listed. Ashfall days were measured at Kagoshima Local Meteorological Observatory and ashfall amounts represent material covering all the Kagoshima Prefecture. Data courtesy of JMA monthly reports.
| Month |
Explosive events |
Days of ashfall |
Ashfall amount (g/m2) |
SO2 emissions (tons/day) |
| Jul 2023 |
3 |
0 |
0 |
1,600-3,200 |
| Aug 2023 |
3 |
10 |
7 |
1,800-3,300 |
| Sep 2023 |
3 |
7 |
3 |
1,600-2,300 |
| Oct 2023 |
33 |
8 |
61 |
2,200-4,200 |
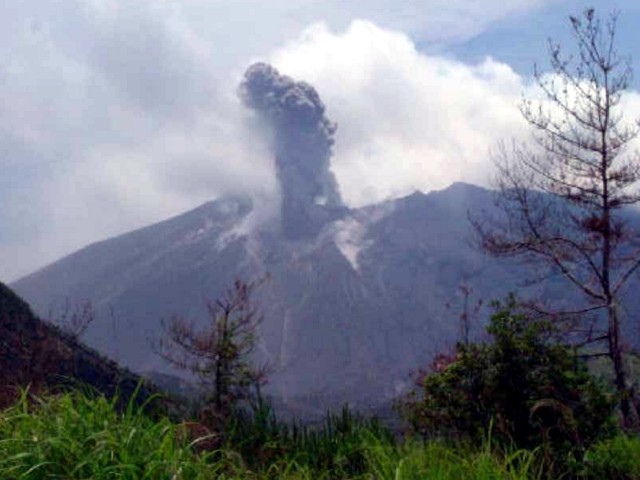
JMA reported that during July, there were eight eruptions, three of which were explosion events in the Showa crater. Large blocks were ejected as far as 600 m from the Showa crater. Very small eruptions were occasionally reported at the Minamidake crater. Nighttime incandescence was observed in both the Showa and Minamidake crater. Explosions were reported on 16 July at 2314 and on 17 July at 1224 and at 1232 (figure 151). Resulting eruption plumes rose 700-2,500 m above the crater and drifted N. On 23 July the number of volcanic earthquakes on the SW flank of the volcano increased. A strong Mw 3.1 volcanic earthquake was detected at 1054 on 26 July. The number of earthquakes recorded throughout the month was 545, which markedly increased from 73 in June. No ashfall was observed at the Kagoshima Regional Meteorological Observatory during July. According to a field survey conducted during the month, the daily amount of sulfur dioxide emissions was 1,600-3,200 tons per day (t/d).
There were three eruptions reported at the Minamidake crater during August, each of which were explosive. The explosions occurred on 9 August at 0345, on 13 August at 2205, and on 31 August at 0640, which generated ash plumes that rose 800-2,000 m above the crater and drifted W. There were two eruptions detected at Showa crater; on 4 August at 2150 ejecta traveled 800 m from the Showa crater and associated eruption plumes rose 2.3 km above the crater. The explosion at 2205 on 13 August generated an ash plume that rose 2 km above the crater and was accompanied by large blocks that were ejected 600 m from the Minamidake crater (figure 152). Nighttime crater incandescence was visible in a high-sensitivity surveillance camera at both craters. Seismicity consisted of 163 volcanic earthquakes, 84 of which were detected on the SW flank. According to the Kagoshima Regional Meteorological Observatory there was a total of 7 g/m2 of ashfall over the course of 10 days during the month. According to a field survey, the daily amount of sulfur dioxide emitted was 1,800-3,300 t/d.
During September, four eruptions were reported, three of which were explosion events. These events occurred at 1512 on 9 September, at 0018 on 11 September, and at 2211 on 13 September. Resulting ash plumes generally rose 800-1,100 m above the crater. An explosion produced an ash plume at 2211 on 13 September that rose as high as 1.7 km above the crater. Large volcanic blocks were ejected 600 m from the Minamidake crater. Smaller eruptions were occasionally observed at the Showa crater. Nighttime crater incandescence was visible at the Minamidake crater. Seismicity was characterized by 68 volcanic earthquakes, 28 of which were detected beneath the SW flank. According to the Kagoshima Regional Meteorological Observatory there was a total of 3 g/m2 of ashfall over the course of seven days during the month. A field survey reported that the daily amount of sulfur dioxide emitted was 1,600-2,300 t/d.
Eruptive activity during October consisted of 69 eruptions, 33 of which were described as explosive. These explosions occurred during 4 and 11-21 October and generated ash plumes that rose 500-3,600 m above the crater and drifted S, E, SE, and N. On 19 October at 1648 an explosion generated an ash plume that rose 3.6 km above the crater (figure 153). No eruptions were reported in the Showa crater; white gas-and-steam emissions rose 100 m above the crater from a vent on the N flank. Nighttime incandescence was observed at the Minamidake crater. On 24 October an eruption was reported from 0346 through 0430, which included an ash plume that rose 3.4 km above the crater. Ejected blocks traveled 1.2 km from the Minamidake crater. Following this eruption, small amounts of ashfall were observed from Arimura (4.5 km SE) and a varying amount in Kurokami (4 km E) (figure 154). The number of recorded volcanic earthquakes during the month was 190, of which 14 were located beneath the SW flank. Approximately 61 g/m2 of ashfall was reported over eight days of the month. According to a field survey, the daily amount of sulfur dioxide emitted was 2,200-4,200 t/d.
Geologic Background. The Aira caldera in the northern half of Kagoshima Bay contains the post-caldera Sakurajima volcano, one of Japan's most active. Eruption of the voluminous Ito pyroclastic flow accompanied formation of the 17 x 23 km caldera about 22,000 years ago. The smaller Wakamiko caldera was formed during the early Holocene in the NE corner of the caldera, along with several post-caldera cones. The construction of Sakurajima began about 13,000 years ago on the southern rim and built an island that was joined to the Osumi Peninsula during the major explosive and effusive eruption of 1914. Activity at the Kitadake summit cone ended about 4,850 years ago, after which eruptions took place at Minamidake. Frequent eruptions since the 8th century have deposited ash on the city of Kagoshima, located across Kagoshima Bay only 8 km from the summit. The largest recorded eruption took place during 1471-76.
Information Contacts: Japan Meteorological Agency (JMA), 1-3-4 Otemachi, Chiyoda-ku, Tokyo 100-8122, Japan (URL: http://www.jma.go.jp/jma/indexe.html); MIROVA (Middle InfraRed Observation of Volcanic Activity), a collaborative project between the Universities of Turin and Florence (Italy) supported by the Centre for Volcanic Risk of the Italian Civil Protection Department (URL: http://www.mirovaweb.it/); Copernicus Browser, Copernicus Data Space Ecosystem, European Space Agency (URL: https://dataspace.copernicus.eu/browser/).
Nishinoshima (Japan) — November 2023 Cite this Report
Nishinoshima
Japan
27.247°N, 140.874°E; summit elev. 100 m
All times are local (unless otherwise noted)
Gray emissions during October 2023
Nishinoshima is a small island in the Ogasawara Arc, about 1,000 km S of Tokyo, Japan. It contains prominent submarine peaks to the S, W, and NE. Recorded eruptions date back to 1973, with the current eruption period beginning in October 2022. Eruption plumes and fumarolic activity characterize recent activity (BGVN 48:10). This report covers the end of the eruption for September through October 2023, based on information from monthly reports of the Japan Meteorological Agency (JMA) monthly reports, and satellite data.
No eruptive activity was reported during September 2023, although JMA noted that the surface temperature was slightly elevated compared to the surrounding area since early March 2023. The Japan Coast Guard (JCG) conducted an overflight on 20 September and reported white gas-and-steam plumes rising 3 km above the central crater of the pyroclastic cone, as well as multiple white gas-and-steam emissions emanating from the N, E, and S flanks of the crater to the coastline. In addition, dark reddish brown-to-green discolored water was distributed around almost the entire circumference of the island.
Similar low-level activity was reported during October. Multiple white gas-and-steam emissions rose from the N, E, and S flanks of the central crater of the pyroclastic cone and along the coastline; these emissions were more intense compared to the previous overflight observations. Dark reddish brown-to-green discolored water remained visible around the circumference of the island. On 4 October aerial observations by JCG showed a small eruption consisting of continuous gas-and-steam emissions emanating from the central crater, with gray emissions rising to 1.5 km altitude (figure 129). According to observations from the marine weather observation vessel Keifu Maru on 26 October, white gas-and-steam emissions persisted from the center of the pyroclastic cone, as well as from the NW, SW, and SE coasts of the island for about five minutes. Slightly discolored water was visible up to about 1 km.
Frequent low-to-moderate power thermal anomalies were recorded in the MIROVA graph (Middle InfraRed Observation of Volcanic Activity) during September (figure 130). Occasional anomalies were detected during October, and fewer during November through December. A thermal anomaly was visible in the crater using infrared satellite imagery on 6, 8, 11, 16, 18, 21, and 23 September and 8, 13, 21, 26, and 28 October (figure 131).
Geologic Background. The small island of Nishinoshima was enlarged when several new islands coalesced during an eruption in 1973-74. Multiple eruptions that began in 2013 completely covered the previous exposed surface and continued to enlarge the island. The island is the summit of a massive submarine volcano that has prominent peaks to the S, W, and NE. The summit of the southern cone rises to within 214 m of the ocean surface 9 km SSE.
Information Contacts: Japan Meteorological Agency (JMA), 1-3-4 Otemachi, Chiyoda-ku, Tokyo 100-8122, Japan (URL: http://www.jma.go.jp/jma/indexe.html); MIROVA (Middle InfraRed Observation of Volcanic Activity), a collaborative project between the Universities of Turin and Florence (Italy) supported by the Centre for Volcanic Risk of the Italian Civil Protection Department (URL: http://www.mirovaweb.it/); Copernicus Browser, Copernicus Data Space Ecosystem, European Space Agency (URL: https://dataspace.copernicus.eu/browser/).
Kilauea (United States) — October 2023 Cite this Report
Kilauea
United States
19.421°N, 155.287°W; summit elev. 1222 m
All times are local (unless otherwise noted)
Strong lava fountains, lava flows, and spatter at Halema’uma’u during January-September 2023
Kīlauea is on the island of Hawai’i and overlaps the E flank of the Mauna Loa volcano. Its East Rift Zone (ERZ) has been intermittently active for at least 2,000 years. An extended eruption period began in January 1983 and was characterized by open lava lakes and lava flows from the summit caldera and the East Rift Zone. During May 2018 magma migrated into the Lower East Rift Zone (LERZ) and opened 24 fissures along a 6-km-long NE-trending fracture zone that produced lava flows traveling in multiple directions. As lava emerged from the fissures, the lava lake at Halema'uma'u drained and explosions sent ash plumes to several kilometers altitude (BGVN 43:10).
The current eruption period started during September 2021 and has been characterized by low-level lava effusions in the active Halema’uma’u lava lake (BGVN 48:01). This report covers three notable eruption periods during February, June, and September 2023 consisting of lava fountaining, lava flows, and spatter during January through September 2023 using information from daily reports, volcanic activity notices, and abundant photo, map, and video data from the US Geological Survey's (USGS) Hawaiian Volcano Observatory (HVO).
Activity during January 2023. Small earthquake swarms were recorded on 2 January 2023; increased seismicity and changes in the pattern of deformation were noted on the morning of 5 January. At around 1500 both the rate of deformation and seismicity drastically increased, which suggested magma movement toward the surface. HVO raised the Volcano Alert Level (VAL) to Watch (the second highest level on a four-level scale) and the Aviation Color Code (ACC) to Orange (the second highest color on a four-color scale) at 1520.
Multiple lava fountains and lava effusions from vents in the central eastern portion of the Halema’uma’u crater began on 5 January around 0434; activity was confined to the eastern half of the crater and within the basin of the western half of the crater, which was the focus of the eruption in 2021-2022 (figure 525). Incandescence was visible in webcam images at 1634 on 5 January, prompting HVO to raise the VAL to Warning (the highest level on a four-level scale) and the ACC to Red (the highest color on a four-color scale). Lava fountains initially rose as high as 50 m above the vent at the onset of the eruption (figure 526) but then declined to a more consistent 5-6 m height in the proceeding days. By 1930 that same day, lava had covered most of the crater floor (an area of about 1,200,000 m2) and the lava lake had a depth of 10 m. A higher-elevation island that formed during the initial phase of the December 2020 eruption remained exposed, appearing darker in images, along with a ring of older lava around the lava lake that was active prior to December 2022. Overnight during 5-6 January the lava fountains continued to rise 5 m high, and the lava effusion rate had slowed.
On 6 January at 0815 HVO lowered the VAL to Watch and the ACC to Orange due to the declining effusion rates. Sulfur dioxide emission rates ranged from 3,000-12,500 tonnes per day (t/d), the highest value of which was recorded on 6 January. Lava continued to erupt from the vents during 6-8 January, although the footprint of the active area had shrunk; a similar progression has been commonly observed during the early stages of recent eruptions at Halema’uma’u. On 9 January HVO reported one dominant lava fountain rising 6-7 m high in the E half of the crater. Lava flows built up the margins of the lake, causing the lake to be perched. On 10 January the eastern lava lake had an area of approximately 120,000 m2 that increased to 250,000 m2 by 17 January. During 13-31 January several small overflows occurred along the margins of the E lake. A smaller area of lava was active within the basin in the W half of the crater that had been the focus of activity during 2021-2022. On 19 January just after 0200 a small ooze-out was observed on the crater’s W edge.
Activity during February 2023. Activity continued in the E part of Halema’uma’u crater, as well as in a smaller basin in the W part of the 2021-2022 lava lake (figure 527). The E lava lake contained a single lava fountain and frequent overflows. HVO reported that during the morning of 1 February the large E lava lake began to cool and crust over in the center of the lake; two smaller areas of lava were observed on the N and S sides by the afternoon. The dominant lava fountain located in the S part of the lava lake paused for roughly 45 minutes at 2315 and resumed by midnight, rising 1-2 m. At 0100 on 2 February lava from the S part was effusing across the entire E lava lake area, covering the crusted over portion in the center of the lake and continuing across the majority of the previously measured 250,000 m2 by 0400. A small lava pond near the E lake produced an overflow around 0716 on 2 February. On 3 February some lava crust began to form against the N and E levees, which defined the 250,000 m2 eastern lava lake. The small S lava fountain remained active, rising 1-6 m high during 3-9 February; around 0400 on 5 February occasional bursts doubled the height of the lava fountain.
A large breakout occurred overnight during 2100 on 4 February to 0900 on 5 February on the N part of the crater floor, equal to or slightly larger in size than the E lava lake. A second, smaller lava fountain appeared in the same area of the E lava lake between 0300 and 0700 on 5 February and was temporarily active. This large breakout continued until 7 February. A small, brief breakout was reported in the S of the E lava lake around midnight on 7 February. In the W lake, as well as the smaller lava pond in the central portion of the crater floor, contained several overflows during 7-10 February and intermittent fountaining. Activity at the S small lava pond and the small S lava fountain within the E lake declined during 9-10 February. The lava pond in the central portion of the crater floor had nearly continuous, expansive flows during 10-13 February; channels from the small central lava pond seemed to flow into the larger E lake. During 13-18 February a small lava fountain was observed in the small lava pond in the central portion of the crater floor. Continuous overflows persisted during this time.
Activity in the eastern and central lakes began to decline in the late afternoon of 17 February. By 18 February HVO reported that the lava effusions had significantly declined, and that the eastern and central lakes were no longer erupting. The W lake in the basin remained active but at a greatly reduced level that continued to decline. HVO reported that this decrease in activity is attributed to notable deflationary tilt that began early on the morning of 17 February and lasted until early 19 February. By 19 February the W lake was mostly crusted over although some weak lava flows remained, which continued through 28 February. The sulfur dioxide emission rates ranged 250-2,800 t/d, the highest value of which was recorded on 6 February.
Activity during March 2023. The summit eruption at Halema’uma’u crater continued at greatly reduced levels compared to the previous two months. The E and central vents stopped effusing lava, and the W lava lake remained active with weak lava flows; the lake was mostly crusted over, although slowly circulating lava intermittently overturned the crust. By 6 March the lava lake in the W basin had stopped because the entire surface was crusted over. The only apparent surface eruptive activity during 5-6 March was minor ooze-outs of lava onto the crater floor, which had stopped by 7 March. Several hornitos on the crater floor still glowed through 12 March according to overnight webcam images, but they did not erupt any lava. A small ooze-out of lava was observed just after 1830 in the W lava lake on 8 March, which diminished overnight. The sulfur dioxide emission rate ranged from 155-321 t/d on 21 March. The VAL was lowered to Advisory, and the ACC was lowered to Yellow (the second lowest on a four-color scale) on 23 March due to a pause in the eruption since 7 March.
Activity during April-May 2023. The eruption at Halema’uma’u crater was paused; no lava effusions were visible on the crater floor. Sulfur dioxide emission rates ranged from 75-185 t/d, the highest of which was measured on 22 April. During May and June summit seismicity was elevated compared to seismicity that preceded the activity during January.
Activity during June 2023. Earthquake activity and changes in the patterns of ground deformation beneath the summit began during the evening of 6 June. The data indicated magma movement toward the surface, prompting HVO to raise the VAL to Watch and the ACC to Orange. At about 0444 on 7 June incandescence in Halema’uma’u crater was visible in webcam images, indicating that a new eruption had begun. HVO raised the VAL to Warning and the ACC to Red (the highest color on a four-color scale). Lava flowed from fissures that had opened on the crater floor. Multiple minor lava fountains were active in the central E portion of the Halema’uma’u crater, and one vent opened on the W wall of the caldera (figure 528). The eruptive vent on the SW wall of the crater continued to effuse into the lava lake in the far SW part of the crater (figure 529). The largest lava fountain consistently rose 15 m high; during the early phase of the eruption, fountain bursts rose as high as 60 m. Lava flows inundated much of the crater floor and added about 6 m depth of new lava within a few hours, covering approximately 10,000 m2. By 0800 on 7 June lava filled the crater floor to a depth of about 10 m. During 0800-0900 the sulfur dioxide emission rate was about 65,000 t/d. Residents of Pahala (30 km downwind of the summit) reported minor deposits of fine, gritty ash and Pele’s hair. A small spatter cone had formed at the vent on the SW wall by midday, and lava from the cone was flowing into the active lava lake. Fountain heights had decreased from the onset of the eruption and were 4-9 m high by 1600, with occasional higher bursts. Inflation switched to deflation and summit earthquake activity greatly diminished shortly after the eruption onset.
At 0837 on 8 June HVO lowered the VAL to Watch and the ACC to Orange because the initial high effusion rates had declined, and no infrastructure was threatened. The surface of the lava lake had dropped by about 2 m, likely due to gas loss by the morning of 8 June. The drop left a wall of cooled lava around the margins of the crater floor. Lava fountain heights decreased during 8-9 June but continued to rise to 10 m high. Active lava and vents covered much of the W half of Halema’uma’u crater in a broad, horseshoe-shape around a central, uplifted area (figure 530). The preliminary average effusion rate for the first 24 hours of the eruption was about 150 cubic meters per second, though the estimate did not account for vesiculated lava and variations in crater floor topography. The effusion rate during the very earliest phases of the eruption appeared significantly higher than the previous three summit eruptions based on the rapid coverage of the entire crater floor. An active lava lake, also referred to as the “western lava lake” was centered within the uplifted area and was fed by a vent in the NE corner. Two small active lava lakes were located just SE from the W lava lake and in the E portion of the crater floor.
During 8-9 June the lava in the central lava lake had a thickness of approximately 1.5 m, based on measurements from a laser rangefinder. During 9-12 June the height of the lava fountains decreased to 9 m high. HVO reported that the previously active lava lake in the E part of the crater appeared stagnant during 10-11 June. The surface of the W lake rose approximately 1 m overnight during 11-12 June, likely due to the construction of a levee around it. Only a few small fountains were active during 12-13 June; the extent of the active lava had retreated so that all activity was concentrated in the SW and central parts of Halema’uma’u crater. Intermittent spattering from the vent on the SW wall was visible in overnight webcam images during 13-18 June. On the morning of 14 June a weak lava effusion originated from near the western eruptive vent, but by 15 June there were no signs of continued activity. HVO reported that other eruptive vents in the SW lava lake had stopped during this time, following several days of waning activity; lava filled the lake by about 0.5 m. Lava circulation continued in the central lake and no active lava was reported in the northern or eastern parts of the crater. Around 0800 on 15 June the top of the SW wall spatter cone collapsed, which was followed by renewed and constant spattering from the top vent and a change in activity from the base vent; several new lava flows effused from the top of the cone, as well as from the pre-existing tube-fed flow from its base. Accumulation of lava on the floor resulted in a drop of the central basin relative to the crater floor, allowing several overflows from the SW lava lake to cascade into the basin during the night of 15 June into the morning of 16 June.
Renewed lava fountaining was reported at the eruptive vent on the SW side of the crater during 16-19 June, which effused lava into the far SW part of the crater. This activity was described as vigorous during midday on 16 June; a group of observatory geologists estimated that the lava was consistently ejected at least 10 m high, with some spatter ejected even higher and farther. Deposits from the fountain further heightened and widened the spatter cone built around the original eruptive vent in the lower section of the crater wall. Multiple lava flows from the base of the cone were fed into the SW lava lake and onto the southwestern-most block from the 2018 collapse within Halema’uma’u on 17 June (figure 531); by 18 June they focused into a single flow feeding into the SW lava lake. On the morning of 19 June a second lava flow from the base of the eruptive cone advanced into the SW lava lake.
Around 1600 on 19 June there was a rapid decline in lava fountaining and effusion at the eruptive vent on the SW side of the crater; vent activity had been vigorous up to that point (figure 532). Circulation in the lava lake also slowed, and the lava lake surface dropped by several meters. Overnight webcam images showed some previously eruptive lava still flowing onto the crater floor, which continued until those flows began to cool. By 21 June no lava was erupting in Halema’uma’u crater. Overnight webcam images during 29-30 June showed some incandescence from previously erupted lava flows as they continued to cool. Seismicity in the crater declined to low levels. Sulfur dioxide emission rates ranged 160-21,000 t/d throughout the month, the highest measurement of which was recorded on 8 June. On 30 June the VAL was lowered to Advisory (the second level on a four-level scale) and the ACC was lowered to Yellow. Gradual inflation was detected at summit tiltmeters during 19-30 June.
Activity during July-August 2023. During July, the eruption paused; no lava was erupting in Halema’uma’u crater. Nighttime webcam images showed some incandescence from previously erupted lava as it continued to cool on the crater floor. During the week of 14 August HVO reported that the rate in seismicity increased, with 467 earthquakes of Mw 3.2 and smaller occurring. Sulfur dioxide emission rates remained low, ranging from 75-86 t/d, the highest of which was recorded on 10 and 15 August. On 15 August beginning at 0730 and lasting for several hours, a swarm of approximately 50 earthquakes were detected at a depth of 2-3 km below the surface and about 2 km long directly S of Halema’uma’u crater. HVO reported that this was likely due to magma movement in the S caldera region. During 0130-0500 and 1700-2100 on 21 August two small earthquake swarms of approximately 20 and 25 earthquakes, respectively, occurred at the same location and at similar depths. Another swarm of 50 earthquakes were recorded during 0430-0830 on 23 August. Elevated seismicity continued in the S area through the end of the month.
Activity during September 2023. Elevated seismicity persisted in the S summit with occasional small, brief seismic swarms. Sulfur dioxide measurements were relatively low and were 70 t/d on 8 September. About 150 earthquakes occurred during 9-10 September, and tiltmeter and Global Positioning System (GPS) data showed inflation in the S portion of the crater.
At 0252 on 10 September HVO raised the VAL to Watch and the ACC to Orange due to increased earthquake activity and changes in ground deformation that indicated magma moving toward the surface. At 1515 the summit eruption resumed in the E part of the caldera based on field reports and webcam images. Fissures opened on the crater floor and produced multiple minor lava fountains and flows (figure 533). The VAL and ACC were raised to Warning and Red, respectively. Gas-and-steam plumes rose from the fissures and drifted downwind. A line of eruptive vents stretched approximately 1.4 km from the E part of the crater into the E wall of the down dropped block by 1900. The lava fountains at the onset of the eruption had an estimated 50 m height, which later rose 20-25 m high. Lava erupted from fissures on the down dropped block and expanded W toward Halema’uma’u crater. Data from a laser rangefinder recorded about 2.5 m thick of new lava added to the W part of the crater. Sulfur dioxide emissions were elevated in the eruptive area during 1600-1500 on 10 September, measuring at least 100,000 t/d.
At 0810 on 11 September HVO lowered the VAL and ACC back to Watch and Orange due to the style of eruption and the fissure location had stabilized. The initial extremely high effusion rates had declined (but remained at high levels) and no infrastructure was threatened. An eruption plume, mainly comprised of sulfur dioxide and particulates, rose as high as 3 km altitude. Several lava fountains were active on the W side of the down dropped block during 11-15 September, while the easternmost vents on the down dropped block and the westernmost vents in the crater became inactive on 11 September (figure 534). The remaining vents spanned approximately 750 m and trended roughly E-W. The fed channelized lava effusions flowed N and W into Halema’uma’u. The E rim of the crater was buried by new lava flows; pahoehoe lava flows covered most of the crater floor except areas of higher elevation in the SW part of the crater. The W part of the crater filled about 5 m since the start of the eruption, according to data from a laser rangefinder during 11-12 September. Lava fountaining continued, rising as high as 15 m by the morning of 12 September. During the morning of 13 September active lava flows were moving on the N and E parts of the crater. The area N of the eruptive vents that had active lava on its surface became perched and was about 3 m higher than the surrounding ground surface. By the morning of 14 September active lava was flowing on the W part of the down dropped block and the NE parts of the crater. The distances of the active flows progressively decreased. Spatter had accumulated on the S (downwind) side of the vents, forming ramparts about 20 m high.
Vigorous spattering was restricted to the westernmost large spatter cone with fountains rising 10-15 m high. Minor spattering occurred within the cone to the E of the main cone, but HVO noted that the fountains remained mostly below the rim of the cone. Lava continued to effuse from these cones and likely from several others as well, traveled N and W, confined to the W part of the down-dropped block and the NE parts of Halema’uma’u. Numerous ooze-outs of lava were visible over other parts of the crater floor at night. Laser range-finder measurements taken of the W part of the crater during 14-15 September showed that lava filled the crater by 10 m since the start of the eruption. Sulfur dioxide emissions remained elevated after the onset of the eruption, ranging 20,000-190,000 t/d during the eruption activity, the highest of which occurred on 10 September.
Field crews observed the eruptive activity on 15 September; they reported a notable decrease or stop in activity at several vents. Webcam images showed little to no fountaining since 0700 on 16 September, though intermittent spattering continued from the westernmost large cone throughout the night of 15-16 September. Thermal images showed that lava continued to flow onto the crater floor. On 16 September HVO reported that the eruption stopped around 1200 and that there was no observable activity anywhere overnight or on the morning of 17 September. HVO field crews reported that active lava was no longer flowing onto Halema’uma’u crater floor and was restricted to a ponded area N of the vents on the down dropped block. They reported that spattering stopped around 1115 on 16 September. Nighttime webcam images showed some incandescence on the crater floor as lava continued to cool. Field observations supported by geophysical data showed that eruptive tremor in the summit region decreased over 15-16 September and returned to pre-eruption levels by 1700 on 16 September. Sulfur dioxide emissions were measured at a rate of 800 t/d on 16 September while the eruption was waning, and 200 t/d on 17 September, which were markedly lower compared to measurements taken the previous week of 20,000-190,000 t/d.
Geologic Background. Kilauea overlaps the E flank of the massive Mauna Loa shield volcano in the island of Hawaii. Eruptions are prominent in Polynesian legends; written documentation since 1820 records frequent summit and flank lava flow eruptions interspersed with periods of long-term lava lake activity at Halemaumau crater in the summit caldera until 1924. The 3 x 5 km caldera was formed in several stages about 1,500 years ago and during the 18th century; eruptions have also originated from the lengthy East and Southwest rift zones, which extend to the ocean in both directions. About 90% of the surface of the basaltic shield volcano is formed of lava flows less than about 1,100 years old; 70% of the surface is younger than 600 years. The long-term eruption from the East rift zone between 1983 and 2018 produced lava flows covering more than 100 km2, destroyed hundreds of houses, and added new coastline.
Information Contacts: Hawaiian Volcano Observatory (HVO), U.S. Geological Survey, PO Box 51, Hawai'i National Park, HI 96718, USA (URL: http://hvo.wr.usgs.gov/).
Tinakula (Solomon Islands) — December 2023 Cite this Report
Tinakula
Solomon Islands
10.386°S, 165.804°E; summit elev. 796 m
All times are local (unless otherwise noted)
Continued lava flows and thermal activity during June through November 2023
Tinakula is a remote 3.5 km-wide island in the Solomon Islands, located 640 km ESE of the capital, Honiara. The current eruption period began in December 2018 and has more recently been characterized by intermittent lava flows and thermal activity (BGVN 48:06). This report covers similar activity during June through November 2023 using satellite data.
During clear weather days (20 July, 23 September, 23 October, and 12 November), infrared satellite imagery showed lava flows that mainly affected the W side of the island and were sometimes accompanied by gas-and-steam emissions (figure 54). The flow appeared more intense during July and September compared to October and November. According to the MODVOLC thermal alerts, there were a total of eight anomalies detected on 19 and 21 July, 28 and 30 October, and 16 November. Infrared MODIS satellite data processed by MIROVA (Middle InfraRed Observation of Volcanic Activity) detected a small cluster of thermal activity occurring during late July, followed by two anomalies during August, two during September, five during October, and five during November (figure 55).
Geologic Background. The small 3.5-km-wide island of Tinakula is the exposed summit of a massive stratovolcano at the NW end of the Santa Cruz islands. It has a breached summit crater that extends from the summit to below sea level. Landslides enlarged this scarp in 1965, creating an embayment on the NW coast. The Mendana cone is located on the SE side. The dominantly andesitic volcano has frequently been observed in eruption since the era of Spanish exploration began in 1595. In about 1840, an explosive eruption apparently produced pyroclastic flows that swept all sides of the island, killing its inhabitants. Recorded eruptions have frequently originated from a cone constructed within the large breached crater. These have left the upper flanks and the steep apron of lava flows and volcaniclastic debris within the breach unvegetated.
Information Contacts: MIROVA (Middle InfraRed Observation of Volcanic Activity), a collaborative project between the Universities of Turin and Florence (Italy) supported by the Centre for Volcanic Risk of the Italian Civil Protection Department (URL: http://www.mirovaweb.it/); Hawai'i Institute of Geophysics and Planetology (HIGP) - MODVOLC Thermal Alerts System, School of Ocean and Earth Science and Technology (SOEST), Univ. of Hawai'i, 2525 Correa Road, Honolulu, HI 96822, USA (URL: http://modis.higp.hawaii.edu/); Copernicus Browser, Copernicus Data Space Ecosystem, European Space Agency (URL: https://dataspace.copernicus.eu/browser/).
Search Bulletin Archive by Publication Date
Select a month and year from the drop-downs and click "Show Issue" to have that issue displayed in this tab.
The default month and year is the latest issue available.
Bulletin of the Global Volcanism Network - Volume 32, Number 04 (April 2007)
Aira (Japan)
Eruption from E-slope Showa crater on 4 June 2007
Bagana (Papua New Guinea)
Almost daily thermal anomalies over past year; plumes and glow
Bulusan (Philippines)
Continued explosive eruptions and ashfall during October 2006 through May 2007
Home Reef (Tonga)
Island almost gone in mid-February; pumice reaches Australia
Manam (Papua New Guinea)
Mild eruptive activity between August 2006 and May 2007
Popocatepetl (Mexico)
Minor explosions and lava dome growth
Raoul Island (New Zealand)
Update on March 2006 eruption; new submarine volcanoes discovered
Santa Ana (El Salvador)
Lahars follow October 2005 eruptions; steam emissions
Soufriere Hills (United Kingdom)
Seismic activity continues at a reduced level through 1 June
Stromboli (Italy)
Flank eruption begins on 27 February 2007
Sulu Range (Papua New Guinea)
Non-eruptive, but geysers and indications of a shallow dike intrusion
Tungurahua (Ecuador)
Post-eruptive quiet spurs return of residents, but activity increases again in 2007
Aira
Japan
31.5772°N, 130.6589°E; summit elev. 1117 m
All times are local (unless otherwise noted)
Eruption from E-slope Showa crater on 4 June 2007
According to the Sakurajima Volcano Research Center (SVRC) at Kyoto University, an eruption started on 4 June 2006 at the Showa crater, a spot that differs from vents active in recent decades at the summit of Minami-dake ("south mountain"; BGVN 31:06 and many previous reports). The Showa crater resides on the E slope of Minami-dake at an elevation of ~ 800 m (figures 23, 24, and 25). Showa crater was formed in a 1946 eruption; the 1946 vent was the source of lava flows that spread E and then branched to travel S and ENE (figure 25).
Unfortunately, at press time many details still remained unavailable to Bulletin editors regarding the duration and character of the return of venting at Showa crater. It is also unclear to what extent the Minami-dake summit craters continued to participate in the emissions.
The 4 June 2006 eruption continued intermittently, including an evening eruption on 7 June which sent an ash column ~ 1 km above the crater. Figure 26 shows one such eruption on 6 June.
A series of plots describe the short- and long-term seismicity and volume of magma supplied at Sakura-jima (figures 27 and 28). The number of shallow earthquakes had increased since the middle of March 2006 (figures 26 and 27), and small volcanic tremors with a duration shorter than 2 minutes had increased since the middle of May 2006. GPS data showed continued inflation in the N part of the Aira caldera, an observation attributed to incoming magma. Kazuhiro Ishihara, director of SVRC, commented that the present eruption was considered to be related to magma accumulating in the Aira caldera and searching for an exit.
Table 14 presents a chronology of ash-plume observations made since the previous Bulletin report (BGVN 31:06). The table is based primarily on reports from Tokyo Volcanic Ash Advisory Center (VAAC) and covers the interval 7 June 2006 to 20 March 2007. Most of the plumes described did not exceed 3 km altitude. The tallest plume recorded on the table, an ash plume on 20 March 2007, rose to 3.7 km altitude.
Table 14. Heights and drift of plumes and their character at Sakurajima from June 2006-March 2007. Some of the data during mid-June 2006 were previously reported, but new information has emerged. Courtesy of SVRC and Tokyo Volcanic Ash Advisory Center.
| Date |
Plume altitude/drift |
Other observations |
| 07-12 Jun 2006 |
3.4 km |
-- |
| 10 Jun 2006 |
-- |
SVRC reported increase in low-frequency earthquakes since mid-March and in small tremors with a less than 2-minute duration since mid-May 2006; thermal anomaly at the volcano grew in size after February 2006. |
| 14, 16, 19 Jun 2006 |
2.1 km |
-- |
| 02 Aug 2006 |
2.4 km/SW |
explosion |
| 09 Aug 2006 |
2.4 km/straight up |
eruption |
| 22, 23, 26 Aug 2006 |
2.4 km/SW |
eruptions |
| 03-04 Sep 2006 |
2.7 km/NW and N |
eruptions |
| 06 Sep 2006 |
-- |
explosion generated eruption cloud |
| 19 Sep 2006 |
3 km/straight up |
eruption |
| 20, 21 Sep 2006 |
2.4 km |
eruptions |
| 07, 08, 10 Oct 2006 |
1.8-2.4 km/W, S, and SW |
eruptions |
| 21 Oct 2006 |
3.4 km/straight up |
explosions |
| 25 and 27 Oct 2006 |
2.1-2.4 km/SW and NE |
ash plumes |
| 04-05 Nov 2006 |
2.1-2.4 km/NE, SE, E |
eruptions |
| 22 Nov 2006 |
2.1 km/W |
explosions |
| 26 Nov 2006 |
-- |
eruption |
| 12 Dec 2006 |
2.1 km/NE |
eruption |
| 13 Dec 2006 |
-- |
explosion |
| 02 Jan 2007 |
3.4 km/SW |
eruption |
| 10 Feb 2007 |
-- |
explosion |
| 13 Feb 2007 |
2.1 km |
explosion |
| 15 Feb 2007 |
1.5 km |
ash plume |
| 20 Mar 2007 |
3.7 km |
ash plume |
Volcanic hazards research. Lee and others (2005) reported the successful remote measurement of significant amounts of ClO (as well as BrO and SO2) in a volcanic plume from Sakura-jima during May 2004. Near the volcano they also observed halogen-catalyzed, local surface ozone depletion. The investigators employed ground-based, multi-axis, differential optical absorption spectroscopy. Their results help document the presence of a wide range of chemical species that have potential health implications for populations living nearby.
The center of Kagoshima City (population ~ 550,000) sits ~ 10 km from Minami-dake's summit and ~ 4 km from Sakura-jima's E shore (just off figure 24, but along the trend of the arrow labeled KC). According to Durand and others (2001), "Since 1955 the city has been subjected to ashfall from Sakura-jima. Until 1990 ashfalls occurred up to twice per week, although this has decreased in frequency in recent years."
Durand and others (2001) comment that "[Kagoshima City] presents a good opportunity to study the impacts of volcanic ash on key services, or 'lifelines.' In addition, the city provides a chance to see how lifelines have been adapted to counter any problems presented by ashfalls." They also noted that, "The advice from Kagoshima would seem to be that during an ashfall event, people should bring in the washing and shut the doors and windows. People who have to go out and work in ashfall should wear goggles and a face mask. In Kagoshima, umbrellas are the only form of protection for many people going to work during ashfall events."
References. Durand, M.; Gordon, K .; Johnston, D. ; Lorden, R. ; Poirot ,T. ; Scott, J. ; and Shephard, B.; 2001; Impacts of, and responses to ashfall in Kagoshima from Sakurajima Volcano?lessons for New Zealand. Science report 2001/30, Institute of Geological & Nuclear Sciences; Lower Hutt, New Zealand, November 2001 53p. (ISSN 1171-9184, ISBN 0-478-09748-4).
Fukuyama, H. and Ono, K., 1981, Geological Map of Sakura-jima, scale 1:25,000
Kobayashi, Tetsuo, 1988, Geological Map of Sakurajima Volcano, A Guidebook for Sakura-jima Volcano, in Kagoshima International Conference on Volcanoes, 1988 (1:50,000).
Lee, C., Kim, Y. J., Tanimoto, H., Bobrowski, N., Platt, U., Mori, T., Yamamoto, K., and Hong, C. S., 2005, High ClO and ozone depletion observed in the plume of Sakurajima volcano, Japan, Geophysical Research Letters, v. 32, L21809, doi:10.1029/2005GL023785.
Okuno, Mitsuru; Nakamura, Toshio, and Kobayashi, Tetsuo, 1998, AMS 14C dating of historic eruptions of the Kirishima, Sakura-jima and Kaimon-dake volcanoes, Southern Kyushu, Japan. Proceedings of the 16th International 14C Conference, edited by W. G. Mook and van der Plicht, RADIOCARBON, Vol. 40, No. 2, 1998, P. 825,832.
Geologic Background. The Aira caldera in the northern half of Kagoshima Bay contains the post-caldera Sakurajima volcano, one of Japan's most active. Eruption of the voluminous Ito pyroclastic flow accompanied formation of the 17 x 23 km caldera about 22,000 years ago. The smaller Wakamiko caldera was formed during the early Holocene in the NE corner of the caldera, along with several post-caldera cones. The construction of Sakurajima began about 13,000 years ago on the southern rim and built an island that was joined to the Osumi Peninsula during the major explosive and effusive eruption of 1914. Activity at the Kitadake summit cone ended about 4,850 years ago, after which eruptions took place at Minamidake. Frequent eruptions since the 8th century have deposited ash on the city of Kagoshima, located across Kagoshima Bay only 8 km from the summit. The largest recorded eruption took place during 1471-76.
Information Contacts: Sakura-jima Volcano Research Center, Disaster Prevention Research Institute (DPRI), Kyoto University, Gokasho, Uji, Kyoto 611-0011, Japan (URL: http://www.dpri.kyoto-u.ac.jp/~kazan/default_e.html); Tokyo Volcanic Ash Advisory Center (VAAC), Japan Meteorological Agency (JMA) (URL: http://ds.data.jma.go.jp/svd/vaac/data/).
Bagana (Papua New Guinea) — April 2007 Cite this Report
Bagana
Papua New Guinea
6.137°S, 155.196°E; summit elev. 1855 m
All times are local (unless otherwise noted)
Almost daily thermal anomalies over past year; plumes and glow
Brief periods of effusive activity took place during January to mid-April 2006 (BGVN 31:05), with ash-and-steam emissions reported as late as 18 June 2006. Activity has continued since that time through early June 2007, with evidence coming from either MODIS thermal satellite data, observations of glow, or plume observations from the ground or satellites (figure 8). It appears that there were three episodes of increased plume generation, two periods of frequent glow observations, and almost daily MODIS anomalies over that one-year time frame.
The Rabaul Volcano Observatory (RVO) noted that between 18 September and 4 December 2006 only white vapor was released; some of these emissions were forceful. Jet engine-like roaring noises were heard on 11 and 20 November. Variable glow was visible on 25-26 September, 15, 20, and 29 October, 15-21 November, and 4 December. The lava flow on the S flank was active only on 15 October.
There were no aviation warnings after June until a diffuse plume became visible on satellite imagery on 22 November. Based on satellite imagery, the Darwin Volcanic Ash Advisory Centre (VAAC) reported subsequent plumes on 5 December (ash), 21-22 December (ash-and steam), and 9 January 2007.
RVO reported that white vapor emissions from the summit crater continued during 10 January-21 May 2007. Emissions were occasionally forceful and were accompanied by ash clouds on 3 and 17 March, as well as 1 and 3-5 April. Summit incandescence was visible on 7, 8, 20, and 24 March, and 17 May. Based on satellite imagery, the Darwin VAAC reported diffuse plumes to altitudes of 2.4 and 3 km on 10 March and 20 May, respectively. Forceful, white emissions on 21 May produced plumes that rose to an altitude of 2.3 km and drifted W. Diffuse ash-and-steam plumes were seen in satellite images again on 22 and 28 May, rising to altitudes of 3.7 and 3 km, respectively.
Moderate Resolution Imaging Spectroradiometers (MODIS) satellite thermal anomaly data reported by the Hawai'i Institute of Geophysics and Planetology (HIGP) revealed frequent thermal anomalies during 20 June-24 July 2006, 16 August-3 October 2006, 9 November 2006-23 January 2007, and 13 February-2 June 2007.
Geologic Background. Bagana volcano, in a remote portion of central Bougainville Island, is frequently active. This massive symmetrical cone was largely constructed by an accumulation of viscous andesitic lava flows. The entire edifice could have been constructed in about 300 years at its present rate of lava production. Eruptive activity is characterized by non-explosive effusion of viscous lava that maintains a small lava dome in the summit crater, although occasional explosive activity produces pyroclastic flows. Lava flows with tongue-shaped lobes up to 50 m thick and prominent levees descend the flanks on all sides.
Information Contacts: Herman Patia, Rabaul Volcano Observatory (RVO), P.O. Box 386, Rabaul, Papua New Guinea; Darwin Volcanic Ash Advisory Centre (VAAC), Bureau of Meteorology, Northern Territory Regional Office, PO Box 40050, Casuarina, Northern Territory 0811, Australia (URL: http://www.bom.gov.au/info/vaac/); Hawai'i Institute of Geophysics and Planetology (HIGP) Hot Spots System, University of Hawai'i, 2525 Correa Road, Honolulu, HI 96822, USA (URL: http://modis.higp.hawaii.edu/).
Bulusan (Philippines) — April 2007 Cite this Report
Bulusan
Philippines
12.769°N, 124.056°E; summit elev. 1535 m
All times are local (unless otherwise noted)
Continued explosive eruptions and ashfall during October 2006 through May 2007
Activity declined at Bulusan in late June 2006 after a series of 10 explosions that began on 19 March 2006 (BGVN 31:09). Between 30 August and 1 September steam plumes reached up to 350 m above the summit; the plumes drifted NW and SE. This report summarizes Bulusan's activity from 10 October 2006 through 12 May 2007 (table 4). Hazard maps created by the Philippine Institute of Volcanology and Seismology (PHIVOLCS) illustrate the risks to the large numbers of cummunities in the vicinity of the volcano (figure 7). Review of the available MODIS data indicates no thermal alerts during the year prior to 31 May 2007.
Table 4. An overview of Bulusan's activity, as noted by PHIVOLCS during 10 October 2006 through 12 May 2007. Courtesy of PHIVOLCS.
| Date |
Plume altitude |
Drift direction(s) |
Areas affected by ashfall or lahars |
Remarks |
| 10 Oct 2006 |
3 km |
SSW and SE |
Irosin: San Benon, Sto. Domingo, and Patag, Bulusan: Bulusan Proper, San Roque, San Rafael, San Francisco, and Dangkalan. |
Accompanied by rumbling sound. |
| 19 Oct 2006 |
-- |
-- |
Irosin: Monbon, Gulang-Gulang, Cogon (traces of ash); Tinampo (0.5 mm thick ash). |
Not observed, but recorded as explosion-type earthquake lasting for 2 minutes. |
| 23 Oct 2006 |
1 km |
SE and SW |
Irosin: Monbon and Tinampo (0.5 mm thick ash); Gulang-Gulang, and Tinampo (trace). |
Accompanied by rumbling sounds. |
| 25-26 Oct 2006 |
-- |
-- |
Irosin: Cogon (sediments 15 cm thick); Lahar (channel-confined muddy stream flow). |
-- |
| 30 Oct 2006 |
~1 km |
N and NW |
Light ashfalls (trace to 1.0 mm): Casiguran: Inlagadian, San Juan, Casay, and Escuala; Gubat-Bentuco, Tugawe, Benguet, Rizal, Buenavista, Ariman, Tabi, Bulacao, Naagtan, Panganiban, Carriedo, and Gubat proper. |
Series of three explosion explosion-type earthquakes lasting 35 minutes, accompanied by rumbling sounds. |
| 31 Oct 2006 |
0.7 km |
N and NE |
Casiguran: Inlagadian. |
Small tremor that lasted for ~8 minutes. |
| 31 Oct 2006 |
-- |
-- |
Irosin: Patag and Mapaso. |
Not observed due to thick cloud cover; recorded as explosion type earthquake. |
| 21-28 Nov 2006 |
-- |
-- |
-- |
Seismic swarm - total of 170 events in three days; majority of epicenters more than 2 km away from the summit; 16-87 earthquakes daily. |
| 20 Dec 2006 |
-- |
-- |
Irosin: ashfall at Monbon (1.5 mm), Buenavista (1.5 mm), Salvacion (2.5 mm), Casini (4.0 mm), Patag (trace), Santo (Sto.) Dmingo (trace), Tulay (3.0 mm), Poblacion (0.5 mm), and Bulan-Trece and Gate (trace). |
Explosion-type earthquake for 20 minutes, accompanied by rumbling sound and lightning flashes. |
| 24 Jan 2007 |
-- |
-- |
Traces of ash in Irosin: Cogon, Monbon, San Benon, Gulang-Gulang (including Sito Omagom) and Tinampo. |
Explosion-type earthquake for 10 minutes. |
| 26 Jan 2007 |
1.0 km |
SW |
Irosin: Barangay Monbon. |
Explosion-type earthquake lasting for 10 minutes. |
| Feb-Mar 2007 |
-- |
-- |
Areas SW of the volcano. |
Dirty white moderate to voluminous steam emission, no seismic record of ash explosion. |
| 07 Apr 2007 |
-- |
-- |
-- |
Increase in number of volcanic earthquakes; total of 68 events for two days. |
| 08 Apr 2007 |
4.0 |
SW |
Irosin: Mombon, Tinampo, Cogon, Gulang-Gulang (including Sitio Omagom), Bolos, and Sangkayon; Juban: Bura-buran and Bacolod; Magallanes: Siuton; Bulan: Cadandanan, Busay, Palale, San Francisco, and Sumagongsong. |
Explosion-type earthquake for 27 minutes. |
| 09 Apr 2007 |
-- |
-- |
-- |
Not seen, but recorded as explosion-type earthquake lasting for 20 minutes, accompanied by rumbling sounds. |
| 09 Apr 2007 |
-- |
-- |
-- |
Not observed, but recorded as explosion-type earthquake for 20 minutes. |
| 17 Apr 2007 |
-- |
-- |
-- |
Increase in number of volcanic earthquakes; total of 35 events for 24 hours. |
| 12 May 2007 |
4.0 |
WSW, WNW |
Trace to 2 mm of ashfall. Irosin: Cogon, Gulang-Gulang, Tinampo, Bolos of Irosin. Juban: Bura-buran, Sangkayon, Bacolod, Puting Sapa, Aniog, and Sitio Cawayan (Bgy. Guruyan). |
Event accompanied by rumbling sounds; recorded as explosion-type earthquake lasting for 35 minutes; elevated numbers of volcanic earthquakes. |
PHIVOLCS reported an explosion from Bulusan on 10 October that produced an ash-and-steam plume that rose to 4.5 km altitude and drifted mainly SE and SSW. Light ashfall (1.5-5.0 mm thick) was reported in neighboring towns downwind. Based on seismic data, the activity lasted for 9 minutes. On 11 and 12 October, steam plumes drifted SW and SSW. Another explosion occurred on 19 October. The following day, steam plumes drifted W and WSW. On 23 October, an explosion produced a brownish ash plume that rose to about 2.6 km and drifted SE and SW. Light ashfall (trace to 0.5 mm thick) from the 19 and 23 Cctober explosions was reported from neighborhoods in the municipality of Irosin, about 7 km S of the summit.
During 25-26 October, PHIVOLCS reported a lahar that deposited sediments 15 cm thick along a tributary leading to the Gulang-gulang River. According to news articles, the lahar mobilized boulders as large as trucks and caused at least 96 people to evacuate. During 30-31 October, ash explosions generated a light gray ash-and-steam plume that rose to 2.3 km and drifted NNE. Later field inspection revealed ashfall (trace to 1 mm) N of the volcano, as well as in the municipalities of Casiguran and Gubat, about 12 km SSE and 18 km NNE, respectively, from the summit. Two explosion-type earthquakes recorded late on 31 October were followed by ashfall in Casiguran, Malapatan, and Irosin.
News articles and wire services reported that Bulusan emitted ash accompanied by rumbling noises and lightning flashes on 20 December. Clouds hindered a view of the summit. Ash deposits up to 4 mm thick were noted in several villages in the foothills. A news report in News Balita noted a plume of gas and "white ash" on 22 December.
In January 2007, PHIVOLCS reported that an explosion from the summit on 24 January lasted about 10 minutes, based on seismic interpretation. Observation was inhibited due to cloud cover. Ashfall was reported SW of the volcano.
On 15 March, news media reported that ash fell on Bulusan's SW slopes and nearby villages. A resident volcanologist stated that ashfall was caused by voluminous steaming during 12-15 March, not explosions. Other news articles stated that eruptions on 8 April produced ash plumes that rose to altitudes of 3.1-6.6 km.
PHIVOLCS reported another ash explosion on 12 May 2007 with an eruption column reaching a maximum height of 4 km above the summit before drifting to the WSW and WNW. The activity was accompanied by rumbling sounds and was recorded by the seismic network as an explosion type earthquake that lasted for about 35 minutes. Prior to the explosion, during 9-12 May, an increase in the daily number of volcanic earthquakes was noticed, with 42, 65 and 97 events recorded.
Geologic Background. Luzon's southernmost volcano, Bulusan, was constructed along the rim of the 11-km-diameter dacitic-to-rhyolitic Irosin caldera, which was formed about 36,000 years ago. It lies at the SE end of the Bicol volcanic arc occupying the peninsula of the same name that forms the elongated SE tip of Luzon. A broad, flat moat is located below the topographically prominent SW rim of Irosin caldera; the NE rim is buried by the andesitic complex. Bulusan is flanked by several other large intracaldera lava domes and cones, including the prominent Mount Jormajan lava dome on the SW flank and Sharp Peak to the NE. The summit is unvegetated and contains a 300-m-wide, 50-m-deep crater. Three small craters are located on the SE flank. Many moderate explosive eruptions have been recorded since the mid-19th century.
Information Contacts: Philippine Institute of Volcanology and Seismology (PHIVOLCS), University of the Philippines Campus, Diliman, Quezon City, Philippines (URL: http://www.phivolcs.dost.gov.ph); Tokyo Volcanic Ash Advisory Center, Tokyo, Japan (URL: http://www.jma.go.jp/jma/jma-eng/jma-center/vaac/index/html); Inquirer.net, Philippines (URL: http://www.inquirer.net/); Associated Press (URL: http://www.ap.org/); News Balita, Philippines (URL: http://news.balita.ph/).
Home Reef
Tonga
18.992°S, 174.775°W; summit elev. -10 m
All times are local (unless otherwise noted)
Island almost gone in mid-February; pumice reaches Australia
The new island at Home Reef that was constructed by the 8-11 August 2006 felsic shallow marine explosive eruption (BGVN 31:09) was visited on 18 February 2007 by Scott Bryan (Kingston University, United Kingdom), Alex Cook (Queensland Museum, Australia), and Peter Colls (University of Queensland, Australia). The initial aim of field research was to map and describe the volcanic geology of the new island at Home Reef and to collect samples for comparison to floating pumice generated by the eruption (Bryan, 2007).
Island observations. Satellite imagery on 4 October 2006 showed an 800-m-long elongate island (0.23-0.26 km2), which was being rapidly modified by wave erosion (BGVN 31:10). An overflight by the RNZAF on 7 December 2006 revealed a roughly circular island, 450 m in diameter and up to 75 m above the water line (BGVN31:12). Upon arrival on 18 February 2007, the scientists found that only a small (50-75 m diameter) <5 m high low-relief wave-reworked "pumice mound" remained at the southern windward end of the Home Reef shoal (figure 23). Due to strong winds and large swells, landing on the tidally-exposed mound was not possible and it could only be viewed from a couple of hundred meters offshore. The location of the mound (18.993°S 174.758°W) is close to that reported for the circular island observed on 7 December 2006. Swells 2-m high or greater were strongly impacting the mound, with the largest waves almost completely engulfing and sweeping over the mound at half-tide.
The morphology of the island suggests that no primary subaerial island-building deposits remain from the eruption and that complete reworking has occurred of the previously observed cone. On the southern side of the pumice mound were scattered large (>1 m diameter), outsized blocks (10-20 in number) on the mound surface (figure 23) that were largely immobile in the waves. Slopes of the mound reflected wave run-up and the pumiceous material comprising the mound appeared to be relatively coarse and well-sorted. There was little entrained particulate material in the water column downwind and downcurrent, but considerable amounts of material within the surf zone surrounding the island, coloring the water brown. A considerable area of discolored water (green, translucent milky) extended N of the mound for more than 500 m. Several smaller lobes or plumes extended off the W side of the main body of discoloration.
A strong sulfurous odor was detected downwind (NW) of the mound, indicating that magma was continuing to cool and degas at shallow levels in the seamount seven months after the eruption; no surface plume was visible. Surface water temperature measurements did not detect any thermal anomalies, recording ambient water temperatures (28-29°C).
Local pumice sightings. Downwind and downcurrent of the mound were small scattered pumice stringers forming orange-brown slicks a few meters to tens of meters long, characterized by low pumice clast abundance and size (usually 0.5-1 cm diameter). The pumice fragments were generally moderate to high sphericity grains, but some more platy pumice fragments were also sampled. Some clasts had orange to brown surface stains, reflecting hydrothermal alteration since the eruption. Most grains showed some signs of abrasion. Orange-brown algal clumps or coagulates floating on the ocean surface were associated with the stringers.
Small pumice rafts were also encountered around some of the islands at the SW end of the Vava'u Group during the week of 17-24 February (figure 24). The pumice rafts had lateral extents of tens of meters, but other flotsam (leaf, twig, sea grass and plastics) was also present. Pumice clast sizes ranged from ~ 2 mm up to 6 cm, and some of the gray pumice possessed orange-brown surface hydrothermal staining. Some rafts had abundant attached fauna, dominated bygoose barnacles (Lepas sp.) ~ 2-7 mm long. Much of these pumice rafts reflected remobilization of previously stranded material from neighboring beaches, and many SE-facing beaches had been stripped of pumice by strong SE trade winds.
Many beaches had several pumice strandline deposits, the lowermost of which reflected tidal sorting. Dominantly lapilli-sized gray pumice formed the deposits, whereas a black glassy, moderately vesicular pumice of higher density was a notable feature of the highest strandlines. There were also abundant pumice clasts with an orange-brown staining on clast surfaces.
Floating pumice reaches Australia. Pumice rafts and beach strandings were reported previously as the pumice drifted westward past the Lau and Fiji islands and on to Vanuatu in November 2006. A major influx of pumice reached the E coast of northeastern Australia during March and April 2007, seven to eight months after the eruption. Pumice was first noticed passing the offshore islands of Willis Island (16.30°S, 149.98°E) in early February, and Lizard Island (14.66°S 145.47°E) the last week of February. Pumice strandings along the eastern Australian coast began in March in northern Queensland, with a substantial stranding occurring in mid-April corresponding to a change to easterly and northeasterly onshore wind conditions and king tides. This stranding event extended for more than 1,300 km along the Queensland and northern New South Wales coast.
Most stranded pumice clasts ranged in size from 1-4 cm diameter, with the largest clasts up to 17 cm diameter. Pumice clasts were fouled by a variety of organisms, primarily goose barnacles (Lepas sp.) up to 2.7 cm long, molluscs, bryozoa, and dark green algae (figure 25), with serpulids, oysters and other species of algae (e.g., Halimeda) less abundant. A substantial proportion of stranded pumice material remains on beaches inshore from the Great Barrier Reef. However, little stranded material has remained on exposed beaches south of 25°S, to the extent that some beaches still have more pumice preserved from the 2001 eruption of an unnamed Tongan seamount about 85 km NW of Home Reef.
Seismicity. Although no seismicity has been reported that was detected during the eruption, Robert Dziak identified seismic signals from Home Reef in March 2006. The East Pacific hydrophone array maintained by NOAA recorded 52 earthquakes over a 12-hour period beginning at 1700 UTC on 12 March 2006. The arrivals were all very clear and had medium to low T-wave amplitudes.
Reference. Bryan, S.E., 2007, Preliminary Report: Field investigation of Home Reef volcano and Unnamed Seamount 0403-091: Unpublished Report for Ministry of Lands, Survey, Natural Resources and Environment, Tonga, 9 p.
Geologic Background. Home Reef, a submarine volcano midway between Metis Shoal and Late Island in the central Tonga islands, was first reported active in the mid-19th century, when an ephemeral island formed. An eruption in 1984 produced a 12-km-high eruption plume, large amounts of floating pumice, and an ephemeral 500 x 1,500 m island, with cliffs 30-50 m high that enclosed a water-filled crater. In 2006 an island-forming eruption produced widespread dacitic pumice rafts that drifted as far as Australia. Another island was built during a September-October 2022 eruption.
Information Contacts: Scott Bryan, School of Earth Sciences & Geography, Kingston University, Kingston Upon Thames, Surrey KT1 2EL, United Kingdom; Peter Colls, School of Physical Sciences, University of Queensland, St Lucia, Queensland 4072, Australia; Robert Dziak, NOAA Pacific Marine Environmental Laboratory (PMEL), Hatfield Marine Science Center, 2115 SE Oregon State University Drive, Newport, OR 97365, USA.
Manam (Papua New Guinea) — April 2007 Cite this Report
Manam
Papua New Guinea
4.08°S, 145.037°E; summit elev. 1807 m
All times are local (unless otherwise noted)
Mild eruptive activity between August 2006 and May 2007
Eruptive activity at Manam has generally been low following a significant explosion in late February 2006 (BGVN 31:02). Between March and July 2006 the Rabaul Volcano Observatory (RVO) reported intermittent, milder, ash explosions (BGVN 31:06). Similar variable activity has continued into early May 2007, with plumes frequently identified on satellite imagery by the Darwin Volcanic Ash Advisory Centre (VAAC).
RVO received a report that four people were swept away by a mudflow in the early hours of 13 March following heavy rainfall on the northern part of the island. A 5th person was reportedly critically wounded and in a hospital.
Activity during August-December 2006. On 4 and 5 August, an ash plume was visible on satellite imagery extending 30 km NW. Ash plumes were emitted again during 14-15August. Over the next couple of days, the emissions became more diffuse and weak incandescence was observed at night. Based on pilot reports and satellite imagery, continuous emissions during 17-21 August eached altitudes of 3.7 km and drifted NW. Eruptive activity from Main Crater during 22-23 August consisted mainly of dark brown-to-gray ash plumes that rose 1-2 km above the summit and drifted W and NW. The Darwin VAAC reported that eruption plumes were visible on satellite imagery on 23 and 26 August, extending NW. Southern Crater continued to release only diffuse white vapor.
From the end of August to 5 September 2006, the Darwin VAAC reported that ash-and-steam plumes reached altitudes of 4.6 km and drifted W. Steam plumes with possible ash were visible on imagery below 3 km and drifted NE. RVO reported mild eruptive activity during 15-17 October that consisted of steam and ash plumes. White vapor plumes were visible from Southern Crater and intermittently from Main Crater. Main Crater produced gray ash plumes on 19 October. Weak incandescence was seen during 15-17 and 29 October.
During 1-13 November, white vapor plumes rose from Southern and Main craters. Incandescence was noted from both craters during 8-10 November and from Main Crater on 12 November. On 13 November a diffuse plume seen on satellite imagery drifted W. Steady incandescence was again observed from Main Crater during 8-10 December and bluish white vapor emissions during 6-9 December changed to a darker gray on 10 December. Weak glow continued from Main Crater during 14-18 December and a white vapor plume rose just above 2 km altitude. Based on satellite imagery, diffuse plumes drifted mainly W during 13-15 December. The daily number of volcanic earthquakes fluctuated between 700 and 1,000.
Activity during January-May 2007. RVO reported that mild eruptive activity and emissions of white vapor plumes from Main Crater were observed during 1-14 January. Brown-to-gray ash plumes accompanied emissions on 6 and 9-11 January; and nighttime incandescence was observed intermittently. White vapor clouds were occasionally released from Southern Crater. Seismic activity was at low to moderate levels; the daily number of low-frequency earthquakes fluctuated between 500 and 1,000.
Satellite imagery showed diffuse plumes drifting WSW on 15 February. Southern Crater emitted gray ash plumes during 15-19 February and white vapor plumes on 21 February. Continuous gray ash plumes from Main Crater rose to an altitude of 2.3 km and drifted SE during 19-21 February. The daily number of low-frequency earthquakes fluctuated between 400 and 500 during 22-24 February before the seismograph developed technical problems.
Mild eruptive activity continued during 22 February-10 March. Main Crater forcefully released variable gray ash clouds on 22 February that rose less than 1 km above the summit before being blown SE. Incandescence was also visible that day. Poor weather prevented observations for the remainder of the month. When the clouds cleared on 3 March, Main Crater was seen sending ash clouds less than 500 m high. Glow was visible during 2-5 and 9-10 March. Southern Crater released occasional diffuse gray ash clouds on 3-4 and 6 March, but only white vapor on 5 and 7-11 March.
Main Crater continued to release occasional low-level ash clouds through 6 April. Incandescence was visible during clear weather on the nights of 11-12 and 16-18 March. Southern Crater released diffuse white vapor on 11-12 and 15 March; however, diffuse ash clouds were reported on 16-20 March. Weak roaring noises were heard on 24 March, and on 7, 12, and 26 April. Low-level plumes were seen during 25-26 April, and a small plume was blowing W on 28 April. Weak incandescence was again visible from Main Crater on 2 and 4 May. Diffuse plumes were seen in satellite imagery on 6 and 23 May. Seismic activity was at a low level, with the daily number of volcanic earthquakes between 800 and 1,000 events.
Thermal satellite data. Thermal anomalies were not detected by Moderate Resolution Imaging Spectroradiometers (MODIS) for 9 months after events related to the 27-28 February 2006 explosion. Anomalies reappeared in December, with hot pixels detected on 5, 7, 9, 10, 12, and 14 December 2006. Another anomaly was recorded on 19 April 2007. Additional thermal anomalies were present on 16 and 23 May 2007. Most of the pixels were located near the summit, or slightly towards the NE. The May anomalies were the furthest down the NE Valley.
Geologic Background. The 10-km-wide island of Manam, lying 13 km off the northern coast of mainland Papua New Guinea, is one of the country's most active volcanoes. Four large radial valleys extend from the unvegetated summit of the conical basaltic-andesitic stratovolcano to its lower flanks. These valleys channel lava flows and pyroclastic avalanches that have sometimes reached the coast. Five small satellitic centers are located near the island's shoreline on the northern, southern, and western sides. Two summit craters are present; both are active, although most observed eruptions have originated from the southern crater, concentrating eruptive products during much of the past century into the SE valley. Frequent eruptions, typically of mild-to-moderate scale, have been recorded since 1616. Occasional larger eruptions have produced pyroclastic flows and lava flows that reached flat-lying coastal areas and entered the sea, sometimes impacting populated areas.
Information Contacts: Herman Patia and Steve Saunders, Rabaul Volcano Observatory (RVO), P.O. Box 386, Rabaul, Papua New Guinea; Darwin Volcanic Ash Advisory Centre (VAAC), Bureau of Meteorology, Northern Territory Regional Office, PO Box 40050, Casuarina, Northern Territory 0811, Australia (URL: http://www.bom.gov.au/info/vaac/); Hawai'i Institute of Geophysics and Planetology (HIGP) Hot Spots System, University of Hawai'i, 2525 Correa Road, Honolulu, HI 96822, USA (URL: http://modis.higp.hawaii.edu/); NASA Earth Observatory (URL: http://earthobservatory.nasa.gov/).
Popocatepetl (Mexico) — April 2007 Cite this Report
Popocatepetl
Mexico
19.023°N, 98.622°W; summit elev. 5393 m
All times are local (unless otherwise noted)
Minor explosions and lava dome growth
Centro Nacional de Prevencion de Desastres (CENAPRED) reported only sporadic, modest activity at Popocatépetl during early 2006 through April 2007. Based on information from the Mexico City Meteorological Watch Office (MWO), and the Washington Volcanic Ash Advisory Center (VAAC), there were five occasions when ash plumes rose substantially. On 25 and 27 July 2006 ash plumes rose to an altitude of ~ 9.8 km. On 18 and 20 December 2006, ash plumes rose to an altitude of ~ 6.7 km and 7.9 km, respectively. In April 2007, ash plumes rose to ~ 7.6 km on the 1st, and to ~ 7.3 km on the 3rd.
In August 2006, the lava dome that had been irregularly growing since July 2005 covered the floor of the internal crater and began a piston-like growth on the top of the previous dome. The enlarged dome can be seen in an aerial photography taken in 24 November 2006 (figure 51). This formation of the dome was the twenty-sixth such event since 1996.
On 4-5 August and 1-3 November 2006 episodes of large-amplitude harmonic tremor (figure 52) were believed to reflect an increased rate of dome growth. The accumulated volume of the lava dome between November of 2005 and November of 2006 was estimated to be 1,299,000 m3. The average rate growth over that interval is around 0.04 m?/s. Assuming that the dome grows only during the tremor episodes, the rate would be ~ 6.75 m3/s.
Incandescence at the summit was recorded by the CENAPRED camera on 3 August and 4-5 September 2006. Over 27-29 October 2006, eigth small explosions ejected incandescent debris on the slopes surrounding the crater. During November and December 2006, more episodes of low amplitude tremors were recorded. From August to December 2006, 77 volcano-tectonic micro-earthquakes were detected, with magnitudes ranging between 2.0 and 3.0. From these, 66 were located below the crater at depths ranging between 3 and 7 km (figure 53).
Hot spots at the summit were detected on satellite imagery by the Washington Volcanic Ash Advisory Center (VAAC) on 7-8 January 2007. According to the Washington VAAC, a puff with little ash content emitted from Popocatépetl was reported from the MWO and visible from the camera operated by CENEPRED on 14 February 2007. A very diffuse plume was seen drifting to the E on satellite imagery. Base on an aerial photograph taken on 24 January 2007, CENEPRED reported that the lava-dome dimensions have slightly increased since 24 November 2006.
Geologic Background. Volcán Popocatépetl, whose name is the Aztec word for smoking mountain, rises 70 km SE of Mexico City to form North America's 2nd-highest volcano. The glacier-clad stratovolcano contains a steep-walled, 400 x 600 m wide crater. The generally symmetrical volcano is modified by the sharp-peaked Ventorrillo on the NW, a remnant of an earlier volcano. At least three previous major cones were destroyed by gravitational failure during the Pleistocene, producing massive debris-avalanche deposits covering broad areas to the south. The modern volcano was constructed south of the late-Pleistocene to Holocene El Fraile cone. Three major Plinian eruptions, the most recent of which took place about 800 CE, have occurred since the mid-Holocene, accompanied by pyroclastic flows and voluminous lahars that swept basins below the volcano. Frequent historical eruptions, first recorded in Aztec codices, have occurred since Pre-Columbian time.
Information Contacts: Centro Nacional de Prevención de Desastres (CENAPRED), Av. Delfín Madrigal No.665. Coyoacan, México D.F. 04360, México (URL: https://www.gob.mx/cenapred/); Alicia Martinez Bringas and Angel Gómez Vázquez, CENAPRED; Servando de la Cruz Reyna, Insituto de Geofisica UNAM. Ciudad Universitaria, s/n. Circuito Institutos . Coyoacan México D.F. México; Washington Volcanic Ash Advisory Center (VAAC), Satellite Analysis Branch (SAB), NOAA/NESDIS E/SP23, NOAA Science Center Room 401, 5200 Auth Road, Camp Springs, MD 20746, USA (URL: http://www.ospo.noaa.gov/Products/atmosphere/vaac/).
Raoul Island (New Zealand) — April 2007 Cite this Report
Raoul Island
New Zealand
29.27°S, 177.92°W; summit elev. 516 m
All times are local (unless otherwise noted)
Update on March 2006 eruption; new submarine volcanoes discovered
This report discusses evidence for the end of the March 2006 eruption, and press releases announcing newly acquired multibeam bathymetry that disclosed submarine calderas on the flanks of Raoul Island and some adjacent volcanoes.
End of the March 2006 eruption. After the 17 March 2006 eruption (BGVN 31:03), volcanic activity decreased significantly. On 18 September 2006 the Alert Level was lowered to 0.
GeoNet Science (GNS) summarized the decreased activity in their Volcano Alert Bulletin of 18 September 2006. The report noted an absence of significant earthquakes within ~ 30 km of Raoul Island. The water level in Green Lake had continued to drop and was close to the pre-eruption level by 18 September. On 27 August the lake temperature was 20.3°C, well within the seasonal range. The level of ongoing hydrothermal activity (upwelling in Green Lake, nearby hot pools, and steaming ground) was commensurate with that expected six months after an eruption like that seen in March. Chemical analyses of samples recently collected from some of the thermal features were typical of volcano-hydrothermal features in this environment.
GNS reported that the water level in Green Lake, which had risen significantly during the week after the March 2006 eruption and had drowned several new steam vents, still remained above pre-eruption levels as of July 2006, but thereafter dropped slowly. Upwelling and bubbling of springs indicated the volcanic-hydrothermal system was still weakly active 3 months after the eruption. The water temperature, obtained from a thermal infrared satellite image taken on 11 April 2006, was 39.2°C, was 7°C above the average water temperature in April, but had returned to seasonal temperatures by August 2006.
Only 1 to 5 earthquakes were recorded per day in the months following the eruption. The number of earthquakes 30-40 km offshore was slightly higher than normal.
New submarine volcanoes discovered. Marine geologists who had investigated two volcanoes in the Kermadec Arc during May 2007, discovered two new submarine volcanoes near Raoul Island. The geologists were on a scientific expedition mounted by New Zealand's National Institute of Water & Atmospheric Research (NIWA) and the University of Auckland aboard NIWA's deepwater research vessel Tangaroa. They investigated volcanoes on the two largest Kermadec Islands (Raoul and Macauley) and their submerged flanks.
A 22 May 2007 press release by NIWA reported that new seafloor observations revealed for the first time the presence of two submerged calderas. Both calderas were relatively small, ~ 4 km in diameter. One caldera was very deep, measuring ~ 1 km from the rim to the crater floor. Both volcanoes appeared geologically young, on the order of thousands of years old, but laboratory analysis of sediments will be needed to better quantify their age.
The expedition took sediment samples and mapped the contours of the volcanoes both above and below sea level (the latter using multibeam sonar). A series of sediment cores taken from E and W of both islands revealed at least six eruptions from the two islands, recorded as centimeter-thick layers up to 100 km from the islands.
Geologic Background. Anvil-shaped Raoul Island is the largest and northernmost of the Kermadec Islands. During the past several thousand years volcanism has been dominated by dacitic explosive eruptions. Two Holocene calderas exist, the older of which cuts the center the island and is about 2.5 x 3.5 km wide. Denham caldera, formed during a major dacitic explosive eruption about 2200 years ago, truncated the W side of the island and is 6.5 x 4 km wide. Its long axis is parallel to the tectonic fabric of the Havre Trough that lies W of the volcanic arc. Historical eruptions during the 19th and 20th centuries have sometimes occurred simultaneously from both calderas, and have consisted of small-to-moderate phreatic eruptions, some of which formed ephemeral islands in Denham caldera. An unnamed submarine cone, one of several located along a fissure on the lower NNE flank, has also erupted during historical time, and satellitic vents are concentrated along two parallel NNE-trending lineaments.
Information Contacts: Steve Sherburn, GeoNet Science (GNS), Wairakei Research Centre, Private Bag 2000, Taupo, New Zealand; Ian Wright, Ocean Geology group, National Institute of Water & Atmospheric Research (NIWA), PO Box 14901, Wellington, New Zealand (URL: http://www.niwascience.co.nz); Roger Matthews, North Shore City Council, 1 The Strand, Takapuna Private Bag 93500, Takapuna, North Shore City, New Zealand (URL: http://www.northshorecity.govt.nz/).
Santa Ana (El Salvador) — April 2007 Cite this Report
Santa Ana
El Salvador
13.853°N, 89.63°W; summit elev. 2381 m
All times are local (unless otherwise noted)
Lahars follow October 2005 eruptions; steam emissions
Our last report (BGVN 31:01) discussed post-eruption lahars following the sudden 1 October 2005 eruption (BGVN 30:09). This report contains two sections. The first section addresses regional processes such as vegetation loss, ash accumulation, and lahars on and beyond the E flank of Santa Ana (also known as Ilamatepec) to the shores of Lake Coatepeque. Those lahars began soon after the 1 October 2005 eruption. The information on these lahars chiefly came from a report (SNET, 2006) authored by El Salvador's Servicio Nacional de Estudios Territoriales (SNET).
The second section addresses monitoring and observations such as extensive steaming and drop in the surface elevation of the lake in the summit crater. Material for this section, primarily found on the SNET website, covers January-April 2006, when activity was fumarolic with no large eruptions. The 1 October 2005 eruption was possibly followed by a second one two days later on 3 October (SNET, 2006). A 3 October eruption was not mentioned in previous Bulletin reports.Carlos Pullinger explained that the evidence for the second eruption was tremor that day, but that could stemmed from other causes such as geysers in the summit crater lake, so the evidence for a 3 October eruption remains equivocal.
E-flank issues. October 2005 volcanism took place coincident with unusually high rains during tropical storm Stan (1-10 October 2005). On the E flank, the October 2005 eruptive episode killed extensive vegetation and left loose ash deposits covering the upper slopes (figure 7).
Based on a rain gauge 5 km W of the crater (national meteorological station Los Naranjos), rainfall in October averages 193 mm; the yearly average is 2,155 mm. In the months prior to October 2006, rainfall at that station remained at normal values, always below 460 mm per month. In contrast, rainfall reached 865 mm during October 2006. During the peak of the storm, 3-6 October 2005, the Los Naranjos rain gauge collected more than 100 mm per day; the highest reading of 320 mm was on 5 October.
The lahars on Santa Ana's E slope consisted of both material from the October 2005 eruption as well as previous deposits. The first lahar seen by local witnesses took place on the night of 2 October 2005. It carried material up to 2 m in diameter. The lahars that produced most of the damage were those that occurred immediately after the eruption and reached a maximum thickness of 1.5 m. Other lahars descended later in the storm, persisting well into 2006.The 2006 rainy season did not generate damaging lahars, just heavy runoff with minor sediment. In all, SNET seismically registered 22 lahar events, all of which were confirmed by local residents. The communities used tractors used to keep the main drainages open and to build levees, which confined the lahars inside main drainage areas. The SNET website mentioned several lahar episodes during 2006. Some of these episodes occurred in May, June, and July 2006.
A large scallop in the topographic margin of Coatepeque caldera results in Planes de la Laguna (an area of ~ 10 km2), which was where lahars eventually deposited (figures 8 and 9). This area of less steeply sloped, and in places comparatively level, ground contains numerous coffee plantations and small settlements. The largest settlement is El Javillal (figure 8, adjacent Lake Coatepeque).
The upslope areas contained numerous channels carrying lahars (figure 8). Several kilometers into the caldera the channels merge as they cross the less steeply sloped Planes de Laguna. The channels eventually grow into two primary channels, La Mina on the S and El Javillal on the N (figure 10). The La Mina channel led directly towards the Cerro Pacho dome, where the lahars proceeded to branch into multiple routes (A, B, C, and D) before entering El Javillal (figure 11).
Given the lack of soils and the state of vegetation, lahars were viewed as a potential ongoing hazard. To control lahars, SNET (2006) proposed excavating two channels from the vicinity of the domes to Lake Coatepeque, to carry sediment farther towards the lake. The proposed artificial channels are 2 m deep, with sides that slope at 45° outwards, and with a flat floor 5 m across. One proposed channel follows the S margin of the Cerro Pacho dome, the other follows a path similar to arrow A on figure 10.
Pullinger noted that the jocote de corona crop harvest was not affected because it came out just after the eruption. However, coffee was damaged wherever ash fell. Lahars did not directly hurt coffee plantations, but access roads were damaged and labor for harvesting was minimal, after much of the population had fled.
Monitoring. Moderate seismic activity and steam emissions continued during 2006. During 2006, seismicity was slightly above normal levels. Small earthquakes were interpreted as being associated with gas pulses.
Degassing continued in January 2006 with sporadic gas-and-steam emissions which rose approximately 200 m before dispersing. The SO2 flux ranged between 163 and 1,578 metric tons/day.
On 2 February, there was an increase in seismicity, possibly related to an earthquake on the coast of Guatemala. From 1-7 February the SO2 flux averaged 2,000 metric tons per day. A drop in the water level of the steaming, green-colored acidic lake in the summit crater revealed a local topographic high in the lake's center, which took the form of an irregular island (figure 12).
Intense bubbling and fumarole activity during 27 February-23 March disturbed the lake's surface and made it difficult to assess the level of the water. During April, instability in the crater led to periodic landslides. One significant landslide deposited material in the SW section of the beach of the crater lake.
Reference. Servicio Nacional de Estudios Territoriales (SNET), 2006, Flujos de escombros en la Ladera Oriente del Volcán Ilamatepec, Departamento de Santa Ana: Perfil de Obras de Mitigacion, Enero de 2006, 12 p.
Geologic Background. Santa Ana (also known as Ilamatepec), is a massive, dominantly andesitic-to-trachyandesitic stratovolcano in El Salvador immediately W of Coatepeque Caldera. Collapse during the late Pleistocene produced a voluminous debris avalanche that swept into the Pacific Ocean, forming the Acajutla Peninsula. Reconstruction of the volcano subsequently filled most of the collapse scarp. The broad summit is cut by several crescentic craters, and a series of vents and cones have formed along a 20-km-long fissure system that extends from near the town of Chalchuapa NNW of the volcano to the San Marcelino and Cerro la Olla cinder cones on the SE flank. Small to moderate explosive eruptions from both summit and flank vents have been documented since the 16th century. The San Marcelino cinder cone on the SE flank produced a lava flow in 1722 that traveled 13 km E.
Information Contacts: Carlos Pullinger, Servicio Nacional de Estudios Territoriales (SNET), Alameda Roosevelt y 55 Avenida Norte, Edificio Torre El Salvador, Quinta Planta, San Salvador, El Salvador (URL: http://www.snet.gob.sv).
Soufriere Hills (United Kingdom) — April 2007 Cite this Report
Soufriere Hills
United Kingdom
16.72°N, 62.18°W; summit elev. 915 m
All times are local (unless otherwise noted)
Seismic activity continues at a reduced level through 1 June
Activity returned to normal levels following the strong explosive episode of 10 September 2006 (BGVN 31:09). Activity after September included an occasional minor explosions, rockfalls, minor pyroclastic flows, venting of ash and gases and steam with emissions reaching up to 3 km altitude, minor ashfalls, and mudflows during heavy rains. In September and October, the minor pyroclastic flows primarily moved down the N and NE flanks of the dome. In January, pyroclastic flows traveled down the Gages Valley, Tyres Ghaut, Belham Valley, Tuits Ghaut, Farrells Plain, and especially the lower Tar River Valley E of the volcano.
Lava-dome growth slowed in March, and by the end of April it appeared to have ceased. On 1 June Montserrat Volcano Observatory (MVO) (figure 75) warned that, while the lava extrusion had ceased and the dome may not be actively growing, it remains as a large mass of partially molten lava capable of collapsing or exploding. According to MVO, the amount of material above Tyres Ghaut to the NW was sufficient to generate pyroclastic flows and surges capable of affecting the lower Belham Valley and other areas.
Data provided by MVO (table 64) shows the elevated seismicity (hybrid earthquakes and rockfall signals) related to the increased activity in late August and early September (BGVN 31:09). The high number of long-period earthquakes in late June reflects the dome collapse at that time (BGVN 31:05). The dramatic decrease in long-period events and rockfalls in mid-March corresponds to the observed reduction in dome growth.
Table 64. Seismicity at Soufrière Hills between 16 June 2006 and 25 May 2007. * Data for the first 4 days only. VT: volcanic tectonic; LP: long-period. Courtesy of MVO.
| Date |
Hybrid EQ's |
Volcano-tectonic EQ's |
Long-period EQ's |
Rockfall signals |
SO2 flux (metric tons/day) |
| 16 Jun-23 Jun 2006 |
-- |
-- |
32 |
51 |
-- |
| 23 Jun-30 Jun 2006 |
54 |
4 |
1236 |
100 |
-- |
| 30 Jun-07 Jul 2006 |
17 |
6 |
448 |
194 |
593 |
| 07 Jul-14 Jul 2006 |
2 |
1 |
49 |
61 |
468 |
| 14 Jul-21 Jul 2006 |
9 |
-- |
341 |
293 |
523 |
| 21 Jul-28 Jul 2006 |
12 |
-- |
190 |
144 |
-- |
| 28 Jul-04 Aug 2006 |
-- |
2 |
162 |
166 |
120 |
| 04 Aug-11 Aug 2006 |
5 |
1 |
100 |
165 |
230 |
| 11 Aug-18 Aug 2006 |
8 |
1 |
69 |
253 |
222 |
| 18 Aug-25 Aug 2006 |
142 |
-- |
124 |
280 |
150 |
| 25 Aug-01 Sep 2006 |
30 |
12 |
61 |
588 |
351 |
| 01 Sep-08 Sep 2006 |
154 |
1 |
39 |
366 |
160 |
| 08 Sep-15 Sep 2006 |
210 |
5 |
38 |
413 |
405 |
| 15 Sep-22 Sep 2006 |
17 |
1 |
11 |
279 |
232 |
| 22 Sep-29 Sep 2006 |
1 |
-- |
21 |
383 |
450 |
| 29 Sep-06 Oct 2006 |
-- |
3 |
83 |
616 |
144 |
| 06 Oct-13 Oct 2006 |
-- |
1 |
107 |
585 |
150 |
| 13 Oct-20 Oct 2006 |
-- |
2 |
107 |
807 |
-- |
| 20 Oct-27 Oct 2006 |
2 |
2 |
88 |
732 |
356 |
| 27 Oct-03 Nov 2006 |
1 |
-- |
110 |
487 |
420 |
| 03 Nov-10 Nov 2006 |
1 |
-- |
162 |
346 |
520 |
| 10 Nov-17 Nov 2006 |
-- |
1 |
209 |
565 |
332 |
| 17 Nov-24 Nov 2006 |
1 |
1 |
124 |
452 |
845 |
| 24 Nov-01 Dec 2006 |
-- |
2 |
101 |
298 |
465 |
| 01 Dec-08 Dec 2006 |
-- |
-- |
81 |
121 |
524 |
| 08 Dec-15 Dec 2006 |
-- |
-- |
9 |
100 |
574 |
| 15 Dec-22 Dec 2006 |
-- |
-- |
29 |
257 |
-- |
| 22 Dec-29 Dec 2006 |
3 |
6 |
163 |
396 |
200 |
| 29 Dec-05 Jan 2007 |
3 |
3 |
22 |
231 |
152 |
| 05 Jan-12 Jan 2007 |
-- |
2 |
24 |
348 |
159 |
| 12 Jan-19 Jan 2007 |
1 |
1 |
2 |
52 |
156 |
| 19 Jan-26 Jan 2007 |
-- |
7 |
22 |
53 |
204 |
| 26 Jan-02 Feb 2007 |
-- |
2 |
101 |
57 |
213 |
| 02 Feb-09 Feb 2007 |
-- |
3 |
69 |
108 |
153 |
| 09 Feb-16 Feb 2007 |
-- |
3 |
127 |
370 |
-- |
| 16 Feb-23 Feb 2007 |
-- |
2 |
219 |
353 |
271 |
| 23 Feb-02 Mar 2007 |
1 |
1 |
189 |
608 |
157 |
| 02 Mar-09 Mar 2007 |
-- |
-- |
141 |
594 |
150 |
| 09 Mar-16 Mar 2007 |
-- |
3 |
61 |
383 |
157 |
| 16 Mar-23 Mar 2007 |
1 |
3 |
1 |
124 |
135 |
| 23 Mar-30 Mar 2007 |
-- |
8 |
5 |
16 |
158 |
| 30 Mar-05 Apr 2007 |
-- |
17 |
1 |
45 |
1035 |
| 06 Apr-13 Apr 2007 |
-- |
-- |
1 |
8 |
3114 |
| 13 Apr-20 Apr 2007 |
-- |
-- |
3 |
8 |
203* |
| 20 Apr-27 Apr 2007 |
-- |
-- |
1 |
3 |
476 |
| 27 Apr-04 May 2007 |
-- |
-- |
-- |
9 |
223 |
| 04 May-11 May 2007 |
-- |
-- |
-- |
4 |
125 |
| 11 May-18 May 2007 |
-- |
-- |
-- |
2 |
143 |
| 18 May-25 May 2007 |
-- |
1 |
-- |
1 |
216 |
Strong activity during mid-September 2006. On 9 and 10 September, vigorous ash venting from the Gages Wall was accompanied by small explosions. Pyroclastic flows from fountain collapse occurred on all sides of the dome and reached 1 km W down Gages valley. On 11 September, the collapse of an overhanging lava lobe produced pyroclastic flows NE down the Tar River valley. One pyroclastic flow in the same area on 13 September reached the sea. On 14 September, vigorous ash venting resumed. Continuous ash and gas emissions during 13-19 September produced plumes that reached altitudes of 2.4-3.7 km. The Gages Wall vent continued to produce ash and gas emissions into mid-October.
Activity during September-December 2006. During 15 September-6 October the lava dome continued to grow at a moderate rate in the summit area and on the S and E sides of the dome. On 22 September the volume of the dome was about 80 million cubic meters. Lava-dome growth was concentrated on the NE part of the edifice from 6 October until 15 December, when growth moved to the SW part of the dome. A new E-facing shear lobe with a smooth, curved back enlarged during 13-20 October.
During 24 November-1 December, the two cracks in the curved back of the shear E-facing lobe on the summit propagated downward and divided the lobe into three blocks. The dome overtopped the NE crater wall and fresh rock and boulder deposits were observed in that region. During 22-29 December, lava-dome growth was focused on the W, where gas-and-ash venting occurred. A high whaleback lobe directed SW was observed on 26 December.
Aviation notices reported continuous ash and gas emissions almost every day from 15 September through 14 November, with plumes rising above 2 km to a maximum of 4.6 km altitude. Plumes extended 140 km W on 2-3 October. During 17-24 November, ash venting originated from the westernmost of two cracks in the curved back of the shear E-facing lobe on the summit. An explosion produced an ash plume that rose to altitudes of 1.5-1.7 km.
Pyroclastic flows occurred regularly as collapses from the dome sent material in all directions. Pyroclastic flows reached both the upper region of Tuitts Ghaut (N) and the sea via the Tar River Valley (E) on 23 November.
Activity during January-March 2007. Rapid lava-dome growth, pyroclastic flows, and ash venting increased during 3-9 January. Dome growth was concentrated in the NW, the highest part of the dome. Pyroclastic flows were observed in Tyres Ghaut (NW), Gages Valley (W), and N, behind Gages Mountain and accompanied by ash venting. On 4 January, simultaneous pyroclastic flows descended Tyres Ghaut and Gages Valley, and a resultant ash cloud reached an altitude of 2.5 km. The maximum distance for the Gages Valley flow was 4 km. During 6-9 January, distances of pyroclastic flows increased in Tyres Ghaut and possibly exceeded 1.5 km.
During 10-16 January, lava-dome growth was focused on the NW quadrant. During 10-11 January, one pyroclastic flow was observed to the W in Gages Valley and one to the NW in Tyres Ghaut. On 15 January, a relatively large pyroclastic flow traveled E down the Tar River Valley. After 15 January, measurable activity was low. Gas and ash venting that originated from the W side of the dome continued. A clear view on 22 January revealed that the collapse scar from the 8 January event was filled in. A small spine was noted on the W side. On 23 January, a large pyroclastic flow traveled down Gages Valley. The Washington VAAC reported that ash plumes were visible during 26-27 January. On 28 January, a large pyroclastic flow traveled down the Tar River Valley and reached the sea. A diffuse plume rose to an altitude of 1.5 km on 31 January.
During 7-13 February, growth of the lava dome continued on the W side, then was concentrated on the E and N sides for the rest of the month. The lava-dome volume in mid-February was estimated at 200 million cubic meters based on LIDAR data. Previous measurements over-estimated the lava-dome volume due to the perceived location of the dome and the lack of data from inside the crater. Small pyroclastic traveled in multiple directions throughout February. Moderate pyroclastic flows traveled down the Tar River Valley during 24-25 and 27 February. Continuous ash emissions were reported during 14 February-6 March, with plumes to altitudes of 2.1-6.1 km.
Lava-dome growth during 2-9 March was concentrated on an E-facing lobe topped with blocky, spine-like protrusions. Rockfalls affected the E and NE flanks. Pyroclastic flows traveled 2 km in the Tar River Valley. Heightened pyroclastic activity on 7 March resulted in an ash plume that rose to an estimated 2.4 km. On 11 March, a pyroclastic flow traveled down the NE flank into White's Ghaut.
During 9-26 March, lava-dome growth was concentrated on the NE side. Intermittent pyroclastic flows traveled E down the Tar River valley and produced ash plumes. One plume on 12 March rose to 3 km altitude. Pyroclastic flows were observed NW in Tyre's Ghaut and ashfall was reported from the Salem /Old Towne areas. During 23 March-3 April, dome growth apparently stopped.
MODIS thermal data indicated hot pixels at the dome and from pyroclastic flows on 24 March. Another thermal anomaly from a pyroclastic flow Tar River was detected on 29 March. No futher anomalies had been recorded by the HIGP Hotspot system through May. However, the Washington VAAC reported that a SW-drifting, diffuse plume and a hotspot were visible on satellite imagery on 2 April.
During 30 March-13 April, small, intermittent pyroclastic flows from the E-facing shear lobe occurred in the Tar River valley (figure 76). Incandescent rockfalls were seen at night during 5-9 April. On 17 April, a small pyroclastic flow was observed to the NW in the upper part of Tyres Ghaut. In mid-April MVO estimated that the lava-dome volume was about 208 million cubic meters.
The sulfur dioxide (SO2) flux rate during 6-13 April was high, with an average value of 3,114 metric tons per day (t/d), well above the long-term average for the eruption. The previous week averaged 1,035 t/d, from a low of 71 to a high of 3,818 t/d. The three days from 8 to 10 April showed markedly elevated emissions: 3,550, 7,396 peaking at 7,471 t/d, whereas the remaining days' emissions were extremely low, some below 100 t/d.
During 13-20 April, material originating from the lava dome's E-facing shear lobe was shed down the Tar River Valley. A bluish haze containing sulfur dioxide was observed flowing down the N flanks on 18-20 April. Pyroclastic activity was ongoing on the E and NE sides of the dome during 27 April-4 May. After 4 May the overall structure of the dome changed very little. Low-level rockfall and pyroclastic-flow activity continued into late May.
Reference. Wadge, G., Macfarlane, D.G., Robertson, D.A., Hale, A.J., Pinkerton, H., Burrell, R.V., Norton, G.E., and James, M.R., 2005, AVTIS: a novel millimetre-wave ground based instrument for volcano remote sensing: J. Volcanology and Geothermal Research, v. 146, no. 4, p. 307-318.
Geologic Background. The complex, dominantly andesitic Soufrière Hills volcano occupies the southern half of the island of Montserrat. The summit area consists primarily of a series of lava domes emplaced along an ESE-trending zone. The volcano is flanked by Pleistocene complexes to the north and south. English's Crater, a 1-km-wide crater breached widely to the east by edifice collapse, was formed about 2000 years ago as a result of the youngest of several collapse events producing submarine debris-avalanche deposits. Block-and-ash flow and surge deposits associated with dome growth predominate in flank deposits, including those from an eruption that likely preceded the 1632 CE settlement of the island, allowing cultivation on recently devegetated land to near the summit. Non-eruptive seismic swarms occurred at 30-year intervals in the 20th century, but no historical eruptions were recorded until 1995. Long-term small-to-moderate ash eruptions beginning in that year were later accompanied by lava-dome growth and pyroclastic flows that forced evacuation of the southern half of the island and ultimately destroyed the capital city of Plymouth, causing major social and economic disruption.
Information Contacts: Montserrat Volcano Observatory (MVO), Fleming, Montserrat, West Indies (URL: http://www.mvo.ms/); Washington Volcanic Ash Advisory Center (VAAC), Satellite Analysis Branch (SAB), NOAA/NESDIS E/SP23, NOAA Science Center Room 401, 5200 Auth Road, Camp Springs, MD 20746, USA (URL: http://www.ospo.noaa.gov/Products/atmosphere/vaac/); Hawai'i Institute of Geophysics and Planetology, MODIS Thermal Alert System, School of Ocean and Earth Sciences and Technology (SOEST), University of Hawai'i, 2525 Correa Road, Honolulu, HI, USA (URL: http://modis.higp.hawaii.edu/).
Stromboli
Italy
38.789°N, 15.213°E; summit elev. 924 m
All times are local (unless otherwise noted)
Flank eruption begins on 27 February 2007
According to Sonia Calvari of Istituto Nazionale di Geofisica e Vulcanologia (INGV-CT), a flank eruption started on Stromboli volcano on 27 February 2007 and continued to at least 15 March. Compared to the previous flank eruption during 2002-2003, lava effusion was about an order of magnitude greater. Initially, a NE fissure opened on the NE flank of the NE-crater, and lava emitted from the fissure formed three branches and rapidly reached the sea (figure 75).
Late on the eruption's first day, the three initial flows stopped and a new vent opened at the E Margin of the Sciara del Fuoco at about 400 m elevation. In a few days, this vent emitted sufficient lava to build a lava bench several tens of meters wide, which significantly modified the coastline. These lava emissions stopped for a few hours on 9 March, after which another vent opened at about 550 m elevation on the N flank of the NE-crater, almost in the same position as one of the vents of the 2002-2003 eruption. The 550-m vent was active for less than 24 hours and, when it ceased emitting lava, the 400-m vent reopened, again feeding lava to the sea.
On 15 March 2007, while the effusion from the 400-m vent continued, a major explosion occurred at 2137 (2037 UTC). This event, similar to that on 5 April 2003 (BGVN 28:04), was recorded by all the INGV-CT monitoring web cams. As in 2003, the 2007 event occurred during a flank effusive eruption, when the summit craters were obstructed by debris fallen from the crater rims. Still images and videos can be downloaded from the INGV-CT webpage dedicated to the 2007 Stromboli eruption.
Satellite imagery. Satellite imagery revealed an ash plume fanning SSE from the eruption site beginning at 1215 UTC on 27 February 2007. Another eruption was observed on MET-8 split-window IR (infrared) imagery on the same day at 1830 UTC. Ash then blew SSE at 46-56 km/hour.
Geologic Background. Spectacular incandescent nighttime explosions at Stromboli have long attracted visitors to the "Lighthouse of the Mediterranean" in the NE Aeolian Islands. This volcano has lent its name to the frequent mild explosive activity that has characterized its eruptions throughout much of historical time. The small island is the emergent summit of a volcano that grew in two main eruptive cycles, the last of which formed the western portion of the island. The Neostromboli eruptive period took place between about 13,000 and 5,000 years ago. The active summit vents are located at the head of the Sciara del Fuoco, a prominent scarp that formed about 5,000 years ago due to a series of slope failures which extends to below sea level. The modern volcano has been constructed within this scarp, which funnels pyroclastic ejecta and lava flows to the NW. Essentially continuous mild Strombolian explosions, sometimes accompanied by lava flows, have been recorded for more than a millennium.
Information Contacts: Sonia Calvari, Istituto Nazionale di Geofisica e Vulcanologia Sezione di Catania, Piazza Roma 2, 95123 Catania, Italy (URL: http://www.ct.ingv.it/); INGV-CT 2007 Stromboli eruption website (URL: http://www.ct.ingv.it/stromboli2007/main.htm); U.S. Air Force Weather Agency (AFWA)/XOGM, Offutt Air Force Base, NE 68113, USA.
Sulu Range (Papua New Guinea) — April 2007 Cite this Report
Sulu Range
Papua New Guinea
5.5°S, 150.942°E; summit elev. 610 m
All times are local (unless otherwise noted)
Non-eruptive, but geysers and indications of a shallow dike intrusion
New and revised information has emerged regarding the behavior of the Sulu Range (Johnson, 1971), a volcanic field adjacent to and immediately E of Walo hot springs along the coast in the N-central part of New Britain Island (BGVN 31:07 and 31:09; figure 3). Initial Rabaul Volcanological Observatory (RVO) reports mentioned apparent steam and ash emission during mid-July 2006, but although weak-to-moderate vapor emission occured, and a later section of this report discusses heightened hot spring activity, the reported "forceful dark emissions" have been instead linked to dust during mass wasting.
In a 12 April Email message, Steve Saunders clarified the latest RVO views on Sulu's behavior. He noted that ". . . Sulu did not erupt! It was purely a series of seismic cris[es]. The 'emissions' which were reported before we got there turned out to be dust from landslides."
Unusually vigorous hot springs, declining seismicity. Following the first two weeks of unrest during mid-July at Sulu Range, an RVO report discussing 31 July to 2 August activity stated that area hot springs such as those at Walo were undergoing unusually strong activity. This included expelled mud, the emergence of geysers, and abnormal quantities of steam.
RVO noted waning seismicity in late July. Seismicity had declined to relatively low levels, although small volcano-tectonic events continued to be recorded. The small earthquakes were centered around the settlements of Silanga, Sege, and Sale (figure 4; respectively, from Mt.Ruckenberg's summit, located 12.7 km to the SW; 7.2 km SW, and 5.5 km S). The 31 July to 2 August earthquakes were described as more irregular and less frequent than those in preceeding weeks.
The pattern of located earthquakes defined an irregular ellipse, with major axis 9 km E-W. Two earthquakes represented a 1-2 km extension N from the ellipse under Bangula Bay. There were also two earthquakes offshore about 4-5 km due N of Cape Reilnitz, a broad promontory the most extreme point of which lies 18 km to the W of Mt. Ruckenberg's summit. As of the end of July an area devoid of earthquakes remained; it was 2-3 km in diameter and centered on Walo village.
The RVO estimated that the top of the underlying magma body was 10-15 km deep when volcano-tectonic earthquakes began on 6 July 2006. They judged that volatiles or heat escaping from the magma were responsible for onset of the mud and water ejections at the once quiet hot springs.
Postulated intrusion. Randy White (US Geological Survey) analyzed the July seismic crisis, which in his interpretation did not follow the pattern of a tectonic earthquake with a main shock and associated aftershocks, but did follow behavior of many earthquakes accompanying the onset of volcanic unrest. He attributed the seismicity to a dike intruded to shallow depth (and confined to the subsurface). According to White, the epicenters well outboard of, but surrounding the area of intrusion, occurred in a pattern similar to those accompanying many shallow intrusions.
The elevated seismicity began after a volcano-tectonic earthquake, M ~ 6 on 19 July (BGVN 31:07). It was located on the N side of New Britain, slightly offshore, and a few ten's of kilometers from the Sulu Range. The focal depth was thought to be in the 10-20 km range. White noted that soon after the 19 July earthquake, Australia provided portable seismometers. Once those arrived and began recording data, computed moment tensors indicated that subsequent earthquakes were very shallow. Epicenters occurred slightly W of the Sulu Range.
Short level-lines installed by RVO in August 2006 showed, by November, ~ 2 cm of deflation of the Kaiamu area in relation to a datum ~ 1 km E on the Kaiamu-Sulu track. By April 2006 the measured levels had returned to approximately the August datum line.
To the W of the area at Lasibu a similar pattern existed, with over 2.5 cm of deflation locally measured by November and an approximate return to the datum-line by April 2006. The center of the area delimited by seismicity is swamp and difficult to access. Google satellite images show an interesting series of raised shorelines W of Kaiamu.
Upon prompting from White, Chuck Wicks acquired satellite radar (L-band imagery) from Japanese collaborators for the Sulu Range. The radar data were taken weeks before and weeks after the July seismicity. When processed to obtain radar interferometry, the data indicated over 80 cm of vertical surface deformation. The deformation was centered in a region W of the Sulu Range along an area along the coast ~ 5 km W of Lava Point (Lara Point on some maps). It trends ENE. The data were interpreted as a shallow dike intrusion on the order of ~ 8 m wide trending out beneath Bangula Bay.
Wick's preliminary analysis suggests the intrusion's volume may be on the order of one cubic kilometer. White's qualitative estimate of the volume, from the intensity, style, and duration of the seismicity, were consistent with that analysis. In addition, the strike-slip focal mechanisms seen in the seismic data suggested the dike-intrusion episode caused movement along a nearby strike-slip fault.
Geological investigations conducted in the past several months by Herman Patia and Chris McKee indicated that Sulu Range has been quite active 'recently.' The latest eruptive phase at Kaiamu maar was radiocarbon-dated at 1,300 BP. Since that time at least seven eruptions have taken place at other vents, notably Voko, involving phreatomagmatic eruptions. Ruckenberg (Karai) appears to be the source of the most recent activity. Within the last 200 years it produced lava flows.
Reference. Johnson, RW., 1971, Bamus volcano, Lake Hargay area, and Sulu Range, New Britain: Volcanic geology and petrology: Australia Department of National Development, Bureau of Mineral Resources, Geology and Geophysics, Record 1971/55.
Geologic Background. The Sulu Range consists of a cluster of partially overlapping small stratovolcanoes and lava domes in north-central New Britain off Bangula Bay. The 610-m Mount Malopu at the southern end forms the high point of the basaltic-to-rhyolitic complex. Kaiamu maar forms a peninsula with a small lake extending about 1 km into Bangula Bay at the NW side of the Sulu Range. The Walo hydrothermal area, consisting of solfataras and mud pots, lies on the coastal plain west of the SW base of the Sulu Range. No historical eruptions are known from the Sulu Range, although some of the cones display a relatively undissected morphology. A vigorous new fumarolic vent opened in 2006, preceded by vegetation die-off, seismicity, and dust-producing landslides.
Information Contacts: Steve Saunders, Herman Patia, and Chris McKee, Rabaul Volcanological Observatory (RVO), Department of Mining, Private Mail Bag, Port Moresby Post Office, National Capitol District, Papua New Guinea; USGS Earthquakes Hazard Program (URL: http://earthquakes.usgs.gov/); Randy White and Chuck Wicks, US Geological Survey, 345 Middlefield Rd., MS 977, Menlo Park, CA 94025, USA; United Nations Office for the Coordination of Humanitarian Affairs (URL: https://reliefweb.int/).
Tungurahua (Ecuador) — April 2007 Cite this Report
Tungurahua
Ecuador
1.467°S, 78.442°W; summit elev. 5023 m
All times are local (unless otherwise noted)
Post-eruptive quiet spurs return of residents, but activity increases again in 2007
This report covers the time interval early January to 2 March 2007, based on Special Reports of the Ecuadorian Geophysical Institute (IG). This reporting interval was mainly one of relative quiet. In contrast, our previous report (BGVN 32:12), covered IG reports describing energetic eruptions of July and August 2006. Those IG reports also mentioned eruption-related fatalities and the discovery of a new growing bulge on the volcano's N flank. A map and geographic background were tabulated in BGVN 29:01.
Relative quiet prevails and some residents return. As touched on in BGVN 32:12, after August 2006, the volcanic vigor at Tungurahua was minimal and of low energy. The decrease in activity was gradual through mid-December 2006. The vigor remained low until mid-January 2007. Ash emissions did occur but were consistently minor.
IG reports noted that the relative tranquility at Tungurahua could reflect a pattern similar to that seen there in 1918. That was a case when various months of volcanic quiet occurred, only to be followed by explosive eruptions of large size. The latter generated pyroclastic flows.
During the quiet that followed the July and August 2006 eruptions, residents who had evacuated from the margins of the volcano returned to their properties. The IG noted that, unfortunately, these returning residents became more vulnerable to volcanic hazards and made emergency response more difficult.
Vigor increases. Between 20 January and 5 February 2007 internal seismic activity resumed, behavior consisting of a few earthquakes inferred as associated with fractures (volcano-tectonic earthquakes, VTs). On 13 February the volcano emitted an eruptive column with moderate ash content. After 19 February there was a reoccurrence of seismic VTs. These were of shorter duration but higher intensity than those that occurred during the previous period.
During 23-24 February 2007, volcanic tremors and seismic LP's were registered at the Volcanic Observatory of Tungurahua (VOT). At 0310 on 24 February, VOT staff and local observers reported continuous roars of moderate intensity, and discharge of incandescent material that both rose to ~ 800 m above the summit and descended ~ 1000 m down the volcano's flanks.
The emission column headed NW. Fine tephra fell, followed by a thick ashfall that was black in color. It left a deposit 3 mm thick in the towns of Pillate and San Juan. Reports received from Cotaló, Bilbao, Manzano, and Choglontús that indicate a thick, dark ashfall in those spots left a deposit 2 mm thick. Ashfall was also reported in the area of Quero.
Seismic activity decreased on 24 February as well as the intensity and frequency of the roars. As of 2 March, sporadic explosions of ash and incandescent material had been observed. Around this time some bad weather prevented clear views of the upper volcano; however, some reporters noted minor ashfall along the SW portion of the crater. Additionally, the SO2 flux increased to ~ 2,000 metric tons a day for the first time since the beginning of the year. The IG's "Seismic Activity Index" indicated an increase of the volcano's internal activity.
Two scenarios envisioned. Given the available data, the IG concluded that the volcano had received a new influx of magma. They proposed two potential scenarios: (1) the current levels of activity will continue and constant emissions of ash, (potentially more intense) will be generated. Ash clouds will be blown by winds that at this time of the year are predominantly westerly, with occasional S and NW variations. These ash clouds could generate heavy ashfall in the towns downwind from the volcano; or (2) the volume and speed of ascent of the magmatic gases originating from the new magma will increase dramatically, in which case, new explosive eruptions of pyroclastic flows similar to those on 14 July and 16 August could occur.
Geologic Background. Tungurahua, a steep-sided andesitic-dacitic stratovolcano that towers more than 3 km above its northern base, is one of Ecuador's most active volcanoes. Three major edifices have been sequentially constructed since the mid-Pleistocene over a basement of metamorphic rocks. Tungurahua II was built within the past 14,000 years following the collapse of the initial edifice. Tungurahua II collapsed about 3,000 years ago and produced a large debris-avalanche deposit to the west. The modern glacier-capped stratovolcano (Tungurahua III) was constructed within the landslide scarp. Historical eruptions have all originated from the summit crater, accompanied by strong explosions and sometimes by pyroclastic flows and lava flows that reached populated areas at the volcano's base. Prior to a long-term eruption beginning in 1999 that caused the temporary evacuation of the city of Baños at the foot of the volcano, the last major eruption had occurred from 1916 to 1918, although minor activity continued until 1925.
Information Contacts: Geophysical Institute (IG), Escuela Politécnica Nacional, Apartado 17-01-2759, Quito, Ecuador (URL: http://www.igepn.edu.ec/).