Recently Published Bulletin Reports
Erebus (Antarctica) Lava lake remains active; most thermal alerts recorded since 2019
Rincon de la Vieja (Costa Rica) Frequent phreatic explosions during July-December 2023
Bezymianny (Russia) Explosion on 18 October 2023 sends ash plume 8 km high; lava flows and incandescent avalanches
Kilauea (United States) Low-level lava effusions in the lava lake at Halema’uma’u during July-December 2022
Nyamulagira (DR Congo) Lava flows and thermal activity during May-October 2023
Bagana (Papua New Guinea) Explosions, ash plumes, ashfall, and lava flows during April-September 2023
Mayon (Philippines) Lava flows, pyroclastic flows, ash emissions, and seismicity during April-September 2023
Nishinoshima (Japan) Eruption plumes and gas-and-steam plumes during May-August 2023
Krakatau (Indonesia) White gas-and-steam plumes and occasional ash plumes during May-August 2023
Villarrica (Chile) Strombolian activity, gas-and-ash emissions, and crater incandescence during April-September 2023
Merapi (Indonesia) Frequent incandescent avalanches during April-September 2023
Ebeko (Russia) Moderate explosive activity with ash plumes continued during June-November 2023
Erebus (Antarctica) — January 2024  Cite this Report
Erebus
Antarctica
77.53°S, 167.17°E; summit elev. 3794 m
All times are local (unless otherwise noted)
Lava lake remains active; most thermal alerts recorded since 2019
The lava lake in the summit crater of Erebus has been active since at least 1972. Located in Antarctica overlooking the McMurdo Station on Ross Island, it is the southernmost active volcano on the planet. Because of the remote location, activity is primarily monitored by satellites. This report covers activity during 2023.
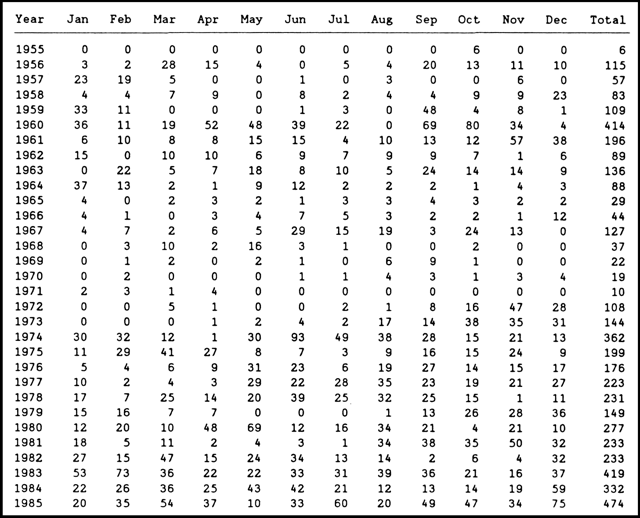
The number of thermal alerts recorded by the Hawai'i Institute of Geophysics and Planetology’s MODVOLC Thermal Alerts System increased considerably in 2023 compared to the years 2020-2022 (table 9). In contrast to previous years, the MODIS instruments aboard the Aqua and Terra satellites captured data from Erebus every month during 2023. Consistent with previous years, the lowest number of anomalous pixels were recorded in January, November, and December.
Table 9. Number of monthly MODIS-MODVOLC thermal alert pixels recorded at Erebus during 2017-2023. See BGVN 42:06 for data from 2000 through 2016. The table was compiled using data provided by the HIGP – MODVOLC Thermal Alerts System.
| Year |
Jan |
Feb |
Mar |
Apr |
May |
Jun |
Jul |
Aug |
Sep |
Oct |
Nov |
Dec |
SUM |
| 2017 |
0 |
21 |
9 |
0 |
0 |
1 |
11 |
61 |
76 |
52 |
0 |
3 |
234 |
| 2018 |
0 |
21 |
58 |
182 |
55 |
17 |
137 |
172 |
103 |
29 |
0 |
0 |
774 |
| 2019 |
2 |
21 |
162 |
151 |
55 |
56 |
75 |
53 |
29 |
19 |
1 |
0 |
624 |
| 2020 |
0 |
2 |
16 |
18 |
4 |
4 |
1 |
3 |
18 |
3 |
1 |
6 |
76 |
| 2021 |
0 |
9 |
1 |
0 |
2 |
56 |
46 |
47 |
35 |
52 |
5 |
3 |
256 |
| 2022 |
1 |
13 |
55 |
22 |
15 |
32 |
39 |
19 |
31 |
11 |
0 |
0 |
238 |
| 2023 |
2 |
33 |
49 |
82 |
41 |
32 |
70 |
64 |
42 |
17 |
5 |
11 |
448 |
Sentinel-2 infrared images showed one or two prominent heat sources within the summit crater, accompanied by adjacent smaller sources, similar to recent years (see BGVN 46:01, 47:02, and 48:01). A unique image was obtained on 25 November 2023 by the OLI-2 (Operational Land Imager-2) on Landsat 9, showing the upper part of the volcano surrounded by clouds (figure 32).
Geologic Background. Mount Erebus, the world's southernmost historically active volcano, overlooks the McMurdo research station on Ross Island. It is the largest of three major volcanoes forming the crudely triangular Ross Island. The summit of the dominantly phonolitic volcano has been modified by one or two generations of caldera formation. A summit plateau at about 3,200 m elevation marks the rim of the youngest caldera, which formed during the late-Pleistocene and within which the modern cone was constructed. An elliptical 500 x 600 m wide, 110-m-deep crater truncates the summit and contains an active lava lake within a 250-m-wide, 100-m-deep inner crater; other lava lakes are sometimes present. The glacier-covered volcano was erupting when first sighted by Captain James Ross in 1841. Continuous lava-lake activity with minor explosions, punctuated by occasional larger Strombolian explosions that eject bombs onto the crater rim, has been documented since 1972, but has probably been occurring for much of the volcano's recent history.
Information Contacts: Hawai'i Institute of Geophysics and Planetology (HIGP) - MODVOLC Thermal Alerts System, School of Ocean and Earth Science and Technology (SOEST), Univ. of Hawai'i, 2525 Correa Road, Honolulu, HI 96822, USA (URL: http://modis.higp.hawaii.edu/); Copernicus Browser, Copernicus Data Space Ecosystem, European Space Agency (URL: https://dataspace.copernicus.eu/browser/); NASA Earth Observatory, EOS Project Science Office, NASA Goddard Space Flight Center, Goddard, Maryland, USA (URL: https://earthobservatory.nasa.gov/images/152134/erebus-breaks-through).
Rincon de la Vieja (Costa Rica) — January 2024 Cite this Report
Rincon de la Vieja
Costa Rica
10.83°N, 85.324°W; summit elev. 1916 m
All times are local (unless otherwise noted)
Frequent phreatic explosions during July-December 2023
Rincón de la Vieja is a volcanic complex in Costa Rica with a hot convecting acid lake that exhibits frequent weak phreatic explosions, gas-and-steam emissions, and occasional elevated sulfur dioxide levels (BGVN 45:10, 46:03, 46:11). The current eruption period began June 2021. This report covers activity during July-December 2023 and is based on weekly bulletins and occasional daily reports from the Observatorio Vulcanologico Sismologica de Costa Rica-Universidad Nacional (OVSICORI-UNA).
Numerous weak phreatic explosions continued during July-December 2023, along with gas-and-steam emissions and plumes that rose as high as 3 km above the crater rim. Many weekly OVSICORI-UNA bulletins included the previous week's number of explosions and emissions (table 9). For many explosions, the time of explosion was given (table 10). Frequent seismic activity (long-period earthquakes, volcano-tectonic earthquakes, and tremor) accompanied the phreatic activity.
Table 9. Number of reported weekly phreatic explosions and gas-and-steam emissions at Rincón de la Vieja, July-December 2023. Counts are reported for the week before the Weekly Bulletin date; not all reports included these data. Courtesy of OVSICORI-UNA.
| OVSICORI Weekly Bulletin |
Number of explosions |
Number of emissions |
| 28 Jul 2023 |
6 |
14 |
| 4 Aug 2023 |
10 |
12 |
| 1 Sep 2023 |
13 |
11 |
| 22 Sep 2023 |
12 |
13 |
| 29 Sep 2023 |
6 |
11 |
| 6 Oct 2023 |
12 |
5 |
| 13 Oct 2023 |
7 |
9 |
| 20 Oct 2023 |
1 |
15 |
| 27 Oct 2023 |
3 |
23 |
| 3 Nov 2023 |
3 |
10 |
| 17 Nov 2023 |
0 |
Some |
| 24 Nov 2023 |
0 |
14 |
| 8 Dec 2023 |
4 |
16 |
| 22 Dec 2023 |
8 |
18 |
Table 10. Summary of activity at Rincón de la Vieja during July-December 2023. Weak phreatic explosions and gas emissions are noted where the time of explosion was indicated in the weekly or daily bulletins. Height of plumes or emissions are distance above the crater rim. Courtesy of OVSICORI-UNA.
| Date |
Time |
Description of Activity |
| 1 Jul 2023 |
0156 |
Explosion. |
| 2 Jul 2023 |
0305 |
Explosion. |
| 4 Jul 2023 |
0229, 0635 |
Event at 0635 produced a gas-and-steam plume that rose 700 m and drifted W; seen by residents in Liberia (21 km SW). |
| 9 Jul 2023 |
1843 |
Explosion. |
| 21 Jul 2023 |
0705 |
Explosion. |
| 26 Jul 2023 |
1807 |
Explosion. |
| 28 Jul 2023 |
0802 |
Explosion generated a gas-and-steam plume that rose 500 m. |
| 30 Jul 2023 |
1250 |
Explosion. |
| 31 Jul 2023 |
2136 |
Explosion. |
| 11 Aug 2023 |
0828 |
Explosion. |
| 18 Aug 2023 |
1304 |
Explosion. |
| 21 Aug 2023 |
1224 |
Explosion generated gas-and-steam plumes rose 500-600 m. |
| 22 Aug 2023 |
0749 |
Explosion generated gas-and-steam plumes rose 500-600 m. |
| 24 Aug 2023 |
1900 |
Explosion. |
| 25 Aug 2023 |
0828 |
Event produced a steam-and-gas plume that rose 3 km and drifted NW. |
| 27-28 Aug 2023 |
0813 |
Four small events; the event at 0813 on 28 August lasted two minutes and generated a steam-and-gas plume that rose 2.5 km. |
| 1 Sep 2023 |
1526 |
Explosion generated plume that rose 2 km and ejected material onto the flanks. |
| 2-3 Sep 2023 |
- |
Small explosions detected in infrasound data. |
| 4 Sep 2023 |
1251 |
Gas-and-steam plume rose 1 km and drifted W. |
| 7 Nov 2023 |
1113 |
Explosion. |
| 8 Nov 2023 |
0722 |
Explosion. |
| 12 Nov 2023 |
0136 |
Small gas emissions. |
| 14 Nov 2023 |
0415 |
Small gas emissions. |
According to OVSICORI-UNA, during July-October the average weekly sulfur dioxide (SO2) flux ranged from 68 to 240 tonnes/day. However, in mid-November the flux increased to as high as 334 tonnes/day, the highest value measured in recent years. The high SO2 flux in mid-November was also detected by the TROPOMI instrument on the Sentinel-5P satellite (figure 43).
Geologic Background. Rincón de la Vieja, the largest volcano in NW Costa Rica, is a remote volcanic complex in the Guanacaste Range. The volcano consists of an elongated, arcuate NW-SE-trending ridge constructed within the 15-km-wide early Pleistocene Guachipelín caldera, whose rim is exposed on the south side. Sometimes known as the "Colossus of Guanacaste," it has an estimated volume of 130 km3 and contains at least nine major eruptive centers. Activity has migrated to the SE, where the youngest-looking craters are located. The twin cone of Santa María volcano, the highest peak of the complex, is located at the eastern end of a smaller, 5-km-wide caldera and has a 500-m-wide crater. A Plinian eruption producing the 0.25 km3 Río Blanca tephra about 3,500 years ago was the last major magmatic eruption. All subsequent eruptions, including numerous historical eruptions possibly dating back to the 16th century, have been from the prominent active crater containing a 500-m-wide acid lake located ENE of Von Seebach crater.
Information Contacts: Observatorio Vulcanológico Sismológica de Costa Rica-Universidad Nacional (OVSICORI-UNA), Apartado 86-3000, Heredia, Costa Rica (URL: http://www.ovsicori.una.ac.cr/); NASA Global Sulfur Dioxide Monitoring Page, Atmospheric Chemistry and Dynamics Laboratory, NASA Goddard Space Flight Center (NASA/GSFC), 8800 Greenbelt Road, Goddard MD 20771, USA (URL: https://so2.gsfc.nasa.gov/).
Bezymianny (Russia) — November 2023 Cite this Report
Bezymianny
Russia
55.972°N, 160.595°E; summit elev. 2882 m
All times are local (unless otherwise noted)
Explosion on 18 October 2023 sends ash plume 8 km high; lava flows and incandescent avalanches
Bezymianny, located on Russia’s Kamchatka Peninsula, has had eruptions since 1955 characterized by dome growth, explosions, pyroclastic flows, ash plumes, and ashfall. Activity during November 2022-April 2023 included gas-and-steam emissions, lava dome collapses generating avalanches, and persistent thermal activity. Similar eruptive activity continued from May through October 2023, described here based on information from weekly and daily reports of the Kamchatka Volcano Eruptions Response Team (KVERT), notices from Tokyo VAAC (Volcanic Ash Advisory Center), and from satellite data.
Overall activity decreased after the strong period of activity in late March through April 2023, which included ash explosions during 29 March and 7-8 April 2023 that sent plumes as high as 10-12 km altitude, along with dome growth and lava flows (BGVN 48:05). This reduced activity can be seen in the MIROVA thermal detection system graph (figure 56), which was consistent with data from the MODVOLC thermal detection system and with Sentinel-2 satellite images that showed persistent hotspots in the summit crater when conditions allowed observations. A renewed period of strong activity began in mid-October 2023.
Activity increased significantly on 17 October 2023 when large collapses began during 0700-0830 on the E flanks of the lava dome and continued to after 0930 the next day (figure 57). Ash plumes rose to an altitude of 4.5-5 km, extending 220 km NNE by 18 October. A large explosion at 1630 on 18 October produced an ash plume that rose to an altitude of 11 km (8 km above the summit) and drifted NNE and then NW, extending 900 km NW within two days at an altitude of 8 km. Minor ashfall was noted in Kozyrevsk (45 km WNW). At 0820 on 20 October an ash plume was identified in satellite images drifting 100 km ENE at altitudes of 4-4.5 km.
Lava flows and hot avalanches from the dome down the SE flank continued over the next few days, including 23 October when clear conditions allowed good observations (figures 58 and 59). A large thermal anomaly was observed over the volcano through 24 October, and in the summit crater on 30 October (figure 60). Strong fumarolic activity continued, with numerous avalanches and occasional incandescence. By the last week of October, volcanic activity had decreased to a level consistent with that earlier in the reporting period.
Aviation warnings were frequently updated during 17-20 October. KVERT issued a Volcano Observatory Notice for Aviation (VONA) on 17 October at 1419 and 1727 (0219 and 0527 UTC) raising the Aviation Color Code (ACC) from Yellow to Orange (second highest level). The next day, KVERT issued a VONA at 1705 (0505 UTC) raising the ACC to Red (highest level) but lowered it back to Orange at 2117 (0917 UTC). After another decrease to Yellow and back to Orange, the ACC was reduced to Yellow on 20 October at 1204 (0004 UTC). In addition, the Tokyo VAAC issued a series of Volcanic Ash Advisories beginning on 16 October and continuing through 30 October.
Geologic Background. The modern Bezymianny, much smaller than its massive neighbors Kamen and Kliuchevskoi on the Kamchatka Peninsula, was formed about 4,700 years ago over a late-Pleistocene lava-dome complex and an edifice built about 11,000-7,000 years ago. Three periods of intensified activity have occurred during the past 3,000 years. The latest period, which was preceded by a 1,000-year quiescence, began with the dramatic 1955-56 eruption. This eruption, similar to that of St. Helens in 1980, produced a large open crater that was formed by collapse of the summit and an associated lateral blast. Subsequent episodic but ongoing lava-dome growth, accompanied by intermittent explosive activity and pyroclastic flows, has largely filled the 1956 crater.
Information Contacts: Kamchatka Volcanic Eruptions Response Team (KVERT), Far Eastern Branch, Russian Academy of Sciences, 9 Piip Blvd., Petropavlovsk-Kamchatsky, 683006, Russia (URL: http://www.kscnet.ru/ivs/kvert/); Kamchatka Volcanological Station, Kamchatka Branch of Geophysical Survey, (KB GS RAS), Klyuchi, Kamchatka Krai, Russia (URL: http://volkstat.ru/); Tokyo Volcanic Ash Advisory Center (VAAC), 1-3-4 Otemachi, Chiyoda-ku, Tokyo 100-8122, Japan (URL: http://ds.data.jma.go.jp/svd/vaac/data/); Hawai'i Institute of Geophysics and Planetology (HIGP) - MODVOLC Thermal Alerts System, School of Ocean and Earth Science and Technology (SOEST), Univ. of Hawai'i, 2525 Correa Road, Honolulu, HI 96822, USA (URL: http://modis.higp.hawaii.edu/); MIROVA (Middle InfraRed Observation of Volcanic Activity), a collaborative project between the Universities of Turin and Florence (Italy) supported by the Centre for Volcanic Risk of the Italian Civil Protection Department (URL: http://www.mirovaweb.it/); Copernicus Browser, Copernicus Data Space Ecosystem, European Space Agency (URL: https://dataspace.copernicus.eu/browser/).chr
Kilauea (United States) — January 2023 Cite this Report
Kilauea
United States
19.421°N, 155.287°W; summit elev. 1222 m
All times are local (unless otherwise noted)
Low-level lava effusions in the lava lake at Halema’uma’u during July-December 2022
Kīlauea is the southeastern-most volcano in Hawaii and overlaps the E flank of the Mauna Loa volcano. Its East Rift Zone (ERZ) has been intermittently active for at least 2,000 years. An extended eruption period began in January 1983 and was characterized by open lava lakes and lava flows from the summit caldera and the East Rift Zone. During May 2018 magma migrated into the Lower East Rift Zone (LERZ) and opened 24 fissures along a 6-km-long NE-trending fracture zone that produced lava flows traveling in multiple directions. As lava emerged from the fissures, the lava lake at Halema'uma'u drained and explosions sent ash plumes to several kilometers altitude (BGVN 43:10).
The current eruption period started during September 2021 and has recently been characterized by lava effusions, spatter, and sulfur dioxide emissions in the active Halema’uma’u lava lake (BGVN 47:08). Lava effusions, some spatter, and sulfur dioxide emissions have continued during this reporting period of July through December 2022 using daily reports, volcanic activity notices, and abundant photo, map, and video data from the US Geological Survey's (USGS) Hawaiian Volcano Observatory (HVO).
Summary of activity during July-December 2022. Low-level effusions have continued at the western vent of the Halema’uma’u crater during July through early December 2022. Occasional weak ooze-outs (also called lava break outs) would occur along the margins of the crater floor. The overall level of the active lava lake throughout the reporting period gradually increased due to infilling, however it stagnated in mid-September (table 13). During September through November, activity began to decline, though lava effusions persisted at the western vent. By 9 December, the active part of the lava lake had completely crusted over, and incandescence was no longer visible.
Table 13. Summary of measurements taken during overflights at Kīlauea that show a gradual increase in the active lava lake level and the volume of lava effused since 29 September 2021. Lower activity was reported during September-October. Data collected during July-December 2022. Courtesy of HVO.
| Date: |
Level of the active lava lake (m): |
Cumulative volume of lava effused (million cubic meters): |
| 7 Jul 2022 |
130 |
95 |
| 19 Jul 2022 |
133 |
98 |
| 4 Aug 2022 |
136 |
102 |
| 16 Aug 2022 |
137 |
104 |
| 12 Sep 2022 |
143 |
111 |
| 5 Oct 2022 |
143 |
111 |
| 28 Oct 2022 |
143 |
111 |
Activity during July 2022. Lava effusions were reported from the western vent in the Halema’uma’u crater, along with occasional weak ooze-outs along the margins of the crater floor. The height of the lava lake was variable due to deflation-inflation tilt events; for example, the lake level dropped approximately 3-4 m during a summit deflation-inflation event reported on 1 July. Webcam images taken during the night of 6-12 July showed intermittent low-level spattering at the western vent that rose less than 10 m above the vent (figure 519). Measurements made during an overflight on 7 July indicated that the crater floor was infilled about 130 m and that 95 million cubic meters of lava had been effused since 29 September 2021. A single, relatively small lava ooze-out was active to the S of the lava lake. Around midnight on 8 July there were two brief periods of lava overflow onto the lake margins. On 9 July lava ooze-outs were reported near the SE and NE edges of the crater floor and during 10-11 July they occurred near the E, NE, and NW edges. On 16 July crater incandescence was reported, though the ooze-outs and spattering were not visible. On 18 July overnight webcam images showed incandescence in the western vent complex and two ooze-outs were reported around 0000 and 0200 on 19 July. By 0900 there were active ooze-outs along the SW edge of the crater floor. Measurements made from an overflight on 19 July indicated that the crater floor was infilled about 133 m and 98 million cubic meters of lava had erupted since 29 September 2021 (figure 520). On 20 July around 1600 active ooze-outs were visible along the N edge of the crater, which continued through the next day. Extensive ooze-outs occurred along the W margin during 24 July until 1900; on 26 July minor ooze-outs were noted along the N margin. Minor spattering was visible on 29 July along the E margin of the lake. The sulfur dioxide emission rates ranged 650-2,800 tons per day (t/d), the higher of which was measured on 8 July (figure 519).
Activity during August 2022. The eruption continued in the Halema’uma’u crater at the western vent. According to HVO the lava in the active lake remained at the level of the bounding levees. Occasional minor ooze-outs were observed along the margins of the crater floor. Strong nighttime crater incandescence was visible after midnight on 6 August over the western vent cone. During 6-7 August scattered small lava lobes were active along the crater floor and incandescence persisted above the western vent through 9 August. During 7-9 August HVO reported a single lava effusion source was active along the NW margin of the crater floor. Measurements from an overflight on 4 August indicated that the crater floor was infilled about 136 m total and that 102 million cubic meters of lava had been erupted since the start of the eruption. Lava breakouts were reported along the N, NE, E, S, and W margins of the crater during 10-16 August. Another overflight survey conducted on 16 August indicated that the crater floor infilled about 137 m and 104 million cubic meters of lava had been erupted since September 2021. Measured sulfur dioxide emissions rates ranged 1,150-2,450 t/d, the higher of which occurred on 8 August.
Activity during September 2022. During September, lava effusion continued from the western vent into the active lava lake and onto the crater floor. Intermittent minor ooze-outs were reported through the month. A small ooze-out was visible on the W crater floor margin at 0220 on 2 September, which showed decreasing surface activity throughout the day, but remained active through 3 September. On 3 September around 1900 a lava outbreak occurred along the NW margin of the crater floor but had stopped by the evening of 4 September. Field crews monitoring the summit lava lake on 9 September observed spattering on the NE margin of the lake that rose no higher than 10 m, before falling back onto the lava lake crust (figure 521). Overflight measurements on 12 September indicated that the crater floor was infilled a total of 143 m and 111 million cubic meters of lava had been erupted since September 2021. Extensive breakouts in the W and N part of the crater floor were reported at 1600 on 20 September and continued into 26 September. The active part of the lava lake dropped by 10 m while other parts of the crater floor dropped by several meters. Summit tiltmeters recorded a summit seismic swarm of more than 80 earthquakes during 1500-1800 on 21 September, which occurred about 1.5 km below Halema’uma’u; a majority of these were less than Mw 2. By 22 September the active part of the lava lake was infilled about 2 m. On 23 September the western vent areas exhibited several small spatter cones with incandescent openings, along with weak, sporadic spattering (figure 522). The sulfur dioxide emission rate ranged from 930 t/d to 2,000 t/d, the higher of which was measured on 6 September.
Activity during October 2022. Activity during October declined slightly compared to previous months, though lava effusions persisted from the western vent into the active lava lake and onto the crater floor during October (figure 523). Slight variations in the lava lake were noted throughout the month. HVO reported that around 0600 on 3 October the level of the lava lake has lowered slightly. Overflight measurements taken on 5 October indicated that the crater floor was infilled a total of about 143 m and that 111 million cubic meters of lava had been effused since September 2021. During 6-7 October the lake gradually rose 0.5 m. Sulfur dioxide measurements made on 22 October had an emission rate of 700 t/d. Another overflight taken on 28 October showed that there was little to no change in the elevation of the crater floor: the crater floor was infilled a total of 143 m and 111 million cubic meters of lava had erupted since the start of the eruption.
Activity during November 2022. Activity remained low during November, though HVO reported that lava from the western vent continued to effuse into the active lava lake and onto the crater floor throughout the month. The rate of sulfur dioxide emissions during November ranged from 300-600 t/d, the higher amount of which occurred on 9 November.
Activity during December 2022. Similar low activity was reported during December, with lava effusing from the western vent into the active lava lake and onto the crater floor. During 4-5 December the active part of the lava lake was slightly variable in elevation and fluctuated within 1 m. On 9 December HVO reported that lava was no longer erupting from the western vent in the Halema’uma’u crater and that sulfur dioxide emissions had returned to near pre-eruption background levels; during 10-11 December, the lava lake had completely crusted over, and no incandescence was visible (figure 524). Time lapse camera images covering the 4-10 December showed that the crater floor showed weak deflation and no inflation. Some passive events of crustal overturning were reported during 14-15 December, which brought fresh incandescent lava to the lake surface. The sulfur dioxide emission rate was approximately 200 t/d on 14 December. A smaller overturn event on 17 December and another that occurred around 0000 and into the morning of 20 December were also detected. A small seismic swarm was later detected on 30 December.
Geologic Background. Kilauea overlaps the E flank of the massive Mauna Loa shield volcano in the island of Hawaii. Eruptions are prominent in Polynesian legends; written documentation since 1820 records frequent summit and flank lava flow eruptions interspersed with periods of long-term lava lake activity at Halemaumau crater in the summit caldera until 1924. The 3 x 5 km caldera was formed in several stages about 1,500 years ago and during the 18th century; eruptions have also originated from the lengthy East and Southwest rift zones, which extend to the ocean in both directions. About 90% of the surface of the basaltic shield volcano is formed of lava flows less than about 1,100 years old; 70% of the surface is younger than 600 years. The long-term eruption from the East rift zone between 1983 and 2018 produced lava flows covering more than 100 km2, destroyed hundreds of houses, and added new coastline.
Information Contacts: Hawaiian Volcano Observatory (HVO), U.S. Geological Survey, PO Box 51, Hawai'i National Park, HI 96718, USA (URL: http://hvo.wr.usgs.gov/).
Nyamulagira (DR Congo) — November 2023 Cite this Report
Nyamulagira
DR Congo
1.408°S, 29.2°E; summit elev. 3058 m
All times are local (unless otherwise noted)
Lava flows and thermal activity during May-October 2023
Nyamulagira (also known as Nyamuragira) is a shield volcano in the Democratic Republic of Congo with the summit truncated by a small 2 x 2.3 km caldera with walls up to about 100 m high. Documented eruptions have occurred within the summit caldera, as well as from numerous flank fissures and cinder cones. The current eruption period began in April 2018 and has more recently been characterized by summit crater lava flows and thermal activity (BGVN 48:05). This report describes lava flows and variable thermal activity during May through October 2023, based on information from the Observatoire Volcanologique de Goma (OVG) and various satellite data.
Lava lake activity continued during May. The MIROVA (Middle InfraRed Observation of Volcanic Activity) system recorded moderate-to-strong thermal activity throughout the reporting period; activity was more intense during May and October and relatively weaker from June through September (figure 95). The MODVOLC thermal algorithm, detected a total of 209 thermal alerts. There were 143 hotspots detected during May, eight during June, nine during September, and 49 during October. This activity was also reflected in infrared satellite images, where a lava flow was visible in the NW part of the crater on 7 May and strong activity was seen in the center of the crater on 4 October (figure 96). Another infrared satellite image taken on 12 May showed still active lava flows along the NW margin of the crater. According to OVG lava effusions were active during 7-29 May and moved to the N and NW parts of the crater beginning on 9 May. Strong summit crater incandescence was visible from Goma (27 km S) during the nights of 17, 19, and 20 May (figure 97). On 17 May there was an increase in eruptive activity, which peaked at 0100 on 20 May. Notable sulfur dioxide plumes drifted NW and W during 19-20 May (figure 98). Drone footage acquired in partnership with the USGS (United States Geological Survey) on 20 May captured images of narrow lava flows that traveled about 100 m down the W flank (figure 99). Data from the Rumangabo seismic station indicated a decreasing trend in activity during 17-21 May. Although weather clouds prevented clear views of the summit, a strong thermal signature on the NW flank was visible in an infrared satellite image on 22 May, based on an infrared satellite image. On 28 May the lava flows on the upper W flank began to cool and solidify. By 29 May seismicity returned to levels similar to those recorded before the 17 May increase. Lava effusion continued but was confined to the summit crater; periodic crater incandescence was observed.
Low-level activity was noted during June through October. On 1 June OVG reported that seismicity remained at lower levels and that crater incandescence had been absent for three days, though infrared satellite imagery showed continued lava effusion in the summit crater. The lava flows on the flanks covered an estimated 0.6 km2. Satellite imagery continued to show thermal activity confined to the lava lake through October (figure 96), although no lava flows or significant sulfur dioxide emissions were reported.
Geologic Background. Africa's most active volcano, Nyamulagira (also known as Nyamuragira), is a massive high-potassium basaltic shield about 25 km N of Lake Kivu and 13 km NNW of the steep-sided Nyiragongo volcano. The summit is truncated by a small 2 x 2.3 km caldera that has walls up to about 100 m high. Documented eruptions have occurred within the summit caldera, as well as from the numerous flank fissures and cinder cones. A lava lake in the summit crater, active since at least 1921, drained in 1938, at the time of a major flank eruption. Recent lava flows extend down the flanks more than 30 km from the summit as far as Lake Kivu; extensive lava flows from this volcano have covered 1,500 km2 of the western branch of the East African Rift.
Information Contacts: Observatoire Volcanologique de Goma (OVG), Departement de Geophysique, Centre de Recherche en Sciences Naturelles, Lwiro, D.S. Bukavu, DR Congo; Hawai'i Institute of Geophysics and Planetology (HIGP) - MODVOLC Thermal Alerts System, School of Ocean and Earth Science and Technology (SOEST), Univ. of Hawai'i, 2525 Correa Road, Honolulu, HI 96822, USA (URL: http://modis.higp.hawaii.edu/); MIROVA (Middle InfraRed Observation of Volcanic Activity), a collaborative project between the Universities of Turin and Florence (Italy) supported by the Centre for Volcanic Risk of the Italian Civil Protection Department (URL: http://www.mirovaweb.it/); NASA Global Sulfur Dioxide Monitoring Page, Atmospheric Chemistry and Dynamics Laboratory, NASA Goddard Space Flight Center (NASA/GSFC), 8800 Greenbelt Road, Goddard, Maryland, USA (URL: https://so2.gsfc.nasa.gov/); Copernicus Browser, Copernicus Data Space Ecosystem, European Space Agency (URL: https://dataspace.copernicus.eu/browser/); Charles Balagizi, Goma Volcano Observatory, Departement de Geophysique, Centre de Recherche en Sciences Naturelles, Lwiro, D.S. Bukavu, DR Congo.
Bagana (Papua New Guinea) — October 2023 Cite this Report
Bagana
Papua New Guinea
6.137°S, 155.196°E; summit elev. 1855 m
All times are local (unless otherwise noted)
Explosions, ash plumes, ashfall, and lava flows during April-September 2023
The remote volcano of Bagana is located in central Bougainville Island, Papua New Guinea. Recorded eruptions date back to 1842 and activity has consisted of effusive activity that has built a small lava dome in the summit crater and occasional explosions that produced pyroclastic flows. The most recent eruption has been ongoing since February 2000 and has produced occasional explosions, ash plumes, and lava flows. More recently, activity has been characterized by ongoing effusive activity and ash emissions (BGVN 48:04). This report updates activity from April through September 2023 that has consisted of explosions, ash plumes, ashfall, and lava flows, using information from the Darwin Volcanic Ash Advisory Center (VAAC) and satellite data.
An explosive eruption was reported on 7 July that generated a large gas-and-ash plume to high altitudes and caused significant ashfall in local communities; the eruption plume had reached upper tropospheric (16-18 km altitude) altitudes by 2200, according to satellite images. Sulfur dioxide plumes were detected in satellite images on 8 July and indicated that the plume was likely a mixture of gas, ice, and ash. A report issued by the Autonomous Bougainville Government (ABG) (Torokina District, Education Section) on 10 July noted that significant ash began falling during 2000-2100 on 7 July and covered most areas in the Vuakovi, Gotana (9 km SW), Koromaketo, Laruma (25 km W) and Atsilima (27 km NW) villages. Pyroclastic flows also occurred, according to ground-based reports; small deposits confined to one drainage were inspected by RVO during an overflight on 17 July and were confirmed to be from the 7 July event. Ashfall continued until 10 July and covered vegetation, which destroyed bushes and gardens and contaminated rivers and streams.
RVO reported another eruption on 14 July. The Darwin VAAC stated that an explosive event started around 0830 on 15 July and produced an ash plume that rose to 16.5 km altitude by 1000 and drifted N, according to satellite images. The plume continued to drift N and remained visible through 1900, and by 2150 it had dissipated.
Ashfall likely from both the 7 and 15 July events impacted about 8,111 people in Torokina (20 km SW), including Tsito/Vuakovi, Gotana, Koromaketo, Kenaia, Longkogari, Kenbaki, Piva (13 km SW), and Atsinima, and in the Tsitovi district, according to ABG. Significant ashfall was also reported in Ruruvu (22 km N) in the Wakunai District of Central Bougainville, though the thickness of these deposits could not be confirmed. An evacuation was called for the villages in Wakunai, where heavy ashfall had contaminated water sources; the communities of Ruruvu, Togarau, Kakarapaia, Karauturi, Atao, and Kuritaturi were asked to evacuate to a disaster center at the Wakunai District Station, and communities in Torokina were asked to evacuate to the Piva District station. According to a news article, more than 7,000 people needed temporary accommodations, with about 1,000 people in evacuation shelters. Ashfall had deposited over a broad area, contaminating water supplies, affecting crops, and collapsing some roofs and houses in rural areas. Schools were temporarily shut down. Intermittent ash emissions continued through the end of July and drifted NNW, NW, and SW. Fine ashfall was reported on the coast of Torokina, and ash plumes also drifted toward Laruma and Atsilima.
A small explosive eruption occurred at 2130 on 28 July that ejected material from the crater vents, according to reports from Torokina, in addition to a lava flow that contained two lobes. A second explosion was detected at 2157. Incandescence from the lava flow was visible from Piva as it descended the W flank around 2000 on 29 July (figure 47). The Darwin VAAC reported that a strong thermal anomaly was visible in satellite images during 30-31 July and that ash emissions rose to 2.4 km altitude and drifted WSW on 30 July. A ground report from RVO described localized emissions at 0900 on 31 July.
The Darwin VAAC reported that ash plumes were identified in satellite imagery at 0800 and 1220 on 12 August and rose to 2.1 km and 3 km altitude and drifted NW and W, respectively. A news report stated that aid was sent to more than 6,300 people that were adversely affected by the eruption. Photos taken during 17-19 August showed ash emissions rising no higher than 1 km above the summit and drifting SE. A small explosion generated an ash plume during the morning of 19 August. Deposits from small pyroclastic flows were also captured in the photos. Satellite images captured lava flows and pyroclastic flow deposits. Two temporary seismic stations were installed near Bagana on 17 August at distances of 7 km WSW (Vakovi station) and 11 km SW (Kepox station). The Kepox station immediately started to record continuous, low-frequency background seismicity.
Satellite data. Little to no thermal activity was detected during April through mid-July 2023; only one anomaly was recorded during early April and one during early June, according to MIROVA (Middle InfraRed Observation of Volcanic Activity) data (figure 48). Thermal activity increased in both power and frequency during mid-July through September, although there were still some short gaps in detected activity. MODVOLC also detected increased thermal activity during August; thermal hotspots were detected a total of five times on 19, 20, and 27 August. Weak thermal anomalies were also captured in infrared satellite images on clear weather days throughout the reporting period on 7, 12, and 17 April, 27 May, 1, 6, 16, and 31 July, and 19 September (figure 48); a strong thermal anomaly was visible on 31 July. Distinct sulfur dioxide plumes that drifted generally NW were intermittently captured by the TROPOMI instrument on the Sentinel-5P satellite and sometimes exceeded two Dobson Units (DUs) (figure 49).
Geologic Background. Bagana volcano, in a remote portion of central Bougainville Island, is frequently active. This massive symmetrical cone was largely constructed by an accumulation of viscous andesitic lava flows. The entire edifice could have been constructed in about 300 years at its present rate of lava production. Eruptive activity is characterized by non-explosive effusion of viscous lava that maintains a small lava dome in the summit crater, although occasional explosive activity produces pyroclastic flows. Lava flows with tongue-shaped lobes up to 50 m thick and prominent levees descend the flanks on all sides.
Information Contacts: Rabaul Volcano Observatory (RVO), Geohazards Management Division, Department of Mineral Policy and Geohazards Management (DMPGM), PO Box 3386, Kokopo, East New Britain Province, Papua New Guinea; Darwin Volcanic Ash Advisory Centre (VAAC), Bureau of Meteorology, Northern Territory Regional Office, PO Box 40050, Casuarina, NT 0811, Australia (URL: http://www.bom.gov.au/info/vaac/); MIROVA (Middle InfraRed Observation of Volcanic Activity), a collaborative project between the Universities of Turin and Florence (Italy) supported by the Centre for Volcanic Risk of the Italian Civil Protection Department (URL: http://www.mirovaweb.it/); Hawai'i Institute of Geophysics and Planetology (HIGP) - MODVOLC Thermal Alerts System, School of Ocean and Earth Science and Technology (SOEST), Univ. of Hawai'i, 2525 Correa Road, Honolulu, HI 96822, USA (URL: http://modis.higp.hawaii.edu/); NASA Global Sulfur Dioxide Monitoring Page, Atmospheric Chemistry and Dynamics Laboratory, NASA Goddard Space Flight Center (NASA/GSFC), 8800 Greenbelt Road, Goddard, Maryland, USA (URL: https://so2.gsfc.nasa.gov/); Copernicus Browser, Copernicus Data Space Ecosystem, European Space Agency (URL: https://dataspace.copernicus.eu/browser/); Autonomous Bougainville Government, P.O Box 322, Buka, AROB, PNG (URL: https://abg.gov.pg/); Andrew Tupper (Twitter: @andrewcraigtupp); Simon Carn, Geological and Mining Engineering and Sciences, Michigan Technological University, 1400 Townsend Drive, Houghton, MI 49931, USA (URL: http://www.volcarno.com/, Twitter: @simoncarn); Radio NZ (URL: https://www.rnz.co.nz/news/pacific/494464/more-than-7-000-people-in-bougainville-need-temporary-accommodation-after-eruption); USAID, 1300 Pennsylvania Ave, NW, Washington DC 20004, USA (URL: https://www.usaid.gov/pacific-islands/press-releases/aug-08-2023-united-states-provides-immediate-emergency-assistance-support-communities-affected-mount-bagana-volcanic-eruptions).
Mayon (Philippines) — October 2023 Cite this Report
Mayon
Philippines
13.257°N, 123.685°E; summit elev. 2462 m
All times are local (unless otherwise noted)
Lava flows, pyroclastic flows, ash emissions, and seismicity during April-September 2023
Mayon is located in the Philippines and has steep upper slopes capped by a small summit crater. Historical eruptions date back to 1616 CE that have been characterized by Strombolian eruptions, lava flows, pyroclastic flows, and mudflows. Eruptions mostly originated from a central conduit. Pyroclastic flows and mudflows have commonly descended many of the approximately 40 drainages that surround the volcano. The most recent eruption occurred during June through October 2022 and consisted of lava dome growth and gas-and-steam emissions (BGVN 47:12). A new eruption was reported during late April 2023 and has included lava flows, pyroclastic density currents, ash emissions, and seismicity. This report covers activity during April through September 2023 based on daily bulletins from the Philippine Institute of Volcanology and Seismology (PHIVOLCS).
During April through September 2023, PHIVOLCS reported near-daily rockfall events, frequent volcanic earthquakes, and sulfur dioxide measurements. Gas-and-steam emissions rose 100-900 m above the crater and drifted in different directions. Nighttime crater incandescence was often visible during clear weather and was accompanied by incandescent avalanches of material. Activity notably increased during June when lava flows were reported on the S, SE, and E flanks (figure 52). The MIROVA graph (Middle InfraRed Observation of Volcanic Activity) showed strong thermal activity coincident with these lava flows, which remained active through September (figure 53). According to the MODVOLC thermal algorithm, a total of 110 thermal alerts were detected during the reporting period: 17 during June, 40 during July, 27 during August, and 26 during September. During early June, pyroclastic density currents (PDCs) started to occur more frequently.
Low activity was reported during much of April and May; gas-and-steam emissions rose 100-900 m above the crater and generally drifted in different directions. A total of 52 rockfall events and 18 volcanic earthquakes were detected during April and 147 rockfall events and 13 volcanic events during May. Sulfur dioxide flux measurements ranged between 400-576 tons per day (t/d) during April, the latter of which was measured on 29 April and between 162-343 t/d during May, the latter of which was measured on 13 May.
Activity during June increased, characterized by lava flows, pyroclastic density currents (PDCs), crater incandescence and incandescent rockfall events, gas-and-steam emissions, and continued seismicity. Weather clouds often prevented clear views of the summit, but during clear days, moderate gas-and-steam emissions rose 100-2,500 m above the crater and drifted in multiple directions. A total of 6,237 rockfall events and 288 volcanic earthquakes were detected. The rockfall events often deposited material on the S and SE flanks within 700-1,500 m of the summit crater and ash from the events drifted SW, S, SE, NE, and E. Sulfur dioxide emissions ranged between 149-1,205 t/d, the latter of which was measured on 10 June. Short-term observations from EDM and electronic tiltmeter monitoring indicated that the upper slopes were inflating since February 2023. Longer-term ground deformation parameters based on EDM, precise leveling, continuous GPS, and electronic tilt monitoring indicated that the volcano remained inflated, especially on the NW and SE flanks. At 1000 on 5 June the Volcano Alert Level (VAL) was raised to 2 (on a 0-5 scale). PHIVOLCS noted that although low-level volcanic earthquakes, ground deformation, and volcanic gas emissions indicated unrest, the steep increase in rockfall frequency may indicate increased dome activity.
A total of 151 dome-collapse PDCs occurred during 8-9 and 11-30 June, traveled 500-2,000 m, and deposited material on the S flank within 2 km of the summit crater. During 8-9 June the VAL was raised to 3. At approximately 1947 on 11 June lava flow activity was reported; two lobes traveled within 500 m from the crater and deposited material on the S (Mi-isi), SE (Bonga), and E (Basud) flanks. Weak seismicity accompanied the lava flow and slight inflation on the upper flanks. This lava flow remained active through 30 June, moving down the S and SE flank as far as 2.5 km and 1.8 km, respectively and depositing material up to 3.3 km from the crater. During 15-16 June traces of ashfall from the PDCs were reported in Sitio Buga, Nabonton, City of Ligao and Purok, and San Francisco, Municipality of Guinobatan. During 28-29 June there were two PDCs generated by the collapse of the lava flow front, which generated a light-brown ash plume 1 km high. Satellite monitors detected significant concentrations of sulfur dioxide beginning on 29 June. On 30 June PDCs primarily affected the Basud Gully on the E flank, the largest of which occurred at 1301 and lasted eight minutes, based on the seismic record. Four PDCs generated between 1800 and 2000 that lasted approximately four minutes each traveled 3-4 km on the E flank and generated an ash plume that rose 1 km above the crater and drifted N and NW. Ashfall was recorded in Tabaco City.
Similar strong activity continued during July; slow lava effusion remained active on the S and SE flanks and traveled as far as 2.8 km and 2.8 km, respectively and material was deposited as far as 4 km from the crater. There was a total of 6,983 rockfall events and 189 PDCs that affected the S, SE, and E flanks. The volcano network detected a total of 2,124 volcanic earthquakes. Continuous gas-and-steam emissions rose 200-2,000 m above the crater and drifted in multiple directions. Sulfur dioxide emissions averaged 792-4,113 t/d, the latter of which was measured on 28 July. During 2-4 July three PDCs were generated from the collapse of the lava flow and resulting light brown plumes rose 200-300 m above the crater. Continuous tremor pulses were reported beginning at 1547 on 3 July through 7 July at 1200, at 2300 on 8 July and going through 0300 on 10 July, and at 2300 on 16 July, as recorded by the seismic network. During 6-9 July there were 10 lava flow-collapse-related PDCs that generated light brown plumes 300-500 m above the crater. During 10-11 July light ashfall was reported in some areas of Mabinit, Legazpi City, Budiao and Salvacion, Daraga, and Camalig, Albay. By 18 July the lava flow advanced 600 m on the E flank as well.
During 1733 on 18 July and 0434 on 19 July PHIVOLCS reported 30 “ashing” events, which are degassing events accompanied by audible thunder-like sounds and entrained ash at the crater, which produced short, dark plumes that drifted SW. These events each lasted 20-40 seconds, and plume heights ranged from 150-300 m above the crater, as recorded by seismic, infrasound, visual, and thermal monitors. Three more ashing events occurred during 19-20 July. Short-term observations from electronic tilt and GPS monitoring indicate deflation on the E lower flanks in early July and inflation on the NW middle flanks during the third week of July. Longer-term ground deformation parameters from EDM, precise leveling, continuous GPS, and electronic tilt monitoring indicated that the volcano was still generally inflated relative to baseline levels. A short-lived lava pulse lasted 28 seconds at 1956 on 21 July, which was accompanied by seismic and infrasound signals. By 22 July, the only lava flow that remained active was on the SE flank, and continued to extend 3.4 km, while those on the S and E flanks weakened markedly. One ashing event was detected during 30-31 July, whereas there were 57 detected during 31 July-1 August; according to PHIVOLCS beginning at approximately 1800 on 31 July eruptive activity was dominated by phases of intermittent ashing, as well as increased in the apparent rates of lava effusion from the summit crater. The ashing phases consisted of discrete events recorded as low-frequency volcanic earthquakes (LFVQ) typically 30 seconds in duration, based on seismic and infrasound signals. Gray ash plume rose 100 m above the crater and generally drifted NE. Shortly after these ashing events began, new lava began to effuse rapidly from the crater, feeding the established flowed on the SE, E, and E flanks and generating frequent rockfall events.
Intensified unrest persisted during August. There was a total of 4,141 rockfall events, 2,881 volcanic earthquakes, which included volcanic tremor events, 32 ashing events, and 101 PDCs detected throughout the month. On clear weather days, gas-and-steam emissions rose 300-1,500 m above the crater and drifted in different directions (figure 54). Sulfur dioxide emissions averaged 735-4,756 t/d, the higher value of which was measured on 16 August. During 1-2 August the rate of lava effusion decreased, but continued to feed the flows on the SE, S, and E flanks, maintaining their advances to 3.4 km, 2.8 km, and 1.1 km from the crater, respectively (figure 55). Rockfall and PDCs generated by collapses at the lava flow margins and from the summit dome deposited material within 4 km of the crater. During 3-4 August there were 10 tremor events detected that lasted 1-4 minutes. Short-lived lava pulse lasted 35 seconds and was accompanied by seismic and infrasound signals at 0442 on 6 August. Seven collapses were recorded at the front of the lava flow during 12-14 August.
During September, similar activity of slow lava effusion, PDCs, gas-and-steam emissions, and seismicity continued. There was a total of 4,452 rockfall events, 329 volcanic earthquakes, which included volcanic tremor events, two ashing events, and 85 PDCs recorded throughout the month. On clear weather days, gas-and-steam emissions rose 100-1,500 m above the crater and drifted in multiple directions. Sulfur dioxide emissions averaged 609-2,252 t/d, the higher average of which was measured on 6 September. Slow lava effusion continued advancing on the SE, S, and E flanks, maintaining lengths of 3.4 km, 2.8 km, and 1.1 km, respectively. Rockfall and PDC events generated by collapses along the lava flow margins and at the summit dome deposited material within 4 km of the crater.
Geologic Background. Symmetrical Mayon, which rises above the Albay Gulf NW of Legazpi City, is the most active volcano of the Philippines. The steep upper slopes are capped by a small summit crater. Recorded eruptions since 1616 CE range from Strombolian to basaltic Plinian, with cyclical activity beginning with basaltic eruptions, followed by longer periods of andesitic lava flows. Eruptions occur predominately from the central conduit and have also produced lava flows that travel far down the flanks. Pyroclastic density currents and mudflows have commonly swept down many of the approximately 40 ravines that radiate from the summit and have often damaged populated lowland areas. A violent eruption in 1814 killed more than 1,200 people and devastated several towns.
Information Contacts: Philippine Institute of Volcanology and Seismology (PHIVOLCS), Department of Science and Technology, University of the Philippines Campus, Diliman, Quezon City, Philippines (URL: http://www.phivolcs.dost.gov.ph/); MIROVA (Middle InfraRed Observation of Volcanic Activity), a collaborative project between the Universities of Turin and Florence (Italy) supported by the Centre for Volcanic Risk of the Italian Civil Protection Department (URL: http://www.mirovaweb.it/); Hawai'i Institute of Geophysics and Planetology (HIGP) - MODVOLC Thermal Alerts System, School of Ocean and Earth Science and Technology (SOEST), Univ. of Hawai'i, 2525 Correa Road, Honolulu, HI 96822, USA (URL: http://modis.higp.hawaii.edu/); Copernicus Browser, Copernicus Data Space Ecosystem, European Space Agency (URL: https://dataspace.copernicus.eu/browser/); William Rogers, Legazpi City, Albay Province, Philippines.
Nishinoshima (Japan) — October 2023 Cite this Report
Nishinoshima
Japan
27.247°N, 140.874°E; summit elev. 100 m
All times are local (unless otherwise noted)
Eruption plumes and gas-and-steam plumes during May-August 2023
Nishinoshima, located about 1,000 km S of Tokyo, is a small island in the Ogasawara Arc in Japan. The island is the summit of a massive submarine volcano that has prominent submarine peaks to the S, W, and NE. Eruptions date back to 1973 and the current eruption period began in October 2022. Recent activity has consisted of small ash plumes and fumarolic activity (BGVN 48:07). This report covers activity during May through August 2023, using information from monthly reports of the Japan Meteorological Agency (JMA) monthly reports and satellite data.
Activity during May through June was relatively low. The Japan Coast Guard (JCG) did overflights on 14 and 22 June and reported white gas-and-steam emissions rising 600 m and 1,200 m from the central crater of the pyroclastic cone, respectively (figure 125). In addition, multiple white gas-and-steam emissions rose from the inner rim of the W side of the crater and from the SE flank of the pyroclastic cone. Discolored brown-to-green water was observed around almost the entire perimeter of the island; on 22 June light green discolored water was observed off the S coast of the island.
Observations from the Himawari meteorological satellite confirmed an eruption on 9 and 10 July. An eruption plume rose 1.6 km above the crater and drifted N around 1300 on 9 July. Satellite images acquired at 1420 and 2020 on 9 July and at 0220 on 10 July showed continuing emissions that rose 1.3-1.6 km above the crater and drifted NE and N. The Tokyo VAAC reported that an ash plume seen by a pilot and identified in a satellite image at 0630 on 21 July rose to 3 km altitude and drifted S.
Aerial observations conducted by JCG on 8 August showed a white-and-gray plume rising from the central crater of the pyroclastic cone, and multiple white gas-and-steam emissions were rising from the inner edge of the western crater and along the NW-SE flanks of the island (figure 126). Brown-to-green discolored water was also noted around the perimeter of the island.
Intermittent low-to-moderate power thermal anomalies were recorded in the MIROVA graph (Middle InfraRed Observation of Volcanic Activity), showing an increase in both frequency and power beginning in July (figure 127). This increase in activity coincides with eruptive activity on 9 and 10 July, characterized by eruption plumes. According to the MODVOLC thermal alert algorithm, one thermal hotspot was recorded on 20 July. Weak thermal anomalies were also detected in infrared satellite imagery, accompanied by strong gas-and-steam plumes (figure 128).
Geologic Background. The small island of Nishinoshima was enlarged when several new islands coalesced during an eruption in 1973-74. Multiple eruptions that began in 2013 completely covered the previous exposed surface and continued to enlarge the island. The island is the summit of a massive submarine volcano that has prominent peaks to the S, W, and NE. The summit of the southern cone rises to within 214 m of the ocean surface 9 km SSE.
Information Contacts: Japan Meteorological Agency (JMA), 1-3-4 Otemachi, Chiyoda-ku, Tokyo 100-8122, Japan (URL: http://www.jma.go.jp/jma/indexe.html); Tokyo Volcanic Ash Advisory Center (VAAC), 1-3-4 Otemachi, Chiyoda-ku, Tokyo 100-8122, Japan (URL: http://ds.data.jma.go.jp/svd/vaac/data/); MIROVA (Middle InfraRed Observation of Volcanic Activity), a collaborative project between the Universities of Turin and Florence (Italy) supported by the Centre for Volcanic Risk of the Italian Civil Protection Department (URL: http://www.mirovaweb.it/); Copernicus Browser, Copernicus Data Space Ecosystem, European Space Agency (URL: https://dataspace.copernicus.eu/browser/).
Krakatau (Indonesia) — October 2023 Cite this Report
Krakatau
Indonesia
6.1009°S, 105.4233°E; summit elev. 285 m
All times are local (unless otherwise noted)
White gas-and-steam plumes and occasional ash plumes during May-August 2023
Krakatau is located in the Sunda Strait between Java and Sumatra, Indonesia. Caldera collapse during the catastrophic 1883 eruption destroyed Danan and Perbuwatan cones and left only a remnant of Rakata. The post-collapse cone of Anak Krakatau (Child of Krakatau) was constructed within the 1883 caldera at a point between the former Danan and Perbuwatan cones; it has been the site of frequent eruptions since 1927. The current eruption period began in May 2021 and has recently consisted of Strombolian eruptions and ash plumes (BGVN 48:07). This report describes lower levels of activity consisting of ash and white gas-and-steam plumes during May through August 2023, based on information provided by the Indonesian Center for Volcanology and Geological Hazard Mitigation, referred to as Pusat Vulkanologi dan Mitigasi Bencana Geologi (PVMBG), MAGMA Indonesia, and satellite data.
Activity was relatively low during May and June. Daily white gas-and-steam emissions rose 25-200 m above the crater and drifted in different directions. Five ash plumes were detected at 0519 on 10 May, 1241 on 11 May, 0920 on 12 May, 2320 on 12 May, and at 0710 on 13 May, and rose 1-2.5 km above the crater and drifted SW. A webcam image taken on 12 May showed ejection of incandescent material above the vent. A total of nine ash plumes were detected during 6-11 June: at 1434 and 00220 on 6 and 7 June the ash plumes rose 500 m above the crater and drifted NW, at 1537 on 8 June the ash plume rose 1 km above the crater and drifted SW, at 0746 and at 0846 on 9 June the ash plumes rose 800 m and 3 km above the crater and drifted SW, respectively, at 0423, 1431, and 1750 on 10 June the ash plumes rose 2 km, 1.5 km, and 3.5 km above the crater and drifted NW, respectively, and at 0030 on 11 June an ash plume rose 2 km above the crater and drifted NW. Webcam images taken on 10 and 11 June at 0455 and 0102, respectively, showed incandescent material ejected above the vent. On 19 June an ash plume at 0822 rose 1.5 km above the crater and drifted SE.
Similar low activity of white gas-and-steam emissions and few ash plumes were reported during July and August. Daily white gas-and-steam emissions rose 25-300 m above the crater and drifted in multiple directions. Three ash plumes were reported at 0843, 0851, and 0852 on 20 July that rose 500-2,000 m above the crater and drifted NW.
The MIROVA (Middle InfraRed Observation of Volcanic Activity) graph of MODIS thermal anomaly data showed intermittent low-to-moderate power thermal anomalies during May through August 2023 (figure 140). Although activity was often obscured by weather clouds, a thermal anomaly was visible in an infrared satellite image of the crater on 12 May, accompanied by an eruption plume that drifted SW (figure 141).
Geologic Background. The renowned Krakatau (frequently mis-named as Krakatoa) volcano lies in the Sunda Strait between Java and Sumatra. Collapse of an older edifice, perhaps in 416 or 535 CE, formed a 7-km-wide caldera. Remnants of that volcano are preserved in Verlaten and Lang Islands; subsequently the Rakata, Danan, and Perbuwatan cones were formed, coalescing to create the pre-1883 Krakatau Island. Caldera collapse during the catastrophic 1883 eruption destroyed Danan and Perbuwatan, and left only a remnant of Rakata. This eruption caused more than 36,000 fatalities, most as a result of tsunamis that swept the adjacent coastlines of Sumatra and Java. Pyroclastic surges traveled 40 km across the Sunda Strait and reached the Sumatra coast. After a quiescence of less than a half century, the post-collapse cone of Anak Krakatau (Child of Krakatau) was constructed within the 1883 caldera at a point between the former Danan and Perbuwatan cones. Anak Krakatau has been the site of frequent eruptions since 1927.
Information Contacts: Pusat Vulkanologi dan Mitigasi Bencana Geologi (PVMBG, also known as Indonesian Center for Volcanology and Geological Hazard Mitigation, CVGHM), Jalan Diponegoro 57, Bandung 40122, Indonesia (URL: http://www.vsi.esdm.go.id/); MAGMA Indonesia, Kementerian Energi dan Sumber Daya Mineral (URL: https://magma.esdm.go.id/v1); MIROVA (Middle InfraRed Observation of Volcanic Activity), a collaborative project between the Universities of Turin and Florence (Italy) supported by the Centre for Volcanic Risk of the Italian Civil Protection Department (URL: http://www.mirovaweb.it/); Copernicus Browser, Copernicus Data Space Ecosystem, European Space Agency (URL: https://dataspace.copernicus.eu/browser/).
Villarrica (Chile) — October 2023 Cite this Report
Villarrica
Chile
39.42°S, 71.93°W; summit elev. 2847 m
All times are local (unless otherwise noted)
Strombolian activity, gas-and-ash emissions, and crater incandescence during April-September 2023
Villarrica, in central Chile, consists of a 2-km-wide caldera that formed about 3,500 years ago and is located at the base of the presently active cone at the NW margin of a 6-km-wide caldera. Historical eruptions eruptions date back to 1558 and have been characterized by mild-to-moderate explosive activity with occasional lava effusions. The current eruption period began in December 2014 and has recently consisted of nighttime crater incandescence, ash emissions, and seismicity (BGVN 48:04). This report covers activity during April through September 2023 and describes occasional Strombolian activity, gas-and-ash emissions, and nighttime crater incandescence. Information for this report primarily comes from the Southern Andes Volcano Observatory (Observatorio Volcanológico de Los Andes del Sur, OVDAS), part of Chile's National Service of Geology and Mining (Servicio Nacional de Geología y Minería, SERNAGEOMIN) and satellite data.
Seismicity during April consisted of long period (LP) events and tremor (TRE); a total of 9,413 LP-type events and 759 TR-type events were detected throughout the month. Nighttime crater incandescence persisted and was visible in the degassing column. Sulfur dioxide data was obtained using Differential Absorption Optical Spectroscopy Equipment (DOAS) that showed an average value of 1,450 ± 198 tons per day (t/d) during 1-15 April and 1,129 ± 201 t/d during 16-30 April, with a maximum daily value of 2,784 t/d on 9 April. Gas-and-steam emissions of variable intensities rose above the active crater as high as 1.3 km above the crater on 13 April. Strombolian explosions were not observed and there was a slight decrease in the lava lake level.
There were 14,123 LP-type events and 727 TR-type events detected during May. According to sulfur dioxide measurements taken with DOAS equipment, the active crater emitted an average value of 1,826 ± 482 t/d during 1-15 May and 912 ± 41 t/d during 16-30 May, with a daily maximum value of 5,155 t/d on 13 May. Surveillance cameras showed continuous white gas-and-steam emissions that rose as high as 430 m above the crater on 27 May. Nighttime incandescence illuminated the gas column less than 300 m above the crater rim was and no pyroclastic emissions were reported. A landslide was identified on 13 May on the E flank of the volcano 50 m from the crater rim and extending 300 m away; SERNAGEOMIN noted that this event may have occurred on 12 May. During the morning of 27 and 28 May minor Strombolian explosions characterized by incandescent ejecta were recorded at the crater rim; the last reported Strombolian explosions had occurred at the end of March.
Seismic activity during June consisted of five volcano-tectonic (VT)-type events, 21,606 LP-type events, and 2,085 TR-type events. The average value of sulfur dioxide flux obtained by DOAS equipment was 1,420 ± 217 t/d during 1-15 June and 2,562 ± 804 t/d, with a maximum daily value of 4,810 t/d on 17 June. White gas-and-steam emissions rose less than 480 m above the crater; frequent nighttime crater incandescence was reflected in the degassing plume. On 12 June an emission rose 100 m above the crater and drifted NNW. On 15 June one or several emissions resulted in ashfall to the NE as far as 5.5 km from the crater, based on a Skysat satellite image. Several Strombolian explosions occurred within the crater; activity on 15 June was higher energy and ejected blocks 200-300 m on the NE slope. Surveillance cameras showed white gas-and-steam emissions rising 480 m above the crater on 16 June. On 19 and 24 June low-intensity Strombolian activity was observed, ejecting material as far as 200 m from the center of the crater to the E.
During July, seismicity included 29,319 LP-type events, 3,736 TR-type events, and two VT-type events. DOAS equipment recorded two days of sulfur dioxide emissions of 4,220 t/d and 1,009 t/d on 1 and 13 July, respectively. Constant nighttime incandescence was also recorded and was particularly noticeable when accompanied by eruptive columns on 12 and 16 July. Minor explosive events were detected in the crater. According to Skysat satellite images taken on 12, 13, and 16 July, ashfall deposits were identified 155 m S of the crater. According to POVI, incandescence was visible from two vents on the crater floor around 0336 on 12 July. Gas-and-ash emissions rose as high as 1.2 km above the crater on 13 July and drifted E and NW. A series of gas-and-steam pulses containing some ash deposited material on the upper E flank around 1551 on 13 July. During 16-31 July, average sulfur dioxide emissions of 1,679 ± 406 t/d were recorded, with a maximum daily value of 2,343 t/d on 28 July. Fine ash emissions were also reported on 16, 17, and 23 July.
Seismicity persisted during August, characterized by 27,011 LP-type events, 3,323 TR-type events, and three VT-type events. The average value of sulfur dioxide measurements taken during 1-15 August was 1,642 ± 270 t/d and 2,207 ± 4,549 t/d during 16-31 August, with a maximum daily value of 3,294 t/d on 27 August. Nighttime crater incandescence remained visible in degassing columns. White gas-and-steam emissions rose 480 m above the crater on 6 August. According to a Skysat satellite image from 6 August, ash accumulation was observed proximal to the crater and was mainly distributed toward the E slope. White gas-and-steam emissions rose 320 m above the crater on 26 August. Nighttime incandescence and Strombolian activity that generated ash emissions were reported on 27 August.
Seismicity during September was characterized by five VT-type events, 12,057 LP-type events, and 2,058 TR-type events. Nighttime incandescence persisted. On 2 September an ash emission rose 180 m above the crater and drifted SE at 1643 (figure 125) and a white gas-and-steam plume rose 320 m above the crater. According to the Buenos Aires VAAC, periods of continuous gas-and-ash emissions were visible in webcam images from 1830 on 2 September to 0110 on 3 September. Strombolian activity was observed on 2 September and during the early morning of 3 September, the latter event of which generated an ash emission that rose 60 m above the crater and drifted 100 m from the center of the crater to the NE and SW. Ashfall was reported to the SE and S as far as 750 m from the crater. The lava lake was active during 3-4 September and lava fountaining was visible for the first time since 26 March 2023, according to POVI. Fountains captured in webcam images at 2133 on 3 September and at 0054 on 4 September rose as high as 60 m above the crater rim and ejected material onto the upper W flank. Sulfur dioxide flux of 1,730 t/d and 1,281 t/d was measured on 3 and 4 September, respectively, according to data obtained by DOAS equipment.
Strong Strombolian activity and larger gas-and-ash plumes were reported during 18-20 September. On 18 September activity was also associated with energetic LP-type events and notable sulfur dioxide fluxes (as high as 4,277 t/d). On 19 September Strombolian activity and incandescence were observed. On 20 September at 0914 ash emissions rose 50 m above the crater and drifted SSE, accompanied by Strombolian activity that ejected material less than 100 m SSE, causing fall deposits on that respective flank. SERNAGEOMIN reported that a Planet Scope satellite image taken on 20 September showed the lava lake in the crater, measuring 32 m x 35 m and an area of 0.001 km2. Several ash emissions were recorded at 0841, 0910, 1251, 1306, 1312, 1315, and 1324 on 23 September and rose less than 150 m above the crater. The sulfur dioxide flux value was 698 t/d on 23 September and 1,097 t/d on 24 September. On 24 September the Volcanic Alert Level (VAL) was raised to Orange (the third level on a four-color scale). SENAPRED maintained the Alert Level at Yellow (the middle level on a three-color scale) for the communities of Villarrica, Pucón (16 km N), Curarrehue, and Panguipulli.
During 24-25 September there was an increase in seismic energy (observed at TR-events) and acoustic signals, characterized by 1 VT-type event, 213 LP-type events, and 124 TR-type events. Mainly white gas-and-steam emissions, in addition to occasional fine ash emissions were recorded. During the early morning of 25 September Strombolian explosions were reported and ejected material 250 m in all directions, though dominantly toward the NW. On 25 September the average value of sulfur dioxide flux was 760 t/d. Seismicity during 25-30 September consisted of five VT-type events, 1,937 LP-type events, and 456 TR-type events.
During 25-29 September moderate Strombolian activity was observed and ejected material as far as the crater rim. In addition, ash pulses lasting roughly 50 minutes were observed around 0700 and dispersed ENE. During 26-27 September a TR episode lasted 6.5 hours and was accompanied by discrete acoustic signals. Satellite images from 26 September showed a spatter cone on the crater floor with one vent that measured 10 x 14 m and a smaller vent about 35 m NE of the cone. SERNAGEOMIN reported an abundant number of bomb-sized blocks up to 150 m from the crater, as well as impact marks on the snow, which indicated explosive activity. A low-altitude ash emission was observed drifting NW around 1140 on 28 September, based on webcam images. Between 0620 and 0850 on 29 September an ash emission rose 60 m above the crater and drifted NW. During an overflight taken around 1000 on 29 September scientists observed molten material in the vent, a large accumulation of pyroclasts inside the crater, and energetic degassing, some of which contained a small amount of ash. Block-sized pyroclasts were deposited on the internal walls and near the crater, and a distal ash deposit was also visible. The average sulfur dioxide flux measured on 28 September was 344 t/d. Satellite images taken on 29 September ashfall was deposited roughly 3 km WNW from the crater and nighttime crater incandescence remained visible. The average sulfur dioxide flux value from 29 September was 199 t/d. On 30 September at 0740 a pulsating ash emission rose 1.1 km above the crater and drifted NNW (figure 126). Deposits on the S flank extended as far as 4.5 km from the crater rim, based on satellite images from 30 September.
Infrared MODIS satellite data processed by MIROVA (Middle InfraRed Observation of Volcanic Activity) showed intermittent thermal activity during April through September, with slightly stronger activity detected during late September (figure 127). Small clusters of thermal activity were detected during mid-June, early July, early August, and late September. According to the MODVOLC thermal alert system, a total of four thermal hotspots were detected on 7 July and 3 and 23 September. This activity was also intermittently captured in infrared satellite imagery on clear weather days (figure 128).
Geologic Background. The glacier-covered Villarrica stratovolcano, in the northern Lakes District of central Chile, is ~15 km south of the city of Pucon. A 2-km-wide caldera that formed about 3,500 years ago is located at the base of the presently active, dominantly basaltic to basaltic andesite cone at the NW margin of a 6-km-wide Pleistocene caldera. More than 30 scoria cones and fissure vents are present on the flanks. Plinian eruptions and pyroclastic flows that have extended up to 20 km from the volcano were produced during the Holocene. Lava flows up to 18 km long have issued from summit and flank vents. Eruptions documented since 1558 CE have consisted largely of mild-to-moderate explosive activity with occasional lava effusion. Glaciers cover 40 km2 of the volcano, and lahars have damaged towns on its flanks.
Information Contacts: Servicio Nacional de Geología y Minería (SERNAGEOMIN), Observatorio Volcanológico de Los Andes del Sur (OVDAS), Avda Sta María No. 0104, Santiago, Chile (URL: http://www.sernageomin.cl/); Proyecto Observación Villarrica Internet (POVI) (URL: http://www.povi.cl/); Sistema y Servicio Nacional de Prevención y Repuesta Ante Desastres (SENAPRED), Av. Beauchef 1671, Santiago, Chile (URL: https://web.senapred.cl/); Buenos Aires Volcanic Ash Advisory Center (VAAC), Servicio Meteorológico Nacional-Fuerza Aérea Argentina, 25 de mayo 658, Buenos Aires, Argentina (URL: http://www.smn.gov.ar/vaac/buenosaires/inicio.php); MIROVA (Middle InfraRed Observation of Volcanic Activity), a collaborative project between the Universities of Turin and Florence (Italy) supported by the Centre for Volcanic Risk of the Italian Civil Protection Department (URL: http://www.mirovaweb.it/); Hawai'i Institute of Geophysics and Planetology (HIGP) - MODVOLC Thermal Alerts System, School of Ocean and Earth Science and Technology (SOEST), Univ. of Hawai'i, 2525 Correa Road, Honolulu, HI 96822, USA (URL: http://modis.higp.hawaii.edu/); Copernicus Browser, Copernicus Data Space Ecosystem, European Space Agency (URL: https://dataspace.copernicus.eu/browser/).
Merapi (Indonesia) — October 2023 Cite this Report
Merapi
Indonesia
7.54°S, 110.446°E; summit elev. 2910 m
All times are local (unless otherwise noted)
Frequent incandescent avalanches during April-September 2023
Merapi, located just north of the major city of Yogyakarta in central Java, Indonesia, has had activity within the last 20 years characterized by pyroclastic flows and lahars accompanying growth and collapse of the steep-sided active summit lava dome. The current eruption period began in late December 2020 and has more recently consisted of ash plumes, intermittent incandescent avalanches of material, and pyroclastic flows (BGVN 48:04). This report covers activity during April through September 2023, based on information from Balai Penyelidikan dan Pengembangan Teknologi Kebencanaan Geologi (BPPTKG), the Center for Research and Development of Geological Disaster Technology, a branch of PVMBG which specifically monitors Merapi. Additional information comes from the Pusat Vulkanologi dan Mitigasi Bencana Geologi (PVMBG, also known as Indonesian Center for Volcanology and Geological Hazard Mitigation, CVGHM), MAGMA Indonesia, the Darwin Volcanic Ash Advisory Centre (VAAC), and various satellite data.
Activity during April through September 2023 primarily consisted of incandescent avalanches of material that mainly affected the SW and W flanks and traveled as far as 2.3 km from the summit (table 25) and white gas-and-steam emissions that rose 10-1,000 m above the crater.
Table 25. Monthly summary of avalanches and avalanche distances recorded at Merapi during April through September 2023. The number of reported avalanches does not include instances where possible avalanches were heard but could not be visually confirmed as a result of inclement weather. Data courtesy of BPPTKG (April-September 2023 daily reports).
| Month |
Average number of avalanches per day |
Distance avalanches traveled (m) |
| Apr 2023 |
19 |
1,200-2,000 |
| May 2023 |
22 |
500-2,000 |
| Jun 2023 |
18 |
1,200-2,000 |
| Jul 2023 |
30 |
300-2,000 |
| Aug 2023 |
25 |
400-2,300 |
| Sep 2023 |
23 |
600-2,000 |
BPPTKG reported that during April and May white gas-and-steam emissions rose 10-750 m above the crater, incandescent avalanches descended 500-2,000 m on the SW and W flanks (figure 135). Cloudy weather often prevented clear views of the summit, and sometimes avalanches could not be confirmed. According to a webcam image, a pyroclastic flow was visible on 17 April at 0531. During the week of 28 April and 4 May a pyroclastic flow was reported on the SW flank, traveling up to 2.5 km. According to a drone overflight taken on 17 May the SW lava dome volume was an estimated 2,372,800 cubic meters and the dome in the main crater was an estimated 2,337,300 cubic meters.
During June and July similar activity persisted with white gas-and-steam emissions rising 10-350 m above the crater and frequent incandescent avalanches that traveled 300-2,000 m down the SW, W, and S flanks (figure 136). Based on an analysis of aerial photos taken on 24 June the volume of the SW lava dome was approximately 2.5 million cubic meters. A pyroclastic flow was observed on 5 July that traveled 2.7 km on the SW flank. According to the Darwin VAAC multiple minor ash plumes were identified in satellite images on 19 July that rose to 3.7 km altitude and drifted S and SW. During 22, 25, and 26 July a total of 17 avalanches descended as far as 1.8 km on the S flank.
Frequent white gas-and-steam emissions continued during August and September, rising 10-450 m above the crater. Incandescent avalanches mainly affected the SW and W flanks and traveled 400-2,300 m from the vent (figure 137). An aerial survey conducted on 10 August was analyzed and reported that estimates of the SW dome volume was 2,764,300 cubic meters and the dome in the main crater was 2,369,800 cubic meters.
Frequent and moderate-power thermal activity continued throughout the reporting period, according to a MIROVA (Middle InfraRed Observation of Volcanic Activity) analysis of MODIS satellite data (figure 138). There was an increase in the number of detected anomalies during mid-May. The MODVOLC thermal algorithm recorded a total of 47 thermal hotspots: six during April, nine during May, eight during June, 15 during July, four during August, and five during September. Some of this activity was captured in infrared satellite imagery on clear weather days, sometimes accompanied by incandescent material on the SW flank (figure 139).
Geologic Background. Merapi, one of Indonesia's most active volcanoes, lies in one of the world's most densely populated areas and dominates the landscape immediately north of the major city of Yogyakarta. It is the youngest and southernmost of a volcanic chain extending NNW to Ungaran volcano. Growth of Old Merapi during the Pleistocene ended with major edifice collapse perhaps about 2,000 years ago, leaving a large arcuate scarp cutting the eroded older Batulawang volcano. Subsequent growth of the steep-sided Young Merapi edifice, its upper part unvegetated due to frequent activity, began SW of the earlier collapse scarp. Pyroclastic flows and lahars accompanying growth and collapse of the steep-sided active summit lava dome have devastated cultivated lands on the western-to-southern flanks and caused many fatalities.
Information Contacts: Balai Penyelidikan dan Pengembangan Teknologi Kebencanaan Geologi (BPPTKG), Center for Research and Development of Geological Disaster Technology (URL: http://merapi.bgl.esdm.go.id/, Twitter: @BPPTKG); MAGMA Indonesia, Kementerian Energi dan Sumber Daya Mineral (URL: https://magma.esdm.go.id/v1); Pusat Vulkanologi dan Mitigasi Bencana Geologi (PVMBG, also known as Indonesian Center for Volcanology and Geological Hazard Mitigation, CVGHM), Jalan Diponegoro 57, Bandung 40122, Indonesia (URL: http://www.vsi.esdm.go.id/); Darwin Volcanic Ash Advisory Centre (VAAC), Bureau of Meteorology, Northern Territory Regional Office, PO Box 40050, Casuarina, NT 0811, Australia (URL: http://www.bom.gov.au/info/vaac/); MIROVA (Middle InfraRed Observation of Volcanic Activity), a collaborative project between the Universities of Turin and Florence (Italy) supported by the Centre for Volcanic Risk of the Italian Civil Protection Department (URL: http://www.mirovaweb.it/); Hawai'i Institute of Geophysics and Planetology (HIGP) - MODVOLC Thermal Alerts System, School of Ocean and Earth Science and Technology (SOEST), Univ. of Hawai'i, 2525 Correa Road, Honolulu, HI 96822, USA (URL: http://modis.higp.hawaii.edu/); Copernicus Browser, Copernicus Data Space Ecosystem, European Space Agency (URL: https://dataspace.copernicus.eu/browser/); Øystein Lund Andersen (URL: https://www.oysteinlundandersen.com/, https://twitter.com/oysteinvolcano).
Ebeko
Russia
50.686°N, 156.014°E; summit elev. 1103 m
All times are local (unless otherwise noted)
Moderate explosive activity with ash plumes continued during June-November 2023
Ebeko, located on the N end of Paramushir Island in Russia’s Kuril Islands just S of the Kamchatka Peninsula, consists of three summit craters along a SSW-NNE line at the northern end of a complex of five volcanic cones. Observed eruptions date back to the late 18th century and have been characterized as small-to-moderate explosions from the summit crater, accompanied by intense fumarolic activity. The current eruptive period began in June 2022, consisting of frequent explosions, ash plumes, and thermal activity (BGVN 47:10, 48:06). This report covers similar activity during June-November 2023, based on information from the Kamchatka Volcanic Eruptions Response Team (KVERT) and satellite data.
Moderate explosive activity continued during June-November 2023 (figures 50 and 51). According to visual data from Severo-Kurilsk, explosions sent ash 2-3.5 km above the summit (3-4.5 km altitude) during most days during June through mid-September. Activity after mid-September was slightly weaker, with ash usually reaching less than 2 km above the summit. According to KVERT the volcano in October and November was, with a few exceptions, either quiet or obscured by clouds that prevented satellite observations. KVERT issued Volcano Observatory Notices for Aviation (VONA) on 8 and 12 June, 13 and 22 July, 3 and 21 August, and 31 October warning of potential aviation hazards from ash plumes drifting 3-15 km from the volcano. Based on satellite data, KVERT reported a persistent thermal anomaly whenever weather clouds permitted viewing.
Geologic Background. The flat-topped summit of the central cone of Ebeko volcano, one of the most active in the Kuril Islands, occupies the northern end of Paramushir Island. Three summit craters located along a SSW-NNE line form Ebeko volcano proper, at the northern end of a complex of five volcanic cones. Blocky lava flows extend west from Ebeko and SE from the neighboring Nezametnyi cone. The eastern part of the southern crater contains strong solfataras and a large boiling spring. The central crater is filled by a lake about 20 m deep whose shores are lined with steaming solfataras; the northern crater lies across a narrow, low barrier from the central crater and contains a small, cold crescentic lake. Historical activity, recorded since the late-18th century, has been restricted to small-to-moderate explosive eruptions from the summit craters. Intense fumarolic activity occurs in the summit craters, on the outer flanks of the cone, and in lateral explosion craters.
Information Contacts: Kamchatka Volcanic Eruptions Response Team (KVERT), Far Eastern Branch, Russian Academy of Sciences, 9 Piip Blvd., Petropavlovsk-Kamchatsky, 683006, Russia (URL: http://www.kscnet.ru/ivs/kvert/).
Search Bulletin Archive by Publication Date
Select a month and year from the drop-downs and click "Show Issue" to have that issue displayed in this tab.
The default month and year is the latest issue available.
Scientific Event Alert Network Bulletin - Volume 10, Number 11 (November 1985)
Managing Editor: Lindsay McClelland
Ahyi (United States)
T-Phases recorded in Tahiti may be from this site
Aira (Japan)
Vigorous explosions continue
Arenal (Costa Rica)
Lava flows and tephra ejection continues
Atmospheric Effects (1980-1989) (Unknown)
New stratospheric aerosol layers
Bagana (Papua New Guinea)
Explosions; weak glow; increased seismicity
Colima (Mexico)
New fissures; fumaroles to 800°C; felt seismicity
Concepcion (Nicaragua)
Ash eruption
Fournaise, Piton de la (France)
Earthquake swarm then fissure eruption
Fukujin (United States)
No water discoloration observed, December 1983-December 1985
Fukutoku-Oka-no-Ba (Japan)
Water discoloration observed frequently during December 1983-October 1985
Guallatiri (Chile)
Vapor plumes at 1-minute intervals
Karangetang (Indonesia)
Small ash eruption
Kasuga 1 (United States)
No water discoloration observed, December 1983-December 1985
Kilauea (United States)
Episode 39 includes S-flank vent activity
Klyuchevskoy (Russia)
Ash explosions; lava flows
Lamongan (Indonesia)
Seismicity declines
Langila (Papua New Guinea)
Two small explosions
Manam (Papua New Guinea)
Ashfall on NW and SW parts of island
Masaya (Nicaragua)
Gas column heights in 1985
Michoacan-Guanajuato (Mexico)
Fumarole temperatures increase
Momotombo (Nicaragua)
Fumarole temperatures during 1985
Nikko (Japan)
No water discoloration observed, December 1983-December 1985
Poas (Costa Rica)
Fumarole temperatures decrease
Rabaul (Papua New Guinea)
Seismicity and deformation continue to decline
Raung (Indonesia)
Many small explosions; light ashfalls
Ruapehu (New Zealand)
Crater lake upwelling; higher temperatures
Ruiz, Nevado del (Colombia)
Seismic swarms, latest with inflation; more on 13 November activity and products
Sangeang Api (Indonesia)
Strombolian explosions; lava flow in growing channel; pyroclastic flow deposit
St. Helens (United States)
New lahar warning gauge; background activity
Tangkuban Parahu (Indonesia)
Crater temperatures rise; seismicity unchanged
Tangkuban Parahu (Indonesia)
Minor steam explosions
Telica (Nicaragua)
Continued normal activity and strong seismicity
Ulawun (Papua New Guinea)
Increasing seismicity then tephra ejection & lava flow
Villarrica (Chile)
Small lava fountains and ash; increased seismicity
Whakaari/White Island (New Zealand)
Fumarole temperatures drop; magnetic anomaly
Ahyi (United States) — November 1985 Cite this Report
Ahyi
United States
20.42°N, 145.03°E; summit elev. -75 m
All times are local (unless otherwise noted)
T-Phases recorded in Tahiti may be from this site
Between 2 August and 5 September, 109 T-phase events originating in the NW Pacific were received by a high-gain station at Rangiroa, Tahiti. J.M. Talandier notes that their characteristics are typical of submarine volcanic eruptions, being of shallow (ocean) depth; the timing of the events coincides with the presence of a zone of discolored water.... However, a precise origin cannot be determined because the events were of weak amplitude and recorded by only one station.
[Report reviewed and attributed to Ahyi in 2023.]
Geologic Background. Ahyi seamount is a large conical submarine volcano that rises to within 75 m of the ocean surface ~18 km SE of the island of Farallon de Pajaros in the northern Marianas. Water discoloration has been observed there, and in 1979 the crew of a fishing boat felt shocks over the summit area, followed by upwelling of sulfur-bearing water. On 24-25 April 2001 an explosive eruption was detected seismically by a station on Rangiroa Atoll, Tuamotu Archipelago. The event was well constrained (+/- 15 km) at a location near the southern base of Ahyi. An eruption in April-May 2014 was detected by NOAA divers, hydroacoustic sensors, and seismic stations.
Information Contacts: J. Talandier, Lab. de Geophysique, Tahiti.
Aira
Japan
31.5772°N, 130.6589°E; summit elev. 1117 m
All times are local (unless otherwise noted)
Vigorous explosions continue
Eruptive activity remained vigorous in November, when 34 explosions were recorded. Frequent powerful explosions produced air shocks and scattered incandescent blocks to about 2 km from the summit. No damages were reported. An explosion on 25 November at 1427 was accompanied by a small pyroclastic flow, which only covered part of the summit area.
The frequency of explosions increased further in early December. By the 5th, 19 explosions were recorded, bringing 1985's total to 416, the largest since discrete explosive activity began in 1955 (figure 15). A series of small explosions on 3 December shattered windows of several buildings in northern Kagoshima and disrupted telephone service in some areas. The summit crater of Minami-dake erupted on 5 December at 0220 and 0648, dropping ash on Kagoshima, but there was no damage.
Geologic Background. The Aira caldera in the northern half of Kagoshima Bay contains the post-caldera Sakurajima volcano, one of Japan's most active. Eruption of the voluminous Ito pyroclastic flow accompanied formation of the 17 x 23 km caldera about 22,000 years ago. The smaller Wakamiko caldera was formed during the early Holocene in the NE corner of the caldera, along with several post-caldera cones. The construction of Sakurajima began about 13,000 years ago on the southern rim and built an island that was joined to the Osumi Peninsula during the major explosive and effusive eruption of 1914. Activity at the Kitadake summit cone ended about 4,850 years ago, after which eruptions took place at Minamidake. Frequent eruptions since the 8th century have deposited ash on the city of Kagoshima, located across Kagoshima Bay only 8 km from the summit. The largest recorded eruption took place during 1471-76.
Information Contacts: JMA, Tokyo; UPI.
Arenal (Costa Rica) — November 1985 Cite this Report
Arenal
Costa Rica
10.463°N, 84.703°W; summit elev. 1670 m
All times are local (unless otherwise noted)
Lava flows and tephra ejection continues
Lava production continued through early November from the active vent (Crater C), feeding lava flows that advanced NW, W, and S. A dome has formed on the W rim of Crater C. Gas emission was continuous. The ejections of pyroclastic materials that began in June 1984 were also continuing in early November. Geologists noted that when the advance of the lava flows was slow, the explosions were strong and very frequent, whereas when much lava was flowing from the crater there were almost no pyroclastic ejections. There were strong explosions during the first week in October. A 50 x 60 cm bomb fell 1 km from the crater, forming an impact crater that measured 80 x 50 cm and 20 cm deep. A block with dimensions of 90 x 30 x 20 cm formed a 90 x 100 cm crater that was 30 cm deep; this block came to rest 20 m from its initial impact crater. Small quantities of ash were emitted. Prevailing winds carried the ash about 3 km W and SW.
Further Reference. Alvarado, I.G.E. and Barquero, R., 1987, Las señales sísmicas del volcán Arenal (Costa Rica) y su relación con las fases eruptivas (1968-1986): Instituto Costarricense de Electricidad, Departamento de Geología, San José, 33 p.
Geologic Background. Conical Volcán Arenal is the youngest stratovolcano in Costa Rica and one of its most active. The 1670-m-high andesitic volcano towers above the eastern shores of Lake Arenal, which has been enlarged by a hydroelectric project. Arenal lies along a volcanic chain that has migrated to the NW from the late-Pleistocene Los Perdidos lava domes through the Pleistocene-to-Holocene Chato volcano, which contains a 500-m-wide, lake-filled summit crater. The earliest known eruptions of Arenal took place about 7000 years ago, and it was active concurrently with Cerro Chato until the activity of Chato ended about 3500 years ago. Growth of Arenal has been characterized by periodic major explosive eruptions at several-hundred-year intervals and periods of lava effusion that armor the cone. An eruptive period that began with a major explosive eruption in 1968 ended in December 2010; continuous explosive activity accompanied by slow lava effusion and the occasional emission of pyroclastic flows characterized the eruption from vents at the summit and on the upper western flank.
Information Contacts: J. Barquero H. and E. Fernández S., Univ. Nacional, Heredia.
Atmospheric Effects (1980-1989) (Unknown) — November 1985 Cite this Report
Atmospheric Effects (1980-1989)
Unknown
Unknown, Unknown; summit elev. m
All times are local (unless otherwise noted)
New stratospheric aerosol layers
Data from Hawaii and Wyoming suggest that aerosol material, perhaps from the 13 November eruption of Ruiz volcano, Colombia, has recently been injected into the stratosphere. Through 22 November, lidar measurements at Mauna Loa, Hawaii continued to show only remnants of the 1982 El Chichón aerosol cloud. On 26 and 27 November, a distinct new layer centered at 25-25.5 km appeared on Mauna Loa lidar profiles (figure 12), accompanied by a substantial increase in total backscatter. This layer was absent over Mauna Loa on 3 December, but new layers centered at 15, 16.8, and 18.6 km altitude (tropopause altitude was 16.5 km) were detected and total backscatter remained elevated. Preliminary data 7 and 10 December showed some apparent new material, but less distinctly than on the 3rd. No new material was evident 10 December over Hampton, Virginia.
While flying from Honolulu to Los Angeles on 27 November at approximately 22°N, 140°W, David Hofmann saw a cloud of particles above the aircraft at an estimated elevation of 12 km. The gray haze and large ring around the sun were very similar towhat Hofmann observed shortly after the eruption of Fuego volcano, Guatemala in October 1974, suggesting that this cloud was also of volcanic origin.
On 5 December, balloon-borne particle counters detected a 10-fold increase in condensation nuclei (CN, H2SO4 droplets with diameters much less than 0.1 µm) between 15 and 17 km altitude over Laramie, Wyoming. Particle counts were 400 per cm3 compared to background values of 40 particles per cm3 at that altitude [see 10:12]. This CN event is distinguishable from El Chichón aerosols by both its altitude (El Chichón aerosols are found at 17-19 km) and particle size (El Chichón particles are now larger than 0.1 µm). A subsequent balloon flight on 11 December showed only background CN concentrations at these elevations.
Geologic Background. The enormous aerosol cloud from the March-April 1982 eruption of Mexico's El Chichón persisted for years in the stratosphere, and led to the Atmospheric Effects section becoming a regular feature of the Bulletin. Descriptions of the initial dispersal of major eruption clouds remain with the individual eruption reports, but observations of long-term stratospheric aerosol loading will be found here.
Information Contacts: D. Hofmann and J. Rosen, Univ. of Wyoming; T. DeFoor, MLO; R. Reiter, Garmisch-Partenkirchen, W Germany; W. Fuller, NASA.
Bagana (Papua New Guinea) — November 1985 Cite this Report
Bagana
Papua New Guinea
6.137°S, 155.196°E; summit elev. 1855 m
All times are local (unless otherwise noted)
Explosions; weak glow; increased seismicity
"A moderate level of activity was observed during November with occasional reports of weak nighttime glows from the summit crater and occasional audible explosions. Seismic activity increased in the middle of the month to about 50 earthquakes per day. Previous levels were generally less than 10. This level of seismic activity persisted to the end of the month."
Geologic Background. Bagana volcano, in a remote portion of central Bougainville Island, is frequently active. This massive symmetrical cone was largely constructed by an accumulation of viscous andesitic lava flows. The entire edifice could have been constructed in about 300 years at its present rate of lava production. Eruptive activity is characterized by non-explosive effusion of viscous lava that maintains a small lava dome in the summit crater, although occasional explosive activity produces pyroclastic flows. Lava flows with tongue-shaped lobes up to 50 m thick and prominent levees descend the flanks on all sides.
Information Contacts: P. Lowenstein, RVO.
Colima
Mexico
19.514°N, 103.62°W; summit elev. 3850 m
All times are local (unless otherwise noted)
New fissures; fumaroles to 800°C; felt seismicity
"Dartmouth volcanologists visited Colima 26-27 November. Large linear fractures had opened on the NE flank of the volcano between the summit and Volcancito Cone, at an elevation of approximately 3,700 m (figure 1). These fractures strike N30-45°E and are as much as 15 m deep, 5 m wide, and 50-100 m long. New arcuate fractures of comparable size are concave downslope and head across the linear fractures. Fumarolic activity in an area of 100 m2 was intense with temperatures up to 800°C and several fumaroles hotter than 600°C. Fracturing and fumarolic activity persisted at higher elevations, but was concentrated below the summit. Hundreds of tremors were felt during a bivouac near the fumarole field on the night of 26 November. A small fissure was observed cutting across the summit of Volcancito roughly in line with those found at higher elevations. Temperatures in this fissure were 40°C. This is a marked change in activity since our group last visited Colima in April 1983, when fractures and fumarolic activity were not observed in this area. The 1983 fumaroles were located at higher elevations and were much cooler; highest temperature was 565°C."
Geologic Background. The Colima complex is the most prominent volcanic center of the western Mexican Volcanic Belt. It consists of two southward-younging volcanoes, Nevado de Colima (the high point of the complex) on the north and the historically active Volcán de Colima at the south. A group of late-Pleistocene cinder cones is located on the floor of the Colima graben west and east of the complex. Volcán de Colima (also known as Volcán Fuego) is a youthful stratovolcano constructed within a 5-km-wide scarp, breached to the south, that has been the source of large debris avalanches. Major slope failures have occurred repeatedly from both the Nevado and Colima cones, producing thick debris-avalanche deposits on three sides of the complex. Frequent recorded eruptions date back to the 16th century. Occasional major explosive eruptions have destroyed the summit (most recently in 1913) and left a deep, steep-sided crater that was slowly refilled and then overtopped by lava dome growth.
Information Contacts: C. Connor, B. Gemmell, and R. Stoiber, Dartmouth College.
Concepcion (Nicaragua) — November 1985 Cite this Report
Concepcion
Nicaragua
11.538°N, 85.622°W; summit elev. 1700 m
All times are local (unless otherwise noted)
Ash eruption
A violent tephra eruption occurred on 2 January 1985, accompanied by strong rumbling. Ashfall damaged tobacco and sesame crops, and fell on the towns of Esquipulas, Los Angeles, and to a lesser extent, Moyogalpa (at the W foot of the volcano). As the eruption began, Esquipulas was celebrating the festival of its patron saint, but heavy ashfall forced the festival's suspension. Blocks fell on the volcano's flanks. The eruption was comparable to that of 1977 (2:4).
During Space Shuttle mission 61B (27 November-3 December 1985), astronauts photographed Concepción three times. The first two photographs (nos. 61B-121-101 and 61B-36-086), taken on 28 November at 1300 and 30 November at 1230, showed no plume or other signs of volcanic activity. A photograph (no. 61B-39-066) taken later in the mission, however, exhibited a buff-brown plume over the volcano, which could be traced clearly for 6.6 km to the SW with possible wispy material for an additional 10 km.
Geologic Background. Volcán Concepción is one of Nicaragua's highest and most active volcanoes. The symmetrical basaltic-to-dacitic stratovolcano forms the NW half of the dumbbell-shaped island of Ometepe in Lake Nicaragua and is connected to neighboring Madera volcano by a narrow isthmus. A steep-walled summit crater is 250 m deep and has a higher western rim. N-S-trending fractures on the flanks have produced chains of spatter cones, cinder cones, lava domes, and maars located on the NW, NE, SE, and southern sides extending in some cases down to Lake Nicaragua. Concepción was constructed above a basement of lake sediments, and the modern cone grew above a largely buried caldera, a small remnant of which forms a break in slope about halfway up the N flank. Frequent explosive eruptions during the past half century have increased the height of the summit significantly above that shown on current topographic maps and have kept the upper part of the volcano unvegetated.
Information Contacts: D. Fajardo B., INETER; C. Wood, M. Helfert, NASA, Houston.
Piton de la Fournaise (France) — November 1985 Cite this Report
Piton de la Fournaise
France
21.244°S, 55.708°E; summit elev. 2632 m
All times are local (unless otherwise noted)
Earthquake swarm then fissure eruption
"Seismic activity was very low during all of November and was at shallow depth (1-2 km) under the summit. Small deformation was measured only on the summit stations. Continuously-recording tiltmeters indicated progressive deformation on Bory Crater since 28 November.
"During the night of 1-2 December, a very short seismic crisis occurred. For 17 minutes, very shallow low-magnitude events occurred under Dolomieu crater at depths of 0.5-1.5 km. A 1.5-km fissure opened from the top of Bory crater down to the S flank of the central cone. This eruption lasted only 28 hours, from 2 December at 0215 to 3 December at 0600. The amount of basaltic lava emitted was very small.
"A major inflation pattern was recorded only on the summit stations. No deformation was found in the rest of the geodimeter net."
Geologic Background. Piton de la Fournaise is a massive basaltic shield volcano on the French island of Réunion in the western Indian Ocean. Much of its more than 530,000-year history overlapped with eruptions of the deeply dissected Piton des Neiges shield volcano to the NW. Three scarps formed at about 250,000, 65,000, and less than 5,000 years ago by progressive eastward slumping, leaving caldera-sized embayments open to the E and SE. Numerous pyroclastic cones are present on the floor of the scarps and their outer flanks. Most recorded eruptions have originated from the summit and flanks of Dolomieu, a 400-m-high lava shield that has grown within the youngest scarp, which is about 9 km wide and about 13 km from the western wall to the ocean on the E side. More than 150 eruptions, most of which have produced fluid basaltic lava flows, have occurred since the 17th century. Only six eruptions, in 1708, 1774, 1776, 1800, 1977, and 1986, have originated from fissures outside the scarps.
Information Contacts: H. Delorme and J. Delarue, OVPDLF; P. Bachelery, Univ. de la Réunion.
Fukujin (United States) — November 1985 Cite this Report
Fukujin
United States
21.93°N, 143.47°E; summit elev. -217 m
All times are local (unless otherwise noted)
No water discoloration observed, December 1983-December 1985
JMSA has continued frequent aerial monitoring of several known submarine volcanoes. Volcanic activity has often been observed at Fukutoku-okanoba during overflights since late 1983, but no water discoloration has been seen at Kasuga, Nikko, or Fukujin.
Geologic Background. Fukujin seamount in the Mariana Volcanic Arc has risen on occasion to just beneath the ocean surface. Intermittent periods of water discoloration have been observed since the mid-20th century, and eruptions producing floating pumice were noted on several occasions.
Information Contacts: JMA, Tokyo.
Fukutoku-Oka-no-Ba (Japan) — November 1985 Cite this Report
Fukutoku-Oka-no-Ba
Japan
24.285°N, 141.481°E; summit elev. -29 m
All times are local (unless otherwise noted)
Water discoloration observed frequently during December 1983-October 1985
JMSA has continued frequent aerial monitoring of several known submarine volcanoes. Volcanic activity has often been observed at Fukutoku-Okanoba during overflights since late 1983 . . . . Discolored water was observed at Fukutoku-Okanoba on: 21 December 1983; 30 January, 23 February, 15 March, 6 and 23 April, 18 May, 9 June, 10 July, 1 August, 6 September, and 16 November 1984; and 14 February, 15 March, 17 April, 14 May, 17 September, and 17 October 1985; and was not visible 26 September, 24 October, and 12 December 1984.
[Additional water discoloration in 1985 was reported (Bulletin of Volcanic Eruptions no. 25, 1988) on 14 June, 17 July, 13 August, 14 November, and 23 December.]
Geologic Background. Fukutoku-Oka-no-ba is a submarine volcano located 5 km NE of the island of Minami-Ioto. Water discoloration is frequently observed, and several ephemeral islands have formed in the 20th century. The first of these formed Shin-Ioto ("New Sulfur Island") in 1904, and the most recent island was formed in 1986. The volcano is part of an elongated edifice with two major topographic highs trending NNW-SSE, and is a trachyandesitic volcano geochemically similar to Ioto.
Information Contacts: JMA, Tokyo.
Guallatiri (Chile) — November 1985 Cite this Report
Guallatiri
Chile
18.42°S, 69.092°W; summit elev. 6071 m
All times are local (unless otherwise noted)
Vapor plumes at 1-minute intervals
[This activity was initially attributed to Acotango in the Quimsachata Volcano Group. It is now thought to have originated from Guallatiri, further along the same line of sight as Acotango (figure 1). Investigation of Acotango volcano in 1987, by Oscar González-Ferrán, revealed no evidence of a recent eruption.]
The quoted material is a report from Robert Koeppen. "On 1 December at 0750, Robert Koeppen (USGS), Walter West (U. S. Embassy, La Paz, Bolivia), and Jaime Jauregui (Geological Survey of Bolivia) observed steam plumes erupting from a source near the crest of Nevados de Quimsachata. The observation was made from a point about 25 km to the NNE, near the W base of Volcán Nevado Sajama, Bolivia. Visibility was initially excellent, but within about 45 minutes cloud cover completely obscured the mountain's summit. Intervening peaks prevented exact determination of the vent, but the eruption appeared to originate from Cerro Acotango, either from the main summit or possibly immediately to the NW. If the eruption plume came from Volcán Guallatiri, the next possible source area along the line of sight, then it would represent a significantly larger eruption (figure 1).
"The eruptions produced white, billowing clouds that rose vertically above the Quimsachata crest, perhaps about 500 m, then drifted W. The eruptions occurred in episodic bursts, and, based on first sightings of the plumes, at intervals ranging from 45-75 seconds. One large plume drifted more NW and appeared to trail a curtain, possibly of ash fallout. Several bursts seemed particularly vigorous and appeared to consist of several plumes coalescing at higher levels."
Chilean forest service personnel based near Lago Chungara, roughly 20 km to the NW, reported that they had seen no activity, but visibilities in the area are frequently poor.
No eruptions are known in historic time from Cerro Acotango, but Yoshio Katsui and Oscar González-Ferrán (1968) mapped it as Holocene. Four historic eruptions bave been reported from Guallatiri, most recently in December 1960. Chilean geologists note that fumarolic activity from Guallatiri is apparently continuous but less vigorous than the plume emission observed 1 December.
Reference. Katsui, Y., and González-Ferrán, O., 1968, Geología del area neovolcánica de los Nevados de Payachata: Publicaciones del Instituto de Geología, Universidad de Chile, no. 29, 161 p.
Geologic Background. One of northern Chile's most active volcanoes, Volcán Guallatiri is a symmetrical ice-clad stratovolcano at the SW end of the Nevados de Quimsachata volcano group. It lies just W of the border with Bolivia and is capped by a central dacitic dome or lava complex, with the active vent situated on its S side. Thick lava flows are prominent on the lower N and W flanks of the andesitic-to-rhyolitic volcano. Minor explosive eruptions have been reported since the beginning of the 19th century. Intense fumarolic activity with "jet-like" noises continues, and numerous solfataras extend more than 300 m down the W flank.
Information Contacts: R. Koeppen, USGS, Reston, VA; L. López E., Univ. de Chile, Santiago.
Karangetang (Indonesia) — November 1985 Cite this Report
Karangetang
Indonesia
2.781°N, 125.407°E; summit elev. 1797 m
All times are local (unless otherwise noted)
Small ash eruption
"Api Siau erupted from the main crater (Kawah Utama) on 6 November. A 1.5-km-high ash column covered villages S of the volcano (Salili, Beong, Kanawong, and Lehi) with 1-3 mm of ash. Detonations were heard from the observation post at Muaralawa, 4.5 km SW of the volcano. Additional detonations were reported throughout the month. Possible precursory signs of this activity included a darkening of the normally whitish quiescent plume beginning on 4 November."
Geologic Background. Karangetang (Api Siau) volcano lies at the northern end of the island of Siau, about 125 km NNE of the NE-most point of Sulawesi. The stratovolcano contains five summit craters along a N-S line. It is one of Indonesia's most active volcanoes, with more than 40 eruptions recorded since 1675 and many additional small eruptions that were not documented (Neumann van Padang, 1951). Twentieth-century eruptions have included frequent explosive activity sometimes accompanied by pyroclastic flows and lahars. Lava dome growth has occurred in the summit craters; collapse of lava flow fronts have produced pyroclastic flows.
Information Contacts: T. Casadevall and L. Pardyanto, VSI.
Kasuga 1 (United States) — November 1985 Cite this Report
Kasuga 1
United States
21.765°N, 143.71°E; summit elev. -598 m
All times are local (unless otherwise noted)
No water discoloration observed, December 1983-December 1985
JMSA has continued frequent aerial monitoring of several known submarine volcanoes. Volcanic activity has often been observed at Fukutoku-okanoba during overflights since late 1983, but no water discoloration has been seen at Kasuga, Nikko, or Fukujin.
Geologic Background. Kasuga 1, the northernmost of three seamounts in the the Kasuga seamount chain SE of Fukujin, rises from a depth of 3,000 m to within about 600 m of the ocean surface. A series of flank vents are located low on the southern side of the edifice. The summit does not have a caldera or display hydrothermal activity, and is largely covered by volcaniclastics. Altered basaltic and andesitic rocks dredged from the summit suggest that it is the oldest of the three seamounts, although delicately preserved lava flow lobes and toes from a flank eruption suggest a very youthful age. It is listed as an active volcano by the Japan Meteorological Agency, and floating pumice attributed to a submarine eruption was seen south of it in the summer of 1959. Water discoloration from a possible submarine eruption was reported near the seamount in November 1975.
Information Contacts: JMA, Tokyo.
Kilauea (United States) — November 1985 Cite this Report
Kilauea
United States
19.421°N, 155.287°W; summit elev. 1222 m
All times are local (unless otherwise noted)
Episode 39 includes S-flank vent activity
EPISODE 39
"Kīlauea's eruption continued in November with the 39th eruptive episode. From 12-13 November, the magma column was within a few meters of the conduit rim and spattering nearly continuously. At about 0530 on 13 November, three small vents opened on the S flank of Pu`u `O`o. Two of these vents remained active through the day and produced a pahoehoe flow that extended approximately 600 m beyond the base of Pu`u `O`o.
"The summit of Kīlauea began to deflate on 13 November at 1430. An hour later, activity at the main Pu`u `O`o vent increased, and a low fountain began to feed a thin pahoehoe flow. The fountains gradually increased in height, reaching 415 m by 1925. The vents on the S side of the cone probably died at about the same time. The high fountains continued until 0124 the next morning and produced an aa flow that extended 6 km ESE of Pu`u `O`o (figure 39).
"Summit subsidence continued until 14 November at 0330, with a total loss of 13.9 µrad recorded by the summit tiltmeter. By the end of November, the summit had regained 9.6 µrad.
"Harmonic tremor associated with episode 39 increased gradually from 13 November at 1610, peaked in amplitude between 1725 and 0100, and decreased at 0126 on 14 November. Following episode 39, harmonic tremor persisted at background levels in the E rift zone near Pu`u `O`o."
Geologic Background. Kilauea overlaps the E flank of the massive Mauna Loa shield volcano in the island of Hawaii. Eruptions are prominent in Polynesian legends; written documentation since 1820 records frequent summit and flank lava flow eruptions interspersed with periods of long-term lava lake activity at Halemaumau crater in the summit caldera until 1924. The 3 x 5 km caldera was formed in several stages about 1,500 years ago and during the 18th century; eruptions have also originated from the lengthy East and Southwest rift zones, which extend to the ocean in both directions. About 90% of the surface of the basaltic shield volcano is formed of lava flows less than about 1,100 years old; 70% of the surface is younger than 600 years. The long-term eruption from the East rift zone between 1983 and 2018 produced lava flows covering more than 100 km2, destroyed hundreds of houses, and added new coastline.
Information Contacts: C. Heliker, R. Hanatani, R. Koyanagi, HVO.
Klyuchevskoy (Russia) — November 1985 Cite this Report
Klyuchevskoy
Russia
56.056°N, 160.642°E; summit elev. 4754 m
All times are local (unless otherwise noted)
Ash explosions; lava flows
The quoted part of the following report is from S. Fedotov. "Activity at Kliuchevskoi's summit crater has increased since 17 August, following a period of slight fumarolic activity. Since then, the height of steam and gas explosions increased gradually from 200 to 1,000 m, and reached 3,000 m between 5 and 11 November; the number of ash explosions has increased as well. Since 4 November, lava fountains 300-500 m high from two vents in the crater have been observed. Lava flows more than 2 km long poured from the summit crater onto the SW and NE flanks of the volcano."
Moscow Domestic Service reported that powerful explosions occurred on the slope of the volcano on 2 December, and that eruptions at the summit were continuing.
[This report was not included in GV 75-85.]
Geologic Background. Klyuchevskoy is the highest and most active volcano on the Kamchatka Peninsula. Since its origin about 6,000 years ago, this symmetrical, basaltic stratovolcano has produced frequent moderate-volume explosive and effusive eruptions without major periods of inactivity. It rises above a saddle NE of Kamen volcano and lies SE of the broad Ushkovsky massif. More than 100 flank eruptions have occurred during approximately the past 3,000 years, with most lateral craters and cones occurring along radial fissures between the unconfined NE-to-SE flanks of the conical volcano between 500 and 3,600 m elevation. Eruptions recorded since the late 17th century have resulted in frequent changes to the morphology of the 700-m-wide summit crater. These eruptions over the past 400 years have originated primarily from the summit crater, but have also included numerous major explosive and effusive eruptions from flank craters.
Information Contacts: S. Fedotov, IV; Moscow Domestic Service.
Lamongan (Indonesia) — November 1985 Cite this Report
Lamongan
Indonesia
7.981°S, 113.341°E; summit elev. 1641 m
All times are local (unless otherwise noted)
Seismicity declines
"November activity consisted of an average of one earthquake/day in the October swarm area W of the volcano. Detailed geological and monitoring efforts are now in progress by VSI to evaluate the possibility of a future eruption from the epicentral area."
Geologic Background. Lamongan, a small stratovolcano located between the massive Tengger and Iyang-Argapura volcanic complexes, is surrounded by numerous maars and cinder cones. The currently active cone has been constructed 650 m SW of Gunung Tarub, the volcano's high point. As many as 27 maars with diameters from 150 to 700 m, some containing crater lakes, surround the volcano, along with about 60 cinder cones and spatter cones. Lake-filled maars, including Ranu Pakis, Ranu Klakah, and Ranu Bedali, are located on the E and W flanks; dry maars are predominately located on the N flanks. None of the maars has erupted during historical time, although several of the youthful maars cut drainage channels from Gunung Tarub. The volcano was very active from the time of its first historical eruption in 1799 through the end of the 19th century, producing frequent explosive eruptions and lava flows from vents on the western side ranging from the summit to about 450 m elevation.
Information Contacts: T. Casadevall and L. Pardyanto, VSI.
Langila (Papua New Guinea) — November 1985 Cite this Report
Langila
Papua New Guinea
5.525°S, 148.42°E; summit elev. 1330 m
All times are local (unless otherwise noted)
Two small explosions
"Activity was at a low level during November with occasional reports of grey ash clouds from Crater 2. A column of dark cloud was reported rising to about 200-300 m above the summit on the 30th. Two audible explosions (heard at the observation post, 10 km NW of the crater) were reported on the 17th and 30th. Crater 3 remained inactive throughout the month. Seismic activity remained at a low level throughout the month with only 2 explosion shocks recorded, on the 17th and the 30th."
Geologic Background. Langila, one of the most active volcanoes of New Britain, consists of a group of four small overlapping composite basaltic-andesitic cones on the lower E flank of the extinct Talawe volcano in the Cape Gloucester area of NW New Britain. A rectangular, 2.5-km-long crater is breached widely to the SE; Langila was constructed NE of the breached crater of Talawe. An extensive lava field reaches the coast on the N and NE sides of Langila. Frequent mild-to-moderate explosive eruptions, sometimes accompanied by lava flows, have been recorded since the 19th century from three active craters at the summit. The youngest and smallest crater (no. 3 crater) was formed in 1960 and has a diameter of 150 m.
Information Contacts: B. Talai, RVO.
Manam (Papua New Guinea) — November 1985 Cite this Report
Manam
Papua New Guinea
4.08°S, 145.037°E; summit elev. 1807 m
All times are local (unless otherwise noted)
Ashfall on NW and SW parts of island
"A slight increase in activity occurred in November with reports of brown ash clouds from Southern and Main craters. Ashfalls were reported along the NW and SW parts of the island. On the 26th, small incandescent ejections were reported from Southern crater and rumbling was heard at the observatory 7-9, 25-26, and 29 November. Seismic amplitudes remained at non-eruptive levels with a slight increase toward the end of the month. Daily numbers of earthquakes remained low throughout the month."
Geologic Background. The 10-km-wide island of Manam, lying 13 km off the northern coast of mainland Papua New Guinea, is one of the country's most active volcanoes. Four large radial valleys extend from the unvegetated summit of the conical basaltic-andesitic stratovolcano to its lower flanks. These valleys channel lava flows and pyroclastic avalanches that have sometimes reached the coast. Five small satellitic centers are located near the island's shoreline on the northern, southern, and western sides. Two summit craters are present; both are active, although most observed eruptions have originated from the southern crater, concentrating eruptive products during much of the past century into the SE valley. Frequent eruptions, typically of mild-to-moderate scale, have been recorded since 1616. Occasional larger eruptions have produced pyroclastic flows and lava flows that reached flat-lying coastal areas and entered the sea, sometimes impacting populated areas.
Information Contacts: B. Talai, RVO.
Masaya (Nicaragua) — November 1985 Cite this Report
Masaya
Nicaragua
11.9844°N, 86.1688°W; summit elev. 594 m
All times are local (unless otherwise noted)
Gas column heights in 1985
Heights of the gas column above the rim of Santiago Crater (485 m above sea level) were measured on three occasions in 1985: 22 January (48 m), 17 June (78 m), and 21 October (78 m).
On 3 December, during re-entry from mission 61-B, Space Shuttle pilot Brian O'Connor took three 35-mm photographs (nos. 61B-12-020, 021, and 022) of Masaya. These showed a large white plume extending at least 25 km due W toward the Pacific Ocean.
Further Reference. Stoiber, R.E., Williams, S.N., and Huebert, B.J., 1986, Sulfur and Halogen Gases at Masaya Caldera Complex, Nicaragua: Total Flux and Variations with Time; JGR, v. 91, no. B12, p. 12215-12232.
Geologic Background. Masaya volcano in Nicaragua has erupted frequently since the time of the Spanish Conquistadors, when an active lava lake prompted attempts to extract the volcano's molten "gold" until it was found to be basalt rock upon cooling. It lies within the massive Pleistocene Las Sierras caldera and is itself a broad, 6 x 11 km basaltic caldera with steep-sided walls up to 300 m high. The caldera is filled on its NW end by more than a dozen vents that erupted along a circular, 4-km-diameter fracture system. The Nindirí and Masaya cones, the source of observed eruptions, were constructed at the southern end of the fracture system and contain multiple summit craters, including the currently active Santiago crater. A major basaltic Plinian tephra erupted from Masaya about 6,500 years ago. Recent lava flows cover much of the caldera floor and there is a lake at the far eastern end. A lava flow from the 1670 eruption overtopped the north caldera rim. Periods of long-term vigorous gas emission at roughly quarter-century intervals have caused health hazards and crop damage.
Information Contacts: D. Fajardo B., INETER; C. Wood, M. Helfert, NASA, Houston.
Michoacan-Guanajuato (Mexico) — November 1985 Cite this Report
Michoacan-Guanajuato
Mexico
19.85°N, 101.75°W; summit elev. 3860 m
All times are local (unless otherwise noted)
Fumarole temperatures increase
"Fumarolic activity persisted at Ahuan vent on the SW flank. When temperatures were measured at Ahuan vent on 29 November, the hottest fumarole was 473°C, 70° higher than in April 1983, when Dartmouth scientists last measured temperatures at Parícutin. Several fumaroles over an area of about 50 m2 were hotter than 300°C. No physical changes in the area were apparent since April 1983."
Geologic Background. The widespread Michoacán-Guanajuato volcanic field contains over 1,400 vents, including the historically active cinder cones of Parícutin and Jorullo, covering a 200 x 250 km wide area of Michoacán and Guanajuato states in west-central México. Cinder cones are the predominant volcanic form, but small shield volcanoes, lava domes, maars and tuff rings (many in the Valle de Santiago area), and coneless lava flows are also present. The volcanoes with shield-type morphologies are mostly Pleistocene in age, although the Michoacán-Guanajuato centers have higher slope angles and smaller basal diameters. Jorullo, which was constructed in the 18th century, and Parícutin, which grew above a former cornfield during 1943-52, are the two best known volcanic features scattered throughout the field.
Information Contacts: C. Connor, B. Gemmell, and R. Stoiber, Dartmouth College.
Momotombo (Nicaragua) — November 1985 Cite this Report
Momotombo
Nicaragua
12.423°N, 86.539°W; summit elev. 1270 m
All times are local (unless otherwise noted)
Fumarole temperatures during 1985
On 30 May Momotombo was monitored with three sensitive portable seismographs. Three microearthquakes were recorded, one of which was detected by all three instruments, and was located at 12.455°N, 86.547°W at 1.27 km depth. Fumarole temperatures remained high (table 2), but were slightly lower than the 895°C measured in August 1984.
Table 2. Fumarole temperatures at Momotombo, January-October 1985. Courtesy of INETER.
| Month |
Temperature (°C) |
| January |
870 |
| February |
870 |
| March |
875 |
| April |
879 |
| May |
882 |
| June |
875 |
| July |
875 |
| August |
875 |
| September |
874 |
| October |
874 |
Further Reference. Menyailov, I.A., Nikitina, L.P., Shapar, V.N., and Pilipenko, V.P., 1986, Temperature increase and chemical change of fumarolic gases at Momotombo volcano, Nicaragua, in 1982-1985: Are these indicators of a possible eruption?: JGR, v. 91, no. B12, p. 12199-12214.
Geologic Background. Momotombo is a young stratovolcano that rises prominently above the NW shore of Lake Managua, forming one of Nicaragua's most familiar landmarks. Momotombo began growing about 4500 years ago at the SE end of the Marrabios Range and consists of a somma from an older edifice that is surmounted by a symmetrical younger cone with a 150 x 250 m wide summit crater. Young lava flows extend down the NW flank into the 4-km-wide Monte Galán caldera. The youthful cone of Momotombito forms an island offshore in Lake Managua. Momotombo has a long record of Strombolian eruptions, punctuated by occasional stronger explosive activity. The latest eruption, in 1905, produced a lava flow that traveled from the summit to the lower NE base. A small black plume was seen above the crater after a 10 April 1996 earthquake, but later observations noted no significant changes in the crater. A major geothermal field is located on the south flank.
Information Contacts: D. Fajardo B., INETER.
Nikko
Japan
23.078°N, 142.326°E; summit elev. -392 m
All times are local (unless otherwise noted)
No water discoloration observed, December 1983-December 1985
JMSA has continued frequent aerial monitoring of several known submarine volcanoes. Volcanic activity has often been observed at Fukutoku-okanoba during overflights since late 1983, but no water discoloration has been seen at Kasuga, Nikko, or Fukujin.
Geologic Background. Nikko submarine volcano is a massive seamount that rises from nearly 3 km depth to within 392 m of the ocean surface near the N end of the Mariana Volcanic Arc. Two large cones at the basaltic-to-andesitic volcano have been constructed on the NW and NE rims of a roughly 3-km-wide, flat-floored submarine caldera, whose rim is prominently displayed on the southern side, but largely buried on the north. A smaller cone is present on the SE caldera floor. The larger NW cone lies within a partially buried crater and displays hydrothermal activity. Discolored water was observed in July 1979, but none has been observed during semi-regular seasonal reconnaissance flights since then. Hydrothermal venting was documented during a NOAA expedition.
Information Contacts: JMA, Tokyo.
Poas (Costa Rica) — November 1985 Cite this Report
Poas
Costa Rica
10.2°N, 84.233°W; summit elev. 2697 m
All times are local (unless otherwise noted)
Fumarole temperatures decrease
Fumarolic activity continued, with constant gas emission. Fumarole temperatures have dropped substantially since early 1985 (table 3).
Geologic Background. The broad vegetated edifice of Poás, one of the most active volcanoes of Costa Rica, contains three craters along a N-S line. The frequently visited multi-hued summit crater lakes of the basaltic-to-dacitic volcano are easily accessible by vehicle from the nearby capital city of San José. A N-S-trending fissure cutting the complex stratovolcano extends to the lower N flank, where it has produced the Congo stratovolcano and several lake-filled maars. The southernmost of the two summit crater lakes, Botos, last erupted about 7,500 years ago. The more prominent geothermally heated northern lake, Laguna Caliente, is one of the world's most acidic natural lakes, with a pH of near zero. It has been the site of frequent phreatic and phreatomagmatic eruptions since an eruption was reported in 1828. Eruptions often include geyser-like ejections of crater-lake water.
Information Contacts: J. Barquero H., E. Fernández S., Univ. Nacional, Heredia.
Rabaul (Papua New Guinea) — November 1985 Cite this Report
Rabaul
Papua New Guinea
4.2459°S, 152.1937°E; summit elev. 688 m
All times are local (unless otherwise noted)
Seismicity and deformation continue to decline
"Seismicity and ground deformation rates were in further decline from previous months. The total number of caldera earthquakes in November was 115, of which only one was locatable. On 26 November, no caldera earthquakes were recorded for the first time since 24 May 1983. Ground deformation was minimal."
Geologic Background. The low-lying Rabaul caldera on the tip of the Gazelle Peninsula at the NE end of New Britain forms a broad sheltered harbor utilized by what was the island's largest city prior to a major eruption in 1994. The outer flanks of the asymmetrical shield volcano are formed by thick pyroclastic-flow deposits. The 8 x 14 km caldera is widely breached on the east, where its floor is flooded by Blanche Bay and was formed about 1,400 years ago. An earlier caldera-forming eruption about 7,100 years ago is thought to have originated from Tavui caldera, offshore to the north. Three small stratovolcanoes lie outside the N and NE caldera rims. Post-caldera eruptions built basaltic-to-dacitic pyroclastic cones on the caldera floor near the NE and W caldera walls. Several of these, including Vulcan cone, which was formed during a large eruption in 1878, have produced major explosive activity during historical time. A powerful explosive eruption in 1994 occurred simultaneously from Vulcan and Tavurvur volcanoes and forced the temporary abandonment of Rabaul city.
Information Contacts: B. Talai, RVO.
Raung (Indonesia) — November 1985 Cite this Report
Raung
Indonesia
8.119°S, 114.056°E; summit elev. 3260 m
All times are local (unless otherwise noted)
Many small explosions; light ashfalls
"Raung resumed activity during November with a series of small explosions. The summit crater has not been visited since the start of the latest activity. However, observations begun 1 November from the new Raung observation post about 15 km SE of the summit at 700 m altitude (at Mangaran) indicated that the explosions have been centered along the E side of the large summit crater, near the recently active eruptive vent on the crater floor. At least 44 explosion clouds were observed during November, mostly whitish in color but dark gray ash-laden clouds were also seen. On 15 November, light ashfall was reported from SE flank villages (Bejong, Mangaran, and Seragi) and from Banjuyangi City, 35 km ESE of the volcano. The Mangaran seismometer recorded 52 explosion earthquakes during November. Activity was continuing as of 12 December."
"The last eruption of Raung that produced a lava flow was in 1973. That flow was confined to the summit crater. Explosions similar to the November activity have frequently been reported over the last decade."
Geologic Background. Raung, one of Java's most active volcanoes, is a massive stratovolcano in easternmost Java that was constructed SW of the rim of Ijen caldera. The unvegetated summit is truncated by a dramatic steep-walled, 2-km-wide caldera that has been the site of frequent historical eruptions. A prehistoric collapse of Gunung Gadung on the W flank produced a large debris avalanche that traveled 79 km, reaching nearly to the Indian Ocean. Raung contains several centers constructed along a NE-SW line, with Gunung Suket and Gunung Gadung stratovolcanoes being located to the NE and W, respectively.
Information Contacts: T. Casadevall and L. Pardyanto, VSI; Antara News Service, Jakarta.
Ruapehu (New Zealand) — November 1985 Cite this Report
Ruapehu
New Zealand
39.28°S, 175.57°E; summit elev. 2797 m
All times are local (unless otherwise noted)
Crater lake upwelling; higher temperatures
Park Ranger Paul Dale witnessed a large upwelling and surging of the lake on 31 October at 1342, lasting 30-40 seconds and producing [25 cm] waves on the shore. The lake temperature at 1405 was 26.5°C with an outflow rate of 150 l/s, a significant increase from the 20.0°C temperature and water level 0.1-0.2 m below overflow recorded on 17 October. Fresh ash was not present on the snow. Pilot Bruce Williams, flying just E of the mountain on 11 November at 1100, reported steam accompanying strong upwelling in the lake center. He considered the lake to be in the most agitated state he had observed since witnessing a relatively large eruption 4 years ago; the activity was also observed by a Geyserland Airways pilot.
During a 15 November inspection by NZGS personnel, the lake was gray with scattered yellow sulfur slicks, in contrast to the 17 October observation of dark concentric rings of sulfur. An upwelling of muddy water occurred at 1027, doming to 2 m above the lake surface, and generating steam and 0.5 m waves near the center of the lake. At 1336 water domed to 4-5 m, producing 1 m waves. The waves did not further erode the low-lying snow or generate significant surges in the outlet channel, illustrating the difficulty of detecting evidence for small events. The upwellings observed during the November inspection were smaller than some seen during a period of apparently similar activity in May (10:05). A minor inflationary extension measured on 17-18 October had reversed by 15 November. Tremor and volcanic earthquakes increased in magnitude in October. Seismic records 4-10 November included both low- (~2 Hz) and high-frequency (~5 Hz) tremor of generally low amplitude. Some small B-type events were recorded on 4 November and very shallow earthquakes (L-shocks) were common. During the geologists' 15 November observations, seismometers recorded low-frequency (2 Hz) tremor.
Geologic Background. Ruapehu, one of New Zealand's most active volcanoes, is a complex stratovolcano constructed during at least four cone-building episodes dating back to about 200,000 years ago. The dominantly andesitic 110 km3 volcanic massif is elongated in a NNE-SSW direction and surrounded by another 100 km3 ring plain of volcaniclastic debris, including the NW-flank Murimoto debris-avalanche deposit. A series of subplinian eruptions took place between about 22,600 and 10,000 years ago, but pyroclastic flows have been infrequent. The broad summait area and flank contain at least six vents active during the Holocene. Frequent mild-to-moderate explosive eruptions have been recorded from the Te Wai a-Moe (Crater Lake) vent, and tephra characteristics suggest that the crater lake may have formed as recently as 3,000 years ago. Lahars resulting from phreatic eruptions at the summit crater lake are a hazard to a ski area on the upper flanks and lower river valleys.
Information Contacts: P. Otway, NZGS, Wairakei.
Nevado del Ruiz (Colombia) — November 1985 Cite this Report
Nevado del Ruiz
Colombia
4.892°N, 75.324°W; summit elev. 5279 m
All times are local (unless otherwise noted)
Seismic swarms, latest with inflation; more on 13 November activity and products
Since the 13 November eruption, activity at Ruiz has been limited to emission of a vapor plume and a few seismic swarms, one accompanied by measureable inflation. Work by numerous geologists has yielded new information on the 13 November eruption, its products, and pre-eruption activity.
Pre-13 November activity. The most vigorous seismic energy release at Ruiz occurred in the days preceding the 11 September ash emission. The rate of energy release increased prior to the 13 November eruption, but more gradually than before the 11 September activity. Hypocenters were concentrated N and NE of the summit with best-located events concentrated at depths 0-1 km below sea level (figure 3).
The quoted material below is from a report from Rodolfo Van der Laat, Eduardo Parra, and Heyley Vergara.
"After 11 September, when there was a significant ash emission, activity at Ruiz had decreased notably through 10 November. The activity caused concern in Manizales (30 km NW of Arenas Crater), but the presentation by INGEOMINAS of a preliminary volcanic risk map (figure 4) calmed the population.
"Seismic activity reached a maximum of 60 events per day 19-21 October, declining by 3 November to 3-5 daily locatable events. An increase in temperature of the thermal vent 'La Hedionda' (on the NE flank) may have been related to the increase in seismic activity.
"The height of the plume during this period decreased from about 3 km at the end of September and the beginning of October to about 800 m, with an occasional nucleus of ash 200-300 m high. There were two main fumarolic vents: one yellowish (sulfur), the smaller one gray/coffee-colored (ash derived from mud).
"A tilt network was established, detecting a general deflation 26 October-3 November, with small pulses of inflation of the order of 5-10 µrad per day. At the beginning of November, the first measurement was made of a geodesic net to monitor horizontal deformation by the Instituto Geográfico Agustín Codazzi."
13 November eruption and products. Details of the 13 November eruption sequence remain uncertain and field investigations were still in progress at press time. An initial explosion at 1530 deposited a very thin, fine-grained layer of ash around the summit and NNE of the volcano. The main explosion started at 2108 or 2109 and continued for 20-30 minutes. Five kilometers from the crater, tephra from the main explosion was 7 cm thick and included 30-cm pumice fragments, but the deposit thinned rapidly and was only 1-2 mm thick at Armero with similar amounts at Mariquita and Honda (75 km NE). Preliminary estimates by Haraldur Sigurdsson and Steven Carey place the volume of tephra at roughly 39 x 106 m3. Cloudy weather and lack of nearby wind data on 13 November impeded determination of the height of the Ruiz eruption column. Based on the position of tephra diameter isopleths, Sigurdsson and Carey inferred that the top of the eruption cloud reached [31] km altitude, but emphasized that most of the tephra probably remained in the upper troposphere [Naranjo and others, 1986].
Mudflows that moved E down the valleys of the Lagunillas and Azufrado rivers and inundated Armero were overlain by airfall tephra within 5-10 km of the volcano. However, the mudflow that moved W down the Río Claro valley to Chinchiná contained fresh pumice, and the fluid mudflow that traveled down the Gualí river washed tephra off vegetation, suggesting that both were generated after tephra ejection. The Armero mudflows emerged from both the Lagunillas and Azufrado valleys, which join upstream from the city. The first wave of mud, probably from the Lagunillas, was apparently colder, lighter colored, more water-rich, and formed a more extensive deposit than the second wave, probably from the Azufrado, which was hotter, coarser, and darker-colored. Donald Lowe estimated that outflow from the mouth of the Río Lagunillas reached about 47,500 m3/s. Preliminary calculations by Sigurdsson and Carey yield a volume of about 30-60 x 106 m3 for the deposits of the Armero, and Gualí and Chinchiná valley mudflows, plus about 30-90 x 106 m3 of water, roughly 6-18% of the pre-eruption volume of the summit ice cap. The Lagunillas mudflow probably included water from a lake that had been trapped behind a debris dam in that valley's headwaters for at least several months. Other estimates suggested that about 5% of the summit ice was removed during the 13 November eruption.
Preliminary chemical analyses of a few samples of the 13 November pumice suggest that it is a hypersthene andesite, very similar to an earlier pumice that was probably from Ruiz's last large eruption, in 1595. Little systematic variation was found in different-colored samples that had suggested mixed magma in hand specimen (table 1).
Table 1. Preliminary analyses of bulk compositions of Ruiz pumice (1-4) and glass septa (5-6). Numbers 1, 2, 5, and 6 are from electron microprobe analyses by William Melson and Deborah Reid Jerez; 3 and 4 are X-ray fluorescence analyses by Joseph Taggart.
| Sample |
1 |
2 |
3 |
4 |
5 |
6 |
| SiO2 |
59.31 |
58.69 |
59.50 |
61.50 |
65.36 |
63.97 |
| Al2O3 |
16.83 |
16.81 |
15.70 |
15.20 |
16.01 |
16.33 |
| FeO* |
5.87 |
5.72 |
5.94 |
5.44 |
3.98 |
4.14 |
| MgO |
5.40 |
5.13 |
4.94 |
3.98 |
1.51 |
1.54 |
| CaO |
6.30 |
6.04 |
6.11 |
5.43 |
3.81 |
4.24 |
| K2O |
1.87 |
1.85 |
3.67 |
3.66 |
3.47 |
3.15 |
| Na2O |
3.80 |
3.79 |
2.07 |
2.45 |
4.12 |
4.22 |
| TiO2 |
0.82 |
0.81 |
0.67 |
0.65 |
0.77 |
0.77 |
| P2O5 |
0.30 |
0.28 |
0.19 |
0.19 |
0.30 |
0.29 |
| MnO |
-- |
-- |
0.09 |
0.09 |
-- |
-- |
| Total |
100.50 |
99.12 |
98.90 |
98.60 |
99.33 |
98.65 |
Notes: |
| Samples 1 and 5: 13 November 1985 pumice collected by Stanley Williams. USNM116158. |
| Samples 2 and 6: Probable 1595 pumice collected by Stanley Williams. USNM116159. |
Post-13 November activity. No significant eruptive activity occurred in the succeeding weeks. The vapor column varied in height from 200-300 m to 1-1.4 km. Rates of SO2 emission measured by COSPEC were 200 t/d on 18 November, 50 t/d on the 19th, and several thousand tons per day on 22 November. Possible new fissures have been observed near the summit along with possible development of a depression SW of the summit. However, the fissures may have been pre-existing features exposed by clearer weather and seasonal snowmelt. Slight advances of some of the summit glaciers have been noted, but no large-scale ice movements were apparent and there was no evidence of significant melting from below.
Six telemetering seismometers have been installed, ringing the summit at elevations of 4,000-4,500 m, supplementing the four-station seismic net that was in place before 13 November. Telemetering tiltmeters were emplaced at 4,200 m elevation on the NW flank, 4,600 m elevation on the NNW flank, and on the NE flank, and 8-10 EDM lines have been established, in addition to the dry-tilt network installed on the N flank in October.
Seismic energy release was at relatively low levels shortly after the 13 November eruption, but the slope of the energy release curve steepened in the succeeding weeks. Earthquake swarms that were small but of increasing energy occurred 19-20 and 27 November, and 6-7 December. Maximum magnitudes were 2.5-3 in the November swarms; the 6-7 December activity included two magnitude 3-3.5 shocks. Locations were available for only a few events, which were centered along a generally N-S trend, usually somewhat N of the crater. The swarms were not accompanied by measurable tilt episodes or obvious changes to the plume. The rate of seismic energy release doubled during the first day of a stronger swarm 12-13 December and Civil Defense personnel were put on alert. The same day, the NW flank tiltmeter recorded a 5 µrad tilt event, the first change recorded in the weeks since it was installed, and a NW flank EDM line shortened 14 cm between measurements 11 and 13 December. However, seismicity declined 13 December, and the seismic energy release curve was nearly flat 14-17 December.
Geologic Background. Nevado del Ruiz is a broad, glacier-covered volcano in central Colombia that covers more than 200 km2. Three major edifices, composed of andesitic and dacitic lavas and andesitic pyroclastics, have been constructed since the beginning of the Pleistocene. The modern cone consists of a broad cluster of lava domes built within the caldera of an older edifice. The 1-km-wide, 240-m-deep Arenas crater occupies the summit. The prominent La Olleta pyroclastic cone located on the SW flank may also have been active in historical time. Steep headwalls of massive landslides cut the flanks. Melting of its summit icecap during historical eruptions, which date back to the 16th century, has resulted in devastating lahars, including one in 1985 that was South America's deadliest eruption.
Information Contacts: P. Medina, Comité de Estudios Vulcanológicos, Manizales; A. López R., INGEOMINAS, Bogotá; R. Van der Laat, Univ. Nacional, Heredia; E. Parra, INGEOMINAS, Medellín; H. Vergara, INGEOMINAS, Tolima; H. Sigurdsson and S. Carey, Univ. of Rhode Island; S. Williams and D. Lowe, Louisiana State Univ.; A. Londoño C., Univ. Nacional, Manizales; Néstor Garcia P., Industria Licorera de Caldas, Manizales; R. Stoiber and B. Gemmell, Dartmouth College; D. Harlow, USGS, Menlo Park, CA; C. Hearn, D. Klick, D. Herd, and R. Tilling, USGS, Reston, VA; J. Taggart, Jr., USGS, Denver, CO; W. Melson and D. Jerez, SI; P. Clemente-Colón, NOAA/NESDIS.
Sangeang Api (Indonesia) — November 1985 Cite this Report
Sangeang Api
Indonesia
8.2°S, 119.07°E; summit elev. 1912 m
All times are local (unless otherwise noted)
Strombolian explosions; lava flow in growing channel; pyroclastic flow deposit
"Sangeang Api continued to erupt with 10-30 Strombolian explosions/day in November and the first week in December. The 1985 lava channel had not lengthened from the 4.7 km observed in late September. However, the volume of the main channel has grown because of a considerable increase in height during the past 2 months. A slow-moving lava flow in the central channel is located atop the main feeder tube. Periodic overflows of this channel add both fluid lava and rubble to the outer flanks of this tube. On 5 December, four separate overflows of fluid lava and rock rubble were observed rolling down the sides of the central channel.
"A brief visit was made to the central crater on 4 December during a period of quiet. The active vent was a large cinder cone in Doro Api Crater. This central cone, which previously rose about 40 m from the floor of Doro Api, was estimated to be approximately 180-200 m above the floor during the 4 December visit. Thundering detonations were heard almost continuously during the 15 minutes spent in the crater and 1 mild Strombolian explosion hurled incandescent blocks. At night, a continuous reddish glow at the bottom of the gas plume over the crater suggested that a small lava lake may exist within Doro Api or the central cone. Fountaining of fluid lava, sheets, or ribbons was observed to accompany some of the larger Strombolian explosions at night.
"We also confirmed the existence of a small-volume pyroclastic flow that was probably produced during the initial activity of 30 July. Local residents reported that the activity caused a number of small fires in the vicinity of Doro Montoy crater (just N of Doro Api) and the Sori Mbere drainage on the S flank of the volcano. A small block and ash flow, still hot to the touch, was found in the Sori Mbere drainage in December. Lahars generated by heavy rainfall and unconsolidated material on the upper slopes of the volcano have been common during and immediately after previous episodes. Outcrops along the shoreline indicate that a number of lahars and possibly also pyroclastic flows have entered the sea. Small mudflows were produced by heavy rains on 2 December. One traveled down the Sori Mbere drainage while a second mudflow entered the sea at Oi Nono Jara on the S side of Sangeang Island.
"This pattern of activity conforms to that of previous 20th century eruptions of Sangeang Api. The 1911 activity included numerous explosions and a lava flow from the summit crater that moved more than 6 km down the W flank. The activity that began in March 1953 produced a lava flow and intermittent explosions through 1954. The 1964 eruption began on 29 January with strong explosions from the 1954 crater, and a lava flow first observed on 3-4 February moved N and E to about 750 m elevation. Explosions and outflow of lava continued for at least several months and possibly until the end of 1965."
Geologic Background. Sangeang Api volcano, one of the most active in the Lesser Sunda Islands, forms a small 13-km-wide island off the NE coast of Sumbawa Island. Two large trachybasaltic-to-tranchyandesitic volcanic cones, Doro Api and Doro Mantoi, were constructed in the center and on the eastern rim, respectively, of an older, largely obscured caldera. Flank vents occur on the south side of Doro Mantoi and near the northern coast. Intermittent eruptions have been recorded since 1512, most of them during in the 20th century.
Information Contacts: T. Casadevall and L. Pardyanto, VSI.
St. Helens (United States) — November 1985 Cite this Report
St. Helens
United States
46.2°N, 122.18°W; summit elev. 2549 m
All times are local (unless otherwise noted)
New lahar warning gauge; background activity
Mt. St. Helens was quiet through November and early December, with seismic activity, SO2 emission, and displacement rates remaining at background levels. Displacement rates on the dome were less than 1 mm/day; SO2 levels continued to be low and quite variable.
The USGS's Water Resources Division has installed a new gauge along the crater's main drainage channel to improve warnings of mudflows and snow avalanches. The new gauge, just N of the crater (in Loowit Channel at The Steps), and an existing one 25 km downstream in the North Fork Toutle River (at Elk Rock) transmit to CVO via satellite every 5 minutes. These stations, in addition to seismometers and other gauges downstream, should provide an early warning of rapidly rising water levels (figure 29).
Much of the network was installed prior to November 1982 to monitor levels of the lakes created when the 18 May 1980 avalanche blocked the outflow from Spirit Lake and downstream tributaries to the North Fork Toutle River. Major flooding could occur if one of the debris dams failed, and seismometers were installed in 1983 to supplement the gauges. A characteristic signature is produced by lahars flowing from the crater in a confined channel, as in May and June 1984. Although exact times and discharge volumes could not be determined from the seismic records for those events, future refinements may provide a relationship between seismic signals and discharge volumes (Brantley and others, 1985).
References. Brantley, S., Power, J., and Topinka, L., 1985, Reports from the U.S. Geological Survey's Cascades Volcano Observatory at Vancouver, Washington; Earthquake Information Bulletin, v. 17, no. 1, p. 20-32.
Childers, D. and Carpenter, P.J., 1985, International Symposium on Erosion, Debris Flow, and Disaster Prevention; September 3-5, Tsukuba, Japan.
Geologic Background. Prior to 1980, Mount St. Helens was a conical volcano sometimes known as the Fujisan of America. During the 1980 eruption the upper 400 m of the summit was removed by slope failure, leaving a 2 x 3.5 km breached crater now partially filled by a lava dome. There have been nine major eruptive periods beginning about 40-50,000 years ago, and it has been the most active volcano in the Cascade Range during the Holocene. Prior to 2,200 years ago, tephra, lava domes, and pyroclastic flows were erupted, forming the older edifice, but few lava flows extended beyond the base of the volcano. The modern edifice consists of basaltic as well as andesitic and dacitic products from summit and flank vents. Eruptions in the 19th century originated from the Goat Rocks area on the N flank, and were witnessed by early settlers.
Information Contacts: G. Gallino, S. Brantley, E. Iwatsubo, USGS CVO, Vancouver, WA; C. Jonientz-Trisler, University of Washington.
Tangkuban Parahu (Indonesia) — November 1985 Cite this Report
Tangkuban Parahu
Indonesia
6.77°S, 107.6°E; summit elev. 2084 m
All times are local (unless otherwise noted)
Crater temperatures rise; seismicity unchanged
Temperatures in Kawah Baru, a small vent on the W side of the summit crater, active during the 1896 eruption, rose steadily from 90 to 140°C in the two weeks prior to 9 December. No changes have been detected in the volcano's continuing low-level background seismicity.
Geologic Background. Gunung Tangkuban Parahu is a broad stratovolcano overlooking Indonesia's former capital city of Bandung. The volcano was constructed within the 6 x 8 km Pleistocene Sunda caldera, which formed about 190,000 years ago. The volcano's low profile is the subject of legends referring to the mountain of the "upturned boat." The Sunda caldera rim forms a prominent ridge on the western side; elsewhere the rim is largely buried by deposits of the current volcano. The dominantly small phreatic eruptions recorded since the 19th century have originated from several nested craters within an elliptical 1 x 1.5 km summit depression.
Information Contacts: T. Casadevall and L. Pardyanto, VSI.
Tangkuban Parahu (Indonesia) — November 1985
Tangkuban Parahu
Indonesia
6.77°S, 107.6°E; summit elev. 2084 m
All times are local (unless otherwise noted)
Minor steam explosions
[Minor steam explosions were reported from Kawah Baru crater on 15 November 1985. The explosions were described as essentially phreatic, producing a 200-m-high eruption cloud. There was no mention of tephra ejection. After this event, temperatures in the Kawah Baru solfatara field increased from 95 to 168°C].
Geologic Background. Gunung Tangkuban Parahu is a broad stratovolcano overlooking Indonesia's former capital city of Bandung. The volcano was constructed within the 6 x 8 km Pleistocene Sunda caldera, which formed about 190,000 years ago. The volcano's low profile is the subject of legends referring to the mountain of the "upturned boat." The Sunda caldera rim forms a prominent ridge on the western side; elsewhere the rim is largely buried by deposits of the current volcano. The dominantly small phreatic eruptions recorded since the 19th century have originated from several nested craters within an elliptical 1 x 1.5 km summit depression.
Information Contacts: A. Sudradjat, Kaswanda, and Tulus, VSI (as reported in BVE, no. 25, March 1988).
Telica (Nicaragua) — November 1985 Cite this Report
Telica
Nicaragua
12.606°N, 86.84°W; summit elev. 1036 m
All times are local (unless otherwise noted)
Continued normal activity and strong seismicity
Although normal activity continued, Telica continued to show stronger seismic activity than other Nicaraguan volcanoes. A seismograph registered 24 low-frequency microearthquakes in a 5-hour period on 9 July.
Geologic Background. Telica, one of Nicaragua's most active volcanoes, has erupted frequently since the beginning of the Spanish era. This volcano group consists of several interlocking cones and vents with a general NW alignment. Sixteenth-century eruptions were reported at symmetrical Santa Clara volcano at the SW end of the group. However, its eroded and breached crater has been covered by forests throughout historical time, and these eruptions may have originated from Telica, whose upper slopes in contrast are unvegetated. The steep-sided cone of Telica is truncated by a 700-m-wide double crater; the southern crater, the source of recent eruptions, is 120 m deep. El Liston, immediately E, has several nested craters. The fumaroles and boiling mudpots of Hervideros de San Jacinto, SE of Telica, form a prominent geothermal area frequented by tourists, and geothermal exploration has occurred nearby.
Information Contacts: D. Fajardo B., INETER.
Ulawun (Papua New Guinea) — November 1985 Cite this Report
Ulawun
Papua New Guinea
5.05°S, 151.33°E; summit elev. 2334 m
All times are local (unless otherwise noted)
Increasing seismicity then tephra ejection & lava flow
"A brief, spectacular Strombolian eruption took place 17-22 November, developing rapidly after about five days of precursory seismicity.
"Seismic activity began to increase on 12 November with the occasional appearance of small discrete B-type volcanic earthquakes. These increased in size and number over the following three days, resulting in an official notification on the 15th of an increased risk of an eruption. Seismic activity continued to increase over the following two days with the appearance of low-amplitude continuous harmonic tremor on 17 November at 1600.
"At 2000, notification was received by radio from Ulamona Catholic Mission (figure 1) of a summit Strombolian eruption in progress, with ejections of incandescent lava fragments to heights of 300-500 m above the crater every few seconds. The eruption was reported to have begun at about 1830, following, or in association with, a rapid increase in the amplitude of the harmonic tremor.
"The intensity of the eruption increased with the emission of two large, dark clouds of ash at about 2045 before settling down to a more steady pattern of Strombolian explosions every few seconds, accompanied by a fairly constant level of strong continuous harmonic tremor.
"Volcanologists carried out an aerial inspection at about 0700 the next day and observed regular Strombolian ejections of incandescent lava every few seconds to heights of about 200 m above the summit crater. A small cone was being constructed in the summit crater, but some ejecta were falling outside the crater rim. Small debris slides were occurring intermittently around the N side of the crater. The eruption column at that time was about 2 km high and was lightly laden with ash. The eruption plume was about 10 km long and trended approximately S. During the day the rate of ash production increased, resulting in a dense pall of ash on the E side of the volcano.
"A lava flow started to descend the N slope in the early evening of the 18th. This flow originated from a fissure about 70 m below the summit crater, and although it moved rapidly at first on the steep upper slopes of the volcano (it may have advanced about 3 km downslope in the first few hours), its progress became very slow when it reached the volcano's gentler middle slopes.
"Spectacular `fire-fountaining' at the summit crater was observed beginning the night of the 18th. The sub-continuous showering of explosion debris around the crater built up an apron of highly unstable material. Intermittent slides of this material, mainly into the NW valley, produced impressive ash clouds rising from the volcano's slopes. The first of these moderate-sized avalanches was observed moving down the N flank at about 0715 on the 19th. Several more slides occurred later the same day. Throughout the 20th, debris slides were common on the N flank and NW valley. Most advanced less than 4 km from the crater, but a few traveled about 5 km downslope.
"By early morning of the 19th the lava flow had bifurcated, with the E lobe slightly longer. Progress of the flow was slow on the 19th and 20th. At 1400 on the 20th, the nose of the E lobe was about 4 km from the summit, and was about 100 m longer than the W lobe. Their widths were 20-40 m.
"The eruption column was very impressive on the morning of the 20th. Dark grey and convoluted at its base, it paled upward, rising to an altitude of 7-8 km, and was crowned by an elliptical pale grey vapour and ash plume extending W. Most of the ash fallout was controlled by the low-level wind system (below 4 km altitude) blowing from the NW.
"The intensity and mode of activity remained unchanged on the 21st, but seismicity began increasing during the early hours of the 22nd. After reaching a peak at about 0800 on the 22nd, seismicity suddenly declined and within 2 hours, the eruption ended.
"When the eruption stopped, the most distal part of the lava flow was about 5.5 km from the crater. Samples collected from the flow are coarsely porphyritic with conspicuous plagioclase phenocrysts. The lava has a similar appearance to previous Ulawun lavas, which are quartz tholeiites.
"During the eruption, on the 18th and 20th, measurements were made at a number of dry tilt arrays around Ulawun. The readings on these days showed that little or no tilting was occurring. Unfortunately, no base line measurements are available to check whether deformation had occurred prior to the eruption."
Geologic Background. The symmetrical basaltic-to-andesitic Ulawun stratovolcano is the highest volcano of the Bismarck arc, and one of Papua New Guinea's most frequently active. The volcano, also known as the Father, rises above the N coast of the island of New Britain across a low saddle NE of Bamus volcano, the South Son. The upper 1,000 m is unvegetated. A prominent E-W escarpment on the south may be the result of large-scale slumping. Satellitic cones occupy the NW and E flanks. A steep-walled valley cuts the NW side, and a flank lava-flow complex lies to the south of this valley. Historical eruptions date back to the beginning of the 18th century. Twentieth-century eruptions were mildly explosive until 1967, but after 1970 several larger eruptions produced lava flows and basaltic pyroclastic flows, greatly modifying the summit crater.
Information Contacts: C. McKee and P. Lowenstein, RVO.
Villarrica (Chile) — November 1985 Cite this Report
Villarrica
Chile
39.42°S, 71.93°W; summit elev. 2847 m
All times are local (unless otherwise noted)
Small lava fountains and ash; increased seismicity
The following is a report from Gustavo Fuentealba Cifuentes.
"When the last eruptive cycle of Villarrica Volcano (30 October-26 February) began to decay in January 1985, seismic activity also decreased. Between January and June 1985, the seismograph located on the N flank of the volcano recorded a monthly average of 15 volcanic earthquakes (Minakami's B-type). In February, only five seismic events were recorded with very little harmonic tremor. However, since June 1985 volcano-seismic activity has increased significantly. At the same time, notable harmonic tremor was observed. Figure 2 shows monthly seismic activity between January and November 1985. This situation was continuing as of 25 November, with a small gap in mid-late November. On 19 November at 0700, harmonic tremor stopped abruptly, and only apparently very shallow seismic activity was recorded. On 21 November at 1000, harmonic tremor activity resumed.
"According to personal observations and reports from Pucón, a town at the N foot of the volcano, an increase in fumarolic activity and lava fountaining with weak explosions and very small ash emissions have been registered since April. A red glow has been seen at night since late September."
Further References. Acevedo, P., and Fuentealba, G., 1987, Antecedentes de la actividad microsísmica del volcán Villarrica relacionada con la erupción de Octubre de 1984: Boletín de Vulcanología (Universidad Nacional, Heredia, Costa Rica), no. 18, p. 13-17.
Moreno, H., Fuentealba, G., and Riffo, P. (in press), The 1984-1985 eruption of Villarrica, southern Andes of Chile (39°21'S): Basaltic Lava Flows Furrowed the Ice Cap.
Geologic Background. The glacier-covered Villarrica stratovolcano, in the northern Lakes District of central Chile, is ~15 km south of the city of Pucon. A 2-km-wide caldera that formed about 3,500 years ago is located at the base of the presently active, dominantly basaltic to basaltic andesite cone at the NW margin of a 6-km-wide Pleistocene caldera. More than 30 scoria cones and fissure vents are present on the flanks. Plinian eruptions and pyroclastic flows that have extended up to 20 km from the volcano were produced during the Holocene. Lava flows up to 18 km long have issued from summit and flank vents. Eruptions documented since 1558 CE have consisted largely of mild-to-moderate explosive activity with occasional lava effusion. Glaciers cover 40 km2 of the volcano, and lahars have damaged towns on its flanks.
Information Contacts: G. Fuentealba C., P. Riffo A., and P. Acevedo, Univ. de La Frontera, Temuco; H. Moreno R., Univ. de Chile, Santiago.
Whakaari/White Island (New Zealand) — November 1985 Cite this Report
Whakaari/White Island
New Zealand
37.52°S, 177.18°E; summit elev. 294 m
All times are local (unless otherwise noted)
Fumarole temperatures drop; magnetic anomaly
When geologists visited White Island on 13 November, there was no evidence that any eruptive activity had occurred since their visit on 21 May. Deflation of the Donald Mound area, roughly 100 m E of the 1978 Crater, continued. The area of subsidence was a NW-SE ellipsoid about 400 m long by 250 m wide, centered on Donald Mound. One station had dropped 112 mm since a small ash eruption in February 1984; stations immediately W of the area, which had dropped 15-25 mm May 1984-May 1985, had fully recovered by the November visit.
Magnetic data showed a small but high-amplitude anomaly centered N of Donald Mound, suggesting to geologists that substantial near-surface cooling had occurred in the area since the May magnetic survey. At one vent, fumarole temperatures had declined to 390°C from 523° in May. No low-frequency (B-type) events were recorded from February until late September, when they resumed following a M 7 event, 350-400 km NE of White Island. Since 25 October, 6-35 low-frequency events have occurred per day, with unusually large amplitudes (up to 50 mm peak to peak). The number of high-frequency (volcano-tectonic) earthquakes remained relatively constant in 1985, with 3-5 recorded on most days.
Geologic Background. The uninhabited Whakaari/White Island is the 2 x 2.4 km emergent summit of a 16 x 18 km submarine volcano in the Bay of Plenty about 50 km offshore of North Island. The island consists of two overlapping andesitic-to-dacitic stratovolcanoes. The SE side of the crater is open at sea level, with the recent activity centered about 1 km from the shore close to the rear crater wall. Volckner Rocks, sea stacks that are remnants of a lava dome, lie 5 km NW. Descriptions of volcanism since 1826 have included intermittent moderate phreatic, phreatomagmatic, and Strombolian eruptions; activity there also forms a prominent part of Maori legends. The formation of many new vents during the 19th and 20th centuries caused rapid changes in crater floor topography. Collapse of the crater wall in 1914 produced a debris avalanche that buried buildings and workers at a sulfur-mining project. Explosive activity in December 2019 took place while tourists were present, resulting in many fatalities. The official government name Whakaari/White Island is a combination of the full Maori name of Te Puia o Whakaari ("The Dramatic Volcano") and White Island (referencing the constant steam plume) given by Captain James Cook in 1769.
Information Contacts: I. Nairn, A. Cody, B. Scott, C. Wood, and W. Davis, NZGS, Rotorua; P. Otway, NZGS, Wairakei; D. Christoffel and E. Hardy, Victoria Univ. Wellington; W. Giggenbach, DSIR, Wellington.