Recently Published Bulletin Reports
Erebus (Antarctica) Lava lake remains active; most thermal alerts recorded since 2019
Rincon de la Vieja (Costa Rica) Frequent phreatic explosions during July-December 2023
Bezymianny (Russia) Explosion on 18 October 2023 sends ash plume 8 km high; lava flows and incandescent avalanches
Kilauea (United States) Low-level lava effusions in the lava lake at Halema’uma’u during July-December 2022
Nyamulagira (DR Congo) Lava flows and thermal activity during May-October 2023
Bagana (Papua New Guinea) Explosions, ash plumes, ashfall, and lava flows during April-September 2023
Mayon (Philippines) Lava flows, pyroclastic flows, ash emissions, and seismicity during April-September 2023
Nishinoshima (Japan) Eruption plumes and gas-and-steam plumes during May-August 2023
Krakatau (Indonesia) White gas-and-steam plumes and occasional ash plumes during May-August 2023
Villarrica (Chile) Strombolian activity, gas-and-ash emissions, and crater incandescence during April-September 2023
Merapi (Indonesia) Frequent incandescent avalanches during April-September 2023
Ebeko (Russia) Moderate explosive activity with ash plumes continued during June-November 2023
Erebus (Antarctica) — January 2024  Cite this Report
Erebus
Antarctica
77.53°S, 167.17°E; summit elev. 3794 m
All times are local (unless otherwise noted)
Lava lake remains active; most thermal alerts recorded since 2019
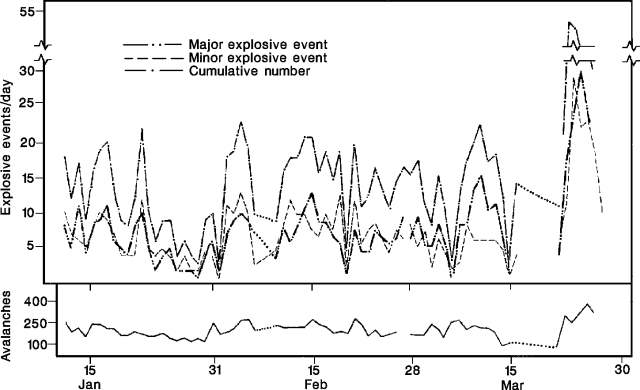
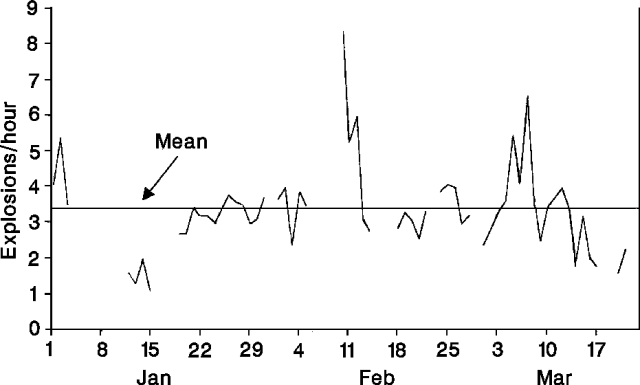
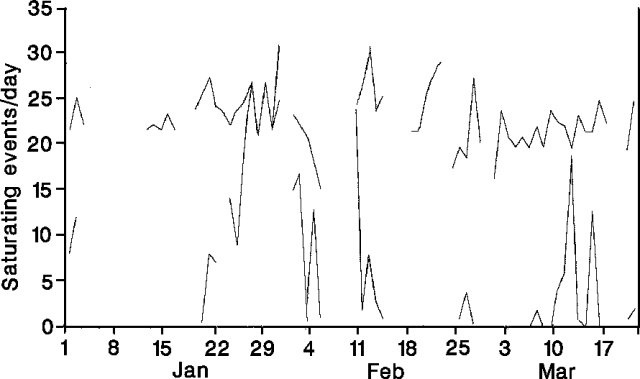
The lava lake in the summit crater of Erebus has been active since at least 1972. Located in Antarctica overlooking the McMurdo Station on Ross Island, it is the southernmost active volcano on the planet. Because of the remote location, activity is primarily monitored by satellites. This report covers activity during 2023.
The number of thermal alerts recorded by the Hawai'i Institute of Geophysics and Planetology’s MODVOLC Thermal Alerts System increased considerably in 2023 compared to the years 2020-2022 (table 9). In contrast to previous years, the MODIS instruments aboard the Aqua and Terra satellites captured data from Erebus every month during 2023. Consistent with previous years, the lowest number of anomalous pixels were recorded in January, November, and December.
Table 9. Number of monthly MODIS-MODVOLC thermal alert pixels recorded at Erebus during 2017-2023. See BGVN 42:06 for data from 2000 through 2016. The table was compiled using data provided by the HIGP – MODVOLC Thermal Alerts System.
| Year |
Jan |
Feb |
Mar |
Apr |
May |
Jun |
Jul |
Aug |
Sep |
Oct |
Nov |
Dec |
SUM |
| 2017 |
0 |
21 |
9 |
0 |
0 |
1 |
11 |
61 |
76 |
52 |
0 |
3 |
234 |
| 2018 |
0 |
21 |
58 |
182 |
55 |
17 |
137 |
172 |
103 |
29 |
0 |
0 |
774 |
| 2019 |
2 |
21 |
162 |
151 |
55 |
56 |
75 |
53 |
29 |
19 |
1 |
0 |
624 |
| 2020 |
0 |
2 |
16 |
18 |
4 |
4 |
1 |
3 |
18 |
3 |
1 |
6 |
76 |
| 2021 |
0 |
9 |
1 |
0 |
2 |
56 |
46 |
47 |
35 |
52 |
5 |
3 |
256 |
| 2022 |
1 |
13 |
55 |
22 |
15 |
32 |
39 |
19 |
31 |
11 |
0 |
0 |
238 |
| 2023 |
2 |
33 |
49 |
82 |
41 |
32 |
70 |
64 |
42 |
17 |
5 |
11 |
448 |
Sentinel-2 infrared images showed one or two prominent heat sources within the summit crater, accompanied by adjacent smaller sources, similar to recent years (see BGVN 46:01, 47:02, and 48:01). A unique image was obtained on 25 November 2023 by the OLI-2 (Operational Land Imager-2) on Landsat 9, showing the upper part of the volcano surrounded by clouds (figure 32).
Geologic Background. Mount Erebus, the world's southernmost historically active volcano, overlooks the McMurdo research station on Ross Island. It is the largest of three major volcanoes forming the crudely triangular Ross Island. The summit of the dominantly phonolitic volcano has been modified by one or two generations of caldera formation. A summit plateau at about 3,200 m elevation marks the rim of the youngest caldera, which formed during the late-Pleistocene and within which the modern cone was constructed. An elliptical 500 x 600 m wide, 110-m-deep crater truncates the summit and contains an active lava lake within a 250-m-wide, 100-m-deep inner crater; other lava lakes are sometimes present. The glacier-covered volcano was erupting when first sighted by Captain James Ross in 1841. Continuous lava-lake activity with minor explosions, punctuated by occasional larger Strombolian explosions that eject bombs onto the crater rim, has been documented since 1972, but has probably been occurring for much of the volcano's recent history.
Information Contacts: Hawai'i Institute of Geophysics and Planetology (HIGP) - MODVOLC Thermal Alerts System, School of Ocean and Earth Science and Technology (SOEST), Univ. of Hawai'i, 2525 Correa Road, Honolulu, HI 96822, USA (URL: http://modis.higp.hawaii.edu/); Copernicus Browser, Copernicus Data Space Ecosystem, European Space Agency (URL: https://dataspace.copernicus.eu/browser/); NASA Earth Observatory, EOS Project Science Office, NASA Goddard Space Flight Center, Goddard, Maryland, USA (URL: https://earthobservatory.nasa.gov/images/152134/erebus-breaks-through).
Rincon de la Vieja (Costa Rica) — January 2024 Cite this Report
Rincon de la Vieja
Costa Rica
10.83°N, 85.324°W; summit elev. 1916 m
All times are local (unless otherwise noted)
Frequent phreatic explosions during July-December 2023
Rincón de la Vieja is a volcanic complex in Costa Rica with a hot convecting acid lake that exhibits frequent weak phreatic explosions, gas-and-steam emissions, and occasional elevated sulfur dioxide levels (BGVN 45:10, 46:03, 46:11). The current eruption period began June 2021. This report covers activity during July-December 2023 and is based on weekly bulletins and occasional daily reports from the Observatorio Vulcanologico Sismologica de Costa Rica-Universidad Nacional (OVSICORI-UNA).
Numerous weak phreatic explosions continued during July-December 2023, along with gas-and-steam emissions and plumes that rose as high as 3 km above the crater rim. Many weekly OVSICORI-UNA bulletins included the previous week's number of explosions and emissions (table 9). For many explosions, the time of explosion was given (table 10). Frequent seismic activity (long-period earthquakes, volcano-tectonic earthquakes, and tremor) accompanied the phreatic activity.
Table 9. Number of reported weekly phreatic explosions and gas-and-steam emissions at Rincón de la Vieja, July-December 2023. Counts are reported for the week before the Weekly Bulletin date; not all reports included these data. Courtesy of OVSICORI-UNA.
| OVSICORI Weekly Bulletin |
Number of explosions |
Number of emissions |
| 28 Jul 2023 |
6 |
14 |
| 4 Aug 2023 |
10 |
12 |
| 1 Sep 2023 |
13 |
11 |
| 22 Sep 2023 |
12 |
13 |
| 29 Sep 2023 |
6 |
11 |
| 6 Oct 2023 |
12 |
5 |
| 13 Oct 2023 |
7 |
9 |
| 20 Oct 2023 |
1 |
15 |
| 27 Oct 2023 |
3 |
23 |
| 3 Nov 2023 |
3 |
10 |
| 17 Nov 2023 |
0 |
Some |
| 24 Nov 2023 |
0 |
14 |
| 8 Dec 2023 |
4 |
16 |
| 22 Dec 2023 |
8 |
18 |
Table 10. Summary of activity at Rincón de la Vieja during July-December 2023. Weak phreatic explosions and gas emissions are noted where the time of explosion was indicated in the weekly or daily bulletins. Height of plumes or emissions are distance above the crater rim. Courtesy of OVSICORI-UNA.
| Date |
Time |
Description of Activity |
| 1 Jul 2023 |
0156 |
Explosion. |
| 2 Jul 2023 |
0305 |
Explosion. |
| 4 Jul 2023 |
0229, 0635 |
Event at 0635 produced a gas-and-steam plume that rose 700 m and drifted W; seen by residents in Liberia (21 km SW). |
| 9 Jul 2023 |
1843 |
Explosion. |
| 21 Jul 2023 |
0705 |
Explosion. |
| 26 Jul 2023 |
1807 |
Explosion. |
| 28 Jul 2023 |
0802 |
Explosion generated a gas-and-steam plume that rose 500 m. |
| 30 Jul 2023 |
1250 |
Explosion. |
| 31 Jul 2023 |
2136 |
Explosion. |
| 11 Aug 2023 |
0828 |
Explosion. |
| 18 Aug 2023 |
1304 |
Explosion. |
| 21 Aug 2023 |
1224 |
Explosion generated gas-and-steam plumes rose 500-600 m. |
| 22 Aug 2023 |
0749 |
Explosion generated gas-and-steam plumes rose 500-600 m. |
| 24 Aug 2023 |
1900 |
Explosion. |
| 25 Aug 2023 |
0828 |
Event produced a steam-and-gas plume that rose 3 km and drifted NW. |
| 27-28 Aug 2023 |
0813 |
Four small events; the event at 0813 on 28 August lasted two minutes and generated a steam-and-gas plume that rose 2.5 km. |
| 1 Sep 2023 |
1526 |
Explosion generated plume that rose 2 km and ejected material onto the flanks. |
| 2-3 Sep 2023 |
- |
Small explosions detected in infrasound data. |
| 4 Sep 2023 |
1251 |
Gas-and-steam plume rose 1 km and drifted W. |
| 7 Nov 2023 |
1113 |
Explosion. |
| 8 Nov 2023 |
0722 |
Explosion. |
| 12 Nov 2023 |
0136 |
Small gas emissions. |
| 14 Nov 2023 |
0415 |
Small gas emissions. |
According to OVSICORI-UNA, during July-October the average weekly sulfur dioxide (SO2) flux ranged from 68 to 240 tonnes/day. However, in mid-November the flux increased to as high as 334 tonnes/day, the highest value measured in recent years. The high SO2 flux in mid-November was also detected by the TROPOMI instrument on the Sentinel-5P satellite (figure 43).
Geologic Background. Rincón de la Vieja, the largest volcano in NW Costa Rica, is a remote volcanic complex in the Guanacaste Range. The volcano consists of an elongated, arcuate NW-SE-trending ridge constructed within the 15-km-wide early Pleistocene Guachipelín caldera, whose rim is exposed on the south side. Sometimes known as the "Colossus of Guanacaste," it has an estimated volume of 130 km3 and contains at least nine major eruptive centers. Activity has migrated to the SE, where the youngest-looking craters are located. The twin cone of Santa María volcano, the highest peak of the complex, is located at the eastern end of a smaller, 5-km-wide caldera and has a 500-m-wide crater. A Plinian eruption producing the 0.25 km3 Río Blanca tephra about 3,500 years ago was the last major magmatic eruption. All subsequent eruptions, including numerous historical eruptions possibly dating back to the 16th century, have been from the prominent active crater containing a 500-m-wide acid lake located ENE of Von Seebach crater.
Information Contacts: Observatorio Vulcanológico Sismológica de Costa Rica-Universidad Nacional (OVSICORI-UNA), Apartado 86-3000, Heredia, Costa Rica (URL: http://www.ovsicori.una.ac.cr/); NASA Global Sulfur Dioxide Monitoring Page, Atmospheric Chemistry and Dynamics Laboratory, NASA Goddard Space Flight Center (NASA/GSFC), 8800 Greenbelt Road, Goddard MD 20771, USA (URL: https://so2.gsfc.nasa.gov/).
Bezymianny (Russia) — November 2023 Cite this Report
Bezymianny
Russia
55.972°N, 160.595°E; summit elev. 2882 m
All times are local (unless otherwise noted)
Explosion on 18 October 2023 sends ash plume 8 km high; lava flows and incandescent avalanches
Bezymianny, located on Russia’s Kamchatka Peninsula, has had eruptions since 1955 characterized by dome growth, explosions, pyroclastic flows, ash plumes, and ashfall. Activity during November 2022-April 2023 included gas-and-steam emissions, lava dome collapses generating avalanches, and persistent thermal activity. Similar eruptive activity continued from May through October 2023, described here based on information from weekly and daily reports of the Kamchatka Volcano Eruptions Response Team (KVERT), notices from Tokyo VAAC (Volcanic Ash Advisory Center), and from satellite data.
Overall activity decreased after the strong period of activity in late March through April 2023, which included ash explosions during 29 March and 7-8 April 2023 that sent plumes as high as 10-12 km altitude, along with dome growth and lava flows (BGVN 48:05). This reduced activity can be seen in the MIROVA thermal detection system graph (figure 56), which was consistent with data from the MODVOLC thermal detection system and with Sentinel-2 satellite images that showed persistent hotspots in the summit crater when conditions allowed observations. A renewed period of strong activity began in mid-October 2023.
Activity increased significantly on 17 October 2023 when large collapses began during 0700-0830 on the E flanks of the lava dome and continued to after 0930 the next day (figure 57). Ash plumes rose to an altitude of 4.5-5 km, extending 220 km NNE by 18 October. A large explosion at 1630 on 18 October produced an ash plume that rose to an altitude of 11 km (8 km above the summit) and drifted NNE and then NW, extending 900 km NW within two days at an altitude of 8 km. Minor ashfall was noted in Kozyrevsk (45 km WNW). At 0820 on 20 October an ash plume was identified in satellite images drifting 100 km ENE at altitudes of 4-4.5 km.
Lava flows and hot avalanches from the dome down the SE flank continued over the next few days, including 23 October when clear conditions allowed good observations (figures 58 and 59). A large thermal anomaly was observed over the volcano through 24 October, and in the summit crater on 30 October (figure 60). Strong fumarolic activity continued, with numerous avalanches and occasional incandescence. By the last week of October, volcanic activity had decreased to a level consistent with that earlier in the reporting period.
Aviation warnings were frequently updated during 17-20 October. KVERT issued a Volcano Observatory Notice for Aviation (VONA) on 17 October at 1419 and 1727 (0219 and 0527 UTC) raising the Aviation Color Code (ACC) from Yellow to Orange (second highest level). The next day, KVERT issued a VONA at 1705 (0505 UTC) raising the ACC to Red (highest level) but lowered it back to Orange at 2117 (0917 UTC). After another decrease to Yellow and back to Orange, the ACC was reduced to Yellow on 20 October at 1204 (0004 UTC). In addition, the Tokyo VAAC issued a series of Volcanic Ash Advisories beginning on 16 October and continuing through 30 October.
Geologic Background. The modern Bezymianny, much smaller than its massive neighbors Kamen and Kliuchevskoi on the Kamchatka Peninsula, was formed about 4,700 years ago over a late-Pleistocene lava-dome complex and an edifice built about 11,000-7,000 years ago. Three periods of intensified activity have occurred during the past 3,000 years. The latest period, which was preceded by a 1,000-year quiescence, began with the dramatic 1955-56 eruption. This eruption, similar to that of St. Helens in 1980, produced a large open crater that was formed by collapse of the summit and an associated lateral blast. Subsequent episodic but ongoing lava-dome growth, accompanied by intermittent explosive activity and pyroclastic flows, has largely filled the 1956 crater.
Information Contacts: Kamchatka Volcanic Eruptions Response Team (KVERT), Far Eastern Branch, Russian Academy of Sciences, 9 Piip Blvd., Petropavlovsk-Kamchatsky, 683006, Russia (URL: http://www.kscnet.ru/ivs/kvert/); Kamchatka Volcanological Station, Kamchatka Branch of Geophysical Survey, (KB GS RAS), Klyuchi, Kamchatka Krai, Russia (URL: http://volkstat.ru/); Tokyo Volcanic Ash Advisory Center (VAAC), 1-3-4 Otemachi, Chiyoda-ku, Tokyo 100-8122, Japan (URL: http://ds.data.jma.go.jp/svd/vaac/data/); Hawai'i Institute of Geophysics and Planetology (HIGP) - MODVOLC Thermal Alerts System, School of Ocean and Earth Science and Technology (SOEST), Univ. of Hawai'i, 2525 Correa Road, Honolulu, HI 96822, USA (URL: http://modis.higp.hawaii.edu/); MIROVA (Middle InfraRed Observation of Volcanic Activity), a collaborative project between the Universities of Turin and Florence (Italy) supported by the Centre for Volcanic Risk of the Italian Civil Protection Department (URL: http://www.mirovaweb.it/); Copernicus Browser, Copernicus Data Space Ecosystem, European Space Agency (URL: https://dataspace.copernicus.eu/browser/).chr
Kilauea (United States) — January 2023 Cite this Report
Kilauea
United States
19.421°N, 155.287°W; summit elev. 1222 m
All times are local (unless otherwise noted)
Low-level lava effusions in the lava lake at Halema’uma’u during July-December 2022
Kīlauea is the southeastern-most volcano in Hawaii and overlaps the E flank of the Mauna Loa volcano. Its East Rift Zone (ERZ) has been intermittently active for at least 2,000 years. An extended eruption period began in January 1983 and was characterized by open lava lakes and lava flows from the summit caldera and the East Rift Zone. During May 2018 magma migrated into the Lower East Rift Zone (LERZ) and opened 24 fissures along a 6-km-long NE-trending fracture zone that produced lava flows traveling in multiple directions. As lava emerged from the fissures, the lava lake at Halema'uma'u drained and explosions sent ash plumes to several kilometers altitude (BGVN 43:10).
The current eruption period started during September 2021 and has recently been characterized by lava effusions, spatter, and sulfur dioxide emissions in the active Halema’uma’u lava lake (BGVN 47:08). Lava effusions, some spatter, and sulfur dioxide emissions have continued during this reporting period of July through December 2022 using daily reports, volcanic activity notices, and abundant photo, map, and video data from the US Geological Survey's (USGS) Hawaiian Volcano Observatory (HVO).
Summary of activity during July-December 2022. Low-level effusions have continued at the western vent of the Halema’uma’u crater during July through early December 2022. Occasional weak ooze-outs (also called lava break outs) would occur along the margins of the crater floor. The overall level of the active lava lake throughout the reporting period gradually increased due to infilling, however it stagnated in mid-September (table 13). During September through November, activity began to decline, though lava effusions persisted at the western vent. By 9 December, the active part of the lava lake had completely crusted over, and incandescence was no longer visible.
Table 13. Summary of measurements taken during overflights at Kīlauea that show a gradual increase in the active lava lake level and the volume of lava effused since 29 September 2021. Lower activity was reported during September-October. Data collected during July-December 2022. Courtesy of HVO.
| Date: |
Level of the active lava lake (m): |
Cumulative volume of lava effused (million cubic meters): |
| 7 Jul 2022 |
130 |
95 |
| 19 Jul 2022 |
133 |
98 |
| 4 Aug 2022 |
136 |
102 |
| 16 Aug 2022 |
137 |
104 |
| 12 Sep 2022 |
143 |
111 |
| 5 Oct 2022 |
143 |
111 |
| 28 Oct 2022 |
143 |
111 |
Activity during July 2022. Lava effusions were reported from the western vent in the Halema’uma’u crater, along with occasional weak ooze-outs along the margins of the crater floor. The height of the lava lake was variable due to deflation-inflation tilt events; for example, the lake level dropped approximately 3-4 m during a summit deflation-inflation event reported on 1 July. Webcam images taken during the night of 6-12 July showed intermittent low-level spattering at the western vent that rose less than 10 m above the vent (figure 519). Measurements made during an overflight on 7 July indicated that the crater floor was infilled about 130 m and that 95 million cubic meters of lava had been effused since 29 September 2021. A single, relatively small lava ooze-out was active to the S of the lava lake. Around midnight on 8 July there were two brief periods of lava overflow onto the lake margins. On 9 July lava ooze-outs were reported near the SE and NE edges of the crater floor and during 10-11 July they occurred near the E, NE, and NW edges. On 16 July crater incandescence was reported, though the ooze-outs and spattering were not visible. On 18 July overnight webcam images showed incandescence in the western vent complex and two ooze-outs were reported around 0000 and 0200 on 19 July. By 0900 there were active ooze-outs along the SW edge of the crater floor. Measurements made from an overflight on 19 July indicated that the crater floor was infilled about 133 m and 98 million cubic meters of lava had erupted since 29 September 2021 (figure 520). On 20 July around 1600 active ooze-outs were visible along the N edge of the crater, which continued through the next day. Extensive ooze-outs occurred along the W margin during 24 July until 1900; on 26 July minor ooze-outs were noted along the N margin. Minor spattering was visible on 29 July along the E margin of the lake. The sulfur dioxide emission rates ranged 650-2,800 tons per day (t/d), the higher of which was measured on 8 July (figure 519).
Activity during August 2022. The eruption continued in the Halema’uma’u crater at the western vent. According to HVO the lava in the active lake remained at the level of the bounding levees. Occasional minor ooze-outs were observed along the margins of the crater floor. Strong nighttime crater incandescence was visible after midnight on 6 August over the western vent cone. During 6-7 August scattered small lava lobes were active along the crater floor and incandescence persisted above the western vent through 9 August. During 7-9 August HVO reported a single lava effusion source was active along the NW margin of the crater floor. Measurements from an overflight on 4 August indicated that the crater floor was infilled about 136 m total and that 102 million cubic meters of lava had been erupted since the start of the eruption. Lava breakouts were reported along the N, NE, E, S, and W margins of the crater during 10-16 August. Another overflight survey conducted on 16 August indicated that the crater floor infilled about 137 m and 104 million cubic meters of lava had been erupted since September 2021. Measured sulfur dioxide emissions rates ranged 1,150-2,450 t/d, the higher of which occurred on 8 August.
Activity during September 2022. During September, lava effusion continued from the western vent into the active lava lake and onto the crater floor. Intermittent minor ooze-outs were reported through the month. A small ooze-out was visible on the W crater floor margin at 0220 on 2 September, which showed decreasing surface activity throughout the day, but remained active through 3 September. On 3 September around 1900 a lava outbreak occurred along the NW margin of the crater floor but had stopped by the evening of 4 September. Field crews monitoring the summit lava lake on 9 September observed spattering on the NE margin of the lake that rose no higher than 10 m, before falling back onto the lava lake crust (figure 521). Overflight measurements on 12 September indicated that the crater floor was infilled a total of 143 m and 111 million cubic meters of lava had been erupted since September 2021. Extensive breakouts in the W and N part of the crater floor were reported at 1600 on 20 September and continued into 26 September. The active part of the lava lake dropped by 10 m while other parts of the crater floor dropped by several meters. Summit tiltmeters recorded a summit seismic swarm of more than 80 earthquakes during 1500-1800 on 21 September, which occurred about 1.5 km below Halema’uma’u; a majority of these were less than Mw 2. By 22 September the active part of the lava lake was infilled about 2 m. On 23 September the western vent areas exhibited several small spatter cones with incandescent openings, along with weak, sporadic spattering (figure 522). The sulfur dioxide emission rate ranged from 930 t/d to 2,000 t/d, the higher of which was measured on 6 September.
Activity during October 2022. Activity during October declined slightly compared to previous months, though lava effusions persisted from the western vent into the active lava lake and onto the crater floor during October (figure 523). Slight variations in the lava lake were noted throughout the month. HVO reported that around 0600 on 3 October the level of the lava lake has lowered slightly. Overflight measurements taken on 5 October indicated that the crater floor was infilled a total of about 143 m and that 111 million cubic meters of lava had been effused since September 2021. During 6-7 October the lake gradually rose 0.5 m. Sulfur dioxide measurements made on 22 October had an emission rate of 700 t/d. Another overflight taken on 28 October showed that there was little to no change in the elevation of the crater floor: the crater floor was infilled a total of 143 m and 111 million cubic meters of lava had erupted since the start of the eruption.
Activity during November 2022. Activity remained low during November, though HVO reported that lava from the western vent continued to effuse into the active lava lake and onto the crater floor throughout the month. The rate of sulfur dioxide emissions during November ranged from 300-600 t/d, the higher amount of which occurred on 9 November.
Activity during December 2022. Similar low activity was reported during December, with lava effusing from the western vent into the active lava lake and onto the crater floor. During 4-5 December the active part of the lava lake was slightly variable in elevation and fluctuated within 1 m. On 9 December HVO reported that lava was no longer erupting from the western vent in the Halema’uma’u crater and that sulfur dioxide emissions had returned to near pre-eruption background levels; during 10-11 December, the lava lake had completely crusted over, and no incandescence was visible (figure 524). Time lapse camera images covering the 4-10 December showed that the crater floor showed weak deflation and no inflation. Some passive events of crustal overturning were reported during 14-15 December, which brought fresh incandescent lava to the lake surface. The sulfur dioxide emission rate was approximately 200 t/d on 14 December. A smaller overturn event on 17 December and another that occurred around 0000 and into the morning of 20 December were also detected. A small seismic swarm was later detected on 30 December.
Geologic Background. Kilauea overlaps the E flank of the massive Mauna Loa shield volcano in the island of Hawaii. Eruptions are prominent in Polynesian legends; written documentation since 1820 records frequent summit and flank lava flow eruptions interspersed with periods of long-term lava lake activity at Halemaumau crater in the summit caldera until 1924. The 3 x 5 km caldera was formed in several stages about 1,500 years ago and during the 18th century; eruptions have also originated from the lengthy East and Southwest rift zones, which extend to the ocean in both directions. About 90% of the surface of the basaltic shield volcano is formed of lava flows less than about 1,100 years old; 70% of the surface is younger than 600 years. The long-term eruption from the East rift zone between 1983 and 2018 produced lava flows covering more than 100 km2, destroyed hundreds of houses, and added new coastline.
Information Contacts: Hawaiian Volcano Observatory (HVO), U.S. Geological Survey, PO Box 51, Hawai'i National Park, HI 96718, USA (URL: http://hvo.wr.usgs.gov/).
Nyamulagira (DR Congo) — November 2023 Cite this Report
Nyamulagira
DR Congo
1.408°S, 29.2°E; summit elev. 3058 m
All times are local (unless otherwise noted)
Lava flows and thermal activity during May-October 2023
Nyamulagira (also known as Nyamuragira) is a shield volcano in the Democratic Republic of Congo with the summit truncated by a small 2 x 2.3 km caldera with walls up to about 100 m high. Documented eruptions have occurred within the summit caldera, as well as from numerous flank fissures and cinder cones. The current eruption period began in April 2018 and has more recently been characterized by summit crater lava flows and thermal activity (BGVN 48:05). This report describes lava flows and variable thermal activity during May through October 2023, based on information from the Observatoire Volcanologique de Goma (OVG) and various satellite data.
Lava lake activity continued during May. The MIROVA (Middle InfraRed Observation of Volcanic Activity) system recorded moderate-to-strong thermal activity throughout the reporting period; activity was more intense during May and October and relatively weaker from June through September (figure 95). The MODVOLC thermal algorithm, detected a total of 209 thermal alerts. There were 143 hotspots detected during May, eight during June, nine during September, and 49 during October. This activity was also reflected in infrared satellite images, where a lava flow was visible in the NW part of the crater on 7 May and strong activity was seen in the center of the crater on 4 October (figure 96). Another infrared satellite image taken on 12 May showed still active lava flows along the NW margin of the crater. According to OVG lava effusions were active during 7-29 May and moved to the N and NW parts of the crater beginning on 9 May. Strong summit crater incandescence was visible from Goma (27 km S) during the nights of 17, 19, and 20 May (figure 97). On 17 May there was an increase in eruptive activity, which peaked at 0100 on 20 May. Notable sulfur dioxide plumes drifted NW and W during 19-20 May (figure 98). Drone footage acquired in partnership with the USGS (United States Geological Survey) on 20 May captured images of narrow lava flows that traveled about 100 m down the W flank (figure 99). Data from the Rumangabo seismic station indicated a decreasing trend in activity during 17-21 May. Although weather clouds prevented clear views of the summit, a strong thermal signature on the NW flank was visible in an infrared satellite image on 22 May, based on an infrared satellite image. On 28 May the lava flows on the upper W flank began to cool and solidify. By 29 May seismicity returned to levels similar to those recorded before the 17 May increase. Lava effusion continued but was confined to the summit crater; periodic crater incandescence was observed.
Low-level activity was noted during June through October. On 1 June OVG reported that seismicity remained at lower levels and that crater incandescence had been absent for three days, though infrared satellite imagery showed continued lava effusion in the summit crater. The lava flows on the flanks covered an estimated 0.6 km2. Satellite imagery continued to show thermal activity confined to the lava lake through October (figure 96), although no lava flows or significant sulfur dioxide emissions were reported.
Geologic Background. Africa's most active volcano, Nyamulagira (also known as Nyamuragira), is a massive high-potassium basaltic shield about 25 km N of Lake Kivu and 13 km NNW of the steep-sided Nyiragongo volcano. The summit is truncated by a small 2 x 2.3 km caldera that has walls up to about 100 m high. Documented eruptions have occurred within the summit caldera, as well as from the numerous flank fissures and cinder cones. A lava lake in the summit crater, active since at least 1921, drained in 1938, at the time of a major flank eruption. Recent lava flows extend down the flanks more than 30 km from the summit as far as Lake Kivu; extensive lava flows from this volcano have covered 1,500 km2 of the western branch of the East African Rift.
Information Contacts: Observatoire Volcanologique de Goma (OVG), Departement de Geophysique, Centre de Recherche en Sciences Naturelles, Lwiro, D.S. Bukavu, DR Congo; Hawai'i Institute of Geophysics and Planetology (HIGP) - MODVOLC Thermal Alerts System, School of Ocean and Earth Science and Technology (SOEST), Univ. of Hawai'i, 2525 Correa Road, Honolulu, HI 96822, USA (URL: http://modis.higp.hawaii.edu/); MIROVA (Middle InfraRed Observation of Volcanic Activity), a collaborative project between the Universities of Turin and Florence (Italy) supported by the Centre for Volcanic Risk of the Italian Civil Protection Department (URL: http://www.mirovaweb.it/); NASA Global Sulfur Dioxide Monitoring Page, Atmospheric Chemistry and Dynamics Laboratory, NASA Goddard Space Flight Center (NASA/GSFC), 8800 Greenbelt Road, Goddard, Maryland, USA (URL: https://so2.gsfc.nasa.gov/); Copernicus Browser, Copernicus Data Space Ecosystem, European Space Agency (URL: https://dataspace.copernicus.eu/browser/); Charles Balagizi, Goma Volcano Observatory, Departement de Geophysique, Centre de Recherche en Sciences Naturelles, Lwiro, D.S. Bukavu, DR Congo.
Bagana (Papua New Guinea) — October 2023 Cite this Report
Bagana
Papua New Guinea
6.137°S, 155.196°E; summit elev. 1855 m
All times are local (unless otherwise noted)
Explosions, ash plumes, ashfall, and lava flows during April-September 2023
The remote volcano of Bagana is located in central Bougainville Island, Papua New Guinea. Recorded eruptions date back to 1842 and activity has consisted of effusive activity that has built a small lava dome in the summit crater and occasional explosions that produced pyroclastic flows. The most recent eruption has been ongoing since February 2000 and has produced occasional explosions, ash plumes, and lava flows. More recently, activity has been characterized by ongoing effusive activity and ash emissions (BGVN 48:04). This report updates activity from April through September 2023 that has consisted of explosions, ash plumes, ashfall, and lava flows, using information from the Darwin Volcanic Ash Advisory Center (VAAC) and satellite data.
An explosive eruption was reported on 7 July that generated a large gas-and-ash plume to high altitudes and caused significant ashfall in local communities; the eruption plume had reached upper tropospheric (16-18 km altitude) altitudes by 2200, according to satellite images. Sulfur dioxide plumes were detected in satellite images on 8 July and indicated that the plume was likely a mixture of gas, ice, and ash. A report issued by the Autonomous Bougainville Government (ABG) (Torokina District, Education Section) on 10 July noted that significant ash began falling during 2000-2100 on 7 July and covered most areas in the Vuakovi, Gotana (9 km SW), Koromaketo, Laruma (25 km W) and Atsilima (27 km NW) villages. Pyroclastic flows also occurred, according to ground-based reports; small deposits confined to one drainage were inspected by RVO during an overflight on 17 July and were confirmed to be from the 7 July event. Ashfall continued until 10 July and covered vegetation, which destroyed bushes and gardens and contaminated rivers and streams.
RVO reported another eruption on 14 July. The Darwin VAAC stated that an explosive event started around 0830 on 15 July and produced an ash plume that rose to 16.5 km altitude by 1000 and drifted N, according to satellite images. The plume continued to drift N and remained visible through 1900, and by 2150 it had dissipated.
Ashfall likely from both the 7 and 15 July events impacted about 8,111 people in Torokina (20 km SW), including Tsito/Vuakovi, Gotana, Koromaketo, Kenaia, Longkogari, Kenbaki, Piva (13 km SW), and Atsinima, and in the Tsitovi district, according to ABG. Significant ashfall was also reported in Ruruvu (22 km N) in the Wakunai District of Central Bougainville, though the thickness of these deposits could not be confirmed. An evacuation was called for the villages in Wakunai, where heavy ashfall had contaminated water sources; the communities of Ruruvu, Togarau, Kakarapaia, Karauturi, Atao, and Kuritaturi were asked to evacuate to a disaster center at the Wakunai District Station, and communities in Torokina were asked to evacuate to the Piva District station. According to a news article, more than 7,000 people needed temporary accommodations, with about 1,000 people in evacuation shelters. Ashfall had deposited over a broad area, contaminating water supplies, affecting crops, and collapsing some roofs and houses in rural areas. Schools were temporarily shut down. Intermittent ash emissions continued through the end of July and drifted NNW, NW, and SW. Fine ashfall was reported on the coast of Torokina, and ash plumes also drifted toward Laruma and Atsilima.
A small explosive eruption occurred at 2130 on 28 July that ejected material from the crater vents, according to reports from Torokina, in addition to a lava flow that contained two lobes. A second explosion was detected at 2157. Incandescence from the lava flow was visible from Piva as it descended the W flank around 2000 on 29 July (figure 47). The Darwin VAAC reported that a strong thermal anomaly was visible in satellite images during 30-31 July and that ash emissions rose to 2.4 km altitude and drifted WSW on 30 July. A ground report from RVO described localized emissions at 0900 on 31 July.
The Darwin VAAC reported that ash plumes were identified in satellite imagery at 0800 and 1220 on 12 August and rose to 2.1 km and 3 km altitude and drifted NW and W, respectively. A news report stated that aid was sent to more than 6,300 people that were adversely affected by the eruption. Photos taken during 17-19 August showed ash emissions rising no higher than 1 km above the summit and drifting SE. A small explosion generated an ash plume during the morning of 19 August. Deposits from small pyroclastic flows were also captured in the photos. Satellite images captured lava flows and pyroclastic flow deposits. Two temporary seismic stations were installed near Bagana on 17 August at distances of 7 km WSW (Vakovi station) and 11 km SW (Kepox station). The Kepox station immediately started to record continuous, low-frequency background seismicity.
Satellite data. Little to no thermal activity was detected during April through mid-July 2023; only one anomaly was recorded during early April and one during early June, according to MIROVA (Middle InfraRed Observation of Volcanic Activity) data (figure 48). Thermal activity increased in both power and frequency during mid-July through September, although there were still some short gaps in detected activity. MODVOLC also detected increased thermal activity during August; thermal hotspots were detected a total of five times on 19, 20, and 27 August. Weak thermal anomalies were also captured in infrared satellite images on clear weather days throughout the reporting period on 7, 12, and 17 April, 27 May, 1, 6, 16, and 31 July, and 19 September (figure 48); a strong thermal anomaly was visible on 31 July. Distinct sulfur dioxide plumes that drifted generally NW were intermittently captured by the TROPOMI instrument on the Sentinel-5P satellite and sometimes exceeded two Dobson Units (DUs) (figure 49).
Geologic Background. Bagana volcano, in a remote portion of central Bougainville Island, is frequently active. This massive symmetrical cone was largely constructed by an accumulation of viscous andesitic lava flows. The entire edifice could have been constructed in about 300 years at its present rate of lava production. Eruptive activity is characterized by non-explosive effusion of viscous lava that maintains a small lava dome in the summit crater, although occasional explosive activity produces pyroclastic flows. Lava flows with tongue-shaped lobes up to 50 m thick and prominent levees descend the flanks on all sides.
Information Contacts: Rabaul Volcano Observatory (RVO), Geohazards Management Division, Department of Mineral Policy and Geohazards Management (DMPGM), PO Box 3386, Kokopo, East New Britain Province, Papua New Guinea; Darwin Volcanic Ash Advisory Centre (VAAC), Bureau of Meteorology, Northern Territory Regional Office, PO Box 40050, Casuarina, NT 0811, Australia (URL: http://www.bom.gov.au/info/vaac/); MIROVA (Middle InfraRed Observation of Volcanic Activity), a collaborative project between the Universities of Turin and Florence (Italy) supported by the Centre for Volcanic Risk of the Italian Civil Protection Department (URL: http://www.mirovaweb.it/); Hawai'i Institute of Geophysics and Planetology (HIGP) - MODVOLC Thermal Alerts System, School of Ocean and Earth Science and Technology (SOEST), Univ. of Hawai'i, 2525 Correa Road, Honolulu, HI 96822, USA (URL: http://modis.higp.hawaii.edu/); NASA Global Sulfur Dioxide Monitoring Page, Atmospheric Chemistry and Dynamics Laboratory, NASA Goddard Space Flight Center (NASA/GSFC), 8800 Greenbelt Road, Goddard, Maryland, USA (URL: https://so2.gsfc.nasa.gov/); Copernicus Browser, Copernicus Data Space Ecosystem, European Space Agency (URL: https://dataspace.copernicus.eu/browser/); Autonomous Bougainville Government, P.O Box 322, Buka, AROB, PNG (URL: https://abg.gov.pg/); Andrew Tupper (Twitter: @andrewcraigtupp); Simon Carn, Geological and Mining Engineering and Sciences, Michigan Technological University, 1400 Townsend Drive, Houghton, MI 49931, USA (URL: http://www.volcarno.com/, Twitter: @simoncarn); Radio NZ (URL: https://www.rnz.co.nz/news/pacific/494464/more-than-7-000-people-in-bougainville-need-temporary-accommodation-after-eruption); USAID, 1300 Pennsylvania Ave, NW, Washington DC 20004, USA (URL: https://www.usaid.gov/pacific-islands/press-releases/aug-08-2023-united-states-provides-immediate-emergency-assistance-support-communities-affected-mount-bagana-volcanic-eruptions).
Mayon (Philippines) — October 2023 Cite this Report
Mayon
Philippines
13.257°N, 123.685°E; summit elev. 2462 m
All times are local (unless otherwise noted)
Lava flows, pyroclastic flows, ash emissions, and seismicity during April-September 2023
Mayon is located in the Philippines and has steep upper slopes capped by a small summit crater. Historical eruptions date back to 1616 CE that have been characterized by Strombolian eruptions, lava flows, pyroclastic flows, and mudflows. Eruptions mostly originated from a central conduit. Pyroclastic flows and mudflows have commonly descended many of the approximately 40 drainages that surround the volcano. The most recent eruption occurred during June through October 2022 and consisted of lava dome growth and gas-and-steam emissions (BGVN 47:12). A new eruption was reported during late April 2023 and has included lava flows, pyroclastic density currents, ash emissions, and seismicity. This report covers activity during April through September 2023 based on daily bulletins from the Philippine Institute of Volcanology and Seismology (PHIVOLCS).
During April through September 2023, PHIVOLCS reported near-daily rockfall events, frequent volcanic earthquakes, and sulfur dioxide measurements. Gas-and-steam emissions rose 100-900 m above the crater and drifted in different directions. Nighttime crater incandescence was often visible during clear weather and was accompanied by incandescent avalanches of material. Activity notably increased during June when lava flows were reported on the S, SE, and E flanks (figure 52). The MIROVA graph (Middle InfraRed Observation of Volcanic Activity) showed strong thermal activity coincident with these lava flows, which remained active through September (figure 53). According to the MODVOLC thermal algorithm, a total of 110 thermal alerts were detected during the reporting period: 17 during June, 40 during July, 27 during August, and 26 during September. During early June, pyroclastic density currents (PDCs) started to occur more frequently.
Low activity was reported during much of April and May; gas-and-steam emissions rose 100-900 m above the crater and generally drifted in different directions. A total of 52 rockfall events and 18 volcanic earthquakes were detected during April and 147 rockfall events and 13 volcanic events during May. Sulfur dioxide flux measurements ranged between 400-576 tons per day (t/d) during April, the latter of which was measured on 29 April and between 162-343 t/d during May, the latter of which was measured on 13 May.
Activity during June increased, characterized by lava flows, pyroclastic density currents (PDCs), crater incandescence and incandescent rockfall events, gas-and-steam emissions, and continued seismicity. Weather clouds often prevented clear views of the summit, but during clear days, moderate gas-and-steam emissions rose 100-2,500 m above the crater and drifted in multiple directions. A total of 6,237 rockfall events and 288 volcanic earthquakes were detected. The rockfall events often deposited material on the S and SE flanks within 700-1,500 m of the summit crater and ash from the events drifted SW, S, SE, NE, and E. Sulfur dioxide emissions ranged between 149-1,205 t/d, the latter of which was measured on 10 June. Short-term observations from EDM and electronic tiltmeter monitoring indicated that the upper slopes were inflating since February 2023. Longer-term ground deformation parameters based on EDM, precise leveling, continuous GPS, and electronic tilt monitoring indicated that the volcano remained inflated, especially on the NW and SE flanks. At 1000 on 5 June the Volcano Alert Level (VAL) was raised to 2 (on a 0-5 scale). PHIVOLCS noted that although low-level volcanic earthquakes, ground deformation, and volcanic gas emissions indicated unrest, the steep increase in rockfall frequency may indicate increased dome activity.
A total of 151 dome-collapse PDCs occurred during 8-9 and 11-30 June, traveled 500-2,000 m, and deposited material on the S flank within 2 km of the summit crater. During 8-9 June the VAL was raised to 3. At approximately 1947 on 11 June lava flow activity was reported; two lobes traveled within 500 m from the crater and deposited material on the S (Mi-isi), SE (Bonga), and E (Basud) flanks. Weak seismicity accompanied the lava flow and slight inflation on the upper flanks. This lava flow remained active through 30 June, moving down the S and SE flank as far as 2.5 km and 1.8 km, respectively and depositing material up to 3.3 km from the crater. During 15-16 June traces of ashfall from the PDCs were reported in Sitio Buga, Nabonton, City of Ligao and Purok, and San Francisco, Municipality of Guinobatan. During 28-29 June there were two PDCs generated by the collapse of the lava flow front, which generated a light-brown ash plume 1 km high. Satellite monitors detected significant concentrations of sulfur dioxide beginning on 29 June. On 30 June PDCs primarily affected the Basud Gully on the E flank, the largest of which occurred at 1301 and lasted eight minutes, based on the seismic record. Four PDCs generated between 1800 and 2000 that lasted approximately four minutes each traveled 3-4 km on the E flank and generated an ash plume that rose 1 km above the crater and drifted N and NW. Ashfall was recorded in Tabaco City.
Similar strong activity continued during July; slow lava effusion remained active on the S and SE flanks and traveled as far as 2.8 km and 2.8 km, respectively and material was deposited as far as 4 km from the crater. There was a total of 6,983 rockfall events and 189 PDCs that affected the S, SE, and E flanks. The volcano network detected a total of 2,124 volcanic earthquakes. Continuous gas-and-steam emissions rose 200-2,000 m above the crater and drifted in multiple directions. Sulfur dioxide emissions averaged 792-4,113 t/d, the latter of which was measured on 28 July. During 2-4 July three PDCs were generated from the collapse of the lava flow and resulting light brown plumes rose 200-300 m above the crater. Continuous tremor pulses were reported beginning at 1547 on 3 July through 7 July at 1200, at 2300 on 8 July and going through 0300 on 10 July, and at 2300 on 16 July, as recorded by the seismic network. During 6-9 July there were 10 lava flow-collapse-related PDCs that generated light brown plumes 300-500 m above the crater. During 10-11 July light ashfall was reported in some areas of Mabinit, Legazpi City, Budiao and Salvacion, Daraga, and Camalig, Albay. By 18 July the lava flow advanced 600 m on the E flank as well.
During 1733 on 18 July and 0434 on 19 July PHIVOLCS reported 30 “ashing” events, which are degassing events accompanied by audible thunder-like sounds and entrained ash at the crater, which produced short, dark plumes that drifted SW. These events each lasted 20-40 seconds, and plume heights ranged from 150-300 m above the crater, as recorded by seismic, infrasound, visual, and thermal monitors. Three more ashing events occurred during 19-20 July. Short-term observations from electronic tilt and GPS monitoring indicate deflation on the E lower flanks in early July and inflation on the NW middle flanks during the third week of July. Longer-term ground deformation parameters from EDM, precise leveling, continuous GPS, and electronic tilt monitoring indicated that the volcano was still generally inflated relative to baseline levels. A short-lived lava pulse lasted 28 seconds at 1956 on 21 July, which was accompanied by seismic and infrasound signals. By 22 July, the only lava flow that remained active was on the SE flank, and continued to extend 3.4 km, while those on the S and E flanks weakened markedly. One ashing event was detected during 30-31 July, whereas there were 57 detected during 31 July-1 August; according to PHIVOLCS beginning at approximately 1800 on 31 July eruptive activity was dominated by phases of intermittent ashing, as well as increased in the apparent rates of lava effusion from the summit crater. The ashing phases consisted of discrete events recorded as low-frequency volcanic earthquakes (LFVQ) typically 30 seconds in duration, based on seismic and infrasound signals. Gray ash plume rose 100 m above the crater and generally drifted NE. Shortly after these ashing events began, new lava began to effuse rapidly from the crater, feeding the established flowed on the SE, E, and E flanks and generating frequent rockfall events.
Intensified unrest persisted during August. There was a total of 4,141 rockfall events, 2,881 volcanic earthquakes, which included volcanic tremor events, 32 ashing events, and 101 PDCs detected throughout the month. On clear weather days, gas-and-steam emissions rose 300-1,500 m above the crater and drifted in different directions (figure 54). Sulfur dioxide emissions averaged 735-4,756 t/d, the higher value of which was measured on 16 August. During 1-2 August the rate of lava effusion decreased, but continued to feed the flows on the SE, S, and E flanks, maintaining their advances to 3.4 km, 2.8 km, and 1.1 km from the crater, respectively (figure 55). Rockfall and PDCs generated by collapses at the lava flow margins and from the summit dome deposited material within 4 km of the crater. During 3-4 August there were 10 tremor events detected that lasted 1-4 minutes. Short-lived lava pulse lasted 35 seconds and was accompanied by seismic and infrasound signals at 0442 on 6 August. Seven collapses were recorded at the front of the lava flow during 12-14 August.
During September, similar activity of slow lava effusion, PDCs, gas-and-steam emissions, and seismicity continued. There was a total of 4,452 rockfall events, 329 volcanic earthquakes, which included volcanic tremor events, two ashing events, and 85 PDCs recorded throughout the month. On clear weather days, gas-and-steam emissions rose 100-1,500 m above the crater and drifted in multiple directions. Sulfur dioxide emissions averaged 609-2,252 t/d, the higher average of which was measured on 6 September. Slow lava effusion continued advancing on the SE, S, and E flanks, maintaining lengths of 3.4 km, 2.8 km, and 1.1 km, respectively. Rockfall and PDC events generated by collapses along the lava flow margins and at the summit dome deposited material within 4 km of the crater.
Geologic Background. Symmetrical Mayon, which rises above the Albay Gulf NW of Legazpi City, is the most active volcano of the Philippines. The steep upper slopes are capped by a small summit crater. Recorded eruptions since 1616 CE range from Strombolian to basaltic Plinian, with cyclical activity beginning with basaltic eruptions, followed by longer periods of andesitic lava flows. Eruptions occur predominately from the central conduit and have also produced lava flows that travel far down the flanks. Pyroclastic density currents and mudflows have commonly swept down many of the approximately 40 ravines that radiate from the summit and have often damaged populated lowland areas. A violent eruption in 1814 killed more than 1,200 people and devastated several towns.
Information Contacts: Philippine Institute of Volcanology and Seismology (PHIVOLCS), Department of Science and Technology, University of the Philippines Campus, Diliman, Quezon City, Philippines (URL: http://www.phivolcs.dost.gov.ph/); MIROVA (Middle InfraRed Observation of Volcanic Activity), a collaborative project between the Universities of Turin and Florence (Italy) supported by the Centre for Volcanic Risk of the Italian Civil Protection Department (URL: http://www.mirovaweb.it/); Hawai'i Institute of Geophysics and Planetology (HIGP) - MODVOLC Thermal Alerts System, School of Ocean and Earth Science and Technology (SOEST), Univ. of Hawai'i, 2525 Correa Road, Honolulu, HI 96822, USA (URL: http://modis.higp.hawaii.edu/); Copernicus Browser, Copernicus Data Space Ecosystem, European Space Agency (URL: https://dataspace.copernicus.eu/browser/); William Rogers, Legazpi City, Albay Province, Philippines.
Nishinoshima (Japan) — October 2023 Cite this Report
Nishinoshima
Japan
27.247°N, 140.874°E; summit elev. 100 m
All times are local (unless otherwise noted)
Eruption plumes and gas-and-steam plumes during May-August 2023
Nishinoshima, located about 1,000 km S of Tokyo, is a small island in the Ogasawara Arc in Japan. The island is the summit of a massive submarine volcano that has prominent submarine peaks to the S, W, and NE. Eruptions date back to 1973 and the current eruption period began in October 2022. Recent activity has consisted of small ash plumes and fumarolic activity (BGVN 48:07). This report covers activity during May through August 2023, using information from monthly reports of the Japan Meteorological Agency (JMA) monthly reports and satellite data.
Activity during May through June was relatively low. The Japan Coast Guard (JCG) did overflights on 14 and 22 June and reported white gas-and-steam emissions rising 600 m and 1,200 m from the central crater of the pyroclastic cone, respectively (figure 125). In addition, multiple white gas-and-steam emissions rose from the inner rim of the W side of the crater and from the SE flank of the pyroclastic cone. Discolored brown-to-green water was observed around almost the entire perimeter of the island; on 22 June light green discolored water was observed off the S coast of the island.
Observations from the Himawari meteorological satellite confirmed an eruption on 9 and 10 July. An eruption plume rose 1.6 km above the crater and drifted N around 1300 on 9 July. Satellite images acquired at 1420 and 2020 on 9 July and at 0220 on 10 July showed continuing emissions that rose 1.3-1.6 km above the crater and drifted NE and N. The Tokyo VAAC reported that an ash plume seen by a pilot and identified in a satellite image at 0630 on 21 July rose to 3 km altitude and drifted S.
Aerial observations conducted by JCG on 8 August showed a white-and-gray plume rising from the central crater of the pyroclastic cone, and multiple white gas-and-steam emissions were rising from the inner edge of the western crater and along the NW-SE flanks of the island (figure 126). Brown-to-green discolored water was also noted around the perimeter of the island.
Intermittent low-to-moderate power thermal anomalies were recorded in the MIROVA graph (Middle InfraRed Observation of Volcanic Activity), showing an increase in both frequency and power beginning in July (figure 127). This increase in activity coincides with eruptive activity on 9 and 10 July, characterized by eruption plumes. According to the MODVOLC thermal alert algorithm, one thermal hotspot was recorded on 20 July. Weak thermal anomalies were also detected in infrared satellite imagery, accompanied by strong gas-and-steam plumes (figure 128).
Geologic Background. The small island of Nishinoshima was enlarged when several new islands coalesced during an eruption in 1973-74. Multiple eruptions that began in 2013 completely covered the previous exposed surface and continued to enlarge the island. The island is the summit of a massive submarine volcano that has prominent peaks to the S, W, and NE. The summit of the southern cone rises to within 214 m of the ocean surface 9 km SSE.
Information Contacts: Japan Meteorological Agency (JMA), 1-3-4 Otemachi, Chiyoda-ku, Tokyo 100-8122, Japan (URL: http://www.jma.go.jp/jma/indexe.html); Tokyo Volcanic Ash Advisory Center (VAAC), 1-3-4 Otemachi, Chiyoda-ku, Tokyo 100-8122, Japan (URL: http://ds.data.jma.go.jp/svd/vaac/data/); MIROVA (Middle InfraRed Observation of Volcanic Activity), a collaborative project between the Universities of Turin and Florence (Italy) supported by the Centre for Volcanic Risk of the Italian Civil Protection Department (URL: http://www.mirovaweb.it/); Copernicus Browser, Copernicus Data Space Ecosystem, European Space Agency (URL: https://dataspace.copernicus.eu/browser/).
Krakatau (Indonesia) — October 2023 Cite this Report
Krakatau
Indonesia
6.1009°S, 105.4233°E; summit elev. 285 m
All times are local (unless otherwise noted)
White gas-and-steam plumes and occasional ash plumes during May-August 2023
Krakatau is located in the Sunda Strait between Java and Sumatra, Indonesia. Caldera collapse during the catastrophic 1883 eruption destroyed Danan and Perbuwatan cones and left only a remnant of Rakata. The post-collapse cone of Anak Krakatau (Child of Krakatau) was constructed within the 1883 caldera at a point between the former Danan and Perbuwatan cones; it has been the site of frequent eruptions since 1927. The current eruption period began in May 2021 and has recently consisted of Strombolian eruptions and ash plumes (BGVN 48:07). This report describes lower levels of activity consisting of ash and white gas-and-steam plumes during May through August 2023, based on information provided by the Indonesian Center for Volcanology and Geological Hazard Mitigation, referred to as Pusat Vulkanologi dan Mitigasi Bencana Geologi (PVMBG), MAGMA Indonesia, and satellite data.
Activity was relatively low during May and June. Daily white gas-and-steam emissions rose 25-200 m above the crater and drifted in different directions. Five ash plumes were detected at 0519 on 10 May, 1241 on 11 May, 0920 on 12 May, 2320 on 12 May, and at 0710 on 13 May, and rose 1-2.5 km above the crater and drifted SW. A webcam image taken on 12 May showed ejection of incandescent material above the vent. A total of nine ash plumes were detected during 6-11 June: at 1434 and 00220 on 6 and 7 June the ash plumes rose 500 m above the crater and drifted NW, at 1537 on 8 June the ash plume rose 1 km above the crater and drifted SW, at 0746 and at 0846 on 9 June the ash plumes rose 800 m and 3 km above the crater and drifted SW, respectively, at 0423, 1431, and 1750 on 10 June the ash plumes rose 2 km, 1.5 km, and 3.5 km above the crater and drifted NW, respectively, and at 0030 on 11 June an ash plume rose 2 km above the crater and drifted NW. Webcam images taken on 10 and 11 June at 0455 and 0102, respectively, showed incandescent material ejected above the vent. On 19 June an ash plume at 0822 rose 1.5 km above the crater and drifted SE.
Similar low activity of white gas-and-steam emissions and few ash plumes were reported during July and August. Daily white gas-and-steam emissions rose 25-300 m above the crater and drifted in multiple directions. Three ash plumes were reported at 0843, 0851, and 0852 on 20 July that rose 500-2,000 m above the crater and drifted NW.
The MIROVA (Middle InfraRed Observation of Volcanic Activity) graph of MODIS thermal anomaly data showed intermittent low-to-moderate power thermal anomalies during May through August 2023 (figure 140). Although activity was often obscured by weather clouds, a thermal anomaly was visible in an infrared satellite image of the crater on 12 May, accompanied by an eruption plume that drifted SW (figure 141).
Geologic Background. The renowned Krakatau (frequently mis-named as Krakatoa) volcano lies in the Sunda Strait between Java and Sumatra. Collapse of an older edifice, perhaps in 416 or 535 CE, formed a 7-km-wide caldera. Remnants of that volcano are preserved in Verlaten and Lang Islands; subsequently the Rakata, Danan, and Perbuwatan cones were formed, coalescing to create the pre-1883 Krakatau Island. Caldera collapse during the catastrophic 1883 eruption destroyed Danan and Perbuwatan, and left only a remnant of Rakata. This eruption caused more than 36,000 fatalities, most as a result of tsunamis that swept the adjacent coastlines of Sumatra and Java. Pyroclastic surges traveled 40 km across the Sunda Strait and reached the Sumatra coast. After a quiescence of less than a half century, the post-collapse cone of Anak Krakatau (Child of Krakatau) was constructed within the 1883 caldera at a point between the former Danan and Perbuwatan cones. Anak Krakatau has been the site of frequent eruptions since 1927.
Information Contacts: Pusat Vulkanologi dan Mitigasi Bencana Geologi (PVMBG, also known as Indonesian Center for Volcanology and Geological Hazard Mitigation, CVGHM), Jalan Diponegoro 57, Bandung 40122, Indonesia (URL: http://www.vsi.esdm.go.id/); MAGMA Indonesia, Kementerian Energi dan Sumber Daya Mineral (URL: https://magma.esdm.go.id/v1); MIROVA (Middle InfraRed Observation of Volcanic Activity), a collaborative project between the Universities of Turin and Florence (Italy) supported by the Centre for Volcanic Risk of the Italian Civil Protection Department (URL: http://www.mirovaweb.it/); Copernicus Browser, Copernicus Data Space Ecosystem, European Space Agency (URL: https://dataspace.copernicus.eu/browser/).
Villarrica (Chile) — October 2023 Cite this Report
Villarrica
Chile
39.42°S, 71.93°W; summit elev. 2847 m
All times are local (unless otherwise noted)
Strombolian activity, gas-and-ash emissions, and crater incandescence during April-September 2023
Villarrica, in central Chile, consists of a 2-km-wide caldera that formed about 3,500 years ago and is located at the base of the presently active cone at the NW margin of a 6-km-wide caldera. Historical eruptions eruptions date back to 1558 and have been characterized by mild-to-moderate explosive activity with occasional lava effusions. The current eruption period began in December 2014 and has recently consisted of nighttime crater incandescence, ash emissions, and seismicity (BGVN 48:04). This report covers activity during April through September 2023 and describes occasional Strombolian activity, gas-and-ash emissions, and nighttime crater incandescence. Information for this report primarily comes from the Southern Andes Volcano Observatory (Observatorio Volcanológico de Los Andes del Sur, OVDAS), part of Chile's National Service of Geology and Mining (Servicio Nacional de Geología y Minería, SERNAGEOMIN) and satellite data.
Seismicity during April consisted of long period (LP) events and tremor (TRE); a total of 9,413 LP-type events and 759 TR-type events were detected throughout the month. Nighttime crater incandescence persisted and was visible in the degassing column. Sulfur dioxide data was obtained using Differential Absorption Optical Spectroscopy Equipment (DOAS) that showed an average value of 1,450 ± 198 tons per day (t/d) during 1-15 April and 1,129 ± 201 t/d during 16-30 April, with a maximum daily value of 2,784 t/d on 9 April. Gas-and-steam emissions of variable intensities rose above the active crater as high as 1.3 km above the crater on 13 April. Strombolian explosions were not observed and there was a slight decrease in the lava lake level.
There were 14,123 LP-type events and 727 TR-type events detected during May. According to sulfur dioxide measurements taken with DOAS equipment, the active crater emitted an average value of 1,826 ± 482 t/d during 1-15 May and 912 ± 41 t/d during 16-30 May, with a daily maximum value of 5,155 t/d on 13 May. Surveillance cameras showed continuous white gas-and-steam emissions that rose as high as 430 m above the crater on 27 May. Nighttime incandescence illuminated the gas column less than 300 m above the crater rim was and no pyroclastic emissions were reported. A landslide was identified on 13 May on the E flank of the volcano 50 m from the crater rim and extending 300 m away; SERNAGEOMIN noted that this event may have occurred on 12 May. During the morning of 27 and 28 May minor Strombolian explosions characterized by incandescent ejecta were recorded at the crater rim; the last reported Strombolian explosions had occurred at the end of March.
Seismic activity during June consisted of five volcano-tectonic (VT)-type events, 21,606 LP-type events, and 2,085 TR-type events. The average value of sulfur dioxide flux obtained by DOAS equipment was 1,420 ± 217 t/d during 1-15 June and 2,562 ± 804 t/d, with a maximum daily value of 4,810 t/d on 17 June. White gas-and-steam emissions rose less than 480 m above the crater; frequent nighttime crater incandescence was reflected in the degassing plume. On 12 June an emission rose 100 m above the crater and drifted NNW. On 15 June one or several emissions resulted in ashfall to the NE as far as 5.5 km from the crater, based on a Skysat satellite image. Several Strombolian explosions occurred within the crater; activity on 15 June was higher energy and ejected blocks 200-300 m on the NE slope. Surveillance cameras showed white gas-and-steam emissions rising 480 m above the crater on 16 June. On 19 and 24 June low-intensity Strombolian activity was observed, ejecting material as far as 200 m from the center of the crater to the E.
During July, seismicity included 29,319 LP-type events, 3,736 TR-type events, and two VT-type events. DOAS equipment recorded two days of sulfur dioxide emissions of 4,220 t/d and 1,009 t/d on 1 and 13 July, respectively. Constant nighttime incandescence was also recorded and was particularly noticeable when accompanied by eruptive columns on 12 and 16 July. Minor explosive events were detected in the crater. According to Skysat satellite images taken on 12, 13, and 16 July, ashfall deposits were identified 155 m S of the crater. According to POVI, incandescence was visible from two vents on the crater floor around 0336 on 12 July. Gas-and-ash emissions rose as high as 1.2 km above the crater on 13 July and drifted E and NW. A series of gas-and-steam pulses containing some ash deposited material on the upper E flank around 1551 on 13 July. During 16-31 July, average sulfur dioxide emissions of 1,679 ± 406 t/d were recorded, with a maximum daily value of 2,343 t/d on 28 July. Fine ash emissions were also reported on 16, 17, and 23 July.
Seismicity persisted during August, characterized by 27,011 LP-type events, 3,323 TR-type events, and three VT-type events. The average value of sulfur dioxide measurements taken during 1-15 August was 1,642 ± 270 t/d and 2,207 ± 4,549 t/d during 16-31 August, with a maximum daily value of 3,294 t/d on 27 August. Nighttime crater incandescence remained visible in degassing columns. White gas-and-steam emissions rose 480 m above the crater on 6 August. According to a Skysat satellite image from 6 August, ash accumulation was observed proximal to the crater and was mainly distributed toward the E slope. White gas-and-steam emissions rose 320 m above the crater on 26 August. Nighttime incandescence and Strombolian activity that generated ash emissions were reported on 27 August.
Seismicity during September was characterized by five VT-type events, 12,057 LP-type events, and 2,058 TR-type events. Nighttime incandescence persisted. On 2 September an ash emission rose 180 m above the crater and drifted SE at 1643 (figure 125) and a white gas-and-steam plume rose 320 m above the crater. According to the Buenos Aires VAAC, periods of continuous gas-and-ash emissions were visible in webcam images from 1830 on 2 September to 0110 on 3 September. Strombolian activity was observed on 2 September and during the early morning of 3 September, the latter event of which generated an ash emission that rose 60 m above the crater and drifted 100 m from the center of the crater to the NE and SW. Ashfall was reported to the SE and S as far as 750 m from the crater. The lava lake was active during 3-4 September and lava fountaining was visible for the first time since 26 March 2023, according to POVI. Fountains captured in webcam images at 2133 on 3 September and at 0054 on 4 September rose as high as 60 m above the crater rim and ejected material onto the upper W flank. Sulfur dioxide flux of 1,730 t/d and 1,281 t/d was measured on 3 and 4 September, respectively, according to data obtained by DOAS equipment.
Strong Strombolian activity and larger gas-and-ash plumes were reported during 18-20 September. On 18 September activity was also associated with energetic LP-type events and notable sulfur dioxide fluxes (as high as 4,277 t/d). On 19 September Strombolian activity and incandescence were observed. On 20 September at 0914 ash emissions rose 50 m above the crater and drifted SSE, accompanied by Strombolian activity that ejected material less than 100 m SSE, causing fall deposits on that respective flank. SERNAGEOMIN reported that a Planet Scope satellite image taken on 20 September showed the lava lake in the crater, measuring 32 m x 35 m and an area of 0.001 km2. Several ash emissions were recorded at 0841, 0910, 1251, 1306, 1312, 1315, and 1324 on 23 September and rose less than 150 m above the crater. The sulfur dioxide flux value was 698 t/d on 23 September and 1,097 t/d on 24 September. On 24 September the Volcanic Alert Level (VAL) was raised to Orange (the third level on a four-color scale). SENAPRED maintained the Alert Level at Yellow (the middle level on a three-color scale) for the communities of Villarrica, Pucón (16 km N), Curarrehue, and Panguipulli.
During 24-25 September there was an increase in seismic energy (observed at TR-events) and acoustic signals, characterized by 1 VT-type event, 213 LP-type events, and 124 TR-type events. Mainly white gas-and-steam emissions, in addition to occasional fine ash emissions were recorded. During the early morning of 25 September Strombolian explosions were reported and ejected material 250 m in all directions, though dominantly toward the NW. On 25 September the average value of sulfur dioxide flux was 760 t/d. Seismicity during 25-30 September consisted of five VT-type events, 1,937 LP-type events, and 456 TR-type events.
During 25-29 September moderate Strombolian activity was observed and ejected material as far as the crater rim. In addition, ash pulses lasting roughly 50 minutes were observed around 0700 and dispersed ENE. During 26-27 September a TR episode lasted 6.5 hours and was accompanied by discrete acoustic signals. Satellite images from 26 September showed a spatter cone on the crater floor with one vent that measured 10 x 14 m and a smaller vent about 35 m NE of the cone. SERNAGEOMIN reported an abundant number of bomb-sized blocks up to 150 m from the crater, as well as impact marks on the snow, which indicated explosive activity. A low-altitude ash emission was observed drifting NW around 1140 on 28 September, based on webcam images. Between 0620 and 0850 on 29 September an ash emission rose 60 m above the crater and drifted NW. During an overflight taken around 1000 on 29 September scientists observed molten material in the vent, a large accumulation of pyroclasts inside the crater, and energetic degassing, some of which contained a small amount of ash. Block-sized pyroclasts were deposited on the internal walls and near the crater, and a distal ash deposit was also visible. The average sulfur dioxide flux measured on 28 September was 344 t/d. Satellite images taken on 29 September ashfall was deposited roughly 3 km WNW from the crater and nighttime crater incandescence remained visible. The average sulfur dioxide flux value from 29 September was 199 t/d. On 30 September at 0740 a pulsating ash emission rose 1.1 km above the crater and drifted NNW (figure 126). Deposits on the S flank extended as far as 4.5 km from the crater rim, based on satellite images from 30 September.
Infrared MODIS satellite data processed by MIROVA (Middle InfraRed Observation of Volcanic Activity) showed intermittent thermal activity during April through September, with slightly stronger activity detected during late September (figure 127). Small clusters of thermal activity were detected during mid-June, early July, early August, and late September. According to the MODVOLC thermal alert system, a total of four thermal hotspots were detected on 7 July and 3 and 23 September. This activity was also intermittently captured in infrared satellite imagery on clear weather days (figure 128).
Geologic Background. The glacier-covered Villarrica stratovolcano, in the northern Lakes District of central Chile, is ~15 km south of the city of Pucon. A 2-km-wide caldera that formed about 3,500 years ago is located at the base of the presently active, dominantly basaltic to basaltic andesite cone at the NW margin of a 6-km-wide Pleistocene caldera. More than 30 scoria cones and fissure vents are present on the flanks. Plinian eruptions and pyroclastic flows that have extended up to 20 km from the volcano were produced during the Holocene. Lava flows up to 18 km long have issued from summit and flank vents. Eruptions documented since 1558 CE have consisted largely of mild-to-moderate explosive activity with occasional lava effusion. Glaciers cover 40 km2 of the volcano, and lahars have damaged towns on its flanks.
Information Contacts: Servicio Nacional de Geología y Minería (SERNAGEOMIN), Observatorio Volcanológico de Los Andes del Sur (OVDAS), Avda Sta María No. 0104, Santiago, Chile (URL: http://www.sernageomin.cl/); Proyecto Observación Villarrica Internet (POVI) (URL: http://www.povi.cl/); Sistema y Servicio Nacional de Prevención y Repuesta Ante Desastres (SENAPRED), Av. Beauchef 1671, Santiago, Chile (URL: https://web.senapred.cl/); Buenos Aires Volcanic Ash Advisory Center (VAAC), Servicio Meteorológico Nacional-Fuerza Aérea Argentina, 25 de mayo 658, Buenos Aires, Argentina (URL: http://www.smn.gov.ar/vaac/buenosaires/inicio.php); MIROVA (Middle InfraRed Observation of Volcanic Activity), a collaborative project between the Universities of Turin and Florence (Italy) supported by the Centre for Volcanic Risk of the Italian Civil Protection Department (URL: http://www.mirovaweb.it/); Hawai'i Institute of Geophysics and Planetology (HIGP) - MODVOLC Thermal Alerts System, School of Ocean and Earth Science and Technology (SOEST), Univ. of Hawai'i, 2525 Correa Road, Honolulu, HI 96822, USA (URL: http://modis.higp.hawaii.edu/); Copernicus Browser, Copernicus Data Space Ecosystem, European Space Agency (URL: https://dataspace.copernicus.eu/browser/).
Merapi (Indonesia) — October 2023 Cite this Report
Merapi
Indonesia
7.54°S, 110.446°E; summit elev. 2910 m
All times are local (unless otherwise noted)
Frequent incandescent avalanches during April-September 2023
Merapi, located just north of the major city of Yogyakarta in central Java, Indonesia, has had activity within the last 20 years characterized by pyroclastic flows and lahars accompanying growth and collapse of the steep-sided active summit lava dome. The current eruption period began in late December 2020 and has more recently consisted of ash plumes, intermittent incandescent avalanches of material, and pyroclastic flows (BGVN 48:04). This report covers activity during April through September 2023, based on information from Balai Penyelidikan dan Pengembangan Teknologi Kebencanaan Geologi (BPPTKG), the Center for Research and Development of Geological Disaster Technology, a branch of PVMBG which specifically monitors Merapi. Additional information comes from the Pusat Vulkanologi dan Mitigasi Bencana Geologi (PVMBG, also known as Indonesian Center for Volcanology and Geological Hazard Mitigation, CVGHM), MAGMA Indonesia, the Darwin Volcanic Ash Advisory Centre (VAAC), and various satellite data.
Activity during April through September 2023 primarily consisted of incandescent avalanches of material that mainly affected the SW and W flanks and traveled as far as 2.3 km from the summit (table 25) and white gas-and-steam emissions that rose 10-1,000 m above the crater.
Table 25. Monthly summary of avalanches and avalanche distances recorded at Merapi during April through September 2023. The number of reported avalanches does not include instances where possible avalanches were heard but could not be visually confirmed as a result of inclement weather. Data courtesy of BPPTKG (April-September 2023 daily reports).
| Month |
Average number of avalanches per day |
Distance avalanches traveled (m) |
| Apr 2023 |
19 |
1,200-2,000 |
| May 2023 |
22 |
500-2,000 |
| Jun 2023 |
18 |
1,200-2,000 |
| Jul 2023 |
30 |
300-2,000 |
| Aug 2023 |
25 |
400-2,300 |
| Sep 2023 |
23 |
600-2,000 |
BPPTKG reported that during April and May white gas-and-steam emissions rose 10-750 m above the crater, incandescent avalanches descended 500-2,000 m on the SW and W flanks (figure 135). Cloudy weather often prevented clear views of the summit, and sometimes avalanches could not be confirmed. According to a webcam image, a pyroclastic flow was visible on 17 April at 0531. During the week of 28 April and 4 May a pyroclastic flow was reported on the SW flank, traveling up to 2.5 km. According to a drone overflight taken on 17 May the SW lava dome volume was an estimated 2,372,800 cubic meters and the dome in the main crater was an estimated 2,337,300 cubic meters.
During June and July similar activity persisted with white gas-and-steam emissions rising 10-350 m above the crater and frequent incandescent avalanches that traveled 300-2,000 m down the SW, W, and S flanks (figure 136). Based on an analysis of aerial photos taken on 24 June the volume of the SW lava dome was approximately 2.5 million cubic meters. A pyroclastic flow was observed on 5 July that traveled 2.7 km on the SW flank. According to the Darwin VAAC multiple minor ash plumes were identified in satellite images on 19 July that rose to 3.7 km altitude and drifted S and SW. During 22, 25, and 26 July a total of 17 avalanches descended as far as 1.8 km on the S flank.
Frequent white gas-and-steam emissions continued during August and September, rising 10-450 m above the crater. Incandescent avalanches mainly affected the SW and W flanks and traveled 400-2,300 m from the vent (figure 137). An aerial survey conducted on 10 August was analyzed and reported that estimates of the SW dome volume was 2,764,300 cubic meters and the dome in the main crater was 2,369,800 cubic meters.
Frequent and moderate-power thermal activity continued throughout the reporting period, according to a MIROVA (Middle InfraRed Observation of Volcanic Activity) analysis of MODIS satellite data (figure 138). There was an increase in the number of detected anomalies during mid-May. The MODVOLC thermal algorithm recorded a total of 47 thermal hotspots: six during April, nine during May, eight during June, 15 during July, four during August, and five during September. Some of this activity was captured in infrared satellite imagery on clear weather days, sometimes accompanied by incandescent material on the SW flank (figure 139).
Geologic Background. Merapi, one of Indonesia's most active volcanoes, lies in one of the world's most densely populated areas and dominates the landscape immediately north of the major city of Yogyakarta. It is the youngest and southernmost of a volcanic chain extending NNW to Ungaran volcano. Growth of Old Merapi during the Pleistocene ended with major edifice collapse perhaps about 2,000 years ago, leaving a large arcuate scarp cutting the eroded older Batulawang volcano. Subsequent growth of the steep-sided Young Merapi edifice, its upper part unvegetated due to frequent activity, began SW of the earlier collapse scarp. Pyroclastic flows and lahars accompanying growth and collapse of the steep-sided active summit lava dome have devastated cultivated lands on the western-to-southern flanks and caused many fatalities.
Information Contacts: Balai Penyelidikan dan Pengembangan Teknologi Kebencanaan Geologi (BPPTKG), Center for Research and Development of Geological Disaster Technology (URL: http://merapi.bgl.esdm.go.id/, Twitter: @BPPTKG); MAGMA Indonesia, Kementerian Energi dan Sumber Daya Mineral (URL: https://magma.esdm.go.id/v1); Pusat Vulkanologi dan Mitigasi Bencana Geologi (PVMBG, also known as Indonesian Center for Volcanology and Geological Hazard Mitigation, CVGHM), Jalan Diponegoro 57, Bandung 40122, Indonesia (URL: http://www.vsi.esdm.go.id/); Darwin Volcanic Ash Advisory Centre (VAAC), Bureau of Meteorology, Northern Territory Regional Office, PO Box 40050, Casuarina, NT 0811, Australia (URL: http://www.bom.gov.au/info/vaac/); MIROVA (Middle InfraRed Observation of Volcanic Activity), a collaborative project between the Universities of Turin and Florence (Italy) supported by the Centre for Volcanic Risk of the Italian Civil Protection Department (URL: http://www.mirovaweb.it/); Hawai'i Institute of Geophysics and Planetology (HIGP) - MODVOLC Thermal Alerts System, School of Ocean and Earth Science and Technology (SOEST), Univ. of Hawai'i, 2525 Correa Road, Honolulu, HI 96822, USA (URL: http://modis.higp.hawaii.edu/); Copernicus Browser, Copernicus Data Space Ecosystem, European Space Agency (URL: https://dataspace.copernicus.eu/browser/); Øystein Lund Andersen (URL: https://www.oysteinlundandersen.com/, https://twitter.com/oysteinvolcano).
Ebeko
Russia
50.686°N, 156.014°E; summit elev. 1103 m
All times are local (unless otherwise noted)
Moderate explosive activity with ash plumes continued during June-November 2023
Ebeko, located on the N end of Paramushir Island in Russia’s Kuril Islands just S of the Kamchatka Peninsula, consists of three summit craters along a SSW-NNE line at the northern end of a complex of five volcanic cones. Observed eruptions date back to the late 18th century and have been characterized as small-to-moderate explosions from the summit crater, accompanied by intense fumarolic activity. The current eruptive period began in June 2022, consisting of frequent explosions, ash plumes, and thermal activity (BGVN 47:10, 48:06). This report covers similar activity during June-November 2023, based on information from the Kamchatka Volcanic Eruptions Response Team (KVERT) and satellite data.
Moderate explosive activity continued during June-November 2023 (figures 50 and 51). According to visual data from Severo-Kurilsk, explosions sent ash 2-3.5 km above the summit (3-4.5 km altitude) during most days during June through mid-September. Activity after mid-September was slightly weaker, with ash usually reaching less than 2 km above the summit. According to KVERT the volcano in October and November was, with a few exceptions, either quiet or obscured by clouds that prevented satellite observations. KVERT issued Volcano Observatory Notices for Aviation (VONA) on 8 and 12 June, 13 and 22 July, 3 and 21 August, and 31 October warning of potential aviation hazards from ash plumes drifting 3-15 km from the volcano. Based on satellite data, KVERT reported a persistent thermal anomaly whenever weather clouds permitted viewing.
Geologic Background. The flat-topped summit of the central cone of Ebeko volcano, one of the most active in the Kuril Islands, occupies the northern end of Paramushir Island. Three summit craters located along a SSW-NNE line form Ebeko volcano proper, at the northern end of a complex of five volcanic cones. Blocky lava flows extend west from Ebeko and SE from the neighboring Nezametnyi cone. The eastern part of the southern crater contains strong solfataras and a large boiling spring. The central crater is filled by a lake about 20 m deep whose shores are lined with steaming solfataras; the northern crater lies across a narrow, low barrier from the central crater and contains a small, cold crescentic lake. Historical activity, recorded since the late-18th century, has been restricted to small-to-moderate explosive eruptions from the summit craters. Intense fumarolic activity occurs in the summit craters, on the outer flanks of the cone, and in lateral explosion craters.
Information Contacts: Kamchatka Volcanic Eruptions Response Team (KVERT), Far Eastern Branch, Russian Academy of Sciences, 9 Piip Blvd., Petropavlovsk-Kamchatsky, 683006, Russia (URL: http://www.kscnet.ru/ivs/kvert/).
Search Bulletin Archive by Publication Date
Select a month and year from the drop-downs and click "Show Issue" to have that issue displayed in this tab.
The default month and year is the latest issue available.
Bulletin of the Global Volcanism Network - Volume 16, Number 04 (April 1991)
Managing Editor: Lindsay McClelland
Aira (Japan)
Continued vigorous explosions
Alcedo (Ecuador)
Sonic activity and felt earthquakes decline; minor changes to hydrothermal system
Arenal (Costa Rica)
Strombolian activity; explosions; lava extrusion
Asamayama (Japan)
Continued steam emission; seismicity increases after 2 months of quiet
Colima (Mexico)
Lava advances down SW flank after partial collapse of summit dome; rock avalanches from flow margins
Fernandina (Ecuador)
Large SO2-rich plumes deposit ash; lava fountains and flows from 1988 vent area
Fukutoku-Oka-no-Ba (Japan)
Water discoloration during one of five overflights
Galeras (Colombia)
Frequent ash emission and seismicity
Gede-Pangrango (Indonesia)
Earthquake swarm
Hakoneyama (Japan)
Brief earthquake swarm in center of caldera
Ijen (Indonesia)
Crater lake changes from gray and bubbling to light green
Kavachi (Solomon Islands)
Submarine eruption builds new island
Kilauea (United States)
Lava breakout from tube system feeds new ocean entry
Klyuchevskoy (Russia)
Small summit plume; ash on SE flank
Kozushima (Japan)
Earthquake swarm but no surface activity
Kusatsu-Shiranesan (Japan)
Continued seismicity
Langila (Papua New Guinea)
Ash emission and glow
Lewotobi (Indonesia)
Brief increase in seismicity
Manam (Papua New Guinea)
Tephra emission from two craters
Merapi (Indonesia)
High-temperature fumaroles; no changes evident to summit dome
Ontakesan (Japan)
Earthquake swarms and tremor; no change in steam emission
Pacaya (Guatemala)
Strombolian activity declines to ash emission as seismicity decreases
Pinatubo (Philippines)
Phreatic explosion devastates 1 km2 forested area; seismicity and gas emission continue; 2,000 evacuated
Poas (Costa Rica)
Increased gas emission; continued seismicity
Rabaul (Papua New Guinea)
Low-level seismicity; minor deflation
Rincon de la Vieja (Costa Rica)
Ash ejection and lahars
Ruiz, Nevado del (Colombia)
Tremor precedes several days of ash emission
Santa Maria (Guatemala)
Strong explosion and pyroclastic flow; continued lava extrusion feeds rock avalanches
Semeru (Indonesia)
Continued explosions and seismicity
Sheveluch (Russia)
Possible new tephra deposit on E flank
Stromboli (Italy)
Explosive activity from a single crater; strong seismicity
Submarine Volcano NNE of Iriomotejima (Japan)
Strong felt seismicity but no surface changes
Taal (Philippines)
Continued seismicity and changes to crater lake
Turrialba (Costa Rica)
New fractures found after major 22 April earthquake
Unzendake (Japan)
Ash emission from two vents; frequent seismicity; lava dome extruded into summit crater
Vulcano (Italy)
Fumarole temperatures increase
Whakaari/White Island (New Zealand)
Renewed ash emission; new collapse pit
Aira
Japan
31.5772°N, 130.6589°E; summit elev. 1117 m
All times are local (unless otherwise noted)
Continued vigorous explosions
Explosive activity has remained at high levels since mid-January, totaling . . . 42 [explosions] in April (the highest monthly total since April 1986), and 15 through 16 May . . . . The explosions caused no damage. The highest April ash cloud rose 3,000 m on the 30th. April ashfall was 187 g/m2 [at KLMO]. Earthquake swarms were recorded on four days, a normal monthly total for the volcano.
Geologic Background. The Aira caldera in the northern half of Kagoshima Bay contains the post-caldera Sakurajima volcano, one of Japan's most active. Eruption of the voluminous Ito pyroclastic flow accompanied formation of the 17 x 23 km caldera about 22,000 years ago. The smaller Wakamiko caldera was formed during the early Holocene in the NE corner of the caldera, along with several post-caldera cones. The construction of Sakurajima began about 13,000 years ago on the southern rim and built an island that was joined to the Osumi Peninsula during the major explosive and effusive eruption of 1914. Activity at the Kitadake summit cone ended about 4,850 years ago, after which eruptions took place at Minamidake. Frequent eruptions since the 8th century have deposited ash on the city of Kagoshima, located across Kagoshima Bay only 8 km from the summit. The largest recorded eruption took place during 1471-76.
Information Contacts: JMA.
Alcedo
Ecuador
0.43°S, 91.12°W; summit elev. 1130 m
All times are local (unless otherwise noted)
Sonic activity and felt earthquakes decline; minor changes to hydrothermal system
Late-April fieldwork revealed continued but diminished sonic activity, no evidence of an eruption, and only minor changes to the volcano's hydrothermal system.
Biologist Milton Friere, working on the island since February, reported that he felt a strong shock, apparently on 9 March at about 1900. Hunters on Santiago Island, 35 km NE of Alcedo, also felt a large earthquake around that time but there is uncertainty about the date and the WWSSN recorded only the 3 March event (16:3). Immediately after the felt earthquake, explosion sounds began to be heard daily at Friere's camp on the caldera's N rim. The initial sounds were the most intense and frequent, then they declined gradually, and by late April were heard only once every few days from the N rim camp. Fewer than 5 earthquakes were felt at the camp until 5 April. Others were documented on 5 April at 1740, 7 April at 1700, and 17 April at 1725. Events of similar intensity may have gone unnoticed during active fieldwork.
While camped on the caldera's S rim during a 23-28 April field survey, Dennis Geist heard eight explosion sounds in 3 days, compared to 2-13 heard daily by Tui DeRoy and Mark Jones in late March (16:3). All were heard in camp, with none noticed during fieldwork. The sounds, consisting of deep rumbling lasting about a second, were likened to thunder generated ~ 10 km away. Although the sounds were clearly directional, each seemed to come from a different direction. None were accompanied by discernible changes in fumarole output, but two were followed 10-15 seconds later by a felt earthquake. The stronger earthquake lasted 5-10 seconds, whereas the weaker one continued for more than 30 seconds after a strong initial jolt.
The seismicity and sonic activity were preceded by the first heavy rains in the Galápagos for several years. Between 26 February and 4 March, 5-10 cm of rain fell daily on Alcedo. Heavy rains also fell on 6, 8, 10, 19, and 30 March, and 10 and 15 April.
Geist noted only subtle changes to the hydrothermal system. Before the 1991 activity, hundreds of fumaroles were distributed around both the southern ring faults and a vent that erupted voluminous rhyolitic pumice and obsidian flows about 90,000 years ago. Fewer than 10 small new fumaroles (identified by remains of recently killed plants) were observed, and no significant increase in total gas output was evident. A large fumarole (called "the Geyser" because it formerly ejected water) may have been somewhat more vigorous than during Geist's previous visits in 1989 and 1983. The vapor plume from this fumarole varied dramatically over periods of hours, and at times there was no visible cloud. No recently formed fissures or fault scarps were observed.
Geologic Background. Alcedo is one of the lowest and smallest of six shield volcanoes on Isabela Island. Much of the flanks and summit caldera are vegetated, but young lava flows are prominent on the N flank near the saddle with Darwin volcano. It is the only Galapagos volcano known to have erupted rhyolite as well as basalt, producing about 1 km3 of late-Pleistocene rhyolitic tephra and lava flows from several vents late in its history. Recent faulting has produced a moat around part of the 7-8 km caldera floor, which is elongated N-S and appears to be migrating to the south. Fewer circumferential fissures occur on Alcedo than on other western Galápagos volcanoes. An eruption attributed to Alcedo in 1954 (Richards, 1957) is more likely to have been from neighboring Sierra Negra (Simkin 1980, pers. comm.). Photo-geologic mapping by K.A. Howard (pers. comm.) revealed only one flow on 30 October 1960 photographs that does not appear on 30 May 1946 photos. That is near Cartago Bay, low on the SE flank, rather than the 610-m, NE-flank elevation listed for the 1954 eruption. An active hydrothermal system is located within the caldera.
Information Contacts: D. Geist, Univ of Idaho.
Arenal (Costa Rica) — April 1991 Cite this Report
Arenal
Costa Rica
10.463°N, 84.703°W; summit elev. 1670 m
All times are local (unless otherwise noted)
Strombolian activity; explosions; lava extrusion
Strombolian activity, with sporadic small explosions, lava extrusion, and voluminous gas emission, continued during April. Tremor, associated with lava extrusion, dominated seismicity during the first half of the month. Following 15 April, the number of explosions increased and tremor diminished.
The following is a report by W. Melson. "From 7 to 17 April, continuous 24 hour/day seismic, sound, and visual observations from the Arenal Observatory . . . revealed that; 1) blocky lava flows are moving down and have covered the S slope to about 900 m elevation. None are now active in the previous long-term channel on the N slopes into the Río Tabacón drainage; one small 200-m-long flow was active on the WNW slope. 2) The level of pyroclastic activity ranged from 3 events/day (10 April) to 46/day (14-15 April) (figure 37). 3) Episodic periods of intense harmonic tremor are common. Compared to 11 other periods of close monitoring, beginning in 1987, the pyroclastic activity is low (figure 38)."
Geologic Background. Conical Volcán Arenal is the youngest stratovolcano in Costa Rica and one of its most active. The 1670-m-high andesitic volcano towers above the eastern shores of Lake Arenal, which has been enlarged by a hydroelectric project. Arenal lies along a volcanic chain that has migrated to the NW from the late-Pleistocene Los Perdidos lava domes through the Pleistocene-to-Holocene Chato volcano, which contains a 500-m-wide, lake-filled summit crater. The earliest known eruptions of Arenal took place about 7000 years ago, and it was active concurrently with Cerro Chato until the activity of Chato ended about 3500 years ago. Growth of Arenal has been characterized by periodic major explosive eruptions at several-hundred-year intervals and periods of lava effusion that armor the cone. An eruptive period that began with a major explosive eruption in 1968 ended in December 2010; continuous explosive activity accompanied by slow lava effusion and the occasional emission of pyroclastic flows characterized the eruption from vents at the summit and on the upper western flank.
Information Contacts: W. Melson, SI; V. Barboza, E. Fernández, J. Barquero, and R. Sáenz, OVSICORI.
Asamayama
Japan
36.406°N, 138.523°E; summit elev. 2568 m
All times are local (unless otherwise noted)
Continued steam emission; seismicity increases after 2 months of quiet
Strong seismicity . . . declined during February and March 1991. Only 19 earthquakes and no tremor episodes were recorded in March. Seismicity increased again 8-18 April and a monthly total of 250 earthquakes and 17 tremor episodes were recorded (figure 13). Steam emission remained unchanged with a plume height of a few hundred meters.
Geologic Background. Asamayama, Honshu's most active volcano, overlooks the resort town of Karuizawa, 140 km NW of Tokyo. The volcano is located at the junction of the Izu-Marianas and NE Japan volcanic arcs. The modern Maekake cone forms the summit and is situated east of the remnant of an older andesitic volcano, Kurofuyama, which was destroyed by a late-Pleistocene landslide about 20,000 years before present (BP). Growth of a dacitic shield volcano was accompanied by pumiceous pyroclastic flows, the largest of which occurred about 14,000-11,000 BP, and by growth of the Ko-Asamayama lava dome on the east flank. Maekake, capped by the Kamayama pyroclastic cone that forms the present summit, is probably only a few thousand years old and has observed activity dating back at least to the 11th century CE. Maekake has had several major Plinian eruptions, the last two of which occurred in 1108 (Asamayama's largest Holocene eruption) and 1783 CE.
Information Contacts: JMA.
Colima
Mexico
19.514°N, 103.62°W; summit elev. 3850 m
All times are local (unless otherwise noted)
Lava advances down SW flank after partial collapse of summit dome; rock avalanches from flow margins
The following is from Ana Lillian Martín del Pozzo and colleagues.
The new summit-dome lobe grew from about 6 m high and 20 m in diameter on 2 March to 36 m high and 109 m across on 14 April, but geodetic measurements on 15 April showed a reduction in its diameter due to the beginning of its emplacement down the SW flank. Seismicity recorded by four portable seismographs increased dramatically beginning on 12 April, saturating records; avalanche signals and both A-and B-type events were detected. Most seismicity after 15 April was related to avalanching (see also seismic data from RESCO instruments reported in 16:03). During the morning of 16 April, avalanching from the dome occurred every 3-5 minutes, increasing to constant landsliding about noon. Large Merapi-type avalanches began around 1515, with maximum intensity between 1700 and 1800. During that time, three distinct plumes were visible: a white gas column, fine gray ash being carried E, and fine-grained material produced by the avalanches. Colima airport was closed because of ashfall, although <5 mm of ash were measured there. Data from four dry-tilt stations N and S of the summit showed <10 µrad of deformation for the period 14-23 April. Weekly spring-water monitoring showed no pH or temperature changes, although sulfate and boron contents varied, having increased before 16 April. Declines in the levels of nearby lakes appear to have been caused by normal withdrawal of irrigation water.
The following is from a Centro Internacional de Ciencias de la Tierra (CICT) team, including geologists and geophysicists from the Universidad de Colima, UNAM, Univ de Guadalajara, Arizona State, and Louisiana State Universities.
Avalanches generated voluminous dilute dust clouds, mainly produced by the crumbling of blocks falling from the dome and the receding crater rim, and by reactivation of previously deposited dust. The component of hot new magma apparently contributed to the seemingly fluidized character of the avalanches [and the resulting Merapi-type block-and-ash flows].
After the partial collapse of the summit-dome lobe, a block lava flow emerged from the SW part of the dome and began to move down the SW flank. The flow, 70 m long and 40 m wide on 18 April, was about 100 m wide and at least 1,150 m long by the morning of 26 April, with its 25-m-thick front at 2,680 m altitude. Dimensions were similar on 18 May, and the flow was widening at its top. Small avalanches occurred from the flow front, from the crater rim adjacent to the flow levees, and from the levees themselves, especially the E levee. Blocks reached about 2,300 m elevation (~4,000 m outward from the summit) during the largest avalanche associated with the 16 April collapse. Dust clouds extended beyond the range of the avalanche blocks, and three canyons of the volcano's main drainage system on the SW and S flanks were filled with avalanche-derived clastic material, mostly very fine powder. This material has not been compacted and has a volume on the order of 106 m3. A lahar warning has been issued for the coming rainy season, which usually begins in early June. Lava extruded from the SW part of the dome was pushing older dome material toward the W and NW. Unstable material was accumulating, and geologists noted that additional avalanches could be expected in those areas.
Winds in the area have dominantly blown toward the SE to NE recently, and some light ashfall has been reported from towns in that sector up to 30 km away. Seismic records showed events with small wave packages that at times seemed to correlate with explosive summit degassing activity, but their number and amplitude were decreasing as of late April.
Observations of the summit area revealed that the 2 July 1987 crater on the E side of the dome (Flores and others, 1987, and 12:07, 13:09, and 15:12) had a ring-like pattern of fumaroles around its rim. A pair of whitish plumes persistently issued from the N part of the zone of lava extrusion, where some incandescence has been observed. Plume heights during similar wind conditions ranged from a few tens of meters to 1,500 m. As of 18 May, the summit-dome lobe was growing toward the edge of the pre-existing W dome. Geologists noted that if activity continues at the same rate, a new block lava flow will begin to develop, probably on the W or NW side of the volcano, in the next 2-3 weeks.
Airborne COSPEC measurements that began 25 April showed SO2 emission rates on the order of 300 t/d, similar to those observed in 1982 by Casadevall and others (1984) and in 1985 by geologists from Dartmouth College. Geologists noted that these stable low levels were consistent with the absence of significant deep seismicity or harmonic tremor and support an interpretation that the present cycle of activity does not include the ascent of significant new magma or magmatic gases from depth.
Alert warnings have been issued and transportation made available for possible evacuation of towns in the risk area, which extends to 12 km on the SW flank. However, geologists noted that no evacuations have occurred, since the volume of rock avalanches was limited to a few hundred thousand m3 and seismicity has remained at relatively low levels, without harmonic tremor or low-frequency earthquakes.
The following, from J.B. Murray, describes ground deformation work 1-7 March.
"Ten kilometers of levelling lines, established in 1982, were measured 1-4 March, as were five of six dry-tilt stations. The 6th, on the W side of the cone, could not be measured, because repeated rock avalanches from the dome made it extremely hazardous to approach this side of the mountain.
"The levelling traverse was last occupied in March 1990, and results show that there have been no large changes since then. There was a slight subsidence of the stations nearest to the summit (just over 1 km from the dome), which have dropped 2.5 cm relative to the farthest stations, 3 km from the summit and outside the caldera. Within the precision of the method, the subsidence appears to be radial to the summit, or perhaps between the summit and the parasitic vent Volcancito (on the upper NE flank).
"The three dry-tilt stations within the caldera all showed tilts to the S over the past year. Those on the Playon (the caldera floor at the NW foot of the active cone) had small tilts of 9 and 15 µrad. The station on Volcancito has tilted 39 µrad, although this value is less reliable because the combination of benchmarks used was different than in 1990. The other two stations (at Nevado de Colima and Barranca La Arena), 6 km N and 9 km S of the summit, were vandalized or otherwise disturbed.
"At first sight these results appear reassuring, as one would expect more pronounced deformation if there were any major increase in magma supply that might be associated with a cataclysmic event. However, caution must be exercised, since (a) ground deformation prior to a major eruption has not been measured at Colima before, and is poorly known on this type of volcano, and (b) the levelling traverse and two of the three dry-tilt stations are N of the volcano where the ground rises toward Nevado de Colima, whereas most of the deformation could be occurring on the unbutressed S flank.
"Many large rock avalanches were seen on 1 March, but from 2 March, the rate declined somewhat. During the levelling 2-4 March, avalanches were noted at the overall rate of 3.2/hour down the N and W sides. From the same area, avalanches were noted at the hourly rate of 1.4 on 29 March-1 April 1990; 0.4 on 4-5 February 1986; and 1.5 on 3-7 December 1982. These figures underplay the 1991 activity, because the avalanches were much larger this year and continued for much longer."
References. Casadevall, T.J., Rose, W.I., Fuller, W., Hunt, W., Hart, M., Moyers, J., Woods, D., Chuan, R., and Friend, J., 1984, Sulfur dioxide and particles in quiescent volcanic plumes from Poás, Arenal, and Colima Volcanoes, Costa Rica and México: JGR, v. 89, no. D6, p. 9633-9641.
Flores, J., and others, 1987, Informes de las recientes observaciones practicadas en el Volcán Colima: Revista del Instituto de Geografía y Estadística, Universidad de Guadalajara, México, v. 3, no. 2.
Further Reference. Rodríguez-Elizarrías, S., Siebe, C., Komorowski, J.-C., Espindola, J., and Saucedo, R., 1991, Field observations of pristine block- and-ash-flow deposits emplaced April 16-17, 1991 at Volcán de Colima, Mexico: JVGR, v. 48, p. 399-412.
Geologic Background. The Colima complex is the most prominent volcanic center of the western Mexican Volcanic Belt. It consists of two southward-younging volcanoes, Nevado de Colima (the high point of the complex) on the north and the historically active Volcán de Colima at the south. A group of late-Pleistocene cinder cones is located on the floor of the Colima graben west and east of the complex. Volcán de Colima (also known as Volcán Fuego) is a youthful stratovolcano constructed within a 5-km-wide scarp, breached to the south, that has been the source of large debris avalanches. Major slope failures have occurred repeatedly from both the Nevado and Colima cones, producing thick debris-avalanche deposits on three sides of the complex. Frequent recorded eruptions date back to the 16th century. Occasional major explosive eruptions have destroyed the summit (most recently in 1913) and left a deep, steep-sided crater that was slowly refilled and then overtopped by lava dome growth.
Information Contacts: Francisco Núñez-Cornú, F.A. Nava, Gilberto Ornelas-Arciniega, Ariel Ramírez-Vázquez, R. Saucedo, G.A. Reyes-Dávila, R. García, Guillermo Castellanos, and Hector Tamez, CICT, Universidad de Colima; S. de la Cruz-Reyna, Z. Jiménez, J.M. Espindola, and Sergio Rodríguez, UNAM; Julián Flores, Instituto de Geografía y Estadística, Univ de Guadalajara; Claus Siebe and J-C. Komorowski, Arizona State Univ, USA; S. Williams, Louisiana State Univ, USA.Ana Lillian Martín del Pozzo, J. Panohaya, F. Sánchez, R. Maciel, and A. Aguayo, Instituto de Geofísica, UNAM; D. Barrera, Centro de Ciencias de la Tierra, Univ de Guadalajara; G. González, Univ Autónoma de Puebla; J.B. Murray, Open Univ, UK.
Fernandina (Ecuador) — April 1991 Cite this Report
Fernandina
Ecuador
0.37°S, 91.55°W; summit elev. 1476 m
All times are local (unless otherwise noted)
Large SO2-rich plumes deposit ash; lava fountains and flows from 1988 vent area
The eruption . . . began on 19 April and ended in the early morning hours of 24 April. It was observed by several groups both on and near Fernandina, providing documentation that is unusually detailed for this uninhabited island volcano.
The start of the eruption was witnessed at about 1300 by Kirstin and Feo Pitcairn while sailing towards Fernandina ~30 km to its N. A "towering column" developed within only a few minutes, and one hour later a second plume, from a source N of the first, was recognized. David Day. . . reported that the main vent was near the base of the ESE caldera wall at the 1988 eruption site, with another vent ~3 km to the NW, also on the main caldera boundary fault and near the easternmost 1978 eruption vent. At 1500, Day, then sailing near Isla Santiago, noted that the leading edge of the cloud had already reached that island's high point, ~ 90 km ENE of its source.
Shortly after 1500, cloud development accelerated. Kirstin Pitcairn described a "big white mushroom cloud above the N plume" and estimated the height of the rapidly rising S plume at 4-6 km. Day described the distant cloud as building slowly after 1510, and both observers remarked on the increased density of the ash cloud. At 1535 a new plume joined the other two, nearer the S plume, and rose very rapidly, but the S plume remained dominant and Pitcairn saw pink coloration to its top in daytime. Starting about 1600, ash fell at Cabo Hammond, on Fernandina's SW corner, where Markus Horning and assistants were studying fur seals. Ashfall was continuous for 3 hours and intermittent until about 2230, with an estimated accumulation of 5-10 mm for the full eruption. At 2015 Horning first heard noise from the eruption, a strong continuous rumbling without booms or explosions, that continued until well after midnight. A single explosion was heard by Milton Friere, 50 km E on Volcán Alcedo, at 1630 ( ± 15 minutes).
At 1830 David Day, then 110 km ESE, saw "the first of 3 large dark clouds punch up quickly above the low cloud covering Isabela . . . over a 10-minute period," and estimated the cloud height at 3-4 km.
That night the Pitcairns watched and videotaped the eruption from Punta Espinoza on Fernandina's NE coast. They described a varying spectacle including "flame-shaped jets shooting high into the billowing column," alternation of brightness between the two main plumes, and cessation of the central plume at 2043. At Cabo Hammond, Horning routinely measured incident light intensity at sea level every night, and his readings indicated maximum light emission/reflection that night from about 2000 to 2200. He noted that this was the only night in which glow from two vents was visible (only the S vent being active in later nights). Although it was a dark night (new moon 14 April), the peak glow corresponded to roughly 2/3 the light measured on clear full-moon nights.
The eruption was quieter on the early morning of 20 April, but zoologists N.P. and M.J. Ashmole, also at Espinoza, described renewed activity around 0845, including audible explosions, ash, and reappearance of the central column. On the opposite corner of the island, Horning experienced a heavy, dense fog that obscured the summit, but he heard strong explosions at 0857 and 1116. The Pitcairns described a huge dark cloud forming at 0910, and in late morning they sailed W to circle the island, but encountered heavy ashfall off the WNW coast. At 1152 the Nimbus-7 . . . TOMS instrument measured a strong SO2 plume to the SW, with the greatest concentration 500-600 km SSW and trace values to the W. A preliminary estimate of the total mass of SO2 was 1.7 x 10⁵ metric tons. The combination of ash and aerosol that stung the eyes caused the Pitcairn group to turn back about 1500. Ashfall increased to the N in late afternoon, and they experienced (decreasing) ashfall all the way back to Punta Espinoza. Very little ash fell at Cabo Hammond.
Activity had declined by the morning of 21 April, with only the S plume continuing and at decreased height. By mid-morning the summit was obscured by low cloud cover, but at 1120 Pitcairn saw all three plumes active (although the N one was small). From the summit of Sierra Negra, 65 km SE of Fernandina, David Day photographed "a medium-size eruption cloud" at noon. At the same time, however, the TOMS instrument detected virtually no SO2 over Galápagos but a low concentration 600 km W, on the equator. That night, Day sailed around Isabela and briefly saw faint glow over Fernandina as he approached it from the S.
On the morning of 22 April, . . . Day landed at NW Fernandina and noted 1 mm of fresh ash. At about 1040, while still low on the NW flank, he heard roaring from the vent, then roughly 12 km distant. This apparently marked a renewal of activity, for the TOMS instrument measured a strong concentration of SO2 immediately over Fernandina at 1046. Day reached the rim at 1730 and described 50-100-m fountains from the 1988 vent area, low on the opposite caldera wall. Fresh aa flows covered an estimated 80% of the low caldera floor, with only the higher lobes of the 1988 debris avalanches still visible. Most flows were to the NW, but a smaller flow went W below the SE bench. The aforementioned northerly vent, on the E side of the NW bench, had fed "a small flow" to join the others on the NW floor, and fumarolic activity was vigorous at the vent.
Day reported that the eruption continued with the same intensity all night, and the next day he explored to the S, finding that the maximum thickness of new tephra on the W rim was 1 cm at a point WNW of the main vent. Pele's hair was "fairly abundant." On this day (23 April), the GOES satellite detected a 105-km plume at 0900 that grew to 320 km SSW at 1300 and had dissipated by 1600 (16:3). At 1103 the TOMS instrument detected a strong SO2 concentration ~ 90 km SW and lower values to ~ 225 km SW; a preliminary estimate of the total mass was ~4 x 10⁴ metric tons. Day was on the S rim of the caldera at 1205, when he saw "a mass of landslides round and above the main vent" that was immediately followed by increased activity at the vent. Fountain height increased by almost 50% and his group (~ 3 km SW of the vent) experienced light scoria fall 10 minutes later that lasted for 15 minutes. Noise and fountaining, after almost ceasing, resumed at 2006 that evening and Day saw additional flareups at 2019, 2037, and 2100. Day observed a small flow NW from the main vent from 2100 to 2122, with no noise, but reported no further observations or sounds overnight.
Horning had reached the SW rim at 1700 and watched the S vent continue producing lava until at least 0100 on 24 April, but it had ceased by 0530. Day also noted no activity between dawn and his leaving the rim at 0630 that morning. Horning's SW-rim camp received 1 mm or less of ash overnight, but when they returned to their coastal camp that evening ~ 1-2 mm had accumulated in their absence. No glow was observed during the nights of 24 and 25 April.
Geologist Dennis Geist was on the summit of Alcedo from 24 April and reported that the only sign of a Fernandina eruption was a small (~ 3 km diameter) white cloud above the caldera. No glow was observed that night, either from Alcedo or N of the volcano (where Day was sailing around N Isabela). The small white cloud persisted over Fernandina at least until 27 April when Geist left Alcedo.
Geologic Background. Fernandina, the most active of Galápagos volcanoes and the one closest to the Galápagos mantle plume, is a basaltic shield volcano with a deep 5 x 6.5 km summit caldera. The volcano displays the classic "overturned soup bowl" profile of Galápagos shield volcanoes. Its caldera is elongated in a NW-SE direction and formed during several episodes of collapse. Circumferential fissures surround the caldera and were instrumental in growth of the volcano. Reporting has been poor in this uninhabited western end of the archipelago, and even a 1981 eruption was not witnessed at the time. In 1968 the caldera floor dropped 350 m following a major explosive eruption. Subsequent eruptions, mostly from vents located on or near the caldera boundary faults, have produced lava flows inside the caldera as well as those in 1995 that reached the coast from a SW-flank vent. Collapse of a nearly 1 km3 section of the east caldera wall during an eruption in 1988 produced a debris-avalanche deposit that covered much of the caldera floor and absorbed the caldera lake.
Information Contacts: D. Day, Isla Santa Cruz; F. Pitcairn and K. Pitcairn, Bryn Athyn, PA, USA; M. Horning, Seeweisen, Germany; S. Doiron, GSFC; N. Ashmole and M. Ashmole, Univ of Edinburgh, Scotland; D. Geist, Univ of Idaho, USA.
Fukutoku-Oka-no-Ba (Japan) — April 1991 Cite this Report
Fukutoku-Oka-no-Ba
Japan
24.285°N, 141.481°E; summit elev. -29 m
All times are local (unless otherwise noted)
Water discoloration during one of five overflights
A blue water discoloration, extending 2 km E-W, was observed during a 6 February overflight by the JMSA. Overflights on 18 January, 12 March, 15 April, and 10 May revealed no abnormal water.
Geologic Background. Fukutoku-Oka-no-ba is a submarine volcano located 5 km NE of the island of Minami-Ioto. Water discoloration is frequently observed, and several ephemeral islands have formed in the 20th century. The first of these formed Shin-Ioto ("New Sulfur Island") in 1904, and the most recent island was formed in 1986. The volcano is part of an elongated edifice with two major topographic highs trending NNW-SSE, and is a trachyandesitic volcano geochemically similar to Ioto.
Information Contacts: JMA.
Galeras
Colombia
1.22°N, 77.37°W; summit elev. 4276 m
All times are local (unless otherwise noted)
Frequent ash emission and seismicity
Following the pattern begun in March, activity continued to increase during April, when ash emissions from the main crater and associated seismicity were very frequent (table 5). Fieldwork revealed new fissures and vents on the crater's W wall, increases in the area of incandescence, and slumping of loose material. Analyses of gas samples from Deformes and Besolima fissure fumaroles suggest an increasingly magmatic composition. At Calvache fumarole, the ratio of CO2/SO2 has increased steadily (figure 36), while H2S and HCl have shown no significant variations. Besolima fissure fumarole temperatures continued to decline, from 514°C in March to 468°C on 2 April.
Table 5. Eruptive activity and associated seismicity at Galeras, 1-19 April 1991. Atmospheric conditions prevented direct observations 20-30 April. "Inc" means increased, column heights are in meters, and durations are in seconds.
| Date |
Time |
Activity |
Column height |
Signal Type |
Signal Duration |
| 01 Apr 1991 |
0640 |
Ash emission |
-- |
Long-period |
34 s |
| 01 Apr 1991 |
0905 |
Inc sulfur odor |
-- |
Tremor |
1800 s |
| 02 Apr 1991 |
0620 |
Inc column size |
300 m |
Tremor |
159 s |
| 02 Apr 1991 |
0711 |
Ash emission |
900 m |
Tremor |
275 s |
| 02 Apr 1991 |
1014 |
Ash emission |
-- |
Tremor |
116 s |
| 02 Apr 1991 |
1029 |
Ash emission |
-- |
Long-period |
42 s |
| 03 Apr 1991 |
0741 |
Ash emission |
-- |
Tremor |
89 s |
| 05 Apr 1991 |
0500 |
Inc noise |
-- |
Tremor |
475 s |
| 06 Apr 1991 |
0002 |
Inc incandescence |
-- |
Tremor |
182 s |
| 07 Apr 1991 |
1757 |
Ash emission |
700 m |
Long-period |
52 s |
| 07 Apr 1991 |
1823 |
Ash emission |
500 m |
Tremor |
140 s |
| 08 Apr 1991 |
1717 |
Ash emission |
-- |
Tremor |
135 s |
| 09 Apr 1991 |
1827 |
Ash emission |
400 m |
Tremor |
130 s |
| 10 Apr 1991 |
0608 |
Ash emission |
1100 m |
Tremor |
89 s |
| 10 Apr 1991 |
0644 |
Ash emission |
200 m |
Tremor |
71 s |
| 10 Apr 1991 |
1010 |
Ash emission |
700 m |
Tremor |
230 s |
| 10 Apr 1991 |
1643 |
Inc noise |
-- |
Tremor |
110 s |
| 10 Apr 1991 |
1820 |
Ash emission |
-- |
Long-period |
50 s |
| 10 Apr 1991 |
1820 |
Inc noise |
-- |
Long-period |
61 s |
| 10 Apr 1991 |
1820 |
Inc incandescence |
-- |
Tremor |
165 s |
| 10 Apr 1991 |
1916 |
Ash emission |
-- |
Long-period |
30 s |
| 11 Apr 1991 |
0320 |
Ash emission, inc incandescence |
-- |
Tremor |
170 s |
| 11 Apr 1991 |
0324 |
Ash emission |
-- |
Long-period |
17 s |
| 11 Apr 1991 |
0324 |
Inc incandescence |
-- |
Long-period |
29 s |
| 11 Apr 1991 |
0605 |
Ash emission |
200 m |
Long-period |
44 s |
| 11 Apr 1991 |
0611 |
Ash emission |
400 m |
Long-period |
58 s |
| 11 Apr 1991 |
1508 |
Ash emission |
-- |
Tremor |
131 s |
| 11 Apr 1991 |
1758 |
Ash emission |
1700 m |
Tremor |
120 s |
| 11 Apr 1991 |
1836 |
Ash emission |
200 m |
Long-period |
26 s |
| 11 Apr 1991 |
1841 |
Ash emission |
800 m |
Tremor |
115 s |
| 12 Apr 1991 |
0806 |
Ash emission |
-- |
Tremor |
295 s |
| 12 Apr 1991 |
0826 |
Ash emission |
-- |
Tremor |
250 s |
| 12 Apr 1991 |
0854 |
Ash emission |
-- |
Long-period |
46 s |
| 13 Apr 1991 |
0359 |
Ash emission |
-- |
Tremor |
625 s |
| 13 Apr 1991 |
0555 |
Inc column size |
500 m |
Tremor |
260 s |
| 13 Apr 1991 |
0622 |
Inc column size |
400 m |
Long-period |
20 s |
| 13 Apr 1991 |
0658 |
Ash emission |
400 m |
Long-period |
50 s |
| 13 Apr 1991 |
0958 |
Ash emission, inc noise |
-- |
Tremor |
91 s |
| 14 Apr 1991 |
0632 |
Ash emission |
800 m |
Tremor |
83 s |
| 14 Apr 1991 |
0735 |
Ash emission |
1100 m |
Tremor |
130 s |
| 14 Apr 1991 |
0808 |
Ash emission |
700 m |
Long-period |
56 s |
| 14 Apr 1991 |
0845 |
Ash emission, explosions, inc sulfur odor |
1500 m |
Tremor |
179 s |
| 15 Apr 1991 |
0757 |
Ash emission |
1500 m |
Tremor |
137 s |
| 15 Apr 1991 |
1355 |
Ash emission, explosions |
-- |
Long-period; tremor |
380 s |
| 15 Apr 1991 |
1509 |
Ash emission, explosions |
-- |
Tremor |
82 s |
| 15 Apr 1991 |
1921 |
Ash emission, inc incandescence |
-- |
Tremor |
130 s |
| 16 Apr 1991 |
0559 |
Ash emission |
-- |
Tremor |
111 s |
| 16 Apr 1991 |
0711 |
Ash emission |
-- |
Long-period |
40 s |
| 16 Apr 1991 |
0815 |
Ash emission |
800 m |
Long-period |
34 s |
| 16 Apr 1991 |
0835 |
Ash emission |
1500 m |
Tremor |
600 s |
| 16 Apr 1991 |
1004 |
Ash emission |
1500 m |
Tremor |
171 s |
| 16 Apr 1991 |
1107 |
Ash emission |
-- |
Tremor |
145 s |
| 17 Apr 1991 |
0711 |
Ash emission |
-- |
Long-period |
47 s |
| 17 Apr 1991 |
0740 |
Ash emission |
-- |
Long-period |
57 s |
| 17 Apr 1991 |
0752 |
Ash emission |
-- |
Tremor |
122 s |
| 17 Apr 1991 |
1742 |
Ash emission |
-- |
Tremor |
205 s |
| 17 Apr 1991 |
1802 |
Ash emission |
-- |
Tremor |
370 s |
| 17 Apr 1991 |
1948 |
Ash emission |
-- |
Tremor |
1500 s |
| 18 Apr 1991 |
0706 |
Ash emission |
-- |
Tremor |
190 s |
| 18 Apr 1991 |
0918 |
Ash emission |
-- |
Long-period |
70 s |
| 19 Apr 1991 |
0627 |
Ash emission |
-- |
Long-period |
21 s |
| 19 Apr 1991 |
0728 |
Ash emission |
-- |
Tremor |
76 s |
| 19 Apr 1991 |
0855 |
Ash emission |
-- |
Tremor |
180 s |
A significant increase in high-frequency seismicity was recorded during the second half of April, including swarms of events on the 18th and 29th. The earthquakes (M<=2.9) were mostly located SSW of the crater at 1-5 km depth (figure 37). Long-period seismicity was at high levels, and the daily reduced displacement on 13 April was the highest recorded since monitoring began in February 1989 (figure 38). The amplitudes and durations of tremor pulses fluctuated; deep tremor and low-frequency, modulating tremor were also recorded.
The electronic tiltmeter 0.9 km E of the crater (at "Crater" station) showed continued inflation, with 85 and 48 µrad of accumulated tangential and radial inflation, respectively, since September 1990 (figure 39). Three km E of the crater, dry tilt (El Pintado station) showed very low, but consistent inflation. Geologists interpreted the inflation as volcanic deformation or neotectonic tilt along the Buesaco fault.
Geologic Background. Galeras, a stratovolcano with a large breached caldera located immediately west of the city of Pasto, is one of Colombia's most frequently active volcanoes. The dominantly andesitic complex has been active for more than 1 million years, and two major caldera collapse eruptions took place during the late Pleistocene. Long-term extensive hydrothermal alteration has contributed to large-scale edifice collapse on at least three occasions, producing debris avalanches that swept to the west and left a large open caldera inside which the modern cone has been constructed. Major explosive eruptions since the mid-Holocene have produced widespread tephra deposits and pyroclastic flows that swept all but the southern flanks. A central cone slightly lower than the caldera rim has been the site of numerous small-to-moderate eruptions since the time of the Spanish conquistadors.
Information Contacts: INGEOMINAS-OVP.
Gede-Pangrango (Indonesia) — April 1991 Cite this Report
Gede-Pangrango
Indonesia
6.786°S, 106.983°E; summit elev. 3026 m
All times are local (unless otherwise noted)
Earthquake swarm
A swarm of 100 volcanic earthquakes (40 deep and 60 shallow) was recorded on 29 April, an increase from the previous daily average of 10-15 events. Tectonic earthquakes averaged 1-2/day. Seismicity had been increasing since February. No surface activity was observed.
Geologic Background. The two peaks of the Gede-Pangrango volcanic complex overlook the major cities of Cianjur, Sukabumi, and Bogor, situated to the E, S, and NW, respectively. The summit of Gunung Pangrango, constructed over the NE rim of a 3 x 5 km caldera, forms the high point. Many lava flows are visible on the flanks of the younger Gunung Gede to the SE of Pangrango. The steep-walled summit crater has migrated about 1 km NNW over time. Two large debris-avalanche deposits are present on its flanks, one of which underlies the city of Cianjur. Activity recorded since the 16th century has typically consisted of small short explosive eruptions.
Information Contacts: W. Modjo, VSI.
Hakoneyama
Japan
35.233°N, 139.021°E; summit elev. 1438 m
All times are local (unless otherwise noted)
Brief earthquake swarm in center of caldera
A swarm of ~300 earthquakes (M <= 2.5) was recorded between 1000 and 1300 on 22 April. Several of the earthquakes, located at 5 km depth in the central part of the caldera, were felt by area residents. Seismicity gradually declined, and had returned to normal by 24 April. No changes in surface activity were observed. Earthquake swarms have been recorded about once a year, including one in August 1990 (M <= 5.1), at the volcano's E foot. Hakone erupted phreatically about 3,000 years ago, and many fumaroles and hot springs remain active.
Geologic Background. Hakoneyama volcano is truncated by two overlapping calderas, the largest of which is 10 x 11 km wide. The calderas were formed as a result of two major explosive eruptions about 180,000 and 49,000-60,000 years ago. Scenic Lake Ashi lies between the SW caldera wall and a half dozen post-caldera lava domes that were constructed along a NW-SE trend cutting through the center of the calderas. Dome growth occurred progressively to the NW, and the largest and youngest of these, Kamiyama, forms the high point. The calderas are breached to the east by the Hayakawa canyon. A phreatic explosion about 3000 years ago was followed by collapse of the NW side of Kamiyama, damming the Hayakawa valley and creating Lake Ashi. The latest magmatic eruptive activity about 2900 years ago produced a pyroclastic flow and a lava dome in the explosion crater, although phreatic eruptions took place as recently as the 12-13th centuries CE. Seismic swarms have occurred during the 20th century. Lake Ashi, along with the thermal areas in the caldera, is a popular resort destination SW of Tokyo.
Information Contacts: JMA.
Ijen
Indonesia
8.058°S, 114.242°E; summit elev. 2769 m
All times are local (unless otherwise noted)
Crater lake changes from gray and bubbling to light green
The crater lake (45°C) was light green in March and April, a change from its previous gray color, when large bubbles were visible on the surface. A total of one deep and two shallow volcanic earthquakes and one tectonic event were recorded. Tremor was recorded on 25, 26, and 28 March.
Geologic Background. The Ijen volcano complex at the eastern end of Java consists of a group of small stratovolcanoes constructed within the 20-km-wide Ijen (Kendeng) caldera. The north caldera wall forms a prominent arcuate ridge, but elsewhere the rim was buried by post-caldera volcanoes, including Gunung Merapi, which forms the high point of the complex. Immediately west of the Gunung Merapi stratovolcano is the historically active Kawah Ijen crater, which contains a nearly 1-km-wide, turquoise-colored, acid lake. Kawah Ijen is the site of a labor-intensive mining operation in which baskets of sulfur are hand-carried from the crater floor. Many other post-caldera cones and craters are located within the caldera or along its rim. The largest concentration of cones forms an E-W zone across the southern side of the caldera. Coffee plantations cover much of the caldera floor; nearby waterfalls and hot springs are tourist destinations.
Information Contacts: W. Modjo, VSI.
Kavachi (Solomon Islands) — April 1991 Cite this Report
Kavachi
Solomon Islands
8.991°S, 157.979°E; summit elev. -20 m
All times are local (unless otherwise noted)
Submarine eruption builds new island
A newly emergent volcanic island near previously active Kavachi was observed ejecting lava and ash during a helicopter overflight on 4 May. John Starcy (Australian High Commissioner, Honiara, Solomon Islands) reported that "the volcanic action had already formed a thick rim of black material above sea level, inside which a large body of molten lava was churning and spewing out rocks." At the time, the island was estimated to be ~300x150 m in diameter and ~30 m high, with a lava pond ~50 m in diameter. Red Marsden (a Rabaul-based pilot) flew over the volcano on 12 May. The island had a regular conical shape that he estimated was ~15-20 m high. The volcano continued to eject incandescent lava fragments and some dark material to ~50 m height. White vapor emission occurred between ejections, and considerable steam rose from along the water line. Activity continued as of 13 May and the size of the cone continued to increase.
The location of the new island remains uncertain (figure 5) [but more precise navigation linked it to Kavachi; see 16:7]. It was reported at 8.88°S, 157.88°E, 20 km NW of Kavachi, by Starcy, and ~38 km SW of Kavachi (at 9.23°S, 157.70°E; within the Woodlark Basin) by Ted Tame (Rabaul representative of the Papua New Guinea National Disaster and Emergency Services). A submarine volcano was shown on Admiralty Chart 3995 at ~25 km W of Kavachi (at 9.0°S, 157.8°E), between the two reported positions, but the Machias 1981 bathymetry survey failed to find this feature (Exon and Johnson, 1986). Instead, the survey located a bathymetric high 10 km to the WNW that is probably a southward-trending ridge originating on Tetepare Island.
Reference. Exon, N.E., and Johnson, R.W., 1986, The elusive Cook volcano and other submarine forearc volcanoes in the Solomon Islands: BMR Journal of Australian Geology & Geophysics, v. 10, p. 77-83.
Geologic Background. Named for a sea-god of the Gatokae and Vangunu peoples, Kavachi is located in the Solomon Islands south of Vangunu Island. Sometimes referred to as Rejo te Kvachi ("Kavachi's Oven"), this shallow submarine basaltic-to-andesitic volcano has produced ephemeral islands up to 1 km long many times since its first recorded eruption during 1939. Residents of the nearby islands of Vanguna and Nggatokae (Gatokae) reported "fire on the water" prior to 1939, a possible reference to earlier eruptions. The roughly conical edifice rises from water depths of 1.1-1.2 km on the north and greater depths to the SE. Frequent shallow submarine and occasional subaerial eruptions produce phreatomagmatic explosions that eject steam, ash, and incandescent bombs. On a number of occasions lava flows were observed on the ephemeral islands.
Information Contacts: G. Wheller, CSIRO, Australia; C. McKee, RVO.
Kilauea (United States) — April 1991 Cite this Report
Kilauea
United States
19.421°N, 155.287°W; summit elev. 1222 m
All times are local (unless otherwise noted)
Lava breakout from tube system feeds new ocean entry
Lava . . . continued to enter the ocean . . . on the W side of the flow field through April (figure 77). The tube supplying lava to the coast divided just above the sea cliff. Its W branch fed a single entry site, where repeated collapse of the fragile lower lava bench caused nearly continuous explosive activity in early April. Bench collapse episodes left the lava tube perched in the sea cliff, and lava poured into the ocean in an arching stream. The explosive activity built a littoral cone >3 m high that was >90% covered by spatter. The two entry sites fed by the tube's E branch have built a large bench below the (pre-autumn 1990) sea cliff.
In mid-April, lava broke out of the tube system near 150 m (500 ft) elevation, generating a large pahoehoe flow that was diverted E by 1990 and 1991 flows and reached the ocean ~1.5 km E of the W entry sites. By 22 April, it had built a new bench below the sea cliff, and had an active front ~300 m wide that extended no more than 20 m offshore. Lava continued to pour into the sea until the beginning of May, when only three sluggish streams of lava were observed at the ocean front. Behind the active entry, small viscous surface flows broke out from the main flow. Despite the apparently diminished supply of lava to the E entry, large volumes of lava continued to flow into the sea at the W entry sites in early May. Surface flows, noted during April along the tube system between ~430 and 340 m (1,400-1,100 ft) elevation, covered a previously lava-free area (kipuka) on the W side of the flow field.
Skylights in the tube system at the base of Kupaianaha shield revealed lava velocities of ~1.5 m/s in late April. The uppermost skylight, at ~620 m (2,050 ft) elevation, was fuming heavily, but very little degassing was occurring from the vicinity of Kupaianaha and its former lava pond, which remained sealed through the month. Three kilometers uprift, the lava pond in the base of Pu`u `O`o crater, ~60 m below the rim, remained active through April. The pond covered less than half of the crater floor, but sometimes overflowed onto more. The walls of Pu`u `O`o remained unstable and collapse continued.
Since the intrusive swarm seismicity in late March seismic activity has returned to lower levels. Low-amplitude volcanic tremor continued along the East rift zone, with some variability at stations near Kupaianaha and Pu`u `O`o. Increases in summit-area microearthquakes were recorded 9-10, 14, and 26-27 April, but events were very small and did not appear to be associated with changes in eruptive activity.
Geologic Background. Kilauea overlaps the E flank of the massive Mauna Loa shield volcano in the island of Hawaii. Eruptions are prominent in Polynesian legends; written documentation since 1820 records frequent summit and flank lava flow eruptions interspersed with periods of long-term lava lake activity at Halemaumau crater in the summit caldera until 1924. The 3 x 5 km caldera was formed in several stages about 1,500 years ago and during the 18th century; eruptions have also originated from the lengthy East and Southwest rift zones, which extend to the ocean in both directions. About 90% of the surface of the basaltic shield volcano is formed of lava flows less than about 1,100 years old; 70% of the surface is younger than 600 years. The long-term eruption from the East rift zone between 1983 and 2018 produced lava flows covering more than 100 km2, destroyed hundreds of houses, and added new coastline.
Information Contacts: T. Moulds and P. Okubo, HVO.
Klyuchevskoy (Russia) — April 1991 Cite this Report
Klyuchevskoy
Russia
56.056°N, 160.642°E; summit elev. 4754 m
All times are local (unless otherwise noted)
Small summit plume; ash on SE flank
A Space Shuttle photograph on 29 April at 1248 shows a plume, apparently containing ash, rising about 1 km above the summit and extending about 15 km downwind. Snow on the SE flank appeared to be ash-covered. A small summit eruption occurred on 8 April, but no additional eruptive activity has been reported.
Geologic Background. Klyuchevskoy is the highest and most active volcano on the Kamchatka Peninsula. Since its origin about 6,000 years ago, this symmetrical, basaltic stratovolcano has produced frequent moderate-volume explosive and effusive eruptions without major periods of inactivity. It rises above a saddle NE of Kamen volcano and lies SE of the broad Ushkovsky massif. More than 100 flank eruptions have occurred during approximately the past 3,000 years, with most lateral craters and cones occurring along radial fissures between the unconfined NE-to-SE flanks of the conical volcano between 500 and 3,600 m elevation. Eruptions recorded since the late 17th century have resulted in frequent changes to the morphology of the 700-m-wide summit crater. These eruptions over the past 400 years have originated primarily from the summit crater, but have also included numerous major explosive and effusive eruptions from flank craters.
Information Contacts: C. Evans, Lockheed, Houston.
Kozushima
Japan
34.219°N, 139.153°E; summit elev. 572 m
All times are local (unless otherwise noted)
Earthquake swarm but no surface activity
An earthquake swarm (M <= 4.0) occurred from 2100 to 2400 on 23 April, with seismicity gradually returning to normal levels by the following day. Many of the earthquakes were felt by residents (to JMA intensity IV). Swarm events were centered from the W coast to 20 km SW of the island (figure 1), at 0-10 km depth. No surface activity was reported.
Geologic Background. A cluster of rhyolitic lava domes and associated pyroclastic deposits form the 4 x 6 km island of Kozushima in the northern Izu Islands. The island is the exposed summit of a larger submarine edifice more than 20 km long that lies along the Zenisu Ridge, one of several en-echelon ridges oriented NE-SW, transverse to the trend of the northern Izu arc. The youngest and largest of the 18 lava domes, Tenjosan, occupies the central portion of the island. Most of the older domes, some of which are Holocene in age, flank Tenjosan to the north, although late-Pleistocene domes are also found at the southern end of the island. A lava flow may have reached the sea during an eruption in 832 CE. The Tenjosan dome was formed during a major eruption in 838 CE that also produced pyroclastic flows and surges. Earthquake swarms took place during the 20th century.
Information Contacts: JMA.
Kusatsu-Shiranesan (Japan) — April 1991 Cite this Report
Kusatsu-Shiranesan
Japan
36.618°N, 138.528°E; summit elev. 2165 m
All times are local (unless otherwise noted)
Continued seismicity
In April, seismicity remained similar to previous months, with a total of 110 earthquakes and one tremor episode recorded... (figure 5). No surface activity was observed.
Geologic Background. The Kusatsu-Shiranesan complex, located immediately north of Asama volcano, consists of a series of overlapping pyroclastic cones and three crater lakes. The andesitic-to-dacitic volcano was formed in three eruptive stages beginning in the early to mid-Pleistocene. The Pleistocene Oshi pyroclastic flow produced extensive welded tuffs and non-welded pumice that covers much of the E, S, and SW flanks. The latest eruptive stage began about 14,000 years ago. Historical eruptions have consisted of phreatic explosions from the acidic crater lakes or their margins. Fumaroles and hot springs that dot the flanks have strongly acidified many rivers draining from the volcano. The crater was the site of active sulfur mining for many years during the 19th and 20th centuries.
Information Contacts: JMA.
Langila (Papua New Guinea) — April 1991 Cite this Report
Langila
Papua New Guinea
5.525°S, 148.42°E; summit elev. 1330 m
All times are local (unless otherwise noted)
Ash emission and glow
"Activity declined in early April . . . . Emissions from Crater 2 consisted of moderate to weak white-grey ash and vapour. An explosion on 3 April produced a dark ash column that rose ~500 m above the crater and resulted in ashfall on the NW side of the volcano. Steady weak red glow from the crater was observed on most nights. Following the first few days of stronger seismicity, when up to four explosion earthquakes/day were recorded, the seismicity declined and on most days no explosion events were recorded."
Geologic Background. Langila, one of the most active volcanoes of New Britain, consists of a group of four small overlapping composite basaltic-andesitic cones on the lower E flank of the extinct Talawe volcano in the Cape Gloucester area of NW New Britain. A rectangular, 2.5-km-long crater is breached widely to the SE; Langila was constructed NE of the breached crater of Talawe. An extensive lava field reaches the coast on the N and NE sides of Langila. Frequent mild-to-moderate explosive eruptions, sometimes accompanied by lava flows, have been recorded since the 19th century from three active craters at the summit. The youngest and smallest crater (no. 3 crater) was formed in 1960 and has a diameter of 150 m.
Information Contacts: C. McKee, RVO.
Lewotobi (Indonesia) — April 1991 Cite this Report
Lewotobi
Indonesia
8.542°S, 122.775°E; summit elev. 1703 m
All times are local (unless otherwise noted)
Brief increase in seismicity
A sudden increase in seismicity, from 7 to 60 earthquakes/day, was recorded at the end of March. Activity peaked on 26 March, then gradually decreased. No changes in surface activity were observed.
Geologic Background. The Lewotobi edifice in eastern Flores Island is composed of the two adjacent Lewotobi Laki-laki and Lewotobi Perempuan stratovolcanoes (the "husband and wife"). Their summits are less than 2 km apart along a NW-SE line. The conical Laki-laki to the NW has been frequently active during the 19th and 20th centuries, while the taller and broader Perempuan has had observed eruptions in 1921 and 1935. Small lava domes have grown during the 20th century in both of the summit craters, which are open to the north. A prominent cone, Iliwokar, occurs on the E flank of Perampuan.
Information Contacts: W. Modjo, VSI.
Manam (Papua New Guinea) — April 1991 Cite this Report
Manam
Papua New Guinea
4.08°S, 145.037°E; summit elev. 1807 m
All times are local (unless otherwise noted)
Tephra emission from two craters
"The increased activity at Main Crater in late March continued until mid-April, then declined. However, Southern Crater then became more active.
"Main Crater emissions consisted of weak to moderate white-grey ash and vapour with occasional thin blue vapour from 1 to 14 April. Emission clouds reached heights of 180-1,000 m above the crater rim. Light ashfall was noted 5 km downwind on 4 April. Deep roaring noises were heard on most days during this period. Weak red glow was seen above the crater 1-11 April, with some incandescent lava ejections on the 4th.
"Southern Crater activity increased for the first time since August 1990. From about mid-April, emissions consisted of weak to moderate white-grey vapour and ash. Light ashfalls were reported 23 and 25 April on the E side of the volcano, ~5 km from the summit. Low rumbling noises associated with the vapour and ash emissions were heard on 16 and 23-25 April.
"The seismograph at Manam became inoperable from 8 April. Before this time, seismic amplitudes remained at about the same level as at the end of March (~3x normal levels), although the daily totals of recorded volcanic shocks dropped from ~550 to 100. Tiltmeter measurements showed a slight radial deflation of ~1.5 µrad."
Geologic Background. The 10-km-wide island of Manam, lying 13 km off the northern coast of mainland Papua New Guinea, is one of the country's most active volcanoes. Four large radial valleys extend from the unvegetated summit of the conical basaltic-andesitic stratovolcano to its lower flanks. These valleys channel lava flows and pyroclastic avalanches that have sometimes reached the coast. Five small satellitic centers are located near the island's shoreline on the northern, southern, and western sides. Two summit craters are present; both are active, although most observed eruptions have originated from the southern crater, concentrating eruptive products during much of the past century into the SE valley. Frequent eruptions, typically of mild-to-moderate scale, have been recorded since 1616. Occasional larger eruptions have produced pyroclastic flows and lava flows that reached flat-lying coastal areas and entered the sea, sometimes impacting populated areas.
Information Contacts: C. McKee, RVO.
Merapi
Indonesia
7.54°S, 110.446°E; summit elev. 2910 m
All times are local (unless otherwise noted)
High-temperature fumaroles; no changes evident to summit dome
No changes were visible at the summit dome, whose volume remained at ~6.8 x 10⁶ m3. Diffuse to dense gas plumes rose to 450 m above the summit. Temperatures of 832 and 543°C were measured at the dome's Gendol and Woro solfataras, respectively. The temperature measured through cracks in the 1956 lava was 86°C on 20 April. There was no significant change in seismicity, although the weekly number of volcanic earthquakes briefly rose to 17 during the second week in April from the long-term average of 1-4. One multiphase event and 3-10 tectonic earthquakes were recorded/week.
Geologic Background. Merapi, one of Indonesia's most active volcanoes, lies in one of the world's most densely populated areas and dominates the landscape immediately north of the major city of Yogyakarta. It is the youngest and southernmost of a volcanic chain extending NNW to Ungaran volcano. Growth of Old Merapi during the Pleistocene ended with major edifice collapse perhaps about 2,000 years ago, leaving a large arcuate scarp cutting the eroded older Batulawang volcano. Subsequent growth of the steep-sided Young Merapi edifice, its upper part unvegetated due to frequent activity, began SW of the earlier collapse scarp. Pyroclastic flows and lahars accompanying growth and collapse of the steep-sided active summit lava dome have devastated cultivated lands on the western-to-southern flanks and caused many fatalities.
Information Contacts: W. Modjo, VSI.
Ontakesan
Japan
35.893°N, 137.48°E; summit elev. 3067 m
All times are local (unless otherwise noted)
Earthquake swarms and tremor; no change in steam emission
Three earthquake swarms (20, 23, and 27 April) and four tremor episodes (27-28 April and 2 May) were recorded during late April-early May. The strongest swarm, on 20 April, lasted a few hours and included a M 1.6 event. None of the shocks were felt, and it was not possible to locate them accurately, but they were believed to be in the summit area. The 27 April tremor episode was the largest (table 1), and accompanying seismicity was the strongest registered (figure 5), since installation of the current seismometer, in July 1988.
Table 1. Tremor episodes recorded at On-take, 15 July 1988-11 May 1991.
| Date |
Time |
Amplitude (N) |
Duration (min) |
| 02 Oct 1988 |
0132 |
0.1 |
1 |
| 06 Oct 1988 |
1035 |
0.1 |
1 |
| 12 Jan 1989 |
1725 |
0.6 |
1 |
| 19 Aug 1989 |
1313 |
0.4 |
2 |
| 11 Apr 1990 |
1808 |
0.2 |
2 |
| 27 Apr 1991 |
0716 |
2.3 |
4 |
| 27 Apr 1991 |
1201 |
0.1 |
2 |
| 28 Apr 1991 |
1309 |
1.4 |
3 |
| 02 May 1991 |
0938 |
0.3 |
3 |
White steam emissions, unchanged from previous months (figure 6), rose 200 m from summit vents formed during a small phreatic eruption in October 1979. That eruption emitted ash for 1 day; steam emission declined, but has remained steady since then.
A M 6.8 earthquake, 12 km SE of the summit on 14 September 1984, triggered a landslide on the S slope of the volcano that killed 29 people. Aftershocks were distributed on the volcano's S flank in an elliptical zone that may mark a 20-km-long WSW-ENE fault (figure 7). Steam emission and surface activity were unchanged by the 1984 earthquake.
Geologic Background. The massive Ontakesan stratovolcano, the second highest volcano in Japan, lies at the southern end of the Northern Japan Alps. Ascending this volcano is one of the major objects of religious pilgrimage in central Japan. It is constructed within a largely buried 4 x 5 km caldera and occupies the southern end of the Norikura volcanic zone, which extends northward to Yakedake volcano. The older volcanic complex consisted of at least four major stratovolcanoes constructed from about 680,000 to about 420,000 years ago, after which Ontakesan was inactive for more than 300,000 years. The broad, elongated summit of the younger edifice is cut by a series of small explosion craters along a NNE-trending line. Several phreatic eruptions post-date the roughly 7300-year-old Akahoya tephra from Kikai caldera. The first historical eruption took place in 1979 from fissures near the summit. A non-eruptive landslide in 1984 produced a debris avalanche and lahar that swept down valleys south and east of the volcano. Very minor phreatic activity caused a dusting of ash near the summit in 1991 and 2007. A significant phreatic explosion in September 2014, when a large number of hikers were at or near the summit, resulted in many fatalities.
Information Contacts: JMA.
Pacaya
Guatemala
14.382°N, 90.601°W; summit elev. 2569 m
All times are local (unless otherwise noted)
Strombolian activity declines to ash emission as seismicity decreases
In comparison with observations made in early February (16:02), visits to the volcano in mid-March-early April revealed a decrease in eruptive activity. A small vent with night glow on the W flank (50 m below the summit), periodically the source of incandescent lava fragments that rolled down the upper flank, had disappeared by 21 March. Strombolian activity from a cinder cone in the W quarter of MacKenney Cone's 1987 crater ejected material to 100-150 m height. The number of explosions declined from about 20 to 1-2/hour over the mid March-early April observation period, and during the first week of April, the primary ejecta changed from lava spatter to ash. Some collapse occurred on the cone's interior walls. Two explosions, observed during a 3-hour period on 10 April, emitted ash clouds hundreds of meters high. Lava flow activity, prominent from mid-November through February (15:11-12 and 16:02), declined, and ceased entirely by 10 April. A decrease in seismicity, coincident with the decrease of eruptive activity, began about 1 April and continued as of 19 April.
Geologic Background. Eruptions from Pacaya are frequently visible from Guatemala City, the nation's capital. This complex basaltic volcano was constructed just outside the southern topographic rim of the 14 x 16 km Pleistocene Amatitlán caldera. A cluster of dacitic lava domes occupies the southern caldera floor. The post-caldera Pacaya massif includes the older Pacaya Viejo and Cerro Grande stratovolcanoes and the currently active Mackenney stratovolcano. Collapse of Pacaya Viejo between 600 and 1,500 years ago produced a debris-avalanche deposit that extends 25 km onto the Pacific coastal plain and left an arcuate scarp inside which the modern Pacaya volcano (Mackenney cone) grew. The NW-flank Cerro Chino crater was last active in the 19th century. During the past several decades, activity has consisted of frequent Strombolian eruptions with intermittent lava flow extrusion that has partially filled in the caldera moat and covered the flanks of Mackenney cone, punctuated by occasional larger explosive eruptions that partially destroy the summit.
Information Contacts: Otoniel Matías and Rodolfo Morales, Sección de Vulcanología, INSIVUMEH; Michael Conway, Michigan Technological Univ, Houghton, USA; P. Vetsch, SVG, Switzerland; Thierry Basset, Univ de Genève, Switzerland; Alan Deino, Berkeley Geochronology Laboratory, Institute of Human Origins, USA.
Pinatubo (Philippines) — April 1991 Cite this Report
Pinatubo
Philippines
15.13°N, 120.35°E; summit elev. 1486 m
All times are local (unless otherwise noted)
Phreatic explosion devastates 1 km2 forested area; seismicity and gas emission continue; 2,000 evacuated
The following includes a more detailed account of events reported in 16:3.
On 2 April, an explosion at the E end of Pinatubo's geothermal area (about 1.5 km NW of the summit and 2/3 of the way down the flank) ejected clouds of steam and minor quantities of ash to 500-800 m height. Ash fell 2 km away, primarily to the NW and SW, and covered an area of about 10,000 m2, including part of one village, from which about 2,000 people were evacuated. No injuries or deaths were reported. The ash was composed of sub-angular material, none of which was freshly vesiculated, with a mineralogy of plagioclase, hornblende, small amounts of biotite, and possible quartz. About 1 km2 of forested land was devastated by the explosion, extending about 500 m from the explosion site, and leaves and vegetation were stripped over several square kilometers. Downed trees were preferentially oriented N.
Following the explosion, an ENE-WSW-trending line (roughly 1 km long at 1,100-1,350 m elevation - summit elevation is 1,745 m) of new fumaroles with six main vents had developed. The most intense activity was located at the W end of the line, while the blast site, at the E end of the line, had ceased activity (figure 2). Vent emissions, voluminous and at extremely high pressure, consisted mainly of steam, with an H2S odor and an associated gray haze. Plumes (~200-500 m high in mid- to late-April, 100-300 m high in early May) were carried W by the prevailing wind, onto a zone of dead and dying vegetation. Respiratory and eye irritation forced about 5,000 W-flank residents to leave the area. Increased discharge from springs near the fumaroles caused rapid downward erosion in stream beds, and muddy water was reported in the N drainages.
A seismometer installed on 5 April recorded 223 high-frequency volcano-tectonic earthquakes over a 24-hour period (figure 3). Seismicity rapidly decreased, with 50-90 events recorded/day 8 April-10 May (the seismometer did not function 6-8 April). Earthquake location became possible on 6 May with the completion of a seismic network at the volcano. During the first few days of operation, earthquakes were centered [~4-8 km NW] of the summit at 3-6 km depth, and had magnitudes of 0.1-1.5 (averaging about M 1.0). The events all had the same first motions, suggesting that they had the same focal mechanisms. Seismicity increased on 10 May (167 recorded earthquakes/day) and remained high as of 12 May (120-150/day). No long-period events have been recorded.
Deformation measurements on the NW slope have not shown evidence of inflation.
The center of the Pinatubo geothermal area, previously the site of several low-discharge acid-sulfate springs and three steaming sulfur-depositing fumaroles (>90°C), was located within a crater-like structure largely related to collapse. Geologists believe that some of the breccias in the structure's wall are probably of hydrothermally explosive origin. "Numerous alleged eruptive activities have been reported in the area."
Geologic Background. Prior to 1991 Pinatubo volcano was a relatively unknown, heavily forested lava dome complex located 100 km NW of Manila with no records of historical eruptions. The 1991 eruption, one of the world's largest of the 20th century, ejected massive amounts of tephra and produced voluminous pyroclastic flows, forming a small, 2.5-km-wide summit caldera whose floor is now covered by a lake. Caldera formation lowered the height of the summit by more than 300 m. Although the eruption caused hundreds of fatalities and major damage with severe social and economic impact, successful monitoring efforts greatly reduced the number of fatalities. Widespread lahars that redistributed products of the 1991 eruption have continued to cause severe disruption. Previous major eruptive periods, interrupted by lengthy quiescent periods, have produced pyroclastic flows and lahars that were even more extensive than in 1991.
Information Contacts: R. Punongbayan, PHIVOLCS; Chris Newhall, USGS Reston; John Ewert, CVO; David Sussman and Areberto Arevalo, Philippine Geothermal Inc., Manila.
Poas
Costa Rica
10.2°N, 84.233°W; summit elev. 2697 m
All times are local (unless otherwise noted)
Increased gas emission; continued seismicity
Gas emission increased in April. Fumaroles burned sulfur, produced loud jet-engine noises, and ejected small amounts of gray sediment that covered the W base of the crater. Acid rain continued to be a problem on the W flank of the volcano; rainwater pH was 3.4 at Cerro Pelón (2.5 km SW).
Seismicity levels in April were similar to March, with an average of 266 low-frequency earthquakes recorded/day (average frequency 2.2 Hz) and a monthly total of 26 high-frequency events (figure 37). Low-frequency tremor was recorded up to 22 hours/day on 20-21 April.
Geologic Background. The broad vegetated edifice of Poás, one of the most active volcanoes of Costa Rica, contains three craters along a N-S line. The frequently visited multi-hued summit crater lakes of the basaltic-to-dacitic volcano are easily accessible by vehicle from the nearby capital city of San José. A N-S-trending fissure cutting the complex stratovolcano extends to the lower N flank, where it has produced the Congo stratovolcano and several lake-filled maars. The southernmost of the two summit crater lakes, Botos, last erupted about 7,500 years ago. The more prominent geothermally heated northern lake, Laguna Caliente, is one of the world's most acidic natural lakes, with a pH of near zero. It has been the site of frequent phreatic and phreatomagmatic eruptions since an eruption was reported in 1828. Eruptions often include geyser-like ejections of crater-lake water.
Information Contacts: E. Fernández, V. Barboza, and J. Barquero, OVSICORI.
Rabaul (Papua New Guinea) — April 1991 Cite this Report
Rabaul
Papua New Guinea
4.2459°S, 152.1937°E; summit elev. 688 m
All times are local (unless otherwise noted)
Low-level seismicity; minor deflation
"Seismicity remained at a low level in April. The month's total number of earthquakes was 126 . . . with daily totals ranging from 0 to 19. Thirteen earthquakes were locatable and were distributed on the NW and W sides of the caldera seismic zone. Levelling measurements carried out between 8 March and 23 April showed 4 mm of subsidence at the SE end of Matupit Island."
Geologic Background. The low-lying Rabaul caldera on the tip of the Gazelle Peninsula at the NE end of New Britain forms a broad sheltered harbor utilized by what was the island's largest city prior to a major eruption in 1994. The outer flanks of the asymmetrical shield volcano are formed by thick pyroclastic-flow deposits. The 8 x 14 km caldera is widely breached on the east, where its floor is flooded by Blanche Bay and was formed about 1,400 years ago. An earlier caldera-forming eruption about 7,100 years ago is thought to have originated from Tavui caldera, offshore to the north. Three small stratovolcanoes lie outside the N and NE caldera rims. Post-caldera eruptions built basaltic-to-dacitic pyroclastic cones on the caldera floor near the NE and W caldera walls. Several of these, including Vulcan cone, which was formed during a large eruption in 1878, have produced major explosive activity during historical time. A powerful explosive eruption in 1994 occurred simultaneously from Vulcan and Tavurvur volcanoes and forced the temporary abandonment of Rabaul city.
Information Contacts: C. McKee, RVO.
Rincon de la Vieja (Costa Rica) — April 1991 Cite this Report
Rincon de la Vieja
Costa Rica
10.83°N, 85.324°W; summit elev. 1916 m
All times are local (unless otherwise noted)
Ash ejection and lahars
A [phreatomagmatic] eruption at 1015-1025 on 8 May ejected small quantities of [ash, bombs, blocks, and mud, and produced small lahars]. Gray lahars with a sulfur odor traveled N down the Río Pénjamo and Azul systems, destroying the forest along the rivers and two small bridges, and cutting off access to the towns of Buenos Aires (12 km NE) and Gavilán. At the distal end of the lahars, 15 km from the summit, the deposits reached 2 m in thickness, and covered the surface for several hundred meters on both sides of the Pénjamo river channels. Following passage of the lahars, the rivers were milky and had high acidity. The eruption followed two smaller explosive events on 6 and 7 May, but no other seismic precursors were recorded.
Geologic Background. Rincón de la Vieja, the largest volcano in NW Costa Rica, is a remote volcanic complex in the Guanacaste Range. The volcano consists of an elongated, arcuate NW-SE-trending ridge constructed within the 15-km-wide early Pleistocene Guachipelín caldera, whose rim is exposed on the south side. Sometimes known as the "Colossus of Guanacaste," it has an estimated volume of 130 km3 and contains at least nine major eruptive centers. Activity has migrated to the SE, where the youngest-looking craters are located. The twin cone of Santa María volcano, the highest peak of the complex, is located at the eastern end of a smaller, 5-km-wide caldera and has a 500-m-wide crater. A Plinian eruption producing the 0.25 km3 Río Blanca tephra about 3,500 years ago was the last major magmatic eruption. All subsequent eruptions, including numerous historical eruptions possibly dating back to the 16th century, have been from the prominent active crater containing a 500-m-wide acid lake located ENE of Von Seebach crater.
Information Contacts: R. Barquero, ICE; J. Barquero and R. Sáenz, OVSICORI.
Nevado del Ruiz (Colombia) — April 1991 Cite this Report
Nevado del Ruiz
Colombia
4.892°N, 75.324°W; summit elev. 5279 m
All times are local (unless otherwise noted)
Tremor precedes several days of ash emission
An increase in the number of tremor pulses preceded several days of ash emission at the end of April. Lithic and crystalline ash (<2 mm in diameter) was reported W of the volcano in Pereira (40 km from the summit), Santa Rosa de Cabal (35 km), Chinchiná (35 km), and Manizales (25 km), and NE of the volcano in Mariquita (55 km). High- and low-frequency seismicity was generally at low levels in April, with a slight increase in released energy from low-frequency events. The monthly average SO2 flux, measured by COSPEC, was ~2,740 t/d, up from 2,233 t/d in March.
Geologic Background. Nevado del Ruiz is a broad, glacier-covered volcano in central Colombia that covers more than 200 km2. Three major edifices, composed of andesitic and dacitic lavas and andesitic pyroclastics, have been constructed since the beginning of the Pleistocene. The modern cone consists of a broad cluster of lava domes built within the caldera of an older edifice. The 1-km-wide, 240-m-deep Arenas crater occupies the summit. The prominent La Olleta pyroclastic cone located on the SW flank may also have been active in historical time. Steep headwalls of massive landslides cut the flanks. Melting of its summit icecap during historical eruptions, which date back to the 16th century, has resulted in devastating lahars, including one in 1985 that was South America's deadliest eruption.
Information Contacts: C. Carvajal, INGEOMINAS, Manizales.
Santa Maria (Guatemala) — April 1991 Cite this Report
Santa Maria
Guatemala
14.757°N, 91.552°W; summit elev. 3745 m
All times are local (unless otherwise noted)
Strong explosion and pyroclastic flow; continued lava extrusion feeds rock avalanches
Quoted material is a report from the Santiaguito Volcano Observatory.
"At 0903 on 10 April, a powerful pyroclastic eruption shook El Caliente vent. The eruption produced a vertical plume that rose 3.5 km above the vent, and a pyroclastic flow that moved a few kilometers down the Río Nimá II. Ash blanketed the area immediately SW to a maximum thickness of 1-2 mm, and noticeable ashfall was observed at Retalhuleu [25 km SSW]. The ash consisted of comminuted dacite, gray to black volcanic glass, plagioclase, and quartz. This eruption marked the first major pyroclastic event at Santiaguito since 23 November 1990 and could signal an increase in hazardous pyroclastic activity similar to the period April-November 1990. Seismic activity increased significantly during the final week of March, following a period of relative quiescence from January through mid-March (figure 20)."
Smaller pyroclastic events, observed during fieldwork 24-27 March and 11-13 April, lasted about 4-7 minutes and were separated by tens of minutes to >1 hour. Eruptive plumes ranged from black to white and rose 500-1,500 m. On 11 April, observers measured a 20° initial eastward inclination of the explosion clouds, and plume heights of 3,000 m. The source of the explosions had migrated about 150-200 m NNE from the summit, which continued to degas quietly.
Numerous avalanches, with 150-400 recorded daily by seismometers (figure 20), occurred on the E flank of the volcano, sometimes accompanied by loud summit explosions. The block lava flow erupting from the E summit of Caliente continued to flow slowly (<100 m/month), with frequent collapses of the flow front sending block-and-ash debris avalanching [into] the Río Nimá II [drainage].
Geologic Background. Symmetrical, forest-covered Santa María volcano is part of a chain of large stratovolcanoes that rise above the Pacific coastal plain of Guatemala. The sharp-topped, conical profile is cut on the SW flank by a 1.5-km-wide crater. The oval-shaped crater extends from just below the summit to the lower flank, and was formed during a catastrophic eruption in 1902. The renowned Plinian eruption of 1902 that devastated much of SW Guatemala followed a long repose period after construction of the large basaltic andesite stratovolcano. The massive dacitic Santiaguito lava-dome complex has been growing at the base of the 1902 crater since 1922. Compound dome growth at Santiaguito has occurred episodically from four vents, with activity progressing E towards the most recent, Caliente. Dome growth has been accompanied by almost continuous minor explosions, with periodic lava extrusion, larger explosions, pyroclastic flows, and lahars.
Information Contacts: Otoniel Matías and Rodolfo Morales, INSIVUMEH; Michael Conway, Michigan Technological Univ; P. Vetsch, SVG, Switzerland; Thierry Basset, Univ de Genève, Switzerland.
Semeru
Indonesia
8.108°S, 112.922°E; summit elev. 3657 m
All times are local (unless otherwise noted)
Continued explosions and seismicity
Explosions continued during April, with column heights averaging 300-400 m, and explosion earthquakes recorded an average of 112 times/day . . . . Seismographs also recorded 2-3 daily avalanches of material off the lava flow erupted 17 February. A total of one deep volcanic earthquake and 18 tectonic events were recorded.
Geologic Background. Semeru, the highest volcano on Java, and one of its most active, lies at the southern end of a volcanic massif extending north to the Tengger caldera. The steep-sided volcano, also referred to as Mahameru (Great Mountain), rises above coastal plains to the south. Gunung Semeru was constructed south of the overlapping Ajek-ajek and Jambangan calderas. A line of lake-filled maars was constructed along a N-S trend cutting through the summit, and cinder cones and lava domes occupy the eastern and NE flanks. Summit topography is complicated by the shifting of craters from NW to SE. Frequent 19th and 20th century eruptions were dominated by small-to-moderate explosions from the summit crater, with occasional lava flows and larger explosive eruptions accompanied by pyroclastic flows that have reached the lower flanks of the volcano.
Information Contacts: W. Modjo, VSI.
Sheveluch
Russia
56.653°N, 161.36°E; summit elev. 3283 m
All times are local (unless otherwise noted)
Possible new tephra deposit on E flank
After the 8 April explosive eruption, satellite images showed an apparent narrow zone of tephra deposited SE from the summit to the coast. The NOAA 10 polar orbiter showed a second, similar deposit on 9 May at 1000, extending E from the summit then turning SE to parallel the 8 April material. . . .
Geologic Background. The high, isolated massif of Sheveluch volcano (also spelled Shiveluch) rises above the lowlands NNE of the Kliuchevskaya volcano group. The 1,300 km3 andesitic volcano is one of Kamchatka's largest and most active volcanic structures, with at least 60 large eruptions during the Holocene. The summit of roughly 65,000-year-old Stary Shiveluch is truncated by a broad 9-km-wide late-Pleistocene caldera breached to the south. Many lava domes occur on its outer flanks. The Molodoy Shiveluch lava dome complex was constructed during the Holocene within the large open caldera; Holocene lava dome extrusion also took place on the flanks of Stary Shiveluch. Widespread tephra layers from these eruptions have provided valuable time markers for dating volcanic events in Kamchatka. Frequent collapses of dome complexes, most recently in 1964, have produced debris avalanches whose deposits cover much of the floor of the breached caldera.
Information Contacts: W. Gould, NOAA/NESDIS.
Stromboli
Italy
38.789°N, 15.213°E; summit elev. 924 m
All times are local (unless otherwise noted)
Explosive activity from a single crater; strong seismicity
Explosive activity was at low levels from January through March, seldom exceeding the long-term average of six recorded explosions/hour (figure 11). Visits to the summit on 30 March and 9 April revealed that activity was restricted to Crater 1, and that the small cone 1 in Crater 3 had collapsed, forming a glowing red vent. The number of earthquakes exceeding instrument saturation level was quite high from the end of January to the beginning of February (~30/day), and 11-17 March (~19/day; figure 12). Average tremor amplitude returned to normal following a low in December.
Geologic Background. Spectacular incandescent nighttime explosions at Stromboli have long attracted visitors to the "Lighthouse of the Mediterranean" in the NE Aeolian Islands. This volcano has lent its name to the frequent mild explosive activity that has characterized its eruptions throughout much of historical time. The small island is the emergent summit of a volcano that grew in two main eruptive cycles, the last of which formed the western portion of the island. The Neostromboli eruptive period took place between about 13,000 and 5,000 years ago. The active summit vents are located at the head of the Sciara del Fuoco, a prominent scarp that formed about 5,000 years ago due to a series of slope failures which extends to below sea level. The modern volcano has been constructed within this scarp, which funnels pyroclastic ejecta and lava flows to the NW. Essentially continuous mild Strombolian explosions, sometimes accompanied by lava flows, have been recorded for more than a millennium.
Information Contacts: M. Riuscetti, Univ di Udine.
Submarine Volcano NNE of Iriomotejima (Japan) — April 1991 Cite this Report
Submarine Volcano NNE of Iriomotejima
Japan
24.57°N, 123.93°E; summit elev. -200 m
All times are local (unless otherwise noted)
Strong felt seismicity but no surface changes
High levels of seismicity . . . suddenly declined in late April (figure 1). A total of 670 high-frequency earthquakes were felt by the end of April, including nine of JMA intensity IV, and a M 4.3 event on 31 March. The swarm was centered on the NW coast of the island (figure 2) at 0-10 km depth (the majority at ~5 km). No surface phenomena (steaming, bubbling, or water discoloration) were found despite frequent patrolling over the island and adjacent sea area by JMSA aircraft.
Geologic Background. The southernmost Ryukyu Islands volcano is a shallow submarine volcano 20 km NNE of Iriomotejima island and 35 km WSW of the northern tip of the island of Ishigakishima in an area with an estimated depth of 200-300 m. A major submarine eruption on 31 October 1924 produced rhyolitic pumice rafts with an estimated volume of about 1 km3 that were carried by currents along both coasts of Japan as far north as Hokkaido. The largest pumice blocks exceeded 1 x 2 m in size, and the volume of ejecta places this poorly known eruption among the largest recorded in Japan.
Information Contacts: JMA.
Taal
Philippines
14.0106°N, 120.9975°E; summit elev. 311 m
All times are local (unless otherwise noted)
Continued seismicity and changes to crater lake
High seismicity continued as of early May, with the daily number of earthquakes varying from 15 to 30 (figure 4). Felt earthquakes reached intensity IV. Acidity and chloride content of the volcano's crater lake continued to fluctuate, ranging from 2.4-2.8 and 9,630-11,720 ppm, respectively. Lake temperature increased slightly from 30° to 31°C, and lake level rose by 4 cm.
On 26 April, strong bubbling and increased steaming were observed in the N sector of the crater and at the base of the wall. Geysering, to 1.2 m height, was also noted near the NNE shore of the lake, where water temperatures of 99°C were measured.
Deformation measurements on Taal Volcano Island have found no inflation or swelling of the volcanic edifice.
Volcano Island has been partly evacuated since 23 March, but a small number of residents have remained, particularly near the PHIVOLCS station at the N end of the island.
Geologic Background. Taal is one of the most active volcanoes in the Philippines and has produced some powerful eruptions. The 15 x 20 km Talisay (Taal) caldera is largely filled by Lake Taal, whose 267 km2 surface lies only 3 m above sea level. The maximum depth of the lake is 160 m, with several submerged eruptive centers. The 5-km-wide Volcano Island in north-central Lake Taal is the location of all observed eruptions. The island is composed of coalescing small stratovolcanoes, tuff rings, and scoria cones. Powerful pyroclastic flows and surges have caused many fatalities.
Information Contacts: R. Punongbayan, PHIVOLCS.
Turrialba (Costa Rica) — April 1991 Cite this Report
Turrialba
Costa Rica
10.025°N, 83.767°W; summit elev. 3340 m
All times are local (unless otherwise noted)
New fractures found after major 22 April earthquake
Shortly after the [M 7.6] earthquake on 22 April [85 km WSW], numerous small concentric fractures were found along the S and SW rims of the central crater and the W rim of the main crater. Small landslides continued on the S, SW, and N walls of the main crater, and fumarole temperatures remained at 89°C.
Geologic Background. Turrialba, the easternmost of Costa Rica's Holocene volcanoes, is a large vegetated basaltic-to-dacitic stratovolcano located across a broad saddle NE of Irazú volcano overlooking the city of Cartago. The massive edifice covers an area of 500 km2. Three well-defined craters occur at the upper SW end of a broad 800 x 2200 m summit depression that is breached to the NE. Most activity originated from the summit vent complex, but two pyroclastic cones are located on the SW flank. Five major explosive eruptions have occurred during the past 3500 years. A series of explosive eruptions during the 19th century were sometimes accompanied by pyroclastic flows. Fumarolic activity continues at the central and SW summit craters.
Information Contacts: E. Fernández, V. Barboza, and J. Barquero, OVSICORI.
Unzendake
Japan
32.761°N, 130.299°E; summit elev. 1483 m
All times are local (unless otherwise noted)
Ash emission from two vents; frequent seismicity; lava dome extruded into summit crater
Frequent, almost continuous, ash emissions (500 m high) continued in April from two vents. In mid-April, the most intense activity switched from Byobu-iwa vent . . . to Jigoku-ato vent . . . . No earthquake swarms were recorded in April, but seismicity remained high. A total of 733 earthquakes was recorded and 27 felt . . . compared to 734 recorded and 21 felt in March. Most of the events were located a few kilometers W of Fugen-dake peak . . . . The number of tremor episodes increased in April (181, compared to 99 in March), as did amplitudes and durations (figure 16).
A swarm of microearthquakes, the first since July 1990, began 13 May and continued as of 17 May. Ash emissions were at low levels during this period. Heavy rains on recently fallen tephra caused lahars in at least one flank valley. The press reported that more than 1,200 people were evacuated on 19 May. A lava dome was extruded into the summit crater before dawn on 21 May. Small ash emissions occurred from the dome and fissures exposed its interior.
Geologic Background. The massive Unzendake volcanic complex comprises much of the Shimabara Peninsula east of the city of Nagasaki. An E-W graben, 30-40 km long, extends across the peninsula. Three large stratovolcanoes with complex structures, Kinugasa on the north, Fugen-dake at the east-center, and Kusenbu on the south, form topographic highs on the broad peninsula. Fugendake and Mayuyama volcanoes in the east-central portion of the andesitic-to-dacitic volcanic complex have been active during the Holocene. The Mayuyama lava dome complex, located along the eastern coast west of Shimabara City, formed about 4000 years ago and was the source of a devastating 1792 CE debris avalanche and tsunami. Historical eruptive activity has been restricted to the summit and flanks of Fugendake. The latest activity during 1990-95 formed a lava dome at the summit, accompanied by pyroclastic flows that caused fatalities and damaged populated areas near Shimabara City.
Information Contacts: JMA; H. Glicken, Tokyo Metropolitan Univ; AP.
Vulcano
Italy
38.404°N, 14.962°E; summit elev. 500 m
All times are local (unless otherwise noted)
Fumarole temperatures increase
Observations at "La Fossa" crater in recent years have included changes in fumarole temperatures and chemical compositions, ground deformation, and opening of new fractures. Data collected since a systematic surveillance program began in 1977 have allowed geologists to identify different stages during which changing contributions of magmatic gases and water caused fluctuating fumarole outputs. The interaction of heat rising from depth with shallow aquifers has produced changes in water vaporization and pressure as the heat/water ratio varied.
Only minor crater activity occurred until 1987, probably because of the constraints imposed by a limited fracture system on the thermal input. Since then, a sharp change has been observed, with ground inflation and significant increases in the maximum temperature and water concentration of emitted fluids.
In 1990, a further increase in the maximum temperature (to 620°C) and decrease in water contents of fumarole fluids were interpreted as a consequence of increased heat flow, causing significant aquifer depletion (15:08).
The most recent (April 1991) observations indicate that fumarole temperatures are again increasing, and significant vaporization as well as new inflation can be expected. Geologists noted that the long-lasting instability of La Fossa's NW sector could result in some form of collapse that could create problems for the local community.
Further References. Falsaperla, S., Frazzetta, G., Neri, G., Nunnari, G., Velardita, R., and Villari, L., 1989, Volcano monitoring in the Aeolian Islands (southern Tyrrhenian Sea): the Lipari-Vulcano eruptive complex, in Latter, J.H., ed., Volcanic Hazards: Assessment and Monitoring: Springer-Verlag, p. 339-356.
Martini, M., 1989, The forecasting significance of chemical indicators in areas of quiescent volcanism: examples from Vulcano and Phlegrean Fields (Italy), in Latter, J.H., ed., Volcanic Hazards: Assessment and Monitoring: Springer-Verlag, p. 372-383.
Martini, M., Giannini, L., Buccianti, A., Prati, F., Legittimo, P.C., Iozelli, P., and Capaccioni, B., 1991, 1980-1990: Ten years of geochemical investigation at Phlegrean Fields (Italy): Journal of Volcanology and Geothermal Research, v. 48, p. 161-171.
Martini, M., Giannini, L., and Capaccioni, B., 1991, Geochemical and seismic precursors of volcanic activity: Acta Vulcanologia, v. 1, p. 7-11.
Martini, M., Giannini, L., and Capaccioni, B., 1991, The influence of water on chemical changes of fumarolic gases: different characters and their implications in forecasting volcanic activity: Acta Vulcanologia, v. 1, p. 13-16.
Geologic Background. The word volcano is derived from Vulcano stratovolcano in Italy's Aeolian Islands. Vulcano was constructed during six stages over the past 136,000 years. Two overlapping calderas, the 2.5-km-wide Caldera del Piano on the SE and the 4-km-wide Caldera della Fossa on the NW, were formed at about 100,000 and 24,000-15,000 years ago, respectively, and volcanism has migrated north over time. La Fossa cone, active throughout the Holocene and the location of most historical eruptions, occupies the 3-km-wide Caldera della Fossa at the NW end of the elongated 3 x 7 km island. The Vulcanello lava platform is a low, roughly circular peninsula on the northern tip of Vulcano that was formed as an island beginning more than 2,000 years ago and was connected to the main island in about 1550 CE. Vulcanello is capped by three pyroclastic cones and was active intermittently until the 16th century. Explosive activity took place at the Fossa cone from 1898 to 1900.
Information Contacts: M. Martini, Univ di Firenze.
Whakaari/White Island (New Zealand) — April 1991 Cite this Report
Whakaari/White Island
New Zealand
37.52°S, 177.18°E; summit elev. 294 m
All times are local (unless otherwise noted)
Renewed ash emission; new collapse pit
There was no evidence, during fieldwork 21 April, of eruptive activity since the 20-22 March eruption that formed Orca vent and was probably responsible for up to 10 mm of ash deposited on the 1978/91 Crater rim since 13 February. An increase in gas emission (compared to visits during February and March) was noted at Orca vent and TV1 Crater. . . . Intense gas emission also occurred from an area of hot ground NW of TV1.
Several morphologic changes were observed in the crater area. A second, smaller vent (~5 m in diameter) was found on the slope NW of Orca vent. A new collapse pit, ~20 m in diameter and 50 m deep, was located above the conduit that had previously fed Donald Duck Crater. The new pit, a few meters NW of the crater, looked fresh, suggesting that it had formed shortly before the 21 April visit.
Ash-laden steam emission reportedly began 23 April and was continuing as of 3 May. No significant volcanic tremor or other seismicity was recorded during this period.
Geologic Background. The uninhabited Whakaari/White Island is the 2 x 2.4 km emergent summit of a 16 x 18 km submarine volcano in the Bay of Plenty about 50 km offshore of North Island. The island consists of two overlapping andesitic-to-dacitic stratovolcanoes. The SE side of the crater is open at sea level, with the recent activity centered about 1 km from the shore close to the rear crater wall. Volckner Rocks, sea stacks that are remnants of a lava dome, lie 5 km NW. Descriptions of volcanism since 1826 have included intermittent moderate phreatic, phreatomagmatic, and Strombolian eruptions; activity there also forms a prominent part of Maori legends. The formation of many new vents during the 19th and 20th centuries caused rapid changes in crater floor topography. Collapse of the crater wall in 1914 produced a debris avalanche that buried buildings and workers at a sulfur-mining project. Explosive activity in December 2019 took place while tourists were present, resulting in many fatalities. The official government name Whakaari/White Island is a combination of the full Maori name of Te Puia o Whakaari ("The Dramatic Volcano") and White Island (referencing the constant steam plume) given by Captain James Cook in 1769.
Information Contacts: I. Nairn and B. Scott, DSIR Geology & Geophysics, Rotorua.