Recently Published Bulletin Reports
Manam (Papua New Guinea) Few ash plumes during November-December 2022
Krakatau (Indonesia) Strombolian activity and ash plumes during November 2022-April 2023
Stromboli (Italy) Strombolian explosions and lava flows continue during January-April 2023
Nishinoshima (Japan) Small ash plumes and fumarolic activity during November 2022 through April 2023
Karangetang (Indonesia) Lava flows, incandescent avalanches, and ash plumes during January-June 2023
Ahyi (United States) Intermittent hydroacoustic signals and discolored plumes during November 2022-June 2023
Kadovar (Papua New Guinea) An ash plume and weak thermal anomaly during May 2023
San Miguel (El Salvador) Small gas-and-ash explosions during March and May 2023
Semisopochnoi (United States) Occasional explosions, ash deposits, and gas-and-steam plumes during December 2022-May 2023
Ebeko (Russia) Continued explosions, ash plumes, and ashfall during October 2022-May 2023
Home Reef (Tonga) Discolored plumes continued during November 2022-April 2023
Ambae (Vanuatu) New lava flow, ash plumes, and sulfur dioxide plumes during February-May 2023
Manam (Papua New Guinea) — July 2023  Cite this Report
Manam
Papua New Guinea
4.08°S, 145.037°E; summit elev. 1807 m
All times are local (unless otherwise noted)
Few ash plumes during November-December 2022
Manam is a 10-km-wide island that consists of two active summit craters: the Main summit crater and the South summit crater and is located 13 km off the northern coast of mainland Papua New Guinea. Frequent mild-to-moderate eruptions have been recorded since 1616. The current eruption period began during June 2014 and has more recently been characterized by intermittent ash plumes and thermal activity (BGVN 47:11). This report updates activity that occurred from November 2022 through May 2023 based on information from the Darwin Volcanic Ash Advisory Center (VAAC) and various satellite data.
Ash plumes were reported during November and December 2022 by the Darwin VAAC. On 7 November an ash plume rose to 2.1 km altitude and drifted NE based on satellite images and weather models. On 14 November an ash plume rose to 2.1 km altitude and drifted W based on RVO webcam images. On 20 November ash plumes rose to 1.8 km altitude and drifted NW. On 26 December an ash plume rose to 3 km altitude and drifted S and SSE.
Intermittent sulfur dioxide plumes were detected using the TROPOMI instrument on the Sentinel-5P satellite, some of which exceeded at least two Dobson Units (DU) and drifted in different directions (figure 93). Occasional low-to-moderate power thermal anomalies were recorded by the MIROVA (Middle InfraRed Observation of Volcanic Activity) system; less than five anomalies were recorded each month during November 2022 through May 2023 (figure 94). Two thermal hotspots were detected by the MODVOLC thermal alerts system on 10 December 2022. On clear weather days, thermal activity was also captured in infrared satellite imagery in both the Main and South summit craters, accompanied by gas-and-steam emissions (figure 95).
Geologic Background. The 10-km-wide island of Manam, lying 13 km off the northern coast of mainland Papua New Guinea, is one of the country's most active volcanoes. Four large radial valleys extend from the unvegetated summit of the conical basaltic-andesitic stratovolcano to its lower flanks. These valleys channel lava flows and pyroclastic avalanches that have sometimes reached the coast. Five small satellitic centers are located near the island's shoreline on the northern, southern, and western sides. Two summit craters are present; both are active, although most observed eruptions have originated from the southern crater, concentrating eruptive products during much of the past century into the SE valley. Frequent eruptions, typically of mild-to-moderate scale, have been recorded since 1616. Occasional larger eruptions have produced pyroclastic flows and lava flows that reached flat-lying coastal areas and entered the sea, sometimes impacting populated areas.
Information Contacts: Rabaul Volcano Observatory (RVO), Geohazards Management Division, Department of Mineral Policy and Geohazards Management (DMPGM), PO Box 3386, Kokopo, East New Britain Province, Papua New Guinea; Darwin Volcanic Ash Advisory Centre (VAAC), Bureau of Meteorology, Northern Territory Regional Office, PO Box 40050, Casuarina, NT 0811, Australia (URL: http://www.bom.gov.au/info/vaac/); MIROVA (Middle InfraRed Observation of Volcanic Activity), a collaborative project between the Universities of Turin and Florence (Italy) supported by the Centre for Volcanic Risk of the Italian Civil Protection Department (URL: http://www.mirovaweb.it/); Hawai'i Institute of Geophysics and Planetology (HIGP) - MODVOLC Thermal Alerts System, School of Ocean and Earth Science and Technology (SOEST), Univ. of Hawai'i, 2525 Correa Road, Honolulu, HI 96822, USA (URL: http://modis.higp.hawaii.edu/); NASA Global Sulfur Dioxide Monitoring Page, Atmospheric Chemistry and Dynamics Laboratory, NASA Goddard Space Flight Center (NASA/GSFC), 8800 Greenbelt Road, Goddard, Maryland, USA (URL: https://so2.gsfc.nasa.gov/); Copernicus Browser, Copernicus Data Space Ecosystem, European Space Agency (URL: https://dataspace.copernicus.eu/browser/).
Krakatau (Indonesia) — July 2023 Cite this Report
Krakatau
Indonesia
6.1009°S, 105.4233°E; summit elev. 285 m
All times are local (unless otherwise noted)
Strombolian activity and ash plumes during November 2022-April 2023
Krakatau is located in the Sunda Strait between Java and Sumatra, Indonesia. Caldera collapse during the catastrophic 1883 eruption destroyed Danan and Perbuwatan cones and left only a remnant of Rakata. The post-collapse cone of Anak Krakatau (Child of Krakatau) was constructed within the 1883 caldera at a point between the former Danan and Perbuwatan cones; it has been the site of frequent eruptions since 1927. The current eruption period began in May 2021 and has recently consisted of explosions, ash plumes, and thermal activity (BGVN 47:11). This report covers activity during November 2022 through April 2023 based on information provided by the Indonesian Center for Volcanology and Geological Hazard Mitigation, referred to as Pusat Vulkanologi dan Mitigasi Bencana Geologi (PVMBG), MAGMA Indonesia, the Darwin Volcanic Ash Advisory Center (VAAC), and several sources of satellite data.
Activity was relatively low during November and December 2022. Daily white gas-and-steam plumes rose 25-100 m above the summit and drifted in different directions. Gray ash plumes rose 200 m above the summit and drifted NE at 1047 and at 2343 on 11 November. On 14 November at 0933 ash plumes rose 300 m above the summit and drifted E. An ash plume was reported at 0935 on 15 December that rose 100 m above the summit and drifted NE. An eruptive event at 1031 later that day generated an ash plume that rose 700 m above the summit and drifted NE. A gray ash plume at 1910 rose 100 m above the summit and drifted E. Incandescent material was ejected above the vent based on an image taken at 1936.
During January 2023 daily white gas-and-steam plumes rose 25-300 m above the summit and drifted in multiple directions. Gray-to-brown ash plumes were reported at 1638 on 3 January, at 1410 and 1509 on 4 January, and at 0013 on 5 January that rose 100-750 m above the summit and drifted NE and E; the gray-to-black ash plume at 1509 on 4 January rose as high as 3 km above the summit and drifted E. Gray ash plumes were recorded at 1754, 2241, and 2325 on 11 January and at 0046 on 12 January and rose 200-300 m above the summit and drifted NE. Toward the end of January, PVMBG reported that activity had intensified; Strombolian activity was visible in webcam images taken at 0041, 0043, and 0450 on 23 January. Multiple gray ash plumes throughout the day rose 200-500 m above the summit and drifted E and SE (figure 135). Webcam images showed progressively intensifying Strombolian activity at 1919, 1958, and 2113 on 24 January; a gray ash plume at 1957 rose 300 m above the summit and drifted E (figure 135). Eruptive events at 0231 and 2256 on 25 January and at 0003 on 26 January ejected incandescent material from the vent, based on webcam images. Gray ash plumes observed during 26-27 January rose 300-500 m above the summit and drifted NE, E, and SE.
Low levels of activity were reported during February and March. Daily white gas-and-steam plumes rose 25-300 m above the summit and drifted in different directions. The Darwin VAAC reported that continuous ash emissions rose to 1.5-1.8 km altitude and drifted W and NW during 1240-1300 on 10 March, based on satellite images, weather models, and PVMBG webcams. White-and-gray ash plumes rose 500 m and 300 m above the summit and drifted SW at 1446 and 1846 on 18 March, respectively. An eruptive event was recorded at 2143, though it was not visible due to darkness. Multiple ash plumes were reported during 27-29 March that rose as high as 2.5 km above the summit and drifted NE, W, and SW (figure 136). Webcam images captured incandescent ejecta above the vent at 0415 and around the summit area at 2003 on 28 March and at 0047 above the vent on 29 March.
Daily white gas-and-steam plumes rose 25-300 m above the summit and drifted in multiple directions during April and May. White-and-gray and black plumes rose 50-300 m above the summit on 2 and 9 April. On 11 May at 1241 a gray ash plume rose 1-3 km above the summit and drifted SW. On 12 May at 0920 a gray ash plume rose 2.5 km above the summit and drifted SW and at 2320 an ash plume rose 1.5 km above the summit and drifted SW. An accompanying webcam image showed incandescent ejecta. On 13 May at 0710 a gray ash plume rose 2 km above the summit and drifted SW (figure 137).
The MIROVA (Middle InfraRed Observation of Volcanic Activity) graph of MODIS thermal anomaly data showed intermittent low-to-moderate power thermal anomalies during November 2022 through April 2023 (figure 138). Some of this thermal activity was also visible in infrared satellite imagery at the crater, accompanied by gas-and-steam and ash plumes that drifted in different directions (figure 139).
Geologic Background. The renowned Krakatau (frequently mis-named as Krakatoa) volcano lies in the Sunda Strait between Java and Sumatra. Collapse of an older edifice, perhaps in 416 or 535 CE, formed a 7-km-wide caldera. Remnants of that volcano are preserved in Verlaten and Lang Islands; subsequently the Rakata, Danan, and Perbuwatan cones were formed, coalescing to create the pre-1883 Krakatau Island. Caldera collapse during the catastrophic 1883 eruption destroyed Danan and Perbuwatan, and left only a remnant of Rakata. This eruption caused more than 36,000 fatalities, most as a result of tsunamis that swept the adjacent coastlines of Sumatra and Java. Pyroclastic surges traveled 40 km across the Sunda Strait and reached the Sumatra coast. After a quiescence of less than a half century, the post-collapse cone of Anak Krakatau (Child of Krakatau) was constructed within the 1883 caldera at a point between the former Danan and Perbuwatan cones. Anak Krakatau has been the site of frequent eruptions since 1927.
Information Contacts: Pusat Vulkanologi dan Mitigasi Bencana Geologi (PVMBG, also known as Indonesian Center for Volcanology and Geological Hazard Mitigation, CVGHM), Jalan Diponegoro 57, Bandung 40122, Indonesia (URL: http://www.vsi.esdm.go.id/); MAGMA Indonesia, Kementerian Energi dan Sumber Daya Mineral (URL: https://magma.esdm.go.id/v1); Darwin Volcanic Ash Advisory Centre (VAAC), Bureau of Meteorology, Northern Territory Regional Office, PO Box 40050, Casuarina, NT 0811, Australia (URL: http://www.bom.gov.au/info/vaac/); MIROVA (Middle InfraRed Observation of Volcanic Activity), a collaborative project between the Universities of Turin and Florence (Italy) supported by the Centre for Volcanic Risk of the Italian Civil Protection Department (URL: http://www.mirovaweb.it/); Copernicus Browser, Copernicus Data Space Ecosystem, European Space Agency (URL: https://dataspace.copernicus.eu/browser/).
Stromboli
Italy
38.789°N, 15.213°E; summit elev. 924 m
All times are local (unless otherwise noted)
Strombolian explosions and lava flows continue during January-April 2023
Stromboli, located in Italy, has exhibited nearly constant lava fountains for the past 2,000 years; recorded eruptions date back to 350 BCE. Eruptive activity occurs at the summit from multiple vents, which include a north crater area (N area) and a central-southern crater (CS area) on a terrace known as the ‘terrazza craterica’ at the head of the Sciara del Fuoco, a large scarp that runs from the summit down the NW side of the volcano-island. Activity typically consists of Strombolian explosions, incandescent ejecta, lava flows, and pyroclastic flows. Thermal and visual monitoring cameras are located on the nearby Pizzo Sopra La Fossa, above the terrazza craterica, and at multiple flank locations. The current eruption period has been ongoing since 1934 and recent activity has consisted of frequent Strombolian explosions and lava flows (BGVN 48:02). This report updates activity during January through April 2023 primarily characterized by Strombolian explosions and lava flows based on reports from Italy's Istituto Nazionale di Geofisica e Vulcanologia (INGV) and various satellite data.
Frequent explosive activity continued throughout the reporting period, generally in the low-to-medium range, based on the number of hourly explosions in the summit crater (figure 253, table 16). Intermittent thermal activity was recorded by the MIROVA (Middle InfraRed Observation of Volcanic Activity) analysis of MODIS satellite data (figure 254). According to data collected by the MODVOLC thermal algorithm, a total of 9 thermal alerts were detected: one on 2 January 2023, one on 1 February, five on 24 March, and two on 26 March. The stronger pulses of thermal activity likely reflected lava flow events. Infrared satellite imagery captured relatively strong thermal hotspots at the two active summit craters on clear weather days, showing an especially strong event on 8 March (figure 255).
Table 16. Summary of type, frequency, and intensity of explosive activity at Stromboli by month during January-April 2023; information from webcam observations. Courtesy of INGV weekly reports.
| Month |
Explosive Activity |
| Jan 2023 |
Typical Strombolian activity with spattering and lava overflows in the N crater area. Explosions were reported from 4 vents in the N area and 1-2 vents in the CS area. The average hourly frequency of explosions was low-to-medium (1-12 events/hour). The intensity of the explosions varied from low (less than 80 m high) to medium (less than 150 m high) in the N crater area and up to high (greater than 150 m high) in the CS crater area. |
| Feb 2023 |
Typical Strombolian activity with spattering in the N crater area. Explosions were reported from 2-3 vents in the N area and 1-4 vents in the CS area. The average hourly frequency of explosions was low-to-medium (1-14 events/hour). The intensity of the explosions varied from low (less than 80 m high) to medium (less than 150 m high) in the N crater area and up to high (greater than 150 m high) in the CS crater area. |
| Mar 2023 |
Typical Strombolian activity with spattering and lava overflows in the N crater area. Explosions were reported from 2-3 vents in the N area and 2-4 vents in the CS area. The average hourly frequency of explosions was low-to-medium (1-18 events/hour). The intensity of the explosions varied from low (less than 80 m high) to medium (less than 150 m high) in the N crater area and up to high (greater than 150 m high) in the CS crater area. |
| Apr 2023 |
Typical Strombolian activity. Explosions were reported from 2 vents in the N area and 2-3 vents in the CS area. The average hourly frequency of explosions was low-to-high (1-16 events/hour). The intensity of the explosions varied from low (less than 80 m high) to medium (less than 150 m high) in both the N and CS crater areas. |
Activity during January-February 2023. Strombolian explosions were reported in the N crater area, as well as lava effusion. Explosive activity in the N crater area ejected coarse material (bombs and lapilli). Intense spattering was observed in both the N1 and N2 craters. In the CS crater area, explosions generally ejected fine material (ash), sometimes to heights greater than 250 m. The intensity of the explosions was characterized as low-to-medium in the N crater and medium-to-high in the CS crater. After intense spattering activity from the N crater area, a lava overflow began at 2136 on 2 January that flowed part way down the Sciara del Fuoco, possibly moving down the drainage that formed in October, out of view from webcams. The flow remained active for a couple of hours before stopping and beginning to cool. A second lava flow was reported at 0224 on 4 January that similarly remained active for a few hours before stopping and cooling. Intense spattering was observed on 11 and 13 January from the N1 crater. After intense spattering activity at the N2 crater at 1052 on 17 January another lava flow started to flow into the upper part of the Sciara del Fuoco (figure 256), dividing into two: one that traveled in the direction of the drainage formed in October, and the other one moving parallel to the point of emission. By the afternoon, the rate of the flow began to decrease, and at 1900 it started to cool. A lava flow was reported at 1519 on 24 January following intense spattering in the N2 area, which began to flow into the upper part of the Sciara del Fuoco. By the morning of 25 January, the lava flow had begun to cool. During 27 January the frequency of eruption in the CS crater area increased to 6-7 events/hour compared to the typical 1-7 events/hour; the following two days showed a decrease in frequency to less than 1 event/hour. Starting at 1007 on 30 January a high-energy explosive sequence was produced by vents in the CS crater area. The sequence began with an initial energetic pulse that lasted 45 seconds, ejecting predominantly coarse products 300 m above the crater that fell in an ESE direction. Subsequent and less intense explosions ejected material 100 m above the crater. The total duration of this event lasted approximately two minutes. During 31 January through 6, 13, and 24 February spattering activity was particularly intense for short periods in the N2 crater.
An explosive sequence was reported on 16 February that was characterized by a major explosion in the CS crater area (figure 257). The sequence began at 1817 near the S2 crater that ejected material radially. A few seconds later, lava fountains were observed in the central part of the crater. Three explosions of medium intensity (material was ejected less than 150 m high) were recorded at the S2 crater. The first part of this sequence lasted approximately one minute, according to INGV, and material rose 300 m above the crater and then was deposited along the Sciara del Fuoco. The second phase began at 1818 at the S1 crater; it lasted seven seconds and material was ejected 150 m above the crater. Another event 20 seconds later lasted 12 seconds, also ejecting material 150 m above the crater. The sequence ended with at least three explosions of mostly fine material from the S1 crater. The total duration of this sequence was about two minutes.
Short, intense spattering activity was noted above the N1 crater on 27 and 28 February. A lava overflow was first reported at 0657 from the N2 crater on 27 February that flowed into the October 2022 drainage. By 1900 the flow had stopped. A second lava overflow also in the N crater area occurred at 2149, which overlapped the first flow and then stopped by 0150 on 28 February. Material detached from both the lava overflows rolled down the Sciara del Fuoco, some of which was visible in webcam images.
Activity during March-April 2023. Strombolian activity continued with spattering activity and lava overflows in the N crater area during March. Explosive activity at the N crater area varied from low (less than 80 m high) to medium (less than 150 m high) and ejected coarse material, such as bombs and lapilli. Spattering was observed above the N1 crater, while explosive activity at the CS crater area varied from medium to high (greater than 150 m high) and ejected coarse material. Intense spattering activity was observed for short periods on 6 March above the N1 crater. At approximately 0610 a lava overflow was reported around the N2 crater on 8 March, which then flowed into the October 2022 drainage. By 1700 the flow started to cool. A second overflow began at 1712 on 9 March and overlapped the previous flow. It had stopped by 2100. Material from both flows was deposited along the Sciara del Fuoco, though much of the activity was not visible in webcam images. On 11 March a lava overflow was observed at 0215 that overlapped the two previous flows in the October 2022 drainage. By late afternoon on 12 March, it had stopped.
During a field excursion on 16 March, scientists noted that a vent in the central crater area was degassing. Another vent showed occasional Strombolian activity that emitted ash and lapilli. During 1200-1430 low-to-medium intense activity was reported; the N1 crater emitted ash emissions and the N2 crater emitted both ash and coarse material. Some explosions also occurred in the CS crater area that ejected coarse material. The C crater in the CS crater area occasionally showed gas jetting and low intensity explosions on 17 and 22 March; no activity was observed at the S1 crater. Intense, longer periods of spattering were reported in the N1 crater on 19, 24, and 25 March. Around 2242 on 23 March a lava overflow began from the N1 crater that, after about an hour, began moving down the October 2022 drainage and flow along the Sciara del Fuoco (figure 258). Between 0200 and 0400 on 26 March the flow rate increased, which generated avalanches of material from collapses at the advancing flow front. By early afternoon, the flow began to cool. On 25 March at 1548 an explosive sequence began from one of the vents at S2 in the CS crater area (figure 258). Fine ash mixed with coarse material was ejected 300 m above the crater rim and drifted SSE. Some modest explosions around Vent C were detected at 1549 on 25 March, which included an explosion at 1551 that ejected coarse material. The entire explosive sequence lasted approximately three minutes.
During April explosions persisted in both the N and CS crater areas. Fine material was ejected less than 80 m above the N crater rim until 6 April, followed by ejection of coarser material. Fine material was also ejected less than 80 m above the CS crater rim. The C and S2 crater did not show significant eruptive activity. On 7 April an explosive sequence was detected in the CS crater area at 1203 (figure 259). The first explosion lasted approximately 18 seconds and ejected material 400 m above the crater rim, depositing pyroclastic material in the upper part of the Sciara del Fuoco. At 1204 a second, less intense explosion lasted approximately four seconds and deposited pyroclastic products outside the crater area and near Pizzo Sopra La Fossa. A third explosion at 1205 was mainly composed of ash that rose about 150 m above the crater and lasted roughly 20 seconds. A fourth explosion occurred at 1205 about 28 seconds after the third explosion and ejected a mixture of coarse and fine material about 200 m above the crater; the explosion lasted roughly seven seconds. Overall, the entire explosive sequence lasted about two minutes and 20 seconds. After the explosive sequence on 7 April, explosions in both the N and CS crater areas ejected material as high as 150 m above the crater.
On 21 April research scientists from INGV made field observations in the summit area of Stromboli, and some lapilli samples were collected. In the N crater area near the N1 crater, a small cone was observed with at least two active vents, one of which was characterized by Strombolian explosions. The other vent produced explosions that ejected ash and chunks of cooled lava. At the N2 crater at least one vent was active and frequently emitted ash. In the CS crater area, a small cone contained 2-3 degassing vents and a smaller, possible fissure area also showed signs of degassing close to the Pizzo Sopra La Fossa. In the S part of the crater, three vents were active: a small hornito was characterized by modest and rare explosions, a vent that intermittently produced weak Strombolian explosions, and a vent at the end of the terrace that produced frequent ash emissions. Near the S1 crater there was a hornito that generally emitted weak gas-and-steam emissions, sometimes associated with “gas rings”. On 22 April another field inspection was carried out that reported two large sliding surfaces on the Sciara del Fuoco that showed where blocks frequently descended toward the sea. A thermal anomaly was detected at 0150 on 29 April.
Geologic Background. Spectacular incandescent nighttime explosions at Stromboli have long attracted visitors to the "Lighthouse of the Mediterranean" in the NE Aeolian Islands. This volcano has lent its name to the frequent mild explosive activity that has characterized its eruptions throughout much of historical time. The small island is the emergent summit of a volcano that grew in two main eruptive cycles, the last of which formed the western portion of the island. The Neostromboli eruptive period took place between about 13,000 and 5,000 years ago. The active summit vents are located at the head of the Sciara del Fuoco, a prominent scarp that formed about 5,000 years ago due to a series of slope failures which extends to below sea level. The modern volcano has been constructed within this scarp, which funnels pyroclastic ejecta and lava flows to the NW. Essentially continuous mild Strombolian explosions, sometimes accompanied by lava flows, have been recorded for more than a millennium.
Information Contacts: Istituto Nazionale di Geofisica e Vulcanologia (INGV), Sezione di Catania, Piazza Roma 2, 95123 Catania, Italy, (URL: http://www.ct.ingv.it/en/); MIROVA (Middle InfraRed Observation of Volcanic Activity), a collaborative project between the Universities of Turin and Florence (Italy) supported by the Centre for Volcanic Risk of the Italian Civil Protection Department (URL: http://www.mirovaweb.it/); Hawai'i Institute of Geophysics and Planetology (HIGP) - MODVOLC Thermal Alerts System, School of Ocean and Earth Science and Technology (SOEST), Univ. of Hawai'i, 2525 Correa Road, Honolulu, HI 96822, USA (URL: http://modis.higp.hawaii.edu/); Copernicus Browser, Copernicus Data Space Ecosystem, European Space Agency (URL: https://dataspace.copernicus.eu/browser/).
Nishinoshima (Japan) — July 2023 Cite this Report
Nishinoshima
Japan
27.247°N, 140.874°E; summit elev. 100 m
All times are local (unless otherwise noted)
Small ash plumes and fumarolic activity during November 2022 through April 2023
Nishinoshima is a small island located about 1,000 km S of Tokyo in the Ogasawara Arc in Japan. The island is the summit of a massive submarine volcano that has prominent peaks to the S, W, and NE. Eruptions date back to 1973; the most recent eruption period began in October 2022 and was characterized by ash plumes and fumarolic activity (BGVN 47:12). This report describes ash plumes and fumarolic activity during November 2022 through April 2023 based on monthly reports from the Japan Meteorological Agency (JMA) monthly reports and satellite data.
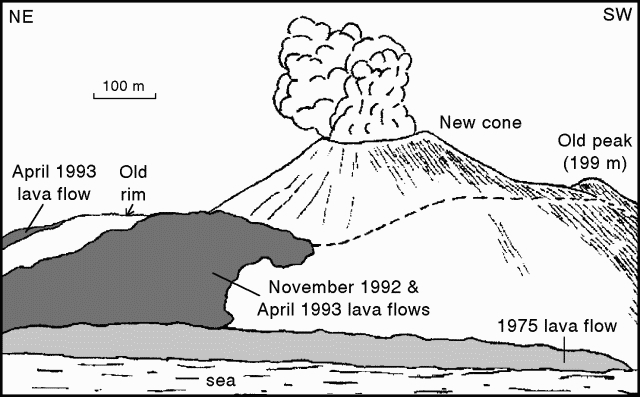
The most recent eruptive activity prior to the reporting internal occurred on 12 October 2022, when an ash plume rose 3.5 km above the crater rim. An aerial observation conducted by the Japan Coast Guard (JCG) on 25 November reported that white fumaroles rose approximately 200 m above the central crater of a pyroclastic cone (figure 119), and multiple plumes were observed on the ESE flank of the cone. Discolored water ranging from reddish-brown to brown and yellowish-green were visible around the perimeter of the island (figure 119). No significant activity was reported in December.
During an overflight conducted by JCG on 25 January 2023 intermittent activity and small, blackish-gray plumes rose 900 m above the central part of the crater were observed (figure 120). The fumarolic zone of the E flank and base of the cone had expanded and emissions had intensified. Dark brown discolored water was visible around the perimeter of the island.
No significant activity was reported during February through March. Ash plumes at 1050 and 1420 on 11 April rose 1.9 km above the crater rim and drifted NW and N. These were the first ash plumes observed since 12 October 2022. On 14 April JCG carried out an overflight and reported that no further eruptive activity was visible, although white gas-and-steam plumes were visible from the central crater and rose 900 m high (figure 121). Brownish and yellow-green discolored water surrounded the island.
Intermittent low-to-moderate power thermal anomalies were recorded in the MIROVA graph (Middle InfraRed Observation of Volcanic Activity) during November 2022 through April 2023 (figure 123). A cluster of six to eight anomalies were detected during November while a smaller number were detected during the following months: two to three during December, one during mid-January 2023, one during February, five during March, and two during April. Thermal activity was also reflected in infrared satellite data at the summit crater, accompanied by occasional gas-and-steam plumes (figure 124).
Geologic Background. The small island of Nishinoshima was enlarged when several new islands coalesced during an eruption in 1973-74. Multiple eruptions that began in 2013 completely covered the previous exposed surface and continued to enlarge the island. The island is the summit of a massive submarine volcano that has prominent peaks to the S, W, and NE. The summit of the southern cone rises to within 214 m of the ocean surface 9 km SSE.
Information Contacts: Japan Meteorological Agency (JMA), 1-3-4 Otemachi, Chiyoda-ku, Tokyo 100-8122, Japan (URL: http://www.jma.go.jp/jma/indexe.html); MIROVA (Middle InfraRed Observation of Volcanic Activity), a collaborative project between the Universities of Turin and Florence (Italy) supported by the Centre for Volcanic Risk of the Italian Civil Protection Department (URL: http://www.mirovaweb.it/); Copernicus Browser, Copernicus Data Space Ecosystem, European Space Agency (URL: https://dataspace.copernicus.eu/browser/).
Karangetang (Indonesia) — July 2023 Cite this Report
Karangetang
Indonesia
2.781°N, 125.407°E; summit elev. 1797 m
All times are local (unless otherwise noted)
Lava flows, incandescent avalanches, and ash plumes during January-June 2023
Karangetang (also known as Api Siau), at the northern end of the island of Siau, Indonesia, contains five summit craters along a N-S line. More than 40 eruptions have been recorded since 1675; recent eruptions have included frequent explosive activity, sometimes accompanied by pyroclastic flows and lahars. Lava dome growth has occurred in the summit craters and collapses of lava flow fronts have produced pyroclastic flows. The two active summit craters are Kawah Dua (the N crater) and Kawah Utama (the S crater, also referred to as the “Main Crater”). The most recent eruption began in late November 2018 and has more recently consisted of weak thermal activity and gas-and-steam emissions (BGVN 48:01). This report updates activity characterized by lava flows, incandescent avalanches, and ash plumes during January through June 2023 using reports from Pusat Vulkanologi dan Mitigasi Bencana Geologi (PVMBG, also known as CVGHM, or the Center of Volcanology and Geological Hazard Mitigation), MAGMA Indonesia, the Darwin VAAC (Volcano Ash Advisory Center), and satellite data.
Activity during January was relatively low and mainly consisted of white gas-and-steam emissions that rose 25-150 m above Main Crater (S crater) and drifted in different directions. Incandescence was visible from the lava dome in Kawah Dua (the N crater). Weather conditions often prevented clear views of the summit. On 18 January the number of seismic signals that indicated avalanches of material began to increase. In addition, there were a total of 71 earthquakes detected during the month.
Activity continued to increase during the first week of February. Material from Main Crater traveled as far as 800 m down the Batuawang (S) and Batang (W) drainages and as far as 1 km W down the Beha (W) drainage on 4 February. On 6 February 43 earthquake events were recorded, and on 7 February, 62 events were recorded. White gas-and-steam emissions rose 25-250 m above both summit craters throughout the month. PVMBG reported an eruption began during the evening of 8 February around 1700. Photos showed incandescent material at Main Crater. Incandescent material had also descended the flank in at least two unconfirmed directions as far as 2 km from Main Crater, accompanied by ash plumes (figure 60). As a result, PVMBG increased the Volcano Alert Level (VAL) to 3 (the second highest level on a 1-4 scale).
Occasional nighttime webcam images showed three main incandescent lava flows of differing lengths traveling down the S, SW, and W flanks (figure 61). Incandescent rocks were visible on the upper flanks, possibly from ejected or collapsed material from the crater, and incandescence was the most intense at the summit. Based on analyses of satellite imagery and weather models, the Darwin VAAC reported that daily ash plumes during 16-20 February rose to 2.1-3 km altitude and drifted NNE, E, and SE. BNPB reported on 16 February that as many as 77 people were evacuated and relocated to the East Siau Museum. A webcam image taken at 2156 on 17 February possibly showed incandescent material descending the SE flank. Ash plumes rose to 2.1 km altitude and drifted SE during 22-23 February, according to the Darwin VAAC.
Incandescent avalanches of material and summit incandescence at Main Crater continued during March. White gas-and-steam emissions during March generally rose 25-150 m above the summit crater; on 31 March gas-and-steam emissions rose 200-400 m high. An ash plume rose to 2.4 km altitude and drifted S at 1710 on 9 March and a large thermal anomaly was visible in images taken at 0550 and 0930 on 10 March. Incandescent material was visible at the summit and on the flanks based on webcam images taken at 0007 and 2345 on 16 March, at 1828 on 17 March, at 1940 on 18 March, at 2311 on 19 March, and at 2351 on 20 March. Incandescence was most intense on 18 and 20 March and webcam images showed possible Strombolian explosions (figure 62). An ash plume rose to 2.4 km altitude and drifted SW on 18 March, accompanied by a thermal anomaly.
Summit crater incandescence at Main Crater and on the flanks persisted during April. Incandescent material at the S crater and on the flanks was reported at 0016 on 1 April. The lava flows had stopped by 1 April according to PVMBG, although incandescence was still visible up to 10 m high. Seismic signals indicating effusion decreased and by 6 April they were no longer detected. Incandescence was visible from both summit craters. On 26 April the VAL was lowered to 2 (the second lowest level on a 1-4 scale). White gas-and-steam emissions rose 25-200 m above the summit crater.
During May white gas-and-steam emissions generally rose 50-250 m above the summit, though it was often cloudy, which prevented clear views; on 21 May gas-and-steam emissions rose 50-400 m high. Nighttime N summit crater incandescence rose 10-25 m above the lava dome, and less intense incandescence was noted above Main Crater, which reached about 10 m above the dome. Sounds of falling rocks at Main Crater were heard on 15 May and the seismic network recorded 32 rockfall events in the crater on 17 May. Avalanches traveled as far as 1.5 km down the SW and S flanks, accompanied by rumbling sounds on 18 May. Incandescent material descending the flanks was captured in a webcam image at 2025 on 19 May (figure 63) and on 29 May; summit crater incandescence was observed in webcam images at 2332 on 26 May and at 2304 on 29 May. On 19 May the VAL was again raised to 3.
Occasional Main Crater incandescence was reported during June, as well as incandescent material on the flanks. White gas-and-steam emissions rose 10-200 m above the summit crater. Ash plumes rose to 2.1 km altitude and drifted SE and E during 2-4 June, according to the Darwin VAAC. Material on the flanks of Main Crater were observed at 2225 on 7 June, at 2051 on 9 June, at 0007 on 17 June, and at 0440 on 18 June. Webcam images taken on 21, 25, and 27 June showed incandescence at Main Crater and from material on the flanks.
MIROVA (Middle InfraRed Observation of Volcanic Activity) analysis of MODIS satellite data showed strong thermal activity during mid-February through March and mid-May through June, which represented incandescent avalanches and lava flows (figure 64). During April through mid-May the power of the anomalies decreased but frequent anomalies were still detected. Brief gaps in activity occurred during late March through early April and during mid-June. Infrared satellite images showed strong lava flows mainly affecting the SW and S flanks, accompanied by gas-and-steam emissions (figure 65). According to data recorded by the MODVOLC thermal algorithm, there were a total of 79 thermal hotspots detected: 28 during February, 24 during March, one during April, five during May, and 21 during June.
Geologic Background. Karangetang (Api Siau) volcano lies at the northern end of the island of Siau, about 125 km NNE of the NE-most point of Sulawesi. The stratovolcano contains five summit craters along a N-S line. It is one of Indonesia's most active volcanoes, with more than 40 eruptions recorded since 1675 and many additional small eruptions that were not documented (Neumann van Padang, 1951). Twentieth-century eruptions have included frequent explosive activity sometimes accompanied by pyroclastic flows and lahars. Lava dome growth has occurred in the summit craters; collapse of lava flow fronts have produced pyroclastic flows.
Information Contacts: Pusat Vulkanologi dan Mitigasi Bencana Geologi (PVMBG, also known as Indonesian Center for Volcanology and Geological Hazard Mitigation, CVGHM), Jalan Diponegoro 57, Bandung 40122, Indonesia (URL: http://www.vsi.esdm.go.id/); MAGMA Indonesia, Kementerian Energi dan Sumber Daya Mineral (URL: https://magma.esdm.go.id/v1); Badan Nasional Penanggulangan Bencana (BNPB), National Disaster Management Agency, Graha BNPB - Jl. Scout Kav.38, East Jakarta 13120, Indonesia (URL: http://www.bnpb.go.id/); Darwin Volcanic Ash Advisory Centre (VAAC), Bureau of Meteorology, Northern Territory Regional Office, PO Box 40050, Casuarina, NT 0811, Australia (URL: http://www.bom.gov.au/info/vaac/); MIROVA (Middle InfraRed Observation of Volcanic Activity), a collaborative project between the Universities of Turin and Florence (Italy) supported by the Centre for Volcanic Risk of the Italian Civil Protection Department (URL: http://www.mirovaweb.it/); Hawai'i Institute of Geophysics and Planetology (HIGP) - MODVOLC Thermal Alerts System, School of Ocean and Earth Science and Technology (SOEST), Univ. of Hawai'i, 2525 Correa Road, Honolulu, HI 96822, USA (URL: http://modis.higp.hawaii.edu/); Copernicus Browser, Copernicus Data Space Ecosystem, European Space Agency (URL: https://dataspace.copernicus.eu/browser/); IDN Times, Jl. Jend. Gatot Subroto Kav. 27 3rd Floor Kuningan, Jakarta, Indonesia 12950, Status of Karangetang Volcano in Sitaro Islands Increases (URL: https://sulsel.idntimes.com/news/indonesia/savi/status-gunung-api-karangetang-di-kepulauan-sitaro-meningkat?page=all).
Ahyi (United States) — July 2023 Cite this Report
Ahyi
United States
20.42°N, 145.03°E; summit elev. -75 m
All times are local (unless otherwise noted)
Intermittent hydroacoustic signals and discolored plumes during November 2022-June 2023
Ahyi seamount is a large, conical submarine volcano that rises to within 75 m of the ocean surface about 18 km SE of the island of Farallon de Pajaros in the Northern Marianas. The remote location of the seamount has made eruptions difficult to document, but seismic stations installed in the region confirmed an eruption in the vicinity in 2001. No new activity was detected until April-May 2014 when an eruption was detected by NOAA (National Oceanic and Atmospheric Administration) divers, hydroacoustic sensors, and seismic stations (BGVN 42:04). New activity was first detected on 15 November by hydroacoustic sensors that were consistent with submarine volcanic activity. This report covers activity during November 2022 through June 2023 based on daily and weekly reports from the US Geological Survey.
Starting in mid-October, hydroacoustic sensors at Wake Island (2.2 km E) recorded signals consistent with submarine volcanic activity, according to a report from the USGS issued on 15 November 2022. A combined analysis of the hydroacoustic signals and seismic stations located at Guam and Chichijima Island, Japan, suggested that the source of this activity was at or near the Ahyi seamount. After a re-analysis of a satellite image of the area that was captured on 6 November, USGS confirmed that there was no evidence of discoloration at the ocean surface. Few hydroacoustic and seismic signals continued through November, including on 18 November, which USGS suggested signified a decline or pause in unrest. A VONA (Volcano Observatory Notice for Aviation) reported that a discolored water plume was persistently visible in satellite data starting on 18 November (figure 6). Though clouds often obscured clear views of the volcano, another discolored water plume was captured in a satellite image on 26 November. The Aviation Color Code (ACC) was raised to Yellow (the second lowest level on a four-color scale) and the Volcano Alert Level (VAL) was raised to Advisory (the second lowest level on a four-level scale) on 29 November.
During December, occasional detections were recorded on the Wake Island hydrophone sensors and discolored water over the seamount remained visible. During 2-7, 10-12, and 16-31 December possible explosion signals were detected. A small area of discolored water was observed in high-resolution Sentinel-2 satellite images during 1-6 December (figure 7). High-resolution satellite images recorded discolored water plumes on 13 December that originated from the summit region; no observations indicated that activity breached the ocean surface. A possible underwater plume was visible in satellite images on 18 December, and during 19-20 December a definite but diffuse underwater plume located SSE from the main vent was reported. An underwater plume was visible in a satellite image taken on 26 December (figure 7).
Hydrophone sensors continued to detect signals consistent with possible explosions during 1-8 January 2023. USGS reported that the number of detections decreased during 4-5 January. The hydrophone sensors experienced a data outage that started at 0118 on 8 January and continued through 10 January, though according to USGS, possible explosions were recorded prior to the data outage and likely continued during the outage. A discolored water plume originating from the summit region was detected in a partly cloudy satellite image on 8 January. On 11-12 and 15-17 January possible explosion signals were recorded again. One small signal was detected during 22-23 January and several signals were recorded on 25 and 31 January. During 27-31 January a plume of discolored water was observed above the seamount in satellite imagery (figure 8).
Low levels of activity continued during February and March, based on data from pressure sensors on Wake Island. During 1 and 4-6 February activity was reported, and a submarine plume was observed on 4 February (figure 8). Possible explosion signals were detected during 7-8, 10, 13-14, and 24 February. During 1-2 and 3-5 March a plume of discolored water was observed in satellite imagery (figure 8). Almost continuous hydroacoustic signals were detected in remote pressure sensor data on Wake Island 2,270 km E from the volcano during 7-13 March. During 12-13 March water discoloration around the seamount was observed in satellite imagery, despite cloudy weather. By 14 March discolored water extended about 35 km, but no direction was noted. USGS reported that the continuous hydroacoustic signals detected during 13-14 March stopped abruptly on 14 March and no new detections were observed. Three 30 second hydroacoustic detections were reported during 17-19 March, but no activity was visible due to cloudy weather. A data outage was reported during 21-22 March, making pressure sensor data unavailable; a discolored water plume was, however, visible in satellite data. A possible underwater explosion signal was detected by pressure sensors at Wake Island on 26, 29, and 31 March, though the cause and origin of these events were unclear.
Similar low activity continued during April, May, and June. Several signals were detected during 1-3 April in pressure sensors at Wake Island. USGS suggested that these may be related to underwater explosions or earthquakes at the volcano, but no underwater plumes were visible in clear satellite images. The pressure sensors had data outages during 12-13 April and no data were recorded; no underwater plumes were visible in satellite images, although cloudy weather obscured most clear views. Eruptive activity was reported starting at 2210 on 21 May. On 22 May a discolored water plume that extended 4 km was visible in satellite images, though no direction was recorded. During 23-24 May some signals were detected by the underwater pressure sensors. Possible hydroacoustic signals were detected during 2-3 and 6-8 June. Multiple hydroacoustic signals were detected during 9-11 and 16-17 June, although no activity was visible in satellite images. One hydroacoustic signal was detected during 23-24 June, but there was some uncertainty about its association with volcanic activity. A single possible hydroacoustic signal was detected during 30 June to 1 July.
Geologic Background. Ahyi seamount is a large conical submarine volcano that rises to within 75 m of the ocean surface ~18 km SE of the island of Farallon de Pajaros in the northern Marianas. Water discoloration has been observed there, and in 1979 the crew of a fishing boat felt shocks over the summit area, followed by upwelling of sulfur-bearing water. On 24-25 April 2001 an explosive eruption was detected seismically by a station on Rangiroa Atoll, Tuamotu Archipelago. The event was well constrained (+/- 15 km) at a location near the southern base of Ahyi. An eruption in April-May 2014 was detected by NOAA divers, hydroacoustic sensors, and seismic stations.
Information Contacts: US Geological Survey, Volcano Hazards Program (USGS-VHP), 12201 Sunrise Valley Drive, Reston, VA, USA, https://volcanoes.usgs.gov/index.html; Copernicus Browser, Copernicus Data Space Ecosystem, European Space Agency (URL: https://dataspace.copernicus.eu/browser/).
Kadovar (Papua New Guinea) — June 2023 Cite this Report
Kadovar
Papua New Guinea
3.608°S, 144.588°E; summit elev. 365 m
All times are local (unless otherwise noted)
An ash plume and weak thermal anomaly during May 2023
Kadovar is a 2-km-wide island that is the emergent summit of a Bismarck Sea stratovolcano. It lies off the coast of New Guinea, about 25 km N of the mouth of the Sepik River. Prior to an eruption that began in 2018, a lava dome formed the high point of the volcano, filling an arcuate landslide scarp open to the S. Submarine debris-avalanche deposits occur to the S of the island. The current eruption began in January 2018 and has comprised lava effusion from vents at the summit and at the E coast; more recent activity has consisted of ash plumes, weak thermal activity, and gas-and-steam plumes (BGVN 48:02). This report covers activity during February through May 2023 using information from the Darwin Volcanic Ash Advisory Center (VAAC) and satellite data.
Activity during the reporting period was relatively low and mainly consisted of white gas-and-steam plumes that were visible in natural color satellite images on clear weather days (figure 67). According to a Darwin VAAC report, at 2040 on 6 May an ash plume rose to 4.6 km altitude and drifted W; by 2300 the plume had dissipated. MODIS satellite instruments using the MODVOLC thermal algorithm detected a single thermal hotspot on the SE side of the island on 7 May. Weak thermal activity was also detected in a satellite image on the E side of the island on 14 May, accompanied by a white gas-and-steam plume that drifted SE (figure 68).
Geologic Background. The 2-km-wide island of Kadovar is the emergent summit of a Bismarck Sea stratovolcano of Holocene age. It is part of the Schouten Islands, and lies off the coast of New Guinea, about 25 km N of the mouth of the Sepik River. Prior to an eruption that began in 2018, a lava dome formed the high point of the andesitic volcano, filling an arcuate landslide scarp open to the south; submarine debris-avalanche deposits occur in that direction. Thick lava flows with columnar jointing forms low cliffs along the coast. The youthful island lacks fringing or offshore reefs. A period of heightened thermal phenomena took place in 1976. An eruption began in January 2018 that included lava effusion from vents at the summit and at the E coast.
Information Contacts: Darwin Volcanic Ash Advisory Centre (VAAC), Bureau of Meteorology, Northern Territory Regional Office, PO Box 40050, Casuarina, NT 0811, Australia (URL: http://www.bom.gov.au/info/vaac/); Hawai'i Institute of Geophysics and Planetology (HIGP) - MODVOLC Thermal Alerts System, School of Ocean and Earth Science and Technology (SOEST), Univ. of Hawai'i, 2525 Correa Road, Honolulu, HI 96822, USA (URL: http://modis.higp.hawaii.edu/); Copernicus Browser, Copernicus Data Space Ecosystem, European Space Agency (URL: https://dataspace.copernicus.eu/browser/).
San Miguel (El Salvador) — June 2023 Cite this Report
San Miguel
El Salvador
13.434°N, 88.269°W; summit elev. 2130 m
All times are local (unless otherwise noted)
Small gas-and-ash explosions during March and May 2023
San Miguel in El Salvador is a broad, deep crater complex that has been frequently modified by eruptions recorded since the early 16th century and consists of the summit known locally as Chaparrastique. Flank eruptions have produced lava flows that extended to the N, NE, and SE during the 17-19th centuries. The most recent activity has consisted of minor ash eruptions from the summit crater. The current eruption period began in November 2022 and has been characterized by frequent phreatic explosions, gas-and-ash emissions, and sulfur dioxide plumes (BGVN 47:12). This report describes small gas-and-ash explosions during December 2022 through May 2023 based on special reports from the Ministero de Medio Ambiente y Recursos Naturales (MARN).
Activity has been relatively low since the last recorded explosions on 29 November 2022. Seismicity recorded by the San Miguel Volcano Station (VSM) located on the N flank at 1.7 km elevation had decreased by 7 December. Sulfur dioxide gas measurements taken with DOAS (Differential Optical Absorption Spectroscopy) mobile equipment were below typical previously recorded values: 300 tons per day (t/d). During December, small explosions were recorded by the seismic network and manifested as gas-and-steam emissions.
Gas-and-ash explosions in the crater occurred during January 2023, which were recorded by the seismic network. Sulfur dioxide values remained low, between 300-400 t/d through 10 March. At 0817 on 14 January a gas-and-ash emission was visible in webcam images, rising just above the crater rim. Some mornings during February, small gas-and-steam plumes were visible in the crater. On 7 March at 2252 MARN noted an increase in degassing from the central crater; gas emissions were constantly observed through the early morning hours on 8 March. During the early morning of 8 March through the afternoon on 9 March, 12 emissions were registered, some accompanied by ash. The last gas-and-ash emission was recorded at 1210 on 9 March; very fine ashfall was reported in El Tránsito (10 km S), La Morita (6 km W), and La Piedrita (3 km W). The smell of sulfur was reported in Piedra Azul (5 km SW). On 16 March MARN reported that gas-and-steam emissions decreased.
Low degassing and very low seismicity were reported during April; no explosions have been detected between 9 March and 27 May. The sulfur dioxide emissions remained between 350-400 t/d; during 13-20 April sulfur dioxide values fluctuated between 30-300 t/d. Activity remained low through most of May; on 23 May seismicity increased. An explosion was detected at 1647 on 27 May generated a gas-and-ash plume that rose 700 m high (figure 32); a decrease in seismicity and gas emissions followed. The DOAS station installed on the W flank recorded sulfur dioxide values that reached 400 t/d on 27 May; subsequent measurements showed a decrease to 268 t/d on 28 May and 100 t/d on 29 May.
Geologic Background. The symmetrical cone of San Miguel, one of the most active volcanoes in El Salvador, rises from near sea level to form one of the country's most prominent landmarks. A broad, deep, crater complex that has been frequently modified by eruptions recorded since the early 16th century caps the truncated unvegetated summit, also known locally as Chaparrastique. Flanks eruptions of the basaltic-andesitic volcano have produced many lava flows, including several during the 17th-19th centuries that extended to the N, NE, and SE. The SE-flank flows are the largest and form broad, sparsely vegetated lava fields crossed by highways and a railroad skirting the base of the volcano. Flank vent locations have migrated higher on the edifice during historical time, and the most recent activity has consisted of minor ash eruptions from the summit crater.
Information Contacts: Ministero de Medio Ambiente y Recursos Naturales (MARN), Km. 5½ Carretera a Nueva San Salvador, Avenida las Mercedes, San Salvador, El Salvador (URL: http://www.snet.gob.sv/ver/vulcanologia).
Semisopochnoi (United States) — June 2023 Cite this Report
Semisopochnoi
United States
51.93°N, 179.58°E; summit elev. 1221 m
All times are local (unless otherwise noted)
Occasional explosions, ash deposits, and gas-and-steam plumes during December 2022-May 2023
Semisopochnoi is located in the western Aleutians, is 20-km-wide at sea level, and contains an 8-km-wide caldera. The three-peaked Mount Young (formerly Cerberus) was constructed within the caldera during the Holocene. Each of these peaks contains a summit crater; the lava flows on the N flank appear younger than those on the S side. The current eruption period began in early February 2021 and has more recently consisted of intermittent explosions and ash emissions (BGVN 47:12). This report updates activity during December 2022 through May 2023 using daily, weekly, and special reports from the Alaska Volcano Observatory (AVO). AVO monitors the volcano using local seismic and infrasound sensors, satellite data, web cameras, and remote infrasound and lightning networks.
Activity during most of December 2022 was relatively quiet; according to AVO no eruptive or explosive activity was observed since 7 November 2022. Intermittent tremor and occasional small earthquakes were observed in geophysical data. Continuous gas-and-steam emissions were observed from the N crater of Mount Young in webcam images on clear weather days (figure 25). On 24 December, there was a slight increase in earthquake activity and several small possible explosion signals were detected in infrasound data. Eruptive activity resumed on 27 December at the N crater of Mount Young; AVO issued a Volcano Activity Notice (VAN) that reported minor ash deposits on the flanks of Mount Young that extended as far as 1 km from the vent, according to webcam images taken during 27-28 December (figure 26). No ash plumes were observed in webcam or satellite imagery, but a persistent gas-and-steam plume that might have contained some ash rose to 1.5 km altitude. As a result, AVO raised the Aviation Color Code (ACC) to Orange (the second highest level on a four-color scale) and the Volcano Alert Level (VAL) to Watch (the second highest level on a four-level scale). Possible explosions were detected during 21 December 2022 through 1 January 2023 and seismic tremor was recorded during 30-31 December.
During January 2023 eruptive activity continued at the active N crater of Mount Young. Minor ash deposits were observed on the flanks, extending about 2 km SSW, based on webcam images from 1 and 3 January. A possible explosion occurred during 1-2 January based on elevated seismicity recorded on local seismometers and an infrasound signal recorded minutes later by an array at Adak. Though no ash plumes were observed in webcam or satellite imagery, a persistent gas-and-steam plume rose to 1.5 km altitude that might have carried minor traces of ash. Ash deposits were accompanied by periods of elevated seismicity and infrasound signals from the local geophysical network, which AVO reported were likely due to weak explosive activity. Low-level explosive activity was also detected during 2-3 January, with minor gas-and-steam emissions and a new ash deposit that was visible in webcam images. Low-level explosive activity was detected in geophysical data during 4-5 January, with elevated seismicity and infrasound signals observed on local stations. Volcanic tremor was detected during 7-9 January and very weak explosive activity was detected in seismic and infrasound data on 9 January. Weak seismic and infrasound signals were recorded on 17 January, which indicated minor explosive activity, but no ash emissions were observed in clear webcam images; a gas-and-steam plume continued to rise to 1.5 km altitude. During 29-30 January, ash deposits near the summit were observed on fresh snow, according to webcam images.
The active N cone at Mount Young continued to produce a gas-and-steam plume during February, but no ash emissions or explosive events were detected. Seismicity remained elevated with faint tremor during early February. Gas-and-steam emissions from the N crater were observed in clear webcam images on 11-13 and 16 February; no explosive activity was detected in seismic, infrasound, or satellite data. Seismicity has also decreased, with no significant seismic tremor observed since 25 January. Therefore, the ACC was lowered to Yellow (the second lowest level on a four-color scale) and the VAL was lowered to Advisory (the second lowest level on a four-color scale) on 22 February.
Gas-and-steam emissions persisted during March from the N cone of Mount Young, based on clear webcam images. A few brief episodes of weak tremor were detected in seismic data, although seismicity decreased over the month. A gas-and-steam plume detected in satellite data extended 150 km on 18 March. Low-level ash emissions from the N cone at Mount Young were observed in several webcam images during 18-19 March, in addition to small explosions and volcanic tremor. The ACC was raised to Orange and the VAL increased to Watch on 19 March. A small explosion was detected in seismic and infrasound data on 21 March.
Low-level unrest continued during April, although cloudy weather often obscured views of the summit; periods of seismic tremor and local earthquakes were recorded. During 3-4 April a gas-and-steam plume was visible traveling more than 200 km overnight; no ash was evident in the plume, according to AVO. A gas-and-steam plume was observed during 4-6 April that extended 400 km but did not seem to contain ash. Small explosions were detected in seismic and infrasound data on 5 April. Occasional clear webcam images showed continuing gas-and-steam emissions rose from Mount Young, but no ash deposits were observed on the snow. On 19 April small explosions and tremor were detected in seismic and infrasound data. A period of seismic tremor was detected during 22-25 April, with possible weak explosions on 25 April. Ash deposits were visible near the crater rim, but it was unclear if these deposits were recent or due to older deposits.
Occasional small earthquakes were recorded during May, but there were no signs of explosive activity seen in geophysical data. Gas-and-steam emissions continued from the N crater of Mount Young, based on webcam images, and seismicity remained slightly elevated. A new, light ash deposit was visible during the morning of 5 May on fresh snow on the NW flank of Mount Young. During 10 May periods of volcanic tremor were observed. The ACC was lowered to Yellow and the VAL to Advisory on 17 May due to no additional evidence of activity.
Geologic Background. Semisopochnoi, the largest subaerial volcano of the western Aleutians, is 20 km wide at sea level and contains an 8-km-wide caldera. It formed as a result of collapse of a low-angle, dominantly basaltic volcano following the eruption of a large volume of dacitic pumice. The high point of the island is Anvil Peak, a double-peaked late-Pleistocene cone that forms much of the island's northern part. The three-peaked Mount Cerberus (renamed Mount Young in 2023) was constructed within the caldera during the Holocene. Each of the peaks contains a summit crater; lava flows on the N flank appear younger than those on the south side. Other post-caldera volcanoes include the symmetrical Sugarloaf Peak SSE of the caldera and Lakeshore Cone, a small cinder cone at the edge of Fenner Lake in the NE part of the caldera. Most documented eruptions have originated from Young, although Coats (1950) considered that both Sugarloaf and Lakeshore Cone could have been recently active.
Information Contacts: Alaska Volcano Observatory (AVO), a cooperative program of a) U.S. Geological Survey, 4200 University Drive, Anchorage, AK 99508-4667 USA (URL: https://avo.alaska.edu/), b) Geophysical Institute, University of Alaska, PO Box 757320, Fairbanks, AK 99775-7320, USA, and c) Alaska Division of Geological & Geophysical Surveys, 794 University Ave., Suite 200, Fairbanks, AK 99709, USA (URL: http://dggs.alaska.gov/).
Ebeko
Russia
50.686°N, 156.014°E; summit elev. 1103 m
All times are local (unless otherwise noted)
Continued explosions, ash plumes, and ashfall during October 2022-May 2023
Ebeko, located on the N end of Paramushir Island in the Kuril Islands, consists of three summit craters along a SSW-NNE line at the northern end of a complex of five volcanic cones. Eruptions date back to the late 18th century and have been characterized as small-to-moderate explosions from the summit crater, accompanied by intense fumarolic activity. The current eruption period began in June 2022 and has recently consisted of frequent explosions, ash plumes, and thermal activity (BGVN 47:10). This report covers similar activity during October 2022 through May 2023, based on information from the Kamchatka Volcanic Eruptions Response Team (KVERT) and satellite data.
Activity during October consisted of explosive activity, ash plumes, and occasional thermal anomalies. Visual data by volcanologists from Severo-Kurilsk showed explosions producing ash clouds up to 2.1-3 km altitude which drifted E, N, NE, and SE during 1-8, 10, 16, and 18 October. KVERT issued several Volcano Observatory Notices for Aviation (VONA) on 7, 13-15, and 27 October 2022, stating that explosions generated ash plumes that rose to 2.3-4 km altitude and drifted 5 km E, NE, and SE. Ashfall was reported in Severo-Kurilsk (Paramushir Island, about 7 km E) on 7 and 13 October. Satellite data showed a thermal anomaly over the volcano on 15-16 October. Visual data showed ash plumes rising to 2.5-3.6 km altitude on 22, 25-29, and 31 October and moving NE due to constant explosions.
Similar activity continued during November, with explosions, ash plumes, and ashfall occurring. KVERT issued VONAs on 1-2, 4, 6-7, 9, 13, and 16 November that reported explosions and resulting ash plumes that rose to 1.7-3.6 km altitude and drifted 3-5 km SE, ESE, E, and NE. On 1 November ash plumes extended as far as 110 km SE. On 5, 8, 12, and 24-25 November explosions and ash plumes rose to 2-3.1 km altitude and drifted N and E. Ashfall was observed in Severo-Kurilsk on 7 and 16 November. A thermal anomaly was visible during 1-4, 16, and 20 November. Explosions during 26 November rose as high as 2.7 km altitude and drifted NE (figure 45).
Explosions and ash plumes continued to occur in December. During 1-2 and 4 December volcanologists from Severo-Kurilsk observed explosions that sent ash to 1.9-2.5 km altitude and drifted NE and SE (figure 46). VONAs were issued on 5, 9, and 16 December reporting that explosions generated ash plumes rising to 1.9 km, 2.6 km, and 2.4 km altitude and drifted 5 km SE, E, and NE, respectively. A thermal anomaly was visible in satellite imagery on 16 December. On 18 and 27-28 December explosions produced ash plumes that rose to 2.5 km altitude and drifted NE and SE. On 31 December an ash plume rose to 2 km altitude and drifted NE.
Explosions continued during January 2023, based on visual observations by volcanologists from Severo-Kurilsk. During 1-7 January explosions generated ash plumes that rose to 4 km altitude and drifted NE, E, W, and SE. According to VONAs issued by KVERT on 2, 4, 10, and 23 January, explosions produced ash plumes that rose to 2-4 km altitude and drifted 5 km N, NE, E, and ENE; the ash plume that rose to 4 km altitude occurred on 10 January (figure 47). Satellite data showed a thermal anomaly during 3-4, 10, 13, 16, 21, 22, and 31 January. KVERT reported that an ash cloud on 4 January moved 12 km NE. On 6 and 9-11 January explosions sent ash plumes to 4.5 km altitude and drifted W and ESE. On 13 January an ash plume rose to 3 km altitude and drifted SE. During 20-24 January ash plumes from explosions rose to 3.7 km altitude and drifted SE, N, and NE. On 21 January the ash plume drifted as far as 40 km NE. During 28-29 and 31 January and 1 February ash plumes rose to 4 km altitude and drifted NE.
During February, explosions, ash plumes, and ashfall were reported. During 1, 4-5 and 7-8 February explosions generated ash plumes that rose to 4.5 km altitude and drifted E and NE; ashfall was observed on 5 and 8 February. On 6 February an explosion produced an ash plume that rose to 3 km altitude and drifted 7 km E, causing ashfall in Severo-Kurilsk. A thermal anomaly was visible in satellite data on 8, 9, 13, and 21 February. Explosions on 9 and 12-13 February produced ash plumes that rose to 4 km altitude and drifted E and NE; the ash cloud on 12 February extended as far as 45 km E. On 22 February explosions sent ash to 3 km altitude that drifted E. During 24 and 26-27 February ash plumes rose to 4 km altitude and drifted E. On 28 February an explosion sent ash to 2.5-3 km altitude and drifted 5 km E; ashfall was observed in Severo-Kurilsk.
Activity continued during March; visual observations showed that explosions generated ash plumes that rose to 3.6 km altitude on 3, 5-7, and 9-12 March and drifted E, NE, and NW. Thermal anomalies were visible on 10, 13, and 29-30 March in satellite imagery. On 18, 21-23, 26, and 29-30 March explosions produced ash plumes that rose to 2.8 km altitude and drifted NE and E; the ash plumes during 22-23 March extended up to 76 km E. A VONA issued on 21 March reported an explosion that produced an ash plume that rose to 2.8 km altitude and drifted 5 km E. Another VONA issued on 23 March reported that satellite data showed an ash plume rising to 3 km altitude and drifted 14 km E.
Explosions during April continued to generate ash plumes. On 1 and 4 April an ash plume rose to 2.8-3.5 km altitude and drifted SE and NE. A thermal anomaly was visible in satellite imagery during 1-6 April. Satellite data showed ash plumes and clouds rising to 2-3 km altitude and drifting up to 12 km SW and E on 3 and 6 April (figure 48). KVERT issued VONAs on 3, 5, 14, 16 April describing explosions that produced ash plumes rising to 3 km, 3.5 km, 3.5 km, and 3 km altitude and drifting 5 km S, 5 km NE and SE, 72 km NNE, and 5 km NE, respectively. According to satellite data, the resulting ash cloud from the explosion on 14 April was 25 x 7 km in size and drifted 72-104 km NNE during 14-15 April. According to visual data by volcanologists from Severo-Kurilsk explosions sent ash up to 3.5 km altitude that drifted NE and E during 15-16, 22, 25-26, and 29 April.
The explosive eruption continued during May. Explosions during 3-4, 6-7, and 9-10 May generated ash plumes that rose to 4 km altitude and drifted SW and E. Satellite data showed a thermal anomaly on 3, 9, 13-14, and 24 May. During 12-16, 23-25, and 27-28 May ash plumes rose to 3.5 km altitude and drifted in different directions due to explosions. Two VONA notices were issued on 16 and 25 May, describing explosions that generated ash plumes rising to 3 km and 3.5 km altitude, respectively and extending 5 km E. The ash cloud on 25 May drifted 75 km SE.
Thermal activity in the summit crater, occasionally accompanied by ash plumes and ash deposits on the SE and E flanks due to frequent explosions, were visible in infrared and true color satellite images (figure 49).
Geologic Background. The flat-topped summit of the central cone of Ebeko volcano, one of the most active in the Kuril Islands, occupies the northern end of Paramushir Island. Three summit craters located along a SSW-NNE line form Ebeko volcano proper, at the northern end of a complex of five volcanic cones. Blocky lava flows extend west from Ebeko and SE from the neighboring Nezametnyi cone. The eastern part of the southern crater contains strong solfataras and a large boiling spring. The central crater is filled by a lake about 20 m deep whose shores are lined with steaming solfataras; the northern crater lies across a narrow, low barrier from the central crater and contains a small, cold crescentic lake. Historical activity, recorded since the late-18th century, has been restricted to small-to-moderate explosive eruptions from the summit craters. Intense fumarolic activity occurs in the summit craters, on the outer flanks of the cone, and in lateral explosion craters.
Information Contacts: Kamchatka Volcanic Eruptions Response Team (KVERT), Far Eastern Branch, Russian Academy of Sciences, 9 Piip Blvd., Petropavlovsk-Kamchatsky, 683006, Russia (URL: http://www.kscnet.ru/ivs/kvert/); MIROVA (Middle InfraRed Observation of Volcanic Activity), a collaborative project between the Universities of Turin and Florence (Italy) supported by the Centre for Volcanic Risk of the Italian Civil Protection Department (URL: http://www.mirovaweb.it/); Copernicus Browser, Copernicus Data Space Ecosystem, European Space Agency (URL: https://dataspace.copernicus.eu/browser/).
Home Reef
Tonga
18.992°S, 174.775°W; summit elev. -10 m
All times are local (unless otherwise noted)
Discolored plumes continued during November 2022-April 2023
Home Reef is a submarine volcano located in the central Tonga islands between Lateiki (Metis Shoal) and Late Island. The first recorded eruption occurred in the mid-19th century, when an ephemeral island formed. An eruption in 1984 produced a 12-km-high eruption plume, a large volume of floating pumice, and an ephemeral island 500 x 1,500 m wide, with cliffs 30-50 m high that enclosed a water-filled crater. Another island-forming eruption in 2006 produced widespread pumice rafts that drifted as far as Australia; by 2008 the island had eroded below sea level. The previous eruption occurred during October 2022 and was characterized by a new island-forming eruption, lava effusion, ash plumes, discolored water, and gas-and-steam plumes (BGVN 47:11). This report covers discolored water plumes during November 2022 through April 2023 using satellite data.
Discolored plumes continued during the reporting period and were observed in true color satellite images on clear weather days. Satellite images show light green-yellow discolored water extending W on 8 and 28 November 2022 (figure 31), and SW on 18 November. Light green-yellow plumes extended W on 3 December, S on 13 December, SW on 18 December, and W and S on 23 December (figure 31). On 12 January 2023 discolored green-yellow plumes extended to the NE, E, SE, and N. The plume moved SE on 17 January and NW on 22 January. Faint discolored water in February was visible moving NE on 1 February. A discolored plume extended NW on 8 and 28 March and NW on 13 March (figure 31). During April, clear weather showed green-blue discolored plumes moving S on 2 April, W on 7 April, and NE and S on 12 April. A strong green-yellow discolored plume extended E and NE on 22 April for several kilometers (figure 31).
Geologic Background. Home Reef, a submarine volcano midway between Metis Shoal and Late Island in the central Tonga islands, was first reported active in the mid-19th century, when an ephemeral island formed. An eruption in 1984 produced a 12-km-high eruption plume, large amounts of floating pumice, and an ephemeral 500 x 1,500 m island, with cliffs 30-50 m high that enclosed a water-filled crater. In 2006 an island-forming eruption produced widespread dacitic pumice rafts that drifted as far as Australia. Another island was built during a September-October 2022 eruption.
Information Contacts: Copernicus Browser, Copernicus Data Space Ecosystem, European Space Agency (URL: https://dataspace.copernicus.eu/browser/).
Ambae
Vanuatu
15.389°S, 167.835°E; summit elev. 1496 m
All times are local (unless otherwise noted)
New lava flow, ash plumes, and sulfur dioxide plumes during February-May 2023
Ambae, also known as Aoba, is a large basaltic shield volcano in Vanuatu. A broad pyroclastic cone containing three crater lakes (Manaro Ngoru, Voui, and Manaro Lakua) is located at the summit within the youngest of at least two nested calderas. Periodic phreatic and pyroclastic explosions have been reported since the 16th century. A large eruption more than 400 years ago resulted in a volcanic cone within the summit crater that is now filled by Lake Voui; the similarly sized Lake Manaro fills the western third of the caldera. The previous eruption ended in August 2022 that was characterized by gas-and-steam and ash emissions and explosions of wet tephra (BGVN 47:10). This report covers a new eruption during February through May 2023 that consisted of a new lava flow, ash plumes, and sulfur dioxide emissions, using information from the Vanuatu Meteorology and Geo-Hazards Department (VMGD) and satellite data.
During the reporting period, the Alert Level remained at a 2 (on a scale of 0-5), which has been in place since December 2021. Activity during October 2022 through March 2023 remained relatively low and mostly consisted of gas-and-steam emissions in Lake Voui. VMGD reported that at 1300 on 15 November a satellite image captured a strong amount of sulfur dioxide rising above the volcano (figure 99), and that seismicity slightly increased. The southern and northern part of the island reported a strong sulfur dioxide smell and heard explosions. On 20 February 2023 a gas-and-ash plume rose 1.3 km above the summit and drifted SSW, according to a webcam image (figure 100). Gas-and-steam and possibly ash emissions continued on 23 February and volcanic earthquakes were recorded by the seismic network.
During April, volcanic earthquakes and gas-and-steam and ash emissions were reported from the cone in Lake Voui. VMGD reported that activity increased during 5-7 April; high gas-and-steam and ash plumes were visible, accompanied by nighttime incandescence. According to a Wellington VAAC report, a low-level ash plume rose as high as 2.5 km above the summit and drifted W and SW on 5 April, based on satellite imagery. Reports in Saratamata stated that a dark ash plume drifted to the WSW, but no loud explosion was heard. Webcam images from 2100 showed incandescence above the crater and reflected in the clouds. According to an aerial survey, field observations, and satellite data, water was no longer present in the lake. A lava flow was reported effusing from the vent and traveling N into the dry Lake Voui, which lasted three days. The next morning at 0745 on 6 April a gas-and-steam and ash plume rose 5.4 km above the summit and drifted ESE, based on information from VMGD (figure 101). The Wellington VAAC also reported that light ashfall was observed on the island. Intermittent gas-and-steam and ash emissions were visible on 7 April, some of which rose to an estimated 3 km above the summit and drifted E. Webcam images during 0107-0730 on 7 April showed continuing ash emissions. A gas-and-steam and ash plume rose 695 m above the summit crater at 0730 on 19 April and drifted ESE, based on a webcam image (figure 102).
According to visual and infrared satellite data, water was visible in Lake Voui as late as 24 March 2023 (figure 103). The vent in the caldera showed a gas-and-steam plume drifted SE. On 3 April thermal activity was first detected, accompanied by a gas-and-ash plume that drifted W (figure 103). The lava flow moved N within the dry lake and was shown cooling by 8 April. By 23 April much of the water in the lake had returned. Occasional sulfur dioxide plumes were detected by the TROPOMI instrument on the Sentinel-5P satellite that exceeded 2 Dobson Units (DU) and drifted in different directions (figure 104).
Geologic Background. The island of Ambae, also known as Aoba, is a massive 2,500 km3 basaltic shield that is the most voluminous volcano of the New Hebrides archipelago. A pronounced NE-SW-trending rift zone with numerous scoria cones gives the 16 x 38 km island an elongated form. A broad pyroclastic cone containing three crater lakes (Manaro Ngoru, Voui, and Manaro Lakua) is located at the summit within the youngest of at least two nested calderas, the largest of which is 6 km in diameter. That large central edifice is also called Manaro Voui or Lombenben volcano. Post-caldera explosive eruptions formed the summit craters about 360 years ago. A tuff cone was constructed within Lake Voui (or Vui) about 60 years later. The latest known flank eruption, about 300 years ago, destroyed the population of the Nduindui area near the western coast.
Information Contacts: Geo-Hazards Division, Vanuatu Meteorology and Geo-Hazards Department (VMGD), Ministry of Climate Change Adaptation, Meteorology, Geo-Hazards, Energy, Environment and Disaster Management, Private Mail Bag 9054, Lini Highway, Port Vila, Vanuatu (URL: http://www.vmgd.gov.vu/, https://www.facebook.com/VanuatuGeohazardsObservatory/); Wellington Volcanic Ash Advisory Centre (VAAC), Meteorological Service of New Zealand Ltd (MetService), PO Box 722, Wellington, New Zealand (URL: http://www.metservice.com/vaac/, http://www.ssd.noaa.gov/VAAC/OTH/NZ/messages.html); MIROVA (Middle InfraRed Observation of Volcanic Activity), a collaborative project between the Universities of Turin and Florence (Italy) supported by the Centre for Volcanic Risk of the Italian Civil Protection Department (URL: http://www.mirovaweb.it/); Global Sulfur Dioxide Monitoring Page, Atmospheric Chemistry and Dynamics Laboratory, NASA Goddard Space Flight Center (NASA/GSFC), 8800 Greenbelt Road, Goddard, Maryland, USA (URL: https://so2.gsfc.nasa.gov/); Copernicus Browser, Copernicus Data Space Ecosystem, European Space Agency (URL: https://dataspace.copernicus.eu/browser/).
Search Bulletin Archive by Publication Date
Select a month and year from the drop-downs and click "Show Issue" to have that issue displayed in this tab.
The default month and year is the latest issue available.
Bulletin of the Global Volcanism Network - Volume 18, Number 07 (July 1993)
Managing Editor: Edward Venzke
Arenal (Costa Rica)
Lava flows remain active; explosions and pyroclastic-flow activity decrease
CoAxial Segment (Undersea Features)
Submarine lava flow and hydrothermal plumes
Erta Ale (Ethiopia)
Review of satellite data reveals lava lake activity in June 1992
Gamalama (Indonesia)
Explosive ash eruptions produce columns to heights of 3,000 m
Ijen (Indonesia)
Phreatic eruptions from the crater lake
Kama'ehuakanaloa (United States)
Five hours of seismicity on 11 July
Kilauea (United States)
New lava breakout on the Kamoamoa delta reaches the ocean
Klyuchevskoy (Russia)
Gas-and-ash plumes; lava flows down W slope; high seismicity
Krakatau (Indonesia)
Explosions continue; bombs destroy another seismometer
Lengai, Ol Doinyo (Tanzania)
Increased carbonatite lava production; ash eruptions
Manam (Papua New Guinea)
Moderate eruption produces ashfall, pyroclastic flows, and lava flows
Masaya (Nicaragua)
Small ash eruption precedes formation of lava lake; fumarole temperatures rise
Seguam (United States)
Ash eruptions to 2,400 m height; lava flow
Sheveluch (Russia)
Gas-and-steam plume continues
Tongariro (New Zealand)
Fumarole temperatures decrease
Unzendake (Japan)
Exogenous dome growth continues; increased seismicity
Veniaminof (United States)
Ash and steam eruption begins on 30 July; Strombolian activity
Arenal
Costa Rica
10.463°N, 84.703°W; summit elev. 1670 m
All times are local (unless otherwise noted)
Lava flows remain active; explosions and pyroclastic-flow activity decrease
Gas emissions and lava flows continued at Crater C in July, as well as sporadic Strombolian activity that sent ash columns >500 m above the crater rim. Explosions have decreased in quantity and magnitude compared to June. The lava flow that started in mid-April on the SW flank remained active as its W lobe descended another 50 m to 1,150 m elevation and the SW lobe traveled 150 m down to 1,100 m. A new lobe from this flow that formed in early July descended to the SW. A new lava flow was also observed on 20 July moving WNW. At 1022 on 21 July a rock avalanche traveled NW to 1,300 m elevation. Another avalanche was observed later that day at 1100, and seven more occurred from 1314 and 1355. The lowest elevation reached by the fronts of these nine avalanches was 1,150 m.
Three distance lines continued to show minor contraction in 1993. The last measurement was made on 21 July. The radial leveling line on the W flank indicated deflation of 8.9 µrad between 26 August 1992 and 21 July 1993. Deformation measured at most dry-tilt stations was insignificant. However, three stations on the SW and W flanks exhibited cumulative inflation of ~10 µrad since 15 April. The seismic station 2.7 km NE of the active crater (VACR) registered 651 events in July, with the highest daily total on 21 July. Most of the seismicity was associated with ash eruptions and pyroclastic activity. The level of explosive activity was less in June and July than earlier in the year. Tremor averaged 13 hours/day, with the highest daily total of 23 hours recorded on 8 July. There was more tremor in July than in any previous month this year.
The following report, of activity from 25 July to 4 August, is from W. Melson (SI), and V. Barboza and Jorge Barquero (OVSICORI). "Arenal showed an extremely low level of pyroclastic activity during this period, the lowest recorded during regular periods of observations by Smithsonian Institution volunteers since 1987. There have been 18 such observation periods, each lasting about 10 days for 24-hours/day, from the Arenal Observatory Lodge about 2.8 km S of the summit (figure 59). Periods of high tremor were common. Ongoing 3-component seismic measurements have shown that tremor produces weak vertical signals but strong horizontal signals (figure 60). The dominance of horizontal over vertical motion has been characteristic of Arenal's seismicity over the past 3 years. Local observers reported that a large fragment of the WNW rim collapsed around 19 or 20 July, forming a notch through which lava continued to move as of 4 August. The lava flow was moving slowly (~10-30 m/day) down the WNW slope, and had reached ~1,100 m elevation below the new cone being built to an approximate elevation of 1,650 m above old Crater C."
Geologic Background. Conical Volcán Arenal is the youngest stratovolcano in Costa Rica and one of its most active. The 1670-m-high andesitic volcano towers above the eastern shores of Lake Arenal, which has been enlarged by a hydroelectric project. Arenal lies along a volcanic chain that has migrated to the NW from the late-Pleistocene Los Perdidos lava domes through the Pleistocene-to-Holocene Chato volcano, which contains a 500-m-wide, lake-filled summit crater. The earliest known eruptions of Arenal took place about 7000 years ago, and it was active concurrently with Cerro Chato until the activity of Chato ended about 3500 years ago. Growth of Arenal has been characterized by periodic major explosive eruptions at several-hundred-year intervals and periods of lava effusion that armor the cone. An eruptive period that began with a major explosive eruption in 1968 ended in December 2010; continuous explosive activity accompanied by slow lava effusion and the occasional emission of pyroclastic flows characterized the eruption from vents at the summit and on the upper western flank.
Information Contacts: E. Fernández, J. Barquero, R. Van der Laat, F. de Obaldia, T. Marino, V. Barboza, and R. Sáenz, OVSICORI; W. Melson, SI.
CoAxial Segment (Undersea Features) — July 1993 Cite this Report
CoAxial Segment
Undersea Features
46.52°N, 129.58°W; summit elev. -2400 m
All times are local (unless otherwise noted)
Submarine lava flow and hydrothermal plumes
A submarine eruption along the Juan de Fuca Ridge (JDFR) was detected in late June 1993 by the NOAA using hydrophones. Plumes and a lava flow were subsequently identified by research ships along the Coaxial Segment (figure 1), located ~435 km W of the Oregon coast.
On 26 June a burst of low-magnitude and low-frequency (1-30 Hz) T-phase seismicity (~31 events in the first hour) was accompanied by what appeared to be harmonic tremor near the terminus of the N rift zone of Axial Volcano (a hot-spot volcano adjacent to the ridge) near 46.23°N, 129.83°W. Activity migrated ~37 km NNE over the next two days, with the final locus of activity near 46.52°N, 129.60°W. Another swarm of events occurred on 4 July; activity then declined to a few minor events/day. All T-phase activity was probably below the threshold of land-based seismometers, mb < 2.5, though some events may have been larger. Real-time monitoring of the Juan de Fuca Ridge by the NOAA Vents T-Phase Project had begun only four days earlier, on 22 June, using the U.S. Navy Sound Surveillance System (SOSUS). The raw data are transferred to NOAA's Newport, Oregon labs, where time-versus-frequency plots for selected locations are continuously displayed and monitored.
Scientists aboard the Canadian Survey Ship Tully performed Conductivity-Temperature-Depth (CTD)/transmissometer casts on 1-3 July between 46.20°N and 46.55°N, primarily along the W ridge of a large graben where the NE flank of Axial Volcano merges into the JDFR. A transmissometer is a device that measures the amount of particulate matter in the water by shining a light across a short distance and measuring the amount of light received at the other end. Plumes can be mapped in this way independent of temperature anomalies. Plumes were found along the central axis of the graben, extending between approximately 46.33°N and 46.50°N, in close agreement with the T-phase locations. Strong plumes within several hundred meters of the seafloor (bottom depth ~2,400 m) were detected at 46.50°N, 129.59°W, and there was an intense plume at 1,700-1,800 m depth, at least 700 m above the bottom.
On 9 July, the NOAA Ship Discoverer arrived at the site with a full suite of instrumentation, including CTD/transmissometer, chemical scanner, SeaBeam, seafloor volcanic system monitors (rumbleometers), and the Canadian remotely operated vehicle system, ROPOS, equipped with acoustic and differential GPS navigation. The next day, Discoverer's first cast, at 46.50°N, 129.60°W, confirmed the presence of both deep and shallow plumes. Plumes were identified on the basis of thermal and light-attenuation anomalies, as well as large anomalies in dissolved Mn and Fe using a continuously sensing in-situ chemical scanner. Over the next several days, two along-axis, several cross-axis tow-yos, and several vertical CTD casts were completed. The term "tow-yo" describes the process of alternately lowering and raising the CTD instrumentation during the tow, making a saw-toothed survey through the water column. This allows measurement of the upper and lower boundaries of plumes, as well as their lateral extent in two dimensions. The first along-axis CTD tow mapped the large plumes along the segment and above the N swarm area on 12 July.
Lower plumes, extending 39 km along the axis from 46.23°N to 46.57°N, were characterized by temperature anomalies as high as 0.07°C centered ~150-200 m above the seafloor; in some places the temperature anomalies extended within 10 m of the seafloor (generally the closest approach height of the CTD). Upper plumes were well-defined by temperature, light-attenuation, and chemical anomalies, with a maximum rise height of ~800 m and a maximum temperature anomaly of at least 0.18°C. The upper plumes were first found near 46.50°N and later near 46.27°N, and appeared to have a distinct layered structure, perhaps indicative of separate injections of hydrothermal fluid. Although these plumes have rise heights and temperatures similar to the megaplumes discovered over the Cleft Segment of the JDFR (~160 km S at 44.5-45.0°N) in 1986 and 1987, their volume appears much smaller, only several kilometers along and across axis. Preliminary results indicate dissolved Mn and Fe anomalies in the upper plumes exceeding those found in the 1986 and 1987 megaplumes. The well-defined N edge of the plumes approximates the extent of the T-phase swarm area. The S boundary of the plumes is more diffuse, but there is a fairly distinct diminishment at about 46.23°N, approximately the boundary of the S swarm.
Preliminary analysis of radon-222 in plume samples taken on 12 and 19 July shows a distinct decrease in values for the upper plume, supporting the presumption that they were produced by powerful but short-lived hydrothermal discharges and were not resupplied by continuous venting. Radon-222 estimates for the cessation of the hydrothermal event that produced these upper plumes range from 28 June to 1 July, or 2-5 days after the initial T-phase activity. The lower-plume radon-222 values did not decrease between sampling, indicating that they were sustained by continuous venting in mid-July.
The most intense hydrothermal activity was from the center of the axial valley over about 46.52°N. Because of the coincidence between the T-phase swarms and the hydrothermal activity, this area was chosen for detailed study with the remotely operated vehicle ROPOS. The dive traversed the valley floor from E to W and encountered sediment-free, glassy lava on the W-facing slope of a ridge just N of a small, older seamount centered at 46.52°N, 130.59°W. Subsequent traverses over the ENE-oriented lava ridge revealed it to be ~300 m wide and at least 1,500 m long. A 100-m-wide zone centered over the crest was venting warm water through interstices of unfractured pillow and lobate lava flows. Water temperatures were up to 13°C, and the chemical scanner measured high levels of Fe and Mn in the vent fluids. The S end of the lava ridge was within a graben imaged by the ROPOS's Mesotech sonar system. The next ROPOS dive started at the S terminus of the lava ridge and continued S along the trend defined by the ridge crest. An actively venting fracture system was crossed on every subsequent traverse across this trend, extending 6.5 km S to 46.47°N, with water temperatures up to 23°C. The fracture system crosses a lava plateau that bisects the axial valley.
Basalt samples from the recent flow are very fresh-looking lobate to pillowed types. Upper glass selvages are up to 2.5 cm thick and are sparsely plagioclase-phyric. The glass selvages have no sediment cover (except in areas of hydrothermal discharge) and exhibit a shiny iridescent surface. Some of the samples have surficial staining (probably elemental sulfur) as the result of contact with hydrothermal fluids.
The volcanic zone of the Coaxial Segment between 46.10°N and 46.65°N was resurveyed with SeaBeam multibeam sonar. By the time data collection and analysis were complete, a new lava flow had been located with ROPOS at 46.52°N, 129.58°W. The extent of the new lava flow corresponds very closely to an area of depth change identified between SeaBeam surveys. Comparison of the new survey and the 1981 and 1991 SeaBeam surveys showed a depth change of about 30 m. Onshore processing of the data is still in progress, but no other depth changes had been confirmed by 20 Aug; there could be other new lava flows that are below the detection level of SeaBeam. Except for bacterial filaments, the young lava flow was devoid of sessile organisms, whereas adjacent old lavas hosted many non-vent animals.
Geologic Background. The CoAxial segment of the Juan de Fuca Ridge is about 435 km W of the Oregon coast, NE of Axial volcano. A submarine eruption along the CoAxial segment that produced thermal plumes and a new lava flow was detected by acoustic hydrophones in June 1993, just days after installation of the hydrophone system. This was the first deep-sea volcanic eruption detected as it was happening. The location of the eruption was at a depth of about 2,400 m, about 37 km NE of Axial volcano. Bathymetric surveys indicated that one or more additional sea-floor lava extrusions took place immediately east of the 1993 lava flow sometime between 1981-82 and 1991.
Information Contacts: C. Fox, W. Chadwick, R. Embley, and R. Dziak, NOAA Vents T-phase Project.
Erta Ale
Ethiopia
13.601°N, 40.666°E; summit elev. 585 m
All times are local (unless otherwise noted)
Review of satellite data reveals lava lake activity in June 1992
"The visit . . . on 10-11 November 1992 showed that since the last recorded observation, made using Landsat TM data from 9 February 1987, the lava lake in the N crater had disappeared (presumably frozen over and collapsed), but that the lava lake in the S crater . . . was still active. This interpretation is consistent with visual observations made during an aircraft overflight on 21 September 1992 (17:8-9).
"New satellite data further narrow the window of uncertainty about when the N lava lake became inactive, and provide evidence of the continuity of activity at the S lava lake. Data from the Japanese Earth Resources Satellite-1 (JERS-1, also known as Fuyo-1) recorded on 9 June 1992 show the S lava lake to be a strong source of short-wavelength infrared radiation, which is convincing evidence that it was active. However, there is no trace of any short-wavelength infrared thermal radiance from the N lava lake, indicating that the lake had already ceased to exist.
"JERS-1 was launched on 11 February 1992. Its optical sensors record images in three visible channels, and (more importantly for thermal remote sensing of volcanoes) in four short-wavelength infrared channels: 1.55-1.77, 2.01-2.12, 2.13-2.25, and 2.27-2.40 µm. The image pixels are 18 m across. This contrasts with Landsat TM which has 30 m pixels in two short-wavelength infrared channels (1.55-1.75 and 2.08-2.35 µm). This is believed to be the first demonstration that JERS-1 data can play a useful role in volcano monitoring. The thermal anomaly covers an approximately equidimensional area 4-5 pixels across in all four short-wavelength infrared channels, which is roughly consistent with the size of the lava lake seen during fieldwork five months later."
Geologic Background. The Erta Ale basaltic shield volcano in Ethiopia has a 50-km-wide edifice that rises more than 600 m from below sea level in the Danakil depression. The volcano includes a 0.7 x 1.6 km summit crater hosting steep-sided pit craters. Another larger 1.8 x 3.1 km wide depression elongated parallel to the trend of the Erta Ale range is located SE of the summit and is bounded by curvilinear fault scarps on the SE side. Basaltic lava flows from these fissures have poured into the caldera and locally overflowed its rim. The summit caldera usually also holds at least one long-term lava lake that has been active since at least 1967, and possibly since 1906. Recent fissure eruptions have occurred on the N flank.
Information Contacts: D. Rothery, Open Univ.
Gamalama (Indonesia) — July 1993 Cite this Report
Gamalama
Indonesia
0.81°N, 127.3322°E; summit elev. 1714 m
All times are local (unless otherwise noted)
Explosive ash eruptions produce columns to heights of 3,000 m
Ash explosions at 0600 and 0625 on 6 May produced eruption columns that rose 2,500 and 2,000 m, respectively, above the summit. There was also a small eruption at 1500 on 8 May. The strongest explosion occurred at 1338-1352 on 12 May, preceded by detonation sounds and incandescent ballistic bombs. A black ash column from this eruption rose 3,000 m and could be seen from the observatory. About 141,000 m3 of material was erupted. There was no damage caused by this eruption. An Indonesian radio broadcast also reported an eruption on 21 May (18:05). A pilot report described a smoke plume at 1000 on 17 August rising ~ 480 m above the rim before drifting NNW and dissipating.
Geologic Background. Gamalama is a near-conical stratovolcano that comprises the entire island of Ternate off the western coast of Halmahera, and is one of Indonesia's most active volcanoes. The island was a major regional center in the Portuguese and Dutch spice trade for several centuries, which contributed to the extensive documentation of activity. Three cones, progressively younger to the north, form the summit. Several maars and vents define a rift zone, parallel to the Halmahera island arc, that cuts the volcano; the S-flank Ngade maar formed after about 14,500–13,000 cal. BP (Faral et al., 2022). Eruptions, recorded frequently since the 16th century, typically originated from the summit craters, although flank eruptions have occurred in 1763, 1770, 1775, and 1962-63.
Information Contacts: W. Tjetjep, VSI; J. Lynch, SAB.
Ijen
Indonesia
8.058°S, 114.242°E; summit elev. 2769 m
All times are local (unless otherwise noted)
Phreatic eruptions from the crater lake
Three phreatic eruptions occurred from the center of the crater lake in early July, but caused no damage. The eruptions, at 0646 on 3 July and at 0835 and 1045 on 4 July, were preceded by increasing seismicity and tremor. The color of the lake also changed from whitish-green to brown prior to the activity.
Geologic Background. The Ijen volcano complex at the eastern end of Java consists of a group of small stratovolcanoes constructed within the 20-km-wide Ijen (Kendeng) caldera. The north caldera wall forms a prominent arcuate ridge, but elsewhere the rim was buried by post-caldera volcanoes, including Gunung Merapi, which forms the high point of the complex. Immediately west of the Gunung Merapi stratovolcano is the historically active Kawah Ijen crater, which contains a nearly 1-km-wide, turquoise-colored, acid lake. Kawah Ijen is the site of a labor-intensive mining operation in which baskets of sulfur are hand-carried from the crater floor. Many other post-caldera cones and craters are located within the caldera or along its rim. The largest concentration of cones forms an E-W zone across the southern side of the caldera. Coffee plantations cover much of the caldera floor; nearby waterfalls and hot springs are tourist destinations.
Information Contacts: W. Tjetjep, VSI.
Kama'ehuakanaloa (United States) — July 1993 Cite this Report
Kama'ehuakanaloa
United States
18.92°N, 155.27°W; summit elev. -975 m
All times are local (unless otherwise noted)
Five hours of seismicity on 11 July
A flurry of seismicity occurred from Lōʻihi for ~5 hours on the evening of 11 July 1993; only of few events were locatable, the largest was M 2.9. [Originally in Kīlauea report.]
Geologic Background. The Kama’ehuakanaloa seamount, previously known as Loihi, lies about 35 km off the SE coast of the island of Hawaii. This youngest volcano of the Hawaiian chain has an elongated morphology dominated by two curving rift zones extending north and south of the summit. The summit region contains a caldera about 3 x 4 km and exhibits numerous lava cones, the highest of which is about 975 m below the ocean surface. The summit platform also includes two well-defined pit craters, sediment-free glassy lava, and low-temperature hydrothermal venting. An arcuate chain of small cones on the western edge of the summit extends north and south of the pit craters and merges into the crests prominent rift zones. Seismicity indicates a magmatic system distinct from that of Kilauea. During 1996 a new pit crater formed at the summit, and lava flows were erupted. Continued volcanism is expected to eventually build a new island; time estimates for the summit to reach the ocean surface range from roughly 10,000 to 100,000 years.
Information Contacts: P. Okubo, HVO.
Kilauea (United States) — July 1993 Cite this Report
Kilauea
United States
19.421°N, 155.287°W; summit elev. 1222 m
All times are local (unless otherwise noted)
New lava breakout on the Kamoamoa delta reaches the ocean
The . . . eruption continued in July with lava entering the ocean on the E and W sides of the Kamoamoa delta. The W Kamoamoa . . . flow built small benches below the old sea cliff that were soon broken apart by the high surf. Activity at this new flow declined throughout July. Lava entered the ocean along a 160-m-wide front on the E side of the Kamoamoa delta through most of the month. New land continued to be very unstable in this area. On 3 July, most of the lower bench at the E entry collapsed (an estimated area of 20 x 150 m), leaving behind a sliver of bench still attached to the delta. Lava flows quickly built a new bench extending ~35 m into the ocean, and two new littoral cones formed on the bench surface.
Lava tubes drained on 23 July and lava stopped pouring into the ocean . . . . The eruption resumed the next day as lava reoccupied the E-51 tube. Two small flows broke out of the tube; however, most of the erupted material traveled within the tube to the coastal plain. A large pahoehoe sheet-flow broke out just below a fault scarp and spread out over older Kamoamoa flows (figure 92). One part of the flow descended the W side of the Kamoamoa flow and entered the ocean on 27 July. Another finger advanced down the E side of the Kamoamoa flow and entered the ocean on 28 July. Isolated portions of Chain of Craters Road were covered on both sides of the Kamoamoa flow. Lava entered the ocean along wide fronts and explosive activity was rare. However, one large explosion on 28 July blew lithic blocks inland of the W entry point.
A team of French and Swiss geologists who spent the night of 10-11 July at the summit of Pu`u `O`o observed the . . . lava pond for a number of hours. Activity was intense throughout the night, with the level of lava fluctuating 1-2 m. Bubbling was localized in the S and SE parts of the pond. At one point, a large collapse of the inner SSE crater wall produced a wave surge across the lava pond. Waves were several meters high, and covered the entire surface for several seconds. Other smaller landslides occurred during the night, showing the instability of the inner crater walls. The lava pond remained active throughout the month, with the surface fluctuating between 74 and 81 m below the crater rim.
Eruption tremor along the East rift zone continued in July at a relatively steady amplitude of 2x background level. Shallow, long-period microearthquake counts were slightly above average in the first half of the month, but were low later in the month, except for 22-23 July. Counts of short-period events were low beneath the summit and about average along the East rift zone.
Geologic Background. Kilauea overlaps the E flank of the massive Mauna Loa shield volcano in the island of Hawaii. Eruptions are prominent in Polynesian legends; written documentation since 1820 records frequent summit and flank lava flow eruptions interspersed with periods of long-term lava lake activity at Halemaumau crater in the summit caldera until 1924. The 3 x 5 km caldera was formed in several stages about 1,500 years ago and during the 18th century; eruptions have also originated from the lengthy East and Southwest rift zones, which extend to the ocean in both directions. About 90% of the surface of the basaltic shield volcano is formed of lava flows less than about 1,100 years old; 70% of the surface is younger than 600 years. The long-term eruption from the East rift zone between 1983 and 2018 produced lava flows covering more than 100 km2, destroyed hundreds of houses, and added new coastline.
Information Contacts: T. Mattox and P. Okubo, HVO; H. Gaudru, SVE, Switzerland.
Klyuchevskoy (Russia) — July 1993 Cite this Report
Klyuchevskoy
Russia
56.056°N, 160.642°E; summit elev. 4754 m
All times are local (unless otherwise noted)
Gas-and-ash plumes; lava flows down W slope; high seismicity
Steam-and-ash explosions . . . continued in late July and early August. A gas-and-ash plume was rising as high as 3 km above the crater (8 km altitude) and extending to the NW at 1400 on 25 July according to visual observations made from a helicopter by S. Zharinov and O. Braitseva. Lava flows were observed to extend from the summit crater down the W slope of the volcano, entering and melting the glacier at ~3,000 m elev. Seismic activity, including tremor, was stable but at a high level. The direction and height of the plume was about the same the next day as seen from a helicopter, and ashfall took place in Kliuchi [(30 km NNE)]. On 27 July at 2200, the gas-and-ash plume was as high as 5 km above the crater, extending to the S for an unknown distance. A W-flank lava flow was observed at 0030 on 28 July as well as lava fountains 600-700 m above the crater. On July 29 at 1500, the gas-and-ash cloud was 5 km above the crater and extended SW.
Airborne observations in early August indicated that the gas-and-ash plume was generally 1-3 km above the crater, extending to the N or NW for ~50 km. On 3 August, the gas-and-ash plume, as observed from a helicopter by V. Dvigalo and A. Belousov, rose to 6-7 km altitude and extended to the E in the afternoon and to the N that night. Lava continued to flow down the W slope of the volcano, and ash fell again on Kliuchi. Volcanic tremor remained high and steady in late July and early August.
Geologic Background. Klyuchevskoy (also spelled Kliuchevskoi) is Kamchatka's highest and most active volcano. Since its origin about 6000 years ago, the beautifully symmetrical, 4835-m-high basaltic stratovolcano has produced frequent moderate-volume explosive and effusive eruptions without major periods of inactivity. It rises above a saddle NE of sharp-peaked Kamen volcano and lies SE of the broad Ushkovsky massif. More than 100 flank eruptions have occurred during the past roughly 3000 years, with most lateral craters and cones occurring along radial fissures between the unconfined NE-to-SE flanks of the conical volcano between 500 m and 3600 m elevation. The morphology of the 700-m-wide summit crater has been frequently modified by historical eruptions, which have been recorded since the late-17th century. Historical eruptions have originated primarily from the summit crater, but have also included numerous major explosive and effusive eruptions from flank craters.
Information Contacts: S. Zharinov, IVGG.
Krakatau (Indonesia) — July 1993 Cite this Report
Krakatau
Indonesia
6.1009°S, 105.4233°E; summit elev. 285 m
All times are local (unless otherwise noted)
Explosions continue; bombs destroy another seismometer
Anak Krakatau has now been in continuous eruption for nine months . . . . Continued explosions (140-400/day) have built a new cone to ~280-300 m elev, which is 80-100 m above the old peak (figure 7). A seismometer installed by VSI was destroyed by a ballistic bomb on 16 July; lava flows have previously destroyed two other seismometers. Earlier this year, lava flows filled the valley between the cone and the old rim, and overflowed onto the outer slope of the old rim. The April 1993 lava flow descended the N flank to the coast, where it burned trees. The recommended off-limits zone, 3 km from the island, remains in effect.
Geologic Background. The renowned Krakatau (frequently mis-named as Krakatoa) volcano lies in the Sunda Strait between Java and Sumatra. Collapse of an older edifice, perhaps in 416 or 535 CE, formed a 7-km-wide caldera. Remnants of that volcano are preserved in Verlaten and Lang Islands; subsequently the Rakata, Danan, and Perbuwatan cones were formed, coalescing to create the pre-1883 Krakatau Island. Caldera collapse during the catastrophic 1883 eruption destroyed Danan and Perbuwatan, and left only a remnant of Rakata. This eruption caused more than 36,000 fatalities, most as a result of tsunamis that swept the adjacent coastlines of Sumatra and Java. Pyroclastic surges traveled 40 km across the Sunda Strait and reached the Sumatra coast. After a quiescence of less than a half century, the post-collapse cone of Anak Krakatau (Child of Krakatau) was constructed within the 1883 caldera at a point between the former Danan and Perbuwatan cones. Anak Krakatau has been the site of frequent eruptions since 1927.
Information Contacts: W. Tjetjep, VSI.
Ol Doinyo Lengai (Tanzania) — July 1993 Cite this Report
Ol Doinyo Lengai
Tanzania
2.764°S, 35.914°E; summit elev. 2962 m
All times are local (unless otherwise noted)
Increased carbonatite lava production; ash eruptions
Activity since mid-June has perhaps been greater than at any other time during the current eruption . . . . Explosive eruptions have produced ash clouds visible from the surrounding region, and deposited some ash on the outer slopes of the cone. Lava fountaining within the crater has thrown volcanic bombs up to 10 cm long across the crater floor. New vents opened in the S part of the crater floor 8-29 June, where none had existed since detailed observations began in 1988. Carbonatitic lava extrusion down the outer, W slopes of the cone blocked the former climbing route.
Burra Gadiye (Sengo Safaris Ltd.) reached the W crater rim on 6 April. There was little change since late February, although T20 had clearly been the source of lava flows that reached the base of the W wall (figure 28). A loud explosion was heard at 0400 on 22 May at Karatu (70 km S) by Gadiye. An explosion near the summit at that time was later reported by residents of Ngare Sero (~10 km N).
By the time of an 8 June ascent by Gadiye, T20 had grown to the same approximate height as T5/T9, which was emitting steam. A new vent near the N wall (T21), the source of recent lava flows, had no liquid lava visible. There was also a new dome or low mound (T22) near the W wall (figure 29). A large amount of steam was being emitted from a crack between the two buttes near the W rim, between which the path led. An earthquake was reported on 14 June by Gadiye, and dark, dense plumes from the crater could be seen from Ngare Sero, causing local Maasai herdsmen to move their livestock. The next day, Gadiye and some visitors climbed a considerable distance up the W trail before being stopped by flowing lava that apparently originated between the two buttes. Gadiye was able to dip the end of his walking stick into the very liquid lava flow. Dark ash was being erupted from within the summit crater.
Gadiye reported that ash fell on the W flank on 18 June, a black ash cloud rose from the summit at 1300-1500 on 21 June, and ash fell on local residents from 0800 to 1400 on 25 June after black ash clouds were blown E. A pilot who overflew the crater the week before 26 June (M. Bornir), reported that about half the crater was a bubbling black mass, two lava fountains were ejecting black material high into the air at short intervals, a new cone had formed, and smoke was abundant along the crater walls. Small light-colored plumes were seen from the surrounding area on the morning of 26 June, but when a group from St. Lawrence Univ arrived in mid-afternoon, they saw only a few small puffs of ash or steam from the summit at 1818-1821.
On 27 June, C. Nyamweru, C. Shrady, T. Coburn, and G. Cornwell (St. Lawrence Univ), Jumanne Juma (Dorobo Safaris Ltd.), and Danieli Kirway were unable to reach the crater rim from the W. No ash clouds were observed, but steam was seen at or near the W rim and a strong smell of sulfur was occasionally detected far down the outer slopes. A light dusting of fine gray ash on the outer slopes, increasing slightly in thickness towards the rim, covered leaves, spider webs, and small stones. Much of the vegetation near the summit was brown and dead. Steep rock slabs a few hundred meters below the rim were covered with several centimeters of loose ash, making climbing very difficult. The gap between the buttes had been blocked by a rockslide, apparently related to the 15 June lava flow. The dimensions of the lava flow were not measured, but the solid, cold surface was composed of broken slabs, some of which had pahoehoe structures.
Shrady, Coburn, and Cornwell, together with Thad Peterson and J. Juma, reached the E crater rim around 0830 on 29 June; they descended into the crater and remained until just after noon. Most of the crater floor (figure 29) was covered by dark, very fresh lava with both blocky and ropy textures. Much of it was still warm, and small pahoehoe flows were moving on the E half of the main crater floor. Lava flows were especially thick to the S, where the crater floor is now higher than cone T14 in the N. A large slab of the S crater wall near T24 had split from the rim and was standing free on the crater floor. Steam and sulfur fumes were escaping from several areas, particularly the E and N walls; only small amounts of steam were escaping along the W wall. The source of the 15 June lava flow was not determined.
Liquid lava was also erupting from a new vent (T23) just S of T20, with lava fragments being thrown 3-7 m above the rim of the vent at a rate of 4-8 bursts/min. The vent consisted of an outer, smooth, regular conical structure (white in color and higher on the W) surrounding smaller, black cones from which liquid lava was bursting. Activity continued throughout the morning, increasing in frequency and strength by noon, when clots of lava were being thrown 10 m high. The activity sounded like ocean surf, and there was a continuous dull rumble from below the vent. No lava flows issued from T23 that morning, but a very recent flow extended N from between T8 and T14. Lava flows from T23 have covered earlier flows NE of T20.
T20 had grown taller than T5/T9, previously the tallest feature, which was unchanged from February, although the top of the cone was steaming. The upper parts of T8 and T14 were visible, but had some sulfur staining and were surrounded by lava flows from other vents. T8 also exhibited some steam emission and occasional gas bursts. The E side of the T14 cone had collapsed, and was steaming weakly. Vent T24, wider than T20 but not as high, had a partly collapsed open top; its NW wall had collapsed, and it was the source of a large, 7-8 m thick flow of blocky lava (figure 29). On 29 June this flow was not moving, but fragments were falling down the flow front and its color was still dark. A sound similar to flowing water emerged from somewhere below T24. Vent T25, a circular fresh-looking black cone on the floor of the former 'Southern Depression,' was the source of a large flow of blocky lava that covered much of the S crater floor, though no liquid lava was present on 29 June. Feature T26 is a large black half-cone close to the base of the S crater wall, below the summit. Not active on the morning of 29 June, it might have been the source of volcanic bombs (up to 10 cm long) found on the crater floor and on the surface of fairly young lava flows, and possibly the source of some of the ash on the outer slopes. Vent T21 and dome T22, first seen on 8 June, were not observed.
On 3 July (1030-1100), Nyamweru and Shrady flew over the summit under clear conditions. No liquid lava could be seen bubbling in any of the vents or flowing on the crater floor, though much of the S and E parts of the crater were very black. Vegetation was brown on the inner crater walls and high on the outer slopes of the cone. Moderate amounts of steam were escaping from the W and N crater rim, from T20, and from the lower slopes of T5/T9. Sulfur odor could be detected from the aircraft. White ash covered much of the summit, extinct S crater, and the SE slopes, overlying the older gray ash.
Geologic Background. The symmetrical Ol Doinyo Lengai is the only volcano known to have erupted carbonatite tephras and lavas in historical time. The prominent stratovolcano, known to the Maasai as "The Mountain of God," rises abruptly above the broad plain south of Lake Natron in the Gregory Rift Valley. The cone-building stage ended about 15,000 years ago and was followed by periodic ejection of natrocarbonatitic and nephelinite tephra during the Holocene. Historical eruptions have consisted of smaller tephra ejections and emission of numerous natrocarbonatitic lava flows on the floor of the summit crater and occasionally down the upper flanks. The depth and morphology of the northern crater have changed dramatically during the course of historical eruptions, ranging from steep crater walls about 200 m deep in the mid-20th century to shallow platforms mostly filling the crater. Long-term lava effusion in the summit crater beginning in 1983 had by the turn of the century mostly filled the northern crater; by late 1998 lava had begun overflowing the crater rim.
Information Contacts: C. Nyamweru and C. Shrady, St. Lawrence Univ; Thad Peterson and J. Juma, Dorobo Safaris Ltd., Arusha; B. Gadiye, Sengo Safaris Ltd., Arusha; D. Kirway, Monduli, Tanzania; M. Bornir, Nairobi, Kenya; T. Berhault and D. Chevallier, France.
Manam (Papua New Guinea) — July 1993 Cite this Report
Manam
Papua New Guinea
4.08°S, 145.037°E; summit elev. 1807 m
All times are local (unless otherwise noted)
Moderate eruption produces ashfall, pyroclastic flows, and lava flows
"Activity reached a high level in mid-July with a paroxysmal eruption on 14 July from Southern Crater. Activity was then low through the end of the month.
"From 1 to 4 July, both Main and Southern craters released occasional small emissions of mostly white vapours with no audible sounds or night glow. Mild, deep-seated eruptive activity began at Southern Crater on 5 July with occasional forceful emissions of white-grey, ash-laden clouds rising several hundred meters above the summit, accompanied by sub-continuous weak-to-loud roaring and rumbling noises. Rapid degassing started on 7 July with incandescent Strombolian projections up to ~100 m above the summit and rocks cascading down the headwall into SW Valley. This level of activity continued until 11 July, and then declined slightly.
"Activity at Southern Crater intensified at 1200 on 14 July as a new eruptive phase began with continuous strong emission of dark ash-laden clouds. The basaltic scoria-and-ash column reportedly rose to about 11 km and was accompanied by continuous loud roaring sounds. Moderate-heavy ash and scoria fall occurred from 1300 to 2000 on the W flank. Heavy tephra fall caused several hours of partial darkness on the W side of the volcano. The maximum measured ash-fall thickness of 80 mm was recorded between the coastal villages of Yacca and Kuluguma (5 km NW), damaging vegetation and food gardens. No casualties were reported. About 2 mm of ashfall occurred on the mainland at Awar Plantation (20 km W) and Watam village (30 km NW). Ashfall was detected as far as 90 km NW of the volcano. Weather satellite imagery indicated that the emission plume was oriented SW from the volcano and was ~170 km long at 1630 on 14 July.
"Small pyroclastic flows, generated at 1300, descended into SW Valley and stopped 3 km from the coast. At about 1820, moderate-to-large pyroclastic flows in SE Valley stripped and burned vegetation from the upper banks of the valley and along its course before reaching the sea, 5 km from the summit. Lava flows followed the pyroclastic flows into SE and SW Valleys. The largest of the lava flows was in SW Valley, and was ~2.5 km long, 40 m wide, and 3-4 m thick, terminating 3 km from the coast. The level of activity at Southern Crater declined on 15 July and stayed at a low level until the end of the month. Activity consisted of the release of white and blue vapour in small amounts with no audible noises or night glow.
"Main Crater activity remained low throughout the month with the emission of mostly white vapour in small-to-moderate volumes on 6, 16, and 31 July, while moderate volumes of white-grey ash and vapours were released between 7 and 15 July. The seismograph was not operational during most of July. Measurements from water-tube tiltmeters during 1993 have fluctuated over a range of a few microradians, although there may be a slight inflationary trend. The 14 July eruption appears to have had little or no effect on the tilt measurements."
Geologic Background. The 10-km-wide island of Manam, lying 13 km off the northern coast of mainland Papua New Guinea, is one of the country's most active volcanoes. Four large radial valleys extend from the unvegetated summit of the conical basaltic-andesitic stratovolcano to its lower flanks. These valleys channel lava flows and pyroclastic avalanches that have sometimes reached the coast. Five small satellitic centers are located near the island's shoreline on the northern, southern, and western sides. Two summit craters are present; both are active, although most observed eruptions have originated from the southern crater, concentrating eruptive products during much of the past century into the SE valley. Frequent eruptions, typically of mild-to-moderate scale, have been recorded since 1616. Occasional larger eruptions have produced pyroclastic flows and lava flows that reached flat-lying coastal areas and entered the sea, sometimes impacting populated areas.
Information Contacts: B. Talai, R. Stewart, and C. McKee, RVO.
Masaya
Nicaragua
11.9844°N, 86.1688°W; summit elev. 594 m
All times are local (unless otherwise noted)
Small ash eruption precedes formation of lava lake; fumarole temperatures rise
In the last week of March 1993 a fissure was observed to open in the bottom of Santiago crater, with no associated seismic activity. Enlargement of the fissure to 10 m in diameter was accompanied by high-pressure gas emissions. In the first week of April, an earthquake swarm occurred approximately 3 km E of Masaya City; the largest event was M 2.7. At the same time, minor microearthquake activity was registered beneath Santiago crater (1-2 events/day). On 16 June a small ash eruption in the late afternoon lasted for about 13 minutes. That same night incandescence was observed in the bottom of the Santiago crater (BGVN 18:06).
A 7-8 m diameter vent with liquid lava splashing at a depth of about 30-40 m was present on 20 June according to a report by Alain Creusot (BGVN 18:06). An additional report from Creusot indicates that an incandescent hole that had opened above the lava lake was 1-2 m larger in late July. A significant increase in gas emission has maintained a plume rising from the crater. As of 28 June, the temperature of gas emissions from the crater had increased. INETER reported that fumarole temperatures have generally been around 50°C since the beginning of the year, but have now increased to almost 250°C. Seismicity has generally remained low, with a slight increase on 4 July.
Geologic Background. Masaya volcano in Nicaragua has erupted frequently since the time of the Spanish Conquistadors, when an active lava lake prompted attempts to extract the volcano's molten "gold" until it was found to be basalt rock upon cooling. It lies within the massive Pleistocene Las Sierras caldera and is itself a broad, 6 x 11 km basaltic caldera with steep-sided walls up to 300 m high. The caldera is filled on its NW end by more than a dozen vents that erupted along a circular, 4-km-diameter fracture system. The Nindirí and Masaya cones, the source of observed eruptions, were constructed at the southern end of the fracture system and contain multiple summit craters, including the currently active Santiago crater. A major basaltic Plinian tephra erupted from Masaya about 6,500 years ago. Recent lava flows cover much of the caldera floor and there is a lake at the far eastern end. A lava flow from the 1670 eruption overtopped the north caldera rim. Periods of long-term vigorous gas emission at roughly quarter-century intervals have caused health hazards and crop damage.
Information Contacts: Oscar Leonel Urbina, Departamento de Volcanes, INETER; Alain Creusot, Instituto Nicaraguense de Energía, Managua, Nicaragua.
Seguam (United States) — July 1993 Cite this Report
Seguam
United States
52.315°N, 172.51°W; summit elev. 1054 m
All times are local (unless otherwise noted)
Ash eruptions to 2,400 m height; lava flow
Heavy ash eruptions rising 900-1,200 m were reported the morning of 31 July by the U.S. Coast Guard. A lava flow was also noted. According to these observers, the volcano was still erupting sporadically on 10 August, with light- to dark-gray ash plumes rising 2,400 m above the summit. Reports from Atka Island (~110 km W) indicate that weather conditions have frequently prevented observations.
Geologic Background. The 11.5 x 24 km island of Seguam, between Amlia and Amukta Islands in the central Aleutians, contains two calderas with Holocene post-caldera cones. Growth of the basaltic-to-rhyolitic Wilcox volcano on the east side of the island during the late Pleistocene was followed by edifice collapse and an associated ignimbrite eruption about 9,000 years ago, leaving a caldera open to the west, inside which a rhyolitic cone was constructed. The 3 x 4 km westernmost caldera has a central scoria cone, Pyre Peak, which rises above the caldera rim and is the source of most of the reported eruptions. A very young basaltic field surrounds Pyre Peak, and lava flows partially fill the caldera and reach the southern coast. Older Holocene lava flows were erupted from vents within the eastern caldera, and a monogenetic Holocene cone forms Moundhill volcano on the eastern tip of the island.
Information Contacts: AVO.
Sheveluch
Russia
56.653°N, 161.36°E; summit elev. 3283 m
All times are local (unless otherwise noted)
Gas-and-steam plume continues
A gas-and-steam plume was observed on the afternoon of 29 July rising to 3 km above the crater and extending >50 km S. Similar activity, with a gas-and-steam column rising 1-6 km above the rim, has persisted since the 22 April eruption. The volcano has also remained seismically active. Seismicity registered at a station 8 km from the volcano increased 23-24 and 28-29 July, then decreased after 1 August. Weather conditions prevented visual observations of the summit in early August.
Geologic Background. The high, isolated massif of Sheveluch volcano (also spelled Shiveluch) rises above the lowlands NNE of the Kliuchevskaya volcano group. The 1,300 km3 andesitic volcano is one of Kamchatka's largest and most active volcanic structures, with at least 60 large eruptions during the Holocene. The summit of roughly 65,000-year-old Stary Shiveluch is truncated by a broad 9-km-wide late-Pleistocene caldera breached to the south. Many lava domes occur on its outer flanks. The Molodoy Shiveluch lava dome complex was constructed during the Holocene within the large open caldera; Holocene lava dome extrusion also took place on the flanks of Stary Shiveluch. Widespread tephra layers from these eruptions have provided valuable time markers for dating volcanic events in Kamchatka. Frequent collapses of dome complexes, most recently in 1964, have produced debris avalanches whose deposits cover much of the floor of the breached caldera.
Information Contacts: S. Zharinov, IVGG.
Tongariro (New Zealand) — July 1993 Cite this Report
Tongariro
New Zealand
39.157°S, 175.632°E; summit elev. 1978 m
All times are local (unless otherwise noted)
Fumarole temperatures decrease
The following ... is based on fieldwork in late March and early May 1993. "Activity in the crater of Ngāuruhoe has declined further over the past year and is at an all time low since records were first kept. Fumarole temperatures have decreased to 90°C after remaining stable at 94°C (boiling point for altitude) since 1986. No volcanic deformation was identified by surveys to points on the crater rim and at the base of the mountain."
Geologic Background. Tongariro is a large volcanic massif, located immediately NE of Ruapehu volcano, that is composed of more than a dozen composite cones constructed over a period of 275,000 years. Vents along a NE-trending zone extending from Saddle Cone (below Ruapehu) to Te Maari crater (including vents at the present-day location of Ngauruhoe) were active during several hundred years around 10,000 years ago, producing the largest known eruptions at the Tongariro complex during the Holocene. North Crater stratovolcano is truncated by a broad, shallow crater filled by a solidified lava lake that is cut on the NW side by a small explosion crater. The youngest cone, Ngauruhoe, is also the highest peak.
Information Contacts: B. Christenson, I. Nairn, P. Otway, and B. Scott, IGNS, Wairakei.
Unzendake
Japan
32.761°N, 130.299°E; summit elev. 1483 m
All times are local (unless otherwise noted)
Exogenous dome growth continues; increased seismicity
Exogenous growth at dome 11 . . . continued through early August (figure 57). Partial collapses generated about 10 pyroclastic flows/day to the E and NE, leaving a relatively stable part of dome 11 over the remnants of dome 4. No damage was caused by pyroclastic flows in July. Ash-laden plumes from the former Jigokuato crater, rising as high as 1 km, have frequently been observed since mid-July. Volcanic tremor at the summit area increased after 22 July, but no surface changes have been observed.
During growth of dome 11, the E part was pushed outward and has collapsed frequently. A ramp structure formed, and lavas were successively overridden by later flows, like dominoes. The thickness of dome 11 decreased toward the front and lengthened, maintaining the ramp structure. This implies that stretching and sliding along the basal plane are the main reasons for the lengthening of the dome. The E arm of the dome was 400 m long, 150 m wide, and 50 m thick by the end of July, and had grown to 500 m in length by 7 August. Geologists estimated a growth rate of ~200,000 m3/day, with the eruption rate close to 250,000 m3/day.
On 19 July, 32 seismically recorded pyroclastic flows moved E along the Mizunashi Valley, the largest daily count in the month. The series began at 0354 and continued until midnight, including larger flows with seismic durations of 130 seconds at 0415 and 0428, 150 seconds at 0405 and 1131, and 170 seconds at 1700. The largest pyroclastic flow of the series occurred at 1821, with a duration of 190 seconds, and traveled 5.3 km E, crossing Route 57 (figure 58). The road was closed in late June after another pyroclastic flow crossed it. The front of the pyroclastic flow extended 100 m beyond the road, which is the farthest distance a pyroclastic flow has traveled from the active crater during the current period of activity. The longest pyroclastic flows, from W of dome 11, traveled 5.5 km on 8 June and 15 September 1991. There were a total of 353 seismically detected pyroclastic flows in July . . . . The number of evacuees from Shimabara and Fukae has remained unchanged at 3,617 since early July.
The frontal part of the 19 July pyroclastic-flow deposit was as narrow as a few tens of meters, and as long as 1 km (figure 58). Deposits were distributed along a narrow gully within older pyroclastic-flow and debris-flow deposits. A video taken of the 19 July pyroclastic flow showed that the front lobes of the growing ash cloud protruded intermittently from the main mass of the ash cloud for the last 1 km. Ground vibrations, usually recorded by seismometers during movement of block-and-ash flows, had stopped before this event. Deposits at the front of this flow were deficient in large lava blocks, which are common 2 km closer to the source, indicating that these may be a type of pyroclastic-surge deposit.
Seismicity at the lava dome complex was unchanged before and during the pyroclastic-flow activity. Low seismicity at the dome complex, about 20 events/day, was followed by a burst of activity that began on 26 July and culminated with 2,604 events on 7 August, the highest daily count in the present period of volcanism. The previous high was 632 on 11 September 1992. Seismicity gradually declined through 11 August, but remained high at about 800 events/day. Aerial inspections on 3, 5, and 8 August showed no unusual changes on the surface of the dome complex, which continued growing at a rate of 2-3 x 10⁵ m3/day. A total of 1,034 microearthquakes was recorded in July, more than double the total of 506 in June.
Heavy rainfall during the rainy season has frequently caused debris flows along the Nakao and Mizunashi rivers. Debris flows on 4-5 July damaged 25 houses, and another 83 houses were damaged on 16-18 July. Debris flows during the current activity have damaged 1,409 houses. During periods of heavy rainfall, mayors of Shimabara and Fukae issued temporary evacuation orders to 5,000-9,000 residents along the rivers.
Geologic Background. The massive Unzendake volcanic complex comprises much of the Shimabara Peninsula east of the city of Nagasaki. An E-W graben, 30-40 km long, extends across the peninsula. Three large stratovolcanoes with complex structures, Kinugasa on the north, Fugen-dake at the east-center, and Kusenbu on the south, form topographic highs on the broad peninsula. Fugendake and Mayuyama volcanoes in the east-central portion of the andesitic-to-dacitic volcanic complex have been active during the Holocene. The Mayuyama lava dome complex, located along the eastern coast west of Shimabara City, formed about 4000 years ago and was the source of a devastating 1792 CE debris avalanche and tsunami. Historical eruptive activity has been restricted to the summit and flanks of Fugendake. The latest activity during 1990-95 formed a lava dome at the summit, accompanied by pyroclastic flows that caused fatalities and damaged populated areas near Shimabara City.
Information Contacts: JMA; S. Nakada, Kyushu Univ.
Veniaminof (United States) — July 1993 Cite this Report
Veniaminof
United States
56.17°N, 159.38°W; summit elev. 2507 m
All times are local (unless otherwise noted)
Ash and steam eruption begins on 30 July; Strombolian activity
After 6 years of quiet, eruptive activity resumed on 30 July. Observers in Perryville . . . reported seeing black clouds ejected from the summit beginning at 1430 on 30 July and continuing into early August. A white steam cloud was present during the intervals between black emissions. A small eruption plume was observed on satellite imagery by the U.S. National Weather Service on 30 July, but none were seen in the following days. On the morning of 31 July, Perryville observers saw a gray cloud rising from the volcano and extending to the S. Commercial airline pilots on 2 August observed continued intermittent venting of black ash with a low ash cloud rising nearly 300 m.
Pilot reports on 3 August indicated that black ash was erupting from the summit vent of the intracaldera cone at 30-60 second intervals to a height of 2,400-3,000 m above sea level (840 m above the vent). Pilot reports also described a new steam vent that had formed in the icefield adjacent to the active cone, with the melting perhaps caused by a subglacial lava flow. At mid-day on 3 August, pilots of Reeve Aleutian Airways and personnel from the FWS (Alaska Peninsula/Becharof National Wildlife Refuge) observed the eruption site. They described intermittent ash emission and block ejection from the prominent cinder cone (summit elevation 2,160 m) located within the summit caldera. Material was being thrown an estimated 150-300 m above the cone. Steam was emanating from a depression 180-275 m wide in the glacial ice E of the cone's base. Residents of Port Heiden . . . reported a very light ash fall on the night of 3 August. Residents of Perryville, Chignik, and Chignik Lake, S and E of the volcano, also heard a "rumbling noise" accompanied by a slight tremor at about 2200 that night.
On the morning of 6 August, a resident of Port Heiden observed eruptions of ash and steam occurring at 3-4 minute intervals. These small plumes were reaching only several tens of meters above the summit. There were no reports of ashfall at other nearby villages. On 12 August, a pilot reported ash venting 600-900 m above the crater with the ash cloud carried ENE.
Observations indicate that the eruption is Strombolian (characterized by intermittent bursts of molten material several tens of meters above the vent), similar to previous historical eruptions at this volcano. As this activity continues, occasional ash falls are possible at Perryville and other nearby villages. AVO has no seismic monitoring equipment on Veniaminof and for this reason is not using the Level of Concern Color Code. A scientist from the Geophysical Institute at the Univ of Alaska installed a seismometer in Perryville on 4 August and an additional instrument will be installed closer to the volcano. These should aid efforts to identify future continuing activity.
Geologic Background. Veniaminof, on the Alaska Peninsula, is truncated by a steep-walled, 8 x 11 km, glacier-filled caldera that formed around 3,700 years ago. The caldera rim is up to 520 m high on the north, is deeply notched on the west by Cone Glacier, and is covered by an ice sheet on the south. Post-caldera vents are located along a NW-SE zone bisecting the caldera that extends 55 km from near the Bering Sea coast, across the caldera, and down the Pacific flank. Historical eruptions probably all originated from the westernmost and most prominent of two intra-caldera cones, which rises about 300 m above the surrounding icefield. The other cone is larger, and has a summit crater or caldera that may reach 2.5 km in diameter, but is more subdued and barely rises above the glacier surface.
Information Contacts: AVO.