Recently Published Bulletin Reports
Manam (Papua New Guinea) Few ash plumes during November-December 2022
Krakatau (Indonesia) Strombolian activity and ash plumes during November 2022-April 2023
Stromboli (Italy) Strombolian explosions and lava flows continue during January-April 2023
Nishinoshima (Japan) Small ash plumes and fumarolic activity during November 2022 through April 2023
Karangetang (Indonesia) Lava flows, incandescent avalanches, and ash plumes during January-June 2023
Ahyi (United States) Intermittent hydroacoustic signals and discolored plumes during November 2022-June 2023
Kadovar (Papua New Guinea) An ash plume and weak thermal anomaly during May 2023
San Miguel (El Salvador) Small gas-and-ash explosions during March and May 2023
Semisopochnoi (United States) Occasional explosions, ash deposits, and gas-and-steam plumes during December 2022-May 2023
Ebeko (Russia) Continued explosions, ash plumes, and ashfall during October 2022-May 2023
Home Reef (Tonga) Discolored plumes continued during November 2022-April 2023
Ambae (Vanuatu) New lava flow, ash plumes, and sulfur dioxide plumes during February-May 2023
Manam (Papua New Guinea) — July 2023  Cite this Report
Manam
Papua New Guinea
4.08°S, 145.037°E; summit elev. 1807 m
All times are local (unless otherwise noted)
Few ash plumes during November-December 2022
Manam is a 10-km-wide island that consists of two active summit craters: the Main summit crater and the South summit crater and is located 13 km off the northern coast of mainland Papua New Guinea. Frequent mild-to-moderate eruptions have been recorded since 1616. The current eruption period began during June 2014 and has more recently been characterized by intermittent ash plumes and thermal activity (BGVN 47:11). This report updates activity that occurred from November 2022 through May 2023 based on information from the Darwin Volcanic Ash Advisory Center (VAAC) and various satellite data.
Ash plumes were reported during November and December 2022 by the Darwin VAAC. On 7 November an ash plume rose to 2.1 km altitude and drifted NE based on satellite images and weather models. On 14 November an ash plume rose to 2.1 km altitude and drifted W based on RVO webcam images. On 20 November ash plumes rose to 1.8 km altitude and drifted NW. On 26 December an ash plume rose to 3 km altitude and drifted S and SSE.
Intermittent sulfur dioxide plumes were detected using the TROPOMI instrument on the Sentinel-5P satellite, some of which exceeded at least two Dobson Units (DU) and drifted in different directions (figure 93). Occasional low-to-moderate power thermal anomalies were recorded by the MIROVA (Middle InfraRed Observation of Volcanic Activity) system; less than five anomalies were recorded each month during November 2022 through May 2023 (figure 94). Two thermal hotspots were detected by the MODVOLC thermal alerts system on 10 December 2022. On clear weather days, thermal activity was also captured in infrared satellite imagery in both the Main and South summit craters, accompanied by gas-and-steam emissions (figure 95).
Geologic Background. The 10-km-wide island of Manam, lying 13 km off the northern coast of mainland Papua New Guinea, is one of the country's most active volcanoes. Four large radial valleys extend from the unvegetated summit of the conical basaltic-andesitic stratovolcano to its lower flanks. These valleys channel lava flows and pyroclastic avalanches that have sometimes reached the coast. Five small satellitic centers are located near the island's shoreline on the northern, southern, and western sides. Two summit craters are present; both are active, although most observed eruptions have originated from the southern crater, concentrating eruptive products during much of the past century into the SE valley. Frequent eruptions, typically of mild-to-moderate scale, have been recorded since 1616. Occasional larger eruptions have produced pyroclastic flows and lava flows that reached flat-lying coastal areas and entered the sea, sometimes impacting populated areas.
Information Contacts: Rabaul Volcano Observatory (RVO), Geohazards Management Division, Department of Mineral Policy and Geohazards Management (DMPGM), PO Box 3386, Kokopo, East New Britain Province, Papua New Guinea; Darwin Volcanic Ash Advisory Centre (VAAC), Bureau of Meteorology, Northern Territory Regional Office, PO Box 40050, Casuarina, NT 0811, Australia (URL: http://www.bom.gov.au/info/vaac/); MIROVA (Middle InfraRed Observation of Volcanic Activity), a collaborative project between the Universities of Turin and Florence (Italy) supported by the Centre for Volcanic Risk of the Italian Civil Protection Department (URL: http://www.mirovaweb.it/); Hawai'i Institute of Geophysics and Planetology (HIGP) - MODVOLC Thermal Alerts System, School of Ocean and Earth Science and Technology (SOEST), Univ. of Hawai'i, 2525 Correa Road, Honolulu, HI 96822, USA (URL: http://modis.higp.hawaii.edu/); NASA Global Sulfur Dioxide Monitoring Page, Atmospheric Chemistry and Dynamics Laboratory, NASA Goddard Space Flight Center (NASA/GSFC), 8800 Greenbelt Road, Goddard, Maryland, USA (URL: https://so2.gsfc.nasa.gov/); Copernicus Browser, Copernicus Data Space Ecosystem, European Space Agency (URL: https://dataspace.copernicus.eu/browser/).
Krakatau (Indonesia) — July 2023 Cite this Report
Krakatau
Indonesia
6.1009°S, 105.4233°E; summit elev. 285 m
All times are local (unless otherwise noted)
Strombolian activity and ash plumes during November 2022-April 2023
Krakatau is located in the Sunda Strait between Java and Sumatra, Indonesia. Caldera collapse during the catastrophic 1883 eruption destroyed Danan and Perbuwatan cones and left only a remnant of Rakata. The post-collapse cone of Anak Krakatau (Child of Krakatau) was constructed within the 1883 caldera at a point between the former Danan and Perbuwatan cones; it has been the site of frequent eruptions since 1927. The current eruption period began in May 2021 and has recently consisted of explosions, ash plumes, and thermal activity (BGVN 47:11). This report covers activity during November 2022 through April 2023 based on information provided by the Indonesian Center for Volcanology and Geological Hazard Mitigation, referred to as Pusat Vulkanologi dan Mitigasi Bencana Geologi (PVMBG), MAGMA Indonesia, the Darwin Volcanic Ash Advisory Center (VAAC), and several sources of satellite data.
Activity was relatively low during November and December 2022. Daily white gas-and-steam plumes rose 25-100 m above the summit and drifted in different directions. Gray ash plumes rose 200 m above the summit and drifted NE at 1047 and at 2343 on 11 November. On 14 November at 0933 ash plumes rose 300 m above the summit and drifted E. An ash plume was reported at 0935 on 15 December that rose 100 m above the summit and drifted NE. An eruptive event at 1031 later that day generated an ash plume that rose 700 m above the summit and drifted NE. A gray ash plume at 1910 rose 100 m above the summit and drifted E. Incandescent material was ejected above the vent based on an image taken at 1936.
During January 2023 daily white gas-and-steam plumes rose 25-300 m above the summit and drifted in multiple directions. Gray-to-brown ash plumes were reported at 1638 on 3 January, at 1410 and 1509 on 4 January, and at 0013 on 5 January that rose 100-750 m above the summit and drifted NE and E; the gray-to-black ash plume at 1509 on 4 January rose as high as 3 km above the summit and drifted E. Gray ash plumes were recorded at 1754, 2241, and 2325 on 11 January and at 0046 on 12 January and rose 200-300 m above the summit and drifted NE. Toward the end of January, PVMBG reported that activity had intensified; Strombolian activity was visible in webcam images taken at 0041, 0043, and 0450 on 23 January. Multiple gray ash plumes throughout the day rose 200-500 m above the summit and drifted E and SE (figure 135). Webcam images showed progressively intensifying Strombolian activity at 1919, 1958, and 2113 on 24 January; a gray ash plume at 1957 rose 300 m above the summit and drifted E (figure 135). Eruptive events at 0231 and 2256 on 25 January and at 0003 on 26 January ejected incandescent material from the vent, based on webcam images. Gray ash plumes observed during 26-27 January rose 300-500 m above the summit and drifted NE, E, and SE.
Low levels of activity were reported during February and March. Daily white gas-and-steam plumes rose 25-300 m above the summit and drifted in different directions. The Darwin VAAC reported that continuous ash emissions rose to 1.5-1.8 km altitude and drifted W and NW during 1240-1300 on 10 March, based on satellite images, weather models, and PVMBG webcams. White-and-gray ash plumes rose 500 m and 300 m above the summit and drifted SW at 1446 and 1846 on 18 March, respectively. An eruptive event was recorded at 2143, though it was not visible due to darkness. Multiple ash plumes were reported during 27-29 March that rose as high as 2.5 km above the summit and drifted NE, W, and SW (figure 136). Webcam images captured incandescent ejecta above the vent at 0415 and around the summit area at 2003 on 28 March and at 0047 above the vent on 29 March.
Daily white gas-and-steam plumes rose 25-300 m above the summit and drifted in multiple directions during April and May. White-and-gray and black plumes rose 50-300 m above the summit on 2 and 9 April. On 11 May at 1241 a gray ash plume rose 1-3 km above the summit and drifted SW. On 12 May at 0920 a gray ash plume rose 2.5 km above the summit and drifted SW and at 2320 an ash plume rose 1.5 km above the summit and drifted SW. An accompanying webcam image showed incandescent ejecta. On 13 May at 0710 a gray ash plume rose 2 km above the summit and drifted SW (figure 137).
The MIROVA (Middle InfraRed Observation of Volcanic Activity) graph of MODIS thermal anomaly data showed intermittent low-to-moderate power thermal anomalies during November 2022 through April 2023 (figure 138). Some of this thermal activity was also visible in infrared satellite imagery at the crater, accompanied by gas-and-steam and ash plumes that drifted in different directions (figure 139).
Geologic Background. The renowned Krakatau (frequently mis-named as Krakatoa) volcano lies in the Sunda Strait between Java and Sumatra. Collapse of an older edifice, perhaps in 416 or 535 CE, formed a 7-km-wide caldera. Remnants of that volcano are preserved in Verlaten and Lang Islands; subsequently the Rakata, Danan, and Perbuwatan cones were formed, coalescing to create the pre-1883 Krakatau Island. Caldera collapse during the catastrophic 1883 eruption destroyed Danan and Perbuwatan, and left only a remnant of Rakata. This eruption caused more than 36,000 fatalities, most as a result of tsunamis that swept the adjacent coastlines of Sumatra and Java. Pyroclastic surges traveled 40 km across the Sunda Strait and reached the Sumatra coast. After a quiescence of less than a half century, the post-collapse cone of Anak Krakatau (Child of Krakatau) was constructed within the 1883 caldera at a point between the former Danan and Perbuwatan cones. Anak Krakatau has been the site of frequent eruptions since 1927.
Information Contacts: Pusat Vulkanologi dan Mitigasi Bencana Geologi (PVMBG, also known as Indonesian Center for Volcanology and Geological Hazard Mitigation, CVGHM), Jalan Diponegoro 57, Bandung 40122, Indonesia (URL: http://www.vsi.esdm.go.id/); MAGMA Indonesia, Kementerian Energi dan Sumber Daya Mineral (URL: https://magma.esdm.go.id/v1); Darwin Volcanic Ash Advisory Centre (VAAC), Bureau of Meteorology, Northern Territory Regional Office, PO Box 40050, Casuarina, NT 0811, Australia (URL: http://www.bom.gov.au/info/vaac/); MIROVA (Middle InfraRed Observation of Volcanic Activity), a collaborative project between the Universities of Turin and Florence (Italy) supported by the Centre for Volcanic Risk of the Italian Civil Protection Department (URL: http://www.mirovaweb.it/); Copernicus Browser, Copernicus Data Space Ecosystem, European Space Agency (URL: https://dataspace.copernicus.eu/browser/).
Stromboli
Italy
38.789°N, 15.213°E; summit elev. 924 m
All times are local (unless otherwise noted)
Strombolian explosions and lava flows continue during January-April 2023
Stromboli, located in Italy, has exhibited nearly constant lava fountains for the past 2,000 years; recorded eruptions date back to 350 BCE. Eruptive activity occurs at the summit from multiple vents, which include a north crater area (N area) and a central-southern crater (CS area) on a terrace known as the ‘terrazza craterica’ at the head of the Sciara del Fuoco, a large scarp that runs from the summit down the NW side of the volcano-island. Activity typically consists of Strombolian explosions, incandescent ejecta, lava flows, and pyroclastic flows. Thermal and visual monitoring cameras are located on the nearby Pizzo Sopra La Fossa, above the terrazza craterica, and at multiple flank locations. The current eruption period has been ongoing since 1934 and recent activity has consisted of frequent Strombolian explosions and lava flows (BGVN 48:02). This report updates activity during January through April 2023 primarily characterized by Strombolian explosions and lava flows based on reports from Italy's Istituto Nazionale di Geofisica e Vulcanologia (INGV) and various satellite data.
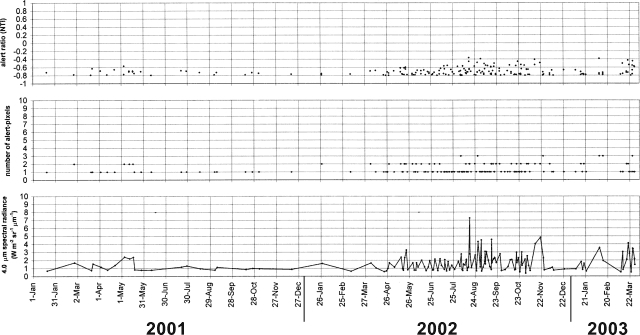
Frequent explosive activity continued throughout the reporting period, generally in the low-to-medium range, based on the number of hourly explosions in the summit crater (figure 253, table 16). Intermittent thermal activity was recorded by the MIROVA (Middle InfraRed Observation of Volcanic Activity) analysis of MODIS satellite data (figure 254). According to data collected by the MODVOLC thermal algorithm, a total of 9 thermal alerts were detected: one on 2 January 2023, one on 1 February, five on 24 March, and two on 26 March. The stronger pulses of thermal activity likely reflected lava flow events. Infrared satellite imagery captured relatively strong thermal hotspots at the two active summit craters on clear weather days, showing an especially strong event on 8 March (figure 255).
Table 16. Summary of type, frequency, and intensity of explosive activity at Stromboli by month during January-April 2023; information from webcam observations. Courtesy of INGV weekly reports.
| Month |
Explosive Activity |
| Jan 2023 |
Typical Strombolian activity with spattering and lava overflows in the N crater area. Explosions were reported from 4 vents in the N area and 1-2 vents in the CS area. The average hourly frequency of explosions was low-to-medium (1-12 events/hour). The intensity of the explosions varied from low (less than 80 m high) to medium (less than 150 m high) in the N crater area and up to high (greater than 150 m high) in the CS crater area. |
| Feb 2023 |
Typical Strombolian activity with spattering in the N crater area. Explosions were reported from 2-3 vents in the N area and 1-4 vents in the CS area. The average hourly frequency of explosions was low-to-medium (1-14 events/hour). The intensity of the explosions varied from low (less than 80 m high) to medium (less than 150 m high) in the N crater area and up to high (greater than 150 m high) in the CS crater area. |
| Mar 2023 |
Typical Strombolian activity with spattering and lava overflows in the N crater area. Explosions were reported from 2-3 vents in the N area and 2-4 vents in the CS area. The average hourly frequency of explosions was low-to-medium (1-18 events/hour). The intensity of the explosions varied from low (less than 80 m high) to medium (less than 150 m high) in the N crater area and up to high (greater than 150 m high) in the CS crater area. |
| Apr 2023 |
Typical Strombolian activity. Explosions were reported from 2 vents in the N area and 2-3 vents in the CS area. The average hourly frequency of explosions was low-to-high (1-16 events/hour). The intensity of the explosions varied from low (less than 80 m high) to medium (less than 150 m high) in both the N and CS crater areas. |
Activity during January-February 2023. Strombolian explosions were reported in the N crater area, as well as lava effusion. Explosive activity in the N crater area ejected coarse material (bombs and lapilli). Intense spattering was observed in both the N1 and N2 craters. In the CS crater area, explosions generally ejected fine material (ash), sometimes to heights greater than 250 m. The intensity of the explosions was characterized as low-to-medium in the N crater and medium-to-high in the CS crater. After intense spattering activity from the N crater area, a lava overflow began at 2136 on 2 January that flowed part way down the Sciara del Fuoco, possibly moving down the drainage that formed in October, out of view from webcams. The flow remained active for a couple of hours before stopping and beginning to cool. A second lava flow was reported at 0224 on 4 January that similarly remained active for a few hours before stopping and cooling. Intense spattering was observed on 11 and 13 January from the N1 crater. After intense spattering activity at the N2 crater at 1052 on 17 January another lava flow started to flow into the upper part of the Sciara del Fuoco (figure 256), dividing into two: one that traveled in the direction of the drainage formed in October, and the other one moving parallel to the point of emission. By the afternoon, the rate of the flow began to decrease, and at 1900 it started to cool. A lava flow was reported at 1519 on 24 January following intense spattering in the N2 area, which began to flow into the upper part of the Sciara del Fuoco. By the morning of 25 January, the lava flow had begun to cool. During 27 January the frequency of eruption in the CS crater area increased to 6-7 events/hour compared to the typical 1-7 events/hour; the following two days showed a decrease in frequency to less than 1 event/hour. Starting at 1007 on 30 January a high-energy explosive sequence was produced by vents in the CS crater area. The sequence began with an initial energetic pulse that lasted 45 seconds, ejecting predominantly coarse products 300 m above the crater that fell in an ESE direction. Subsequent and less intense explosions ejected material 100 m above the crater. The total duration of this event lasted approximately two minutes. During 31 January through 6, 13, and 24 February spattering activity was particularly intense for short periods in the N2 crater.
An explosive sequence was reported on 16 February that was characterized by a major explosion in the CS crater area (figure 257). The sequence began at 1817 near the S2 crater that ejected material radially. A few seconds later, lava fountains were observed in the central part of the crater. Three explosions of medium intensity (material was ejected less than 150 m high) were recorded at the S2 crater. The first part of this sequence lasted approximately one minute, according to INGV, and material rose 300 m above the crater and then was deposited along the Sciara del Fuoco. The second phase began at 1818 at the S1 crater; it lasted seven seconds and material was ejected 150 m above the crater. Another event 20 seconds later lasted 12 seconds, also ejecting material 150 m above the crater. The sequence ended with at least three explosions of mostly fine material from the S1 crater. The total duration of this sequence was about two minutes.
Short, intense spattering activity was noted above the N1 crater on 27 and 28 February. A lava overflow was first reported at 0657 from the N2 crater on 27 February that flowed into the October 2022 drainage. By 1900 the flow had stopped. A second lava overflow also in the N crater area occurred at 2149, which overlapped the first flow and then stopped by 0150 on 28 February. Material detached from both the lava overflows rolled down the Sciara del Fuoco, some of which was visible in webcam images.
Activity during March-April 2023. Strombolian activity continued with spattering activity and lava overflows in the N crater area during March. Explosive activity at the N crater area varied from low (less than 80 m high) to medium (less than 150 m high) and ejected coarse material, such as bombs and lapilli. Spattering was observed above the N1 crater, while explosive activity at the CS crater area varied from medium to high (greater than 150 m high) and ejected coarse material. Intense spattering activity was observed for short periods on 6 March above the N1 crater. At approximately 0610 a lava overflow was reported around the N2 crater on 8 March, which then flowed into the October 2022 drainage. By 1700 the flow started to cool. A second overflow began at 1712 on 9 March and overlapped the previous flow. It had stopped by 2100. Material from both flows was deposited along the Sciara del Fuoco, though much of the activity was not visible in webcam images. On 11 March a lava overflow was observed at 0215 that overlapped the two previous flows in the October 2022 drainage. By late afternoon on 12 March, it had stopped.
During a field excursion on 16 March, scientists noted that a vent in the central crater area was degassing. Another vent showed occasional Strombolian activity that emitted ash and lapilli. During 1200-1430 low-to-medium intense activity was reported; the N1 crater emitted ash emissions and the N2 crater emitted both ash and coarse material. Some explosions also occurred in the CS crater area that ejected coarse material. The C crater in the CS crater area occasionally showed gas jetting and low intensity explosions on 17 and 22 March; no activity was observed at the S1 crater. Intense, longer periods of spattering were reported in the N1 crater on 19, 24, and 25 March. Around 2242 on 23 March a lava overflow began from the N1 crater that, after about an hour, began moving down the October 2022 drainage and flow along the Sciara del Fuoco (figure 258). Between 0200 and 0400 on 26 March the flow rate increased, which generated avalanches of material from collapses at the advancing flow front. By early afternoon, the flow began to cool. On 25 March at 1548 an explosive sequence began from one of the vents at S2 in the CS crater area (figure 258). Fine ash mixed with coarse material was ejected 300 m above the crater rim and drifted SSE. Some modest explosions around Vent C were detected at 1549 on 25 March, which included an explosion at 1551 that ejected coarse material. The entire explosive sequence lasted approximately three minutes.
During April explosions persisted in both the N and CS crater areas. Fine material was ejected less than 80 m above the N crater rim until 6 April, followed by ejection of coarser material. Fine material was also ejected less than 80 m above the CS crater rim. The C and S2 crater did not show significant eruptive activity. On 7 April an explosive sequence was detected in the CS crater area at 1203 (figure 259). The first explosion lasted approximately 18 seconds and ejected material 400 m above the crater rim, depositing pyroclastic material in the upper part of the Sciara del Fuoco. At 1204 a second, less intense explosion lasted approximately four seconds and deposited pyroclastic products outside the crater area and near Pizzo Sopra La Fossa. A third explosion at 1205 was mainly composed of ash that rose about 150 m above the crater and lasted roughly 20 seconds. A fourth explosion occurred at 1205 about 28 seconds after the third explosion and ejected a mixture of coarse and fine material about 200 m above the crater; the explosion lasted roughly seven seconds. Overall, the entire explosive sequence lasted about two minutes and 20 seconds. After the explosive sequence on 7 April, explosions in both the N and CS crater areas ejected material as high as 150 m above the crater.
On 21 April research scientists from INGV made field observations in the summit area of Stromboli, and some lapilli samples were collected. In the N crater area near the N1 crater, a small cone was observed with at least two active vents, one of which was characterized by Strombolian explosions. The other vent produced explosions that ejected ash and chunks of cooled lava. At the N2 crater at least one vent was active and frequently emitted ash. In the CS crater area, a small cone contained 2-3 degassing vents and a smaller, possible fissure area also showed signs of degassing close to the Pizzo Sopra La Fossa. In the S part of the crater, three vents were active: a small hornito was characterized by modest and rare explosions, a vent that intermittently produced weak Strombolian explosions, and a vent at the end of the terrace that produced frequent ash emissions. Near the S1 crater there was a hornito that generally emitted weak gas-and-steam emissions, sometimes associated with “gas rings”. On 22 April another field inspection was carried out that reported two large sliding surfaces on the Sciara del Fuoco that showed where blocks frequently descended toward the sea. A thermal anomaly was detected at 0150 on 29 April.
Geologic Background. Spectacular incandescent nighttime explosions at Stromboli have long attracted visitors to the "Lighthouse of the Mediterranean" in the NE Aeolian Islands. This volcano has lent its name to the frequent mild explosive activity that has characterized its eruptions throughout much of historical time. The small island is the emergent summit of a volcano that grew in two main eruptive cycles, the last of which formed the western portion of the island. The Neostromboli eruptive period took place between about 13,000 and 5,000 years ago. The active summit vents are located at the head of the Sciara del Fuoco, a prominent scarp that formed about 5,000 years ago due to a series of slope failures which extends to below sea level. The modern volcano has been constructed within this scarp, which funnels pyroclastic ejecta and lava flows to the NW. Essentially continuous mild Strombolian explosions, sometimes accompanied by lava flows, have been recorded for more than a millennium.
Information Contacts: Istituto Nazionale di Geofisica e Vulcanologia (INGV), Sezione di Catania, Piazza Roma 2, 95123 Catania, Italy, (URL: http://www.ct.ingv.it/en/); MIROVA (Middle InfraRed Observation of Volcanic Activity), a collaborative project between the Universities of Turin and Florence (Italy) supported by the Centre for Volcanic Risk of the Italian Civil Protection Department (URL: http://www.mirovaweb.it/); Hawai'i Institute of Geophysics and Planetology (HIGP) - MODVOLC Thermal Alerts System, School of Ocean and Earth Science and Technology (SOEST), Univ. of Hawai'i, 2525 Correa Road, Honolulu, HI 96822, USA (URL: http://modis.higp.hawaii.edu/); Copernicus Browser, Copernicus Data Space Ecosystem, European Space Agency (URL: https://dataspace.copernicus.eu/browser/).
Nishinoshima (Japan) — July 2023 Cite this Report
Nishinoshima
Japan
27.247°N, 140.874°E; summit elev. 100 m
All times are local (unless otherwise noted)
Small ash plumes and fumarolic activity during November 2022 through April 2023
Nishinoshima is a small island located about 1,000 km S of Tokyo in the Ogasawara Arc in Japan. The island is the summit of a massive submarine volcano that has prominent peaks to the S, W, and NE. Eruptions date back to 1973; the most recent eruption period began in October 2022 and was characterized by ash plumes and fumarolic activity (BGVN 47:12). This report describes ash plumes and fumarolic activity during November 2022 through April 2023 based on monthly reports from the Japan Meteorological Agency (JMA) monthly reports and satellite data.
The most recent eruptive activity prior to the reporting internal occurred on 12 October 2022, when an ash plume rose 3.5 km above the crater rim. An aerial observation conducted by the Japan Coast Guard (JCG) on 25 November reported that white fumaroles rose approximately 200 m above the central crater of a pyroclastic cone (figure 119), and multiple plumes were observed on the ESE flank of the cone. Discolored water ranging from reddish-brown to brown and yellowish-green were visible around the perimeter of the island (figure 119). No significant activity was reported in December.
During an overflight conducted by JCG on 25 January 2023 intermittent activity and small, blackish-gray plumes rose 900 m above the central part of the crater were observed (figure 120). The fumarolic zone of the E flank and base of the cone had expanded and emissions had intensified. Dark brown discolored water was visible around the perimeter of the island.
No significant activity was reported during February through March. Ash plumes at 1050 and 1420 on 11 April rose 1.9 km above the crater rim and drifted NW and N. These were the first ash plumes observed since 12 October 2022. On 14 April JCG carried out an overflight and reported that no further eruptive activity was visible, although white gas-and-steam plumes were visible from the central crater and rose 900 m high (figure 121). Brownish and yellow-green discolored water surrounded the island.
Intermittent low-to-moderate power thermal anomalies were recorded in the MIROVA graph (Middle InfraRed Observation of Volcanic Activity) during November 2022 through April 2023 (figure 123). A cluster of six to eight anomalies were detected during November while a smaller number were detected during the following months: two to three during December, one during mid-January 2023, one during February, five during March, and two during April. Thermal activity was also reflected in infrared satellite data at the summit crater, accompanied by occasional gas-and-steam plumes (figure 124).
Geologic Background. The small island of Nishinoshima was enlarged when several new islands coalesced during an eruption in 1973-74. Multiple eruptions that began in 2013 completely covered the previous exposed surface and continued to enlarge the island. The island is the summit of a massive submarine volcano that has prominent peaks to the S, W, and NE. The summit of the southern cone rises to within 214 m of the ocean surface 9 km SSE.
Information Contacts: Japan Meteorological Agency (JMA), 1-3-4 Otemachi, Chiyoda-ku, Tokyo 100-8122, Japan (URL: http://www.jma.go.jp/jma/indexe.html); MIROVA (Middle InfraRed Observation of Volcanic Activity), a collaborative project between the Universities of Turin and Florence (Italy) supported by the Centre for Volcanic Risk of the Italian Civil Protection Department (URL: http://www.mirovaweb.it/); Copernicus Browser, Copernicus Data Space Ecosystem, European Space Agency (URL: https://dataspace.copernicus.eu/browser/).
Karangetang (Indonesia) — July 2023 Cite this Report
Karangetang
Indonesia
2.781°N, 125.407°E; summit elev. 1797 m
All times are local (unless otherwise noted)
Lava flows, incandescent avalanches, and ash plumes during January-June 2023
Karangetang (also known as Api Siau), at the northern end of the island of Siau, Indonesia, contains five summit craters along a N-S line. More than 40 eruptions have been recorded since 1675; recent eruptions have included frequent explosive activity, sometimes accompanied by pyroclastic flows and lahars. Lava dome growth has occurred in the summit craters and collapses of lava flow fronts have produced pyroclastic flows. The two active summit craters are Kawah Dua (the N crater) and Kawah Utama (the S crater, also referred to as the “Main Crater”). The most recent eruption began in late November 2018 and has more recently consisted of weak thermal activity and gas-and-steam emissions (BGVN 48:01). This report updates activity characterized by lava flows, incandescent avalanches, and ash plumes during January through June 2023 using reports from Pusat Vulkanologi dan Mitigasi Bencana Geologi (PVMBG, also known as CVGHM, or the Center of Volcanology and Geological Hazard Mitigation), MAGMA Indonesia, the Darwin VAAC (Volcano Ash Advisory Center), and satellite data.
Activity during January was relatively low and mainly consisted of white gas-and-steam emissions that rose 25-150 m above Main Crater (S crater) and drifted in different directions. Incandescence was visible from the lava dome in Kawah Dua (the N crater). Weather conditions often prevented clear views of the summit. On 18 January the number of seismic signals that indicated avalanches of material began to increase. In addition, there were a total of 71 earthquakes detected during the month.
Activity continued to increase during the first week of February. Material from Main Crater traveled as far as 800 m down the Batuawang (S) and Batang (W) drainages and as far as 1 km W down the Beha (W) drainage on 4 February. On 6 February 43 earthquake events were recorded, and on 7 February, 62 events were recorded. White gas-and-steam emissions rose 25-250 m above both summit craters throughout the month. PVMBG reported an eruption began during the evening of 8 February around 1700. Photos showed incandescent material at Main Crater. Incandescent material had also descended the flank in at least two unconfirmed directions as far as 2 km from Main Crater, accompanied by ash plumes (figure 60). As a result, PVMBG increased the Volcano Alert Level (VAL) to 3 (the second highest level on a 1-4 scale).
Occasional nighttime webcam images showed three main incandescent lava flows of differing lengths traveling down the S, SW, and W flanks (figure 61). Incandescent rocks were visible on the upper flanks, possibly from ejected or collapsed material from the crater, and incandescence was the most intense at the summit. Based on analyses of satellite imagery and weather models, the Darwin VAAC reported that daily ash plumes during 16-20 February rose to 2.1-3 km altitude and drifted NNE, E, and SE. BNPB reported on 16 February that as many as 77 people were evacuated and relocated to the East Siau Museum. A webcam image taken at 2156 on 17 February possibly showed incandescent material descending the SE flank. Ash plumes rose to 2.1 km altitude and drifted SE during 22-23 February, according to the Darwin VAAC.
Incandescent avalanches of material and summit incandescence at Main Crater continued during March. White gas-and-steam emissions during March generally rose 25-150 m above the summit crater; on 31 March gas-and-steam emissions rose 200-400 m high. An ash plume rose to 2.4 km altitude and drifted S at 1710 on 9 March and a large thermal anomaly was visible in images taken at 0550 and 0930 on 10 March. Incandescent material was visible at the summit and on the flanks based on webcam images taken at 0007 and 2345 on 16 March, at 1828 on 17 March, at 1940 on 18 March, at 2311 on 19 March, and at 2351 on 20 March. Incandescence was most intense on 18 and 20 March and webcam images showed possible Strombolian explosions (figure 62). An ash plume rose to 2.4 km altitude and drifted SW on 18 March, accompanied by a thermal anomaly.
Summit crater incandescence at Main Crater and on the flanks persisted during April. Incandescent material at the S crater and on the flanks was reported at 0016 on 1 April. The lava flows had stopped by 1 April according to PVMBG, although incandescence was still visible up to 10 m high. Seismic signals indicating effusion decreased and by 6 April they were no longer detected. Incandescence was visible from both summit craters. On 26 April the VAL was lowered to 2 (the second lowest level on a 1-4 scale). White gas-and-steam emissions rose 25-200 m above the summit crater.
During May white gas-and-steam emissions generally rose 50-250 m above the summit, though it was often cloudy, which prevented clear views; on 21 May gas-and-steam emissions rose 50-400 m high. Nighttime N summit crater incandescence rose 10-25 m above the lava dome, and less intense incandescence was noted above Main Crater, which reached about 10 m above the dome. Sounds of falling rocks at Main Crater were heard on 15 May and the seismic network recorded 32 rockfall events in the crater on 17 May. Avalanches traveled as far as 1.5 km down the SW and S flanks, accompanied by rumbling sounds on 18 May. Incandescent material descending the flanks was captured in a webcam image at 2025 on 19 May (figure 63) and on 29 May; summit crater incandescence was observed in webcam images at 2332 on 26 May and at 2304 on 29 May. On 19 May the VAL was again raised to 3.
Occasional Main Crater incandescence was reported during June, as well as incandescent material on the flanks. White gas-and-steam emissions rose 10-200 m above the summit crater. Ash plumes rose to 2.1 km altitude and drifted SE and E during 2-4 June, according to the Darwin VAAC. Material on the flanks of Main Crater were observed at 2225 on 7 June, at 2051 on 9 June, at 0007 on 17 June, and at 0440 on 18 June. Webcam images taken on 21, 25, and 27 June showed incandescence at Main Crater and from material on the flanks.
MIROVA (Middle InfraRed Observation of Volcanic Activity) analysis of MODIS satellite data showed strong thermal activity during mid-February through March and mid-May through June, which represented incandescent avalanches and lava flows (figure 64). During April through mid-May the power of the anomalies decreased but frequent anomalies were still detected. Brief gaps in activity occurred during late March through early April and during mid-June. Infrared satellite images showed strong lava flows mainly affecting the SW and S flanks, accompanied by gas-and-steam emissions (figure 65). According to data recorded by the MODVOLC thermal algorithm, there were a total of 79 thermal hotspots detected: 28 during February, 24 during March, one during April, five during May, and 21 during June.
Geologic Background. Karangetang (Api Siau) volcano lies at the northern end of the island of Siau, about 125 km NNE of the NE-most point of Sulawesi. The stratovolcano contains five summit craters along a N-S line. It is one of Indonesia's most active volcanoes, with more than 40 eruptions recorded since 1675 and many additional small eruptions that were not documented (Neumann van Padang, 1951). Twentieth-century eruptions have included frequent explosive activity sometimes accompanied by pyroclastic flows and lahars. Lava dome growth has occurred in the summit craters; collapse of lava flow fronts have produced pyroclastic flows.
Information Contacts: Pusat Vulkanologi dan Mitigasi Bencana Geologi (PVMBG, also known as Indonesian Center for Volcanology and Geological Hazard Mitigation, CVGHM), Jalan Diponegoro 57, Bandung 40122, Indonesia (URL: http://www.vsi.esdm.go.id/); MAGMA Indonesia, Kementerian Energi dan Sumber Daya Mineral (URL: https://magma.esdm.go.id/v1); Badan Nasional Penanggulangan Bencana (BNPB), National Disaster Management Agency, Graha BNPB - Jl. Scout Kav.38, East Jakarta 13120, Indonesia (URL: http://www.bnpb.go.id/); Darwin Volcanic Ash Advisory Centre (VAAC), Bureau of Meteorology, Northern Territory Regional Office, PO Box 40050, Casuarina, NT 0811, Australia (URL: http://www.bom.gov.au/info/vaac/); MIROVA (Middle InfraRed Observation of Volcanic Activity), a collaborative project between the Universities of Turin and Florence (Italy) supported by the Centre for Volcanic Risk of the Italian Civil Protection Department (URL: http://www.mirovaweb.it/); Hawai'i Institute of Geophysics and Planetology (HIGP) - MODVOLC Thermal Alerts System, School of Ocean and Earth Science and Technology (SOEST), Univ. of Hawai'i, 2525 Correa Road, Honolulu, HI 96822, USA (URL: http://modis.higp.hawaii.edu/); Copernicus Browser, Copernicus Data Space Ecosystem, European Space Agency (URL: https://dataspace.copernicus.eu/browser/); IDN Times, Jl. Jend. Gatot Subroto Kav. 27 3rd Floor Kuningan, Jakarta, Indonesia 12950, Status of Karangetang Volcano in Sitaro Islands Increases (URL: https://sulsel.idntimes.com/news/indonesia/savi/status-gunung-api-karangetang-di-kepulauan-sitaro-meningkat?page=all).
Ahyi (United States) — July 2023 Cite this Report
Ahyi
United States
20.42°N, 145.03°E; summit elev. -75 m
All times are local (unless otherwise noted)
Intermittent hydroacoustic signals and discolored plumes during November 2022-June 2023
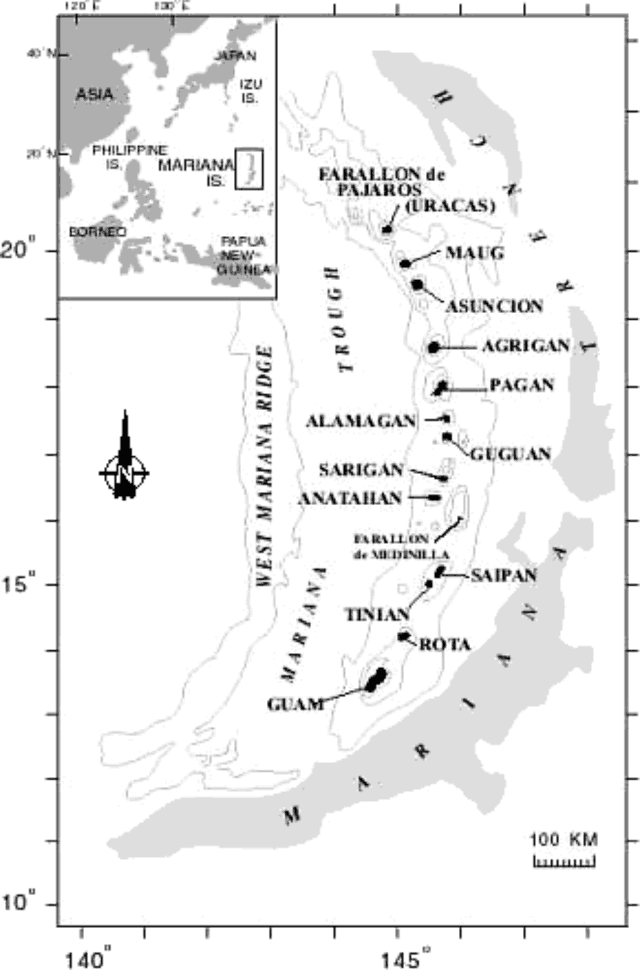
Ahyi seamount is a large, conical submarine volcano that rises to within 75 m of the ocean surface about 18 km SE of the island of Farallon de Pajaros in the Northern Marianas. The remote location of the seamount has made eruptions difficult to document, but seismic stations installed in the region confirmed an eruption in the vicinity in 2001. No new activity was detected until April-May 2014 when an eruption was detected by NOAA (National Oceanic and Atmospheric Administration) divers, hydroacoustic sensors, and seismic stations (BGVN 42:04). New activity was first detected on 15 November by hydroacoustic sensors that were consistent with submarine volcanic activity. This report covers activity during November 2022 through June 2023 based on daily and weekly reports from the US Geological Survey.
Starting in mid-October, hydroacoustic sensors at Wake Island (2.2 km E) recorded signals consistent with submarine volcanic activity, according to a report from the USGS issued on 15 November 2022. A combined analysis of the hydroacoustic signals and seismic stations located at Guam and Chichijima Island, Japan, suggested that the source of this activity was at or near the Ahyi seamount. After a re-analysis of a satellite image of the area that was captured on 6 November, USGS confirmed that there was no evidence of discoloration at the ocean surface. Few hydroacoustic and seismic signals continued through November, including on 18 November, which USGS suggested signified a decline or pause in unrest. A VONA (Volcano Observatory Notice for Aviation) reported that a discolored water plume was persistently visible in satellite data starting on 18 November (figure 6). Though clouds often obscured clear views of the volcano, another discolored water plume was captured in a satellite image on 26 November. The Aviation Color Code (ACC) was raised to Yellow (the second lowest level on a four-color scale) and the Volcano Alert Level (VAL) was raised to Advisory (the second lowest level on a four-level scale) on 29 November.
During December, occasional detections were recorded on the Wake Island hydrophone sensors and discolored water over the seamount remained visible. During 2-7, 10-12, and 16-31 December possible explosion signals were detected. A small area of discolored water was observed in high-resolution Sentinel-2 satellite images during 1-6 December (figure 7). High-resolution satellite images recorded discolored water plumes on 13 December that originated from the summit region; no observations indicated that activity breached the ocean surface. A possible underwater plume was visible in satellite images on 18 December, and during 19-20 December a definite but diffuse underwater plume located SSE from the main vent was reported. An underwater plume was visible in a satellite image taken on 26 December (figure 7).
Hydrophone sensors continued to detect signals consistent with possible explosions during 1-8 January 2023. USGS reported that the number of detections decreased during 4-5 January. The hydrophone sensors experienced a data outage that started at 0118 on 8 January and continued through 10 January, though according to USGS, possible explosions were recorded prior to the data outage and likely continued during the outage. A discolored water plume originating from the summit region was detected in a partly cloudy satellite image on 8 January. On 11-12 and 15-17 January possible explosion signals were recorded again. One small signal was detected during 22-23 January and several signals were recorded on 25 and 31 January. During 27-31 January a plume of discolored water was observed above the seamount in satellite imagery (figure 8).
Low levels of activity continued during February and March, based on data from pressure sensors on Wake Island. During 1 and 4-6 February activity was reported, and a submarine plume was observed on 4 February (figure 8). Possible explosion signals were detected during 7-8, 10, 13-14, and 24 February. During 1-2 and 3-5 March a plume of discolored water was observed in satellite imagery (figure 8). Almost continuous hydroacoustic signals were detected in remote pressure sensor data on Wake Island 2,270 km E from the volcano during 7-13 March. During 12-13 March water discoloration around the seamount was observed in satellite imagery, despite cloudy weather. By 14 March discolored water extended about 35 km, but no direction was noted. USGS reported that the continuous hydroacoustic signals detected during 13-14 March stopped abruptly on 14 March and no new detections were observed. Three 30 second hydroacoustic detections were reported during 17-19 March, but no activity was visible due to cloudy weather. A data outage was reported during 21-22 March, making pressure sensor data unavailable; a discolored water plume was, however, visible in satellite data. A possible underwater explosion signal was detected by pressure sensors at Wake Island on 26, 29, and 31 March, though the cause and origin of these events were unclear.
Similar low activity continued during April, May, and June. Several signals were detected during 1-3 April in pressure sensors at Wake Island. USGS suggested that these may be related to underwater explosions or earthquakes at the volcano, but no underwater plumes were visible in clear satellite images. The pressure sensors had data outages during 12-13 April and no data were recorded; no underwater plumes were visible in satellite images, although cloudy weather obscured most clear views. Eruptive activity was reported starting at 2210 on 21 May. On 22 May a discolored water plume that extended 4 km was visible in satellite images, though no direction was recorded. During 23-24 May some signals were detected by the underwater pressure sensors. Possible hydroacoustic signals were detected during 2-3 and 6-8 June. Multiple hydroacoustic signals were detected during 9-11 and 16-17 June, although no activity was visible in satellite images. One hydroacoustic signal was detected during 23-24 June, but there was some uncertainty about its association with volcanic activity. A single possible hydroacoustic signal was detected during 30 June to 1 July.
Geologic Background. Ahyi seamount is a large conical submarine volcano that rises to within 75 m of the ocean surface ~18 km SE of the island of Farallon de Pajaros in the northern Marianas. Water discoloration has been observed there, and in 1979 the crew of a fishing boat felt shocks over the summit area, followed by upwelling of sulfur-bearing water. On 24-25 April 2001 an explosive eruption was detected seismically by a station on Rangiroa Atoll, Tuamotu Archipelago. The event was well constrained (+/- 15 km) at a location near the southern base of Ahyi. An eruption in April-May 2014 was detected by NOAA divers, hydroacoustic sensors, and seismic stations.
Information Contacts: US Geological Survey, Volcano Hazards Program (USGS-VHP), 12201 Sunrise Valley Drive, Reston, VA, USA, https://volcanoes.usgs.gov/index.html; Copernicus Browser, Copernicus Data Space Ecosystem, European Space Agency (URL: https://dataspace.copernicus.eu/browser/).
Kadovar (Papua New Guinea) — June 2023 Cite this Report
Kadovar
Papua New Guinea
3.608°S, 144.588°E; summit elev. 365 m
All times are local (unless otherwise noted)
An ash plume and weak thermal anomaly during May 2023
Kadovar is a 2-km-wide island that is the emergent summit of a Bismarck Sea stratovolcano. It lies off the coast of New Guinea, about 25 km N of the mouth of the Sepik River. Prior to an eruption that began in 2018, a lava dome formed the high point of the volcano, filling an arcuate landslide scarp open to the S. Submarine debris-avalanche deposits occur to the S of the island. The current eruption began in January 2018 and has comprised lava effusion from vents at the summit and at the E coast; more recent activity has consisted of ash plumes, weak thermal activity, and gas-and-steam plumes (BGVN 48:02). This report covers activity during February through May 2023 using information from the Darwin Volcanic Ash Advisory Center (VAAC) and satellite data.
Activity during the reporting period was relatively low and mainly consisted of white gas-and-steam plumes that were visible in natural color satellite images on clear weather days (figure 67). According to a Darwin VAAC report, at 2040 on 6 May an ash plume rose to 4.6 km altitude and drifted W; by 2300 the plume had dissipated. MODIS satellite instruments using the MODVOLC thermal algorithm detected a single thermal hotspot on the SE side of the island on 7 May. Weak thermal activity was also detected in a satellite image on the E side of the island on 14 May, accompanied by a white gas-and-steam plume that drifted SE (figure 68).
Geologic Background. The 2-km-wide island of Kadovar is the emergent summit of a Bismarck Sea stratovolcano of Holocene age. It is part of the Schouten Islands, and lies off the coast of New Guinea, about 25 km N of the mouth of the Sepik River. Prior to an eruption that began in 2018, a lava dome formed the high point of the andesitic volcano, filling an arcuate landslide scarp open to the south; submarine debris-avalanche deposits occur in that direction. Thick lava flows with columnar jointing forms low cliffs along the coast. The youthful island lacks fringing or offshore reefs. A period of heightened thermal phenomena took place in 1976. An eruption began in January 2018 that included lava effusion from vents at the summit and at the E coast.
Information Contacts: Darwin Volcanic Ash Advisory Centre (VAAC), Bureau of Meteorology, Northern Territory Regional Office, PO Box 40050, Casuarina, NT 0811, Australia (URL: http://www.bom.gov.au/info/vaac/); Hawai'i Institute of Geophysics and Planetology (HIGP) - MODVOLC Thermal Alerts System, School of Ocean and Earth Science and Technology (SOEST), Univ. of Hawai'i, 2525 Correa Road, Honolulu, HI 96822, USA (URL: http://modis.higp.hawaii.edu/); Copernicus Browser, Copernicus Data Space Ecosystem, European Space Agency (URL: https://dataspace.copernicus.eu/browser/).
San Miguel (El Salvador) — June 2023 Cite this Report
San Miguel
El Salvador
13.434°N, 88.269°W; summit elev. 2130 m
All times are local (unless otherwise noted)
Small gas-and-ash explosions during March and May 2023
San Miguel in El Salvador is a broad, deep crater complex that has been frequently modified by eruptions recorded since the early 16th century and consists of the summit known locally as Chaparrastique. Flank eruptions have produced lava flows that extended to the N, NE, and SE during the 17-19th centuries. The most recent activity has consisted of minor ash eruptions from the summit crater. The current eruption period began in November 2022 and has been characterized by frequent phreatic explosions, gas-and-ash emissions, and sulfur dioxide plumes (BGVN 47:12). This report describes small gas-and-ash explosions during December 2022 through May 2023 based on special reports from the Ministero de Medio Ambiente y Recursos Naturales (MARN).
Activity has been relatively low since the last recorded explosions on 29 November 2022. Seismicity recorded by the San Miguel Volcano Station (VSM) located on the N flank at 1.7 km elevation had decreased by 7 December. Sulfur dioxide gas measurements taken with DOAS (Differential Optical Absorption Spectroscopy) mobile equipment were below typical previously recorded values: 300 tons per day (t/d). During December, small explosions were recorded by the seismic network and manifested as gas-and-steam emissions.
Gas-and-ash explosions in the crater occurred during January 2023, which were recorded by the seismic network. Sulfur dioxide values remained low, between 300-400 t/d through 10 March. At 0817 on 14 January a gas-and-ash emission was visible in webcam images, rising just above the crater rim. Some mornings during February, small gas-and-steam plumes were visible in the crater. On 7 March at 2252 MARN noted an increase in degassing from the central crater; gas emissions were constantly observed through the early morning hours on 8 March. During the early morning of 8 March through the afternoon on 9 March, 12 emissions were registered, some accompanied by ash. The last gas-and-ash emission was recorded at 1210 on 9 March; very fine ashfall was reported in El Tránsito (10 km S), La Morita (6 km W), and La Piedrita (3 km W). The smell of sulfur was reported in Piedra Azul (5 km SW). On 16 March MARN reported that gas-and-steam emissions decreased.
Low degassing and very low seismicity were reported during April; no explosions have been detected between 9 March and 27 May. The sulfur dioxide emissions remained between 350-400 t/d; during 13-20 April sulfur dioxide values fluctuated between 30-300 t/d. Activity remained low through most of May; on 23 May seismicity increased. An explosion was detected at 1647 on 27 May generated a gas-and-ash plume that rose 700 m high (figure 32); a decrease in seismicity and gas emissions followed. The DOAS station installed on the W flank recorded sulfur dioxide values that reached 400 t/d on 27 May; subsequent measurements showed a decrease to 268 t/d on 28 May and 100 t/d on 29 May.
Geologic Background. The symmetrical cone of San Miguel, one of the most active volcanoes in El Salvador, rises from near sea level to form one of the country's most prominent landmarks. A broad, deep, crater complex that has been frequently modified by eruptions recorded since the early 16th century caps the truncated unvegetated summit, also known locally as Chaparrastique. Flanks eruptions of the basaltic-andesitic volcano have produced many lava flows, including several during the 17th-19th centuries that extended to the N, NE, and SE. The SE-flank flows are the largest and form broad, sparsely vegetated lava fields crossed by highways and a railroad skirting the base of the volcano. Flank vent locations have migrated higher on the edifice during historical time, and the most recent activity has consisted of minor ash eruptions from the summit crater.
Information Contacts: Ministero de Medio Ambiente y Recursos Naturales (MARN), Km. 5½ Carretera a Nueva San Salvador, Avenida las Mercedes, San Salvador, El Salvador (URL: http://www.snet.gob.sv/ver/vulcanologia).
Semisopochnoi (United States) — June 2023 Cite this Report
Semisopochnoi
United States
51.93°N, 179.58°E; summit elev. 1221 m
All times are local (unless otherwise noted)
Occasional explosions, ash deposits, and gas-and-steam plumes during December 2022-May 2023
Semisopochnoi is located in the western Aleutians, is 20-km-wide at sea level, and contains an 8-km-wide caldera. The three-peaked Mount Young (formerly Cerberus) was constructed within the caldera during the Holocene. Each of these peaks contains a summit crater; the lava flows on the N flank appear younger than those on the S side. The current eruption period began in early February 2021 and has more recently consisted of intermittent explosions and ash emissions (BGVN 47:12). This report updates activity during December 2022 through May 2023 using daily, weekly, and special reports from the Alaska Volcano Observatory (AVO). AVO monitors the volcano using local seismic and infrasound sensors, satellite data, web cameras, and remote infrasound and lightning networks.
Activity during most of December 2022 was relatively quiet; according to AVO no eruptive or explosive activity was observed since 7 November 2022. Intermittent tremor and occasional small earthquakes were observed in geophysical data. Continuous gas-and-steam emissions were observed from the N crater of Mount Young in webcam images on clear weather days (figure 25). On 24 December, there was a slight increase in earthquake activity and several small possible explosion signals were detected in infrasound data. Eruptive activity resumed on 27 December at the N crater of Mount Young; AVO issued a Volcano Activity Notice (VAN) that reported minor ash deposits on the flanks of Mount Young that extended as far as 1 km from the vent, according to webcam images taken during 27-28 December (figure 26). No ash plumes were observed in webcam or satellite imagery, but a persistent gas-and-steam plume that might have contained some ash rose to 1.5 km altitude. As a result, AVO raised the Aviation Color Code (ACC) to Orange (the second highest level on a four-color scale) and the Volcano Alert Level (VAL) to Watch (the second highest level on a four-level scale). Possible explosions were detected during 21 December 2022 through 1 January 2023 and seismic tremor was recorded during 30-31 December.
During January 2023 eruptive activity continued at the active N crater of Mount Young. Minor ash deposits were observed on the flanks, extending about 2 km SSW, based on webcam images from 1 and 3 January. A possible explosion occurred during 1-2 January based on elevated seismicity recorded on local seismometers and an infrasound signal recorded minutes later by an array at Adak. Though no ash plumes were observed in webcam or satellite imagery, a persistent gas-and-steam plume rose to 1.5 km altitude that might have carried minor traces of ash. Ash deposits were accompanied by periods of elevated seismicity and infrasound signals from the local geophysical network, which AVO reported were likely due to weak explosive activity. Low-level explosive activity was also detected during 2-3 January, with minor gas-and-steam emissions and a new ash deposit that was visible in webcam images. Low-level explosive activity was detected in geophysical data during 4-5 January, with elevated seismicity and infrasound signals observed on local stations. Volcanic tremor was detected during 7-9 January and very weak explosive activity was detected in seismic and infrasound data on 9 January. Weak seismic and infrasound signals were recorded on 17 January, which indicated minor explosive activity, but no ash emissions were observed in clear webcam images; a gas-and-steam plume continued to rise to 1.5 km altitude. During 29-30 January, ash deposits near the summit were observed on fresh snow, according to webcam images.
The active N cone at Mount Young continued to produce a gas-and-steam plume during February, but no ash emissions or explosive events were detected. Seismicity remained elevated with faint tremor during early February. Gas-and-steam emissions from the N crater were observed in clear webcam images on 11-13 and 16 February; no explosive activity was detected in seismic, infrasound, or satellite data. Seismicity has also decreased, with no significant seismic tremor observed since 25 January. Therefore, the ACC was lowered to Yellow (the second lowest level on a four-color scale) and the VAL was lowered to Advisory (the second lowest level on a four-color scale) on 22 February.
Gas-and-steam emissions persisted during March from the N cone of Mount Young, based on clear webcam images. A few brief episodes of weak tremor were detected in seismic data, although seismicity decreased over the month. A gas-and-steam plume detected in satellite data extended 150 km on 18 March. Low-level ash emissions from the N cone at Mount Young were observed in several webcam images during 18-19 March, in addition to small explosions and volcanic tremor. The ACC was raised to Orange and the VAL increased to Watch on 19 March. A small explosion was detected in seismic and infrasound data on 21 March.
Low-level unrest continued during April, although cloudy weather often obscured views of the summit; periods of seismic tremor and local earthquakes were recorded. During 3-4 April a gas-and-steam plume was visible traveling more than 200 km overnight; no ash was evident in the plume, according to AVO. A gas-and-steam plume was observed during 4-6 April that extended 400 km but did not seem to contain ash. Small explosions were detected in seismic and infrasound data on 5 April. Occasional clear webcam images showed continuing gas-and-steam emissions rose from Mount Young, but no ash deposits were observed on the snow. On 19 April small explosions and tremor were detected in seismic and infrasound data. A period of seismic tremor was detected during 22-25 April, with possible weak explosions on 25 April. Ash deposits were visible near the crater rim, but it was unclear if these deposits were recent or due to older deposits.
Occasional small earthquakes were recorded during May, but there were no signs of explosive activity seen in geophysical data. Gas-and-steam emissions continued from the N crater of Mount Young, based on webcam images, and seismicity remained slightly elevated. A new, light ash deposit was visible during the morning of 5 May on fresh snow on the NW flank of Mount Young. During 10 May periods of volcanic tremor were observed. The ACC was lowered to Yellow and the VAL to Advisory on 17 May due to no additional evidence of activity.
Geologic Background. Semisopochnoi, the largest subaerial volcano of the western Aleutians, is 20 km wide at sea level and contains an 8-km-wide caldera. It formed as a result of collapse of a low-angle, dominantly basaltic volcano following the eruption of a large volume of dacitic pumice. The high point of the island is Anvil Peak, a double-peaked late-Pleistocene cone that forms much of the island's northern part. The three-peaked Mount Cerberus (renamed Mount Young in 2023) was constructed within the caldera during the Holocene. Each of the peaks contains a summit crater; lava flows on the N flank appear younger than those on the south side. Other post-caldera volcanoes include the symmetrical Sugarloaf Peak SSE of the caldera and Lakeshore Cone, a small cinder cone at the edge of Fenner Lake in the NE part of the caldera. Most documented eruptions have originated from Young, although Coats (1950) considered that both Sugarloaf and Lakeshore Cone could have been recently active.
Information Contacts: Alaska Volcano Observatory (AVO), a cooperative program of a) U.S. Geological Survey, 4200 University Drive, Anchorage, AK 99508-4667 USA (URL: https://avo.alaska.edu/), b) Geophysical Institute, University of Alaska, PO Box 757320, Fairbanks, AK 99775-7320, USA, and c) Alaska Division of Geological & Geophysical Surveys, 794 University Ave., Suite 200, Fairbanks, AK 99709, USA (URL: http://dggs.alaska.gov/).
Ebeko
Russia
50.686°N, 156.014°E; summit elev. 1103 m
All times are local (unless otherwise noted)
Continued explosions, ash plumes, and ashfall during October 2022-May 2023
Ebeko, located on the N end of Paramushir Island in the Kuril Islands, consists of three summit craters along a SSW-NNE line at the northern end of a complex of five volcanic cones. Eruptions date back to the late 18th century and have been characterized as small-to-moderate explosions from the summit crater, accompanied by intense fumarolic activity. The current eruption period began in June 2022 and has recently consisted of frequent explosions, ash plumes, and thermal activity (BGVN 47:10). This report covers similar activity during October 2022 through May 2023, based on information from the Kamchatka Volcanic Eruptions Response Team (KVERT) and satellite data.
Activity during October consisted of explosive activity, ash plumes, and occasional thermal anomalies. Visual data by volcanologists from Severo-Kurilsk showed explosions producing ash clouds up to 2.1-3 km altitude which drifted E, N, NE, and SE during 1-8, 10, 16, and 18 October. KVERT issued several Volcano Observatory Notices for Aviation (VONA) on 7, 13-15, and 27 October 2022, stating that explosions generated ash plumes that rose to 2.3-4 km altitude and drifted 5 km E, NE, and SE. Ashfall was reported in Severo-Kurilsk (Paramushir Island, about 7 km E) on 7 and 13 October. Satellite data showed a thermal anomaly over the volcano on 15-16 October. Visual data showed ash plumes rising to 2.5-3.6 km altitude on 22, 25-29, and 31 October and moving NE due to constant explosions.
Similar activity continued during November, with explosions, ash plumes, and ashfall occurring. KVERT issued VONAs on 1-2, 4, 6-7, 9, 13, and 16 November that reported explosions and resulting ash plumes that rose to 1.7-3.6 km altitude and drifted 3-5 km SE, ESE, E, and NE. On 1 November ash plumes extended as far as 110 km SE. On 5, 8, 12, and 24-25 November explosions and ash plumes rose to 2-3.1 km altitude and drifted N and E. Ashfall was observed in Severo-Kurilsk on 7 and 16 November. A thermal anomaly was visible during 1-4, 16, and 20 November. Explosions during 26 November rose as high as 2.7 km altitude and drifted NE (figure 45).
Explosions and ash plumes continued to occur in December. During 1-2 and 4 December volcanologists from Severo-Kurilsk observed explosions that sent ash to 1.9-2.5 km altitude and drifted NE and SE (figure 46). VONAs were issued on 5, 9, and 16 December reporting that explosions generated ash plumes rising to 1.9 km, 2.6 km, and 2.4 km altitude and drifted 5 km SE, E, and NE, respectively. A thermal anomaly was visible in satellite imagery on 16 December. On 18 and 27-28 December explosions produced ash plumes that rose to 2.5 km altitude and drifted NE and SE. On 31 December an ash plume rose to 2 km altitude and drifted NE.
Explosions continued during January 2023, based on visual observations by volcanologists from Severo-Kurilsk. During 1-7 January explosions generated ash plumes that rose to 4 km altitude and drifted NE, E, W, and SE. According to VONAs issued by KVERT on 2, 4, 10, and 23 January, explosions produced ash plumes that rose to 2-4 km altitude and drifted 5 km N, NE, E, and ENE; the ash plume that rose to 4 km altitude occurred on 10 January (figure 47). Satellite data showed a thermal anomaly during 3-4, 10, 13, 16, 21, 22, and 31 January. KVERT reported that an ash cloud on 4 January moved 12 km NE. On 6 and 9-11 January explosions sent ash plumes to 4.5 km altitude and drifted W and ESE. On 13 January an ash plume rose to 3 km altitude and drifted SE. During 20-24 January ash plumes from explosions rose to 3.7 km altitude and drifted SE, N, and NE. On 21 January the ash plume drifted as far as 40 km NE. During 28-29 and 31 January and 1 February ash plumes rose to 4 km altitude and drifted NE.
During February, explosions, ash plumes, and ashfall were reported. During 1, 4-5 and 7-8 February explosions generated ash plumes that rose to 4.5 km altitude and drifted E and NE; ashfall was observed on 5 and 8 February. On 6 February an explosion produced an ash plume that rose to 3 km altitude and drifted 7 km E, causing ashfall in Severo-Kurilsk. A thermal anomaly was visible in satellite data on 8, 9, 13, and 21 February. Explosions on 9 and 12-13 February produced ash plumes that rose to 4 km altitude and drifted E and NE; the ash cloud on 12 February extended as far as 45 km E. On 22 February explosions sent ash to 3 km altitude that drifted E. During 24 and 26-27 February ash plumes rose to 4 km altitude and drifted E. On 28 February an explosion sent ash to 2.5-3 km altitude and drifted 5 km E; ashfall was observed in Severo-Kurilsk.
Activity continued during March; visual observations showed that explosions generated ash plumes that rose to 3.6 km altitude on 3, 5-7, and 9-12 March and drifted E, NE, and NW. Thermal anomalies were visible on 10, 13, and 29-30 March in satellite imagery. On 18, 21-23, 26, and 29-30 March explosions produced ash plumes that rose to 2.8 km altitude and drifted NE and E; the ash plumes during 22-23 March extended up to 76 km E. A VONA issued on 21 March reported an explosion that produced an ash plume that rose to 2.8 km altitude and drifted 5 km E. Another VONA issued on 23 March reported that satellite data showed an ash plume rising to 3 km altitude and drifted 14 km E.
Explosions during April continued to generate ash plumes. On 1 and 4 April an ash plume rose to 2.8-3.5 km altitude and drifted SE and NE. A thermal anomaly was visible in satellite imagery during 1-6 April. Satellite data showed ash plumes and clouds rising to 2-3 km altitude and drifting up to 12 km SW and E on 3 and 6 April (figure 48). KVERT issued VONAs on 3, 5, 14, 16 April describing explosions that produced ash plumes rising to 3 km, 3.5 km, 3.5 km, and 3 km altitude and drifting 5 km S, 5 km NE and SE, 72 km NNE, and 5 km NE, respectively. According to satellite data, the resulting ash cloud from the explosion on 14 April was 25 x 7 km in size and drifted 72-104 km NNE during 14-15 April. According to visual data by volcanologists from Severo-Kurilsk explosions sent ash up to 3.5 km altitude that drifted NE and E during 15-16, 22, 25-26, and 29 April.
The explosive eruption continued during May. Explosions during 3-4, 6-7, and 9-10 May generated ash plumes that rose to 4 km altitude and drifted SW and E. Satellite data showed a thermal anomaly on 3, 9, 13-14, and 24 May. During 12-16, 23-25, and 27-28 May ash plumes rose to 3.5 km altitude and drifted in different directions due to explosions. Two VONA notices were issued on 16 and 25 May, describing explosions that generated ash plumes rising to 3 km and 3.5 km altitude, respectively and extending 5 km E. The ash cloud on 25 May drifted 75 km SE.
Thermal activity in the summit crater, occasionally accompanied by ash plumes and ash deposits on the SE and E flanks due to frequent explosions, were visible in infrared and true color satellite images (figure 49).
Geologic Background. The flat-topped summit of the central cone of Ebeko volcano, one of the most active in the Kuril Islands, occupies the northern end of Paramushir Island. Three summit craters located along a SSW-NNE line form Ebeko volcano proper, at the northern end of a complex of five volcanic cones. Blocky lava flows extend west from Ebeko and SE from the neighboring Nezametnyi cone. The eastern part of the southern crater contains strong solfataras and a large boiling spring. The central crater is filled by a lake about 20 m deep whose shores are lined with steaming solfataras; the northern crater lies across a narrow, low barrier from the central crater and contains a small, cold crescentic lake. Historical activity, recorded since the late-18th century, has been restricted to small-to-moderate explosive eruptions from the summit craters. Intense fumarolic activity occurs in the summit craters, on the outer flanks of the cone, and in lateral explosion craters.
Information Contacts: Kamchatka Volcanic Eruptions Response Team (KVERT), Far Eastern Branch, Russian Academy of Sciences, 9 Piip Blvd., Petropavlovsk-Kamchatsky, 683006, Russia (URL: http://www.kscnet.ru/ivs/kvert/); MIROVA (Middle InfraRed Observation of Volcanic Activity), a collaborative project between the Universities of Turin and Florence (Italy) supported by the Centre for Volcanic Risk of the Italian Civil Protection Department (URL: http://www.mirovaweb.it/); Copernicus Browser, Copernicus Data Space Ecosystem, European Space Agency (URL: https://dataspace.copernicus.eu/browser/).
Home Reef
Tonga
18.992°S, 174.775°W; summit elev. -10 m
All times are local (unless otherwise noted)
Discolored plumes continued during November 2022-April 2023
Home Reef is a submarine volcano located in the central Tonga islands between Lateiki (Metis Shoal) and Late Island. The first recorded eruption occurred in the mid-19th century, when an ephemeral island formed. An eruption in 1984 produced a 12-km-high eruption plume, a large volume of floating pumice, and an ephemeral island 500 x 1,500 m wide, with cliffs 30-50 m high that enclosed a water-filled crater. Another island-forming eruption in 2006 produced widespread pumice rafts that drifted as far as Australia; by 2008 the island had eroded below sea level. The previous eruption occurred during October 2022 and was characterized by a new island-forming eruption, lava effusion, ash plumes, discolored water, and gas-and-steam plumes (BGVN 47:11). This report covers discolored water plumes during November 2022 through April 2023 using satellite data.
Discolored plumes continued during the reporting period and were observed in true color satellite images on clear weather days. Satellite images show light green-yellow discolored water extending W on 8 and 28 November 2022 (figure 31), and SW on 18 November. Light green-yellow plumes extended W on 3 December, S on 13 December, SW on 18 December, and W and S on 23 December (figure 31). On 12 January 2023 discolored green-yellow plumes extended to the NE, E, SE, and N. The plume moved SE on 17 January and NW on 22 January. Faint discolored water in February was visible moving NE on 1 February. A discolored plume extended NW on 8 and 28 March and NW on 13 March (figure 31). During April, clear weather showed green-blue discolored plumes moving S on 2 April, W on 7 April, and NE and S on 12 April. A strong green-yellow discolored plume extended E and NE on 22 April for several kilometers (figure 31).
Geologic Background. Home Reef, a submarine volcano midway between Metis Shoal and Late Island in the central Tonga islands, was first reported active in the mid-19th century, when an ephemeral island formed. An eruption in 1984 produced a 12-km-high eruption plume, large amounts of floating pumice, and an ephemeral 500 x 1,500 m island, with cliffs 30-50 m high that enclosed a water-filled crater. In 2006 an island-forming eruption produced widespread dacitic pumice rafts that drifted as far as Australia. Another island was built during a September-October 2022 eruption.
Information Contacts: Copernicus Browser, Copernicus Data Space Ecosystem, European Space Agency (URL: https://dataspace.copernicus.eu/browser/).
Ambae
Vanuatu
15.389°S, 167.835°E; summit elev. 1496 m
All times are local (unless otherwise noted)
New lava flow, ash plumes, and sulfur dioxide plumes during February-May 2023
Ambae, also known as Aoba, is a large basaltic shield volcano in Vanuatu. A broad pyroclastic cone containing three crater lakes (Manaro Ngoru, Voui, and Manaro Lakua) is located at the summit within the youngest of at least two nested calderas. Periodic phreatic and pyroclastic explosions have been reported since the 16th century. A large eruption more than 400 years ago resulted in a volcanic cone within the summit crater that is now filled by Lake Voui; the similarly sized Lake Manaro fills the western third of the caldera. The previous eruption ended in August 2022 that was characterized by gas-and-steam and ash emissions and explosions of wet tephra (BGVN 47:10). This report covers a new eruption during February through May 2023 that consisted of a new lava flow, ash plumes, and sulfur dioxide emissions, using information from the Vanuatu Meteorology and Geo-Hazards Department (VMGD) and satellite data.
During the reporting period, the Alert Level remained at a 2 (on a scale of 0-5), which has been in place since December 2021. Activity during October 2022 through March 2023 remained relatively low and mostly consisted of gas-and-steam emissions in Lake Voui. VMGD reported that at 1300 on 15 November a satellite image captured a strong amount of sulfur dioxide rising above the volcano (figure 99), and that seismicity slightly increased. The southern and northern part of the island reported a strong sulfur dioxide smell and heard explosions. On 20 February 2023 a gas-and-ash plume rose 1.3 km above the summit and drifted SSW, according to a webcam image (figure 100). Gas-and-steam and possibly ash emissions continued on 23 February and volcanic earthquakes were recorded by the seismic network.
During April, volcanic earthquakes and gas-and-steam and ash emissions were reported from the cone in Lake Voui. VMGD reported that activity increased during 5-7 April; high gas-and-steam and ash plumes were visible, accompanied by nighttime incandescence. According to a Wellington VAAC report, a low-level ash plume rose as high as 2.5 km above the summit and drifted W and SW on 5 April, based on satellite imagery. Reports in Saratamata stated that a dark ash plume drifted to the WSW, but no loud explosion was heard. Webcam images from 2100 showed incandescence above the crater and reflected in the clouds. According to an aerial survey, field observations, and satellite data, water was no longer present in the lake. A lava flow was reported effusing from the vent and traveling N into the dry Lake Voui, which lasted three days. The next morning at 0745 on 6 April a gas-and-steam and ash plume rose 5.4 km above the summit and drifted ESE, based on information from VMGD (figure 101). The Wellington VAAC also reported that light ashfall was observed on the island. Intermittent gas-and-steam and ash emissions were visible on 7 April, some of which rose to an estimated 3 km above the summit and drifted E. Webcam images during 0107-0730 on 7 April showed continuing ash emissions. A gas-and-steam and ash plume rose 695 m above the summit crater at 0730 on 19 April and drifted ESE, based on a webcam image (figure 102).
According to visual and infrared satellite data, water was visible in Lake Voui as late as 24 March 2023 (figure 103). The vent in the caldera showed a gas-and-steam plume drifted SE. On 3 April thermal activity was first detected, accompanied by a gas-and-ash plume that drifted W (figure 103). The lava flow moved N within the dry lake and was shown cooling by 8 April. By 23 April much of the water in the lake had returned. Occasional sulfur dioxide plumes were detected by the TROPOMI instrument on the Sentinel-5P satellite that exceeded 2 Dobson Units (DU) and drifted in different directions (figure 104).
Geologic Background. The island of Ambae, also known as Aoba, is a massive 2,500 km3 basaltic shield that is the most voluminous volcano of the New Hebrides archipelago. A pronounced NE-SW-trending rift zone with numerous scoria cones gives the 16 x 38 km island an elongated form. A broad pyroclastic cone containing three crater lakes (Manaro Ngoru, Voui, and Manaro Lakua) is located at the summit within the youngest of at least two nested calderas, the largest of which is 6 km in diameter. That large central edifice is also called Manaro Voui or Lombenben volcano. Post-caldera explosive eruptions formed the summit craters about 360 years ago. A tuff cone was constructed within Lake Voui (or Vui) about 60 years later. The latest known flank eruption, about 300 years ago, destroyed the population of the Nduindui area near the western coast.
Information Contacts: Geo-Hazards Division, Vanuatu Meteorology and Geo-Hazards Department (VMGD), Ministry of Climate Change Adaptation, Meteorology, Geo-Hazards, Energy, Environment and Disaster Management, Private Mail Bag 9054, Lini Highway, Port Vila, Vanuatu (URL: http://www.vmgd.gov.vu/, https://www.facebook.com/VanuatuGeohazardsObservatory/); Wellington Volcanic Ash Advisory Centre (VAAC), Meteorological Service of New Zealand Ltd (MetService), PO Box 722, Wellington, New Zealand (URL: http://www.metservice.com/vaac/, http://www.ssd.noaa.gov/VAAC/OTH/NZ/messages.html); MIROVA (Middle InfraRed Observation of Volcanic Activity), a collaborative project between the Universities of Turin and Florence (Italy) supported by the Centre for Volcanic Risk of the Italian Civil Protection Department (URL: http://www.mirovaweb.it/); Global Sulfur Dioxide Monitoring Page, Atmospheric Chemistry and Dynamics Laboratory, NASA Goddard Space Flight Center (NASA/GSFC), 8800 Greenbelt Road, Goddard, Maryland, USA (URL: https://so2.gsfc.nasa.gov/); Copernicus Browser, Copernicus Data Space Ecosystem, European Space Agency (URL: https://dataspace.copernicus.eu/browser/).
Search Bulletin Archive by Publication Date
Select a month and year from the drop-downs and click "Show Issue" to have that issue displayed in this tab.
The default month and year is the latest issue available.
Bulletin of the Global Volcanism Network - Volume 28, Number 04 (April 2003)
Managing Editor: Edward Venzke
Aira (Japan)
Ash plume observed in July 2002; plume photo from 17 April 2003
Anatahan (United States)
Eruption on 10 May is the first historical activity
Asamayama (Japan)
Four minor ash eruptions during February-April 2003
Chikurachki (Russia)
New eruption on 18 April generates long plumes and ashfall
Cosiguina (Nicaragua)
Earthquake swarm in September 2002
Erta Ale (Ethiopia)
Frequent changes in the active crater morphology and lava lake level
Guntur (Indonesia)
Increased seismicity since December 2002
Kikai (Japan)
Eruption plumes and ashfall during 24 May-5 June 2002
Miyakejima (Japan)
Small explosion in November 2002; continued high SO2 flux through April 2003
Niuafo'ou (Tonga)
Fumarolic and hot spring activity in the caldera during October 2002
Semeru (Indonesia)
Continued ash explosions, with frequent lava avalanches and pyroclastic flows
Soufriere Hills (United Kingdom)
Continued dome growth, rockfalls, and pyroclastic flows
Stromboli (Italy)
Strong explosion on 5 April covers much of the summit in pyroclastic deposits
Suwanosejima (Japan)
Ash explosions in September and December 2002, and activity in January 2003
Aira
Japan
31.5772°N, 130.6589°E; summit elev. 1117 m
All times are local (unless otherwise noted)
Ash plume observed in July 2002; plume photo from 17 April 2003
An observer at Kagoshima Airport reported seeing an ash cloud from Sakura-jima at 0900 on 22 July 2002 that rose to 2.1-2.4 km altitude. An ash plume was visible on satellite imagery at 1052 (0152 UTC) that day extending to the SW.
A photograph taken by the webcam at ttp://yumemaru.com/s/ shows a plume of undetermined composition originating from the island on 17 April 2003 (figure 22). This type of event is common at Sakura-jima.
Geologic Background. The Aira caldera in the northern half of Kagoshima Bay contains the post-caldera Sakurajima volcano, one of Japan's most active. Eruption of the voluminous Ito pyroclastic flow accompanied formation of the 17 x 23 km caldera about 22,000 years ago. The smaller Wakamiko caldera was formed during the early Holocene in the NE corner of the caldera, along with several post-caldera cones. The construction of Sakurajima began about 13,000 years ago on the southern rim and built an island that was joined to the Osumi Peninsula during the major explosive and effusive eruption of 1914. Activity at the Kitadake summit cone ended about 4,850 years ago, after which eruptions took place at Minamidake. Frequent eruptions since the 8th century have deposited ash on the city of Kagoshima, located across Kagoshima Bay only 8 km from the summit. The largest recorded eruption took place during 1471-76.
Information Contacts: Charles Holliday, U.S. Air Force Weather Agency, 106 Peacekeeper Drive, Ste 2NE, Offut AFB, NE 68113-4039, USA (URL: http://www.557weatherwing.af.mil/); Yunemaru (URL: http://yumemaru.com/).
Anatahan (United States) — April 2003 Cite this Report
Anatahan
United States
16.35°N, 145.67°E; summit elev. 790 m
All times are local (unless otherwise noted)
Eruption on 10 May is the first historical activity
An explosive eruption on 10 May at Anatahan marked the first report of activity at the volcano since an earthquake swarm on 29 May 1993 that led to the evacuation of the island (BGVN 18:05 and 18:08). No eruptions had previously been documented in historical time from this small volcanic island in the Commonwealth of the Northern Mariana Islands (CNMI) (figure 2).
A group of scientists was near Anatahan on 10 May deploying seismographs for the Margins Mariana Subduction Factory Imaging Project, which is comprised of members from Washington University, St. Louis; Scripps Inst. of Oceanography; and CNMI Emergency Management Office. They passed Anatahan as the eruption was occurring. The island was uninhabited at the time. According to members of the research group who viewed the eruption from about 10 km away, the eruption began on 10 May around 1700. The CNMI Emergency Management Office (EMO) reported that the ash cloud produced from the eruption eventually rose to an altitude of ~12 km (figure 3). During an observational helicopter flight, EMO personnel discovered that the eruption was emanating from the eastern crater (figure 4). They noted that only ash was being emitted, no lava flows were seen, and no explosions were seen or heard. The scientists had visited the island on 6 May and saw no signs of any unusual activity.
The Washington Volcanic Ash Advisory Center (VAAC) issued an advisory about the Anatahan eruption stating that an ash cloud was visible on satellite imagery on 10 May at 2232 at an estimated altitude of 10.5 km. One layer of the ash cloud drifted south at a speed of ~65 km/hour, and a lower level at an altitude of ~4.5 km drifted W at ~28 km/hr. By 0655 the next day ash was seen in satellite imagery drifting in three different directions: WNW at an altitude around 5.5 km, SW around 8.5 km, and two separate and smaller ash plumes were drifting SE at altitudes around 13.4 km. At this time, a hotspot was visible on GOES-9 imagery.
On 11 May the CNMI Emergency Management Office, Office of the Director issued a special advisory stating, "Due to this active volcano eruption with high level clouds and [an] ash plume, the general public especially fishermen, tour operators and commercial pilots are advise[d] to stay away from the island of Anatahan until further notice from the Office of Emergency Management." The eruption continued through at least 14 May, when the Washington VAAC issued an ash advisory stating that ash was visible on satellite imagery drifting W of Anatahan at an altitude of ~4.9 km.
Geologic Background. The elongate, 9-km-long island of Anatahan in the central Mariana Islands consists of a large stratovolcano with a 2.3 x 5 km compound summit caldera. The larger western portion of the caldera is 2.3 x 3 km wide, and its western rim forms the island's high point. Ponded lava flows overlain by pyroclastic deposits fill the floor of the western caldera, whose SW side is cut by a fresh-looking smaller crater. The 2-km-wide eastern portion of the caldera contained a steep-walled inner crater whose floor prior to the 2003 eruption was only 68 m above sea level. A submarine cone, named NE Anatahan, rises to within 460 m of the sea surface on the NE flank, and numerous other submarine vents are found on the NE-to-SE flanks. Sparseness of vegetation on the most recent lava flows had indicated that they were of Holocene age, but the first historical eruption did not occur until May 2003, when a large explosive eruption took place forming a new crater inside the eastern caldera.
Information Contacts: Doug Wiens, Washington University, St. Louis, McDonnell Hall 403 Box 1169, St. Louis, MO 63130; Allan Sauter, Scripps Institution of Oceanography, UCSD, 9500 Gilman Drive, La Jolla CA, 92093-0225; Juan Camacho, Commonwealth of the Northern Mariana Islands Emergency Management Office, P.O. Box 10007, Saipan, MP 96950 (URL: http://www.cnmihsem.gov.mp/); Washington VAAC, Satellite Analysis Branch (SAB), NOAA/NESDIS E/SP23, NOAA Science Center Room 401, 5200 Auth Road, Camp Springs, MD 20746, USA (URL: http://www.ssd.noaa.gov/); Scott Rowland, University of Hawai'i at Manoa, Hawai'i Institute of Geophysics and Planetology, 1680 East-West Road, POST 602, Honolulu, HI 96822; Frank Trusdell, Hawaiian Volcano Observatory, PO Box 51, Hawaii National Park, HI, 96718-0051.
Asamayama
Japan
36.406°N, 138.523°E; summit elev. 2568 m
All times are local (unless otherwise noted)
Four minor ash eruptions during February-April 2003
Asama, located near the resort town of Karuizawa ~150 km W of Tokyo, has been seismically active since 18 September 2000. Heightened seismicity occurred in June 2002, when the daily number of volcanic earthquakes exceeded 300 (BGVN 27:06). The Asama Volcano Observatory (ERI, University of Tokyo) and JMA reported that a new episode of elevated seismicity started around 0620 on 18 September 2002. A relatively large amount of volcanic gas trailed from the summit. The seismicity increased after 0800, 18 September, such that 243 volcanic earthquakes took place on 18 September and another 128 on the 19th, after which the seismic activity decreased. However, the temperature of the crater bottom remained at the elevated levels observed since May 2002. No change was observed in ground deformation.
According to the Japan Meteorological Agency (JMA), seismicity had been at background levels for several months, and the temperature of the crater had been rather low prior to four minor eruptions between 6 February and 18 April 2003. The first eruption occurred at about noon on 6 February as an ash cloud was seen rising to 300 m above the summit crater, with minor ashfall around the summit. Seismic tremor related to the emission started at around 1201 and lasted about 40 seconds. On 30 March at 0154 hours, a gray ash cloud rose 300 m, with minor ashfall around the summit. Then, on 7 April at 0924, an ash cloud rose 200 m. On 18 April at 0732 the volcano spewed a mixture of black smoke and pale ash ~300 m high. There were no reports of injuries or damage from these eruptions, and the JMA reported that more such activity is expected. All of the eruptions were brief, none having durations of more than 10 minutes. No unusual precursory seismic activity preceded these events, but plume activity has increased since the beginning of February.
Geologic Background. Asamayama, Honshu's most active volcano, overlooks the resort town of Karuizawa, 140 km NW of Tokyo. The volcano is located at the junction of the Izu-Marianas and NE Japan volcanic arcs. The modern Maekake cone forms the summit and is situated east of the remnant of an older andesitic volcano, Kurofuyama, which was destroyed by a late-Pleistocene landslide about 20,000 years before present (BP). Growth of a dacitic shield volcano was accompanied by pumiceous pyroclastic flows, the largest of which occurred about 14,000-11,000 BP, and by growth of the Ko-Asamayama lava dome on the east flank. Maekake, capped by the Kamayama pyroclastic cone that forms the present summit, is probably only a few thousand years old and has observed activity dating back at least to the 11th century CE. Maekake has had several major Plinian eruptions, the last two of which occurred in 1108 (Asamayama's largest Holocene eruption) and 1783 CE.
Information Contacts: Hitoshi Yamasato and Tomoyuki Kanno, Japan Meteorological Agency (JMA), Volcanological Division, 1-3-4 Ote-machi, Chiyoda-ku, Tokyo 100, Japan (URL: http://www.jma.go.jp/jma/index.html); Hidefumi Watanabe and Setysuya Nakada, Volcano Research Center-Earthquake Research Institute, University of Tokyo, Yayoi 1-1-1, Bunkyo, Tokyo, 113-0032 Japan (URL: http://www.eri.u-tokyo.ac.jp/VRC/index_E.html).
Chikurachki (Russia) — April 2003 Cite this Report
Chikurachki
Russia
50.324°N, 155.461°E; summit elev. 1781 m
All times are local (unless otherwise noted)
New eruption on 18 April generates long plumes and ashfall
A new eruption that began at Chikurachki on 18 April 2003 was reported by the Kamchatka Volcanic Eruptions Response Team (KVERT) and the Alaska Volcano Observatory (AVO). The most recent previous eruption occurred in early 2002 (BGVN 27:01 and 27:04). Ash explosions were seen by observers on Paramushir Island, and at 1500 and 2000 ashfall was observed in Podgorny town and Cape Vasiliev. The Aviation Meteorological Center at Yelizovo Airport reported that on 19 April ash plumes rose 2,000 m above the crater. According to satellite data from the USA, distinct volcanic events were detected at approximately 2300 on 19 April, 0200 on 20 April, and 0430 on 20 April (1200, 1500, and 1730 UTC, 19 April), with the ash moving towards the SE. Interpretation of satellite imagery revealed plumes extending more than 50 km SE and SSE during 18-19 April, with the longest reaching more than 250 km at 1501 on the 19th.
Visual data from Vasiliev Cape and Paramushir Island on 22 April showed a white gas-and-steam plume that rose 500 m above the crater. According to satellite data from the USA and Russia, ash plumes less than 100 km long were moving SE and E during 22-25 April. Longer plumes on 25 April were directed NNE. Observers from Vasiliev Cape noted a white plume rising ~500 m above the crater on 27 April. On 28 April residents in Severo-Kurilsk observed a very fine layer of gray ash (less than 1 mm thick) near the city, 3 km S of the volcano. The longest plume seen in satellite imagery during April was more then 300 km long when observed at 2028 on 29 April.
Geologic Background. Chikurachki, the highest volcano on Paramushir Island in the northern Kuriles, is a relatively small cone constructed on a high Pleistocene edifice. Oxidized basaltic-to-andesitic scoria deposits covering the upper part of the young cone give it a distinctive red color. Frequent basaltic Plinian eruptions have occurred during the Holocene. Lava flows have reached the sea and formed capes on the NW coast; several young lava flows are also present on the E flank beneath a scoria deposit. The Tatarinov group of six volcanic centers is located immediately to the south, and the Lomonosov cinder cone group, the source of an early Holocene lava flow that reached the saddle between it and Fuss Peak to the west, lies at the southern end of the N-S-trending Chikurachki-Tatarinov complex. In contrast to the frequently active Chikurachki, the Tatarinov centers are extensively modified by erosion and have a more complex structure. Tephrochronology gives evidence of an eruption around 1690 CE from Tatarinov, although its southern cone contains a sulfur-encrusted crater with fumaroles that were active along the margin of a crater lake until 1959.
Information Contacts: Olga Girina, Kamchatka Volcanic Eruptions Response Team (KVERT), Institute of Volcanic Geology and Geochemistry (IVGG), Piip Ave. 9, Petropavlovsk-Kamchatsky, 683006, Russia; Alaska Volcano Observatory (AVO), a cooperative program of a) U.S. Geological Survey, 4200 University Drive, Anchorage, AK 99508-4667, USA (URL: http://www.avo.alaska.edu/), b) Geophysical Institute, University of Alaska, PO Box 757320, Fairbanks, AK 99775-7320, USA, and c) Alaska Division of Geological & Geophysical Surveys, 794 University Ave., Suite 200, Fairbanks, AK 99709, USA.
Cosiguina (Nicaragua) — April 2003 Cite this Report
Cosiguina
Nicaragua
12.98°N, 87.57°W; summit elev. 872 m
All times are local (unless otherwise noted)
Earthquake swarm in September 2002
In September 2002 an earthquake swarm was registered near Cosigüina. This swarm was the first to be recognized at that volcano in the 27 years of the existence of Nicaragua's seismic network. The historical seismic record contains no evidence of the type of cluster that occurred in September 2002, although there was seismic activity in 1951 that could have been of local origin (see below).
The seismicity began on 4 September, with M 2.4-3.6 events. The main earthquake occurred on 9 September with a magnitude of 3.9. The last event occurred on 16 September with a magnitude of 3.7. A total of 34 earthquakes occurred to the N of Cosigüina volcano. Unfortunately, the seismic station at the volcano failed to function due to radio signal transmission problems. Seismic readings were also obtained from the National System of Territorial Studies of El Salvador (SNET) for 31 earthquakes. Epicenters of the earthquakes, located with the readings obtained by the seismic networks of the Instituto Nicaragüense de Estudios Territoriales (INETER) and SNET, were concentrated in a zone approximately 4-5 km N and W of the crater (figure 1). The distribution, along a SW-NE axis, might be simply a product of the geometry of the configuration of seismic stations with which the events were located.
Randy White (USGS) indicated to INETER that the seismicity seems to have been of the volcano-tectonic type, caused by an intrusion of magma, based on several observations: 1) the two stages of the cluster on 4-6 and 9 September showed a release of similar seismic energy; 2) In the two stages there were many similarly sized events; 17 with a magnitude of 3.0 or less, but none greater than 3.9; 3) The maximum magnitude increased several times; and 4) The distribution of energy was highly unusual for tectonic seismicity. Apparently there were several groups of one or a few events in intervals of 5-7 hours. Regular pulsations are typical for volcanic earthquake swarms that last more than several hours.
INETER volcanologist Pedro Perez investigated the volcano on 12 September, but saw nothing anomalous. He also conducted interviews with local residents, went to the summit crater, and took measurements of thermal waters at the foot of the volcano. Within the crater walls, landslides were observed in the E, S, and W portions. Residents in the Marañonal, Potosí, Punta Ñata, and Apascali sectors did not feel the earthquakes.
Seismicity in August 1951. The following description is based on news reports compiled by INETER (The News, 1951 Ago. 07; The Press, 1951 Ago. 04, 05, 07, 09, 18).
In August 1951 there was strong seismic activity in western Nicaragua and southwestern Honduras. On 2 August one of a series of strong events produced a 200-m-long crack near Cosigüina that spewed large amounts of water, flooding the region. The seismic shocks also demolished three houses in Chinandega. These earthquakes were felt more strongly to the W and diminished to the N and in the direction of Managua. The population in these areas slept outside their homes for many days. The people of these sectors, mainly the western population, felt continuous and violent seismic shocks until 8 August. On 17 August a strong tremor shook the western region and Managua. Apparently, this seismic activity produced more than 100 events, not all of which were felt by all residents.
Geologic Background. Cosigüina (also spelled Cosegüina) is a low basaltic-to-andesitic composite volcano that is isolated from other eruptive centers in the Nicaraguan volcanic chain. The stratovolcano forms a large peninsula extending into the Gulf of Fonseca at the western tip of the country. It has a pronounced somma rim on the northern side; a young summit cone rises 300 m above the northern somma rim and buries the rim on other sides. The younger cone is truncated by a large elliptical prehistorical summit caldera, 2 x 2.4 km in diameter and 500 m deep, with a lake at its bottom. Lava flows predominate in the caldera walls, although lahar and pyroclastic-flow deposits surround the volcano. A brief but powerful explosive eruption in 1835 is Nicaragua's largest during historical time. Ash fell as far away as México, Costa Rica, and Jamaica, and pyroclastic flows reached the Gulf of Fonseca.
Information Contacts: Virginia Tenorio and Wilfried Strauch, Instituto Nicaragüense de Estudios Territoriales (INETER), Apartado 1761, Managua, Nicaragua (URL: http://www.ineter.gob.ni/).
Erta Ale (Ethiopia) — April 2003 Cite this Report
Erta Ale
Ethiopia
13.601°N, 40.666°E; summit elev. 585 m
All times are local (unless otherwise noted)
Frequent changes in the active crater morphology and lava lake level
Over the last few years the Afar National Regional State has allowed a program of visitation to Erta Ale volcano by natural science field workers. As a result, numerous expeditions have visited the volcano since November 2000 and January-February 2001 (BGVN 26:12). The following brief reports are a result of some of these visits during January, February, and April 2002, November-December 2002, and January 2003. Typical lava lake activity was commonly reported, but some changes, such as a significant changes of the lake level, were also noted.
Activity during January 2002. Members of the Société de Volcanologie Genève (SVG) visited Erta Ale at the end January 2002. The lava lake remained elliptical with a N-S axis of ~130-133 m and an E-W axis of ~104-111 m; the width had increased ~10 m as a result of crumbling of the terrace along the lake edge. The size of the pit-crater was the same, with an E-W diameter of ~170 m, while the height of the vertical E wall was 46 m. Attempts to measure CO2 and SO2 concentrations inside the crater on 27 January 2002 were unsuccessful because the gas concentrations were below the detection limits of the Dräger tubes (10 ppm SO2 and 0.5% CO2).
Activity during February 2002. During a 14-19 February 2002 stay on Erta Ale by a team that included Roberto Carniel and Jürg Alean (Stromboli Online), the lava lake was active and produced spectacular fountains of lava. The lake level oscillated by several meters during their observation period. Seismic measurements were conducted along with thermal and video recordings of the lake.
Activity during April 2002. During 12-21 April 2002 a group from SVG led by Franck Pothé and Evelyne Pradal visited the volcano and reported significant changes in the morphology and activity of the lava lake since January 2002. The level of the lake had risen ~15 m and its surface area had decreased by ~33%. Over a 36-hour period the level varied intermittently by 1-2 m, the variation sometimes occurring within several minutes. Activity on the lake was intense, with continuous degassing and small lava fountains ~15 m high.
Activity during November-December 2002. A German group from Volcano Expeditions International visited the volcano during November-December 2002. They reported that the S crater was ellipsoidal with dimensions of ~130 m N-S and ~160 m E-W (figure 10). The lava lake occupied about half of the crater, and the lake surface was ~90 m below the W rim of the S pit. The remaining area in the E was covered by basalt that had a terrace ~45 m below the crater rim (figure 10). Previous observations had located the terrace at ~70 m below the rim. It was widely covered with talus; hence, the lava lake must had risen up to the present terrace level between spring 2002 and this visit. Almost no talus was found on the terrace, indicating that the lava cover was not old. Lava fountaining up to 20 m high occurred mainly in the W, S, and center areas of the crater lake. GPS measurements were used to accurately map part of the caldera rim and locate some key points (figure 11).
Several earthquakes were felt during the visit. No seismic equipment was present, but five events were felt on 4 and 5 December 2002. No significant change in the lava lake was noticed during these events. Strong fumarolic activity was observed inside and outside the NW crater as well as on the outside of the caldera rim. The surface near the crater rim was broken by cracks in concentric circles, and the crater walls were formed of very unstable material. On 6 December three large rockfalls from crater wall collapses occurred along ~50 m of the crater wall circumference within a few minutes. About 40 m of the wall height collapsed with an estimated average thickness of 10 m, thus ~20,000 m3 of material slid into the lake, creating a large cloud of orange-brown dust that filled the pit and generated large amounts of Pélé's Hair.
Activity during January 2003. French teams from Terra Incognita visited the summit on 4 and 13-14 January 2003. The ~120 m long by 80 m wide lava lake was still in the W portion of the S pit crater; its surface was ~100 m below the crater rim (figure 12). The new platform, located ~50 m below the rim, was in the E part of the crater and covered ~25% of the crater floor. Gas emissions were abundant, and were assumed to be rich in SO2 based on their blue color and strong odor. The lava lake exhibited convection and lava fountains.
Geologic Background. The Erta Ale basaltic shield volcano in Ethiopia has a 50-km-wide edifice that rises more than 600 m from below sea level in the Danakil depression. The volcano includes a 0.7 x 1.6 km summit crater hosting steep-sided pit craters. Another larger 1.8 x 3.1 km wide depression elongated parallel to the trend of the Erta Ale range is located SE of the summit and is bounded by curvilinear fault scarps on the SE side. Basaltic lava flows from these fissures have poured into the caldera and locally overflowed its rim. The summit caldera usually also holds at least one long-term lava lake that has been active since at least 1967, and possibly since 1906. Recent fissure eruptions have occurred on the N flank.
Information Contacts: P. Vetsch, Marc Caillet, Steven Haefeli, and Pierre-Yves Burgi, Société de Volcanologie Genève (SVG), PO Box 6423, CH-1211 Geneva 6, Switzerland (URL: http://www.volcan.ch/); Jürg Alean, Stromboli Online, Rheinstrasse 6, CH-8193 Eglisau, Switzerland (URL: http://www.swisseduc.ch/stromboli/); Christoph Weber and Lothar Fritsch, Volcano Expeditions International (VEI), Muehlweg 11, 74199 Untergruppenbach, Germany; Jacques-Marie Bardintzeff, Université Paris-Sud, F-91405 Orsay, France; Franck Pothé, Terra Incognita, CP 701, 36 quai Arloing 69256 Lyon Cédex, France.
Guntur
Indonesia
7.143°S, 107.841°E; summit elev. 2251 m
All times are local (unless otherwise noted)
Increased seismicity since December 2002
During December 2002, the Volcanological Survey of Indonesia (VSI) reported that activity at Guntur was higher than normal. As a result, the Alert Level was raised to 2 (on a scale of 1-4). No plume was observed, but deep and shallow volcanic earthquakes were registered, as well as tectonic earthquakes, through at least mid-May 2003. Tremor was also reported occasionally (table 1). On 28 December a "white ash plume around Guntur crater and Kabuyutan crater reached 3 m high." No ashfall was reported. The temperature at Guntur crater was 79.7°C and at Kabuyutan was 92.7°C. EDM deformation measurements taken on 22 November, 14 December, and 28 December 2002 revealed 11 cm of inflation. On 13 January 2003, an earthquake (MM 2-3) was felt in surrounding areas. Elevated tremor was noted during the first week of April 2003. Guntur remained at Alert Level 2 throughout mid-May.
Table 1. Seismicity at Guntur during 1 December 2002-18 May 2003. Courtesy of VSI.
| Date |
Deep volcanic (A-type) |
Shallow volcanic (B-type) |
Tectonic |
| 01 Dec-08 Dec 2002 |
8 |
8 |
19 |
| 09 Dec-15 Dec 2002 |
5 |
12 |
23 |
| 16 Dec-22 Dec 2002 |
2 |
6 |
16 |
| 23 Dec-29 Dec 2002 |
-- |
5 |
14 |
| 30 Dec-05 Jan 2003 |
8 |
24 |
15 |
| 06 Jan-12 Jan 2003 |
3 |
6 |
12 |
| 13 Jan-19 Jan 2003 |
2 |
11 |
12 |
| 20 Jan-26 Jan 2003 |
3 |
23 |
20 |
| 27 Jan-02 Feb 2003 |
5 |
5 |
22 |
| 03 Feb-09 Feb 2003 |
5 |
4 |
11 |
| 10 Feb-16 Feb 2003 |
4 |
5 |
22 |
| 17 Feb-23 Feb 2003 |
3 |
11 |
17 |
| 24 Feb-02 Mar 2003 |
6 |
4 |
19 |
| 03 Mar-09 Mar 2003 |
3 |
10 |
30 |
| 10 Mar-16 Mar 2003 |
4 |
5 |
20 |
| 17 Mar-23 Mar 2003 |
1 |
3 |
28 |
| 24 Mar-30 Mar 2003 |
4 |
4 |
24 |
| 31 Mar-06 Apr 2003 |
13 |
6 |
23 |
| 07 Apr-13 Apr 2003 |
5 |
2 |
17 |
| 14 Apr-20 Apr 2003 |
3 |
3 |
22 |
| 21 Apr-27 Apr 2003 |
6 |
3 |
31 |
| 28 Apr-04 May 2003 |
4 |
2 |
18 |
| 05 May-11 May 2003 |
2 |
-- |
24 |
| 12 May-18 May 2003 |
3 |
1 |
19 |
Geologic Background. Guntur is a complex of several overlapping stratovolcanoes about 10 km NW of the city of Garut in western Java. Young lava flows, the most recent of which was erupted in 1840, are visible on the flanks of the erosionally unmodified Gunung Guntur, which rises about 1550 m above the plain of Garut. It is one of a group of younger cones constructed to the SW of an older eroded group of volcanoes at the NE end of the complex. Guntur, whose name means "thunder," is the only center with recorded activity, with eruptions since the late-17th century. Although it produced frequent explosive eruptions in the 19th century, it has not erupted since.
Information Contacts: Dali Ahmad, Volcanological Survey of Indonesia (VSI), Jalan Diponegoro No. 57, Bandung 40122, Indonesia (URL: http://www.vsi.esdm.go.id/).
Kikai
Japan
30.793°N, 130.305°E; summit elev. 704 m
All times are local (unless otherwise noted)
Eruption plumes and ashfall during 24 May-5 June 2002
According to a Japanese Meteorological Agency (JMA) report on 6 June 2002, discolored plumes associated with volcanic tremor had intermittently issued from Kikai since 11 May 2002. The U.S. Air Force Weather Agency reported that plumes emanating from Satsuma-Iwo-jima (an island forming part of the NW caldera rim of Kikai) were visible on satellite imagery during 24-28 May and 1-4 June 2002. The thin plumes drifted to the S, SE, and E during May, and were estimated to be lower than 3 km altitude. Ash was seen from the island of Yaku-shima on the afternoon of 26 May. JMA noted that the number of small volcanic earthquakes increased after 29 May. The JMA report also stated that discolored plumes were observed from Mishima village in the Ryukyu Islands, and that ash fell on residential areas, during 3-5 June 2002.
Geologic Background. Multiple eruption centers have exhibited recent activity at Kikai, a mostly submerged, 19-km-wide caldera near the northern end of the Ryukyu Islands south of Kyushu. It was the source of one of the world's largest Holocene eruptions about 6,300 years ago when rhyolitic pyroclastic flows traveled across the sea for a total distance of 100 km to southern Kyushu, and ashfall reached the northern Japanese island of Hokkaido. The eruption devastated southern and central Kyushu, which remained uninhabited for several centuries. Post-caldera eruptions formed Iodake (or Iwo-dake) lava dome and Inamuradake scoria cone, as well as submarine lava domes. Recorded eruptions have occurred at or near Satsuma-Iojima (also known as Tokara-Iojima), a small 3 x 6 km island forming part of the NW caldera rim. Showa-Iojima lava dome (also known as Iojima-Shinto), a small island 2 km E of Satsuma-Iojima, was formed during submarine eruptions in 1934 and 1935. Mild-to-moderate explosive eruptions have occurred during the past few decades from Iodake, a rhyolitic lava dome at the eastern end of Satsuma-Iojima.
Information Contacts: Naokuni Uchida, Japan Meteorological Agency (JMA), Fukuoka, Japan (URL: http://www.jma.go.jp/); Volcano Research Center, Earthquake Research Institute, University of Tokyo, Yayoi 1-1-1, Bunkyo-ku, Tokyo 113-0032, Japan (URL: http://www.eri.u-tokyo.ac.jp/VRC/index_E.html); Charles Holliday, U.S. Air Force Weather Agency, 106 Peacekeeper Drive, Ste 2NE, Offut AFB, NE 68113-4039, USA (URL: http://www.557weatherwing.af.mil/).
Miyakejima
Japan
34.094°N, 139.526°E; summit elev. 775 m
All times are local (unless otherwise noted)
Small explosion in November 2002; continued high SO2 flux through April 2003
Miyake-jima has remained restless since the eruption that began in June 2000 (BGVN 25:05-25:07, 25:09, 26:02, 27:03, and 27:11). Small explosions with minor ash emission have been common (see BGVN 27:11). The most recent event reported by the Japan Meteorological Agency was at about 1320 on 24 November 2002, with the plume rising to an unknown height. The SO2 gas output remained high, ~4,000-9,000 tons/day, as of March 2003 (figure 19). Robust degassing was ongoing through the week of 16-22 April 2003. All residents on Miyake-jima island have been evacuated since September 2000, after which time SO2 fluxes reached extremely high values (over 80,000 tons/day in October 2000).
Geologic Background. The circular, 8-km-wide island of Miyakejima forms a low-angle stratovolcano that rises about 1,100 m from the sea floor in the northern Izu Islands about 200 km SSW of Tokyo. The basaltic volcano is truncated by small summit calderas, one of which, 3.5 km wide, was formed during a major eruption about 2,500 years ago. Numerous craters and vents, including maars near the coast and radially oriented fissure vents, are present on the flanks. Frequent eruptions have been recorded since 1085 CE at vents ranging from the summit to below sea level, causing much damage on this small populated island. After a three-century-long hiatus ending in 1469 CE, activity has been dominated by flank fissure eruptions sometimes accompanied by minor summit eruptions. A 1.6-km-wide summit crater was slowly formed by subsidence during an eruption in 2000.
Information Contacts: Akihiko Tomiya, Geological Survey of Japan, AIST, 1-1 Higashi, 1-Chome Tsukuba, Ibaraki 305-8567, Japan (URL: http://staff.aist.go.jp/a.tomiya/tomiyae.html); Japan Meteorological Agency (JMA), Fukuoka, Japan (URL: http://www.jma.go.jp/).
Niuafo'ou
Tonga
15.6°S, 175.63°W; summit elev. 260 m
All times are local (unless otherwise noted)
Fumarolic and hot spring activity in the caldera during October 2002
Niuafo'ou is Tonga's most active volcano with at least 10 periods of activity, both explosive and effusive, since the early 1800s. The most recent period of activity in 1946 (Taylor 1999) resulted in the complete evacuation of the island. This volcanic center, ~450 km N of Tongatapu, is an isolated volcanic island located in the N-central Lau Basin (figure 4). In May 1999 a vent was producing hot water and H2S, and dead fish were observed near the vent (BGVN 26:05). Paul W. Taylor visited the volcano in October 2002 and noted fumarolic activity in two areas of the central caldera. On 20 October fumarolic and hot spring activity was noted in the NE part of the caldera.
Form and structure. Niuafo'ou is a subaerial shield volcano formed by submarine explosive and effusive activity during the Holocene. The island is approximately 8 km in diameter with a central caldera ~4 km in diameter with two lakes, Vai Lahi and Vai Si'i (figures 5 and 6). Periods of explosive activity have formed several small cinder cone complexes within the caldera. A detailed description of the geological features of Niuafo'ou is provided in Taylor (1991). Niuafo'ou rises to a height of 213 m above sea level at a point on the N rim of the caldera, a point known to the Niuafo'ouans as Piu Ofahifa.
Activity during October 2002. During a visit to Niuafo'ou in October 2002 to conduct a series of community workshops, it was noted that fumarolic activity was occurring in two areas of the central caldera. On 14 October Cecile Quesada (a French anthropologist) and Chris Simard visited the Vai Kona and Vai Sulfa areas along the S edge of the caldera (figure 6) and observed continued activity at the site. On 20 October, Taylor, Alejandra Meija-restrepo, Quesada, and Simard visited the Vai Si'i area in the NE part of the caldera and observed continued fumarolic and hot spring activity.
Vai Kona/Vai Sulfa Area. The Vai Kona/Vai Sulfa area of Niuafo'ou has been the site of persistent fumarolic and hot spring activity for many years. Activity was reported in 1958 (Richard, 1962) and again during 1982-83 and 1984 (Taylor, 1991). The level of Vai Kona fluctuates periodically. When Quesada and Simard visited the site on 14 October 2002, areas of persistent activity were observed.
Activity at Vai Kona was concentrated along the S shores of the lake (figure 7). Quesada and Simard observed numerous active vents on the floor of the lake, with large quantities of bubbles reaching the surface. The water temperature was estimated to be 25-30°C. Thick dark mud was present on the bottom of the lake and the temperature of the mud around the vents was estimated to be 35-40°C. Several active hot springs were also observed along the W shore of Vai Kona. These observations suggest that activity at the site has intensified since observed in 1958 and 1983.
Vai Sulfa occupies a small depression W of the southern end of Vai Kona (figure 7). The entire feature covers an area of about 30 m2 and consists of two sections. The W part of the depression is occupied by a small lake, while the E section is dry. At the center of this dry area is a vent ~40 cm across and 20-30 cm deep filled with mud and leaves. When leaves were removed from the hole during the visit it began to fill with water, and a boiling sound was heard. Extensive deposits of sulfur existed around the entire depression, and a strong smell of sulfur was present. Similar activity was also occurring when Quesada and Simard visited the area during July and September 2001. However, activity was less intense at those times.
Vai Si'i Area. A new site of fumarolic activity was first reported during May 1999 and observed during June 1999 (BGVN 26:05). When the site was visited on 20 October the focus of activity had moved to an area along the E shore of Vai Si'i. Numerous vents were present on the floor of the lake along the shoreline. The affected area stretched along the shoreline for ~25-30 m from where the vents were concentrated (figure 7). Active vents were aligned along the shoreline. Although the temperature of the lake water was an estimated 30°C (the prevailing air temperature), the temperature just below the surface of the sediment around the vents had increased to an estimated 65-75°C.
The vents were producing gas that was bubbling to the surface. A strong sulfur smell was noted, and large deposits of sulfur were present in the mud that comprised the floor of the lake around the vents. The deposits formed three elongated lobes that stretched S from the vents. The lobe-like distribution was probably the result of wind-induced currents. Vegetation along the shoreline was dead and encrusted with white sulfur (?). The observations suggests a net increase in activity at the Vai Si'i site since June 1999.
Conclusions. The observed fumarolic activity on Niuafo'ou indicates that the volcanic system is still active. Although not widespread, the fumarolic manifestations observed during 1999-2002 probably represent a net increase in the activity of the system since the last eruption in 1946. At this stage the level of activity is not of concern, but it should be monitored for signs of increase.
References. Richard, J.J., 1962, Kermadec, Tonga and Samoa: Catalogue of Active Volcanoes of the World, part 13.
Taylor, P.W., 1991, The Geology and Petrology of Niuafo'ou Island, Tonga: Subaerial Volcanism in an Active Back-arc Basin: Unpublished MSc thesis, Macquarie University, AVI Occasional Report, No. 91/01.
Taylor, P.W., 1999, The 1946 Eruption of Niuafo'ou: AVI Occasional Report, No. 99/03.
Geologic Background. Niuafo'ou ("Tin Can Island") is a low 8-km-wide island that forms the summit of a largely submerged basaltic shield volcano in the north central Lau Basin about 170 km W of the northern end of the Tofua volcanic arc. The circular island encloses a 5-km-wide caldera that is mostly filled by a lake whose bottom extends to below sea level. The inner walls of the caldera drop sharply to the lake, named Big Lake (or Vai Lahi), which contains several small islands and pyroclastic cones on its NE shore. Eruptions recorded since 1814, mostly from circumferential fissures on the west-to-south side of the island, have often damaged villages. A major eruption in 1946 forced evacuation of most of its 1,200 inhabitants.
Information Contacts: Paul W. Taylor, Australian Volcanological Investigations, PO Box 291, Pymble, NSW 2073 Australia.
Semeru
Indonesia
8.108°S, 112.922°E; summit elev. 3657 m
All times are local (unless otherwise noted)
Continued ash explosions, with frequent lava avalanches and pyroclastic flows
At Semeru, the end of December 2002 was characterized by high numbers of explosions and pyroclastic flows (BGVN 27:12). The 29 December pyroclastic flow at Besuk Bang (figures 11 and 12) traveled ~9 km from the summit. During January through 23 March 2003, the Volcanological Survey of Indonesia (VSI) reported that seismicity was dominated by explosions and avalanches (table 11). A "white-gray ash" column rose 300-700 m above the summit. Activity was especially high during 1-12 January, when tens of ash explosions were visually observed per week (figures 13 and 14). Continuous tremor occurred on 8 January, with an amplitude of 11-12 mm. The Alert level remained at 2.
Table 11. Summary of weekly seismicity at Semeru during 1 January-23 March 2003. Courtesy VSI.
| Date |
Deep volcanic (A-type) |
Shallow volcanic (B-type) |
Explosions |
Avalanches |
Tremor earthquakes |
Pyroclastic flows |
| 01 Jan-05 Jan 2003 |
-- |
4 |
354 |
89 |
7 |
0 |
| 06 Jan-12 Jan 2003 |
-- |
-- |
382 |
84 |
38 |
1 |
| 13 Jan-19 Jan 2003 |
-- |
1 |
554 |
89 |
7 |
0 |
| 20 Jan-26 Jan 2003 |
1 |
2 |
641 |
50 |
15 |
0 |
| 27 Jan-02 Feb 2003 |
18 |
-- |
739 |
84 |
9 |
3 |
| 03 Feb-09 Feb 2003 |
2 |
-- |
777 |
58 |
9 |
14 |
| 10 Feb-16 Feb 2003 |
3 |
4 |
641 |
53 |
13 |
5 |
| 17 Feb-23 Feb 2003 |
4 |
9 |
700 |
105 |
10 |
9 |
| 24 Feb-02 Mar 2003 |
6 |
-- |
629 |
33 |
8 |
10 |
| 03 Mar-09 Mar 2003 |
-- |
4 |
794 |
18 |
4 |
0 |
| 10 Mar-16 Mar 2003 |
2 |
-- |
550 |
89 |
20 |
21 |
| 17 Mar-23 Mar 2003 |
-- |
-- |
563 |
57 |
9 |
13 |
Lava avalanches in January 2003 extended up to 750 m from the crater rim and sometimes entered the Besuk Kembar river. One pyroclastic flow traveled 1,500 m and also entered Besuk Kembar. Pyroclastic flows were more numerous in February, travelling between 2.5 and 4 km from the summit into the Besuk Bang drainage. Lava avalanches were continuous during 17-23 February towards Besuk Kambar. Several pyroclastic flows in March moved toward Besuk Bang (up to 4 km long) and Besuk Kembar (up to 2 km long).
Infrared satellite data, January 2001-March 2003. Between January 2001 and March 2003, MODIS detected quasi-continuous thermal alerts at Semeru (figure 15). During January 2001-March 2002, the anomalies were characterized by 1-2 alert-pixels with a maximum alert ratio of -0.567 (4 May 2001). The Darwin VAAC reported ash plumes and clouds on several occasions throughout this period, and VSI reported numerous seismic events representing explosions and other phenomena (BGVN 26:08).
From April 2002 until the end of the year, MODIS thermal alerts for Semeru increased in frequency and magnitude. This period was characterized by continuous explosions, avalanches and pyroclastic flows, and is related to seismicity increases beginning in March 2002 that prompted VSI to raise the Alert Level to 2 (BGVN 27:06). Thermal alerts reached a maximum amplitude on 16 August (two alert pixels with a maximum alert ratio of -0.364) and 1 September (one alert pixel with alert ratio of -0.389). VSI reported that seismic activity was higher than normal during June-September 2002 (BGVN 27:09), and the explosions produced plumes that reached 300-500 m above the crater. Observers reported that lava avalanches traveled toward the Besuk Kembar river to distances of ~750 m from the crater rim, and an ash explosion ejected glowing material ~150 m toward the upper Besuk Kembar drainage. Center coordinates of alert pixels were concentrated in four adjacent pixels close to Semeru's summit, especially on the S side.
Geologic Background. Semeru, the highest volcano on Java, and one of its most active, lies at the southern end of a volcanic massif extending north to the Tengger caldera. The steep-sided volcano, also referred to as Mahameru (Great Mountain), rises above coastal plains to the south. Gunung Semeru was constructed south of the overlapping Ajek-ajek and Jambangan calderas. A line of lake-filled maars was constructed along a N-S trend cutting through the summit, and cinder cones and lava domes occupy the eastern and NE flanks. Summit topography is complicated by the shifting of craters from NW to SE. Frequent 19th and 20th century eruptions were dominated by small-to-moderate explosions from the summit crater, with occasional lava flows and larger explosive eruptions accompanied by pyroclastic flows that have reached the lower flanks of the volcano.
Information Contacts: Dali Ahmad, Volcanological Survey of Indonesia (VSI), Jalan Diponegoro No. 57, Bandung 40122, Indonesia (URL: http://www.vsi.esdm.go.id/); Diego Coppola and David A. Rothery, Department of Earth Sciences, The Open University, Milton Keynes, MK7 6AA, UK. Thermal alerts courtesy of the HIGP MODIS Thermal Alerts Team (URL: http://modis.higp.hawaii.edu/).
Soufriere Hills (United Kingdom) — April 2003 Cite this Report
Soufriere Hills
United Kingdom
16.72°N, 62.18°W; summit elev. 915 m
All times are local (unless otherwise noted)
Continued dome growth, rockfalls, and pyroclastic flows
During 1 March through 2 May 2003, the dome continued to grow, producing numerous rockfalls and moderate pyroclastic flows. Most activity was concentrated on the northern flanks, producing numerous pyroclastic flows in White's Ghaut, the Tar River Valley, and Tuitt's Ghaut. Pyroclastic flows and rockfalls traveled down all flanks of the dome at some time during the period. On 20 March, the greatest dome height recorded to date was measured, 1,098 m. A prominent extrusive lobe was established on the E and SE sides of the summit at the beginning of April. On 22 April, a large spine, inclined to the E, was observed on the summit, the top of which was at an elevation of 1,163 m.
The Washington VAAC issued notices daily to the aviation community regarding ash clouds emanating from the summit. Seismicity during the report period was dominated by rockfalls (table 44). Average daily SO2 emission rates varied throughout the report period (table 45) with a low of 31 tons/day on 25 March to a maximum of 1,550 tons/day on 1 May.
Table 44. Summary of weekly seismicity at Soufrière Hills during 28 February 2003-2 May 2003. Courtesy MVO.
| Date |
Rockfall |
Hybrid |
Long-period |
Long-period / Rockfall |
Volcano-tectonic |
| 28 Feb-07 Mar 2003 |
997 |
0 |
79 |
71 |
4 |
| 07 Mar-14 Mar 2003 |
1050 |
5 |
87 |
108 |
0 |
| 14 Mar-21 Mar 2003 |
1050 |
2 |
93 |
152 |
2 |
| 21 Mar-28 Mar 2003 |
1097 |
16 |
99 |
138 |
7 |
| 28 Mar-04 Apr 2003 |
754 |
7 |
74 |
101 |
2 |
| 04 Apr-11 Apr 2003 |
332 |
1 |
66 |
77 |
-- |
| 11 Apr-18 Apr 2003 |
393 |
7 |
72 |
56 |
-- |
| 18 Apr-25 Apr 2003 |
966 |
4 |
83 |
88 |
1 |
| 26 Apr-02 May 2003 |
813 |
4 |
168 |
121 |
1 |
Table 45. Average daily SO2 emission rates at Soufrière Hills during 28 February 2003-2 May 2003. Courtesy MVO.
| Date |
SO2 emissions (tons/day) |
| 28 Feb 2003 |
1020 |
| 28 Feb-07 Mar 2003 |
500-1020 |
| 07 Mar-14 Mar 2003 |
220-355 |
| 14 Mar-21 Mar 2003 |
285-380 |
| 21 Mar-28 Mar 2003 |
31-497 |
| 25 Mar 2003 |
31 |
| 28 Mar-04 Apr 2003 |
230-770 |
| 04 Apr-11 Apr 2003 |
151-780 |
| 06 Apr 2003 |
151 |
| 11 Apr-18 Apr 2003 |
220-550 |
| 18 Apr-25 Apr 2003 |
450-550 |
| 25 Apr-02 May 2003 |
390-1550 |
| 01 May 2003 |
1550 |
Throughout the period, access to all areas S of the Belham Valley, to Waterworks, Happy Hill, Lower Friths and Old Towne, and to Bramble airport and beyond was prohibited and a maritime exclusion zone around the S part of the island extended 3.7 km beyond the coastline from Trant's Bay in the E to Lime Kiln Bay on the W coast.
Activity during March 2003. Activity remained at levels similar to that of the previous few weeks (BGVN 28:02), with continued dome growth and moderate pyroclastic-flow activity. Lava extrusion was accompanied by rockfall activity and pyroclastic flows that were focused, during 1-7 March, on the NE and N slopes and valleys. Pyroclastic flows occurred most frequently in Tuitt's Ghaut with a few on Farrell's Plain with run-out distances up to 1 km.
During 8-14 March, rockfalls and pyroclastic flows occurred down all flanks. Dome growth continued and lava extruding into the center of the summit dome complex continued to increase the dome height. Dome glow at night was spectacular in the Tar River Valley and on the NW in Tuitt's Ghaut and the N talus slopes. Small rockfalls and pyroclastic flows occurred infrequently on the W flank and at the top of Gage's Valley. Ash venting was continuous in the summit area.
Lava extrusion during 15-21 March formed a series of spines and ridges. Theodolite measurements on 20 March indicated a dome height of 1,098 m, the highest recorded to date. Activity was dominated by rockfalls and pyroclastic flows mainly in the Tar River Valley, with several small pyroclastic flows in White's and Tuitt's Ghaut and one observed in the upper part of Tyre's Ghaut on 20 March. Ash venting continued.
Dome growth continued through the end of the month. Rockfalls and pyroclastic flows spilled off the active summit in a broad arc extending from the S around the E flanks to the NW. Most activity was towards the NE, with pyroclastic flows in the Tar River Valley and small flows on the N flanks of the dome in White's Ghaut, Tuitt's Ghaut, the upper reaches of Tyre's Ghaut and on Farrell's Plain. Most volcano-tectonic earthquakes (see table 44) occurred in a small swarm late in the evening of 25 March. On the same day, following a brief, intense rainstorm, a 4-5 hour period of increased pyroclastic-flow and rockfall activity occurred on the N and NW flanks of the dome. Observation flights on 27-28 March indicated that rockfalls and small pyroclastic flows were spilling onto the S flanks of the dome.
Activity during April 2003. A prominent extrusive lobe was established on the E and SE sides of the summit at the beginning of April and a large vertical spine, extruded at the back of this lobe on the night of 1-2 April, was the highest point on the dome. During 1-12 April, rockfalls and pyroclastic flows occurred mainly on the E side of the dome in the Tar River Valley. Rockfall activity also continued on the S side of the dome and some pyroclastic flows occurred on the NE flanks in White's Ghaut and Tuitt's Ghaut, and on the NW flank; several of the latter flowed into the upper reaches of Tyre's Ghaut. On 10 April torrential rainfall produced mudflows in the Belham River and triggered pyroclastic flows on the E, N, and NW flanks of the dome.
Helicopter observations during 15 April indicated that the lobe extrusion continued on the ESE side of the dome summit above the Tar River Valley. Vigorous gas venting also was observed on the S side of the summit during this flight. Rockfall and pyroclastic-flow activity occurred throughout the week of 12-18 April on the E and SE sides of the dome with some rockfall activity on the N flanks. On 15 April a small pyroclastic flow occurred in the upper part of Tyre's Ghaut.
On 22 April a large spine was observed on the dome summit, positioned slightly S of the center and inclined at a high angle towards the E. The top of the spine was at an elevation of 1,163 m as compared to the ~1,090 m height of the general summit region of the dome. During 19-25 April, most of the rockfall and pyroclastic-flow activity occurred on the E and SE flank of the dome in the Tar River Valley. A few flows occurred to the NE in White's Ghaut and Tuitt's Ghaut, and to the N and NW onto Farrell's Plain and into the top of Tyre's Ghaut. Observations on 22 April indicated that rockfall debris was starting to spill S into the White River area. On 23 April several large rockfalls were observed on the W side of the dome in the Gages area.
During the last week of April, the prominent spine seen on the summit of the dome the previous week had partly disintegrated. Most of the rockfalls and pyroclastic flows into the Tar River Valley began along the face of the well-developed extrusion lobe present on the ESE side of the summit region. Rockfall debris spilled off the S side of the lobe into the upper reaches of White River, and some flows occurred towards the NE in White's Ghaut and Tuitt's Ghaut, and towards the N and NW on the top of Farrell's Plain and in the top of Tyre's Ghaut. Vigorous pulses of ash-venting occurred on the summit throughout this week.
Geologic Background. The complex, dominantly andesitic Soufrière Hills volcano occupies the southern half of the island of Montserrat. The summit area consists primarily of a series of lava domes emplaced along an ESE-trending zone. The volcano is flanked by Pleistocene complexes to the north and south. English's Crater, a 1-km-wide crater breached widely to the east by edifice collapse, was formed about 2000 years ago as a result of the youngest of several collapse events producing submarine debris-avalanche deposits. Block-and-ash flow and surge deposits associated with dome growth predominate in flank deposits, including those from an eruption that likely preceded the 1632 CE settlement of the island, allowing cultivation on recently devegetated land to near the summit. Non-eruptive seismic swarms occurred at 30-year intervals in the 20th century, but no historical eruptions were recorded until 1995. Long-term small-to-moderate ash eruptions beginning in that year were later accompanied by lava-dome growth and pyroclastic flows that forced evacuation of the southern half of the island and ultimately destroyed the capital city of Plymouth, causing major social and economic disruption.
Information Contacts: Montserrat Volcano Observatory (MVO), Mongo Hill, Montserrat, West Indies (URL: http://www.mvo.ms/); Washington Volcanic Ash Advisory Center (VAAC), Satellite Analysis Branch (SAB), NOAA/NESDIS E/SP23, NOAA Science Center Room 401, 5200 Auth Road, Camp Springs, MD 20746, USA (URL: http://www.ssd.noaa.gov/).
Stromboli
Italy
38.789°N, 15.213°E; summit elev. 924 m
All times are local (unless otherwise noted)
Strong explosion on 5 April covers much of the summit in pyroclastic deposits
On the morning of 5 April, scientists from INGV-CT were conducting a daily helicopter flight with a portable thermal camera, surveying the active lava flow field on the upper sector of the Sciara del Fuoco, above a flat zone at the base of the 28 December 2002 eruptive fissure. Three vents along this surface were feeding small lava flows, and the summit craters were producing a very diluted gas cloud. A few minutes after the start of the survey, which began about 0900, the gas plume from the craters being blown W was suddenly crossed by a reddish ash emission, which was interpreted as resulting from further collapses within the craters. However, the red ash was soon replaced by darker juvenile material coming from Crater 1 (the NE crater) that formed a hot jet with a cauliflower shape rapidly growing above the crater. A few seconds later, Crater 3 also produced a hot jet of juvenile material. Data from the seismic network confirmed that the explosion began at 0912.
The eruptive process then evolved very rapidly, with jets from craters 1 and 3 joining together. A very powerful explosion pushed the helicopter away from the crater. A mushroom-shaped dark cloud rose from the craters, expanding vertically to an altitude of ~2 km, 1 km above the volcano's summit (figure 73). The eruptive cloud was surrounded at its base by a dark-gray cloud, while it was still expanding vertically and assuming the mushroom shape. Bombs, ash, and blocks fell on the NE flank above 400 m elevation, burning vegetation. Most of the ejecta drifted W, falling on Ginostra (~1.5 km from the summit) and destroying two houses; no people were injured.
Continuing the helicopter survey after the eruption, observers saw that the lava-flow field on the upper Sciara del Fuoco was completely covered by a brown carpet of debris ejected from Crater 1 during the initial phase of the event. A thick steam cloud rose above the debris due to vaporization from the wet material by the underlying lava flows. Meanwhile, several alternating black and reddish pulses occurred, mainly from Crater 3. Several fingers of light-brown debris were expanding from the NW flank of Crater 1 along the mid-section of the Sciara del Fuoco. The upper part of the volcano above 700 m elevation was completely covered by pyroclastic products. Within a few minutes after the start of the eruption, the upper Sciara del Fuoco had active flows emerging from the layer of debris covering the lava-flow field. The explosive event caused abundant emission of pumice mixed with small brown scoria. The pumice contained small crystals and was very vesiculated. Lithic fragments of lava with light-gray groundmass and centimeter-sized crystals of pyroxene were common in the pumice.
A helicopter survey on 8 April showed four active vents pouring lava onto the upper Sciara del Fuoco at 590 m elevation. Two of the flows were expanding along the middle Sciara del Fuoco, causing detachment of blocks from the flow front and small rockfalls that reached the sea. Within the summit craters a thick layer of debris had accumulated following the event of 5 April.
Geologic Background. Spectacular incandescent nighttime explosions at Stromboli have long attracted visitors to the "Lighthouse of the Mediterranean" in the NE Aeolian Islands. This volcano has lent its name to the frequent mild explosive activity that has characterized its eruptions throughout much of historical time. The small island is the emergent summit of a volcano that grew in two main eruptive cycles, the last of which formed the western portion of the island. The Neostromboli eruptive period took place between about 13,000 and 5,000 years ago. The active summit vents are located at the head of the Sciara del Fuoco, a prominent scarp that formed about 5,000 years ago due to a series of slope failures which extends to below sea level. The modern volcano has been constructed within this scarp, which funnels pyroclastic ejecta and lava flows to the NW. Essentially continuous mild Strombolian explosions, sometimes accompanied by lava flows, have been recorded for more than a millennium.
Information Contacts: Sonia Calvari, Istituto Nazionale di Geofisica e Vulcanologia, Piazza Roma 2, 95123 Catania, Italy (URL: http://www.ct.ingv.it/).
Suwanosejima (Japan) — April 2003 Cite this Report
Suwanosejima
Japan
29.638°N, 129.714°E; summit elev. 796 m
All times are local (unless otherwise noted)
Ash explosions in September and December 2002, and activity in January 2003
Though the volcano had been relatively quiet since 26 August 2002 (BGVN 27:07), the Japan Meteorological Agency reported that explosive eruptions became frequent on the morning of 12 September 2002. Rumbling was heard intermittently at a location ~4 km SSW of the summit, and light ashfall was observed on 12 September. Explosions occurred at 0816, 1246, 1746, and 1754 on 12 September, and at 0853, 1016, and 1027 on 13 September.
A pilot report contained in the Kagoshima Airport weather observation issued at 1000 on 5 December 2002 noted a plume estimated to be between 900 and 1,200 m altitude. The U.S. Air Force Weather Agency noted that the plume was also seen on DMSP (Defense Meteorological Satellite Program) imagery at 1034 and on NASA Terra MODIS imagery at 1055 on 5 December.
The REAL-Volc Project at the Volcano Research Center, Earthquake Research Institute, University of Tokyo, has detected several thermal anomalies on Suwanose-jima since they started an AVHRR monitoring system in 2001. Anomalies were seen on 11 October 2001, 20 November 2001, 30 December 2001, 20 April 2002, and 12 January 2003.
Geologic Background. The 8-km-long island of Suwanosejima in the northern Ryukyu Islands consists of an andesitic stratovolcano with two active summit craters. The summit is truncated by a large breached crater extending to the sea on the E flank that was formed by edifice collapse. One of Japan's most frequently active volcanoes, it was in a state of intermittent Strombolian activity from Otake, the NE summit crater, between 1949 and 1996, after which periods of inactivity lengthened. The largest recorded eruption took place in 1813-14, when thick scoria deposits covered residential areas, and the SW crater produced two lava flows that reached the western coast. At the end of the eruption the summit of Otake collapsed, forming a large debris avalanche and creating an open collapse scarp extending to the eastern coast. The island remained uninhabited for about 70 years after the 1813-1814 eruption. Lava flows reached the eastern coast of the island in 1884. Only about 50 people live on the island.
Information Contacts: Naokuni Uchida, Japan Meteorological Agency (JMA-Fukuoka Center), 1-3-4 Ote-machi, Chiyoda-ku, Tokyo 100, Japan (URL: http://www.jma.go.jp/); Takayuki Kaneko, Volcano Research Center, Earthquake Research Institute, University of Tokyo, Yayoi 1-1-1, Bunkyo-ku, Tokyo 113-0032, Japan (URL: http://www.eri.u-tokyo.ac.jp/VRC/index_E.html); Charles Holliday, U.S. Air Force Weather Agency, 106 Peacekeeper Drive, Ste 2NE, Offut AFB, NE 68113-4039, USA (URL: http://www.557weatherwing.af.mil/).