Recently Published Bulletin Reports
Manam (Papua New Guinea) Few ash plumes during November-December 2022
Krakatau (Indonesia) Strombolian activity and ash plumes during November 2022-April 2023
Stromboli (Italy) Strombolian explosions and lava flows continue during January-April 2023
Nishinoshima (Japan) Small ash plumes and fumarolic activity during November 2022 through April 2023
Karangetang (Indonesia) Lava flows, incandescent avalanches, and ash plumes during January-June 2023
Ahyi (United States) Intermittent hydroacoustic signals and discolored plumes during November 2022-June 2023
Kadovar (Papua New Guinea) An ash plume and weak thermal anomaly during May 2023
San Miguel (El Salvador) Small gas-and-ash explosions during March and May 2023
Semisopochnoi (United States) Occasional explosions, ash deposits, and gas-and-steam plumes during December 2022-May 2023
Ebeko (Russia) Continued explosions, ash plumes, and ashfall during October 2022-May 2023
Home Reef (Tonga) Discolored plumes continued during November 2022-April 2023
Ambae (Vanuatu) New lava flow, ash plumes, and sulfur dioxide plumes during February-May 2023
Manam (Papua New Guinea) — July 2023  Cite this Report
Manam
Papua New Guinea
4.08°S, 145.037°E; summit elev. 1807 m
All times are local (unless otherwise noted)
Few ash plumes during November-December 2022
Manam is a 10-km-wide island that consists of two active summit craters: the Main summit crater and the South summit crater and is located 13 km off the northern coast of mainland Papua New Guinea. Frequent mild-to-moderate eruptions have been recorded since 1616. The current eruption period began during June 2014 and has more recently been characterized by intermittent ash plumes and thermal activity (BGVN 47:11). This report updates activity that occurred from November 2022 through May 2023 based on information from the Darwin Volcanic Ash Advisory Center (VAAC) and various satellite data.
Ash plumes were reported during November and December 2022 by the Darwin VAAC. On 7 November an ash plume rose to 2.1 km altitude and drifted NE based on satellite images and weather models. On 14 November an ash plume rose to 2.1 km altitude and drifted W based on RVO webcam images. On 20 November ash plumes rose to 1.8 km altitude and drifted NW. On 26 December an ash plume rose to 3 km altitude and drifted S and SSE.
Intermittent sulfur dioxide plumes were detected using the TROPOMI instrument on the Sentinel-5P satellite, some of which exceeded at least two Dobson Units (DU) and drifted in different directions (figure 93). Occasional low-to-moderate power thermal anomalies were recorded by the MIROVA (Middle InfraRed Observation of Volcanic Activity) system; less than five anomalies were recorded each month during November 2022 through May 2023 (figure 94). Two thermal hotspots were detected by the MODVOLC thermal alerts system on 10 December 2022. On clear weather days, thermal activity was also captured in infrared satellite imagery in both the Main and South summit craters, accompanied by gas-and-steam emissions (figure 95).
Geologic Background. The 10-km-wide island of Manam, lying 13 km off the northern coast of mainland Papua New Guinea, is one of the country's most active volcanoes. Four large radial valleys extend from the unvegetated summit of the conical basaltic-andesitic stratovolcano to its lower flanks. These valleys channel lava flows and pyroclastic avalanches that have sometimes reached the coast. Five small satellitic centers are located near the island's shoreline on the northern, southern, and western sides. Two summit craters are present; both are active, although most observed eruptions have originated from the southern crater, concentrating eruptive products during much of the past century into the SE valley. Frequent eruptions, typically of mild-to-moderate scale, have been recorded since 1616. Occasional larger eruptions have produced pyroclastic flows and lava flows that reached flat-lying coastal areas and entered the sea, sometimes impacting populated areas.
Information Contacts: Rabaul Volcano Observatory (RVO), Geohazards Management Division, Department of Mineral Policy and Geohazards Management (DMPGM), PO Box 3386, Kokopo, East New Britain Province, Papua New Guinea; Darwin Volcanic Ash Advisory Centre (VAAC), Bureau of Meteorology, Northern Territory Regional Office, PO Box 40050, Casuarina, NT 0811, Australia (URL: http://www.bom.gov.au/info/vaac/); MIROVA (Middle InfraRed Observation of Volcanic Activity), a collaborative project between the Universities of Turin and Florence (Italy) supported by the Centre for Volcanic Risk of the Italian Civil Protection Department (URL: http://www.mirovaweb.it/); Hawai'i Institute of Geophysics and Planetology (HIGP) - MODVOLC Thermal Alerts System, School of Ocean and Earth Science and Technology (SOEST), Univ. of Hawai'i, 2525 Correa Road, Honolulu, HI 96822, USA (URL: http://modis.higp.hawaii.edu/); NASA Global Sulfur Dioxide Monitoring Page, Atmospheric Chemistry and Dynamics Laboratory, NASA Goddard Space Flight Center (NASA/GSFC), 8800 Greenbelt Road, Goddard, Maryland, USA (URL: https://so2.gsfc.nasa.gov/); Copernicus Browser, Copernicus Data Space Ecosystem, European Space Agency (URL: https://dataspace.copernicus.eu/browser/).
Krakatau (Indonesia) — July 2023 Cite this Report
Krakatau
Indonesia
6.1009°S, 105.4233°E; summit elev. 285 m
All times are local (unless otherwise noted)
Strombolian activity and ash plumes during November 2022-April 2023
Krakatau is located in the Sunda Strait between Java and Sumatra, Indonesia. Caldera collapse during the catastrophic 1883 eruption destroyed Danan and Perbuwatan cones and left only a remnant of Rakata. The post-collapse cone of Anak Krakatau (Child of Krakatau) was constructed within the 1883 caldera at a point between the former Danan and Perbuwatan cones; it has been the site of frequent eruptions since 1927. The current eruption period began in May 2021 and has recently consisted of explosions, ash plumes, and thermal activity (BGVN 47:11). This report covers activity during November 2022 through April 2023 based on information provided by the Indonesian Center for Volcanology and Geological Hazard Mitigation, referred to as Pusat Vulkanologi dan Mitigasi Bencana Geologi (PVMBG), MAGMA Indonesia, the Darwin Volcanic Ash Advisory Center (VAAC), and several sources of satellite data.
Activity was relatively low during November and December 2022. Daily white gas-and-steam plumes rose 25-100 m above the summit and drifted in different directions. Gray ash plumes rose 200 m above the summit and drifted NE at 1047 and at 2343 on 11 November. On 14 November at 0933 ash plumes rose 300 m above the summit and drifted E. An ash plume was reported at 0935 on 15 December that rose 100 m above the summit and drifted NE. An eruptive event at 1031 later that day generated an ash plume that rose 700 m above the summit and drifted NE. A gray ash plume at 1910 rose 100 m above the summit and drifted E. Incandescent material was ejected above the vent based on an image taken at 1936.
During January 2023 daily white gas-and-steam plumes rose 25-300 m above the summit and drifted in multiple directions. Gray-to-brown ash plumes were reported at 1638 on 3 January, at 1410 and 1509 on 4 January, and at 0013 on 5 January that rose 100-750 m above the summit and drifted NE and E; the gray-to-black ash plume at 1509 on 4 January rose as high as 3 km above the summit and drifted E. Gray ash plumes were recorded at 1754, 2241, and 2325 on 11 January and at 0046 on 12 January and rose 200-300 m above the summit and drifted NE. Toward the end of January, PVMBG reported that activity had intensified; Strombolian activity was visible in webcam images taken at 0041, 0043, and 0450 on 23 January. Multiple gray ash plumes throughout the day rose 200-500 m above the summit and drifted E and SE (figure 135). Webcam images showed progressively intensifying Strombolian activity at 1919, 1958, and 2113 on 24 January; a gray ash plume at 1957 rose 300 m above the summit and drifted E (figure 135). Eruptive events at 0231 and 2256 on 25 January and at 0003 on 26 January ejected incandescent material from the vent, based on webcam images. Gray ash plumes observed during 26-27 January rose 300-500 m above the summit and drifted NE, E, and SE.
Low levels of activity were reported during February and March. Daily white gas-and-steam plumes rose 25-300 m above the summit and drifted in different directions. The Darwin VAAC reported that continuous ash emissions rose to 1.5-1.8 km altitude and drifted W and NW during 1240-1300 on 10 March, based on satellite images, weather models, and PVMBG webcams. White-and-gray ash plumes rose 500 m and 300 m above the summit and drifted SW at 1446 and 1846 on 18 March, respectively. An eruptive event was recorded at 2143, though it was not visible due to darkness. Multiple ash plumes were reported during 27-29 March that rose as high as 2.5 km above the summit and drifted NE, W, and SW (figure 136). Webcam images captured incandescent ejecta above the vent at 0415 and around the summit area at 2003 on 28 March and at 0047 above the vent on 29 March.
Daily white gas-and-steam plumes rose 25-300 m above the summit and drifted in multiple directions during April and May. White-and-gray and black plumes rose 50-300 m above the summit on 2 and 9 April. On 11 May at 1241 a gray ash plume rose 1-3 km above the summit and drifted SW. On 12 May at 0920 a gray ash plume rose 2.5 km above the summit and drifted SW and at 2320 an ash plume rose 1.5 km above the summit and drifted SW. An accompanying webcam image showed incandescent ejecta. On 13 May at 0710 a gray ash plume rose 2 km above the summit and drifted SW (figure 137).
The MIROVA (Middle InfraRed Observation of Volcanic Activity) graph of MODIS thermal anomaly data showed intermittent low-to-moderate power thermal anomalies during November 2022 through April 2023 (figure 138). Some of this thermal activity was also visible in infrared satellite imagery at the crater, accompanied by gas-and-steam and ash plumes that drifted in different directions (figure 139).
Geologic Background. The renowned Krakatau (frequently mis-named as Krakatoa) volcano lies in the Sunda Strait between Java and Sumatra. Collapse of an older edifice, perhaps in 416 or 535 CE, formed a 7-km-wide caldera. Remnants of that volcano are preserved in Verlaten and Lang Islands; subsequently the Rakata, Danan, and Perbuwatan cones were formed, coalescing to create the pre-1883 Krakatau Island. Caldera collapse during the catastrophic 1883 eruption destroyed Danan and Perbuwatan, and left only a remnant of Rakata. This eruption caused more than 36,000 fatalities, most as a result of tsunamis that swept the adjacent coastlines of Sumatra and Java. Pyroclastic surges traveled 40 km across the Sunda Strait and reached the Sumatra coast. After a quiescence of less than a half century, the post-collapse cone of Anak Krakatau (Child of Krakatau) was constructed within the 1883 caldera at a point between the former Danan and Perbuwatan cones. Anak Krakatau has been the site of frequent eruptions since 1927.
Information Contacts: Pusat Vulkanologi dan Mitigasi Bencana Geologi (PVMBG, also known as Indonesian Center for Volcanology and Geological Hazard Mitigation, CVGHM), Jalan Diponegoro 57, Bandung 40122, Indonesia (URL: http://www.vsi.esdm.go.id/); MAGMA Indonesia, Kementerian Energi dan Sumber Daya Mineral (URL: https://magma.esdm.go.id/v1); Darwin Volcanic Ash Advisory Centre (VAAC), Bureau of Meteorology, Northern Territory Regional Office, PO Box 40050, Casuarina, NT 0811, Australia (URL: http://www.bom.gov.au/info/vaac/); MIROVA (Middle InfraRed Observation of Volcanic Activity), a collaborative project between the Universities of Turin and Florence (Italy) supported by the Centre for Volcanic Risk of the Italian Civil Protection Department (URL: http://www.mirovaweb.it/); Copernicus Browser, Copernicus Data Space Ecosystem, European Space Agency (URL: https://dataspace.copernicus.eu/browser/).
Stromboli
Italy
38.789°N, 15.213°E; summit elev. 924 m
All times are local (unless otherwise noted)
Strombolian explosions and lava flows continue during January-April 2023
Stromboli, located in Italy, has exhibited nearly constant lava fountains for the past 2,000 years; recorded eruptions date back to 350 BCE. Eruptive activity occurs at the summit from multiple vents, which include a north crater area (N area) and a central-southern crater (CS area) on a terrace known as the ‘terrazza craterica’ at the head of the Sciara del Fuoco, a large scarp that runs from the summit down the NW side of the volcano-island. Activity typically consists of Strombolian explosions, incandescent ejecta, lava flows, and pyroclastic flows. Thermal and visual monitoring cameras are located on the nearby Pizzo Sopra La Fossa, above the terrazza craterica, and at multiple flank locations. The current eruption period has been ongoing since 1934 and recent activity has consisted of frequent Strombolian explosions and lava flows (BGVN 48:02). This report updates activity during January through April 2023 primarily characterized by Strombolian explosions and lava flows based on reports from Italy's Istituto Nazionale di Geofisica e Vulcanologia (INGV) and various satellite data.
Frequent explosive activity continued throughout the reporting period, generally in the low-to-medium range, based on the number of hourly explosions in the summit crater (figure 253, table 16). Intermittent thermal activity was recorded by the MIROVA (Middle InfraRed Observation of Volcanic Activity) analysis of MODIS satellite data (figure 254). According to data collected by the MODVOLC thermal algorithm, a total of 9 thermal alerts were detected: one on 2 January 2023, one on 1 February, five on 24 March, and two on 26 March. The stronger pulses of thermal activity likely reflected lava flow events. Infrared satellite imagery captured relatively strong thermal hotspots at the two active summit craters on clear weather days, showing an especially strong event on 8 March (figure 255).
Table 16. Summary of type, frequency, and intensity of explosive activity at Stromboli by month during January-April 2023; information from webcam observations. Courtesy of INGV weekly reports.
| Month |
Explosive Activity |
| Jan 2023 |
Typical Strombolian activity with spattering and lava overflows in the N crater area. Explosions were reported from 4 vents in the N area and 1-2 vents in the CS area. The average hourly frequency of explosions was low-to-medium (1-12 events/hour). The intensity of the explosions varied from low (less than 80 m high) to medium (less than 150 m high) in the N crater area and up to high (greater than 150 m high) in the CS crater area. |
| Feb 2023 |
Typical Strombolian activity with spattering in the N crater area. Explosions were reported from 2-3 vents in the N area and 1-4 vents in the CS area. The average hourly frequency of explosions was low-to-medium (1-14 events/hour). The intensity of the explosions varied from low (less than 80 m high) to medium (less than 150 m high) in the N crater area and up to high (greater than 150 m high) in the CS crater area. |
| Mar 2023 |
Typical Strombolian activity with spattering and lava overflows in the N crater area. Explosions were reported from 2-3 vents in the N area and 2-4 vents in the CS area. The average hourly frequency of explosions was low-to-medium (1-18 events/hour). The intensity of the explosions varied from low (less than 80 m high) to medium (less than 150 m high) in the N crater area and up to high (greater than 150 m high) in the CS crater area. |
| Apr 2023 |
Typical Strombolian activity. Explosions were reported from 2 vents in the N area and 2-3 vents in the CS area. The average hourly frequency of explosions was low-to-high (1-16 events/hour). The intensity of the explosions varied from low (less than 80 m high) to medium (less than 150 m high) in both the N and CS crater areas. |
Activity during January-February 2023. Strombolian explosions were reported in the N crater area, as well as lava effusion. Explosive activity in the N crater area ejected coarse material (bombs and lapilli). Intense spattering was observed in both the N1 and N2 craters. In the CS crater area, explosions generally ejected fine material (ash), sometimes to heights greater than 250 m. The intensity of the explosions was characterized as low-to-medium in the N crater and medium-to-high in the CS crater. After intense spattering activity from the N crater area, a lava overflow began at 2136 on 2 January that flowed part way down the Sciara del Fuoco, possibly moving down the drainage that formed in October, out of view from webcams. The flow remained active for a couple of hours before stopping and beginning to cool. A second lava flow was reported at 0224 on 4 January that similarly remained active for a few hours before stopping and cooling. Intense spattering was observed on 11 and 13 January from the N1 crater. After intense spattering activity at the N2 crater at 1052 on 17 January another lava flow started to flow into the upper part of the Sciara del Fuoco (figure 256), dividing into two: one that traveled in the direction of the drainage formed in October, and the other one moving parallel to the point of emission. By the afternoon, the rate of the flow began to decrease, and at 1900 it started to cool. A lava flow was reported at 1519 on 24 January following intense spattering in the N2 area, which began to flow into the upper part of the Sciara del Fuoco. By the morning of 25 January, the lava flow had begun to cool. During 27 January the frequency of eruption in the CS crater area increased to 6-7 events/hour compared to the typical 1-7 events/hour; the following two days showed a decrease in frequency to less than 1 event/hour. Starting at 1007 on 30 January a high-energy explosive sequence was produced by vents in the CS crater area. The sequence began with an initial energetic pulse that lasted 45 seconds, ejecting predominantly coarse products 300 m above the crater that fell in an ESE direction. Subsequent and less intense explosions ejected material 100 m above the crater. The total duration of this event lasted approximately two minutes. During 31 January through 6, 13, and 24 February spattering activity was particularly intense for short periods in the N2 crater.
An explosive sequence was reported on 16 February that was characterized by a major explosion in the CS crater area (figure 257). The sequence began at 1817 near the S2 crater that ejected material radially. A few seconds later, lava fountains were observed in the central part of the crater. Three explosions of medium intensity (material was ejected less than 150 m high) were recorded at the S2 crater. The first part of this sequence lasted approximately one minute, according to INGV, and material rose 300 m above the crater and then was deposited along the Sciara del Fuoco. The second phase began at 1818 at the S1 crater; it lasted seven seconds and material was ejected 150 m above the crater. Another event 20 seconds later lasted 12 seconds, also ejecting material 150 m above the crater. The sequence ended with at least three explosions of mostly fine material from the S1 crater. The total duration of this sequence was about two minutes.
Short, intense spattering activity was noted above the N1 crater on 27 and 28 February. A lava overflow was first reported at 0657 from the N2 crater on 27 February that flowed into the October 2022 drainage. By 1900 the flow had stopped. A second lava overflow also in the N crater area occurred at 2149, which overlapped the first flow and then stopped by 0150 on 28 February. Material detached from both the lava overflows rolled down the Sciara del Fuoco, some of which was visible in webcam images.
Activity during March-April 2023. Strombolian activity continued with spattering activity and lava overflows in the N crater area during March. Explosive activity at the N crater area varied from low (less than 80 m high) to medium (less than 150 m high) and ejected coarse material, such as bombs and lapilli. Spattering was observed above the N1 crater, while explosive activity at the CS crater area varied from medium to high (greater than 150 m high) and ejected coarse material. Intense spattering activity was observed for short periods on 6 March above the N1 crater. At approximately 0610 a lava overflow was reported around the N2 crater on 8 March, which then flowed into the October 2022 drainage. By 1700 the flow started to cool. A second overflow began at 1712 on 9 March and overlapped the previous flow. It had stopped by 2100. Material from both flows was deposited along the Sciara del Fuoco, though much of the activity was not visible in webcam images. On 11 March a lava overflow was observed at 0215 that overlapped the two previous flows in the October 2022 drainage. By late afternoon on 12 March, it had stopped.
During a field excursion on 16 March, scientists noted that a vent in the central crater area was degassing. Another vent showed occasional Strombolian activity that emitted ash and lapilli. During 1200-1430 low-to-medium intense activity was reported; the N1 crater emitted ash emissions and the N2 crater emitted both ash and coarse material. Some explosions also occurred in the CS crater area that ejected coarse material. The C crater in the CS crater area occasionally showed gas jetting and low intensity explosions on 17 and 22 March; no activity was observed at the S1 crater. Intense, longer periods of spattering were reported in the N1 crater on 19, 24, and 25 March. Around 2242 on 23 March a lava overflow began from the N1 crater that, after about an hour, began moving down the October 2022 drainage and flow along the Sciara del Fuoco (figure 258). Between 0200 and 0400 on 26 March the flow rate increased, which generated avalanches of material from collapses at the advancing flow front. By early afternoon, the flow began to cool. On 25 March at 1548 an explosive sequence began from one of the vents at S2 in the CS crater area (figure 258). Fine ash mixed with coarse material was ejected 300 m above the crater rim and drifted SSE. Some modest explosions around Vent C were detected at 1549 on 25 March, which included an explosion at 1551 that ejected coarse material. The entire explosive sequence lasted approximately three minutes.
During April explosions persisted in both the N and CS crater areas. Fine material was ejected less than 80 m above the N crater rim until 6 April, followed by ejection of coarser material. Fine material was also ejected less than 80 m above the CS crater rim. The C and S2 crater did not show significant eruptive activity. On 7 April an explosive sequence was detected in the CS crater area at 1203 (figure 259). The first explosion lasted approximately 18 seconds and ejected material 400 m above the crater rim, depositing pyroclastic material in the upper part of the Sciara del Fuoco. At 1204 a second, less intense explosion lasted approximately four seconds and deposited pyroclastic products outside the crater area and near Pizzo Sopra La Fossa. A third explosion at 1205 was mainly composed of ash that rose about 150 m above the crater and lasted roughly 20 seconds. A fourth explosion occurred at 1205 about 28 seconds after the third explosion and ejected a mixture of coarse and fine material about 200 m above the crater; the explosion lasted roughly seven seconds. Overall, the entire explosive sequence lasted about two minutes and 20 seconds. After the explosive sequence on 7 April, explosions in both the N and CS crater areas ejected material as high as 150 m above the crater.
On 21 April research scientists from INGV made field observations in the summit area of Stromboli, and some lapilli samples were collected. In the N crater area near the N1 crater, a small cone was observed with at least two active vents, one of which was characterized by Strombolian explosions. The other vent produced explosions that ejected ash and chunks of cooled lava. At the N2 crater at least one vent was active and frequently emitted ash. In the CS crater area, a small cone contained 2-3 degassing vents and a smaller, possible fissure area also showed signs of degassing close to the Pizzo Sopra La Fossa. In the S part of the crater, three vents were active: a small hornito was characterized by modest and rare explosions, a vent that intermittently produced weak Strombolian explosions, and a vent at the end of the terrace that produced frequent ash emissions. Near the S1 crater there was a hornito that generally emitted weak gas-and-steam emissions, sometimes associated with “gas rings”. On 22 April another field inspection was carried out that reported two large sliding surfaces on the Sciara del Fuoco that showed where blocks frequently descended toward the sea. A thermal anomaly was detected at 0150 on 29 April.
Geologic Background. Spectacular incandescent nighttime explosions at Stromboli have long attracted visitors to the "Lighthouse of the Mediterranean" in the NE Aeolian Islands. This volcano has lent its name to the frequent mild explosive activity that has characterized its eruptions throughout much of historical time. The small island is the emergent summit of a volcano that grew in two main eruptive cycles, the last of which formed the western portion of the island. The Neostromboli eruptive period took place between about 13,000 and 5,000 years ago. The active summit vents are located at the head of the Sciara del Fuoco, a prominent scarp that formed about 5,000 years ago due to a series of slope failures which extends to below sea level. The modern volcano has been constructed within this scarp, which funnels pyroclastic ejecta and lava flows to the NW. Essentially continuous mild Strombolian explosions, sometimes accompanied by lava flows, have been recorded for more than a millennium.
Information Contacts: Istituto Nazionale di Geofisica e Vulcanologia (INGV), Sezione di Catania, Piazza Roma 2, 95123 Catania, Italy, (URL: http://www.ct.ingv.it/en/); MIROVA (Middle InfraRed Observation of Volcanic Activity), a collaborative project between the Universities of Turin and Florence (Italy) supported by the Centre for Volcanic Risk of the Italian Civil Protection Department (URL: http://www.mirovaweb.it/); Hawai'i Institute of Geophysics and Planetology (HIGP) - MODVOLC Thermal Alerts System, School of Ocean and Earth Science and Technology (SOEST), Univ. of Hawai'i, 2525 Correa Road, Honolulu, HI 96822, USA (URL: http://modis.higp.hawaii.edu/); Copernicus Browser, Copernicus Data Space Ecosystem, European Space Agency (URL: https://dataspace.copernicus.eu/browser/).
Nishinoshima (Japan) — July 2023 Cite this Report
Nishinoshima
Japan
27.247°N, 140.874°E; summit elev. 100 m
All times are local (unless otherwise noted)
Small ash plumes and fumarolic activity during November 2022 through April 2023
Nishinoshima is a small island located about 1,000 km S of Tokyo in the Ogasawara Arc in Japan. The island is the summit of a massive submarine volcano that has prominent peaks to the S, W, and NE. Eruptions date back to 1973; the most recent eruption period began in October 2022 and was characterized by ash plumes and fumarolic activity (BGVN 47:12). This report describes ash plumes and fumarolic activity during November 2022 through April 2023 based on monthly reports from the Japan Meteorological Agency (JMA) monthly reports and satellite data.
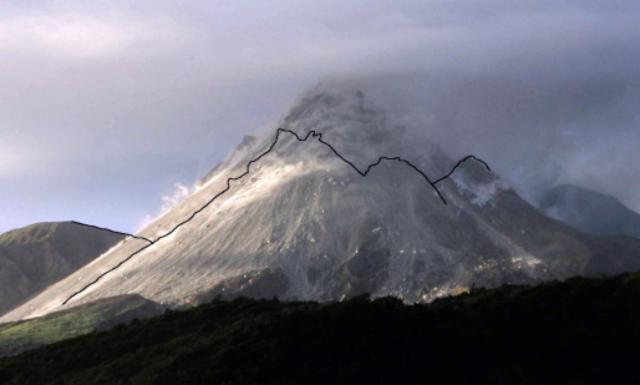
The most recent eruptive activity prior to the reporting internal occurred on 12 October 2022, when an ash plume rose 3.5 km above the crater rim. An aerial observation conducted by the Japan Coast Guard (JCG) on 25 November reported that white fumaroles rose approximately 200 m above the central crater of a pyroclastic cone (figure 119), and multiple plumes were observed on the ESE flank of the cone. Discolored water ranging from reddish-brown to brown and yellowish-green were visible around the perimeter of the island (figure 119). No significant activity was reported in December.
During an overflight conducted by JCG on 25 January 2023 intermittent activity and small, blackish-gray plumes rose 900 m above the central part of the crater were observed (figure 120). The fumarolic zone of the E flank and base of the cone had expanded and emissions had intensified. Dark brown discolored water was visible around the perimeter of the island.
No significant activity was reported during February through March. Ash plumes at 1050 and 1420 on 11 April rose 1.9 km above the crater rim and drifted NW and N. These were the first ash plumes observed since 12 October 2022. On 14 April JCG carried out an overflight and reported that no further eruptive activity was visible, although white gas-and-steam plumes were visible from the central crater and rose 900 m high (figure 121). Brownish and yellow-green discolored water surrounded the island.
Intermittent low-to-moderate power thermal anomalies were recorded in the MIROVA graph (Middle InfraRed Observation of Volcanic Activity) during November 2022 through April 2023 (figure 123). A cluster of six to eight anomalies were detected during November while a smaller number were detected during the following months: two to three during December, one during mid-January 2023, one during February, five during March, and two during April. Thermal activity was also reflected in infrared satellite data at the summit crater, accompanied by occasional gas-and-steam plumes (figure 124).
Geologic Background. The small island of Nishinoshima was enlarged when several new islands coalesced during an eruption in 1973-74. Multiple eruptions that began in 2013 completely covered the previous exposed surface and continued to enlarge the island. The island is the summit of a massive submarine volcano that has prominent peaks to the S, W, and NE. The summit of the southern cone rises to within 214 m of the ocean surface 9 km SSE.
Information Contacts: Japan Meteorological Agency (JMA), 1-3-4 Otemachi, Chiyoda-ku, Tokyo 100-8122, Japan (URL: http://www.jma.go.jp/jma/indexe.html); MIROVA (Middle InfraRed Observation of Volcanic Activity), a collaborative project between the Universities of Turin and Florence (Italy) supported by the Centre for Volcanic Risk of the Italian Civil Protection Department (URL: http://www.mirovaweb.it/); Copernicus Browser, Copernicus Data Space Ecosystem, European Space Agency (URL: https://dataspace.copernicus.eu/browser/).
Karangetang (Indonesia) — July 2023 Cite this Report
Karangetang
Indonesia
2.781°N, 125.407°E; summit elev. 1797 m
All times are local (unless otherwise noted)
Lava flows, incandescent avalanches, and ash plumes during January-June 2023
Karangetang (also known as Api Siau), at the northern end of the island of Siau, Indonesia, contains five summit craters along a N-S line. More than 40 eruptions have been recorded since 1675; recent eruptions have included frequent explosive activity, sometimes accompanied by pyroclastic flows and lahars. Lava dome growth has occurred in the summit craters and collapses of lava flow fronts have produced pyroclastic flows. The two active summit craters are Kawah Dua (the N crater) and Kawah Utama (the S crater, also referred to as the “Main Crater”). The most recent eruption began in late November 2018 and has more recently consisted of weak thermal activity and gas-and-steam emissions (BGVN 48:01). This report updates activity characterized by lava flows, incandescent avalanches, and ash plumes during January through June 2023 using reports from Pusat Vulkanologi dan Mitigasi Bencana Geologi (PVMBG, also known as CVGHM, or the Center of Volcanology and Geological Hazard Mitigation), MAGMA Indonesia, the Darwin VAAC (Volcano Ash Advisory Center), and satellite data.
Activity during January was relatively low and mainly consisted of white gas-and-steam emissions that rose 25-150 m above Main Crater (S crater) and drifted in different directions. Incandescence was visible from the lava dome in Kawah Dua (the N crater). Weather conditions often prevented clear views of the summit. On 18 January the number of seismic signals that indicated avalanches of material began to increase. In addition, there were a total of 71 earthquakes detected during the month.
Activity continued to increase during the first week of February. Material from Main Crater traveled as far as 800 m down the Batuawang (S) and Batang (W) drainages and as far as 1 km W down the Beha (W) drainage on 4 February. On 6 February 43 earthquake events were recorded, and on 7 February, 62 events were recorded. White gas-and-steam emissions rose 25-250 m above both summit craters throughout the month. PVMBG reported an eruption began during the evening of 8 February around 1700. Photos showed incandescent material at Main Crater. Incandescent material had also descended the flank in at least two unconfirmed directions as far as 2 km from Main Crater, accompanied by ash plumes (figure 60). As a result, PVMBG increased the Volcano Alert Level (VAL) to 3 (the second highest level on a 1-4 scale).
Occasional nighttime webcam images showed three main incandescent lava flows of differing lengths traveling down the S, SW, and W flanks (figure 61). Incandescent rocks were visible on the upper flanks, possibly from ejected or collapsed material from the crater, and incandescence was the most intense at the summit. Based on analyses of satellite imagery and weather models, the Darwin VAAC reported that daily ash plumes during 16-20 February rose to 2.1-3 km altitude and drifted NNE, E, and SE. BNPB reported on 16 February that as many as 77 people were evacuated and relocated to the East Siau Museum. A webcam image taken at 2156 on 17 February possibly showed incandescent material descending the SE flank. Ash plumes rose to 2.1 km altitude and drifted SE during 22-23 February, according to the Darwin VAAC.
Incandescent avalanches of material and summit incandescence at Main Crater continued during March. White gas-and-steam emissions during March generally rose 25-150 m above the summit crater; on 31 March gas-and-steam emissions rose 200-400 m high. An ash plume rose to 2.4 km altitude and drifted S at 1710 on 9 March and a large thermal anomaly was visible in images taken at 0550 and 0930 on 10 March. Incandescent material was visible at the summit and on the flanks based on webcam images taken at 0007 and 2345 on 16 March, at 1828 on 17 March, at 1940 on 18 March, at 2311 on 19 March, and at 2351 on 20 March. Incandescence was most intense on 18 and 20 March and webcam images showed possible Strombolian explosions (figure 62). An ash plume rose to 2.4 km altitude and drifted SW on 18 March, accompanied by a thermal anomaly.
Summit crater incandescence at Main Crater and on the flanks persisted during April. Incandescent material at the S crater and on the flanks was reported at 0016 on 1 April. The lava flows had stopped by 1 April according to PVMBG, although incandescence was still visible up to 10 m high. Seismic signals indicating effusion decreased and by 6 April they were no longer detected. Incandescence was visible from both summit craters. On 26 April the VAL was lowered to 2 (the second lowest level on a 1-4 scale). White gas-and-steam emissions rose 25-200 m above the summit crater.
During May white gas-and-steam emissions generally rose 50-250 m above the summit, though it was often cloudy, which prevented clear views; on 21 May gas-and-steam emissions rose 50-400 m high. Nighttime N summit crater incandescence rose 10-25 m above the lava dome, and less intense incandescence was noted above Main Crater, which reached about 10 m above the dome. Sounds of falling rocks at Main Crater were heard on 15 May and the seismic network recorded 32 rockfall events in the crater on 17 May. Avalanches traveled as far as 1.5 km down the SW and S flanks, accompanied by rumbling sounds on 18 May. Incandescent material descending the flanks was captured in a webcam image at 2025 on 19 May (figure 63) and on 29 May; summit crater incandescence was observed in webcam images at 2332 on 26 May and at 2304 on 29 May. On 19 May the VAL was again raised to 3.
Occasional Main Crater incandescence was reported during June, as well as incandescent material on the flanks. White gas-and-steam emissions rose 10-200 m above the summit crater. Ash plumes rose to 2.1 km altitude and drifted SE and E during 2-4 June, according to the Darwin VAAC. Material on the flanks of Main Crater were observed at 2225 on 7 June, at 2051 on 9 June, at 0007 on 17 June, and at 0440 on 18 June. Webcam images taken on 21, 25, and 27 June showed incandescence at Main Crater and from material on the flanks.
MIROVA (Middle InfraRed Observation of Volcanic Activity) analysis of MODIS satellite data showed strong thermal activity during mid-February through March and mid-May through June, which represented incandescent avalanches and lava flows (figure 64). During April through mid-May the power of the anomalies decreased but frequent anomalies were still detected. Brief gaps in activity occurred during late March through early April and during mid-June. Infrared satellite images showed strong lava flows mainly affecting the SW and S flanks, accompanied by gas-and-steam emissions (figure 65). According to data recorded by the MODVOLC thermal algorithm, there were a total of 79 thermal hotspots detected: 28 during February, 24 during March, one during April, five during May, and 21 during June.
Geologic Background. Karangetang (Api Siau) volcano lies at the northern end of the island of Siau, about 125 km NNE of the NE-most point of Sulawesi. The stratovolcano contains five summit craters along a N-S line. It is one of Indonesia's most active volcanoes, with more than 40 eruptions recorded since 1675 and many additional small eruptions that were not documented (Neumann van Padang, 1951). Twentieth-century eruptions have included frequent explosive activity sometimes accompanied by pyroclastic flows and lahars. Lava dome growth has occurred in the summit craters; collapse of lava flow fronts have produced pyroclastic flows.
Information Contacts: Pusat Vulkanologi dan Mitigasi Bencana Geologi (PVMBG, also known as Indonesian Center for Volcanology and Geological Hazard Mitigation, CVGHM), Jalan Diponegoro 57, Bandung 40122, Indonesia (URL: http://www.vsi.esdm.go.id/); MAGMA Indonesia, Kementerian Energi dan Sumber Daya Mineral (URL: https://magma.esdm.go.id/v1); Badan Nasional Penanggulangan Bencana (BNPB), National Disaster Management Agency, Graha BNPB - Jl. Scout Kav.38, East Jakarta 13120, Indonesia (URL: http://www.bnpb.go.id/); Darwin Volcanic Ash Advisory Centre (VAAC), Bureau of Meteorology, Northern Territory Regional Office, PO Box 40050, Casuarina, NT 0811, Australia (URL: http://www.bom.gov.au/info/vaac/); MIROVA (Middle InfraRed Observation of Volcanic Activity), a collaborative project between the Universities of Turin and Florence (Italy) supported by the Centre for Volcanic Risk of the Italian Civil Protection Department (URL: http://www.mirovaweb.it/); Hawai'i Institute of Geophysics and Planetology (HIGP) - MODVOLC Thermal Alerts System, School of Ocean and Earth Science and Technology (SOEST), Univ. of Hawai'i, 2525 Correa Road, Honolulu, HI 96822, USA (URL: http://modis.higp.hawaii.edu/); Copernicus Browser, Copernicus Data Space Ecosystem, European Space Agency (URL: https://dataspace.copernicus.eu/browser/); IDN Times, Jl. Jend. Gatot Subroto Kav. 27 3rd Floor Kuningan, Jakarta, Indonesia 12950, Status of Karangetang Volcano in Sitaro Islands Increases (URL: https://sulsel.idntimes.com/news/indonesia/savi/status-gunung-api-karangetang-di-kepulauan-sitaro-meningkat?page=all).
Ahyi (United States) — July 2023 Cite this Report
Ahyi
United States
20.42°N, 145.03°E; summit elev. -75 m
All times are local (unless otherwise noted)
Intermittent hydroacoustic signals and discolored plumes during November 2022-June 2023
Ahyi seamount is a large, conical submarine volcano that rises to within 75 m of the ocean surface about 18 km SE of the island of Farallon de Pajaros in the Northern Marianas. The remote location of the seamount has made eruptions difficult to document, but seismic stations installed in the region confirmed an eruption in the vicinity in 2001. No new activity was detected until April-May 2014 when an eruption was detected by NOAA (National Oceanic and Atmospheric Administration) divers, hydroacoustic sensors, and seismic stations (BGVN 42:04). New activity was first detected on 15 November by hydroacoustic sensors that were consistent with submarine volcanic activity. This report covers activity during November 2022 through June 2023 based on daily and weekly reports from the US Geological Survey.
Starting in mid-October, hydroacoustic sensors at Wake Island (2.2 km E) recorded signals consistent with submarine volcanic activity, according to a report from the USGS issued on 15 November 2022. A combined analysis of the hydroacoustic signals and seismic stations located at Guam and Chichijima Island, Japan, suggested that the source of this activity was at or near the Ahyi seamount. After a re-analysis of a satellite image of the area that was captured on 6 November, USGS confirmed that there was no evidence of discoloration at the ocean surface. Few hydroacoustic and seismic signals continued through November, including on 18 November, which USGS suggested signified a decline or pause in unrest. A VONA (Volcano Observatory Notice for Aviation) reported that a discolored water plume was persistently visible in satellite data starting on 18 November (figure 6). Though clouds often obscured clear views of the volcano, another discolored water plume was captured in a satellite image on 26 November. The Aviation Color Code (ACC) was raised to Yellow (the second lowest level on a four-color scale) and the Volcano Alert Level (VAL) was raised to Advisory (the second lowest level on a four-level scale) on 29 November.
During December, occasional detections were recorded on the Wake Island hydrophone sensors and discolored water over the seamount remained visible. During 2-7, 10-12, and 16-31 December possible explosion signals were detected. A small area of discolored water was observed in high-resolution Sentinel-2 satellite images during 1-6 December (figure 7). High-resolution satellite images recorded discolored water plumes on 13 December that originated from the summit region; no observations indicated that activity breached the ocean surface. A possible underwater plume was visible in satellite images on 18 December, and during 19-20 December a definite but diffuse underwater plume located SSE from the main vent was reported. An underwater plume was visible in a satellite image taken on 26 December (figure 7).
Hydrophone sensors continued to detect signals consistent with possible explosions during 1-8 January 2023. USGS reported that the number of detections decreased during 4-5 January. The hydrophone sensors experienced a data outage that started at 0118 on 8 January and continued through 10 January, though according to USGS, possible explosions were recorded prior to the data outage and likely continued during the outage. A discolored water plume originating from the summit region was detected in a partly cloudy satellite image on 8 January. On 11-12 and 15-17 January possible explosion signals were recorded again. One small signal was detected during 22-23 January and several signals were recorded on 25 and 31 January. During 27-31 January a plume of discolored water was observed above the seamount in satellite imagery (figure 8).
Low levels of activity continued during February and March, based on data from pressure sensors on Wake Island. During 1 and 4-6 February activity was reported, and a submarine plume was observed on 4 February (figure 8). Possible explosion signals were detected during 7-8, 10, 13-14, and 24 February. During 1-2 and 3-5 March a plume of discolored water was observed in satellite imagery (figure 8). Almost continuous hydroacoustic signals were detected in remote pressure sensor data on Wake Island 2,270 km E from the volcano during 7-13 March. During 12-13 March water discoloration around the seamount was observed in satellite imagery, despite cloudy weather. By 14 March discolored water extended about 35 km, but no direction was noted. USGS reported that the continuous hydroacoustic signals detected during 13-14 March stopped abruptly on 14 March and no new detections were observed. Three 30 second hydroacoustic detections were reported during 17-19 March, but no activity was visible due to cloudy weather. A data outage was reported during 21-22 March, making pressure sensor data unavailable; a discolored water plume was, however, visible in satellite data. A possible underwater explosion signal was detected by pressure sensors at Wake Island on 26, 29, and 31 March, though the cause and origin of these events were unclear.
Similar low activity continued during April, May, and June. Several signals were detected during 1-3 April in pressure sensors at Wake Island. USGS suggested that these may be related to underwater explosions or earthquakes at the volcano, but no underwater plumes were visible in clear satellite images. The pressure sensors had data outages during 12-13 April and no data were recorded; no underwater plumes were visible in satellite images, although cloudy weather obscured most clear views. Eruptive activity was reported starting at 2210 on 21 May. On 22 May a discolored water plume that extended 4 km was visible in satellite images, though no direction was recorded. During 23-24 May some signals were detected by the underwater pressure sensors. Possible hydroacoustic signals were detected during 2-3 and 6-8 June. Multiple hydroacoustic signals were detected during 9-11 and 16-17 June, although no activity was visible in satellite images. One hydroacoustic signal was detected during 23-24 June, but there was some uncertainty about its association with volcanic activity. A single possible hydroacoustic signal was detected during 30 June to 1 July.
Geologic Background. Ahyi seamount is a large conical submarine volcano that rises to within 75 m of the ocean surface ~18 km SE of the island of Farallon de Pajaros in the northern Marianas. Water discoloration has been observed there, and in 1979 the crew of a fishing boat felt shocks over the summit area, followed by upwelling of sulfur-bearing water. On 24-25 April 2001 an explosive eruption was detected seismically by a station on Rangiroa Atoll, Tuamotu Archipelago. The event was well constrained (+/- 15 km) at a location near the southern base of Ahyi. An eruption in April-May 2014 was detected by NOAA divers, hydroacoustic sensors, and seismic stations.
Information Contacts: US Geological Survey, Volcano Hazards Program (USGS-VHP), 12201 Sunrise Valley Drive, Reston, VA, USA, https://volcanoes.usgs.gov/index.html; Copernicus Browser, Copernicus Data Space Ecosystem, European Space Agency (URL: https://dataspace.copernicus.eu/browser/).
Kadovar (Papua New Guinea) — June 2023 Cite this Report
Kadovar
Papua New Guinea
3.608°S, 144.588°E; summit elev. 365 m
All times are local (unless otherwise noted)
An ash plume and weak thermal anomaly during May 2023
Kadovar is a 2-km-wide island that is the emergent summit of a Bismarck Sea stratovolcano. It lies off the coast of New Guinea, about 25 km N of the mouth of the Sepik River. Prior to an eruption that began in 2018, a lava dome formed the high point of the volcano, filling an arcuate landslide scarp open to the S. Submarine debris-avalanche deposits occur to the S of the island. The current eruption began in January 2018 and has comprised lava effusion from vents at the summit and at the E coast; more recent activity has consisted of ash plumes, weak thermal activity, and gas-and-steam plumes (BGVN 48:02). This report covers activity during February through May 2023 using information from the Darwin Volcanic Ash Advisory Center (VAAC) and satellite data.
Activity during the reporting period was relatively low and mainly consisted of white gas-and-steam plumes that were visible in natural color satellite images on clear weather days (figure 67). According to a Darwin VAAC report, at 2040 on 6 May an ash plume rose to 4.6 km altitude and drifted W; by 2300 the plume had dissipated. MODIS satellite instruments using the MODVOLC thermal algorithm detected a single thermal hotspot on the SE side of the island on 7 May. Weak thermal activity was also detected in a satellite image on the E side of the island on 14 May, accompanied by a white gas-and-steam plume that drifted SE (figure 68).
Geologic Background. The 2-km-wide island of Kadovar is the emergent summit of a Bismarck Sea stratovolcano of Holocene age. It is part of the Schouten Islands, and lies off the coast of New Guinea, about 25 km N of the mouth of the Sepik River. Prior to an eruption that began in 2018, a lava dome formed the high point of the andesitic volcano, filling an arcuate landslide scarp open to the south; submarine debris-avalanche deposits occur in that direction. Thick lava flows with columnar jointing forms low cliffs along the coast. The youthful island lacks fringing or offshore reefs. A period of heightened thermal phenomena took place in 1976. An eruption began in January 2018 that included lava effusion from vents at the summit and at the E coast.
Information Contacts: Darwin Volcanic Ash Advisory Centre (VAAC), Bureau of Meteorology, Northern Territory Regional Office, PO Box 40050, Casuarina, NT 0811, Australia (URL: http://www.bom.gov.au/info/vaac/); Hawai'i Institute of Geophysics and Planetology (HIGP) - MODVOLC Thermal Alerts System, School of Ocean and Earth Science and Technology (SOEST), Univ. of Hawai'i, 2525 Correa Road, Honolulu, HI 96822, USA (URL: http://modis.higp.hawaii.edu/); Copernicus Browser, Copernicus Data Space Ecosystem, European Space Agency (URL: https://dataspace.copernicus.eu/browser/).
San Miguel (El Salvador) — June 2023 Cite this Report
San Miguel
El Salvador
13.434°N, 88.269°W; summit elev. 2130 m
All times are local (unless otherwise noted)
Small gas-and-ash explosions during March and May 2023
San Miguel in El Salvador is a broad, deep crater complex that has been frequently modified by eruptions recorded since the early 16th century and consists of the summit known locally as Chaparrastique. Flank eruptions have produced lava flows that extended to the N, NE, and SE during the 17-19th centuries. The most recent activity has consisted of minor ash eruptions from the summit crater. The current eruption period began in November 2022 and has been characterized by frequent phreatic explosions, gas-and-ash emissions, and sulfur dioxide plumes (BGVN 47:12). This report describes small gas-and-ash explosions during December 2022 through May 2023 based on special reports from the Ministero de Medio Ambiente y Recursos Naturales (MARN).
Activity has been relatively low since the last recorded explosions on 29 November 2022. Seismicity recorded by the San Miguel Volcano Station (VSM) located on the N flank at 1.7 km elevation had decreased by 7 December. Sulfur dioxide gas measurements taken with DOAS (Differential Optical Absorption Spectroscopy) mobile equipment were below typical previously recorded values: 300 tons per day (t/d). During December, small explosions were recorded by the seismic network and manifested as gas-and-steam emissions.
Gas-and-ash explosions in the crater occurred during January 2023, which were recorded by the seismic network. Sulfur dioxide values remained low, between 300-400 t/d through 10 March. At 0817 on 14 January a gas-and-ash emission was visible in webcam images, rising just above the crater rim. Some mornings during February, small gas-and-steam plumes were visible in the crater. On 7 March at 2252 MARN noted an increase in degassing from the central crater; gas emissions were constantly observed through the early morning hours on 8 March. During the early morning of 8 March through the afternoon on 9 March, 12 emissions were registered, some accompanied by ash. The last gas-and-ash emission was recorded at 1210 on 9 March; very fine ashfall was reported in El Tránsito (10 km S), La Morita (6 km W), and La Piedrita (3 km W). The smell of sulfur was reported in Piedra Azul (5 km SW). On 16 March MARN reported that gas-and-steam emissions decreased.
Low degassing and very low seismicity were reported during April; no explosions have been detected between 9 March and 27 May. The sulfur dioxide emissions remained between 350-400 t/d; during 13-20 April sulfur dioxide values fluctuated between 30-300 t/d. Activity remained low through most of May; on 23 May seismicity increased. An explosion was detected at 1647 on 27 May generated a gas-and-ash plume that rose 700 m high (figure 32); a decrease in seismicity and gas emissions followed. The DOAS station installed on the W flank recorded sulfur dioxide values that reached 400 t/d on 27 May; subsequent measurements showed a decrease to 268 t/d on 28 May and 100 t/d on 29 May.
Geologic Background. The symmetrical cone of San Miguel, one of the most active volcanoes in El Salvador, rises from near sea level to form one of the country's most prominent landmarks. A broad, deep, crater complex that has been frequently modified by eruptions recorded since the early 16th century caps the truncated unvegetated summit, also known locally as Chaparrastique. Flanks eruptions of the basaltic-andesitic volcano have produced many lava flows, including several during the 17th-19th centuries that extended to the N, NE, and SE. The SE-flank flows are the largest and form broad, sparsely vegetated lava fields crossed by highways and a railroad skirting the base of the volcano. Flank vent locations have migrated higher on the edifice during historical time, and the most recent activity has consisted of minor ash eruptions from the summit crater.
Information Contacts: Ministero de Medio Ambiente y Recursos Naturales (MARN), Km. 5½ Carretera a Nueva San Salvador, Avenida las Mercedes, San Salvador, El Salvador (URL: http://www.snet.gob.sv/ver/vulcanologia).
Semisopochnoi (United States) — June 2023 Cite this Report
Semisopochnoi
United States
51.93°N, 179.58°E; summit elev. 1221 m
All times are local (unless otherwise noted)
Occasional explosions, ash deposits, and gas-and-steam plumes during December 2022-May 2023
Semisopochnoi is located in the western Aleutians, is 20-km-wide at sea level, and contains an 8-km-wide caldera. The three-peaked Mount Young (formerly Cerberus) was constructed within the caldera during the Holocene. Each of these peaks contains a summit crater; the lava flows on the N flank appear younger than those on the S side. The current eruption period began in early February 2021 and has more recently consisted of intermittent explosions and ash emissions (BGVN 47:12). This report updates activity during December 2022 through May 2023 using daily, weekly, and special reports from the Alaska Volcano Observatory (AVO). AVO monitors the volcano using local seismic and infrasound sensors, satellite data, web cameras, and remote infrasound and lightning networks.
Activity during most of December 2022 was relatively quiet; according to AVO no eruptive or explosive activity was observed since 7 November 2022. Intermittent tremor and occasional small earthquakes were observed in geophysical data. Continuous gas-and-steam emissions were observed from the N crater of Mount Young in webcam images on clear weather days (figure 25). On 24 December, there was a slight increase in earthquake activity and several small possible explosion signals were detected in infrasound data. Eruptive activity resumed on 27 December at the N crater of Mount Young; AVO issued a Volcano Activity Notice (VAN) that reported minor ash deposits on the flanks of Mount Young that extended as far as 1 km from the vent, according to webcam images taken during 27-28 December (figure 26). No ash plumes were observed in webcam or satellite imagery, but a persistent gas-and-steam plume that might have contained some ash rose to 1.5 km altitude. As a result, AVO raised the Aviation Color Code (ACC) to Orange (the second highest level on a four-color scale) and the Volcano Alert Level (VAL) to Watch (the second highest level on a four-level scale). Possible explosions were detected during 21 December 2022 through 1 January 2023 and seismic tremor was recorded during 30-31 December.
During January 2023 eruptive activity continued at the active N crater of Mount Young. Minor ash deposits were observed on the flanks, extending about 2 km SSW, based on webcam images from 1 and 3 January. A possible explosion occurred during 1-2 January based on elevated seismicity recorded on local seismometers and an infrasound signal recorded minutes later by an array at Adak. Though no ash plumes were observed in webcam or satellite imagery, a persistent gas-and-steam plume rose to 1.5 km altitude that might have carried minor traces of ash. Ash deposits were accompanied by periods of elevated seismicity and infrasound signals from the local geophysical network, which AVO reported were likely due to weak explosive activity. Low-level explosive activity was also detected during 2-3 January, with minor gas-and-steam emissions and a new ash deposit that was visible in webcam images. Low-level explosive activity was detected in geophysical data during 4-5 January, with elevated seismicity and infrasound signals observed on local stations. Volcanic tremor was detected during 7-9 January and very weak explosive activity was detected in seismic and infrasound data on 9 January. Weak seismic and infrasound signals were recorded on 17 January, which indicated minor explosive activity, but no ash emissions were observed in clear webcam images; a gas-and-steam plume continued to rise to 1.5 km altitude. During 29-30 January, ash deposits near the summit were observed on fresh snow, according to webcam images.
The active N cone at Mount Young continued to produce a gas-and-steam plume during February, but no ash emissions or explosive events were detected. Seismicity remained elevated with faint tremor during early February. Gas-and-steam emissions from the N crater were observed in clear webcam images on 11-13 and 16 February; no explosive activity was detected in seismic, infrasound, or satellite data. Seismicity has also decreased, with no significant seismic tremor observed since 25 January. Therefore, the ACC was lowered to Yellow (the second lowest level on a four-color scale) and the VAL was lowered to Advisory (the second lowest level on a four-color scale) on 22 February.
Gas-and-steam emissions persisted during March from the N cone of Mount Young, based on clear webcam images. A few brief episodes of weak tremor were detected in seismic data, although seismicity decreased over the month. A gas-and-steam plume detected in satellite data extended 150 km on 18 March. Low-level ash emissions from the N cone at Mount Young were observed in several webcam images during 18-19 March, in addition to small explosions and volcanic tremor. The ACC was raised to Orange and the VAL increased to Watch on 19 March. A small explosion was detected in seismic and infrasound data on 21 March.
Low-level unrest continued during April, although cloudy weather often obscured views of the summit; periods of seismic tremor and local earthquakes were recorded. During 3-4 April a gas-and-steam plume was visible traveling more than 200 km overnight; no ash was evident in the plume, according to AVO. A gas-and-steam plume was observed during 4-6 April that extended 400 km but did not seem to contain ash. Small explosions were detected in seismic and infrasound data on 5 April. Occasional clear webcam images showed continuing gas-and-steam emissions rose from Mount Young, but no ash deposits were observed on the snow. On 19 April small explosions and tremor were detected in seismic and infrasound data. A period of seismic tremor was detected during 22-25 April, with possible weak explosions on 25 April. Ash deposits were visible near the crater rim, but it was unclear if these deposits were recent or due to older deposits.
Occasional small earthquakes were recorded during May, but there were no signs of explosive activity seen in geophysical data. Gas-and-steam emissions continued from the N crater of Mount Young, based on webcam images, and seismicity remained slightly elevated. A new, light ash deposit was visible during the morning of 5 May on fresh snow on the NW flank of Mount Young. During 10 May periods of volcanic tremor were observed. The ACC was lowered to Yellow and the VAL to Advisory on 17 May due to no additional evidence of activity.
Geologic Background. Semisopochnoi, the largest subaerial volcano of the western Aleutians, is 20 km wide at sea level and contains an 8-km-wide caldera. It formed as a result of collapse of a low-angle, dominantly basaltic volcano following the eruption of a large volume of dacitic pumice. The high point of the island is Anvil Peak, a double-peaked late-Pleistocene cone that forms much of the island's northern part. The three-peaked Mount Cerberus (renamed Mount Young in 2023) was constructed within the caldera during the Holocene. Each of the peaks contains a summit crater; lava flows on the N flank appear younger than those on the south side. Other post-caldera volcanoes include the symmetrical Sugarloaf Peak SSE of the caldera and Lakeshore Cone, a small cinder cone at the edge of Fenner Lake in the NE part of the caldera. Most documented eruptions have originated from Young, although Coats (1950) considered that both Sugarloaf and Lakeshore Cone could have been recently active.
Information Contacts: Alaska Volcano Observatory (AVO), a cooperative program of a) U.S. Geological Survey, 4200 University Drive, Anchorage, AK 99508-4667 USA (URL: https://avo.alaska.edu/), b) Geophysical Institute, University of Alaska, PO Box 757320, Fairbanks, AK 99775-7320, USA, and c) Alaska Division of Geological & Geophysical Surveys, 794 University Ave., Suite 200, Fairbanks, AK 99709, USA (URL: http://dggs.alaska.gov/).
Ebeko
Russia
50.686°N, 156.014°E; summit elev. 1103 m
All times are local (unless otherwise noted)
Continued explosions, ash plumes, and ashfall during October 2022-May 2023
Ebeko, located on the N end of Paramushir Island in the Kuril Islands, consists of three summit craters along a SSW-NNE line at the northern end of a complex of five volcanic cones. Eruptions date back to the late 18th century and have been characterized as small-to-moderate explosions from the summit crater, accompanied by intense fumarolic activity. The current eruption period began in June 2022 and has recently consisted of frequent explosions, ash plumes, and thermal activity (BGVN 47:10). This report covers similar activity during October 2022 through May 2023, based on information from the Kamchatka Volcanic Eruptions Response Team (KVERT) and satellite data.
Activity during October consisted of explosive activity, ash plumes, and occasional thermal anomalies. Visual data by volcanologists from Severo-Kurilsk showed explosions producing ash clouds up to 2.1-3 km altitude which drifted E, N, NE, and SE during 1-8, 10, 16, and 18 October. KVERT issued several Volcano Observatory Notices for Aviation (VONA) on 7, 13-15, and 27 October 2022, stating that explosions generated ash plumes that rose to 2.3-4 km altitude and drifted 5 km E, NE, and SE. Ashfall was reported in Severo-Kurilsk (Paramushir Island, about 7 km E) on 7 and 13 October. Satellite data showed a thermal anomaly over the volcano on 15-16 October. Visual data showed ash plumes rising to 2.5-3.6 km altitude on 22, 25-29, and 31 October and moving NE due to constant explosions.
Similar activity continued during November, with explosions, ash plumes, and ashfall occurring. KVERT issued VONAs on 1-2, 4, 6-7, 9, 13, and 16 November that reported explosions and resulting ash plumes that rose to 1.7-3.6 km altitude and drifted 3-5 km SE, ESE, E, and NE. On 1 November ash plumes extended as far as 110 km SE. On 5, 8, 12, and 24-25 November explosions and ash plumes rose to 2-3.1 km altitude and drifted N and E. Ashfall was observed in Severo-Kurilsk on 7 and 16 November. A thermal anomaly was visible during 1-4, 16, and 20 November. Explosions during 26 November rose as high as 2.7 km altitude and drifted NE (figure 45).
Explosions and ash plumes continued to occur in December. During 1-2 and 4 December volcanologists from Severo-Kurilsk observed explosions that sent ash to 1.9-2.5 km altitude and drifted NE and SE (figure 46). VONAs were issued on 5, 9, and 16 December reporting that explosions generated ash plumes rising to 1.9 km, 2.6 km, and 2.4 km altitude and drifted 5 km SE, E, and NE, respectively. A thermal anomaly was visible in satellite imagery on 16 December. On 18 and 27-28 December explosions produced ash plumes that rose to 2.5 km altitude and drifted NE and SE. On 31 December an ash plume rose to 2 km altitude and drifted NE.
Explosions continued during January 2023, based on visual observations by volcanologists from Severo-Kurilsk. During 1-7 January explosions generated ash plumes that rose to 4 km altitude and drifted NE, E, W, and SE. According to VONAs issued by KVERT on 2, 4, 10, and 23 January, explosions produced ash plumes that rose to 2-4 km altitude and drifted 5 km N, NE, E, and ENE; the ash plume that rose to 4 km altitude occurred on 10 January (figure 47). Satellite data showed a thermal anomaly during 3-4, 10, 13, 16, 21, 22, and 31 January. KVERT reported that an ash cloud on 4 January moved 12 km NE. On 6 and 9-11 January explosions sent ash plumes to 4.5 km altitude and drifted W and ESE. On 13 January an ash plume rose to 3 km altitude and drifted SE. During 20-24 January ash plumes from explosions rose to 3.7 km altitude and drifted SE, N, and NE. On 21 January the ash plume drifted as far as 40 km NE. During 28-29 and 31 January and 1 February ash plumes rose to 4 km altitude and drifted NE.
During February, explosions, ash plumes, and ashfall were reported. During 1, 4-5 and 7-8 February explosions generated ash plumes that rose to 4.5 km altitude and drifted E and NE; ashfall was observed on 5 and 8 February. On 6 February an explosion produced an ash plume that rose to 3 km altitude and drifted 7 km E, causing ashfall in Severo-Kurilsk. A thermal anomaly was visible in satellite data on 8, 9, 13, and 21 February. Explosions on 9 and 12-13 February produced ash plumes that rose to 4 km altitude and drifted E and NE; the ash cloud on 12 February extended as far as 45 km E. On 22 February explosions sent ash to 3 km altitude that drifted E. During 24 and 26-27 February ash plumes rose to 4 km altitude and drifted E. On 28 February an explosion sent ash to 2.5-3 km altitude and drifted 5 km E; ashfall was observed in Severo-Kurilsk.
Activity continued during March; visual observations showed that explosions generated ash plumes that rose to 3.6 km altitude on 3, 5-7, and 9-12 March and drifted E, NE, and NW. Thermal anomalies were visible on 10, 13, and 29-30 March in satellite imagery. On 18, 21-23, 26, and 29-30 March explosions produced ash plumes that rose to 2.8 km altitude and drifted NE and E; the ash plumes during 22-23 March extended up to 76 km E. A VONA issued on 21 March reported an explosion that produced an ash plume that rose to 2.8 km altitude and drifted 5 km E. Another VONA issued on 23 March reported that satellite data showed an ash plume rising to 3 km altitude and drifted 14 km E.
Explosions during April continued to generate ash plumes. On 1 and 4 April an ash plume rose to 2.8-3.5 km altitude and drifted SE and NE. A thermal anomaly was visible in satellite imagery during 1-6 April. Satellite data showed ash plumes and clouds rising to 2-3 km altitude and drifting up to 12 km SW and E on 3 and 6 April (figure 48). KVERT issued VONAs on 3, 5, 14, 16 April describing explosions that produced ash plumes rising to 3 km, 3.5 km, 3.5 km, and 3 km altitude and drifting 5 km S, 5 km NE and SE, 72 km NNE, and 5 km NE, respectively. According to satellite data, the resulting ash cloud from the explosion on 14 April was 25 x 7 km in size and drifted 72-104 km NNE during 14-15 April. According to visual data by volcanologists from Severo-Kurilsk explosions sent ash up to 3.5 km altitude that drifted NE and E during 15-16, 22, 25-26, and 29 April.
The explosive eruption continued during May. Explosions during 3-4, 6-7, and 9-10 May generated ash plumes that rose to 4 km altitude and drifted SW and E. Satellite data showed a thermal anomaly on 3, 9, 13-14, and 24 May. During 12-16, 23-25, and 27-28 May ash plumes rose to 3.5 km altitude and drifted in different directions due to explosions. Two VONA notices were issued on 16 and 25 May, describing explosions that generated ash plumes rising to 3 km and 3.5 km altitude, respectively and extending 5 km E. The ash cloud on 25 May drifted 75 km SE.
Thermal activity in the summit crater, occasionally accompanied by ash plumes and ash deposits on the SE and E flanks due to frequent explosions, were visible in infrared and true color satellite images (figure 49).
Geologic Background. The flat-topped summit of the central cone of Ebeko volcano, one of the most active in the Kuril Islands, occupies the northern end of Paramushir Island. Three summit craters located along a SSW-NNE line form Ebeko volcano proper, at the northern end of a complex of five volcanic cones. Blocky lava flows extend west from Ebeko and SE from the neighboring Nezametnyi cone. The eastern part of the southern crater contains strong solfataras and a large boiling spring. The central crater is filled by a lake about 20 m deep whose shores are lined with steaming solfataras; the northern crater lies across a narrow, low barrier from the central crater and contains a small, cold crescentic lake. Historical activity, recorded since the late-18th century, has been restricted to small-to-moderate explosive eruptions from the summit craters. Intense fumarolic activity occurs in the summit craters, on the outer flanks of the cone, and in lateral explosion craters.
Information Contacts: Kamchatka Volcanic Eruptions Response Team (KVERT), Far Eastern Branch, Russian Academy of Sciences, 9 Piip Blvd., Petropavlovsk-Kamchatsky, 683006, Russia (URL: http://www.kscnet.ru/ivs/kvert/); MIROVA (Middle InfraRed Observation of Volcanic Activity), a collaborative project between the Universities of Turin and Florence (Italy) supported by the Centre for Volcanic Risk of the Italian Civil Protection Department (URL: http://www.mirovaweb.it/); Copernicus Browser, Copernicus Data Space Ecosystem, European Space Agency (URL: https://dataspace.copernicus.eu/browser/).
Home Reef
Tonga
18.992°S, 174.775°W; summit elev. -10 m
All times are local (unless otherwise noted)
Discolored plumes continued during November 2022-April 2023
Home Reef is a submarine volcano located in the central Tonga islands between Lateiki (Metis Shoal) and Late Island. The first recorded eruption occurred in the mid-19th century, when an ephemeral island formed. An eruption in 1984 produced a 12-km-high eruption plume, a large volume of floating pumice, and an ephemeral island 500 x 1,500 m wide, with cliffs 30-50 m high that enclosed a water-filled crater. Another island-forming eruption in 2006 produced widespread pumice rafts that drifted as far as Australia; by 2008 the island had eroded below sea level. The previous eruption occurred during October 2022 and was characterized by a new island-forming eruption, lava effusion, ash plumes, discolored water, and gas-and-steam plumes (BGVN 47:11). This report covers discolored water plumes during November 2022 through April 2023 using satellite data.
Discolored plumes continued during the reporting period and were observed in true color satellite images on clear weather days. Satellite images show light green-yellow discolored water extending W on 8 and 28 November 2022 (figure 31), and SW on 18 November. Light green-yellow plumes extended W on 3 December, S on 13 December, SW on 18 December, and W and S on 23 December (figure 31). On 12 January 2023 discolored green-yellow plumes extended to the NE, E, SE, and N. The plume moved SE on 17 January and NW on 22 January. Faint discolored water in February was visible moving NE on 1 February. A discolored plume extended NW on 8 and 28 March and NW on 13 March (figure 31). During April, clear weather showed green-blue discolored plumes moving S on 2 April, W on 7 April, and NE and S on 12 April. A strong green-yellow discolored plume extended E and NE on 22 April for several kilometers (figure 31).
Geologic Background. Home Reef, a submarine volcano midway between Metis Shoal and Late Island in the central Tonga islands, was first reported active in the mid-19th century, when an ephemeral island formed. An eruption in 1984 produced a 12-km-high eruption plume, large amounts of floating pumice, and an ephemeral 500 x 1,500 m island, with cliffs 30-50 m high that enclosed a water-filled crater. In 2006 an island-forming eruption produced widespread dacitic pumice rafts that drifted as far as Australia. Another island was built during a September-October 2022 eruption.
Information Contacts: Copernicus Browser, Copernicus Data Space Ecosystem, European Space Agency (URL: https://dataspace.copernicus.eu/browser/).
Ambae
Vanuatu
15.389°S, 167.835°E; summit elev. 1496 m
All times are local (unless otherwise noted)
New lava flow, ash plumes, and sulfur dioxide plumes during February-May 2023
Ambae, also known as Aoba, is a large basaltic shield volcano in Vanuatu. A broad pyroclastic cone containing three crater lakes (Manaro Ngoru, Voui, and Manaro Lakua) is located at the summit within the youngest of at least two nested calderas. Periodic phreatic and pyroclastic explosions have been reported since the 16th century. A large eruption more than 400 years ago resulted in a volcanic cone within the summit crater that is now filled by Lake Voui; the similarly sized Lake Manaro fills the western third of the caldera. The previous eruption ended in August 2022 that was characterized by gas-and-steam and ash emissions and explosions of wet tephra (BGVN 47:10). This report covers a new eruption during February through May 2023 that consisted of a new lava flow, ash plumes, and sulfur dioxide emissions, using information from the Vanuatu Meteorology and Geo-Hazards Department (VMGD) and satellite data.
During the reporting period, the Alert Level remained at a 2 (on a scale of 0-5), which has been in place since December 2021. Activity during October 2022 through March 2023 remained relatively low and mostly consisted of gas-and-steam emissions in Lake Voui. VMGD reported that at 1300 on 15 November a satellite image captured a strong amount of sulfur dioxide rising above the volcano (figure 99), and that seismicity slightly increased. The southern and northern part of the island reported a strong sulfur dioxide smell and heard explosions. On 20 February 2023 a gas-and-ash plume rose 1.3 km above the summit and drifted SSW, according to a webcam image (figure 100). Gas-and-steam and possibly ash emissions continued on 23 February and volcanic earthquakes were recorded by the seismic network.
During April, volcanic earthquakes and gas-and-steam and ash emissions were reported from the cone in Lake Voui. VMGD reported that activity increased during 5-7 April; high gas-and-steam and ash plumes were visible, accompanied by nighttime incandescence. According to a Wellington VAAC report, a low-level ash plume rose as high as 2.5 km above the summit and drifted W and SW on 5 April, based on satellite imagery. Reports in Saratamata stated that a dark ash plume drifted to the WSW, but no loud explosion was heard. Webcam images from 2100 showed incandescence above the crater and reflected in the clouds. According to an aerial survey, field observations, and satellite data, water was no longer present in the lake. A lava flow was reported effusing from the vent and traveling N into the dry Lake Voui, which lasted three days. The next morning at 0745 on 6 April a gas-and-steam and ash plume rose 5.4 km above the summit and drifted ESE, based on information from VMGD (figure 101). The Wellington VAAC also reported that light ashfall was observed on the island. Intermittent gas-and-steam and ash emissions were visible on 7 April, some of which rose to an estimated 3 km above the summit and drifted E. Webcam images during 0107-0730 on 7 April showed continuing ash emissions. A gas-and-steam and ash plume rose 695 m above the summit crater at 0730 on 19 April and drifted ESE, based on a webcam image (figure 102).
According to visual and infrared satellite data, water was visible in Lake Voui as late as 24 March 2023 (figure 103). The vent in the caldera showed a gas-and-steam plume drifted SE. On 3 April thermal activity was first detected, accompanied by a gas-and-ash plume that drifted W (figure 103). The lava flow moved N within the dry lake and was shown cooling by 8 April. By 23 April much of the water in the lake had returned. Occasional sulfur dioxide plumes were detected by the TROPOMI instrument on the Sentinel-5P satellite that exceeded 2 Dobson Units (DU) and drifted in different directions (figure 104).
Geologic Background. The island of Ambae, also known as Aoba, is a massive 2,500 km3 basaltic shield that is the most voluminous volcano of the New Hebrides archipelago. A pronounced NE-SW-trending rift zone with numerous scoria cones gives the 16 x 38 km island an elongated form. A broad pyroclastic cone containing three crater lakes (Manaro Ngoru, Voui, and Manaro Lakua) is located at the summit within the youngest of at least two nested calderas, the largest of which is 6 km in diameter. That large central edifice is also called Manaro Voui or Lombenben volcano. Post-caldera explosive eruptions formed the summit craters about 360 years ago. A tuff cone was constructed within Lake Voui (or Vui) about 60 years later. The latest known flank eruption, about 300 years ago, destroyed the population of the Nduindui area near the western coast.
Information Contacts: Geo-Hazards Division, Vanuatu Meteorology and Geo-Hazards Department (VMGD), Ministry of Climate Change Adaptation, Meteorology, Geo-Hazards, Energy, Environment and Disaster Management, Private Mail Bag 9054, Lini Highway, Port Vila, Vanuatu (URL: http://www.vmgd.gov.vu/, https://www.facebook.com/VanuatuGeohazardsObservatory/); Wellington Volcanic Ash Advisory Centre (VAAC), Meteorological Service of New Zealand Ltd (MetService), PO Box 722, Wellington, New Zealand (URL: http://www.metservice.com/vaac/, http://www.ssd.noaa.gov/VAAC/OTH/NZ/messages.html); MIROVA (Middle InfraRed Observation of Volcanic Activity), a collaborative project between the Universities of Turin and Florence (Italy) supported by the Centre for Volcanic Risk of the Italian Civil Protection Department (URL: http://www.mirovaweb.it/); Global Sulfur Dioxide Monitoring Page, Atmospheric Chemistry and Dynamics Laboratory, NASA Goddard Space Flight Center (NASA/GSFC), 8800 Greenbelt Road, Goddard, Maryland, USA (URL: https://so2.gsfc.nasa.gov/); Copernicus Browser, Copernicus Data Space Ecosystem, European Space Agency (URL: https://dataspace.copernicus.eu/browser/).
Search Bulletin Archive by Publication Date
Select a month and year from the drop-downs and click "Show Issue" to have that issue displayed in this tab.
The default month and year is the latest issue available.
Bulletin of the Global Volcanism Network - Volume 28, Number 07 (July 2003)
Managing Editor: Edward Venzke
Anatahan (United States)
Observations of deposits from the eruptive sequence that began 10 May 2003
Arenal (Costa Rica)
September 2000-October 2001 eruptions include pyroclastic flows
Awu (Indonesia)
Elevated seismicity during last half of 2000
Bezymianny (Russia)
26 July 2003 ash plume to 8-11 km altitude
Chikurachki (Russia)
Infrequent observations suggest weaker eruptions continued in July 2003
Colima (Mexico)
Small explosions produced, including two on 17 July; absence of lava flows
Dieng Volcanic Complex (Indonesia)
Mud bubbling and outflows at Sileri crater that reached 50 m beyond crater rim
Gamalama (Indonesia)
Ashfall from 31 July eruption coats Ternate; pyroclastic flow
Kanlaon (Philippines)
1-km-high plume of ash-laden steam on 10-11 July 2003
Karangetang (Indonesia)
June 2003 ash plumes and two lava avalanches
Karymsky (Russia)
May-July ash plumes; affiliated seismicity and satellite thermal anomalies
Klyuchevskoy (Russia)
Gas-and-steam plumes June-August with occassional ash plumes
Krakatau (Indonesia)
Foggy weather and low seismicity
Leroboleng (Indonesia)
June-July ash plumes reported by pilots may be the first eruptions in 122 years
Negro, Cerro (Nicaragua)
Slumbering volcano yields uneventful seismic and fumarolic temperature data
Papandayan (Indonesia)
After the explosions of November 2002, seismicity and eruptions waned
Semeru (Indonesia)
Ash plumes, pyroclastic flows, and high seismicity continue through June
Sheveluch (Russia)
Lava dome growth and ash-and-gas plumes to 5 km high
Soufriere Hills (United Kingdom)
Changes in activity style and dome growth since February 2002
Stromboli (Italy)
Flank eruption finished as of 22 July; activity resumed at summit craters on 17 April
Yellowstone (United States)
Geyser basin heats up, affecting thermal features
Anatahan (United States) — July 2003 Cite this Report
Anatahan
United States
16.35°N, 145.67°E; summit elev. 790 m
All times are local (unless otherwise noted)
Observations of deposits from the eruptive sequence that began 10 May 2003
Anatahan erupted on the evening of 10 May 2003 (BGVN 28:04). The volcano, which forms the uninhabited Anatahan Island in the Commonwealth of the Northern Mariana Islands (CNMI), had no recorded historical eruptions. This report provides observations from a 25 July 2003 report (updated 31 July 2003) by the University of Tokyo Earthquake Research Institute (ERI) documenting fieldwork by their team during 16-19 July 2003. During the inspection, the volcano was quiet, with only weak steaming at the active crater. Seismicity reported by the Commonwealth of the Northern Mariana Islands (CNMI) Emergency Management Office continued into early August.
Tephra deposits. The recent eruption left recognizable tephra deposits consisting mainly of pumice-bearing brown ash in a lower unit and fine gray ash in an upper unit (figure 10). Both the upper and lower units consist of many sub-layers. At the village (NW end of the island) the total thickness of brown ash was 20 cm and gray ash was 3 cm.
At the SE part of the island tephra deposits were less than 3 cm thick. Although grass and trees did not show heat damage, plastic bottles had melted. The outer S slope of the active crater in the E caldera was thickly covered by gray ash. Many rills and gullies developed on these deposits due to the impermeable nature of the gray ash, which typically consisted of very fine particles. Occasionally the observers noted partly broken, stripped trees on the slopes, with a thick cover of gray tephra accumulated on the side facing the active crater. Tephra was ~20 cm thick near the crater rim and pumice-bearing tephra below was ~25 cm thick. The latter included blocks and fragments of pumice.
Inside the W caldera, tephra deposits reached a thickness of up to 1 m. Gray ash was deposited most thickly NW of the crater. Pumice-bearing tephra was thickest in the WSW direction from the crater. The latter is consistent with the drift direction of eruption plumes in the earliest stage shown by satellite images (BGVN 28:06). Although most of the trees had survived falling pumice early during the eruption, they were toppled by the strong lateral movement of gray ash during the phreatic phase.
Crater observations. The mid-July fieldwork included two days of helicopter inspection; observers saw only steaming at the active crater. That crater occupied the S part of the E crater, which lies inside the E caldera. The S wall of the active crater extended directly into the wall of the E crater. The new crater was ~300 m across and ~100 m deep, with the deepest part in the S containing a dried-out mud pool.
A mound-like but rugged-ridged lava dome protruded along the active crater's inner N periphery (figure 11). The surface of this recently erupted dome lay beneath a thick cover of gray ash associated with the phreatic eruption. Infrared camera images indicate that it remained at higher temperature than deposits outside the crater.
The dome may have been broken by explosive eruptions in mid-June when high seismic and visual activities were reported. Products of a reamed-out dome may have been broken into small clasts, widely dispersed, and buried by later deposits. On the other hand, neither bombs nor blocks were clearly visible on the floors of either the E crater (outside the pyroclastic cone) or in the E caldera. Thus, the absence of large blocks of lava dome around the active crater could suggest that the original dimensions of the lava dome may have been small and that the dome had undergone comparatively little sculpting by later explosions.
A low pyroclastic cone developed on the crater's N side (figure 11). The maximum thickness of newly deposited tephra exposed in a gully through this cone reached ~20 m.
Chemistry and degassing of magma. Pumice from this eruption was crystal-poor and light to dark brown in color. A pumice block with a light-brown crust and dark-brown vesicular core collected from the pumice-fall layer just S of the active crater was analyzed by x-ray fluorescence spectroscopy at ERI. The crust and core parts were separately analyzed; each contained 61 weight percent SiO2.
Observers saw blue- to purple-colored gas escaping the active crater and smelled a strong rotten-egg near the S rim of the E caldera on 18 July. Instrumental concentration estimates measured 2-4 ppm SO2 and 0.5 ppm H2S. The SO2 emission rate remained moderate to low throughout the inspection; the total SO2 flux was probably less than several thousand tons a day, similar to that at Sakurajima, Japan.
Ongoing activity, July into early August. According to CNMI reports, volcanic tremor and other seismicity at Anatahan persisted through July and into August 2003 at a relatively low level. On 1 August the Anatahan seismic station registered a small swarm of a dozen or so long-period (LP) events of approximate magnitude 1; similar swarms occurred on 4 and 5 August. Several hundred small (LP) events occurred during 5-6 August. The number of small LP events was greater than that of previous days, but the overall energy release appears not to have increased significantly. No LP events were recorded on 7 August.
Geologic Background. The elongate, 9-km-long island of Anatahan in the central Mariana Islands consists of a large stratovolcano with a 2.3 x 5 km compound summit caldera. The larger western portion of the caldera is 2.3 x 3 km wide, and its western rim forms the island's high point. Ponded lava flows overlain by pyroclastic deposits fill the floor of the western caldera, whose SW side is cut by a fresh-looking smaller crater. The 2-km-wide eastern portion of the caldera contained a steep-walled inner crater whose floor prior to the 2003 eruption was only 68 m above sea level. A submarine cone, named NE Anatahan, rises to within 460 m of the sea surface on the NE flank, and numerous other submarine vents are found on the NE-to-SE flanks. Sparseness of vegetation on the most recent lava flows had indicated that they were of Holocene age, but the first historical eruption did not occur until May 2003, when a large explosive eruption took place forming a new crater inside the eastern caldera.
Information Contacts: Setsuya Nakada and Teruyuki Kato, Volcano Research Center, Earthquake Research Institute (ERI), University of Tokyo (URL: http://www.eri.u-tokyo.ac.jp/VRC/index_E.html); Takeshi Matsushima, Institute of Seismology and Volcanology (SEVO), Kyushu University, Japan; Juan Takai Camacho and Ramon Chong, Commonwealth of the Northern Mariana Islands (CNMI) Emergency Management Office, P.O. Box 10007, Saipan, MP 96950, USA (URL: http://www.cnmihsem.gov.mp/).
Arenal
Costa Rica
10.463°N, 84.703°W; summit elev. 1670 m
All times are local (unless otherwise noted)
September 2000-October 2001 eruptions include pyroclastic flows
During September 2000-October 2001 Arenal issued frequent Strombolian eruptions, occasional avalanches, and several episodes with sizable pyroclastic flows (PFs). Crater D remained fumarolic, with the eruptive activity centered at crater C. Crater C also emitted lava flows (as many as three simultaneously) down Arenal's NE-NW sides. In some cases the site of pyroclastic-flow (PF) generation came from outside crater C, emerging where lava flows perched on the slopes, broke open, and violently released blocks, ash, and gas (block-and-ash flows).
In September-November 2000, OVSICORI-UNA reports noted that the lava flows that began after the 23 August PFs descended the N flank, and during that month had fronts at ~900 m elevation. Sporadic avalanches broke off the lava flow fronts. One such episode at 0630 on 11 September 2000 produced a small ash column. September-November ash columns remained under 500 m above crater C. In September and later months cold loose debris came down parts of the edifice, entering the drainages Calle de Arenas, Manolo, Guillermina, and the larger Tabacón and Agua Caliente rivers.
Deformation, as measured by surveys of the distance network, lacked significant changes during August 2000-November 2000. However, between December and April 2001 there were sudden changes in line length, on the order of a centimeter on all lines, and most appreciable on NE-sector lines. The N-NE sectors are also where most of the lava flows and avalanche instability has occurred. Deformation and tilt changes through 2001 were otherwise described as minor.
Two noteworthy PFs, in August 2000 and March 2001, did not correlate with short-term increases in precursory seismicity. Crater C emitted Strombolian eruptions and N-directed lava flows in late February, and produced PFs during March 2001.
Eruptive episode of late March 2001. During 24 and 26 March 2001 PFs descended Arenal (figure 95) in a series of pulses traveling NNE towards Cedeño lake. Both reports from ICE and OVSICORI-UNA presented the eruptive time as about 1245 on the 24th and continuing until about 1600, with OVSICORI-UNA reporting under six pulses and ICE reporting under 10 pulses. ICE reported that the strongest pulses took place at 1258, 1331, and 1400. After that, the pulses became more frequent but of minor size.
ICE reports concluded that PFs reappeared on the 25th, with four pulses between 1348 and 1430. In contrast, OVSICORI-UNA's March report did not conclude that PFs occurred on the 25th and only described pulses on 24 and 26 March. ICE described PFs on the 26th as occurring in fewer than 8 pulses, between the hours of 0917 and 1400. OVSICORI-UNA stated that on the 26th there were fewer than three pulses in the early afternoon. It is clear that a series of PFs occurred over the 3-day (24-26 March) period, with few or none on the 25th.
Seismic signals interpreted by OVSICORI-UNA as PFs typically had durations lasting 100-200 seconds. This provided some measure of their time of origin and descent. These workers found that some very large (up to 36 x 17 x 5 m) incandescent blocks yielded temperatures of over 700°C two days after emplacement. They also reported that on Arenal's slopes the PFs excavated a gully 4 m wide by 500 m long. Field observations also disclosed that PFs or other processes removed part of the summit area, including segments of the cone's upper raised walls.
OVSICORI-UNA noted that the largest PFs accompanied dense clouds of lofted fine ash carried SW. The most distant ash fell over the main entrance to the park, in a pueblo known as El Castillo, and as far as 12 km from the source. OVSICORI-UNA scientists reported the lowest margins of the PFs reached ~660 m elevation.
Field work by ICE scientists Guillermo Alvarado and Francisco Arias revealed PF deposits forming three lobes. The main one was 10-50 m wide and reached 2 km in length. It reached down to 720 m elevation and covered 240,000 m3. When investigated (at an unstated date), its temperature measured over 200°C. The PFs had devastated 6-10 hectares (1 hectare is 104 m2) of primary forest, and the PFs, or related ash fall, heat, or singeing gases, had affected another 15 hectares. After the PFs diminished, lava flows began to escape following the same channel, their fronts later attaining ~1,400 m elevation.
This 24-26 March 2001 episode of PFs was judged to have been of smaller magnitude than the episode of 23 August 2000, a day when 27 pulses of PFs were observed, also directed towards lake Cedeño (BGVN 25:07 and 25:08). On that occasion two people died and another was seriously injured. The March 2001 PFs were without reported injuries or fatalities, although the affected zone was somewhat similar.
According to the ICE report, Alvarado and Arroyo (2000) listed five occasions when Arenal discharged a sequence of PFs for longer than one day (17-21 June 1975, 21-22 February 1989, 9-10 December 1991, 29-30 September 1996, and 19-20 August 1997). Only the sequence during 17-21 June 1975 and their interpretation of one during 24-26 March 2001 lasted more than 2 days. PFs in both of these multi-day sequences attained runout distances of over 1 km; by comparison, the flows during 1989 and 1996 did not surpass half kilometer runout distances. The longest PF occurred in 1975, reaching a 3.5 km runout distance, with the PF's distal portions following the Tabacón river.
April-December 2001. In their report for April 2001 OVSICORI-UNA reported that a lava flow had emerged from crater C decending along the path of the previous month's PFs, with lavas extending from the crater rim to the lava's front at ~1,400 m elevation. Blocks falling off the front reached 950 m elevation in N and NE directions. By the end of May 2001 OVSICORI-UNA noted the descending lavas took the form of three distinct flows that each crossed a different portion of crater C's rim. The three flows continued during June. At that time a sudden change was noted at a thermal spring along the Tabacón valley (NW of Arenal's summit). Its surface dropped by ~60 cm; the temperature of the spring remained stable, however, at 52°C. Deformation in the first half of 2001 showed only minor changes in both surveyed lines and tilt meters. The precise leveling lines on the W flank continued to show deflation on the order of 7 µrad/year.
OVSICORI-UNA stated that on 16 June at 0610 a small PF erupted. Although it failed to cause reported damage, it descended the NW flank in the direction of Balneario de Tabacón (a popular lodging and spa complex with thermal pools) situated farther downslope. During July two of the lava flows (the N- and NE-flank lavas) erupted during May and June stopped progressing. Meanwhile, the third lava flow, which exited crater C on the NW flank, remained active and mobile. During July and August, the eruptive vigor stood at modest levels; still, some eruption columns during July rose 500 m. The August and September reports stated that the one remaining actively progressing lava flow reached 950 and then 900 m elevation, respectively. It descended the same channel followed by the 16 July PF but had advanced little if any farther through October.
More PFs on 19 September 2001, during 1633-1640, and at 1646, were generated by lateral loosening of the lava flow at ~1,300 m elevation; it reached ~900 m elevation. The larger had an associated coffee-colored, mushroom-shaped cloud reaching more than 1 km in height. The associated ash cloud blew SE. PFs descended again on 18 October at 1035 from ~1,200 m elevation NE to 900 m elevation. Winds carried the associated ash cloud W.
Reference. Alvarado, G.E., and Arroyo, I., 2000, The pyroclastic flows of Arenal (Costa Rica) between 1975 and 2000: Origin, frequency, distribution and related hazards: Bulletin Osivam, v. 12, no. 23-24, p. 39-53.
Geologic Background. Conical Volcán Arenal is the youngest stratovolcano in Costa Rica and one of its most active. The 1670-m-high andesitic volcano towers above the eastern shores of Lake Arenal, which has been enlarged by a hydroelectric project. Arenal lies along a volcanic chain that has migrated to the NW from the late-Pleistocene Los Perdidos lava domes through the Pleistocene-to-Holocene Chato volcano, which contains a 500-m-wide, lake-filled summit crater. The earliest known eruptions of Arenal took place about 7000 years ago, and it was active concurrently with Cerro Chato until the activity of Chato ended about 3500 years ago. Growth of Arenal has been characterized by periodic major explosive eruptions at several-hundred-year intervals and periods of lava effusion that armor the cone. An eruptive period that began with a major explosive eruption in 1968 ended in December 2010; continuous explosive activity accompanied by slow lava effusion and the occasional emission of pyroclastic flows characterized the eruption from vents at the summit and on the upper western flank.
Information Contacts: E. Fernández, E. Duarte, E. Malavassi, R. Sáenz, V. Barboza, R. Van der Laat, T. Marino, E. Hernández, and F. Chavarría, Observatorio Vulcanológico y Sismológico de Costa Rica (OVSICORI-UNA); Jorge Barquero and Wendy Sáenz, Laboratorio de Química de la Atmósfera (LAQAT), Depto. de Química, Universidad Nacional, Heredia, Costa Rica; María Martínez (at both affiliations above); Orlando Vaselli and Franco Tassi, Department of Earth Sciences, University of Florence, Via La Pira 4, 50121 Florence, Italy; Ivonne Arroyo and Guillermo Alvarado, Observatorio Sismológico y Vulcanológico de Arenal y Miravalles (OSIVAM) Instituto Costarricense de Electricidad (ICE), Apdo 10032-San José, Costa Rica; Mauricio Mora, Sección de Sismología, Vulcanología y Exploración Geofísica, Universidad de Costa Rica (UCR), Apdo. 214-2060 San José, Costa Rica.
Awu
Indonesia
3.689°N, 125.447°E; summit elev. 1318 m
All times are local (unless otherwise noted)
Elevated seismicity during last half of 2000
The Volcanological Survey of Indonesia (VSI) issued reports of activity at Awu during June-July 2000, November-December 2002, and more recently during January-early March 2003, all of which are summarized here.
During June 2000, VSI reported an increase in seismicity, especially deep volcanic earthquakes (table 1). Satellite-relayed monitoring (by ARGOS) showed an increase in seismic energy beginning on 18 May 2000; deformation data showed inflation of ~800 µrad since 23 May.
Table 1. Seismicity reported at Awu during 13 June 2000-2 March 2003. Courtesy VSI.
| Date |
Deep Volcanic (A-type) |
Shallow Volcanic (B-type) |
Tectonic |
| 13 Jun-19 Jun 2000 |
21 |
-- |
161 |
| 25 Jul-30 Jul 2000 |
389 |
-- |
135 |
| 17 Oct 2002 |
3 |
-- |
-- |
| 20 Oct 2002 |
1 |
-- |
-- |
| 05 Nov 2002 |
1 |
-- |
-- |
| 07 Nov 2002 |
1 |
-- |
-- |
| 09 Nov-12 Nov 2002 |
~2/day |
-- |
-- |
| 11 Nov 2002 |
2 |
-- |
33 |
| 12 Nov 2002 |
2 |
-- |
28 |
| 13 Nov 2002 |
-- |
-- |
22 |
| 14 Nov 2002 |
-- |
-- |
23 |
| 15 Nov 2002 |
56 |
25 |
18 |
| 16 Nov 2002 |
2 |
12 |
26 |
| 17 Nov 2002 |
1 |
1 |
36 |
| 19 Nov-24 Nov 2002 |
12 |
5 |
129 |
| 23 Dec-29 Dec 2002 |
1 |
-- |
196 |
| 06 Jan-12 Jan 2003 |
4 |
-- |
161 |
| 13 Jan-19 Jan 2003 |
2 |
-- |
114 |
| 20 Jan-26 Jan 2003 |
3 |
-- |
151 |
| 27 Jan-02 Feb 2003 |
4 |
-- |
121 |
| 03 Feb-09 Feb 2003 |
5 |
-- |
125 |
| 10 Feb-16 Feb 2003 |
1 |
-- |
95 |
| 17 Feb-23 Feb 2003 |
2 |
-- |
155 |
During 14-16 October 2002, tremor was recorded and was followed by a felt tectonic earthquake with an amplitude of I-II MMI on 10 October. Soon after the tremor activity decreased, volcanic earthquakes began to be recorded (table 1). VSI reported a significant increase in seismicity during mid-November 2002; volcanic earthquakes that normally occurred less than five times per day occurred 81 times on 15 November. Activity decreased to normal levels by late 2002. Visual observations of the summit did not reveal significant changes. Volcanic earthquakes continued during January-early March 2003 (table 1). Awu remained at Alert Level 2 (on a scale of 1-4).
Geologic Background. The massive Gunung Awu stratovolcano occupies the northern end of Great Sangihe Island, the largest of the Sangihe arc. Deep valleys that form passageways for lahars dissect the flanks of the volcano, which was constructed within a 4.5-km-wide caldera. Powerful explosive eruptions in 1711, 1812, 1856, 1892, and 1966 produced devastating pyroclastic flows and lahars that caused more than 8000 cumulative fatalities. Awu contained a summit crater lake that was 1 km wide and 172 m deep in 1922, but was largely ejected during the 1966 eruption.
Information Contacts: Dali Ahmad, Volcanological Survey of Indonesia (VSI), Jalan Diponegoro No. 57, Bandung 40122, Indonesia (URL: http://www.vsi.esdm.go.id/).
Bezymianny
Russia
55.972°N, 160.595°E; summit elev. 2882 m
All times are local (unless otherwise noted)
26 July 2003 ash plume to 8-11 km altitude
According to visual observation from the city of Klyuchi by Yu. Demyanchuk, a large explosive eruption of Bezymianny began at 2120 on 26 July 2003; a later report from KVERT (Kamchatka Volcanic Eruptions Response Team) indicated that the eruption began at 2057. An ash plume rose up to 8-11 km and extended to the W, WNW, and SW. A large pyroclastic flow probably formed.
Prior to the eruption, a weak thermal anomaly was noted on satellite images from 6 July. Two shallow earthquakes of M 1.8 registered on 23 and 25 July.
Satellite data revealed plumes extending WNW at 2122 and 2300 on 26 July, to distances of 31 km and 86 km, respectively. Longer plumes were reported on 27 July to 192 km at 0305 and 217 km at 0445. At 1102 on 27 July, an 8-pixel thermal anomaly was observed with a temperature of 31°C on a background of 10°C. The ash cloud was ~250-300 km W of the vent. At 1258 that day a 5-pixel thermal anomaly was noted with a temperature of 50°C on a background of 35°C. The ash cloud was unchanged, and was also detected at 1325. At 1240 probable pyroclastic deposits were identified on the SE flank.
Satellite observations also noted that at 2058 on 27 July, a 10-pixel thermal anomaly yielded a temperature of 29°C on a background of 9°C. At 0246 on 28 July a 2-to 6-pixel thermal anomaly yielded a temperature of 33°C on a background of 5°C. At 2216 there was a 1-pixel thermal anomaly without accompanying ash. At 0246 and 0715 on 28 July, 2-to 6-pixel thermal anomalies were noted, with temperatures of 33° and 39°C on a background of 5° and 16°C, respectively. No ash was recorded for either event.
No seismicity was registered on 27-30 July, and no visual information was available because of meteorological clouds. Thermal anomalies of 1-to 3-pixels with a temperature of 16-25°C on backgrounds from -3° to 5° C, were observed on 28-29 July, 31 July, and 1 August. No seismicity was registered from 31 July-3 August, in part because of the seismicity due to a large volcanic tremor at nearby Klyuchevskoy. According to visual data, gas-steam plumes extended ~15 km to the NW on 2 August. Clouds obscured the volcano on other days.
Geologic Background. The modern Bezymianny, much smaller than its massive neighbors Kamen and Kliuchevskoi on the Kamchatka Peninsula, was formed about 4,700 years ago over a late-Pleistocene lava-dome complex and an edifice built about 11,000-7,000 years ago. Three periods of intensified activity have occurred during the past 3,000 years. The latest period, which was preceded by a 1,000-year quiescence, began with the dramatic 1955-56 eruption. This eruption, similar to that of St. Helens in 1980, produced a large open crater that was formed by collapse of the summit and an associated lateral blast. Subsequent episodic but ongoing lava-dome growth, accompanied by intermittent explosive activity and pyroclastic flows, has largely filled the 1956 crater.
Information Contacts: Olga Girina, Kamchatka Volcanic Eruptions Response Team (KVERT), a cooperative program of the Institute of Volcanic Geology and Geochemistry, Far East Division, Russian Academy of Sciences, Piip Ave. 9, Petropavlovsk-Kamchatsky, 683006, Russia, the Kamchatka Experimental and Methodical Seismological Department (KEMSD), GS RAS (Russia), and the Alaska Volcano Observatory (USA); Alaska Volcano Observatory (AVO), a cooperative program of the U.S. Geological Survey, 4200 University Drive, Anchorage, AK 99508-4667, USA (URL: http://www.avo.alaska.edu/), the Geophysical Institute, University of Alaska, PO Box 757320, Fairbanks, AK 99775-7320, USA, and the Alaska Division of Geological and Geophysical Surveys, 794 University Ave., Suite 200, Fairbanks, AK 99709, USA.
Chikurachki (Russia) — July 2003 Cite this Report
Chikurachki
Russia
50.324°N, 155.461°E; summit elev. 1781 m
All times are local (unless otherwise noted)
Infrequent observations suggest weaker eruptions continued in July 2003
The eruption of the Chikurachki volcano that began on 18 April 2003 continued into mid-July. Ash explosions, possibly up to 4 km above the crater, diminished, and by 3 July only rose up to 2 km above the crater. The volcano is remote, being ~60 km from Severo-Kurilsk on Paramushir Island. It also lacks seismic instruments, and the Kamchatka Volcanic Eruptions Response Team (KVERT) receives only occasional reports from Severo-Kurilsk.
According to a report from Leonid Kotenko of Severo-Kurilsk, ash explosions up to 500 m above the crater were observed from Shelekhov bay during 1930-2310 on 27 May. Ash plumes extended 70-80 km to the NE. At 0900 on 28 May, an ash plume rose 4 km above the crater and extended over 100 km to the NE. From 1030 on the same day, the plume heights decreased to 500 m above the crater. On 29 May, low-level ash plumes extended 15-20 km to the NE. In the afternoon of 29 May, an ash plume rose ~1.2 km above the crater, extended over Severo-Kurilsk, and ash fell on the town. Explosions occurred continually.
MODIS (moderate resolution imaging spectroradiometer) Terra and Aqua Goddard images from 1105 and 1235 on 30 May, depicted a faint, small ash cloud trending to the E. Clouds obscured the volcano on the other days in later May.
Kotenko reported on 6 June that the eruption continued. On 8 June, an ash plume extended 25-30 km to the SSE. On 9-10 June, the plume did not rise more than 500 m above the volcano and extended SSE. Ash fell on the Podgorny settlement, located at a distance of ~20 km SSE of the volcano. The observers from Shelekhov bay had noted more strong explosions during the night than in the day-time.
In the AVHRR (advanced very-high resolution radiometer) image at 1308 on 6 June, a narrow weak ash plume was observed extending to the SE for about 100 km from the volcano. In MODIS Goddard Terra images at 1100 on 8 June and at 1145 on 9 June, a narrow plume was seen extending to the SE for ~100 km. In the AVHRR image at 1245 on 9 June, this plume was also seen, but no ash was detected. Clouds obscured the volcano on the other days.
According to observers from Shelekhov settlement, on 15-16 June an ash plume was observed constantly at the volcano summit. The plume did not rise upwards, but was bent down the flanks of the volcano by a strong wind. On 17 June, observers saw a short gas-steam plume bent by a gale-force wind. On 18 June, Kotenko reported that the eruption continued. On other days, clouds obscured the volcano and prevented observation. According to the last report from Severo-Kurilsk, on 17-25 June, when the weather was good, fishermen from Shelekhovo bay observed only gas-steam activity from the volcano.
By 3 July, KVERT reported that the eruption of Chikurachki had possibly finished. According to satellite data from the USA and Russia, no activity of the volcano was noted from 25 June through 11 July.
Geologic Background. Chikurachki, the highest volcano on Paramushir Island in the northern Kuriles, is a relatively small cone constructed on a high Pleistocene edifice. Oxidized basaltic-to-andesitic scoria deposits covering the upper part of the young cone give it a distinctive red color. Frequent basaltic Plinian eruptions have occurred during the Holocene. Lava flows have reached the sea and formed capes on the NW coast; several young lava flows are also present on the E flank beneath a scoria deposit. The Tatarinov group of six volcanic centers is located immediately to the south, and the Lomonosov cinder cone group, the source of an early Holocene lava flow that reached the saddle between it and Fuss Peak to the west, lies at the southern end of the N-S-trending Chikurachki-Tatarinov complex. In contrast to the frequently active Chikurachki, the Tatarinov centers are extensively modified by erosion and have a more complex structure. Tephrochronology gives evidence of an eruption around 1690 CE from Tatarinov, although its southern cone contains a sulfur-encrusted crater with fumaroles that were active along the margin of a crater lake until 1959.
Information Contacts: Olga Girina, Kamchatka Volcanic Eruptions Response Team (KVERT), a cooperative program of the Institute of Volcanic Geology and Geochemistry, Far East Division, Russian Academy of Sciences, Piip Ave. 9, Petropavlovsk-Kamchatsky, 683006, Russia, the Kamchatka Experimental and Methodical Seismological Department (KEMSD), GS RAS (Russia), and the Alaska Volcano Observatory (USA); Alaska Volcano Observatory (AVO), a cooperative program of the U.S. Geological Survey, 4200 University Drive, Anchorage, AK 99508-4667, USA (URL: http://www.avo.alaska.edu/), the Geophysical Institute, University of Alaska, PO Box 757320, Fairbanks, AK 99775-7320, USA, and the Alaska Division of Geological and Geophysical Surveys, 794 University Ave., Suite 200, Fairbanks, AK 99709, USA.
Colima
Mexico
19.514°N, 103.62°W; summit elev. 3850 m
All times are local (unless otherwise noted)
Small explosions produced, including two on 17 July; absence of lava flows
Explosive activity at Colima continued in May and July 2003. A small explosive eruption reported at 1024 on 2 May 2003 produced an ash cloud visible on satellite imagery and monitoring cameras, but rising to no more than 500 m above the crater. The Mexico City Meteorological Watch Office stated that the plume moved SW of the summit at 5-10 knots (9-18 km/hour). The Washington VAAC described the plume as very small.
Nick Varley pointed out on 18 May that the GVP / USGS Weekly Volcanic Activity Report for 7-13 May 2003 incorrectly reported lava flows at Colima. He noted that "No lava has been produced since the beginning of March [2003]. The current activity comprises small explosions, on average some 25 per day, some containing ash. The dispersal of the ash is limited to approximately 7 km from the summit."
More significant explosions were reported on 17 July 2003. The first, at 0527, threw incandescent material 500 m high and an ash column to ~3 km height that blew SW . Small forest fires caused by the incandescent material 2.5-4 km SW of the crater suggested that the explosion was also directed to this sector. An explosion at 1400 on 17 July, produced an ash-laden cloud 1,000 m high, again dispersing SW. The seismic energy released by the 0527 explosion was reported to be less than half that released in the 1999 explosions.
Geologic Background. The Colima complex is the most prominent volcanic center of the western Mexican Volcanic Belt. It consists of two southward-younging volcanoes, Nevado de Colima (the high point of the complex) on the north and the historically active Volcán de Colima at the south. A group of late-Pleistocene cinder cones is located on the floor of the Colima graben west and east of the complex. Volcán de Colima (also known as Volcán Fuego) is a youthful stratovolcano constructed within a 5-km-wide scarp, breached to the south, that has been the source of large debris avalanches. Major slope failures have occurred repeatedly from both the Nevado and Colima cones, producing thick debris-avalanche deposits on three sides of the complex. Frequent recorded eruptions date back to the 16th century. Occasional major explosive eruptions have destroyed the summit (most recently in 1913) and left a deep, steep-sided crater that was slowly refilled and then overtopped by lava dome growth.
Information Contacts: Observatorio Vulcanologico de la Universidad de Colima, Colima, Col., 28045, México (URL: https://portal.ucol.mx/cueiv/); Nick Varley, Facultad de Ciencias, Universidad de Colima Av. 25 de Julio 965, Col. San Sebastian Apdo. postal 25, Colima, CP 28045, México.
Dieng Volcanic Complex (Indonesia) — July 2003 Cite this Report
Dieng Volcanic Complex
Indonesia
7.2°S, 109.879°E; summit elev. 2565 m
All times are local (unless otherwise noted)
Mud bubbling and outflows at Sileri crater that reached 50 m beyond crater rim
According to the Volcanological Survey of Indonesia (VSI), on 20 July 2003 mud poured from Sileri crater. The crater contains a lake and boiling mud pots, and has been the site of small-to-moderate historical eruptions. The incident of 20 July occurred at night and sent mud as far as 25 m S of the crater rim. On 21 July, a temperature measurement of the crater recorded 74°C, no striking increase from earlier measurements.
On the morning of 24 July, another mud outpouring from the crater covered an area up to 50 m N and E of the crater rim. Activity then continued with small areas of mud bubbling and ejecta thrown 1 m high at the middle of the crater. Neither of the mud-outpouring events were recorded on the seismometer 1.1 km S of the crater. The volcano's hazard status was raised to level 2 on 22 July.
Geologic Background. The Dieng plateau in the highlands of central Java is renowned both for the variety of its volcanic scenery and as a sacred area housing Java's oldest Hindu temples, dating back to the 9th century CE. The Dieng Volcanic Complex consists of multiple stratovolcanoes and more than 20 small Pleistocene-to-Holocene craters and cones over a 6 x 14 km area. Prahu stratovolcano was truncated by a large Pleistocene caldera, which was subsequently filled by a series of cones, lava domes, and craters, many containing lakes. Lava flows cover much of the plateau, but observed activity has been restricted to minor phreatic eruptions. Gas emissions are a hazard at several craters and have caused fatalities. There are abundant thermal features and high heat flow across the area.
Information Contacts: Dali Ahmad, Volcanological Survey of Indonesia (VSI), Jalan Diponegoro No. 57, Bandung 40122, Indonesia (URL: http://www.vsi.esdm.go.id/).
Gamalama (Indonesia) — July 2003 Cite this Report
Gamalama
Indonesia
0.81°N, 127.3322°E; summit elev. 1714 m
All times are local (unless otherwise noted)
Ashfall from 31 July eruption coats Ternate; pyroclastic flow
According to the Volcanological Survey of Indonesia (VSI), at 0300 on 31 July 2003, six type-A volcanic earthquakes were recorded. At 0600 the cloud issuing from the crater became thicker, but the gas pressure remained modest and similar to that normally seen. A series of explosive eruptions that began at 1434 sent a dark gray ash column 500-1,000 m high that drifted E toward Sultan Baabulah airport. A second explosion at 1625 produced a dark-gray ash column with strong gas pressure. The ash column rose 1-2 km above rim and drifted E carrying glowing material.
At 1627 a pyroclastic flow into Togorar valley on the NE flank traveled as much as 1 km but did not reach the village. A continuous blasting sound accompanied a series of ash emissions. Between 1704-1812, a dark gray ash column rose to 1,000-1,500 m, then during 1850-2200 a white-gray ash plume rose to 500 m. Several white gas plumes rose 10-150 m from 2209 through 0600 on 1 August. A steady glow was observed from 0200-0400.
After the initial outbursts, during 0000-1430 on 1 August, seismometers registered seven tectonic earthquakes, 16 shallow volcanic earthquakes, and two deep volcanic earthquakes. Continuous tremor also registered, with a maximum amplitude of 29-30 mm. Ashfall was 1-3 cm thick in the E part of the area, and some of the local population was evacuated.
According to local officials, Ternate (the regional capital, ~7 km E of Gamalama) was covered with thick ash. There were no reports of casualties or damage. The hazard status was set at level 3 starting at 1250 on 31 July and raised to the maximum, level 4, at 0000 the next day.
VSI reported that the last eruption occurred in 1996 from the main crater, followed by a pyroclastic flow to the E.
Geologic Background. Gamalama is a near-conical stratovolcano that comprises the entire island of Ternate off the western coast of Halmahera, and is one of Indonesia's most active volcanoes. The island was a major regional center in the Portuguese and Dutch spice trade for several centuries, which contributed to the extensive documentation of activity. Three cones, progressively younger to the north, form the summit. Several maars and vents define a rift zone, parallel to the Halmahera island arc, that cuts the volcano; the S-flank Ngade maar formed after about 14,500–13,000 cal. BP (Faral et al., 2022). Eruptions, recorded frequently since the 16th century, typically originated from the summit craters, although flank eruptions have occurred in 1763, 1770, 1775, and 1962-63.
Information Contacts: Dali Ahmad, Volcanological Survey of Indonesia (VSI), Jalan Diponegoro No. 57, Bandung 40122, Indonesia (URL: http://www.vsi.esdm.go.id/).
Kanlaon (Philippines) — July 2003 Cite this Report
Kanlaon
Philippines
10.412°N, 123.132°E; summit elev. 2435 m
All times are local (unless otherwise noted)
1-km-high plume of ash-laden steam on 10-11 July 2003
Ash ejections were reported at Canlaon (also spelled Kanlaon) on 10 and 11 July 2003. At 1735 on 10 July a column of ash-laden steam, described as a moderate to strong dirty white color, was seen rising from the volcano to a height of 1 km by observers in Kanlaon City. The cloud drifted to the NW, SW, and NE, with an area within a 4-km radius from the crater affected by ashfall. The explosion registered as a low-frequency volcanic earthquake. Prior to this activity, two low-frequency volcanic earthquakes and two low-frequency short-duration harmonic tremors were recorded by the seismograph at Kanlaon Volcano Station. The phreatic activity continued as of 2000 that night.
Two ash ejections were reported on 11 July, from 0620 to 0624 and 0658 to 0705. Dirty white steam rose up to 1.3 km above the crater and drifted to the SW. The seismic network recorded six low-frequency volcanic earthquakes and three low-frequency short-duration harmonic tremors.
The alert status remained at Level 1 and PHIVOLCS reiterated its warning to the public not to venture within the 4 km radius Permanent Danger Zone.
Geologic Background. Kanlaon volcano (also spelled Canlaon) forms the highest point on the island of Negros, Philippines. The massive andesitic stratovolcano is covered with fissure-controlled pyroclastic cones and craters, many of which are filled by lakes. The largest debris avalanche known in the Philippines traveled 33 km SW from Kanlaon. The summit contains a 2-km-wide, elongated northern caldera with a crater lake and a smaller but higher active vent, Lugud crater, to the south. Eruptions recorded since 1866 have typically consisted of phreatic explosions of small-to-moderate size that produce minor local ashfall.
Information Contacts: Philippine Institute of Volcanology and Seismology (PHIVOLCS), Department of Science and Technology, PHIVOLCS Building, C.P. Garcia Avenue, Univ. of the Philippines Campus, Diliman, Quezon City, Philippines (URL: http://www.phivolcs.dost.gov.ph/).
Karangetang (Indonesia) — July 2003 Cite this Report
Karangetang
Indonesia
2.781°N, 125.407°E; summit elev. 1797 m
All times are local (unless otherwise noted)
June 2003 ash plumes and two lava avalanches
Karangetang was the scene of volcanic and seismic unrest during early June 2003. The volcano produced ash plumes up to 400 m high and two lava avalanches.
In reports from the Volcanological Survey of Indonesia (VSI), activity for the week of 2-8 June 2003 was characterized by emissions of white-to-dark gray colored ash from the S crater, rising to 400 m. Observers at night noted a red glow up to 25 m over the crater. In the N crater, a white-colored gas emission rose to 150 m. During this week, a lava avalanche that occurred in the direction of the Batang river reached as far as 1000 m from the crater. There was a decrease in multiphase earthquakes compared to the previous week, but an increase in shallow volcanic earthquakes.
During the week of 9-15 June, white-colored gas emissions came from both the N and the S craters. Observers at night noted a continued red glow up to 25 m over the crater. Another lava avalanche occurred, this time traveling in the direction of the Beha river as far as 1000 m and toward the Batu Awang river as far as 250 m from the crater. There were increases in volcanic earthquakes and avalanche events.
The seismic record for 2-8 June suggested 11 deep volcanic earthquakes, 348 shallow volcanic earthquakes, 233 multiphase earthquakes, 46 emission earthquakes, 110 avalanches, and 26 tectonic earthquakes. The seismic record for 9-15 June noted 32 deep volcanic earthquakes, 438 shallow volcanic earthquakes, one explosion event, 228 multiphase earthquakes, 21 emission earthquakes, 447 avalanches, and 20 tectonic events. The volcano remained at alert level 2 (on a scale reaching a maximum of 4).
Geologic Background. Karangetang (Api Siau) volcano lies at the northern end of the island of Siau, about 125 km NNE of the NE-most point of Sulawesi. The stratovolcano contains five summit craters along a N-S line. It is one of Indonesia's most active volcanoes, with more than 40 eruptions recorded since 1675 and many additional small eruptions that were not documented (Neumann van Padang, 1951). Twentieth-century eruptions have included frequent explosive activity sometimes accompanied by pyroclastic flows and lahars. Lava dome growth has occurred in the summit craters; collapse of lava flow fronts have produced pyroclastic flows.
Information Contacts: Dali Ahmad and Nia Haerani, Volcanological Survey of Indonesia (VSI), Jalan Diponegoro No. 57, Bandung 40122, Indonesia (URL: http://www.vsi.esdm.go.id/).
Karymsky
Russia
54.049°N, 159.443°E; summit elev. 1513 m
All times are local (unless otherwise noted)
May-July ash plumes; affiliated seismicity and satellite thermal anomalies
Dark ash was observed on the NE, SE, and W flanks of the volcano on 30 May in a MODIS (moderate resolution imaging spectroradiometer) Terra image. Intermittent explosive eruptive activity at Karymsky occurred from early June into mid-August 2003, with seismic activity above background levels. Between 90 and 270 local shallow events occurred per day. The character of the seismicity indicated that ash-and-gas explosions to heights of 1,000-2,000 m above the volcano (2,500-3,500 m altitude) and gas blow-outs possibly occurred. On the morning of 17 July a strong, long duration (86 minutes), seismic event occurred that possibly resulted from a large pyroclastic flow or the onset of a new lava emission. Satellite data confirmed the continuing activity (table 3).
Table 3. Thermal anomalies at Karymsky from AVHHR (advanced very-high resolution radiometer) satellite images and visual observation during June and July 2003. Courtesy Kamchatka Volcanic Eruptions Response Team (KVERT).
| Date(s) |
Thermal Anomaly (pixels) |
Comments |
| 03 Jun 2003 |
2 (faint) |
No ash plume observed |
| 22-24 Jun 2003 |
1-4 |
-- |
| 27 Jun 2003 |
-- |
Short narrow plume to NE |
| 28-30 Jun 2003 |
1-4 |
-- |
| 04, 06-09 Jul 2003 |
1-4 |
-- |
| 14-15 Jul 2003 |
2-3 |
-- |
| 13, 16 Jul 2003 |
2-5 |
No ash plumes observed |
| 19 Jul 2003 |
-- |
Ash plume to SW |
| 25, 27-29 Jul 2003 |
1-3 |
-- |
Geologic Background. Karymsky, the most active volcano of Kamchatka's eastern volcanic zone, is a symmetrical stratovolcano constructed within a 5-km-wide caldera that formed during the early Holocene. The caldera cuts the south side of the Pleistocene Dvor volcano and is located outside the north margin of the large mid-Pleistocene Polovinka caldera, which contains the smaller Akademia Nauk and Odnoboky calderas. Most seismicity preceding Karymsky eruptions originated beneath Akademia Nauk caldera, located immediately south. The caldera enclosing Karymsky formed about 7600-7700 radiocarbon years ago; construction of the stratovolcano began about 2000 years later. The latest eruptive period began about 500 years ago, following a 2300-year quiescence. Much of the cone is mantled by lava flows less than 200 years old. Historical eruptions have been vulcanian or vulcanian-strombolian with moderate explosive activity and occasional lava flows from the summit crater.
Information Contacts: Olga Girina, Kamchatka Volcanic Eruptions Response Team (KVERT), a cooperative program of the Institute of Volcanic Geology and Geochemistry, Far East Division, Russian Academy of Sciences, Piip Ave. 9, Petropavlovsk-Kamchatsky, 683006, Russia, the Kamchatka Experimental and Methodical Seismological Department (KEMSD), GS RAS (Russia), and the Alaska Volcano Observatory (USA); Alaska Volcano Observatory (AVO), a cooperative program of the U.S. Geological Survey, 4200 University Drive, Anchorage, AK 99508-4667, USA (URL: http://www.avo.alaska.edu/), the Geophysical Institute, University of Alaska, PO Box 757320, Fairbanks, AK 99775-7320, USA, and the Alaska Division of Geological and Geophysical Surveys, 794 University Ave., Suite 200, Fairbanks, AK 99709, USA.
Klyuchevskoy (Russia) — July 2003 Cite this Report
Klyuchevskoy
Russia
56.056°N, 160.642°E; summit elev. 4754 m
All times are local (unless otherwise noted)
Gas-and-steam plumes June-August with occassional ash plumes
Eruptions continued at Kliuchevskoi during late 2002 through mid-2003, with typical plume heights estimated at several hundred meters and occasionally reaching ~2 km above the volcano (eg., early July and August 2003). Above-background seismicity prevailed during most or all the reporting interval.
The volcano (also spelled Klyuchevskoy) was last reported on in BGVN 28:02, and vol. 27, no. 11, issues discussing events through 4 March 2003. This report relies heavily on tabled data to convey observations from as far back as 3 December 2002, providing some further details during the 3 December-4 March 2003 interval of overlap with the earlier reports. The source reports came from the Kamchatkan Volcanic Eruption Response Team (KVERT) and were communicated via the Alaska Volcano Observatory (AVO). Table 9 summarizes recent plume observations, while table 10 summarizes recent earthquake and intermittent spasmodic volcanic tremor, basically above-background seismicity affiliated with ongoing eruptive unrest.
Table 9. Plumes visible at Kliuchevskoi during December 2002 through mid-April 2003. Courtesy KVERT.
| Date |
Plume details |
| 30 Nov-2 and 4 Dec 2002 |
Gas-and-steam plumes rose 100-400 m above crater and extended 10 km SE, E, W, and N. |
| 03 Dec 2002 |
Gas-and-steam plumes rose ~1,300 m above crater and extended N and NE (NNE ~15 km from Russian satellite data). |
| 05, 09, 12 Dec 2002 |
Gas-and-steam plumes rose ~100 m above crater and extended 3-10 km E and SE. |
| 10-11 Dec 2002 |
Gas-and-steam plumes rose ~1,500 m above crater and extended N and NE. |
| 13-16, 18 Dec 2002 |
Gas-and-steam plumes rose ~100-800 m above crater and extended 5-10 km E and SE. |
| 17, 19 Dec 2002 |
Gas-and-steam plumes rose ~1,000-1,500 m above crater and extended 10 km E. |
| 19, 21, 23 Dec 2002 |
Gas-and-steam plumes rose ~1,000-2,000 m above crater and extended to E, S, and N. |
| 24 Dec 2002 (0100 UTC) |
Gas-and-ash explosion rose ~4,000 m above crater and plume extended WSW. |
| 04 Jan 2003 (2125 UTC) |
Gas-and-steam plume rose ~1,000 m above crater and extended 20 km NE. |
| 05, 07, 09 Jan 2003 |
Gas-and-steam plumes rose 10 m above crater. |
| 08 Jan 2003 |
Gas-and-steam plumes rose 1,000 m above crater. |
| 11-13, 15 Jan 2003 |
Gas-and-steam plumes rose 50-300 m above crater (very narrow plume extended 30-50 km NNE from US satellite data). |
| 24, 27 Jan 2003 |
Gas-and-steam plumes rose 1,000 m above crater and extended 10 km NE (24 Jan) and SE (27 Jan). |
| 25-26, 28-29 Jan 2003 |
Gas-and-steam plumes rose 100-300 m above crater. |
| 01-03 Feb 2003 |
Gas-and-steam plumes rose 100-300 m above crater (extended 30 km NNE from Russian satellite data). |
| 04 Feb 2003 |
Gas-and-steam plumes rose 1,300 m above crater and extended 10 km NE. |
| 09 Feb 2003 |
Gas-and-steam plumes rose 1,500 m above crater and extended 10 km N. |
| 10 Feb 2003 |
Narrow gas-and-steam plume extending 25 km N. |
| 11, 13, 18-19 Feb 2003 |
Gas-and-steam plumes rose 50 m above crater. |
| 15-17 Feb 2003 |
Gas-and-steam plumes rose 1,000 m above crater. |
| 22-26 Feb 2003 |
Gas-and-steam plumes rose 200 m above crater. |
| 23 Feb 2003 |
Gray sector (perhaps ash deposits) showed up on MODIS satellite data from Russia on the SE part of summit. |
| 05 Mar 2003 |
Gas-and-steam plumes rose 300 m above crater. |
| 10-13 Mar 2003 |
Gas-and-steam plumes rose 50 m above crater. |
| 16 Mar 2003 |
Gas-and-steam plumes extended 25-40 km W (from US and Russian satellite data). |
| 18-19 Mar 2003 |
Gas-and-steam plumes rose 700-1,500 m above crater (extended less than 30 km W on 19 Mar, from US and Russian satellite data). |
| 21-22 and 24-25 Mar 2003 |
Gas-and-steam plumes rose up to 300-1,000 m above crater and and extended 5-30 km in all directions (extended 30 km NNW on 21 Mar and 100 km NNE on 24 Mar, from US and Russian satellite data). |
| 22 Mar 2003 |
Gas-and-steam explosions with ash-poor plumes that rose up to 200 m above the crater. |
| 28-30 Mar, 02 Apr 2003 |
Gas-and-steam plumes rose up to 50-300 m above crater and extended in all directions 5-20 km (10 km NW on 28 Mar, from US and Russian satellite data). |
| 05 Apr 2003 |
Gas-and-steam plumes rose up to 300 m above crater and extended 10 km E. |
| 07 Apr 2003 |
Weak fumarolic activity observed. |
| 15-16 Apr 2003 |
Series of ash plumes rose up to 300 m above crater and extended 10 km E. |
Table 10. Earthquakes and intermittent spasmodic volcanic tremor registered at Kliuchevskoi during December 2002 through mid-April 2003. Courtesy of KVERT.
| Date |
Earthquakes per day (~30 km depth) |
Intermittent tremor (in terms of geophone velocity) |
| 28 Nov-01 Dec 2002 |
8-13 |
~0.8 x 10⁻⁶ m/s. |
| 02-04 Dec 2002 |
24-33 |
~0.8 x 10⁻⁶ m/s. |
| 05-12 Dec 2002 |
12-24 |
~0.5-0.7 x 10⁻⁶ m/s. |
| 13-19 Dec 2002 |
6-12 |
0.5-0.7 x 10⁻⁶ m/s. |
| 19-25 Dec 2002 |
6-9 |
~0.6-0.7 x 10⁻⁶ m/s. |
| 24 Dec 2002 |
-- |
Gas-and-ash explosion at 0010 UTC. |
| 03-04 Jan 2003 |
9, 10 |
~0.5-0.7 x 10⁻⁶ m/s. |
| 05-09 Jan 2003 |
10-13; one M 1.75 earthquake |
Increased from 0.55 x 10⁻⁶ m/s on 5-7 Jan to 0.7 x 10⁻⁶ m/s on 8 Jan. |
| 10-12 Jan 2003 |
12-18 |
0.4-0.75 x 10⁻⁶ m/s. |
| 13-15 Jan 2003 |
33-35 |
0.4-0.75 x 10⁻⁶ m/s. |
| 16-23 Jan 2003 |
-- |
0.4-0.6 x 10⁻⁶ m/s. |
| 16-19 Jan 2003 |
Increased from 44 to 90 |
-- |
| 20-22 Jan 2003 |
Gradually decreased from 35 to 21 |
-- |
| 24-31 Jan 2003 |
10-22; 18 M 1.25 earthquakes |
0.3-0.5 x 10⁻⁶ m/s. |
| 01-06 Feb 2003 |
16-39; 15 M 2.0-2.2 earthquakes |
0.4-0.6 x 10⁻⁶ m/s. |
| 01 Feb 2003 |
-- |
1.26 x 10⁻⁶ m/s from 0311 to 2400 UTC. |
| 06-12 Feb 2003 |
17-30; 17 M 2.0-2.1 earthquakes |
0.5-0.7 x 10⁻⁶ m/s. |
| 13-20 Feb 2003 |
14-81; six M 2.0-2.2 earthquakes |
0.4-0.7 x 10⁻⁶ m/s (on 14 Feb, continuous tremor increased to 0.9 x 10⁻⁶ m/s). |
| 20-27 Feb 2003 |
10-14; 16 M 2.0-2.2 earthquakes |
0.4-0.6 x 10⁻⁶ m/s (from 1140 UTC 26 Feb, continuous tremor increased to 0.95 x 10⁻⁶ m/s). |
| 28 Feb-06 Mar 2003 |
5-11; three M 2.0-2.2 earthquakes |
0.5-0.8 x 10⁻⁶ m/s. |
| 06-13 Mar 2003 |
6-11; 12 M 2.0-2.2 earthquakes |
0.5-0.8 x 10⁻⁶ m/s (6-9 Mar) |
| 10-13 Mar 2003 |
-- |
1.1-1.3 x 10⁻⁶ m/s. |
| 13-20 Mar 2003 |
7-9; seven M 2.0-2.1 earthquakes |
0.5-1.5 x 10⁻⁶ m/s. |
| 14 Mar 2003 |
-- |
1.5 x 10⁻⁶ m/s. |
| 20-24 Mar 2003 |
6-9 |
-- |
| 20-26 Mar 2003 |
26 on 25 Mar, 41 on 26 Mar; 16 M 2.0-2.2 earthquakes |
1.0-2.8 x 10⁻⁶ m/s. |
| 28 Mar-03 Apr 2003 |
24-63 |
0.7-1.4 x 10⁻⁶ m/s. |
| 04-10 Apr 2003 |
10-15; 14 M 2.0-2.2 earthquakes |
1.5-3.7 x 10⁻⁶ m/s. |
| 15 Apr 2003 |
~70 |
Up to 4.0 x 10⁻⁶ m/s. |
Unrest continued during June 2003. Seismicity was above background and continuous spasmodic volcanic tremor tended to increase slowly and consistently. Earthquakes, both at 30 km and shallow depths, continued to register. The character of seismicity also indicated that weak gas-ash explosions possibly occurred. Table 11 summarizes thermal observations.
Table 11. Kliuchevskoi thermal anomalies and plumes observed via Russian and United States satellites, 2 June-11 August 2003. Courtesy of KVERT.
| Date |
Thermal Anomaly (pixels) |
Comments |
| 02 Jun 2003 |
-- |
Gas-and-steam plume rose 400 m above volcano. |
| 03 Jun 2003 |
3 |
-- |
| 06-07 Jun 2003 |
-- |
Ash-poor plume extending S 30-80 km; explosions sent ash-gas plumes to 50-500 m above volcano. |
| 07-08 Jun 2003 |
weak |
-- |
| 09 Jun 2003 |
-- |
Ash on NNE flank. |
| 13, 16, 19 Jun 2003 |
1-4 |
Four-pixel anomaly with max temp of 46°C in a background of -1°C; ash-poor plumes 50-500 m above volcano. |
| 23 Jun 2003 |
3 |
Possible ash deposits on SE flank; gas-and-steam plumes to 50-700 m above volcano. |
| 28 Jun, 02 Jul 2003 |
3 |
Ash-poor plumes to 100 m above volcano); separate and continuous ash plumes to 1,000 m above volcano; plumes extended to E. |
| 04-06 Jul 2003 |
1-2 |
Gas-and-steam with ash-poor plume extending 100 km to ESE; separate ash explosions to 2,000 m above volcano. |
| 15-16 Jul 2003 |
1-2 |
Separate or series ash explosions to 1,000 m above volcano; strong ash explosions to 2,000 m above volcano. |
| 20-24 Jul 2003 |
1-4 |
Gas-and-steam plumes rose from 100-1,000 m above volcano and extended 15 km to SW. |
| 27-29 Jul,01 Aug 2003 |
1-4 |
Temperature from 12 to 50°C in a background of -5 to 20°C; gas and steam plumes rose 500-700 m and extended 5 km SW. |
| 01, 04-07 Aug 2003 |
2-6 |
Gas-and-steam plumes rose 800-2,000 m above volcano and extended to NW and, later, S. |
| 09, 11 Aug 2003 |
2-3 |
-- |
Geologic Background. Klyuchevskoy (also spelled Kliuchevskoi) is Kamchatka's highest and most active volcano. Since its origin about 6000 years ago, the beautifully symmetrical, 4835-m-high basaltic stratovolcano has produced frequent moderate-volume explosive and effusive eruptions without major periods of inactivity. It rises above a saddle NE of sharp-peaked Kamen volcano and lies SE of the broad Ushkovsky massif. More than 100 flank eruptions have occurred during the past roughly 3000 years, with most lateral craters and cones occurring along radial fissures between the unconfined NE-to-SE flanks of the conical volcano between 500 m and 3600 m elevation. The morphology of the 700-m-wide summit crater has been frequently modified by historical eruptions, which have been recorded since the late-17th century. Historical eruptions have originated primarily from the summit crater, but have also included numerous major explosive and effusive eruptions from flank craters.
Information Contacts: Olga Girina, Kamchatka Volcanic Eruptions Response Team (KVERT), a cooperative program of the Institute of Volcanic Geology and Geochemistry, Far East Division, Russian Academy of Sciences, Piip Ave. 9, Petropavlovsk-Kamchatsky, 683006, Russia, the Kamchatka Experimental and Methodical Seismological Department (KEMSD), GS RAS (Russia), and the Alaska Volcano Observatory (USA); Alaska Volcano Observatory (AVO), a cooperative program of the U.S. Geological Survey, 4200 University Drive, Anchorage, AK 99508-4667, USA (URL: http://www.avo.alaska.edu/), the Geophysical Institute, University of Alaska, PO Box 757320, Fairbanks, AK 99775-7320, USA, and the Alaska Division of Geological and Geophysical Surveys, 794 University Ave., Suite 200, Fairbanks, AK 99709, USA.
Krakatau (Indonesia) — July 2003 Cite this Report
Krakatau
Indonesia
6.1009°S, 105.4233°E; summit elev. 285 m
All times are local (unless otherwise noted)
Foggy weather and low seismicity
According to reports from the Volcanological Survey of Indonesia (VSI), no visual observations were made this month due to foggy weather. The volcano remained at alert level 2 for the month. They also noted that relatively few volcanic and tectonic earthquakes were recorded during the weeks of 2-8 and 9-15 June 2003. Specifically, the 2-8 June record consisted of 9 deep volcanic earthquakes, 19 shallow volcanic earthquakes, and 5 tectonic earthquakes; the record of 9-15 June consisted of 6 deep volcanic earthquakes, 17 shallow volcanic earthquakes, and 4 tectonic earthquakes.
In the week of 16-22 June, a significant increase in shallow volcanic earthquakes was observed, although no tectonic earthquakes were recorded. The sesimic record for that week showed 11 deep volcanic earthquakes and 63 shallow volcanic earthquakes. Both volcanic and tectonic earthquakes were recorded for the week of 23-29 June, with 7 deep volcanic earthquakes, 61 shallow volcanic earthquakes, and 2 tectonic earthquakes detected.
Geologic Background. The renowned Krakatau (frequently mis-named as Krakatoa) volcano lies in the Sunda Strait between Java and Sumatra. Collapse of an older edifice, perhaps in 416 or 535 CE, formed a 7-km-wide caldera. Remnants of that volcano are preserved in Verlaten and Lang Islands; subsequently the Rakata, Danan, and Perbuwatan cones were formed, coalescing to create the pre-1883 Krakatau Island. Caldera collapse during the catastrophic 1883 eruption destroyed Danan and Perbuwatan, and left only a remnant of Rakata. This eruption caused more than 36,000 fatalities, most as a result of tsunamis that swept the adjacent coastlines of Sumatra and Java. Pyroclastic surges traveled 40 km across the Sunda Strait and reached the Sumatra coast. After a quiescence of less than a half century, the post-collapse cone of Anak Krakatau (Child of Krakatau) was constructed within the 1883 caldera at a point between the former Danan and Perbuwatan cones. Anak Krakatau has been the site of frequent eruptions since 1927.
Information Contacts: Dali Ahmad and Nia Haerani, Volcanological Survey of Indonesia (VSI), Jalan Diponegoro No. 57, Bandung 40122, Indonesia (URL: http://www.vsi.esdm.go.id/).
Leroboleng (Indonesia) — July 2003 Cite this Report
Leroboleng
Indonesia
8.365°S, 122.833°E; summit elev. 1095 m
All times are local (unless otherwise noted)
June-July ash plumes reported by pilots may be the first eruptions in 122 years
The Darwin Volcanic Ash Advisory Center (VAAC) provided a series of pilot reports on Leroboleng. Confirmation from observers on the ground are pending.
At 1038 on 26 June 2003 aviators reportedly saw an ash plume rise to ~1.8 km altitude. An aircraft crew advised that the activity appeared to be increasing. Ash was not visible on satellite imagery. Another report stated that an ash plume was visible above Leroboleng at 1606 on 14 July at ~2.5 km altitude. Ash was not visible on satellite imagery and at that time VSI personnel could not observe the volcano. An alleged eruption on 29 July at 0900 lasted 10 minutes and sent an ash cloud to ~7.3 km altitude.
Geologic Background. Leroboleng volcano, also known as Lereboleng or Lewono, lies at the eastern end of a 4.5-km-long, WSW-ESE-trending chain of three volcanoes straddling a narrow peninsula in NE Flores Island. The summit of Gunung Leroboleng contains 29 small fissure-controlled craters, two containing lakes. A small lava dome occupies one of the craters. Most of the craters originated along three N-S-trending fissures immediately east of the summit of the volcano. The largest crater, 250-m-wide Ili Gelimun, is located SSE of the summit and fed lava flows from a lower south-flank vent. Explosive eruptions were reported from Burak crater during the 19th century.
Information Contacts: Darwin Volcanic Ash Advisory Centre (VAAC), Bureau of Meteorology, Northern Territory Regional Office, PO Box 40050, Casuarina, NT 0811, Australia (URL: http://www.bom.gov.au/info/vaac/).
Cerro Negro (Nicaragua) — July 2003 Cite this Report
Cerro Negro
Nicaragua
12.506°N, 86.702°W; summit elev. 728 m
All times are local (unless otherwise noted)
Slumbering volcano yields uneventful seismic and fumarolic temperature data
Seismic activity has been monitored at Cerro Negro for the past 15 months. From April 2002 seismicity remained low with eight earthquakes registered in May and June. Earthquake activity was moderate in August (32), September (28), and October (28); no earthquakes were registered in November or December. Activity increased again in January 2003, when 91 tectonic events were registered. Activity dropped in February to 14 tectonic events but increased again in March (44 tectonic earthquakes, two of which were located underneath Cerro Negro), April (45), and May (41 volcano-tectonic earthquakes). Tremors remained low (5 RSAM units).
Gas emissions and fumarole temperatures measured by hand-held infrared instrument (table 3) were also monitored over this period. A visit on 12 April 2002 by Pedro Perez of INETER, Eliecer Duarte and Eric Fernandez of OVSICORI-UNA, Costa Rica, and Franco Tassi and Orlando Vaselli of the University of Florence, Italy, found that fumarole temperatures were down from February. Monthly visits to the volcano started in June 2002.
Table 3. Temperatures (°C) of fumaroles (identified by number) at Cerro Negro, June 2002-May 2003. Fumaroles 2-4 are in the crater formed in 1995. Courtesy of INETER.
| Date |
Fumarole 1 |
Fumarole 2 |
Fumarole 3 |
Fumarole 4 |
Fumarole 6 |
Fumarole 7 |
Fumarole 8 |
| 05 Jun 2002 |
252 |
-- |
-- |
-- |
-- |
-- |
-- |
| 28 Aug 2002 |
255 |
-- |
-- |
-- |
-- |
184 |
189 |
| 09 Sep 2002 |
257 |
-- |
-- |
-- |
175 |
184 |
189 |
| 18 Oct 2002 |
326 |
-- |
-- |
-- |
157 |
223 |
188 |
| 21 Nov 2002 |
475 |
564 |
245 |
475 |
-- |
-- |
-- |
| 22 Nov 2002 |
448 |
479 |
200 |
207 |
-- |
-- |
-- |
| 05 Dec 2002 |
403 |
508 |
385 |
208 |
-- |
-- |
316 / 278 |
| 09 Jan 2003 |
402 |
486 |
494 |
402 |
-- |
-- |
-- |
| 10 Feb 2003 |
402 |
486 |
494 |
402 |
-- |
-- |
-- |
| 21 Mar 2003 |
468 |
-- |
-- |
-- |
-- |
-- |
-- |
| 04 Apr 2003 |
388 |
-- |
-- |
-- |
-- |
-- |
-- |
| 03 May 2003 |
399 |
78.6 |
226 |
-- |
239 |
203 |
255 |
On 5 June, following heavy rain, steam was observed exiting the fissure SE of the volcano. Observations on 18 July noted abundant gas emissions at all fumaroles and a strong scent of sulfur around the entire crater. Emissions continued on the SE fissure and in Este del Cerro La Mula. On 28 August, Perez observed gas emissions at fumarole 4 and a continued sulfur odor. Falling rocks were observed in the inner crater. Few gas emissions were observed on 9 September and 18 October, but the strong scent of sulfur persisted. No landslides were observed. Gas emissions were observed at the fumaroles of Este del Cerro La Mula with greater abundance than in previous months.
Perez visited again on 21 November and during 25-27 November, accompanied by Matthias Frische, Kris Garofalo, Thor Hansten, and Boo Gall (GEOMAR Germany). The maximum measured temperature in the new crater was 564°C and for fumarole 1 of the old crater the temperature was 334°C.
The sampling that began in November continued in the following months. On 5 December temperatures continued to be high in the cone formed in 1995. The maximum fumarole temperature on the new cone was 494°C. The visit on 10 February included more sampling, but no physical change was observed at the volcano. Recorded temperatures did not vary from those made in January. Temperature measurements at fumarole 1 on 21 March 2003 revealed an increase of 66°C from February. On 30 and 31 March there was a slight increase of 20 RSAM units and officials observed the volcano for several hours, witnessing no anomolies. On 4 April more temperature measurements and gas sampling were performed and rock was noted to be loosening in fumarole 4. On 3 May the temperatures of the fumaroles located within the crater were constant with respect to the previous months, with the exception of fumarole 6, which had an increase of 100°C. Strong gas emissions were observed in parts of the inner crater.
Geologic Background. Nicaragua's youngest volcano, Cerro Negro, was created following an eruption that began in April 1850 about 2 km NW of the summit of Las Pilas volcano. It is the largest, southernmost, and most recent of a group of four youthful cinder cones constructed along a NNW-SSE-trending line in the central Marrabios Range. Strombolian-to-subplinian eruptions at intervals of a few years to several decades have constructed a roughly 250-m-high basaltic cone and an associated lava field constrained by topography to extend primarily NE and SW. Cone and crater morphology have varied significantly during its short eruptive history. Although it lies in a relatively unpopulated area, occasional heavy ashfalls have damaged crops and buildings.
Information Contacts: Pedro Perez, Armando Saballos, and Aduardo Mayorga, Instituto Nicaragüense de Estudios Territoriales (INETER), Apartado 1761, Managua, Nicaragua (URL: http://www.ineter.gob.ni/).
Papandayan (Indonesia) — July 2003 Cite this Report
Papandayan
Indonesia
7.32°S, 107.73°E; summit elev. 2665 m
All times are local (unless otherwise noted)
After the explosions of November 2002, seismicity and eruptions waned
On 11 November 2002, ash eruptions occurred at Papandayan (BGVN 27:11 and figure 8). Subsequently, seismic and eruptive activity waned, although gas emission continued (ending 4 May 2003). Lessening seismicity and volcanism in January 2003 resulted in a reduction of the hazard status from 3 to 2 (on a scale of 1 to 4, where 4 is the highest). Reduction in the activity continued through the beginning of May 2003 at which time the Volcanological Survey of Indonesia (VSI) terminated its weekly reporting on Papandayan.
During December 2002, white-gray ash plume was emitted continually from Baru crater and rose 150-400 m to the NE. [After the week of 16-22 December only gas plumes were emitted (described as "white ash emission").] As the activity level reduced (table 2) the typical height of the plume dropped from 150-400 m during December and early January 2003 to 75-250 m by late-January.
Table 2. Weekly seismic events at Papandayan from 2 December 2002 to 4 May 2003. Courtesy of VSI.
| Date |
Deep |
Shallow |
Tectonic |
Avalanches |
| 02 Dec-08 Dec 2002 |
9 |
10 |
17 |
-- |
| 09 Dec-15 Dec 2002 |
1 |
25 |
-- |
-- |
| 16 Dec-22 Dec 2002 |
1 |
20 |
21 |
-- |
| 23 Dec-29 Dec 2002 |
3 |
16 |
12 |
-- |
| 30 Dec-05 Jan 2003 |
28 |
42 |
29 |
-- |
| 06 Jan-12 Jan 2003 |
11 |
21 |
33 |
7 |
| 13 Jan-19 Jan 2003 |
7 |
11 |
16 |
12 |
| 20 Jan-26 Jan 2003 |
14 |
30 |
29 |
-- |
| 27 Jan-02 Feb 2003 |
8 |
25 |
30 |
-- |
| 03 Feb-09 Feb 2003 |
3 |
18 |
12 |
1 |
| 10 Feb-16 Feb 2003 |
-- |
14 |
18 |
2 |
| 17 Feb-23 Feb 2003 |
3 |
24 |
17 |
3 |
| 24 Feb-02 Mar 2003 |
2 |
1 |
3 |
-- |
| 03 Mar-09 Mar 2003 |
-- |
1 |
-- |
7 |
| 10 Mar-16 Mar 2003 |
1 |
10 |
16 |
-- |
| 17 Mar-23 Mar 2003 |
2 |
8 |
24 |
-- |
| 24 Mar-30 Mar 2003 |
2 |
10 |
14 |
-- |
| 31 Mar-06 Apr 2003 |
3 |
15 |
33 |
-- |
| 07 Apr-13 Apr 2003 |
1 |
8 |
9 |
-- |
| 14 Apr-20 Apr 2003 |
2 |
12 |
16 |
-- |
| 21 Apr-27 Apr 2003 |
8 |
5 |
23 |
-- |
| 28 Apr-04 May 2003 |
2 |
7 |
3 |
-- |
Two explosions occurred at 0700 on 4 December and at 1758 on 8 December 2002, and another occurred at 1758 on 12 December. During the week of 2-8 December, shallow volcanic earthquakes decreased, while deep volcanic and tectonic earthquakes increased. During the subsequent week, shallow earthquakes increased, while deep earthquakes decreased (table 2). Insignificant lahars occurred at Cibeureum Gede and Ciparugpug rivers at 1600 on 13 December and at 1700 on 14 December. The movement of stepped landslides on the wall of Nangklak crater were recorded on the seismograph throughout most of December; the last landslide occurred at 1154 on 21 December. The hazard level was reduced to 2 by the week of 13-19 January 2003.
Geologic Background. Papandayan is a complex stratovolcano with four large summit craters, the youngest of which was breached to the NE by collapse during a brief eruption in 1772 and contains active fumarole fields. The broad 1.1-km-wide, flat-floored Alun-Alun crater truncates the summit of Papandayan, and Gunung Puntang to the north gives a twin-peaked appearance. Several episodes of collapse have created an irregular profile and produced debris avalanches that have impacted lowland areas. A sulfur-encrusted fumarole field occupies historically active Kawah Mas ("Golden Crater"). After its first historical eruption in 1772, in which collapse of the NE flank produced a catastrophic debris avalanche that destroyed 40 villages and killed nearly 3000 people, only small phreatic eruptions had occurred prior to an explosive eruption that began in November 2002.
Information Contacts: Dali Ahmad, Volcanological Survey of Indonesia (VSI), Jalan Diponegoro No. 57, Bandung 40122, Indonesia (URL: http://www.vsi.esdm.go.id/).
Semeru
Indonesia
8.108°S, 112.922°E; summit elev. 3657 m
All times are local (unless otherwise noted)
Ash plumes, pyroclastic flows, and high seismicity continue through June
According to the Volcanological Survey of Indonesia (VSI), activity during 24 March-29 June 2003 was continually at a high level. Explosions produced white-gray ash plumes several times per week that rose 300-600 m over the summit. Pyroclastic flows on 27 March had a run-out distance of 3,750 m toward Besuk Bang. More pyroclastic-flow events on 14 and 18 April traveled toward Besuk Bang (3,500 m) and Besuk Kembar (2,500 m). On 11 May a pyroclastic flow entered Besuk Kembar and extended 1,500 m. Seismographs continually recorded earthquake activity (table 12). The hazard status remained at Level 2 (on a scale of 1-4) throughout the report period.
Table 12. Seismicity at Semeru, 24 March-29 June 2003. Courtesy of VSI.
| Date |
Explosion |
Avalanche |
Tremor |
Other |
Tectonic |
| 24 Mar-30 Mar 2003 |
794 |
48 |
17 |
1 flood; 12 PF |
6 |
| 31 Mar-06 Apr 2003 |
738 |
28 |
12 |
2 shallow; 2 PF |
6 |
| 07 Apr-13 Apr 2003 |
698 |
33 |
11 |
7 PF |
6 |
| 14 Apr-20 Apr 2003 |
697 |
70 |
20 |
12 PF |
7 |
| 21 Apr-27 Apr 2003 |
713 |
82 |
16 |
1 deep volc |
9 |
| 28 Apr-04 May 2003 |
651 |
36 |
31 |
1 deep volc |
2 |
| 05 May-11 May 2003 |
846 |
37 |
27 |
2 shallow volc; 1 PF |
5 |
| 12 May-18 May 2003 |
730 |
41 |
38 |
1 shallow volc |
3 |
| 19 May-25 May 2003 |
748 |
17 |
17 |
-- |
8 |
| 26 May-01 Jun 2003 |
585 |
27 |
26 |
-- |
8 |
| 02 Jun-08 Jun 2003 |
758 |
29 |
24 |
-- |
4 |
| 09 Jun-15 Jun 2003 |
600 |
27 |
63 |
2 deep volc |
13 |
| 16 Jun-22 Jun 2003 |
711 |
20 |
13 |
1 shallow volc |
8 |
| 23 Jun-29 Jun 2003 |
838 |
33 |
-- |
-- |
4 |
Geologic Background. Semeru, the highest volcano on Java, and one of its most active, lies at the southern end of a volcanic massif extending north to the Tengger caldera. The steep-sided volcano, also referred to as Mahameru (Great Mountain), rises above coastal plains to the south. Gunung Semeru was constructed south of the overlapping Ajek-ajek and Jambangan calderas. A line of lake-filled maars was constructed along a N-S trend cutting through the summit, and cinder cones and lava domes occupy the eastern and NE flanks. Summit topography is complicated by the shifting of craters from NW to SE. Frequent 19th and 20th century eruptions were dominated by small-to-moderate explosions from the summit crater, with occasional lava flows and larger explosive eruptions accompanied by pyroclastic flows that have reached the lower flanks of the volcano.
Information Contacts: Dali Ahmad and Nia Haerani, Volcanological Survey of Indonesia (VSI), Jalan Diponegoro No. 57, Bandung 40122, Indonesia (URL: http://www.vsi.esdm.go.id/).
Sheveluch
Russia
56.653°N, 161.36°E; summit elev. 3283 m
All times are local (unless otherwise noted)
Lava dome growth and ash-and-gas plumes to 5 km high
Eruptive activity continued during May-August 2003, including growth of a lava dome in the active crater. Seismic activity continued to remain above background levels, and shallow earthquakes at a depth of 5 km were recorded with magnitudes in the range of 1.8-2.8. Several short-lived explosive eruptions each week sent ash-gas plumes to heights of 2,500-5,000 m above the dome. Intermittent spasmodic volcanic tremor was registered. Satellite data on thermal anomalies are shown in table 7.
Table 7. US and Russian satellite data summarizing thermal anomalies associated with Sheveluch from late May to early August 2003. Courtesy of Kamchatka Volcanic Eruptions Response Team (KVERT).
| Date(s) |
Thermal Anomaly (pixels) |
Comments |
| 30 May 2003 |
1-4 |
No ash plumes observed. |
| 06-09 Jun 2003 |
1-6 |
Gas/steam plumes rose 100-700 m above dome and extended E. |
| 13-14, 16-17 Jun 2003 |
1-6 |
Gas/steam plume rose 100 m above dome and extended 5 km NE. |
| 21-22 Jun 2003 |
1-4 |
Gas/steam plumes rose 100 m above dome. |
| 28-30 Jun, 02 Jul 2003 |
1-5 |
Gas/steam plumes rose 100 m above dome. |
| 05-06, 10 Jul 2003 |
1-2 |
Gas/steam plumes rose 500 m above dome. |
| 11, 13-16 Jul 2003 |
1-2 |
Gas/steam plumes rose 200-800 m above dome. |
| 19-22, 24 Jul 2003 |
1-2 |
Gas/steam plumes rose 500-600 m above dome. |
| 27, 31 Jul, 01 Aug 2003 |
1-3 |
Temperatures of 10-19°C in background of 0-5°C; gas/steam plumes rose 100 m above dome. |
| 08-10 Aug 2003 |
2-3 |
-- |
Geologic Background. The high, isolated massif of Sheveluch volcano (also spelled Shiveluch) rises above the lowlands NNE of the Kliuchevskaya volcano group. The 1,300 km3 andesitic volcano is one of Kamchatka's largest and most active volcanic structures, with at least 60 large eruptions during the Holocene. The summit of roughly 65,000-year-old Stary Shiveluch is truncated by a broad 9-km-wide late-Pleistocene caldera breached to the south. Many lava domes occur on its outer flanks. The Molodoy Shiveluch lava dome complex was constructed during the Holocene within the large open caldera; Holocene lava dome extrusion also took place on the flanks of Stary Shiveluch. Widespread tephra layers from these eruptions have provided valuable time markers for dating volcanic events in Kamchatka. Frequent collapses of dome complexes, most recently in 1964, have produced debris avalanches whose deposits cover much of the floor of the breached caldera.
Information Contacts: Olga Girina, Kamchatka Volcanic Eruptions Response Team (KVERT), a cooperative program of the Institute of Volcanic Geology and Geochemistry, Far East Division, Russian Academy of Sciences, Piip Ave. 9, Petropavlovsk-Kamchatsky, 683006, Russia, the Kamchatka Experimental and Methodical Seismological Department (KEMSD), GS RAS (Russia), and the Alaska Volcano Observatory (USA); Alaska Volcano Observatory (AVO), a cooperative program of the U.S. Geological Survey, 4200 University Drive, Anchorage, AK 99508-4667, USA (URL: http://www.avo.alaska.edu/), the Geophysical Institute, University of Alaska, PO Box 757320, Fairbanks, AK 99775-7320, USA, and the Alaska Division of Geological and Geophysical Surveys, 794 University Ave., Suite 200, Fairbanks, AK 99709, USA.
Soufriere Hills (United Kingdom) — July 2003 Cite this Report
Soufriere Hills
United Kingdom
16.72°N, 62.18°W; summit elev. 915 m
All times are local (unless otherwise noted)
Changes in activity style and dome growth since February 2002
Although detailed reports about the activity and monitoring of Soufrière Hills are provided on a regular basis by the Montserrat Volcano Observatory, this report contains observations made by visitors Stephen O'Meara and Robert Benward. They monitored Soufrière Hills visually and, using some novel electronics, collected data and images for 12 days beginning on 7 February 2003. This visit was similar to one in February 2002 (BGVN 27:06).
The visual observations took place primarily on Jack Boy Hill, 6 km N of the volcano. At the new Montserrat Volcano Observatory, Benward set up a black and white CCD video camera that took a frame every eight (8) seconds and relayed it to a digital video recorder. The camera's low-light sensitivity provided round-the-clock surveillance of dome activity. However, orographic and rain clouds caused problems, and much of the volcanic activity was away from the camera view.
Since the visit in 2002, the dome had increased significantly in size (figure 56). The rockfalls and pyroclastic flows that dominated the activity in February 2002 were concentrated in the E portions of the dome and the Tar River Valley. In 2003, activity occurred in a broader arc that extended from Tar River in the E to Farrell's Plain in the N. Several pyroclastic flows traveled into Tuitt's Ghaut and the upper reaches of Tyre's Ghaut, and onto Farrell's Plain. These events were captured on the surveillance camera and in higher-definition color video taken from Jack Boy Hill.
The dome was impressive at night. The summit was often crowned with thick, blocky spines and sharp pinnacles. An array of spiny ridges (speckled with incandescence) that lined the upper portions of the dome helped channelize many of the rockfalls and pyroclastic flows, the flow channels remaining incandescent. The glow was strong throughout the observation period, but especially during 13-19 February, when episodes of prolonged activity made the dome appear to be melting like candle wax. The glowing dome could be seen from the northernmost reaches of the island at night. Its light was so intense that a homemade spectrograph (attached to a 3-inch telescope brought by Benward) revealed a continuous spectrum.
O'Meara visually observed the dome through a 60 power, 60 mm refractor scope and noticed two curious phenomena. At one point, a mass of viscous, but mobile, lava pushed out of the downslope edge of an incandescent ridge. It slumped onto the dome and formed a pad of molten material that quickly cooled and solidified into linear veins. The behavior was similar to that of a budding toe of pahoehoe lava where internal pressure forces fluid lava through its cooling skin. O'Meara also observed what appeared to be a tiny lateral explosion from the downslope edge of an incandescent ridge which shot out glowing gas and rock fragments like buckshot from a gun.
A significant difference in the style of eruption from that reported in 2002 was the periodic mass dumping of dome material. During these episodes, dome material calved off the highest portions of the dome, creating a wide avalanche of incandescent material which flowed down much of the dome's visible face in a matter of seconds. These episodes differed from the classical pyroclastic flows in that they produced comparatively little ash, being comprised principally of extremely massive and widespread rock and block fall.
A dramatic episode of rockfall and pyroclastic-flow activity occurred during 1745-2000 on 13 February. Massive movement of large, house-sized blocks, many of which self-destructed during their descent, preceded the pyroclastic flows. The subsequent pyroclastic flow activity was accompanied by roiling steel-gray ash clouds that drifted N. One particularly strong pyroclastic flow created an incandescent channel in Tuitt's Ghaut that glowed long into the night. Smaller pyroclastic flows followed this channel downslope, while larger ones overflowed the channel's levees or changed course. Often, when one flow slowed, another would push through it. At times pieces of incandescent rocks appeared to be sliding down the dome in the flow with no detectable rolling motion. At other times, linear threads of glowing gases appeared to advance like the treads of a tank. Another series of pyroclastic flows during 0614-0730 on 14 February were directed N, and spread out across Farrell's Plain. As in February 2002, the night activity was most spectacular when viewed and videotaped in the near-IR using Benward's homemade nightscope.
One purpose of the visit was to chronicle changes in visible behavior when the full Moon approached Earth and at perigee. With the approach of the full Moon, the team reported an apparent rise in the number of visible indicators, particularly an increase in the number of large and prolonged rockfalls and pyroclastic flows, and in the average number of events per hour. There was an impressive episode of spine growth in the 24 hours near the time of full Moon, similar to that in 2002. The limited duration of the observations, however, thwart conclusions about the relationships between lunar positions and volcanism. Convincing theories require baseline data over a considerably longer time period.
Geologic Background. The complex, dominantly andesitic Soufrière Hills volcano occupies the southern half of the island of Montserrat. The summit area consists primarily of a series of lava domes emplaced along an ESE-trending zone. The volcano is flanked by Pleistocene complexes to the north and south. English's Crater, a 1-km-wide crater breached widely to the east by edifice collapse, was formed about 2000 years ago as a result of the youngest of several collapse events producing submarine debris-avalanche deposits. Block-and-ash flow and surge deposits associated with dome growth predominate in flank deposits, including those from an eruption that likely preceded the 1632 CE settlement of the island, allowing cultivation on recently devegetated land to near the summit. Non-eruptive seismic swarms occurred at 30-year intervals in the 20th century, but no historical eruptions were recorded until 1995. Long-term small-to-moderate ash eruptions beginning in that year were later accompanied by lava-dome growth and pyroclastic flows that forced evacuation of the southern half of the island and ultimately destroyed the capital city of Plymouth, causing major social and economic disruption.
Information Contacts: Steve and Donna O'Meara, and Robert Benward, Volcano Watch International, PO Box 218, Volcano, HI 96785, USA.
Stromboli
Italy
38.789°N, 15.213°E; summit elev. 924 m
All times are local (unless otherwise noted)
Flank eruption finished as of 22 July; activity resumed at summit craters on 17 April
Effusion of lava from vents located at about 600 m elevation on the upper eastern corner of the Sciara del Fuoco decreased in early June and completely stopped between 21 and 22 July. The decreasing effusion rate caused shorter lava flows, which during July did not spread below 600 m elevation. The upper part of the lava flow field, formed since 15 February on the upper Sciara del Fuoco, reached an estimated thickness of more than 50 m as a result of the slower rate.
[After] the 5 April eruption (BGVN 28:04), the summit craters of the volcano [were] blocked by fallout debris obstructing the conduit. [By 17 April the blockage was apparently cleared because] small, occasional, and short-lived explosions of juvenile, hot material were observed at Crater 3 (the SW crater) [that day] during a helicopter survey with a hand-held thermal camera, and at Crater 1 (the NE crater) on 3 May from the SAR fixed camera located at 400 m on the eastern rim of the Sciara del Fuoco.
Strombolian activity from Crater 1 (NE crater) became more frequent and intense in June, and almost continuous in July, with spatter often falling outside the crater. In July, Crater 3 (SW crater) activity consisted mainly of degassing and sporadic ash emissions, with Strombolian explosions becoming more common in the second half of July.
Erosion of the N flank of Crater 1 by landslides in the upper Sciara del Fuoco increased in July, with the 30 December 2002 landslide scar extending backward and upslope, cutting the flank of the cone 50 m below the crater rim.
Geologic Background. Spectacular incandescent nighttime explosions at Stromboli have long attracted visitors to the "Lighthouse of the Mediterranean" in the NE Aeolian Islands. This volcano has lent its name to the frequent mild explosive activity that has characterized its eruptions throughout much of historical time. The small island is the emergent summit of a volcano that grew in two main eruptive cycles, the last of which formed the western portion of the island. The Neostromboli eruptive period took place between about 13,000 and 5,000 years ago. The active summit vents are located at the head of the Sciara del Fuoco, a prominent scarp that formed about 5,000 years ago due to a series of slope failures which extends to below sea level. The modern volcano has been constructed within this scarp, which funnels pyroclastic ejecta and lava flows to the NW. Essentially continuous mild Strombolian explosions, sometimes accompanied by lava flows, have been recorded for more than a millennium.
Information Contacts: Sonia Calvari, Istituto Nazionale di Geofisica e Vulcanologia, Piazza Roma 2, 95123 Catania, Italy (URL: http://www.ct.ingv.it/).
Yellowstone (United States) — July 2003 Cite this Report
Yellowstone
United States
44.43°N, 110.67°W; summit elev. 2805 m
All times are local (unless otherwise noted)
Geyser basin heats up, affecting thermal features
Yellowstone National Park press releases indicated unusual hydrothermal activity at the Norris geyser basin in the NW-central portion of the Park. A press release on 22 July 2003 announced that high ground temperatures and increased thermal activity had resulted in the temporary closure of a portion of the Back Basin.
The press release noted "Norris is the hottest and most seismically active geyser basin in Yellowstone. Recent activity in the Norris geyser basin has included formation of new mud pots, an eruption of Porkchop geyser (dormant since 1989), the draining of several geysers, creating steam vents and significantly increased measured ground temperatures (up to 200°F [93°C]). Additional observations include vegetation dying due to thermal activity and the changing of several geysers' eruption intervals. Vixen geyser has become more frequent and Echinus geyser has become more regular."
A press release on 7 August advised of a hydrothermal monitoring program by the Yellowstone Volcano Observatory to begin at Norris geyser basin. The Observatory is a collaborative partnership between the US Geological Survey, the University of Utah, and Yellowstone National Park. It was deploying a temporary network of seismographs, Global Positioning System receivers, and temperature loggers. Goals included identification of hydrothermal steam sources, the relationship of the behavior of Norris geyser basin to the general seismicity, and locating crustal deformation in the caldera.
Geologic Background. The Yellowstone Plateau volcanic field developed through three volcanic cycles spanning two million years that included some of the world's largest known eruptions. Eruption of the over 2,450 km3 Huckleberry Ridge Tuff about 2.1 million years ago created the more than 75-km-long Island Park caldera. The second cycle concluded with the eruption of the Mesa Falls Tuff around 1.3 million years ago, forming the 16-km-wide Henrys Fork caldera at the western end of the first caldera. Activity subsequently shifted to the present Yellowstone Plateau and culminated 640,000 years ago with the eruption of the over 1,000 km3 Lava Creek Tuff and the formation of the present 45 x 85 km caldera. Resurgent doming subsequently occurred at both the NE and SW sides of the caldera and voluminous (1000 km3) intracaldera rhyolitic lava flows were erupted between 150,000 and 70,000 years ago. No magmatic eruptions have occurred since the late Pleistocene, but large hydrothermal events took place near Yellowstone Lake during the Holocene. Yellowstone is presently the site of one of the world's largest hydrothermal systems, including Earth's largest concentration of geysers.
Information Contacts: Yellowstone Volcano Observatory, a cooperative arrangement that includesRobert L. Christiansen, U.S. Geological Survey, 345 Middlefield Road, Menlo Park, CA 94025; Robert B. Smith, Department of Geology and Geophysics, University of Utah, Salt Lake City, Utah 84112 USA; Henry Heasler, National Park Service, P.O. Box 168, Yellowstone National Park, WY 82190-0168 USA; and others (URL: https://volcanoes.usgs.gov/observatories/yvo/).