Recently Published Bulletin Reports
Erebus (Antarctica) Lava lake remains active; most thermal alerts recorded since 2019
Rincon de la Vieja (Costa Rica) Frequent phreatic explosions during July-December 2023
Bezymianny (Russia) Explosion on 18 October 2023 sends ash plume 8 km high; lava flows and incandescent avalanches
Kilauea (United States) Low-level lava effusions in the lava lake at Halema’uma’u during July-December 2022
Nyamulagira (DR Congo) Lava flows and thermal activity during May-October 2023
Bagana (Papua New Guinea) Explosions, ash plumes, ashfall, and lava flows during April-September 2023
Mayon (Philippines) Lava flows, pyroclastic flows, ash emissions, and seismicity during April-September 2023
Nishinoshima (Japan) Eruption plumes and gas-and-steam plumes during May-August 2023
Krakatau (Indonesia) White gas-and-steam plumes and occasional ash plumes during May-August 2023
Villarrica (Chile) Strombolian activity, gas-and-ash emissions, and crater incandescence during April-September 2023
Merapi (Indonesia) Frequent incandescent avalanches during April-September 2023
Ebeko (Russia) Moderate explosive activity with ash plumes continued during June-November 2023
Erebus (Antarctica) — January 2024  Cite this Report
Erebus
Antarctica
77.53°S, 167.17°E; summit elev. 3794 m
All times are local (unless otherwise noted)
Lava lake remains active; most thermal alerts recorded since 2019
The lava lake in the summit crater of Erebus has been active since at least 1972. Located in Antarctica overlooking the McMurdo Station on Ross Island, it is the southernmost active volcano on the planet. Because of the remote location, activity is primarily monitored by satellites. This report covers activity during 2023.
The number of thermal alerts recorded by the Hawai'i Institute of Geophysics and Planetology’s MODVOLC Thermal Alerts System increased considerably in 2023 compared to the years 2020-2022 (table 9). In contrast to previous years, the MODIS instruments aboard the Aqua and Terra satellites captured data from Erebus every month during 2023. Consistent with previous years, the lowest number of anomalous pixels were recorded in January, November, and December.
Table 9. Number of monthly MODIS-MODVOLC thermal alert pixels recorded at Erebus during 2017-2023. See BGVN 42:06 for data from 2000 through 2016. The table was compiled using data provided by the HIGP – MODVOLC Thermal Alerts System.
| Year |
Jan |
Feb |
Mar |
Apr |
May |
Jun |
Jul |
Aug |
Sep |
Oct |
Nov |
Dec |
SUM |
| 2017 |
0 |
21 |
9 |
0 |
0 |
1 |
11 |
61 |
76 |
52 |
0 |
3 |
234 |
| 2018 |
0 |
21 |
58 |
182 |
55 |
17 |
137 |
172 |
103 |
29 |
0 |
0 |
774 |
| 2019 |
2 |
21 |
162 |
151 |
55 |
56 |
75 |
53 |
29 |
19 |
1 |
0 |
624 |
| 2020 |
0 |
2 |
16 |
18 |
4 |
4 |
1 |
3 |
18 |
3 |
1 |
6 |
76 |
| 2021 |
0 |
9 |
1 |
0 |
2 |
56 |
46 |
47 |
35 |
52 |
5 |
3 |
256 |
| 2022 |
1 |
13 |
55 |
22 |
15 |
32 |
39 |
19 |
31 |
11 |
0 |
0 |
238 |
| 2023 |
2 |
33 |
49 |
82 |
41 |
32 |
70 |
64 |
42 |
17 |
5 |
11 |
448 |
Sentinel-2 infrared images showed one or two prominent heat sources within the summit crater, accompanied by adjacent smaller sources, similar to recent years (see BGVN 46:01, 47:02, and 48:01). A unique image was obtained on 25 November 2023 by the OLI-2 (Operational Land Imager-2) on Landsat 9, showing the upper part of the volcano surrounded by clouds (figure 32).
Geologic Background. Mount Erebus, the world's southernmost historically active volcano, overlooks the McMurdo research station on Ross Island. It is the largest of three major volcanoes forming the crudely triangular Ross Island. The summit of the dominantly phonolitic volcano has been modified by one or two generations of caldera formation. A summit plateau at about 3,200 m elevation marks the rim of the youngest caldera, which formed during the late-Pleistocene and within which the modern cone was constructed. An elliptical 500 x 600 m wide, 110-m-deep crater truncates the summit and contains an active lava lake within a 250-m-wide, 100-m-deep inner crater; other lava lakes are sometimes present. The glacier-covered volcano was erupting when first sighted by Captain James Ross in 1841. Continuous lava-lake activity with minor explosions, punctuated by occasional larger Strombolian explosions that eject bombs onto the crater rim, has been documented since 1972, but has probably been occurring for much of the volcano's recent history.
Information Contacts: Hawai'i Institute of Geophysics and Planetology (HIGP) - MODVOLC Thermal Alerts System, School of Ocean and Earth Science and Technology (SOEST), Univ. of Hawai'i, 2525 Correa Road, Honolulu, HI 96822, USA (URL: http://modis.higp.hawaii.edu/); Copernicus Browser, Copernicus Data Space Ecosystem, European Space Agency (URL: https://dataspace.copernicus.eu/browser/); NASA Earth Observatory, EOS Project Science Office, NASA Goddard Space Flight Center, Goddard, Maryland, USA (URL: https://earthobservatory.nasa.gov/images/152134/erebus-breaks-through).
Rincon de la Vieja (Costa Rica) — January 2024 Cite this Report
Rincon de la Vieja
Costa Rica
10.83°N, 85.324°W; summit elev. 1916 m
All times are local (unless otherwise noted)
Frequent phreatic explosions during July-December 2023
Rincón de la Vieja is a volcanic complex in Costa Rica with a hot convecting acid lake that exhibits frequent weak phreatic explosions, gas-and-steam emissions, and occasional elevated sulfur dioxide levels (BGVN 45:10, 46:03, 46:11). The current eruption period began June 2021. This report covers activity during July-December 2023 and is based on weekly bulletins and occasional daily reports from the Observatorio Vulcanologico Sismologica de Costa Rica-Universidad Nacional (OVSICORI-UNA).
Numerous weak phreatic explosions continued during July-December 2023, along with gas-and-steam emissions and plumes that rose as high as 3 km above the crater rim. Many weekly OVSICORI-UNA bulletins included the previous week's number of explosions and emissions (table 9). For many explosions, the time of explosion was given (table 10). Frequent seismic activity (long-period earthquakes, volcano-tectonic earthquakes, and tremor) accompanied the phreatic activity.
Table 9. Number of reported weekly phreatic explosions and gas-and-steam emissions at Rincón de la Vieja, July-December 2023. Counts are reported for the week before the Weekly Bulletin date; not all reports included these data. Courtesy of OVSICORI-UNA.
| OVSICORI Weekly Bulletin |
Number of explosions |
Number of emissions |
| 28 Jul 2023 |
6 |
14 |
| 4 Aug 2023 |
10 |
12 |
| 1 Sep 2023 |
13 |
11 |
| 22 Sep 2023 |
12 |
13 |
| 29 Sep 2023 |
6 |
11 |
| 6 Oct 2023 |
12 |
5 |
| 13 Oct 2023 |
7 |
9 |
| 20 Oct 2023 |
1 |
15 |
| 27 Oct 2023 |
3 |
23 |
| 3 Nov 2023 |
3 |
10 |
| 17 Nov 2023 |
0 |
Some |
| 24 Nov 2023 |
0 |
14 |
| 8 Dec 2023 |
4 |
16 |
| 22 Dec 2023 |
8 |
18 |
Table 10. Summary of activity at Rincón de la Vieja during July-December 2023. Weak phreatic explosions and gas emissions are noted where the time of explosion was indicated in the weekly or daily bulletins. Height of plumes or emissions are distance above the crater rim. Courtesy of OVSICORI-UNA.
| Date |
Time |
Description of Activity |
| 1 Jul 2023 |
0156 |
Explosion. |
| 2 Jul 2023 |
0305 |
Explosion. |
| 4 Jul 2023 |
0229, 0635 |
Event at 0635 produced a gas-and-steam plume that rose 700 m and drifted W; seen by residents in Liberia (21 km SW). |
| 9 Jul 2023 |
1843 |
Explosion. |
| 21 Jul 2023 |
0705 |
Explosion. |
| 26 Jul 2023 |
1807 |
Explosion. |
| 28 Jul 2023 |
0802 |
Explosion generated a gas-and-steam plume that rose 500 m. |
| 30 Jul 2023 |
1250 |
Explosion. |
| 31 Jul 2023 |
2136 |
Explosion. |
| 11 Aug 2023 |
0828 |
Explosion. |
| 18 Aug 2023 |
1304 |
Explosion. |
| 21 Aug 2023 |
1224 |
Explosion generated gas-and-steam plumes rose 500-600 m. |
| 22 Aug 2023 |
0749 |
Explosion generated gas-and-steam plumes rose 500-600 m. |
| 24 Aug 2023 |
1900 |
Explosion. |
| 25 Aug 2023 |
0828 |
Event produced a steam-and-gas plume that rose 3 km and drifted NW. |
| 27-28 Aug 2023 |
0813 |
Four small events; the event at 0813 on 28 August lasted two minutes and generated a steam-and-gas plume that rose 2.5 km. |
| 1 Sep 2023 |
1526 |
Explosion generated plume that rose 2 km and ejected material onto the flanks. |
| 2-3 Sep 2023 |
- |
Small explosions detected in infrasound data. |
| 4 Sep 2023 |
1251 |
Gas-and-steam plume rose 1 km and drifted W. |
| 7 Nov 2023 |
1113 |
Explosion. |
| 8 Nov 2023 |
0722 |
Explosion. |
| 12 Nov 2023 |
0136 |
Small gas emissions. |
| 14 Nov 2023 |
0415 |
Small gas emissions. |
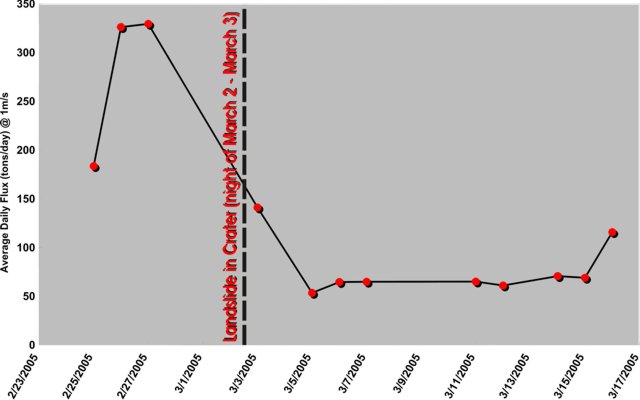
According to OVSICORI-UNA, during July-October the average weekly sulfur dioxide (SO2) flux ranged from 68 to 240 tonnes/day. However, in mid-November the flux increased to as high as 334 tonnes/day, the highest value measured in recent years. The high SO2 flux in mid-November was also detected by the TROPOMI instrument on the Sentinel-5P satellite (figure 43).
Geologic Background. Rincón de la Vieja, the largest volcano in NW Costa Rica, is a remote volcanic complex in the Guanacaste Range. The volcano consists of an elongated, arcuate NW-SE-trending ridge constructed within the 15-km-wide early Pleistocene Guachipelín caldera, whose rim is exposed on the south side. Sometimes known as the "Colossus of Guanacaste," it has an estimated volume of 130 km3 and contains at least nine major eruptive centers. Activity has migrated to the SE, where the youngest-looking craters are located. The twin cone of Santa María volcano, the highest peak of the complex, is located at the eastern end of a smaller, 5-km-wide caldera and has a 500-m-wide crater. A Plinian eruption producing the 0.25 km3 Río Blanca tephra about 3,500 years ago was the last major magmatic eruption. All subsequent eruptions, including numerous historical eruptions possibly dating back to the 16th century, have been from the prominent active crater containing a 500-m-wide acid lake located ENE of Von Seebach crater.
Information Contacts: Observatorio Vulcanológico Sismológica de Costa Rica-Universidad Nacional (OVSICORI-UNA), Apartado 86-3000, Heredia, Costa Rica (URL: http://www.ovsicori.una.ac.cr/); NASA Global Sulfur Dioxide Monitoring Page, Atmospheric Chemistry and Dynamics Laboratory, NASA Goddard Space Flight Center (NASA/GSFC), 8800 Greenbelt Road, Goddard MD 20771, USA (URL: https://so2.gsfc.nasa.gov/).
Bezymianny (Russia) — November 2023 Cite this Report
Bezymianny
Russia
55.972°N, 160.595°E; summit elev. 2882 m
All times are local (unless otherwise noted)
Explosion on 18 October 2023 sends ash plume 8 km high; lava flows and incandescent avalanches
Bezymianny, located on Russia’s Kamchatka Peninsula, has had eruptions since 1955 characterized by dome growth, explosions, pyroclastic flows, ash plumes, and ashfall. Activity during November 2022-April 2023 included gas-and-steam emissions, lava dome collapses generating avalanches, and persistent thermal activity. Similar eruptive activity continued from May through October 2023, described here based on information from weekly and daily reports of the Kamchatka Volcano Eruptions Response Team (KVERT), notices from Tokyo VAAC (Volcanic Ash Advisory Center), and from satellite data.
Overall activity decreased after the strong period of activity in late March through April 2023, which included ash explosions during 29 March and 7-8 April 2023 that sent plumes as high as 10-12 km altitude, along with dome growth and lava flows (BGVN 48:05). This reduced activity can be seen in the MIROVA thermal detection system graph (figure 56), which was consistent with data from the MODVOLC thermal detection system and with Sentinel-2 satellite images that showed persistent hotspots in the summit crater when conditions allowed observations. A renewed period of strong activity began in mid-October 2023.
Activity increased significantly on 17 October 2023 when large collapses began during 0700-0830 on the E flanks of the lava dome and continued to after 0930 the next day (figure 57). Ash plumes rose to an altitude of 4.5-5 km, extending 220 km NNE by 18 October. A large explosion at 1630 on 18 October produced an ash plume that rose to an altitude of 11 km (8 km above the summit) and drifted NNE and then NW, extending 900 km NW within two days at an altitude of 8 km. Minor ashfall was noted in Kozyrevsk (45 km WNW). At 0820 on 20 October an ash plume was identified in satellite images drifting 100 km ENE at altitudes of 4-4.5 km.
Lava flows and hot avalanches from the dome down the SE flank continued over the next few days, including 23 October when clear conditions allowed good observations (figures 58 and 59). A large thermal anomaly was observed over the volcano through 24 October, and in the summit crater on 30 October (figure 60). Strong fumarolic activity continued, with numerous avalanches and occasional incandescence. By the last week of October, volcanic activity had decreased to a level consistent with that earlier in the reporting period.
Aviation warnings were frequently updated during 17-20 October. KVERT issued a Volcano Observatory Notice for Aviation (VONA) on 17 October at 1419 and 1727 (0219 and 0527 UTC) raising the Aviation Color Code (ACC) from Yellow to Orange (second highest level). The next day, KVERT issued a VONA at 1705 (0505 UTC) raising the ACC to Red (highest level) but lowered it back to Orange at 2117 (0917 UTC). After another decrease to Yellow and back to Orange, the ACC was reduced to Yellow on 20 October at 1204 (0004 UTC). In addition, the Tokyo VAAC issued a series of Volcanic Ash Advisories beginning on 16 October and continuing through 30 October.
Geologic Background. The modern Bezymianny, much smaller than its massive neighbors Kamen and Kliuchevskoi on the Kamchatka Peninsula, was formed about 4,700 years ago over a late-Pleistocene lava-dome complex and an edifice built about 11,000-7,000 years ago. Three periods of intensified activity have occurred during the past 3,000 years. The latest period, which was preceded by a 1,000-year quiescence, began with the dramatic 1955-56 eruption. This eruption, similar to that of St. Helens in 1980, produced a large open crater that was formed by collapse of the summit and an associated lateral blast. Subsequent episodic but ongoing lava-dome growth, accompanied by intermittent explosive activity and pyroclastic flows, has largely filled the 1956 crater.
Information Contacts: Kamchatka Volcanic Eruptions Response Team (KVERT), Far Eastern Branch, Russian Academy of Sciences, 9 Piip Blvd., Petropavlovsk-Kamchatsky, 683006, Russia (URL: http://www.kscnet.ru/ivs/kvert/); Kamchatka Volcanological Station, Kamchatka Branch of Geophysical Survey, (KB GS RAS), Klyuchi, Kamchatka Krai, Russia (URL: http://volkstat.ru/); Tokyo Volcanic Ash Advisory Center (VAAC), 1-3-4 Otemachi, Chiyoda-ku, Tokyo 100-8122, Japan (URL: http://ds.data.jma.go.jp/svd/vaac/data/); Hawai'i Institute of Geophysics and Planetology (HIGP) - MODVOLC Thermal Alerts System, School of Ocean and Earth Science and Technology (SOEST), Univ. of Hawai'i, 2525 Correa Road, Honolulu, HI 96822, USA (URL: http://modis.higp.hawaii.edu/); MIROVA (Middle InfraRed Observation of Volcanic Activity), a collaborative project between the Universities of Turin and Florence (Italy) supported by the Centre for Volcanic Risk of the Italian Civil Protection Department (URL: http://www.mirovaweb.it/); Copernicus Browser, Copernicus Data Space Ecosystem, European Space Agency (URL: https://dataspace.copernicus.eu/browser/).chr
Kilauea (United States) — January 2023 Cite this Report
Kilauea
United States
19.421°N, 155.287°W; summit elev. 1222 m
All times are local (unless otherwise noted)
Low-level lava effusions in the lava lake at Halema’uma’u during July-December 2022
Kīlauea is the southeastern-most volcano in Hawaii and overlaps the E flank of the Mauna Loa volcano. Its East Rift Zone (ERZ) has been intermittently active for at least 2,000 years. An extended eruption period began in January 1983 and was characterized by open lava lakes and lava flows from the summit caldera and the East Rift Zone. During May 2018 magma migrated into the Lower East Rift Zone (LERZ) and opened 24 fissures along a 6-km-long NE-trending fracture zone that produced lava flows traveling in multiple directions. As lava emerged from the fissures, the lava lake at Halema'uma'u drained and explosions sent ash plumes to several kilometers altitude (BGVN 43:10).
The current eruption period started during September 2021 and has recently been characterized by lava effusions, spatter, and sulfur dioxide emissions in the active Halema’uma’u lava lake (BGVN 47:08). Lava effusions, some spatter, and sulfur dioxide emissions have continued during this reporting period of July through December 2022 using daily reports, volcanic activity notices, and abundant photo, map, and video data from the US Geological Survey's (USGS) Hawaiian Volcano Observatory (HVO).
Summary of activity during July-December 2022. Low-level effusions have continued at the western vent of the Halema’uma’u crater during July through early December 2022. Occasional weak ooze-outs (also called lava break outs) would occur along the margins of the crater floor. The overall level of the active lava lake throughout the reporting period gradually increased due to infilling, however it stagnated in mid-September (table 13). During September through November, activity began to decline, though lava effusions persisted at the western vent. By 9 December, the active part of the lava lake had completely crusted over, and incandescence was no longer visible.
Table 13. Summary of measurements taken during overflights at Kīlauea that show a gradual increase in the active lava lake level and the volume of lava effused since 29 September 2021. Lower activity was reported during September-October. Data collected during July-December 2022. Courtesy of HVO.
| Date: |
Level of the active lava lake (m): |
Cumulative volume of lava effused (million cubic meters): |
| 7 Jul 2022 |
130 |
95 |
| 19 Jul 2022 |
133 |
98 |
| 4 Aug 2022 |
136 |
102 |
| 16 Aug 2022 |
137 |
104 |
| 12 Sep 2022 |
143 |
111 |
| 5 Oct 2022 |
143 |
111 |
| 28 Oct 2022 |
143 |
111 |
Activity during July 2022. Lava effusions were reported from the western vent in the Halema’uma’u crater, along with occasional weak ooze-outs along the margins of the crater floor. The height of the lava lake was variable due to deflation-inflation tilt events; for example, the lake level dropped approximately 3-4 m during a summit deflation-inflation event reported on 1 July. Webcam images taken during the night of 6-12 July showed intermittent low-level spattering at the western vent that rose less than 10 m above the vent (figure 519). Measurements made during an overflight on 7 July indicated that the crater floor was infilled about 130 m and that 95 million cubic meters of lava had been effused since 29 September 2021. A single, relatively small lava ooze-out was active to the S of the lava lake. Around midnight on 8 July there were two brief periods of lava overflow onto the lake margins. On 9 July lava ooze-outs were reported near the SE and NE edges of the crater floor and during 10-11 July they occurred near the E, NE, and NW edges. On 16 July crater incandescence was reported, though the ooze-outs and spattering were not visible. On 18 July overnight webcam images showed incandescence in the western vent complex and two ooze-outs were reported around 0000 and 0200 on 19 July. By 0900 there were active ooze-outs along the SW edge of the crater floor. Measurements made from an overflight on 19 July indicated that the crater floor was infilled about 133 m and 98 million cubic meters of lava had erupted since 29 September 2021 (figure 520). On 20 July around 1600 active ooze-outs were visible along the N edge of the crater, which continued through the next day. Extensive ooze-outs occurred along the W margin during 24 July until 1900; on 26 July minor ooze-outs were noted along the N margin. Minor spattering was visible on 29 July along the E margin of the lake. The sulfur dioxide emission rates ranged 650-2,800 tons per day (t/d), the higher of which was measured on 8 July (figure 519).
Activity during August 2022. The eruption continued in the Halema’uma’u crater at the western vent. According to HVO the lava in the active lake remained at the level of the bounding levees. Occasional minor ooze-outs were observed along the margins of the crater floor. Strong nighttime crater incandescence was visible after midnight on 6 August over the western vent cone. During 6-7 August scattered small lava lobes were active along the crater floor and incandescence persisted above the western vent through 9 August. During 7-9 August HVO reported a single lava effusion source was active along the NW margin of the crater floor. Measurements from an overflight on 4 August indicated that the crater floor was infilled about 136 m total and that 102 million cubic meters of lava had been erupted since the start of the eruption. Lava breakouts were reported along the N, NE, E, S, and W margins of the crater during 10-16 August. Another overflight survey conducted on 16 August indicated that the crater floor infilled about 137 m and 104 million cubic meters of lava had been erupted since September 2021. Measured sulfur dioxide emissions rates ranged 1,150-2,450 t/d, the higher of which occurred on 8 August.
Activity during September 2022. During September, lava effusion continued from the western vent into the active lava lake and onto the crater floor. Intermittent minor ooze-outs were reported through the month. A small ooze-out was visible on the W crater floor margin at 0220 on 2 September, which showed decreasing surface activity throughout the day, but remained active through 3 September. On 3 September around 1900 a lava outbreak occurred along the NW margin of the crater floor but had stopped by the evening of 4 September. Field crews monitoring the summit lava lake on 9 September observed spattering on the NE margin of the lake that rose no higher than 10 m, before falling back onto the lava lake crust (figure 521). Overflight measurements on 12 September indicated that the crater floor was infilled a total of 143 m and 111 million cubic meters of lava had been erupted since September 2021. Extensive breakouts in the W and N part of the crater floor were reported at 1600 on 20 September and continued into 26 September. The active part of the lava lake dropped by 10 m while other parts of the crater floor dropped by several meters. Summit tiltmeters recorded a summit seismic swarm of more than 80 earthquakes during 1500-1800 on 21 September, which occurred about 1.5 km below Halema’uma’u; a majority of these were less than Mw 2. By 22 September the active part of the lava lake was infilled about 2 m. On 23 September the western vent areas exhibited several small spatter cones with incandescent openings, along with weak, sporadic spattering (figure 522). The sulfur dioxide emission rate ranged from 930 t/d to 2,000 t/d, the higher of which was measured on 6 September.
Activity during October 2022. Activity during October declined slightly compared to previous months, though lava effusions persisted from the western vent into the active lava lake and onto the crater floor during October (figure 523). Slight variations in the lava lake were noted throughout the month. HVO reported that around 0600 on 3 October the level of the lava lake has lowered slightly. Overflight measurements taken on 5 October indicated that the crater floor was infilled a total of about 143 m and that 111 million cubic meters of lava had been effused since September 2021. During 6-7 October the lake gradually rose 0.5 m. Sulfur dioxide measurements made on 22 October had an emission rate of 700 t/d. Another overflight taken on 28 October showed that there was little to no change in the elevation of the crater floor: the crater floor was infilled a total of 143 m and 111 million cubic meters of lava had erupted since the start of the eruption.
Activity during November 2022. Activity remained low during November, though HVO reported that lava from the western vent continued to effuse into the active lava lake and onto the crater floor throughout the month. The rate of sulfur dioxide emissions during November ranged from 300-600 t/d, the higher amount of which occurred on 9 November.
Activity during December 2022. Similar low activity was reported during December, with lava effusing from the western vent into the active lava lake and onto the crater floor. During 4-5 December the active part of the lava lake was slightly variable in elevation and fluctuated within 1 m. On 9 December HVO reported that lava was no longer erupting from the western vent in the Halema’uma’u crater and that sulfur dioxide emissions had returned to near pre-eruption background levels; during 10-11 December, the lava lake had completely crusted over, and no incandescence was visible (figure 524). Time lapse camera images covering the 4-10 December showed that the crater floor showed weak deflation and no inflation. Some passive events of crustal overturning were reported during 14-15 December, which brought fresh incandescent lava to the lake surface. The sulfur dioxide emission rate was approximately 200 t/d on 14 December. A smaller overturn event on 17 December and another that occurred around 0000 and into the morning of 20 December were also detected. A small seismic swarm was later detected on 30 December.
Geologic Background. Kilauea overlaps the E flank of the massive Mauna Loa shield volcano in the island of Hawaii. Eruptions are prominent in Polynesian legends; written documentation since 1820 records frequent summit and flank lava flow eruptions interspersed with periods of long-term lava lake activity at Halemaumau crater in the summit caldera until 1924. The 3 x 5 km caldera was formed in several stages about 1,500 years ago and during the 18th century; eruptions have also originated from the lengthy East and Southwest rift zones, which extend to the ocean in both directions. About 90% of the surface of the basaltic shield volcano is formed of lava flows less than about 1,100 years old; 70% of the surface is younger than 600 years. The long-term eruption from the East rift zone between 1983 and 2018 produced lava flows covering more than 100 km2, destroyed hundreds of houses, and added new coastline.
Information Contacts: Hawaiian Volcano Observatory (HVO), U.S. Geological Survey, PO Box 51, Hawai'i National Park, HI 96718, USA (URL: http://hvo.wr.usgs.gov/).
Nyamulagira (DR Congo) — November 2023 Cite this Report
Nyamulagira
DR Congo
1.408°S, 29.2°E; summit elev. 3058 m
All times are local (unless otherwise noted)
Lava flows and thermal activity during May-October 2023
Nyamulagira (also known as Nyamuragira) is a shield volcano in the Democratic Republic of Congo with the summit truncated by a small 2 x 2.3 km caldera with walls up to about 100 m high. Documented eruptions have occurred within the summit caldera, as well as from numerous flank fissures and cinder cones. The current eruption period began in April 2018 and has more recently been characterized by summit crater lava flows and thermal activity (BGVN 48:05). This report describes lava flows and variable thermal activity during May through October 2023, based on information from the Observatoire Volcanologique de Goma (OVG) and various satellite data.
Lava lake activity continued during May. The MIROVA (Middle InfraRed Observation of Volcanic Activity) system recorded moderate-to-strong thermal activity throughout the reporting period; activity was more intense during May and October and relatively weaker from June through September (figure 95). The MODVOLC thermal algorithm, detected a total of 209 thermal alerts. There were 143 hotspots detected during May, eight during June, nine during September, and 49 during October. This activity was also reflected in infrared satellite images, where a lava flow was visible in the NW part of the crater on 7 May and strong activity was seen in the center of the crater on 4 October (figure 96). Another infrared satellite image taken on 12 May showed still active lava flows along the NW margin of the crater. According to OVG lava effusions were active during 7-29 May and moved to the N and NW parts of the crater beginning on 9 May. Strong summit crater incandescence was visible from Goma (27 km S) during the nights of 17, 19, and 20 May (figure 97). On 17 May there was an increase in eruptive activity, which peaked at 0100 on 20 May. Notable sulfur dioxide plumes drifted NW and W during 19-20 May (figure 98). Drone footage acquired in partnership with the USGS (United States Geological Survey) on 20 May captured images of narrow lava flows that traveled about 100 m down the W flank (figure 99). Data from the Rumangabo seismic station indicated a decreasing trend in activity during 17-21 May. Although weather clouds prevented clear views of the summit, a strong thermal signature on the NW flank was visible in an infrared satellite image on 22 May, based on an infrared satellite image. On 28 May the lava flows on the upper W flank began to cool and solidify. By 29 May seismicity returned to levels similar to those recorded before the 17 May increase. Lava effusion continued but was confined to the summit crater; periodic crater incandescence was observed.
Low-level activity was noted during June through October. On 1 June OVG reported that seismicity remained at lower levels and that crater incandescence had been absent for three days, though infrared satellite imagery showed continued lava effusion in the summit crater. The lava flows on the flanks covered an estimated 0.6 km2. Satellite imagery continued to show thermal activity confined to the lava lake through October (figure 96), although no lava flows or significant sulfur dioxide emissions were reported.
Geologic Background. Africa's most active volcano, Nyamulagira (also known as Nyamuragira), is a massive high-potassium basaltic shield about 25 km N of Lake Kivu and 13 km NNW of the steep-sided Nyiragongo volcano. The summit is truncated by a small 2 x 2.3 km caldera that has walls up to about 100 m high. Documented eruptions have occurred within the summit caldera, as well as from the numerous flank fissures and cinder cones. A lava lake in the summit crater, active since at least 1921, drained in 1938, at the time of a major flank eruption. Recent lava flows extend down the flanks more than 30 km from the summit as far as Lake Kivu; extensive lava flows from this volcano have covered 1,500 km2 of the western branch of the East African Rift.
Information Contacts: Observatoire Volcanologique de Goma (OVG), Departement de Geophysique, Centre de Recherche en Sciences Naturelles, Lwiro, D.S. Bukavu, DR Congo; Hawai'i Institute of Geophysics and Planetology (HIGP) - MODVOLC Thermal Alerts System, School of Ocean and Earth Science and Technology (SOEST), Univ. of Hawai'i, 2525 Correa Road, Honolulu, HI 96822, USA (URL: http://modis.higp.hawaii.edu/); MIROVA (Middle InfraRed Observation of Volcanic Activity), a collaborative project between the Universities of Turin and Florence (Italy) supported by the Centre for Volcanic Risk of the Italian Civil Protection Department (URL: http://www.mirovaweb.it/); NASA Global Sulfur Dioxide Monitoring Page, Atmospheric Chemistry and Dynamics Laboratory, NASA Goddard Space Flight Center (NASA/GSFC), 8800 Greenbelt Road, Goddard, Maryland, USA (URL: https://so2.gsfc.nasa.gov/); Copernicus Browser, Copernicus Data Space Ecosystem, European Space Agency (URL: https://dataspace.copernicus.eu/browser/); Charles Balagizi, Goma Volcano Observatory, Departement de Geophysique, Centre de Recherche en Sciences Naturelles, Lwiro, D.S. Bukavu, DR Congo.
Bagana (Papua New Guinea) — October 2023 Cite this Report
Bagana
Papua New Guinea
6.137°S, 155.196°E; summit elev. 1855 m
All times are local (unless otherwise noted)
Explosions, ash plumes, ashfall, and lava flows during April-September 2023
The remote volcano of Bagana is located in central Bougainville Island, Papua New Guinea. Recorded eruptions date back to 1842 and activity has consisted of effusive activity that has built a small lava dome in the summit crater and occasional explosions that produced pyroclastic flows. The most recent eruption has been ongoing since February 2000 and has produced occasional explosions, ash plumes, and lava flows. More recently, activity has been characterized by ongoing effusive activity and ash emissions (BGVN 48:04). This report updates activity from April through September 2023 that has consisted of explosions, ash plumes, ashfall, and lava flows, using information from the Darwin Volcanic Ash Advisory Center (VAAC) and satellite data.
An explosive eruption was reported on 7 July that generated a large gas-and-ash plume to high altitudes and caused significant ashfall in local communities; the eruption plume had reached upper tropospheric (16-18 km altitude) altitudes by 2200, according to satellite images. Sulfur dioxide plumes were detected in satellite images on 8 July and indicated that the plume was likely a mixture of gas, ice, and ash. A report issued by the Autonomous Bougainville Government (ABG) (Torokina District, Education Section) on 10 July noted that significant ash began falling during 2000-2100 on 7 July and covered most areas in the Vuakovi, Gotana (9 km SW), Koromaketo, Laruma (25 km W) and Atsilima (27 km NW) villages. Pyroclastic flows also occurred, according to ground-based reports; small deposits confined to one drainage were inspected by RVO during an overflight on 17 July and were confirmed to be from the 7 July event. Ashfall continued until 10 July and covered vegetation, which destroyed bushes and gardens and contaminated rivers and streams.
RVO reported another eruption on 14 July. The Darwin VAAC stated that an explosive event started around 0830 on 15 July and produced an ash plume that rose to 16.5 km altitude by 1000 and drifted N, according to satellite images. The plume continued to drift N and remained visible through 1900, and by 2150 it had dissipated.
Ashfall likely from both the 7 and 15 July events impacted about 8,111 people in Torokina (20 km SW), including Tsito/Vuakovi, Gotana, Koromaketo, Kenaia, Longkogari, Kenbaki, Piva (13 km SW), and Atsinima, and in the Tsitovi district, according to ABG. Significant ashfall was also reported in Ruruvu (22 km N) in the Wakunai District of Central Bougainville, though the thickness of these deposits could not be confirmed. An evacuation was called for the villages in Wakunai, where heavy ashfall had contaminated water sources; the communities of Ruruvu, Togarau, Kakarapaia, Karauturi, Atao, and Kuritaturi were asked to evacuate to a disaster center at the Wakunai District Station, and communities in Torokina were asked to evacuate to the Piva District station. According to a news article, more than 7,000 people needed temporary accommodations, with about 1,000 people in evacuation shelters. Ashfall had deposited over a broad area, contaminating water supplies, affecting crops, and collapsing some roofs and houses in rural areas. Schools were temporarily shut down. Intermittent ash emissions continued through the end of July and drifted NNW, NW, and SW. Fine ashfall was reported on the coast of Torokina, and ash plumes also drifted toward Laruma and Atsilima.
A small explosive eruption occurred at 2130 on 28 July that ejected material from the crater vents, according to reports from Torokina, in addition to a lava flow that contained two lobes. A second explosion was detected at 2157. Incandescence from the lava flow was visible from Piva as it descended the W flank around 2000 on 29 July (figure 47). The Darwin VAAC reported that a strong thermal anomaly was visible in satellite images during 30-31 July and that ash emissions rose to 2.4 km altitude and drifted WSW on 30 July. A ground report from RVO described localized emissions at 0900 on 31 July.
The Darwin VAAC reported that ash plumes were identified in satellite imagery at 0800 and 1220 on 12 August and rose to 2.1 km and 3 km altitude and drifted NW and W, respectively. A news report stated that aid was sent to more than 6,300 people that were adversely affected by the eruption. Photos taken during 17-19 August showed ash emissions rising no higher than 1 km above the summit and drifting SE. A small explosion generated an ash plume during the morning of 19 August. Deposits from small pyroclastic flows were also captured in the photos. Satellite images captured lava flows and pyroclastic flow deposits. Two temporary seismic stations were installed near Bagana on 17 August at distances of 7 km WSW (Vakovi station) and 11 km SW (Kepox station). The Kepox station immediately started to record continuous, low-frequency background seismicity.
Satellite data. Little to no thermal activity was detected during April through mid-July 2023; only one anomaly was recorded during early April and one during early June, according to MIROVA (Middle InfraRed Observation of Volcanic Activity) data (figure 48). Thermal activity increased in both power and frequency during mid-July through September, although there were still some short gaps in detected activity. MODVOLC also detected increased thermal activity during August; thermal hotspots were detected a total of five times on 19, 20, and 27 August. Weak thermal anomalies were also captured in infrared satellite images on clear weather days throughout the reporting period on 7, 12, and 17 April, 27 May, 1, 6, 16, and 31 July, and 19 September (figure 48); a strong thermal anomaly was visible on 31 July. Distinct sulfur dioxide plumes that drifted generally NW were intermittently captured by the TROPOMI instrument on the Sentinel-5P satellite and sometimes exceeded two Dobson Units (DUs) (figure 49).
Geologic Background. Bagana volcano, in a remote portion of central Bougainville Island, is frequently active. This massive symmetrical cone was largely constructed by an accumulation of viscous andesitic lava flows. The entire edifice could have been constructed in about 300 years at its present rate of lava production. Eruptive activity is characterized by non-explosive effusion of viscous lava that maintains a small lava dome in the summit crater, although occasional explosive activity produces pyroclastic flows. Lava flows with tongue-shaped lobes up to 50 m thick and prominent levees descend the flanks on all sides.
Information Contacts: Rabaul Volcano Observatory (RVO), Geohazards Management Division, Department of Mineral Policy and Geohazards Management (DMPGM), PO Box 3386, Kokopo, East New Britain Province, Papua New Guinea; Darwin Volcanic Ash Advisory Centre (VAAC), Bureau of Meteorology, Northern Territory Regional Office, PO Box 40050, Casuarina, NT 0811, Australia (URL: http://www.bom.gov.au/info/vaac/); MIROVA (Middle InfraRed Observation of Volcanic Activity), a collaborative project between the Universities of Turin and Florence (Italy) supported by the Centre for Volcanic Risk of the Italian Civil Protection Department (URL: http://www.mirovaweb.it/); Hawai'i Institute of Geophysics and Planetology (HIGP) - MODVOLC Thermal Alerts System, School of Ocean and Earth Science and Technology (SOEST), Univ. of Hawai'i, 2525 Correa Road, Honolulu, HI 96822, USA (URL: http://modis.higp.hawaii.edu/); NASA Global Sulfur Dioxide Monitoring Page, Atmospheric Chemistry and Dynamics Laboratory, NASA Goddard Space Flight Center (NASA/GSFC), 8800 Greenbelt Road, Goddard, Maryland, USA (URL: https://so2.gsfc.nasa.gov/); Copernicus Browser, Copernicus Data Space Ecosystem, European Space Agency (URL: https://dataspace.copernicus.eu/browser/); Autonomous Bougainville Government, P.O Box 322, Buka, AROB, PNG (URL: https://abg.gov.pg/); Andrew Tupper (Twitter: @andrewcraigtupp); Simon Carn, Geological and Mining Engineering and Sciences, Michigan Technological University, 1400 Townsend Drive, Houghton, MI 49931, USA (URL: http://www.volcarno.com/, Twitter: @simoncarn); Radio NZ (URL: https://www.rnz.co.nz/news/pacific/494464/more-than-7-000-people-in-bougainville-need-temporary-accommodation-after-eruption); USAID, 1300 Pennsylvania Ave, NW, Washington DC 20004, USA (URL: https://www.usaid.gov/pacific-islands/press-releases/aug-08-2023-united-states-provides-immediate-emergency-assistance-support-communities-affected-mount-bagana-volcanic-eruptions).
Mayon (Philippines) — October 2023 Cite this Report
Mayon
Philippines
13.257°N, 123.685°E; summit elev. 2462 m
All times are local (unless otherwise noted)
Lava flows, pyroclastic flows, ash emissions, and seismicity during April-September 2023
Mayon is located in the Philippines and has steep upper slopes capped by a small summit crater. Historical eruptions date back to 1616 CE that have been characterized by Strombolian eruptions, lava flows, pyroclastic flows, and mudflows. Eruptions mostly originated from a central conduit. Pyroclastic flows and mudflows have commonly descended many of the approximately 40 drainages that surround the volcano. The most recent eruption occurred during June through October 2022 and consisted of lava dome growth and gas-and-steam emissions (BGVN 47:12). A new eruption was reported during late April 2023 and has included lava flows, pyroclastic density currents, ash emissions, and seismicity. This report covers activity during April through September 2023 based on daily bulletins from the Philippine Institute of Volcanology and Seismology (PHIVOLCS).
During April through September 2023, PHIVOLCS reported near-daily rockfall events, frequent volcanic earthquakes, and sulfur dioxide measurements. Gas-and-steam emissions rose 100-900 m above the crater and drifted in different directions. Nighttime crater incandescence was often visible during clear weather and was accompanied by incandescent avalanches of material. Activity notably increased during June when lava flows were reported on the S, SE, and E flanks (figure 52). The MIROVA graph (Middle InfraRed Observation of Volcanic Activity) showed strong thermal activity coincident with these lava flows, which remained active through September (figure 53). According to the MODVOLC thermal algorithm, a total of 110 thermal alerts were detected during the reporting period: 17 during June, 40 during July, 27 during August, and 26 during September. During early June, pyroclastic density currents (PDCs) started to occur more frequently.
Low activity was reported during much of April and May; gas-and-steam emissions rose 100-900 m above the crater and generally drifted in different directions. A total of 52 rockfall events and 18 volcanic earthquakes were detected during April and 147 rockfall events and 13 volcanic events during May. Sulfur dioxide flux measurements ranged between 400-576 tons per day (t/d) during April, the latter of which was measured on 29 April and between 162-343 t/d during May, the latter of which was measured on 13 May.
Activity during June increased, characterized by lava flows, pyroclastic density currents (PDCs), crater incandescence and incandescent rockfall events, gas-and-steam emissions, and continued seismicity. Weather clouds often prevented clear views of the summit, but during clear days, moderate gas-and-steam emissions rose 100-2,500 m above the crater and drifted in multiple directions. A total of 6,237 rockfall events and 288 volcanic earthquakes were detected. The rockfall events often deposited material on the S and SE flanks within 700-1,500 m of the summit crater and ash from the events drifted SW, S, SE, NE, and E. Sulfur dioxide emissions ranged between 149-1,205 t/d, the latter of which was measured on 10 June. Short-term observations from EDM and electronic tiltmeter monitoring indicated that the upper slopes were inflating since February 2023. Longer-term ground deformation parameters based on EDM, precise leveling, continuous GPS, and electronic tilt monitoring indicated that the volcano remained inflated, especially on the NW and SE flanks. At 1000 on 5 June the Volcano Alert Level (VAL) was raised to 2 (on a 0-5 scale). PHIVOLCS noted that although low-level volcanic earthquakes, ground deformation, and volcanic gas emissions indicated unrest, the steep increase in rockfall frequency may indicate increased dome activity.
A total of 151 dome-collapse PDCs occurred during 8-9 and 11-30 June, traveled 500-2,000 m, and deposited material on the S flank within 2 km of the summit crater. During 8-9 June the VAL was raised to 3. At approximately 1947 on 11 June lava flow activity was reported; two lobes traveled within 500 m from the crater and deposited material on the S (Mi-isi), SE (Bonga), and E (Basud) flanks. Weak seismicity accompanied the lava flow and slight inflation on the upper flanks. This lava flow remained active through 30 June, moving down the S and SE flank as far as 2.5 km and 1.8 km, respectively and depositing material up to 3.3 km from the crater. During 15-16 June traces of ashfall from the PDCs were reported in Sitio Buga, Nabonton, City of Ligao and Purok, and San Francisco, Municipality of Guinobatan. During 28-29 June there were two PDCs generated by the collapse of the lava flow front, which generated a light-brown ash plume 1 km high. Satellite monitors detected significant concentrations of sulfur dioxide beginning on 29 June. On 30 June PDCs primarily affected the Basud Gully on the E flank, the largest of which occurred at 1301 and lasted eight minutes, based on the seismic record. Four PDCs generated between 1800 and 2000 that lasted approximately four minutes each traveled 3-4 km on the E flank and generated an ash plume that rose 1 km above the crater and drifted N and NW. Ashfall was recorded in Tabaco City.
Similar strong activity continued during July; slow lava effusion remained active on the S and SE flanks and traveled as far as 2.8 km and 2.8 km, respectively and material was deposited as far as 4 km from the crater. There was a total of 6,983 rockfall events and 189 PDCs that affected the S, SE, and E flanks. The volcano network detected a total of 2,124 volcanic earthquakes. Continuous gas-and-steam emissions rose 200-2,000 m above the crater and drifted in multiple directions. Sulfur dioxide emissions averaged 792-4,113 t/d, the latter of which was measured on 28 July. During 2-4 July three PDCs were generated from the collapse of the lava flow and resulting light brown plumes rose 200-300 m above the crater. Continuous tremor pulses were reported beginning at 1547 on 3 July through 7 July at 1200, at 2300 on 8 July and going through 0300 on 10 July, and at 2300 on 16 July, as recorded by the seismic network. During 6-9 July there were 10 lava flow-collapse-related PDCs that generated light brown plumes 300-500 m above the crater. During 10-11 July light ashfall was reported in some areas of Mabinit, Legazpi City, Budiao and Salvacion, Daraga, and Camalig, Albay. By 18 July the lava flow advanced 600 m on the E flank as well.
During 1733 on 18 July and 0434 on 19 July PHIVOLCS reported 30 “ashing” events, which are degassing events accompanied by audible thunder-like sounds and entrained ash at the crater, which produced short, dark plumes that drifted SW. These events each lasted 20-40 seconds, and plume heights ranged from 150-300 m above the crater, as recorded by seismic, infrasound, visual, and thermal monitors. Three more ashing events occurred during 19-20 July. Short-term observations from electronic tilt and GPS monitoring indicate deflation on the E lower flanks in early July and inflation on the NW middle flanks during the third week of July. Longer-term ground deformation parameters from EDM, precise leveling, continuous GPS, and electronic tilt monitoring indicated that the volcano was still generally inflated relative to baseline levels. A short-lived lava pulse lasted 28 seconds at 1956 on 21 July, which was accompanied by seismic and infrasound signals. By 22 July, the only lava flow that remained active was on the SE flank, and continued to extend 3.4 km, while those on the S and E flanks weakened markedly. One ashing event was detected during 30-31 July, whereas there were 57 detected during 31 July-1 August; according to PHIVOLCS beginning at approximately 1800 on 31 July eruptive activity was dominated by phases of intermittent ashing, as well as increased in the apparent rates of lava effusion from the summit crater. The ashing phases consisted of discrete events recorded as low-frequency volcanic earthquakes (LFVQ) typically 30 seconds in duration, based on seismic and infrasound signals. Gray ash plume rose 100 m above the crater and generally drifted NE. Shortly after these ashing events began, new lava began to effuse rapidly from the crater, feeding the established flowed on the SE, E, and E flanks and generating frequent rockfall events.
Intensified unrest persisted during August. There was a total of 4,141 rockfall events, 2,881 volcanic earthquakes, which included volcanic tremor events, 32 ashing events, and 101 PDCs detected throughout the month. On clear weather days, gas-and-steam emissions rose 300-1,500 m above the crater and drifted in different directions (figure 54). Sulfur dioxide emissions averaged 735-4,756 t/d, the higher value of which was measured on 16 August. During 1-2 August the rate of lava effusion decreased, but continued to feed the flows on the SE, S, and E flanks, maintaining their advances to 3.4 km, 2.8 km, and 1.1 km from the crater, respectively (figure 55). Rockfall and PDCs generated by collapses at the lava flow margins and from the summit dome deposited material within 4 km of the crater. During 3-4 August there were 10 tremor events detected that lasted 1-4 minutes. Short-lived lava pulse lasted 35 seconds and was accompanied by seismic and infrasound signals at 0442 on 6 August. Seven collapses were recorded at the front of the lava flow during 12-14 August.
During September, similar activity of slow lava effusion, PDCs, gas-and-steam emissions, and seismicity continued. There was a total of 4,452 rockfall events, 329 volcanic earthquakes, which included volcanic tremor events, two ashing events, and 85 PDCs recorded throughout the month. On clear weather days, gas-and-steam emissions rose 100-1,500 m above the crater and drifted in multiple directions. Sulfur dioxide emissions averaged 609-2,252 t/d, the higher average of which was measured on 6 September. Slow lava effusion continued advancing on the SE, S, and E flanks, maintaining lengths of 3.4 km, 2.8 km, and 1.1 km, respectively. Rockfall and PDC events generated by collapses along the lava flow margins and at the summit dome deposited material within 4 km of the crater.
Geologic Background. Symmetrical Mayon, which rises above the Albay Gulf NW of Legazpi City, is the most active volcano of the Philippines. The steep upper slopes are capped by a small summit crater. Recorded eruptions since 1616 CE range from Strombolian to basaltic Plinian, with cyclical activity beginning with basaltic eruptions, followed by longer periods of andesitic lava flows. Eruptions occur predominately from the central conduit and have also produced lava flows that travel far down the flanks. Pyroclastic density currents and mudflows have commonly swept down many of the approximately 40 ravines that radiate from the summit and have often damaged populated lowland areas. A violent eruption in 1814 killed more than 1,200 people and devastated several towns.
Information Contacts: Philippine Institute of Volcanology and Seismology (PHIVOLCS), Department of Science and Technology, University of the Philippines Campus, Diliman, Quezon City, Philippines (URL: http://www.phivolcs.dost.gov.ph/); MIROVA (Middle InfraRed Observation of Volcanic Activity), a collaborative project between the Universities of Turin and Florence (Italy) supported by the Centre for Volcanic Risk of the Italian Civil Protection Department (URL: http://www.mirovaweb.it/); Hawai'i Institute of Geophysics and Planetology (HIGP) - MODVOLC Thermal Alerts System, School of Ocean and Earth Science and Technology (SOEST), Univ. of Hawai'i, 2525 Correa Road, Honolulu, HI 96822, USA (URL: http://modis.higp.hawaii.edu/); Copernicus Browser, Copernicus Data Space Ecosystem, European Space Agency (URL: https://dataspace.copernicus.eu/browser/); William Rogers, Legazpi City, Albay Province, Philippines.
Nishinoshima (Japan) — October 2023 Cite this Report
Nishinoshima
Japan
27.247°N, 140.874°E; summit elev. 100 m
All times are local (unless otherwise noted)
Eruption plumes and gas-and-steam plumes during May-August 2023
Nishinoshima, located about 1,000 km S of Tokyo, is a small island in the Ogasawara Arc in Japan. The island is the summit of a massive submarine volcano that has prominent submarine peaks to the S, W, and NE. Eruptions date back to 1973 and the current eruption period began in October 2022. Recent activity has consisted of small ash plumes and fumarolic activity (BGVN 48:07). This report covers activity during May through August 2023, using information from monthly reports of the Japan Meteorological Agency (JMA) monthly reports and satellite data.
Activity during May through June was relatively low. The Japan Coast Guard (JCG) did overflights on 14 and 22 June and reported white gas-and-steam emissions rising 600 m and 1,200 m from the central crater of the pyroclastic cone, respectively (figure 125). In addition, multiple white gas-and-steam emissions rose from the inner rim of the W side of the crater and from the SE flank of the pyroclastic cone. Discolored brown-to-green water was observed around almost the entire perimeter of the island; on 22 June light green discolored water was observed off the S coast of the island.
Observations from the Himawari meteorological satellite confirmed an eruption on 9 and 10 July. An eruption plume rose 1.6 km above the crater and drifted N around 1300 on 9 July. Satellite images acquired at 1420 and 2020 on 9 July and at 0220 on 10 July showed continuing emissions that rose 1.3-1.6 km above the crater and drifted NE and N. The Tokyo VAAC reported that an ash plume seen by a pilot and identified in a satellite image at 0630 on 21 July rose to 3 km altitude and drifted S.
Aerial observations conducted by JCG on 8 August showed a white-and-gray plume rising from the central crater of the pyroclastic cone, and multiple white gas-and-steam emissions were rising from the inner edge of the western crater and along the NW-SE flanks of the island (figure 126). Brown-to-green discolored water was also noted around the perimeter of the island.
Intermittent low-to-moderate power thermal anomalies were recorded in the MIROVA graph (Middle InfraRed Observation of Volcanic Activity), showing an increase in both frequency and power beginning in July (figure 127). This increase in activity coincides with eruptive activity on 9 and 10 July, characterized by eruption plumes. According to the MODVOLC thermal alert algorithm, one thermal hotspot was recorded on 20 July. Weak thermal anomalies were also detected in infrared satellite imagery, accompanied by strong gas-and-steam plumes (figure 128).
Geologic Background. The small island of Nishinoshima was enlarged when several new islands coalesced during an eruption in 1973-74. Multiple eruptions that began in 2013 completely covered the previous exposed surface and continued to enlarge the island. The island is the summit of a massive submarine volcano that has prominent peaks to the S, W, and NE. The summit of the southern cone rises to within 214 m of the ocean surface 9 km SSE.
Information Contacts: Japan Meteorological Agency (JMA), 1-3-4 Otemachi, Chiyoda-ku, Tokyo 100-8122, Japan (URL: http://www.jma.go.jp/jma/indexe.html); Tokyo Volcanic Ash Advisory Center (VAAC), 1-3-4 Otemachi, Chiyoda-ku, Tokyo 100-8122, Japan (URL: http://ds.data.jma.go.jp/svd/vaac/data/); MIROVA (Middle InfraRed Observation of Volcanic Activity), a collaborative project between the Universities of Turin and Florence (Italy) supported by the Centre for Volcanic Risk of the Italian Civil Protection Department (URL: http://www.mirovaweb.it/); Copernicus Browser, Copernicus Data Space Ecosystem, European Space Agency (URL: https://dataspace.copernicus.eu/browser/).
Krakatau (Indonesia) — October 2023 Cite this Report
Krakatau
Indonesia
6.1009°S, 105.4233°E; summit elev. 285 m
All times are local (unless otherwise noted)
White gas-and-steam plumes and occasional ash plumes during May-August 2023
Krakatau is located in the Sunda Strait between Java and Sumatra, Indonesia. Caldera collapse during the catastrophic 1883 eruption destroyed Danan and Perbuwatan cones and left only a remnant of Rakata. The post-collapse cone of Anak Krakatau (Child of Krakatau) was constructed within the 1883 caldera at a point between the former Danan and Perbuwatan cones; it has been the site of frequent eruptions since 1927. The current eruption period began in May 2021 and has recently consisted of Strombolian eruptions and ash plumes (BGVN 48:07). This report describes lower levels of activity consisting of ash and white gas-and-steam plumes during May through August 2023, based on information provided by the Indonesian Center for Volcanology and Geological Hazard Mitigation, referred to as Pusat Vulkanologi dan Mitigasi Bencana Geologi (PVMBG), MAGMA Indonesia, and satellite data.
Activity was relatively low during May and June. Daily white gas-and-steam emissions rose 25-200 m above the crater and drifted in different directions. Five ash plumes were detected at 0519 on 10 May, 1241 on 11 May, 0920 on 12 May, 2320 on 12 May, and at 0710 on 13 May, and rose 1-2.5 km above the crater and drifted SW. A webcam image taken on 12 May showed ejection of incandescent material above the vent. A total of nine ash plumes were detected during 6-11 June: at 1434 and 00220 on 6 and 7 June the ash plumes rose 500 m above the crater and drifted NW, at 1537 on 8 June the ash plume rose 1 km above the crater and drifted SW, at 0746 and at 0846 on 9 June the ash plumes rose 800 m and 3 km above the crater and drifted SW, respectively, at 0423, 1431, and 1750 on 10 June the ash plumes rose 2 km, 1.5 km, and 3.5 km above the crater and drifted NW, respectively, and at 0030 on 11 June an ash plume rose 2 km above the crater and drifted NW. Webcam images taken on 10 and 11 June at 0455 and 0102, respectively, showed incandescent material ejected above the vent. On 19 June an ash plume at 0822 rose 1.5 km above the crater and drifted SE.
Similar low activity of white gas-and-steam emissions and few ash plumes were reported during July and August. Daily white gas-and-steam emissions rose 25-300 m above the crater and drifted in multiple directions. Three ash plumes were reported at 0843, 0851, and 0852 on 20 July that rose 500-2,000 m above the crater and drifted NW.
The MIROVA (Middle InfraRed Observation of Volcanic Activity) graph of MODIS thermal anomaly data showed intermittent low-to-moderate power thermal anomalies during May through August 2023 (figure 140). Although activity was often obscured by weather clouds, a thermal anomaly was visible in an infrared satellite image of the crater on 12 May, accompanied by an eruption plume that drifted SW (figure 141).
Geologic Background. The renowned Krakatau (frequently mis-named as Krakatoa) volcano lies in the Sunda Strait between Java and Sumatra. Collapse of an older edifice, perhaps in 416 or 535 CE, formed a 7-km-wide caldera. Remnants of that volcano are preserved in Verlaten and Lang Islands; subsequently the Rakata, Danan, and Perbuwatan cones were formed, coalescing to create the pre-1883 Krakatau Island. Caldera collapse during the catastrophic 1883 eruption destroyed Danan and Perbuwatan, and left only a remnant of Rakata. This eruption caused more than 36,000 fatalities, most as a result of tsunamis that swept the adjacent coastlines of Sumatra and Java. Pyroclastic surges traveled 40 km across the Sunda Strait and reached the Sumatra coast. After a quiescence of less than a half century, the post-collapse cone of Anak Krakatau (Child of Krakatau) was constructed within the 1883 caldera at a point between the former Danan and Perbuwatan cones. Anak Krakatau has been the site of frequent eruptions since 1927.
Information Contacts: Pusat Vulkanologi dan Mitigasi Bencana Geologi (PVMBG, also known as Indonesian Center for Volcanology and Geological Hazard Mitigation, CVGHM), Jalan Diponegoro 57, Bandung 40122, Indonesia (URL: http://www.vsi.esdm.go.id/); MAGMA Indonesia, Kementerian Energi dan Sumber Daya Mineral (URL: https://magma.esdm.go.id/v1); MIROVA (Middle InfraRed Observation of Volcanic Activity), a collaborative project between the Universities of Turin and Florence (Italy) supported by the Centre for Volcanic Risk of the Italian Civil Protection Department (URL: http://www.mirovaweb.it/); Copernicus Browser, Copernicus Data Space Ecosystem, European Space Agency (URL: https://dataspace.copernicus.eu/browser/).
Villarrica (Chile) — October 2023 Cite this Report
Villarrica
Chile
39.42°S, 71.93°W; summit elev. 2847 m
All times are local (unless otherwise noted)
Strombolian activity, gas-and-ash emissions, and crater incandescence during April-September 2023
Villarrica, in central Chile, consists of a 2-km-wide caldera that formed about 3,500 years ago and is located at the base of the presently active cone at the NW margin of a 6-km-wide caldera. Historical eruptions eruptions date back to 1558 and have been characterized by mild-to-moderate explosive activity with occasional lava effusions. The current eruption period began in December 2014 and has recently consisted of nighttime crater incandescence, ash emissions, and seismicity (BGVN 48:04). This report covers activity during April through September 2023 and describes occasional Strombolian activity, gas-and-ash emissions, and nighttime crater incandescence. Information for this report primarily comes from the Southern Andes Volcano Observatory (Observatorio Volcanológico de Los Andes del Sur, OVDAS), part of Chile's National Service of Geology and Mining (Servicio Nacional de Geología y Minería, SERNAGEOMIN) and satellite data.
Seismicity during April consisted of long period (LP) events and tremor (TRE); a total of 9,413 LP-type events and 759 TR-type events were detected throughout the month. Nighttime crater incandescence persisted and was visible in the degassing column. Sulfur dioxide data was obtained using Differential Absorption Optical Spectroscopy Equipment (DOAS) that showed an average value of 1,450 ± 198 tons per day (t/d) during 1-15 April and 1,129 ± 201 t/d during 16-30 April, with a maximum daily value of 2,784 t/d on 9 April. Gas-and-steam emissions of variable intensities rose above the active crater as high as 1.3 km above the crater on 13 April. Strombolian explosions were not observed and there was a slight decrease in the lava lake level.
There were 14,123 LP-type events and 727 TR-type events detected during May. According to sulfur dioxide measurements taken with DOAS equipment, the active crater emitted an average value of 1,826 ± 482 t/d during 1-15 May and 912 ± 41 t/d during 16-30 May, with a daily maximum value of 5,155 t/d on 13 May. Surveillance cameras showed continuous white gas-and-steam emissions that rose as high as 430 m above the crater on 27 May. Nighttime incandescence illuminated the gas column less than 300 m above the crater rim was and no pyroclastic emissions were reported. A landslide was identified on 13 May on the E flank of the volcano 50 m from the crater rim and extending 300 m away; SERNAGEOMIN noted that this event may have occurred on 12 May. During the morning of 27 and 28 May minor Strombolian explosions characterized by incandescent ejecta were recorded at the crater rim; the last reported Strombolian explosions had occurred at the end of March.
Seismic activity during June consisted of five volcano-tectonic (VT)-type events, 21,606 LP-type events, and 2,085 TR-type events. The average value of sulfur dioxide flux obtained by DOAS equipment was 1,420 ± 217 t/d during 1-15 June and 2,562 ± 804 t/d, with a maximum daily value of 4,810 t/d on 17 June. White gas-and-steam emissions rose less than 480 m above the crater; frequent nighttime crater incandescence was reflected in the degassing plume. On 12 June an emission rose 100 m above the crater and drifted NNW. On 15 June one or several emissions resulted in ashfall to the NE as far as 5.5 km from the crater, based on a Skysat satellite image. Several Strombolian explosions occurred within the crater; activity on 15 June was higher energy and ejected blocks 200-300 m on the NE slope. Surveillance cameras showed white gas-and-steam emissions rising 480 m above the crater on 16 June. On 19 and 24 June low-intensity Strombolian activity was observed, ejecting material as far as 200 m from the center of the crater to the E.
During July, seismicity included 29,319 LP-type events, 3,736 TR-type events, and two VT-type events. DOAS equipment recorded two days of sulfur dioxide emissions of 4,220 t/d and 1,009 t/d on 1 and 13 July, respectively. Constant nighttime incandescence was also recorded and was particularly noticeable when accompanied by eruptive columns on 12 and 16 July. Minor explosive events were detected in the crater. According to Skysat satellite images taken on 12, 13, and 16 July, ashfall deposits were identified 155 m S of the crater. According to POVI, incandescence was visible from two vents on the crater floor around 0336 on 12 July. Gas-and-ash emissions rose as high as 1.2 km above the crater on 13 July and drifted E and NW. A series of gas-and-steam pulses containing some ash deposited material on the upper E flank around 1551 on 13 July. During 16-31 July, average sulfur dioxide emissions of 1,679 ± 406 t/d were recorded, with a maximum daily value of 2,343 t/d on 28 July. Fine ash emissions were also reported on 16, 17, and 23 July.
Seismicity persisted during August, characterized by 27,011 LP-type events, 3,323 TR-type events, and three VT-type events. The average value of sulfur dioxide measurements taken during 1-15 August was 1,642 ± 270 t/d and 2,207 ± 4,549 t/d during 16-31 August, with a maximum daily value of 3,294 t/d on 27 August. Nighttime crater incandescence remained visible in degassing columns. White gas-and-steam emissions rose 480 m above the crater on 6 August. According to a Skysat satellite image from 6 August, ash accumulation was observed proximal to the crater and was mainly distributed toward the E slope. White gas-and-steam emissions rose 320 m above the crater on 26 August. Nighttime incandescence and Strombolian activity that generated ash emissions were reported on 27 August.
Seismicity during September was characterized by five VT-type events, 12,057 LP-type events, and 2,058 TR-type events. Nighttime incandescence persisted. On 2 September an ash emission rose 180 m above the crater and drifted SE at 1643 (figure 125) and a white gas-and-steam plume rose 320 m above the crater. According to the Buenos Aires VAAC, periods of continuous gas-and-ash emissions were visible in webcam images from 1830 on 2 September to 0110 on 3 September. Strombolian activity was observed on 2 September and during the early morning of 3 September, the latter event of which generated an ash emission that rose 60 m above the crater and drifted 100 m from the center of the crater to the NE and SW. Ashfall was reported to the SE and S as far as 750 m from the crater. The lava lake was active during 3-4 September and lava fountaining was visible for the first time since 26 March 2023, according to POVI. Fountains captured in webcam images at 2133 on 3 September and at 0054 on 4 September rose as high as 60 m above the crater rim and ejected material onto the upper W flank. Sulfur dioxide flux of 1,730 t/d and 1,281 t/d was measured on 3 and 4 September, respectively, according to data obtained by DOAS equipment.
Strong Strombolian activity and larger gas-and-ash plumes were reported during 18-20 September. On 18 September activity was also associated with energetic LP-type events and notable sulfur dioxide fluxes (as high as 4,277 t/d). On 19 September Strombolian activity and incandescence were observed. On 20 September at 0914 ash emissions rose 50 m above the crater and drifted SSE, accompanied by Strombolian activity that ejected material less than 100 m SSE, causing fall deposits on that respective flank. SERNAGEOMIN reported that a Planet Scope satellite image taken on 20 September showed the lava lake in the crater, measuring 32 m x 35 m and an area of 0.001 km2. Several ash emissions were recorded at 0841, 0910, 1251, 1306, 1312, 1315, and 1324 on 23 September and rose less than 150 m above the crater. The sulfur dioxide flux value was 698 t/d on 23 September and 1,097 t/d on 24 September. On 24 September the Volcanic Alert Level (VAL) was raised to Orange (the third level on a four-color scale). SENAPRED maintained the Alert Level at Yellow (the middle level on a three-color scale) for the communities of Villarrica, Pucón (16 km N), Curarrehue, and Panguipulli.
During 24-25 September there was an increase in seismic energy (observed at TR-events) and acoustic signals, characterized by 1 VT-type event, 213 LP-type events, and 124 TR-type events. Mainly white gas-and-steam emissions, in addition to occasional fine ash emissions were recorded. During the early morning of 25 September Strombolian explosions were reported and ejected material 250 m in all directions, though dominantly toward the NW. On 25 September the average value of sulfur dioxide flux was 760 t/d. Seismicity during 25-30 September consisted of five VT-type events, 1,937 LP-type events, and 456 TR-type events.
During 25-29 September moderate Strombolian activity was observed and ejected material as far as the crater rim. In addition, ash pulses lasting roughly 50 minutes were observed around 0700 and dispersed ENE. During 26-27 September a TR episode lasted 6.5 hours and was accompanied by discrete acoustic signals. Satellite images from 26 September showed a spatter cone on the crater floor with one vent that measured 10 x 14 m and a smaller vent about 35 m NE of the cone. SERNAGEOMIN reported an abundant number of bomb-sized blocks up to 150 m from the crater, as well as impact marks on the snow, which indicated explosive activity. A low-altitude ash emission was observed drifting NW around 1140 on 28 September, based on webcam images. Between 0620 and 0850 on 29 September an ash emission rose 60 m above the crater and drifted NW. During an overflight taken around 1000 on 29 September scientists observed molten material in the vent, a large accumulation of pyroclasts inside the crater, and energetic degassing, some of which contained a small amount of ash. Block-sized pyroclasts were deposited on the internal walls and near the crater, and a distal ash deposit was also visible. The average sulfur dioxide flux measured on 28 September was 344 t/d. Satellite images taken on 29 September ashfall was deposited roughly 3 km WNW from the crater and nighttime crater incandescence remained visible. The average sulfur dioxide flux value from 29 September was 199 t/d. On 30 September at 0740 a pulsating ash emission rose 1.1 km above the crater and drifted NNW (figure 126). Deposits on the S flank extended as far as 4.5 km from the crater rim, based on satellite images from 30 September.
Infrared MODIS satellite data processed by MIROVA (Middle InfraRed Observation of Volcanic Activity) showed intermittent thermal activity during April through September, with slightly stronger activity detected during late September (figure 127). Small clusters of thermal activity were detected during mid-June, early July, early August, and late September. According to the MODVOLC thermal alert system, a total of four thermal hotspots were detected on 7 July and 3 and 23 September. This activity was also intermittently captured in infrared satellite imagery on clear weather days (figure 128).
Geologic Background. The glacier-covered Villarrica stratovolcano, in the northern Lakes District of central Chile, is ~15 km south of the city of Pucon. A 2-km-wide caldera that formed about 3,500 years ago is located at the base of the presently active, dominantly basaltic to basaltic andesite cone at the NW margin of a 6-km-wide Pleistocene caldera. More than 30 scoria cones and fissure vents are present on the flanks. Plinian eruptions and pyroclastic flows that have extended up to 20 km from the volcano were produced during the Holocene. Lava flows up to 18 km long have issued from summit and flank vents. Eruptions documented since 1558 CE have consisted largely of mild-to-moderate explosive activity with occasional lava effusion. Glaciers cover 40 km2 of the volcano, and lahars have damaged towns on its flanks.
Information Contacts: Servicio Nacional de Geología y Minería (SERNAGEOMIN), Observatorio Volcanológico de Los Andes del Sur (OVDAS), Avda Sta María No. 0104, Santiago, Chile (URL: http://www.sernageomin.cl/); Proyecto Observación Villarrica Internet (POVI) (URL: http://www.povi.cl/); Sistema y Servicio Nacional de Prevención y Repuesta Ante Desastres (SENAPRED), Av. Beauchef 1671, Santiago, Chile (URL: https://web.senapred.cl/); Buenos Aires Volcanic Ash Advisory Center (VAAC), Servicio Meteorológico Nacional-Fuerza Aérea Argentina, 25 de mayo 658, Buenos Aires, Argentina (URL: http://www.smn.gov.ar/vaac/buenosaires/inicio.php); MIROVA (Middle InfraRed Observation of Volcanic Activity), a collaborative project between the Universities of Turin and Florence (Italy) supported by the Centre for Volcanic Risk of the Italian Civil Protection Department (URL: http://www.mirovaweb.it/); Hawai'i Institute of Geophysics and Planetology (HIGP) - MODVOLC Thermal Alerts System, School of Ocean and Earth Science and Technology (SOEST), Univ. of Hawai'i, 2525 Correa Road, Honolulu, HI 96822, USA (URL: http://modis.higp.hawaii.edu/); Copernicus Browser, Copernicus Data Space Ecosystem, European Space Agency (URL: https://dataspace.copernicus.eu/browser/).
Merapi (Indonesia) — October 2023 Cite this Report
Merapi
Indonesia
7.54°S, 110.446°E; summit elev. 2910 m
All times are local (unless otherwise noted)
Frequent incandescent avalanches during April-September 2023
Merapi, located just north of the major city of Yogyakarta in central Java, Indonesia, has had activity within the last 20 years characterized by pyroclastic flows and lahars accompanying growth and collapse of the steep-sided active summit lava dome. The current eruption period began in late December 2020 and has more recently consisted of ash plumes, intermittent incandescent avalanches of material, and pyroclastic flows (BGVN 48:04). This report covers activity during April through September 2023, based on information from Balai Penyelidikan dan Pengembangan Teknologi Kebencanaan Geologi (BPPTKG), the Center for Research and Development of Geological Disaster Technology, a branch of PVMBG which specifically monitors Merapi. Additional information comes from the Pusat Vulkanologi dan Mitigasi Bencana Geologi (PVMBG, also known as Indonesian Center for Volcanology and Geological Hazard Mitigation, CVGHM), MAGMA Indonesia, the Darwin Volcanic Ash Advisory Centre (VAAC), and various satellite data.
Activity during April through September 2023 primarily consisted of incandescent avalanches of material that mainly affected the SW and W flanks and traveled as far as 2.3 km from the summit (table 25) and white gas-and-steam emissions that rose 10-1,000 m above the crater.
Table 25. Monthly summary of avalanches and avalanche distances recorded at Merapi during April through September 2023. The number of reported avalanches does not include instances where possible avalanches were heard but could not be visually confirmed as a result of inclement weather. Data courtesy of BPPTKG (April-September 2023 daily reports).
| Month |
Average number of avalanches per day |
Distance avalanches traveled (m) |
| Apr 2023 |
19 |
1,200-2,000 |
| May 2023 |
22 |
500-2,000 |
| Jun 2023 |
18 |
1,200-2,000 |
| Jul 2023 |
30 |
300-2,000 |
| Aug 2023 |
25 |
400-2,300 |
| Sep 2023 |
23 |
600-2,000 |
BPPTKG reported that during April and May white gas-and-steam emissions rose 10-750 m above the crater, incandescent avalanches descended 500-2,000 m on the SW and W flanks (figure 135). Cloudy weather often prevented clear views of the summit, and sometimes avalanches could not be confirmed. According to a webcam image, a pyroclastic flow was visible on 17 April at 0531. During the week of 28 April and 4 May a pyroclastic flow was reported on the SW flank, traveling up to 2.5 km. According to a drone overflight taken on 17 May the SW lava dome volume was an estimated 2,372,800 cubic meters and the dome in the main crater was an estimated 2,337,300 cubic meters.
During June and July similar activity persisted with white gas-and-steam emissions rising 10-350 m above the crater and frequent incandescent avalanches that traveled 300-2,000 m down the SW, W, and S flanks (figure 136). Based on an analysis of aerial photos taken on 24 June the volume of the SW lava dome was approximately 2.5 million cubic meters. A pyroclastic flow was observed on 5 July that traveled 2.7 km on the SW flank. According to the Darwin VAAC multiple minor ash plumes were identified in satellite images on 19 July that rose to 3.7 km altitude and drifted S and SW. During 22, 25, and 26 July a total of 17 avalanches descended as far as 1.8 km on the S flank.
Frequent white gas-and-steam emissions continued during August and September, rising 10-450 m above the crater. Incandescent avalanches mainly affected the SW and W flanks and traveled 400-2,300 m from the vent (figure 137). An aerial survey conducted on 10 August was analyzed and reported that estimates of the SW dome volume was 2,764,300 cubic meters and the dome in the main crater was 2,369,800 cubic meters.
Frequent and moderate-power thermal activity continued throughout the reporting period, according to a MIROVA (Middle InfraRed Observation of Volcanic Activity) analysis of MODIS satellite data (figure 138). There was an increase in the number of detected anomalies during mid-May. The MODVOLC thermal algorithm recorded a total of 47 thermal hotspots: six during April, nine during May, eight during June, 15 during July, four during August, and five during September. Some of this activity was captured in infrared satellite imagery on clear weather days, sometimes accompanied by incandescent material on the SW flank (figure 139).
Geologic Background. Merapi, one of Indonesia's most active volcanoes, lies in one of the world's most densely populated areas and dominates the landscape immediately north of the major city of Yogyakarta. It is the youngest and southernmost of a volcanic chain extending NNW to Ungaran volcano. Growth of Old Merapi during the Pleistocene ended with major edifice collapse perhaps about 2,000 years ago, leaving a large arcuate scarp cutting the eroded older Batulawang volcano. Subsequent growth of the steep-sided Young Merapi edifice, its upper part unvegetated due to frequent activity, began SW of the earlier collapse scarp. Pyroclastic flows and lahars accompanying growth and collapse of the steep-sided active summit lava dome have devastated cultivated lands on the western-to-southern flanks and caused many fatalities.
Information Contacts: Balai Penyelidikan dan Pengembangan Teknologi Kebencanaan Geologi (BPPTKG), Center for Research and Development of Geological Disaster Technology (URL: http://merapi.bgl.esdm.go.id/, Twitter: @BPPTKG); MAGMA Indonesia, Kementerian Energi dan Sumber Daya Mineral (URL: https://magma.esdm.go.id/v1); Pusat Vulkanologi dan Mitigasi Bencana Geologi (PVMBG, also known as Indonesian Center for Volcanology and Geological Hazard Mitigation, CVGHM), Jalan Diponegoro 57, Bandung 40122, Indonesia (URL: http://www.vsi.esdm.go.id/); Darwin Volcanic Ash Advisory Centre (VAAC), Bureau of Meteorology, Northern Territory Regional Office, PO Box 40050, Casuarina, NT 0811, Australia (URL: http://www.bom.gov.au/info/vaac/); MIROVA (Middle InfraRed Observation of Volcanic Activity), a collaborative project between the Universities of Turin and Florence (Italy) supported by the Centre for Volcanic Risk of the Italian Civil Protection Department (URL: http://www.mirovaweb.it/); Hawai'i Institute of Geophysics and Planetology (HIGP) - MODVOLC Thermal Alerts System, School of Ocean and Earth Science and Technology (SOEST), Univ. of Hawai'i, 2525 Correa Road, Honolulu, HI 96822, USA (URL: http://modis.higp.hawaii.edu/); Copernicus Browser, Copernicus Data Space Ecosystem, European Space Agency (URL: https://dataspace.copernicus.eu/browser/); Øystein Lund Andersen (URL: https://www.oysteinlundandersen.com/, https://twitter.com/oysteinvolcano).
Ebeko
Russia
50.686°N, 156.014°E; summit elev. 1103 m
All times are local (unless otherwise noted)
Moderate explosive activity with ash plumes continued during June-November 2023
Ebeko, located on the N end of Paramushir Island in Russia’s Kuril Islands just S of the Kamchatka Peninsula, consists of three summit craters along a SSW-NNE line at the northern end of a complex of five volcanic cones. Observed eruptions date back to the late 18th century and have been characterized as small-to-moderate explosions from the summit crater, accompanied by intense fumarolic activity. The current eruptive period began in June 2022, consisting of frequent explosions, ash plumes, and thermal activity (BGVN 47:10, 48:06). This report covers similar activity during June-November 2023, based on information from the Kamchatka Volcanic Eruptions Response Team (KVERT) and satellite data.
Moderate explosive activity continued during June-November 2023 (figures 50 and 51). According to visual data from Severo-Kurilsk, explosions sent ash 2-3.5 km above the summit (3-4.5 km altitude) during most days during June through mid-September. Activity after mid-September was slightly weaker, with ash usually reaching less than 2 km above the summit. According to KVERT the volcano in October and November was, with a few exceptions, either quiet or obscured by clouds that prevented satellite observations. KVERT issued Volcano Observatory Notices for Aviation (VONA) on 8 and 12 June, 13 and 22 July, 3 and 21 August, and 31 October warning of potential aviation hazards from ash plumes drifting 3-15 km from the volcano. Based on satellite data, KVERT reported a persistent thermal anomaly whenever weather clouds permitted viewing.
Geologic Background. The flat-topped summit of the central cone of Ebeko volcano, one of the most active in the Kuril Islands, occupies the northern end of Paramushir Island. Three summit craters located along a SSW-NNE line form Ebeko volcano proper, at the northern end of a complex of five volcanic cones. Blocky lava flows extend west from Ebeko and SE from the neighboring Nezametnyi cone. The eastern part of the southern crater contains strong solfataras and a large boiling spring. The central crater is filled by a lake about 20 m deep whose shores are lined with steaming solfataras; the northern crater lies across a narrow, low barrier from the central crater and contains a small, cold crescentic lake. Historical activity, recorded since the late-18th century, has been restricted to small-to-moderate explosive eruptions from the summit craters. Intense fumarolic activity occurs in the summit craters, on the outer flanks of the cone, and in lateral explosion craters.
Information Contacts: Kamchatka Volcanic Eruptions Response Team (KVERT), Far Eastern Branch, Russian Academy of Sciences, 9 Piip Blvd., Petropavlovsk-Kamchatsky, 683006, Russia (URL: http://www.kscnet.ru/ivs/kvert/).
Search Bulletin Archive by Publication Date
Select a month and year from the drop-downs and click "Show Issue" to have that issue displayed in this tab.
The default month and year is the latest issue available.
Bulletin of the Global Volcanism Network - Volume 31, Number 04 (April 2006)
Managing Editor: Richard Wunderman
Augustine (United States)
Dome building eruptions continuing through late March 2006 and later
Bezymianny (Russia)
Pyroclastic flows on 9 May extend 7-8 km; plumes over 500 km long
Bulusan (Philippines)
Eruptions and earthquakes in March and April 2006 after years of little activity
Karymsky (Russia)
During April 2006, emerging ash plumes remained visible for up to 145 km
Kilauea (United States)
Maps of past year's surface lava flows and photos of lava entering the sea
Lascar (Chile)
Five-day eruption sequence in April 2006; plume seen 220 km away
Masaya (Nicaragua)
Intermittent ash eruptions November 2003-March 2005; continuing incandescence
Sangay (Ecuador)
Some conspicuous plumes during 2004-2005; climber's photos from January 2006
Santa Maria (Guatemala)
During October 2005 to January 2006, occasional ash plumes
Saunders (United Kingdom)
Lack of new thermal signals suggesting any eruption since October 2005
Soputan (Indonesia)
Late 2005 phreatic and Strombolian eruptions; ash plume to ~ 5.8 km altitude
Augustine (United States) — April 2006 Cite this Report
Augustine
United States
59.3626°N, 153.435°W; summit elev. 1218 m
All times are local (unless otherwise noted)
Dome building eruptions continuing through late March 2006 and later
Although the previous report (BGVN 31:01) noted Augustine's events through 22 February 2006, this one overlaps and further discusses some aspects of behavior during late January through 1 February 2006. This report then continues with summaries of Alaska Volcano Observatory (AVO) reports during 24 February to 26 March 2006.
After eight months of increasing seismicity, gas-and-steam emissions, and phreatic eruptions in December 2005, Augustine began magmatic eruptions on 11 January 2006 (BGVN 30:12). Eruptions continued throughout January, producing ash clouds up to ~ 9 km altitude. The eruption was described by Jon Dehn (University of Alaska Fairbanks, personal communication) as occurring in the following three phases: I) 11-28 January; II) 29 January-4 February; and III) 5 February and into at least late March.
During 11 January to 21 March 2006 (70 days), the Anchorage Volcanic Ash Advisory Center (VAAC) issued text reports (Volcanic Activity Advisories) on Augustine 567 times (averaging 8.1 reports per day). These alerted the aviation community to the ongoing airborne-ash hazards.
Augustine lies ~ 277 km SW of Anchorage's airport, a key hub for flights across the North Pacific. According to the US Department of Transportation, during 2003 Anchorage's airport supported the largest tonnage of any in the US, and functioned as the 8th busiest in the US by value of shipments. Augustine's eruptions can potentially impact aviation and operations at the airport, and more generally, they complicate North Pacific air travel.
Plumes, 28 January-1 February. AIRS SO2 retrievals for Augustine plumes on 28 and 29 January were provided by Fred Prata (figure 27). He commented that the SO2 "blobs" seem to spread out rather than elongate into a plume shape, possibly because of calm winds or intermittent ejections.
Shortly after the 28-29 January plumes mentioned above, on 30 January, an overflight by AVO confirmed a ~ 5-km-tall volcanic cloud and small explosions and associated pyroclastic flows. The airborne observations indicated that a considerable amount of ash was being produced during this time period from small explosions and associated pyroclastic flows. Figures 28 and 29 show images from 30 January. AVO also presented 31 January thermal infrared images similarly indicative of vigorous eruptions and fresh pyroclastic flows (figure 30).
René Servranckx looked at several images from 1 February 2006 and sent associated messages and links to the Volcanicclouds listserv. He found a hotspot at Augustine and identified various cloud features from plumes. Using a NOAA-12 IR image taken at 1542 UTC, Servranckx could not detect an ash signature in the split window.
On 4 February, Ken Dean (UAF) posted a message on the Volcanicclouds listserv discussing Augustine for 28 January-1 February. He noted that, regarding SO2 detection in northern Alaska, they had been monitoring the atmospheric transport direction using Puff, a modeling routine for predicting the atmospheric dispersal of ash clouds. Generally speaking, trajectories were to the N and over Fairbanks. Accordingly, lidar systems at both the UAF's Geophysical Institute and ~ 50 km N of Fairbanks at the Poker Flat Rocket Range were turned on to see if they could detect volcanic aerosols from the eruption. Lidar uses laser energy to probe the atmosphere, where it can detect suspended material such as volcanic aerosols in identifiable regions. Preliminary results indicated volcanic aerosols at 4.6-6.6 km altitude in the atmosphere above both Fairbanks and Poker Flats. There could also have been volcanic aerosols at lower altitudes in the weather clouds.
Dean also noted that ground-based event-monitoring collectors set out by Cathy Cahill (UAF) sampled volcanic aerosols and possible traces of ash at Fairbanks. He noted that these observations and trajectories were consistent with Prata's SO2 observations and Servranckx's back trajectories.
24 February-26 March 2006. On 24 February, AVO noted repeated and ongoing unrest during the past week. This included relatively low but above-background seismicity that indicated small, intermittent rockfalls and avalanches from the lava dome. Satellites detected a persisting thermal anomaly in the summit area. These data, along with a 20 February visit to the island, indicated continued slow growth at the summit lava dome. A veil of fresh, light ash dressed Augustine's flanks. The ongoing AVO reports into March noted similar processes and observations, and soon included mention of ash plumes, a lava flow, and a pyroclastic flow.
An overflight of the volcano on 1 March revealed a short, stubby lava flow that extended NE from the dome, terminating at ~ 1 km elevation. AVO noted a small dilute ash plume as well as a 20-minute interval of elevated seismicity at 1010 on 5 March, interpreted as a small explosion with associated ash emission, although low clouds obscured web-camera views. On 6 March AVO reported seismic signals and the low-light camera in Homer suggested rockfalls and avalanches. Although Augustine's plumes in this time frame were generally characterized as local, dilute, and under ~ 1 km above the summit, pyroclastic flows were also seen on 6 March.
Early on the morning of 8 March, AVO's seismometers began recording periods of discrete, repetitive, small events. These signals were taken to indicate ongoing dome growth, observations consistent with those from web cameras, which revealed minor ash emissions and mass wasting. Reports on 8 and 9 March discussed seismicity sufficiently elevated as to sometimes saturate several instruments. In addition, cameras portrayed two areas of high thermal flux. AVO initially interpreted these observations as including elevated rates of lava extruding into the dome, possibly with vigorous lava movement, and block-and-ash flows.
Later reports disclosed further details from around 9 March. AVO's 8-10 March reports noted that the summit was steaming more vigorously than the previous 3-4 weeks. A brownish-orange plume rose from the top of the summit lava dome. Fumaroles on the S and W side of the dome were the source of the most vigorous steaming. Areas of bare ground on the upper W and S flanks had substantially enlarged since 1 March. The greatest amounts of steam came from bare areas on the upper NW flank. Web-camera images and observations from overflights on 8 and 9 March indicated regular small-scale collapses of the summit lava dome. Usually these collapse events produce block-and-ash flows and small diffuse ash clouds. Block-and-ash flows to the E to NE sectors extended to within about 1 km of the coastline. Dilute ash clouds were observed rising from the block-and-ash flows to about the level of the summit and drifting away with the wind.
10 March seismicity included prolonged volcanic tremor and an increase in the frequency of small volcano-tectonic earthquakes. Block-and-ash flows, rock avalanches, and rockfalls originating from the summit lava dome continue to be recorded by the seismic network, particularly at the E flank station.
The 10 March report stated that "Satellite and low-light camera images obtained intermittently throughout the week show that thermal anomalies in the summit area and on the upper NE flank persist. On several evenings this past week, a low-light camera at the AVO site in Homer captured hot avalanches in progress and prolonged periods of incandescence. AVO also received several reports from observers in Homer and Nanwalek of summit glow in the evening hours. Airborne measurements of gas emissions made on March 9 indicate both SO2 and CO2 gas in the plume. This is the first time since the fall of 2005 that CO2 has been a component of the gas plume and likely indicates the presence of new magma entering the volcanic system."
The AVO report for 17 March chronicled low-level eruptive activity. It said that the past week's seismicity changed from periods of prolonged tremor and closely spaced discreet events to episodic short-duration events. Observers interpreted the change as indicating that steady effusion of lava and dome growth had given way to slower effusion of lava and intermittent block-and-ash flows, rock avalanches, and rock-falls from the summit lava dome. On several evenings during the week, clear atmospheric conditions enabled low-light cameras at the AVO site in Homer to capture hot avalanches and prolonged periods of incandescence in both the summit area and on the upper NE flank. Satellite images also showed thermal anomalies.
The 17 March report said that overflights indicated two lava flows were seen on the N and NE flanks. They advanced slowly. Occasional collapses of the lava flow fronts shed hot blocks and produce minor ash emissions. Estimates using photographs indicated that the new lava dome stood ~ 70 m higher than the one formed in 1986.
Little new information was discussed in AVO reports issued on 20-26 March. The 26 March report included the remark that satellite views were then obscured by cloud cover; however, vigorous steaming from the summit was visible with the on-island web camera.
Correction. A previous Augustine report (BGVN 30:12; issued in early 2006) had a typographic error in the title: "Eruptions begin 11 January 2005 and eight outbursts occur by late January)." The year has since been changed on our website to 11 January 2006.
Geologic Background. Augustine volcano, rising above Kamishak Bay in the southern Cook Inlet about 290 km SW of Anchorage, is the most active volcano of the eastern Aleutian arc. It consists of a complex of overlapping summit lava domes surrounded by an apron of volcaniclastic debris that descends to the sea on all sides. Few lava flows are exposed; the flanks consist mainly of debris-avalanche and pyroclastic-flow deposits formed by repeated collapse and regrowth of the summit. The latest episode of edifice collapse occurred during Augustine's large 1883 eruption; subsequent dome growth has restored the edifice to a height comparable to that prior to 1883. The oldest dated volcanic rocks on Augustine are more than 40,000 years old. At least 11 large debris avalanches have reached the sea during the past 1,800-2,000 years, and five major pumiceous tephras have been erupted during this interval. Recorded eruptions have typically consisted of explosive activity with emplacement of pumiceous pyroclastic-flow deposits followed by lava dome extrusion with associated block-and-ash flows.
Information Contacts: Jon Dehn, Cathy Cahill, Ken Dean, and Pavel E. Izbekov, Geophysical Institute, University of Alaska Fairbanks, 903 Koyukuk Drive, PO Box 757320 Fairbanks, AK 99775-7320, USA; Anchorage VAAC, Alaska Aviation Weather Unit, National Weather Service, 6930 Sand Lake Road, Anchorage, AK 99502, USA (URL: http://aawu.arh.noaa.gov/vaac.php); Fred Prata, Norwegian Institute for Air Research, P.O. Box 100, 2027 Kjeller, Norway; René Servranckx, Montreal Volcanic Ash Advisory Centre, Canadian Meteorological Centre, Meteorological Service of Canada, 2121 North Service Road, Trans-Canada Highway, Dorval, Quebec, H9P 1J3 Canada; Alaska Volcano Observatory (AVO), a cooperative program of the U.S. Geological Survey, 4200 University Drive, Anchorage, AK 99508-4667, USA (URL: http://www.avo.alaska.edu/), Geophysical Institute, University of Alaska, PO Box 757320, Fairbanks, AK 99775-7320, USA, and Alaska Division of Geological & Geophysical Surveys, 794 University Ave., Suite 200, Fairbanks, AK 99709, USA.
Bezymianny (Russia) — April 2006 Cite this Report
Bezymianny
Russia
55.972°N, 160.595°E; summit elev. 2882 m
All times are local (unless otherwise noted)
Pyroclastic flows on 9 May extend 7-8 km; plumes over 500 km long
This report describes a substantial eruption on 9 May 2006, and events before and shortly afterwards. Bezymianny was last reported on in BGVN 30:11, covering a series of events during mid-January through late December 2005.
An explosive eruption occurred on 30 November 2005. Seismicity decreased subsequently and from January to the end of April 2006, Bezymianny remained comparatively calm; fumarolic activity and a small thermal anomaly were observed during periods of good visibility. A 1 April aerial photo of the summit area appears as figure 6.
During 28 April to 5 May, Bezymianny's lava dome continued to grow. Seismicity was above background levels during 30 April to 3 May. Incandescent avalanches were visible on 4 May. At the lava dome, fumarolic activity occurred and thermal anomalies were visible on satellite imagery. Bezymianny was at Yellow on the four stage Concern Color Code (low to high–Green, Yellow, Orange, Red).
On 7 May the Concern Color Code was raised to Orange due to an increase in seismicity and the number of incandescent avalanches (14 occurred on 6 May in comparison to 4-6 during the previous 2 days). Intense fumarolic activity occurred, with occasional small amounts of ash. KVERT reported that an explosive eruption was possible in the next 1 or 2 weeks.
9 May eruption. On 9 May around 1935, the Concern Color Code was raised to Red, the highest level, due to increased seismicity and incandescent avalanches. A gas plume rose higher than 7 km altitude and a strong thermal anomaly was visible on satellite imagery.
An explosive eruption occurred on 9 May during 2121 to 2145. The explosion produced an ash column that rose to a height of ~ 15 km altitude. A co-ignimbrite ash plume was about 40 km in diameter and mainly extended NE of the volcano. Ash plumes extended more than 500 km ENE from the volcano. Pyroclastic flows deposits extended 7-8 km from the volcano.
On 10 May around 0100, seismicity returned to background levels and the Concern Color Code was reduced to Orange. Small fumarolic plumes were observed during the early morning of the 10th and lava probably began to flow at the lava dome.
By 11 May seismic activity was still at background levels. Gas and steam plumes were visible above the volcano. A thermal anomaly was noted at the volcano on 10-11 May. Lava effusion was probably occurring at the lava dome. This was interpreted to mean that the likelihood of a large, ash-producing eruption had diminished.
Geologic Background. The modern Bezymianny, much smaller than its massive neighbors Kamen and Kliuchevskoi on the Kamchatka Peninsula, was formed about 4,700 years ago over a late-Pleistocene lava-dome complex and an edifice built about 11,000-7,000 years ago. Three periods of intensified activity have occurred during the past 3,000 years. The latest period, which was preceded by a 1,000-year quiescence, began with the dramatic 1955-56 eruption. This eruption, similar to that of St. Helens in 1980, produced a large open crater that was formed by collapse of the summit and an associated lateral blast. Subsequent episodic but ongoing lava-dome growth, accompanied by intermittent explosive activity and pyroclastic flows, has largely filled the 1956 crater.
Information Contacts: Olga Girina, Kamchatka Volcanic Eruptions Response Team (KVERT), a cooperative program of the Institute of Volcanic Geology and Geochemistry, Far East Division, Russian Academy of Sciences, Piip Ave. 9, Petropavlovsk-Kamchatsky, 683006, Russia, the Kamchatka Experimental and Methodical Seismological Department (KEMSD), GS RAS (Russia), and the Alaska Volcano Observatory (USA); Alaska Volcano Observatory (AVO), a cooperative program of the U.S. Geological Survey, 4200 University Drive, Anchorage, AK 99508-4667, USA (URL: http://www.avo.alaska.edu/), the Geophysical Institute, University of Alaska, PO Box 757320, Fairbanks, AK 99775-7320, USA, and the Alaska Division of Geological and Geophysical Surveys, 794 University Ave., Suite 200, Fairbanks, AK 99709, USA.
Bulusan (Philippines) — April 2006 Cite this Report
Bulusan
Philippines
12.769°N, 124.056°E; summit elev. 1535 m
All times are local (unless otherwise noted)
Eruptions and earthquakes in March and April 2006 after years of little activity
Bulusan, after remaining relatively quiet since 1995, erupted multiple times during March and April 2006. There were no casualties or damage from these eruptions. On 21 March at 1044 the summit crater erupted, sending a column of ash 1.5 km into the sky accompanied by lightning and rumbling noises. Ash drifted N, W, and SW of the volcano and an hour after the event light ash fell on neighborhoods such as Barangays Cogon, Tinampo, Gulang-Gulang, and Bolos in the town of Irosin, as well as Barangays Puting Sapa and Bura-Buran in the town of Juban.
Ash ejected at 1058 on 22 March coincided with an explosion-type earthquake. Three other earthquakes were recorded at 2330, 2332, and 2337. The hazard status had been raised to Alert Level 1; the area within a 4 km radius of the summit is a Permanent Danger Zone.
On 29 April the volcano erupted in a similar fashion, emitting ash nearly 1.6 km into the air. There was no sign of lava and no reports of rumbling noises. It was reported that ash rained on nearby communities.
Geologic Background. Luzon's southernmost volcano, Bulusan, was constructed along the rim of the 11-km-diameter dacitic-to-rhyolitic Irosin caldera, which was formed about 36,000 years ago. It lies at the SE end of the Bicol volcanic arc occupying the peninsula of the same name that forms the elongated SE tip of Luzon. A broad, flat moat is located below the topographically prominent SW rim of Irosin caldera; the NE rim is buried by the andesitic complex. Bulusan is flanked by several other large intracaldera lava domes and cones, including the prominent Mount Jormajan lava dome on the SW flank and Sharp Peak to the NE. The summit is unvegetated and contains a 300-m-wide, 50-m-deep crater. Three small craters are located on the SE flank. Many moderate explosive eruptions have been recorded since the mid-19th century.
Information Contacts: R.U. Solidum and E. Corpuz, Philippine Institute of Volcanology and Seismology (PHIVOLCS), Department of Science and Technology, PHIVOLCS Building, C.P. Garcia Avenue, Univ. of the Philippines Campus, Diliman, Quezon City, Philippines (URL: http://www.phivolcs.dost.gov.ph/); Inq7.net, a venture between The Philippine Daily Inquirer Inc., and GMANetwork Inc. (URL: http://news.inq7.net/).
Karymsky
Russia
54.049°N, 159.443°E; summit elev. 1513 m
All times are local (unless otherwise noted)
During April 2006, emerging ash plumes remained visible for up to 145 km
Karymsky was last reported on in BGVN 30:11. After frequent explosions from December 2004 to June 2005 (BGVN 30:06) a brief decrease in seismic and volcanic activity took place but this ended in late June when ash and gas plumes rose to 3 km above the crater. Seismicity remained above background levels throughout August-December 2005. During this period, ash and gas plumes and thermal anomalies were observed at the volcano.
Seismic activity indicated that ash explosions from the summit crater of Karymsky continued during 14-20 January 2006. Ash plumes extending 6-9 km S from the volcano were observed on 12 January and a thermal anomaly over the dome was observed during 13-15 January. According to seismic data, two possible ash plumes rose to 3.0-3.4 km altitude on 14-15 January.
According to reports from pilots of local airlines, ash emissions from Karymsky rose to 4-5 km altitude during 30-31 January. The ash plumes extended 13-29 km to the SW and SE, respectively. A thermal anomaly was visible at the lava dome during 27 January to 3 February, except when the volcano was obscured by clouds on 28 January. KVERT warned that activity from the volcano could affect nearby low-flying aircraft.
Strombolian activity continued through April 2006. During 10 February to 10 March, a large thermal anomaly was visible at the crater and numerous ash plumes were visible on satellite imagery extending as far as 140 km. On 9 March, a pilot reported an ash plume at a height of ~ 3 km altitude.
During 17-24 March, several ash plumes were visible on satellite imagery at a height of ~ 4 km altitude and extending SE and E. A thermal anomaly was seen at the volcano during periods of visibility. About 40-450 small earthquakes occurred daily.
During 7-14 April satellite imagery showed ash plumes extending ~ 40-145 km E and SE of the volcano, and a large thermal anomaly at the crater. Karymsky remained at Concern Color Code Orange from January to April 2006.
Geologic Background. Karymsky, the most active volcano of Kamchatka's eastern volcanic zone, is a symmetrical stratovolcano constructed within a 5-km-wide caldera that formed during the early Holocene. The caldera cuts the south side of the Pleistocene Dvor volcano and is located outside the north margin of the large mid-Pleistocene Polovinka caldera, which contains the smaller Akademia Nauk and Odnoboky calderas. Most seismicity preceding Karymsky eruptions originated beneath Akademia Nauk caldera, located immediately south. The caldera enclosing Karymsky formed about 7600-7700 radiocarbon years ago; construction of the stratovolcano began about 2000 years later. The latest eruptive period began about 500 years ago, following a 2300-year quiescence. Much of the cone is mantled by lava flows less than 200 years old. Historical eruptions have been vulcanian or vulcanian-strombolian with moderate explosive activity and occasional lava flows from the summit crater.
Information Contacts: Olga Girina, Kamchatka Volcanic Eruptions Response Team (KVERT), a cooperative program of the Institute of Volcanic Geology and Geochemistry, Far East Division, Russian Academy of Sciences, Piip Ave. 9, Petropavlovsk-Kamchatsky, 683006, Russia, the Kamchatka Experimental and Methodical Seismological Department (KEMSD), GS RAS (Russia), and the Alaska Volcano Observatory (USA); Alaska Volcano Observatory (AVO), a cooperative program of the U.S. Geological Survey, 4200 University Drive, Anchorage, AK 99508-4667, USA (URL: http://www.avo.alaska.edu/), the Geophysical Institute, University of Alaska, PO Box 757320, Fairbanks, AK 99775-7320, USA, and the Alaska Division of Geological and Geophysical Surveys, 794 University Ave., Suite 200, Fairbanks, AK 99709, USA; Tokyo Volcanic Ash Advisory Center (VAAC) (URL: https://ds.data.jma.go.jp/svd/vaac/data/).
Kilauea (United States) — April 2006 Cite this Report
Kilauea
United States
19.421°N, 155.287°W; summit elev. 1222 m
All times are local (unless otherwise noted)
Maps of past year's surface lava flows and photos of lava entering the sea
This report covers the interval 31 January 2005 to 7 February 2006 and is drawn exclusively from U.S. Geological Survey Hawaiian Volcanic Observatory (USGS HVO) sources. During this interval, active lava flows during tended to remain along the W to central portions of the existing field (figures 173 and 174). On 31 January 2005, lava from Kīlauea began pouring into the ocean at two entry points. The Ka`ili`ili entry to the E of the flow field was the largest and was fed by the large W arm of the Prince Kuhio Kalaniana (PKK) lava flow. The West Highcastle ocean entry was supplied by the W branch of the W arm of the PKK lava flow.
From 7 February 2005 to 20 February 2005, lava flows were visible on the Pulama pali fault scarp and on the coastal flat. Instruments recorded a few small earthquakes and no tremor at Kīlauea's summit. At Pu`u `O`o, volcanic tremor remained moderate. Small amounts of deformation were recorded.
On 21 February 2005 a new ocean entry formed, named E Lae`apuki. The entry was located between the other two ocean entries (Ka`ili`ili and West Highcastle) that had been active since 31 January 2005. This was the first time there had been three ocean entries active since early 2003 (figures 173-175).
During 23-26 February 2005, lava from Pu`u `O`o entered the sea at three ocean entries–West Highcastle, East Lae'apuki, and Ka`ili`ili–spots along 4.7 km of the island's SE coast (figure 176). Lava may have stopped flowing into the sea at the W entry (West Highcastle) on 26 February 2005. The number of surface lava flows diminished in comparison to the previous weeks, and small earthquakes continued to occur at Kīlauea's summit without accompanying tremor. Tremor remained at moderate levels at Pu`u `O`o, and as of 28 February 2005, deflation had occurred at Pu`u `O`o for more than a week and at the summit since 24 February 2005.
During the month of March 2005, lava from Kīlauea continued to enter the ocean at the Ka`ili`ili and E Lae`apuki, but there were no signs of activity at the West Highcastle entry. Surface lava flowed down the Pulami pali fault scarp and the coastal flat. Small earthquakes occurred at Kīlauea's summit, and no tremor was recorded. Tremor remained at moderate levels at Pu`u `O`o.
On 29 March 2005, lava from Kīlauea entered the ocean at five areas. The largest, named Kamoamoa, consisted of six or more places where lava entered the water along the front of a growing lava delta (figure 177). At one of the two Highcastle entries, a cascade of lava streamed down the old sea cliff. A bright glow came from Ka`ili`ili entry, and a weak glow from E Highcastle entry. Seismicity remained above background levels at Kīlauea's summit, consisting mainly of tremor and some long-period earthquakes. Surface waves from an M 8.7 earthquake on 28 March 2005 off Sumatra, Indonesia disturbed tilt measurements at Kīlauea but otherwise the tilt change was small.
Lava from Kīlauea continued to flow into the ocean at several points during 1-13 April 2005. Seismicity remained above background levels at Kīlauea's summit, consisting mainly of tremor and some long-period earthquakes. Volcanic tremor was at moderate levels at Pu`u `O`o. During 14-19 April, surface lava flows from Kīlauea were visible on the Pulama pali fault scarp but lava was not seen entering the ocean.
Seismicity remained above background levels at Kīlauea's summit during 14-19 April 2005, consisting mainly of tremor and some long-period earthquakes. Volcanic tremor was at moderate levels at Pu`u `O`o. Episodes of inflation and deflation occurred during the week.
During 21-25 April, there were fewer surface lava flows visible at Kīlauea than during the previous week. On 24 April a small amount of lava again began to enter the sea. Seismicity remained above background levels at Kīlauea's summit, consisting mainly of tremor and some long-period earthquakes.
During 27 April-3 May 2005, lava entered the ocean at the Kamoamoa entry. Numerous surface lava flows were visible on the coastal flat. Seismicity remained above background levels at Kīlauea's summit, consisting of both tremor and long-period earthquakes.
A third ocean entry, in the E Lae`apuki area, became active on 5 May 2005. That entry and the Far E Lae`apuki entry were both being fed by lava falls down the old sea cliff and were relatively small. Based on the brighter glow, the Kamoamoa entry was thought to be more substantial. By the morning of 9 May lava was streaming over the old sea cliff in four locations: two falls went into the sea and two other falls landed on an old delta. The branch of the PKK flow feeding E Lae`apuki sprung numerous new lava flows on 9 May. The next day, the middle branch of the PKK flow developed an open-channel stream on the Pulama pali; it was 10-20 m wide, 500-600 m long, and moving rapidly.
Ocean entries remained active during 11-17 May 2005 in the E Lae`apuki and Kamoamoa areas. By 16 May the E Lae`apuki and E Kamoamoa entries both had benches ~ 350 m long and up to 75 m wide. A large plume from West Highcastle on 10 May probably recorded a collapse of part of that lava delta, which has been inactive for the past several weeks following growth in March and April. The middle branch of the PKK flow remained active and extended down Pulama Pali. The E branch reached out farther but was narrower and contained fewer breakouts. The W branch was reduced to a cluster of breakouts about halfway down the pali. Glow was seen from all of the Pu`u `O`o crater vents, as well as the MLK vent at the SW foot of the cone.
During 18-31 May 2005, lava from Kīlauea continued to enter the sea at three areas. Surface lava flows were visible on the coastal plain and on the Pulama pali fault scarp. During 1-4 June 2005 lava entered the sea at three points along the S flank of Kīlauea, and then at only two points through 7 June. Small surface lava flows were visible on the Pulama pali fault scarp and the coastal flat.
Lava again entered the sea at three points on 13 June. During the 14-21 June lava continued to enter the sea and there was a small number of lava flows on the Pulama pali fault scarp. On 22 June lava in the W branch of the current flow descended onto the coastal flat for the first time in several months. On 24 June it was noted that Kīlauea's summit continued its inflation, while Pu`u `O`o was deflating during the same period.
On 27 June part of the active E Lae`apuki lava delta collapsed. Lava stored within the delta gushed out onto the surface and into the water. Fountains of lava reported to be about 25 m high spurted from the central part of the delta soon afterward. Lava also entered the sea during 4-5 July and a few surface flows were on Pulama pali.
During 6-19 July 2005, lava continued to enter the sea at E Kamoamoa and E Lae`apuki. The latter entry was much larger, with several entry points. E Kamoamoa barely glowed. Surface lava was visible along the PKK lava flow throughout the month of July. Background volcanic tremor remained above normal levels at Kīlauea's summit and at moderate levels at Pu`u `O`o. Slight inflation and deflation occurred at the volcano. An M 4.5 earthquake occurred on 25 July at 2209 along the SE edge of Kīlauea's SW rift zone at a depth of ~ 30 km.
Up to seven ocean-entry points were visible off the W-facing front of the E Lae`apuki lava delta during 3-9 August; still others were hidden from view off the E-facing front. On Pulama pali, the W branch of the PKK flow reached its greatest extent of the week on 5 August, when it broadened to include hundreds of meters of scattered breakouts and reached from 460 m down to 260 m elevation. During 15-16 August 2005, surface lava at Kīlauea was again visible on the W and E branches of the PKK lava flow. Lava continued to enter the sea at the E Lae`apuki entry through 5 September. Background volcanic tremor was near normal levels at Kīlauea's summit and at moderate levels at Pu`u `O`o cone. There were small periods of inflation and deflation at Kīlauea's summit and Pu`u `O`o. By 22 August, surface lava on the W branch of the PKK lava flow was no longer visible. On 27 August, part of a lava-bench collapsed.
Throughout September, lava entered the sea at the E Lae`apuki area with surface lava flows visible on the Pulama Pali fault scarp. Lava filled a scar left by the lava-bench collapse on 27 August. Background volcanic tremor continued to remain around normal levels at the summit. Volcanic tremor was at moderate levels at Pu`u `O`o. On 11 September, substantial deflation at the volcano was followed by sharp inflation. On 19 September, several small shallow earthquakes occurred along the Kao`iki fault system with small amounts of inflation and deflation.
In October 2005, lava from Kīlauea continued to enter the sea at the E Lae`apuki area, and surface lava flows were visible along the PKK lava flow. Lava flows continued to enter the sea at E Lae`apuki area, mostly NE of the point of the lava delta. On 18 October, weak surface lava flows were visible at Kīlauea and one cascade of lava flowed off of the western front of the E Lae`apuki delta.
Activity during November 2005 was similar to the previous month. Lava continued to enter the sea at the E Lae`apuki area and surface lava flows were visible on the Pulama pali fault scarp. Background volcanic tremor was near normal levels at Kīlauea's summit.
A lava-bench collapse in the E Lae`apuki area on 29 November 2005 was the largest bench collapse of the current eruption, which began in January 1983. The collapse lasted several hours, sending the 137,588 m2 of bench and an additional 40,467 m2 of adjacent cliff, into the sea. The collapse left a 20-m-high cliff, from which a 2 m thick stream of lava was emitted from an open lava tube. Cracks had been observed on the inland portion of the bench several months earlier; visitors were not allowed near the bench, but a viewing area was provided ~ 3 km away. Growth of the new delta at E Lae`apuki was continuing as of 6 December 2005. At that time breakouts were also active on Pulama Pali.
During December, lava from Kīlauea continued to enter the sea at the E Lae`apuki area and surface lava flows were visible on the Pulama pali fault scarp.
From 28 December 2005 to 9 January 2006, lava from Kīlauea continued to enter the sea at the E Lae`apuki area building a new lava delta with surface lava flows visible on the Pulama pali fault scarp. Background volcanic tremor was near normal levels at Kīlauea's summit. Volcanic tremor reached moderate levels at Pu`u `O`o. Small amounts of deformation occurred. On 10 January, the summit deflation switched abruptly to inflation after a loss of 5.2 µrad. Relatively high tremor occurred at this time. The tremor quickly dropped, becoming weak to moderate when deflation ended, with seismicity punctuated by a few small earthquakes. By 13 January, background volcanic tremor was near normal levels at Kīlauea's summit and reached moderate levels at Pu`u `O`o. On 14 January, the lava delta was about 500 m long (parallel to shore) and still 140 m wide. By the end of the month the lava delta was 615 m long and 140 m wide. Background volcanic tremor was near normal levels at Kīlauea's summit, with numerous shallow earthquakes occurring at the summit and upper E rift zone during several days.
During 2-7 February 2006, lava from Kīlauea continued to enter the sea at the E Lae`apuki area and surface lava flows were visible on the Pulama pali fault scarp. Background volcanic tremor was near normal levels at Kīlauea's summit, with numerous shallow earthquakes continuing to occur at the summit and upper E rift zone. Volcanic tremor reached moderate levels at Pu`u `O`o. Small amounts of inflation and deflation were reported. From mid-to-late February, surface lava flows were not visible on Kīlauea's Pulama pali fault scarp due to lava traveling underground through the PKK lava tube until reaching E Lae`apuki lava delta and flowing into the sea. Observations on 7 February 2006 revealed that the lava delta had broadened 120 m W since 30 January 2006.
Geologic Background. Kilauea overlaps the E flank of the massive Mauna Loa shield volcano in the island of Hawaii. Eruptions are prominent in Polynesian legends; written documentation since 1820 records frequent summit and flank lava flow eruptions interspersed with periods of long-term lava lake activity at Halemaumau crater in the summit caldera until 1924. The 3 x 5 km caldera was formed in several stages about 1,500 years ago and during the 18th century; eruptions have also originated from the lengthy East and Southwest rift zones, which extend to the ocean in both directions. About 90% of the surface of the basaltic shield volcano is formed of lava flows less than about 1,100 years old; 70% of the surface is younger than 600 years. The long-term eruption from the East rift zone between 1983 and 2018 produced lava flows covering more than 100 km2, destroyed hundreds of houses, and added new coastline.
Information Contacts: Hawaiian Volcano Observatory (HVO), U.S. Geological Survey, PO Box 51, Hawaii National Park, HI 96718, USA (URL: https://volcanoes.usgs.gov/observatories/hvo/).
Lascar
Chile
23.37°S, 67.73°W; summit elev. 5592 m
All times are local (unless otherwise noted)
Five-day eruption sequence in April 2006; plume seen 220 km away
Lascar's eruption on 4 May 2005 (BGVN 30:05) was followed by a new eruptive cycle, which began on 18 April 2006 and lasted 5 days. Observers familiar with Lascar judged this eruptive episode unusual compared to those observed previously in terms of eruptive character, frequency, and duration time. The Volcanic Ash Advisory Center (VAAC) in Buenos Aires and Servicio Metererológico Nacional of Argentina detected the eruption from satellite images, and aircraft warnings were posted. All of the times cited are in UTC (local time = UTC - 4 hours).
Eruptions start, 18 April. Four explosions registered (at 1520, 1722, 1900, and 2100 hours UTC). The first explosion, the largest of four, was visible from El Abra cooper mine (220 km NW) and reached ~ 10 km above the summit crater (figure 33). The shape of the eruptive column suggested that it reached the tropopause (~ 15 km altitude in this region). The white to gray plume, containing little ash but a large amount of water, dispersed to the NNE.
The second explosion reached 3 km above the summit crater, while the third and fourth explosions reached 800 m. These latter eruptive plumes were gray colored, had higher contents of ash than the first explosion, and were dispersed NNE. Only slight ash fall was registered on the N side of the volcano. No seismic activity or eruption noises were registered. Analysis of GOES satellite images (figure 34) indicated that for the first and second eruptive plumes the mean horizontal velocities were 70 and 85 km/hour, respectively, while the maximum plume areas were ~ 8,240 and 1,074 km2, respectively. Minimum volumes erupted were ~ 4.1 x 10⁶ and ~ 0.54 x 10⁶ m3 assuming a hypothetical ash fall deposit of 0.5 mm over the stated areas. The third and fourth explosions were not detected by satellite.
19-22 April eruptions and comparative calm that followed. On 19 April 2006 at 1504 hours (UTC) an explosion generated a gray-colored eruptive column that reached 3 km above the summit crater and was dispersed NNE. Slight ash fall was noted on the N side of the volcano. Neither seismic activity nor eruption noises were reported. Two explosions were recorded 20 April at 1505 and 1739 hours (UTC). The first eruptive plume reached 2.5 km above the summit crater and contained a small amount of ash. The plume from the second explosion, the larger of the pair, reached 7 km above the crater. The eruption lasted 1 hour and 50 min. Both plumes were dispersed N and slight ash fall was registered on the N side of the volcano. No seismic activity or eruption noises were registered.
Analysis of satellite data from the sequence of GOES images (figure 35) indicated that the first and second eruptive plumes had mean horizontal velocities of 40 km/h, while the maximum areas were ~ 430 and ~ 800 km2, respectively. Minimal volumes erupted were ~ 0.4 x 10⁶ and ~ 0.2 x 10⁶ m3, again assuming a hypothetical 0.5 mm ash-fall deposit.
Two explosions were recorded on 21 April 2006 at 1248 and 1547 UTC, each lasting ~ 15 minutes. Their eruptive columns reached 3 km above the summit crater and rapidly dispersed ESE. Seismic activity and eruption noises were not noted.
On 22 April at 1518 UTC an explosion generated an eruptive column that reached 3 km above the summit crater; it was blown SE. Local inhabitants heard subterranean noises. On 23 April at 1600 UTC an explosion generated a gray-colored eruptive column that reached 2.5 km above the summit crater and dispersed NNW (figure 36). Seismic activity and eruption noises were not registered. During the following 2 days, the color of the plume was white and it's top remained ~ 1.5 km above the crater.
Other studies. After the 4 May 2005 eruption (BGVN 30:05), a team of scientists from Universidad Católica del Norte (UCN) carried out a gas sampling campaign on new fumaroles around the S edge of the central active crater. They used the direct sampling of fumaroles technique described by Giggenbach (1975) and Giggenbach and Goguel (1989). Gas data showed increasing amounts of H2O, H2S, and CH4 with respect to samples taken in 2002 from inside the active crater (Tassi et al., 2004). However, acid gases also displayed very high values. During December 2005 a team of scientists from UCN and Universidad Autónoma de México (UNAM) carried out field investigations to generate hazard maps.
Scientists from Università degli Studi di Firenze (Italy) and Universidad Católica del Norte (Chile) are conducting a systematic gas sample campaign at Lascar and other active volcanoes in the Central Volcanic Zone (e.g. Putana, Lastarria, and Isluga). Finally, scientists from the Universidad Católica del Norte, the Universidad Nacional de Salta and SEGEMAR (Argentina) are processing data from Landsat Thematic Mapper (TM) and Enhanced Thematic Mapper Plus (ETM+) and Advanced Spaceborne Thermal Emission and Reflection Radiometer (ASTER) images, with the objective of understanding the behavior of Lascar volcano during the 1998-2004 period.
References. Giggenbach, W., 1975, A simple method for the collection and analysis of volcanic gas sample: Bulletin of Volcanology, 39, 132?145.
Giggenbach, W., and Goguel, R., 1989, Collection and analysis of geothermal and volcanic water and gas discharges: DSIR Chemistry, Rept. No. 2401.
Matthews, S., Gardeweg, M., and Sparks, R., 1997, The 1984 to 1996 cyclic activity of Lascar volcano, northern Chile: cycles of dome growth, dome subsidence, degassing and explosive eruptions: Bulletin of Volcanology, v. 59, p. 72-82.
Tassi, F., Viramonte, J., Vaselli, O., Poodts, M., Aguilera, F., Martínez, C., Rodríguez, L., and Watson, I., 2004, First geochemical data from fumarolic gases at Lascar volcano, Chile: 32nd International Geological Congress, Florence, August 20-28, 2004.
Viramonte, J., Aguilera, F., Delgado, H., Rodríguez, L., Guzman, K., Jiménez, J., and Becchio, R., 2006, A new eruptive cycle of Lascar Volcano (Chile): The risk for the aeronavigation in northern Argentina. Garavolcan 2006, Tenerife, Spain.
Geologic Background. Láscar is the most active volcano of the northern Chilean Andes. The andesitic-to-dacitic stratovolcano contains six overlapping summit craters. Prominent lava flows descend its NW flanks. An older, higher stratovolcano 5 km E, Volcán Aguas Calientes, displays a well-developed summit crater and a probable Holocene lava flow near its summit (de Silva and Francis, 1991). Láscar consists of two major edifices; activity began at the eastern volcano and then shifted to the western cone. The largest eruption took place about 26,500 years ago, and following the eruption of the Tumbres scoria flow about 9000 years ago, activity shifted back to the eastern edifice, where three overlapping craters were formed. Frequent small-to-moderate explosive eruptions have been recorded since the mid-19th century, along with periodic larger eruptions that produced ashfall hundreds of kilometers away. The largest historical eruption took place in 1993, producing pyroclastic flows to 8.5 km NW of the summit and ashfall in Buenos Aires.
Information Contacts: Felipe Aguilera, Eduardo Medina, and Karen Guzmán, Programa de Doctorado en Ciencias mención Geología and Departamento de Ciencias Geológicas, Universidad Católica del Norte, Avenida Angamos 0610, Antofagasta, Chile (URL: http://www.geodoctorado.cl, http://www.ucn.cl/); José G. Viramonte, Raúl Becchio, and Marcelo J. Arnosio, Instituto GEONORTE and CONICET, Universidad Nacional de Salta, Buenos Aires 177, Salta 4400, Argentina (URL: http://www.unsa.edu.ar/); Ricardo Valenti and Sergio Haspert, Servicio Metereológico Nacional, Argentina; Hugo G. Delgado, Instituto de Geofísica, Universidad Nacional Autónoma de México (UNAM), Coyoacán 04510, México, D.F.; Buenos Aires Volcanic Ash Advisory Center (VAAC), Servicio Meteorológico Nacional-Fuerza Aérea Argentina, Buenos Aires, Argentina (URL: http://www.smn.gov.ar/vaac/buenosaires/productos.php).
Masaya
Nicaragua
11.9844°N, 86.1688°W; summit elev. 594 m
All times are local (unless otherwise noted)
Intermittent ash eruptions November 2003-March 2005; continuing incandescence
Previously reported behavior at Masaya through 22 September 2003 consisted primarily of incandescence from Santiago crater (BGVN 28:10). Monthly reports prepared by the Instituto Nicarag?ense de Estudios Territoriales (INETER) since that time noted continuing seismicity and incandescence through March 2005. A small explosions was reported on 29 November 2003. Masaya Volcano National Park workers also reported two ash-and-gas explosions at 0121 on 12 December 2003. A collapse event within the crater was noted on 22 June 2004. A report from the Washington Volcanic Ash Advisory Center (VAAC) noted that on 4 July 2004 at 0015 local time, a narrow plume of steam and/or ash from Masaya was visible on satellite imagery extending to the SW. An hour later the plume had extended ~ 12 km from the summit. The report below notes changes induced in Santiago crater after a landslide in early March 2005. A magnitude 1.9 earthquake at a depth of 2.2 km below Masaya on 30 March 2005 was followed by rumbling noises and gas-and-ash emissions.
Field work during February-March 2005. Patricia Nadeau and Glyn Williams-Jones sent us a report of an intensive, multi-component field campaign conducted at Masaya from 16 February 2005 to 12 March 2005. Two FLYSPEC ultraviolet spectrometers were used in tandem with two Microtops sun photometers to constrain passive SO2 and aerosol fluxes and also to evaluate potential downwind loss of SO2 by conversion to aerosols. Additionally, self-potential geophysical measurements were performed at Masaya's summit in a preliminary attempt to delineate the hydrothermal system of the volcano.
On the morning of 3 March, Park workers reported that a landslide had occurred within Santiago crater the previous night. A visibly diminished plume from the crater's active vent suggested that the landslide may have caused a blockage that reduced the escape of SO2 (figures 20 and 21).
The visual observations were supported by subsequent SO2-flux measurements, which confirmed a significant drop in SO2 emissions from an average of ~ 300 tons/day prior to the landslide to an average of ~ 80 tons/day following the landslide (figure 22). This decrease in emissions led to concerns over the possibility of a small vent-clearing explosion such as the one that occurred on 23 April 2001 (BGVN 26:04). That explosion was preceded by a similar drop in SO2 emissions for several weeks due to a blockage of the vent that was active at the time. The 2001 explosion resulted in the opening of a new vent, which has since been the site of Masaya's degassing. After the 2001 explosion, the previously active vent no longer degassed and was assumed to be completely inactive.
In the days following the 2 March 2005 landslide, gas output was monitored closely, both visually and with the FLYSPEC, for any further decreases, which could have been indicative of further blockage and possible pressurization. Visual observations of the crater on the nights of 4 March and 11 March revealed that while the currently degassing vent was not incandescent, the older vent (believed to be inactive after the April 2001 explosion) was indeed incandescent, though not degassing (figure 23).
As of 10 March, the visible gas emissions were the lowest seen, despite the apparent open conduit, as indicated by incandescence in the old vent. Rumbling and sloshing sounds from within the crater had increased from sporadic to nearly constant. However, the days following were marked by a decrease in acoustical noise, as well as the apparent beginning of a climb back to higher SO2 emission rates (~ 120 tons/day on 16 March). These observations were consistent with devlopments in the upper conduit.
References. Williams-Jones, G., Horton, K. A., Elias, T., Garbeil, H., Mouginis-Mark, P. J., Sutton, A. J., and Harris, A. J. L., Accurately measuring volcanic plume velocity with multiple UV spectrometers: Bulletin of Volcanology, in press.
Williams-Jones, G., Delmelle, P., Baxter, P., Beaulieu, A., Burton, M., Garcia-Alvarez, J., Gaonac'h, H., Horrocks, L., Oppenheimer, C., Rymer, H., Rothery, D., St-Amand, K., Stix, J., Strauch, W., and van Wyk de Vries, B., (2001?), Projecto Laboratorio Geofisico-Geoquimico Volcán Masaya, Geochemical, geophysical, and petrological studies at Masaya volcano (1997-2000), on INETER website at.
Geologic Background. Masaya volcano in Nicaragua has erupted frequently since the time of the Spanish Conquistadors, when an active lava lake prompted attempts to extract the volcano's molten "gold" until it was found to be basalt rock upon cooling. It lies within the massive Pleistocene Las Sierras caldera and is itself a broad, 6 x 11 km basaltic caldera with steep-sided walls up to 300 m high. The caldera is filled on its NW end by more than a dozen vents that erupted along a circular, 4-km-diameter fracture system. The Nindirí and Masaya cones, the source of observed eruptions, were constructed at the southern end of the fracture system and contain multiple summit craters, including the currently active Santiago crater. A major basaltic Plinian tephra erupted from Masaya about 6,500 years ago. Recent lava flows cover much of the caldera floor and there is a lake at the far eastern end. A lava flow from the 1670 eruption overtopped the north caldera rim. Periods of long-term vigorous gas emission at roughly quarter-century intervals have caused health hazards and crop damage.
Information Contacts: Patricia Nadeau and Glyn Williams-Jones, Department of Earth Sciences, Simon Fraser University, Burnaby, Canada; Kirstie Simpson, Geological Survey of Canada, Vancouver, Canada; Washington Volcanic Ash Advisory Center (VAAC), Satellite Analysis Branch (SAB), NOAA/NESDIS E/SP23, NOAA Science Center Room 401, 5200 Auth Rd, Camp Springs, MD 20746, USA (URL: http://www.ospo.noaa.gov/Products/atmosphere/vaac/); Wilfried Strauch and Martha Navarro, Instituto Nicaraguense de Estudios Territoriales (INETER), Apartado Postal 2110, Managua, Nicaragua.
Sangay
Ecuador
2.005°S, 78.341°W; summit elev. 5286 m
All times are local (unless otherwise noted)
Some conspicuous plumes during 2004-2005; climber's photos from January 2006
Our previous report was in 1996 (BGVN 21:03); this report covers the time interval January 2004 to January 2006. According to a 2004 annual summary on the Instituto Geofísico (IG) website, Sangay was one of the most active volcanoes in Ecuador, and has been in eruption for ~ 80 years. Its isolated location (figure 6) has meant it has been thought of as a relatively small hazard risk. For this reason, monitoring has been less than for other Ecuadorian volcanoes. Thermal, visual, and satellite monitoring during 2002-2004 confirmed the central crater as the source of frequent explosions and continuing steam-and-gas emissions.
During 2004 observers did not see lava flows or pyroclastic flows. An abnormally large eruption cloud was detected on 14 January 2004; it contained dominantly steam and gases, with minor ash content. Although only clearly detected and reported then, such events are thought to occur with considerable frequency.
Ramon and others (2006) summarized Sangay's activity as continuously erupting since 1934. Thermal images taken during the last three years showed that only one of the three summit craters was active and documented a lack of new, visible lava flows.
On 14 January 2004 a plume from Sangay was observed around 0500. The plume extended about 45 km E and most likely contained ash. During this time a hotspot was also visible on the satellite imagery. On 27 January 2004 a narrow ash plume emitted by Sangay rose to 6 km altitude and drifted SW.
On 1 May 2004, based on a pilot's report, the Washington VAAC noted that ash from an eruption at Sangay produced a plume to a height of ~ 6 km altitude at 1750. Ash was not visible on satellite imagery.
On 28 December 2004 around 0715 a plume from Sangay, most likely composed of steam with little ash, was detected. The plume was E of the volcano's summit at a height of ~ 6.4 km altitude. A hotspot was prominent on satellite imagery, but ash was more difficult to distinguish.
On 16 October 2005 around 0645 Sangay emitted an ash plume. The plume moved SSW very slowly, corresponding to a possible height of ~ 6.7 km altitude. By 0900 the plume was too thin to be visible on satellite imagery and thunderstorms developed in the area, further obscuring the ash cloud. Based on information from the IG, on 26 October 2005 the Washington VAAC noted that ash was seen over Sangay at 0758. No ash was visible on satellite imagery.
Climber's photo journal. Climbers Thorsten Boeckel and Martin Rietze created a website briefly describing a trek to Sangay's summit during 4-12 January 2006. Several of their posted photos from that trip appear here (figures 7-10; unfortunately, the photos, which are strikingly beautiful, were generally presented without much geographic context). The team included at least one local guide and was aided by horses. Settlements on the approach and return included the mountain village St. Eduardo, which they described as ~ 50 km S of Riobamba.
Except for some degassing, the group saw no other activity. Although local residents indicated that the last eruption had occurred about 2 months prior to their visit, intermittent eruptions pose hazards to climbers; in 1976 two climbers were killed by explosions from Sangay (SEAN 01:10).
Reference. Ramón, P., Rivero, D., Böker, F., and Yepes, H., 2006, Thermal monitoring using a portable IR camera: results on Ecuadorian volcanoes in "Cities on Volcanoes IV"; 23-27 January 2006.
Geologic Background. The isolated Sangay volcano, located east of the Andean crest, is the southernmost of Ecuador's volcanoes and its most active. The steep-sided, glacier-covered, dominantly andesitic volcano grew within the open calderas of two previous edifices which were destroyed by collapse to the east, producing large debris avalanches that reached the Amazonian lowlands. The modern edifice dates back to at least 14,000 years ago. It towers above the tropical jungle on the east side; on the other sides flat plains of ash have been eroded by heavy rains into steep-walled canyons up to 600 m deep. The earliest report of an eruption was in 1628. Almost continuous eruptions were reported from 1728 until 1916, and again from 1934 to the present. The almost constant activity has caused frequent changes to the morphology of the summit crater complex.
Information Contacts: P. Ramón, Instituto Geofísico-Departamento de Geofísica (IG), Escuela Politécnica Nacional, Casilla 17-01-2759, Quito, Ecuador; Washington Volcanic Ash Advisory Center (VAAC), Satellite Analysis Branch (SAB), NOAA/NESDIS E/SP23, NOAA Science Center Room 401, 5200 Auth Rd, Camp Springs, MD 20746, USA (URL: http://www.ospo.noaa.gov/Products/atmosphere/vaac/); Thorsten Boeckel and Martin Rietze, c/o Kermarstr.10, Germerswang, D-82216, Germany (URL: http://www.tboeckel.de/).
Santa Maria (Guatemala) — April 2006 Cite this Report
Santa Maria
Guatemala
14.757°N, 91.552°W; summit elev. 3745 m
All times are local (unless otherwise noted)
During October 2005 to January 2006, occasional ash plumes
This summary of activity at Santa María's Santiaguito lava-dome complex, taken largely from Instituto Nacional de Sismologia, Vulcanologia, Meteorologia e Hidrologia (INSIVUMEH) reported for October 2005 to January 2006. During this interval Santa María continued to emit occasional ash plumes.
During 26-31 October 2005, several explosions took place and plumes rose to a maximum of ~ 5 km altitude on 28 October. In early November, several explosions occurred producing ash plumes to an altitude of ~ 5 km. A few weak avalanches of volcanic material were observed SW of the lava dome.
Explosions produced several ash plumes to ~ 5 km altitude during 11-14 November 2005. Several small pyroclastic flows traveled down the SW, NE, and S flanks of Caliente dome. Frequent avalanches of volcanic material occurred off of the fronts of active lava flows mostly to the W of Caliente dome, and less frequently to the S and NE. An ash-and-gas emission on 14 November produced a cloud that was visible on satellite imagery.
During 17-21 November, Santa María produced weak-to-moderate explosions, sending ash plumes to an altitude of ~ 4.6 km. Several small pyroclastic flows traveled down the SW and NE flanks of Caliente dome, stopping at the base of the dome. Avalanches spalled off of the fronts of active lava flows and traveled SW.
On 24 November at 0955, an eruption produced an ash cloud to an altitude of ~ 4 km accompanied by a pyroclastic flow to the S. Fine ash fell 6-7 km S of the volcano, impacting properties in the area.
Moderate-to-strong explosions in December produced ash plumes that rose ~ 1.5-2.5 km. Pyroclastic flows occasionally accompanied explosions and traveled towards the SW. Several avalanches of volcanic material also occurred during the report period.
Throughout January 2006, explosions continued to occur sending resultant ash emissions to the SW. Lava avalanches originated from the SW edge of the Caliente dome and from the fronts of active lava flows on the SW flank. An explosion on the morning of 11 January 2006 generated a small pyroclastic flow that traveled down Caliente dome to the NE. INSIVUMEH reported on 16 January that a slight decrease in explosive activity was observed during the previous month. On 16 January there were reports of a small amount of ashfall 25 km SW in the urban area of San Felipe Retalhuleu.
During 1-3 February, weak-to-moderate explosions took place at Santiaguito's lava-dome complex, producing plumes that rose to a maximum height of 1 km above the volcano. On 1 February at 0657 and 0708, moderate explosions were accompanied by pyroclastic flows. Lava extrusion at Caliente dome produced block-and-ash flows that descended the dome's S, E, and W sides. Several explosions on 9 February also produced small pyroclastic flows that traveled down the SW and SE sides of Caliente dome. On 15-17 February, pyroclastic flows traveled SW and NE, associated with avalanches of incandescent volcanic material spalled off of active lava-flow fronts.
On 4, 6, and 7 March, satellite imagery showed small ash plumes emitted from the lava-dome complex. The plumes reached ~ 3 km above the volcano. On 6 March around 0733, a moderate explosion produced an ash plume and pyroclastic flows. A strong explosion later that day, at 1025, sent an ash plume ~ 3 km above the volcano that deposited ash throughout the volcanic complex. The explosion was accompanied by pyroclastic flows down the NE and SW flanks. Fine ash drifted S falling on properties in that area. On 12 March, there were avalanches of volcanic blocks and ash. On 13 March, a pyroclastic flow traveled down the S flank of Caliente dome.
Geologic Background. Symmetrical, forest-covered Santa María volcano is part of a chain of large stratovolcanoes that rise above the Pacific coastal plain of Guatemala. The sharp-topped, conical profile is cut on the SW flank by a 1.5-km-wide crater. The oval-shaped crater extends from just below the summit to the lower flank, and was formed during a catastrophic eruption in 1902. The renowned Plinian eruption of 1902 that devastated much of SW Guatemala followed a long repose period after construction of the large basaltic andesite stratovolcano. The massive dacitic Santiaguito lava-dome complex has been growing at the base of the 1902 crater since 1922. Compound dome growth at Santiaguito has occurred episodically from four vents, with activity progressing E towards the most recent, Caliente. Dome growth has been accompanied by almost continuous minor explosions, with periodic lava extrusion, larger explosions, pyroclastic flows, and lahars.
Information Contacts: Instituto Nacional de Sismologia, Vulcanologia, Meteorologia e Hidrologia (INSIVUMEH), Unit of Volcanology, Geologic Department of Investigation and Services, 7a Av. 14-57, Zona 13, Guatemala City, Guatemala (URL: http://www.insivumeh.gob.gt/).
Saunders (United Kingdom) — April 2006 Cite this Report
Saunders
United Kingdom
57.8°S, 26.483°W; summit elev. 843 m
All times are local (unless otherwise noted)
Lack of new thermal signals suggesting any eruption since October 2005
The last reported activity of Mount Michael was noted in the SI/USGS Weekly Report of 12-18 October 2005. At that time the first MODVOLC alerts for the volcano since May 2003 indicated an increased level of activity in the island's summit crater and a presumed semi-permanent lava lake that appeared confined to the summit crater. Those alerts occurred on 3, 5, and 6 October 2005. Since that time there has been no additional information concerning Mount Michael and presumably little to no activity.
Geologic Background. Saunders Island consists of a large central volcanic edifice intersected by two seamount chains, as shown by bathymetric mapping (Leat et al., 2013). The young Mount Michael stratovolcano dominates the glacier-covered island, while two submarine plateaus, Harpers Bank and Saunders Bank, extend north. The symmetrical Michael has a 500-m-wide summit crater and a remnant of a somma rim to the SE. Tephra layers visible in ice cliffs surrounding the island are evidence of recent eruptions. Ash clouds were reported from the summit crater in 1819, and an effusive eruption was inferred to have occurred from a N-flank fissure around the end of the 19th century and beginning of the 20th century. A low ice-free lava platform, Blackstone Plain, is located on the north coast, surrounding a group of former sea stacks. A cluster of cones on the SE flank, the Ashen Hills, appear to have been modified since 1820 (LeMasurier and Thomson, 1990). Analysis of satellite imagery available since 1989 (Gray et al., 2019; MODVOLC) suggests frequent eruptive activity (when weather conditions allow), volcanic clouds, steam plumes, and thermal anomalies indicative of a persistent, or at least frequently active, lava lake in the summit crater. Due to this observational bias, there has been a presumption when defining eruptive periods that activity has been ongoing unless there is no evidence for at least 10 months.
Information Contacts: Matt Patrick, Luke Flynn, Harold Garbeil, Andy Harris, Eric Pilger, Glyn Williams-Jones, and Rob Wright, HIGP Thermal Alerts Team, Hawai'i Institute of Geophysics and Planetology (HIGP) / School of Ocean and Earth Science and Technology (SOEST), University of Hawai'i, 2525 Correa Road, Honolulu, HI 96822, USA (URL: http://modis.higp.hawaii.edu/); John Smellie, British Antarctic Survey, Natural Environment Research Council, High Cross, Madingly Road, Cambridge CB3 0ET, United Kingdom (URL: https://www.bas.ac.uk/).
Soputan (Indonesia) — April 2006 Cite this Report
Soputan
Indonesia
1.112°N, 124.737°E; summit elev. 1785 m
All times are local (unless otherwise noted)
Late 2005 phreatic and Strombolian eruptions; ash plume to ~ 5.8 km altitude
Our last report covered events through July 2005 (BGVN 30:08); this report includes activity that took place in late December 2005 and also presents a discussion of the wide discrepancy of cloud-height estimates between ground, aircraft, and satellite remote-sensing observations.
Activity during 21-27 December 2005. A phreatic eruption began at Soputan on 26 December 2005 around 1230 following heavy rain. Observers concluded that rainwater contacted lava at the volcano's summit. On 27 December at 0400, a Strombolian eruption began that lasted about 50 minutes. Incandescent material was ejected ~ 35 m, and avalanches spalling off the margins of the summit traveled as far as 750 m E. Booming noises were heard 5 km from the summit. The Darwin VAAC reported that an ash plume reached a height of ~ 5.8 km altitude and drifted SE.
As of 28 December, eruptive activity continued, producing ash plumes to a height of ~ 1 km above the volcano. Strombolian eruptions ejected incandescent material up to 200 m above the summit. Pyroclastic avalanches traveled ~ 500 m E and SW. This was Soputan's fourth event in 2005, with previous activity on 14 and 20 April, and on 12 September. The Alert Level remained at 2, since the volcano is about 11 km from the nearest settlement. Visitors were prohibited from climbing Soputan's summit and from camping around Kawah Masem.
October 2005 eruption plume height discussion. The Darwin Volcanic Ash Advisory Centre and the Cooperative Institute for Meteorological Satellite Studies (CIMSS) at the University of Wisconsin – Madison collaborated to compare various estimates for the height of the 27 December cloud (BGVN 30:08). The eruption height had been initially reported at less than 6 km altitude on the 27th by an airline pilot, and 1 km above the summit (~ 2.8 km altitude) by ground observers on the 28th. Darwin VAAC, on reviewing hourly MTSAT imagery on the 27th, estimated the plume top at 15 km altitude operationally and then 12.5 km altitude in post-analysis studies.
Michael Richards of CIMSS used an established remote-sensing technique known as "CO2 slicing" (Menzel et al., 1983, Richards et al., 2006), to obtain heights of the cloudscape around Soputan after the eruption. The technique takes advantage of the fact that the emissive infrared CO2 bands available on the MODIS satellite become more transmissive with decreasing wavelength, as the bands move away from the peak wavelength of CO2 absorption at 15 µm. There were two good MODIS images obtained over the eruption on the 27th, with the first, at 0210 UTC or 1010 local time. These images were taken at close to the time of the peak cloud height observed on MTSAT imagery, and the CO2 slicing technique appears to validate the post-analyzed VAAC height of ~ 12.5 km altitude.
The different results for the height of the eruption cloud illustrate the difficulty that observers would have had viewing the cloud from any angle. Weather clouds in the tropics typically extend up to 16 km or more altitude. Cirrus cloud from a storm complex can obscure the view of a satellite for hours. On the other hand, middle-level clouds, such as altostratus, will typically lie between aircraft cruising altitudes and the ground, meaning that pilots at cruising altitude may not associate any eruption cloud with a volcano on the ground, unless the cloud is obviously volcanic. Ground observers are completely unable to view the full height of the cloud if it is penetrating through the middle-level clouds.
The appearance of the cloud on true-color, near-infrared and infrared imagery is consistent with an ice-rich (glaciated) volcanic cloud, in-line with the CVGHM account of water interactions at the ground, and also with a high water loading in the atmosphere. The extensive areas of cloud in the area hindered satellite detection of the eruption until after the pilot report of the eruption had been received.
References. Menzel, W. P., Smith, W. L., and Stewart, T. R., 1983, Improved cloud motion wind vector and altitude assignment using VAS: Journal of Applied Meteorology, v. 22, p. 377-384.
Richards, M. S., Ackerman, S. A., Pavolonis, M. J., Feltz, W. F., and Tupper, A.C., 2006, Volcanic ash cloud heights using the MODIS CO2-slicing algorithm: AMS 12th, conference on aerospace and range meteorology, Atlanta, Georgia, USA (http://ams.confex.com/ams/pdfpapers/104055.pdf).
Geologic Background. The Soputan stratovolcano on the southern rim of the Quaternary Tondano caldera on the northern arm of Sulawesi Island is one of Sulawesi's most active volcanoes. The youthful, largely unvegetated volcano is the only active cone in the Sempu-Soputan volcanic complex, which includes the Soputan caldera, Rindengan, and Manimporok (3.5 km ESE). Kawah Masem maar was formed in the W part of the caldera and contains a crater lake; sulfur has been extracted from fumarolic areas in the maar since 1938. Recent eruptions have originated at both the summit crater and Aeseput, a prominent NE-flank vent that formed in 1906 and was the source of intermittent major lava flows until 1924.
Information Contacts: Center of Volcanology and Geological Hazard Mitigation, Jalan Diponegoro 57, Bandung 40122, Indonesia (URL: http://www.vsi.esdm.go.id/); Andrew Tupper and Rebecca Patrick, Darwin Volcanic Ash Advisory Centre (VAAC), Australian Bureau of Meteorology (URL: http://www.bom.gov.au/info/vaac/soputan.shtml); Michael Richards and Wayne Feltz, Cooperative Institute for Meteorological Satellite Studies (CIMSS), University of Wisconsin, 1225 West Dayton Street, Madison, WI 53706, USA.