Recently Published Bulletin Reports
Erebus (Antarctica) Lava lake remains active; most thermal alerts recorded since 2019
Rincon de la Vieja (Costa Rica) Frequent phreatic explosions during July-December 2023
Bezymianny (Russia) Explosion on 18 October 2023 sends ash plume 8 km high; lava flows and incandescent avalanches
Kilauea (United States) Low-level lava effusions in the lava lake at Halema’uma’u during July-December 2022
Nyamulagira (DR Congo) Lava flows and thermal activity during May-October 2023
Bagana (Papua New Guinea) Explosions, ash plumes, ashfall, and lava flows during April-September 2023
Mayon (Philippines) Lava flows, pyroclastic flows, ash emissions, and seismicity during April-September 2023
Nishinoshima (Japan) Eruption plumes and gas-and-steam plumes during May-August 2023
Krakatau (Indonesia) White gas-and-steam plumes and occasional ash plumes during May-August 2023
Villarrica (Chile) Strombolian activity, gas-and-ash emissions, and crater incandescence during April-September 2023
Merapi (Indonesia) Frequent incandescent avalanches during April-September 2023
Ebeko (Russia) Moderate explosive activity with ash plumes continued during June-November 2023
Erebus (Antarctica) — January 2024  Cite this Report
Erebus
Antarctica
77.53°S, 167.17°E; summit elev. 3794 m
All times are local (unless otherwise noted)
Lava lake remains active; most thermal alerts recorded since 2019
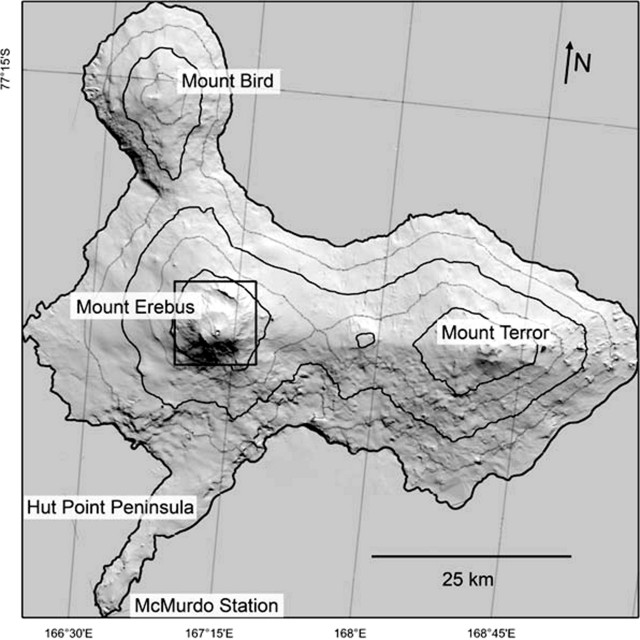
The lava lake in the summit crater of Erebus has been active since at least 1972. Located in Antarctica overlooking the McMurdo Station on Ross Island, it is the southernmost active volcano on the planet. Because of the remote location, activity is primarily monitored by satellites. This report covers activity during 2023.
The number of thermal alerts recorded by the Hawai'i Institute of Geophysics and Planetology’s MODVOLC Thermal Alerts System increased considerably in 2023 compared to the years 2020-2022 (table 9). In contrast to previous years, the MODIS instruments aboard the Aqua and Terra satellites captured data from Erebus every month during 2023. Consistent with previous years, the lowest number of anomalous pixels were recorded in January, November, and December.
Table 9. Number of monthly MODIS-MODVOLC thermal alert pixels recorded at Erebus during 2017-2023. See BGVN 42:06 for data from 2000 through 2016. The table was compiled using data provided by the HIGP – MODVOLC Thermal Alerts System.
| Year |
Jan |
Feb |
Mar |
Apr |
May |
Jun |
Jul |
Aug |
Sep |
Oct |
Nov |
Dec |
SUM |
| 2017 |
0 |
21 |
9 |
0 |
0 |
1 |
11 |
61 |
76 |
52 |
0 |
3 |
234 |
| 2018 |
0 |
21 |
58 |
182 |
55 |
17 |
137 |
172 |
103 |
29 |
0 |
0 |
774 |
| 2019 |
2 |
21 |
162 |
151 |
55 |
56 |
75 |
53 |
29 |
19 |
1 |
0 |
624 |
| 2020 |
0 |
2 |
16 |
18 |
4 |
4 |
1 |
3 |
18 |
3 |
1 |
6 |
76 |
| 2021 |
0 |
9 |
1 |
0 |
2 |
56 |
46 |
47 |
35 |
52 |
5 |
3 |
256 |
| 2022 |
1 |
13 |
55 |
22 |
15 |
32 |
39 |
19 |
31 |
11 |
0 |
0 |
238 |
| 2023 |
2 |
33 |
49 |
82 |
41 |
32 |
70 |
64 |
42 |
17 |
5 |
11 |
448 |
Sentinel-2 infrared images showed one or two prominent heat sources within the summit crater, accompanied by adjacent smaller sources, similar to recent years (see BGVN 46:01, 47:02, and 48:01). A unique image was obtained on 25 November 2023 by the OLI-2 (Operational Land Imager-2) on Landsat 9, showing the upper part of the volcano surrounded by clouds (figure 32).
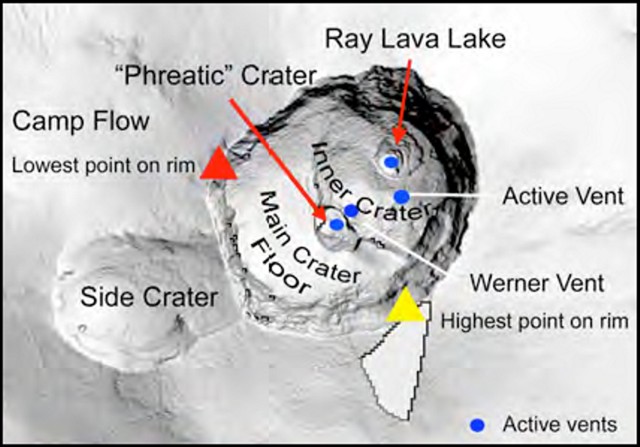
Geologic Background. Mount Erebus, the world's southernmost historically active volcano, overlooks the McMurdo research station on Ross Island. It is the largest of three major volcanoes forming the crudely triangular Ross Island. The summit of the dominantly phonolitic volcano has been modified by one or two generations of caldera formation. A summit plateau at about 3,200 m elevation marks the rim of the youngest caldera, which formed during the late-Pleistocene and within which the modern cone was constructed. An elliptical 500 x 600 m wide, 110-m-deep crater truncates the summit and contains an active lava lake within a 250-m-wide, 100-m-deep inner crater; other lava lakes are sometimes present. The glacier-covered volcano was erupting when first sighted by Captain James Ross in 1841. Continuous lava-lake activity with minor explosions, punctuated by occasional larger Strombolian explosions that eject bombs onto the crater rim, has been documented since 1972, but has probably been occurring for much of the volcano's recent history.
Information Contacts: Hawai'i Institute of Geophysics and Planetology (HIGP) - MODVOLC Thermal Alerts System, School of Ocean and Earth Science and Technology (SOEST), Univ. of Hawai'i, 2525 Correa Road, Honolulu, HI 96822, USA (URL: http://modis.higp.hawaii.edu/); Copernicus Browser, Copernicus Data Space Ecosystem, European Space Agency (URL: https://dataspace.copernicus.eu/browser/); NASA Earth Observatory, EOS Project Science Office, NASA Goddard Space Flight Center, Goddard, Maryland, USA (URL: https://earthobservatory.nasa.gov/images/152134/erebus-breaks-through).
Rincon de la Vieja (Costa Rica) — January 2024 Cite this Report
Rincon de la Vieja
Costa Rica
10.83°N, 85.324°W; summit elev. 1916 m
All times are local (unless otherwise noted)
Frequent phreatic explosions during July-December 2023
Rincón de la Vieja is a volcanic complex in Costa Rica with a hot convecting acid lake that exhibits frequent weak phreatic explosions, gas-and-steam emissions, and occasional elevated sulfur dioxide levels (BGVN 45:10, 46:03, 46:11). The current eruption period began June 2021. This report covers activity during July-December 2023 and is based on weekly bulletins and occasional daily reports from the Observatorio Vulcanologico Sismologica de Costa Rica-Universidad Nacional (OVSICORI-UNA).
Numerous weak phreatic explosions continued during July-December 2023, along with gas-and-steam emissions and plumes that rose as high as 3 km above the crater rim. Many weekly OVSICORI-UNA bulletins included the previous week's number of explosions and emissions (table 9). For many explosions, the time of explosion was given (table 10). Frequent seismic activity (long-period earthquakes, volcano-tectonic earthquakes, and tremor) accompanied the phreatic activity.
Table 9. Number of reported weekly phreatic explosions and gas-and-steam emissions at Rincón de la Vieja, July-December 2023. Counts are reported for the week before the Weekly Bulletin date; not all reports included these data. Courtesy of OVSICORI-UNA.
| OVSICORI Weekly Bulletin |
Number of explosions |
Number of emissions |
| 28 Jul 2023 |
6 |
14 |
| 4 Aug 2023 |
10 |
12 |
| 1 Sep 2023 |
13 |
11 |
| 22 Sep 2023 |
12 |
13 |
| 29 Sep 2023 |
6 |
11 |
| 6 Oct 2023 |
12 |
5 |
| 13 Oct 2023 |
7 |
9 |
| 20 Oct 2023 |
1 |
15 |
| 27 Oct 2023 |
3 |
23 |
| 3 Nov 2023 |
3 |
10 |
| 17 Nov 2023 |
0 |
Some |
| 24 Nov 2023 |
0 |
14 |
| 8 Dec 2023 |
4 |
16 |
| 22 Dec 2023 |
8 |
18 |
Table 10. Summary of activity at Rincón de la Vieja during July-December 2023. Weak phreatic explosions and gas emissions are noted where the time of explosion was indicated in the weekly or daily bulletins. Height of plumes or emissions are distance above the crater rim. Courtesy of OVSICORI-UNA.
| Date |
Time |
Description of Activity |
| 1 Jul 2023 |
0156 |
Explosion. |
| 2 Jul 2023 |
0305 |
Explosion. |
| 4 Jul 2023 |
0229, 0635 |
Event at 0635 produced a gas-and-steam plume that rose 700 m and drifted W; seen by residents in Liberia (21 km SW). |
| 9 Jul 2023 |
1843 |
Explosion. |
| 21 Jul 2023 |
0705 |
Explosion. |
| 26 Jul 2023 |
1807 |
Explosion. |
| 28 Jul 2023 |
0802 |
Explosion generated a gas-and-steam plume that rose 500 m. |
| 30 Jul 2023 |
1250 |
Explosion. |
| 31 Jul 2023 |
2136 |
Explosion. |
| 11 Aug 2023 |
0828 |
Explosion. |
| 18 Aug 2023 |
1304 |
Explosion. |
| 21 Aug 2023 |
1224 |
Explosion generated gas-and-steam plumes rose 500-600 m. |
| 22 Aug 2023 |
0749 |
Explosion generated gas-and-steam plumes rose 500-600 m. |
| 24 Aug 2023 |
1900 |
Explosion. |
| 25 Aug 2023 |
0828 |
Event produced a steam-and-gas plume that rose 3 km and drifted NW. |
| 27-28 Aug 2023 |
0813 |
Four small events; the event at 0813 on 28 August lasted two minutes and generated a steam-and-gas plume that rose 2.5 km. |
| 1 Sep 2023 |
1526 |
Explosion generated plume that rose 2 km and ejected material onto the flanks. |
| 2-3 Sep 2023 |
- |
Small explosions detected in infrasound data. |
| 4 Sep 2023 |
1251 |
Gas-and-steam plume rose 1 km and drifted W. |
| 7 Nov 2023 |
1113 |
Explosion. |
| 8 Nov 2023 |
0722 |
Explosion. |
| 12 Nov 2023 |
0136 |
Small gas emissions. |
| 14 Nov 2023 |
0415 |
Small gas emissions. |
According to OVSICORI-UNA, during July-October the average weekly sulfur dioxide (SO2) flux ranged from 68 to 240 tonnes/day. However, in mid-November the flux increased to as high as 334 tonnes/day, the highest value measured in recent years. The high SO2 flux in mid-November was also detected by the TROPOMI instrument on the Sentinel-5P satellite (figure 43).
Geologic Background. Rincón de la Vieja, the largest volcano in NW Costa Rica, is a remote volcanic complex in the Guanacaste Range. The volcano consists of an elongated, arcuate NW-SE-trending ridge constructed within the 15-km-wide early Pleistocene Guachipelín caldera, whose rim is exposed on the south side. Sometimes known as the "Colossus of Guanacaste," it has an estimated volume of 130 km3 and contains at least nine major eruptive centers. Activity has migrated to the SE, where the youngest-looking craters are located. The twin cone of Santa María volcano, the highest peak of the complex, is located at the eastern end of a smaller, 5-km-wide caldera and has a 500-m-wide crater. A Plinian eruption producing the 0.25 km3 Río Blanca tephra about 3,500 years ago was the last major magmatic eruption. All subsequent eruptions, including numerous historical eruptions possibly dating back to the 16th century, have been from the prominent active crater containing a 500-m-wide acid lake located ENE of Von Seebach crater.
Information Contacts: Observatorio Vulcanológico Sismológica de Costa Rica-Universidad Nacional (OVSICORI-UNA), Apartado 86-3000, Heredia, Costa Rica (URL: http://www.ovsicori.una.ac.cr/); NASA Global Sulfur Dioxide Monitoring Page, Atmospheric Chemistry and Dynamics Laboratory, NASA Goddard Space Flight Center (NASA/GSFC), 8800 Greenbelt Road, Goddard MD 20771, USA (URL: https://so2.gsfc.nasa.gov/).
Bezymianny (Russia) — November 2023 Cite this Report
Bezymianny
Russia
55.972°N, 160.595°E; summit elev. 2882 m
All times are local (unless otherwise noted)
Explosion on 18 October 2023 sends ash plume 8 km high; lava flows and incandescent avalanches
Bezymianny, located on Russia’s Kamchatka Peninsula, has had eruptions since 1955 characterized by dome growth, explosions, pyroclastic flows, ash plumes, and ashfall. Activity during November 2022-April 2023 included gas-and-steam emissions, lava dome collapses generating avalanches, and persistent thermal activity. Similar eruptive activity continued from May through October 2023, described here based on information from weekly and daily reports of the Kamchatka Volcano Eruptions Response Team (KVERT), notices from Tokyo VAAC (Volcanic Ash Advisory Center), and from satellite data.
Overall activity decreased after the strong period of activity in late March through April 2023, which included ash explosions during 29 March and 7-8 April 2023 that sent plumes as high as 10-12 km altitude, along with dome growth and lava flows (BGVN 48:05). This reduced activity can be seen in the MIROVA thermal detection system graph (figure 56), which was consistent with data from the MODVOLC thermal detection system and with Sentinel-2 satellite images that showed persistent hotspots in the summit crater when conditions allowed observations. A renewed period of strong activity began in mid-October 2023.
Activity increased significantly on 17 October 2023 when large collapses began during 0700-0830 on the E flanks of the lava dome and continued to after 0930 the next day (figure 57). Ash plumes rose to an altitude of 4.5-5 km, extending 220 km NNE by 18 October. A large explosion at 1630 on 18 October produced an ash plume that rose to an altitude of 11 km (8 km above the summit) and drifted NNE and then NW, extending 900 km NW within two days at an altitude of 8 km. Minor ashfall was noted in Kozyrevsk (45 km WNW). At 0820 on 20 October an ash plume was identified in satellite images drifting 100 km ENE at altitudes of 4-4.5 km.
Lava flows and hot avalanches from the dome down the SE flank continued over the next few days, including 23 October when clear conditions allowed good observations (figures 58 and 59). A large thermal anomaly was observed over the volcano through 24 October, and in the summit crater on 30 October (figure 60). Strong fumarolic activity continued, with numerous avalanches and occasional incandescence. By the last week of October, volcanic activity had decreased to a level consistent with that earlier in the reporting period.
Aviation warnings were frequently updated during 17-20 October. KVERT issued a Volcano Observatory Notice for Aviation (VONA) on 17 October at 1419 and 1727 (0219 and 0527 UTC) raising the Aviation Color Code (ACC) from Yellow to Orange (second highest level). The next day, KVERT issued a VONA at 1705 (0505 UTC) raising the ACC to Red (highest level) but lowered it back to Orange at 2117 (0917 UTC). After another decrease to Yellow and back to Orange, the ACC was reduced to Yellow on 20 October at 1204 (0004 UTC). In addition, the Tokyo VAAC issued a series of Volcanic Ash Advisories beginning on 16 October and continuing through 30 October.
Geologic Background. The modern Bezymianny, much smaller than its massive neighbors Kamen and Kliuchevskoi on the Kamchatka Peninsula, was formed about 4,700 years ago over a late-Pleistocene lava-dome complex and an edifice built about 11,000-7,000 years ago. Three periods of intensified activity have occurred during the past 3,000 years. The latest period, which was preceded by a 1,000-year quiescence, began with the dramatic 1955-56 eruption. This eruption, similar to that of St. Helens in 1980, produced a large open crater that was formed by collapse of the summit and an associated lateral blast. Subsequent episodic but ongoing lava-dome growth, accompanied by intermittent explosive activity and pyroclastic flows, has largely filled the 1956 crater.
Information Contacts: Kamchatka Volcanic Eruptions Response Team (KVERT), Far Eastern Branch, Russian Academy of Sciences, 9 Piip Blvd., Petropavlovsk-Kamchatsky, 683006, Russia (URL: http://www.kscnet.ru/ivs/kvert/); Kamchatka Volcanological Station, Kamchatka Branch of Geophysical Survey, (KB GS RAS), Klyuchi, Kamchatka Krai, Russia (URL: http://volkstat.ru/); Tokyo Volcanic Ash Advisory Center (VAAC), 1-3-4 Otemachi, Chiyoda-ku, Tokyo 100-8122, Japan (URL: http://ds.data.jma.go.jp/svd/vaac/data/); Hawai'i Institute of Geophysics and Planetology (HIGP) - MODVOLC Thermal Alerts System, School of Ocean and Earth Science and Technology (SOEST), Univ. of Hawai'i, 2525 Correa Road, Honolulu, HI 96822, USA (URL: http://modis.higp.hawaii.edu/); MIROVA (Middle InfraRed Observation of Volcanic Activity), a collaborative project between the Universities of Turin and Florence (Italy) supported by the Centre for Volcanic Risk of the Italian Civil Protection Department (URL: http://www.mirovaweb.it/); Copernicus Browser, Copernicus Data Space Ecosystem, European Space Agency (URL: https://dataspace.copernicus.eu/browser/).chr
Kilauea (United States) — January 2023 Cite this Report
Kilauea
United States
19.421°N, 155.287°W; summit elev. 1222 m
All times are local (unless otherwise noted)
Low-level lava effusions in the lava lake at Halema’uma’u during July-December 2022
Kīlauea is the southeastern-most volcano in Hawaii and overlaps the E flank of the Mauna Loa volcano. Its East Rift Zone (ERZ) has been intermittently active for at least 2,000 years. An extended eruption period began in January 1983 and was characterized by open lava lakes and lava flows from the summit caldera and the East Rift Zone. During May 2018 magma migrated into the Lower East Rift Zone (LERZ) and opened 24 fissures along a 6-km-long NE-trending fracture zone that produced lava flows traveling in multiple directions. As lava emerged from the fissures, the lava lake at Halema'uma'u drained and explosions sent ash plumes to several kilometers altitude (BGVN 43:10).
The current eruption period started during September 2021 and has recently been characterized by lava effusions, spatter, and sulfur dioxide emissions in the active Halema’uma’u lava lake (BGVN 47:08). Lava effusions, some spatter, and sulfur dioxide emissions have continued during this reporting period of July through December 2022 using daily reports, volcanic activity notices, and abundant photo, map, and video data from the US Geological Survey's (USGS) Hawaiian Volcano Observatory (HVO).
Summary of activity during July-December 2022. Low-level effusions have continued at the western vent of the Halema’uma’u crater during July through early December 2022. Occasional weak ooze-outs (also called lava break outs) would occur along the margins of the crater floor. The overall level of the active lava lake throughout the reporting period gradually increased due to infilling, however it stagnated in mid-September (table 13). During September through November, activity began to decline, though lava effusions persisted at the western vent. By 9 December, the active part of the lava lake had completely crusted over, and incandescence was no longer visible.
Table 13. Summary of measurements taken during overflights at Kīlauea that show a gradual increase in the active lava lake level and the volume of lava effused since 29 September 2021. Lower activity was reported during September-October. Data collected during July-December 2022. Courtesy of HVO.
| Date: |
Level of the active lava lake (m): |
Cumulative volume of lava effused (million cubic meters): |
| 7 Jul 2022 |
130 |
95 |
| 19 Jul 2022 |
133 |
98 |
| 4 Aug 2022 |
136 |
102 |
| 16 Aug 2022 |
137 |
104 |
| 12 Sep 2022 |
143 |
111 |
| 5 Oct 2022 |
143 |
111 |
| 28 Oct 2022 |
143 |
111 |
Activity during July 2022. Lava effusions were reported from the western vent in the Halema’uma’u crater, along with occasional weak ooze-outs along the margins of the crater floor. The height of the lava lake was variable due to deflation-inflation tilt events; for example, the lake level dropped approximately 3-4 m during a summit deflation-inflation event reported on 1 July. Webcam images taken during the night of 6-12 July showed intermittent low-level spattering at the western vent that rose less than 10 m above the vent (figure 519). Measurements made during an overflight on 7 July indicated that the crater floor was infilled about 130 m and that 95 million cubic meters of lava had been effused since 29 September 2021. A single, relatively small lava ooze-out was active to the S of the lava lake. Around midnight on 8 July there were two brief periods of lava overflow onto the lake margins. On 9 July lava ooze-outs were reported near the SE and NE edges of the crater floor and during 10-11 July they occurred near the E, NE, and NW edges. On 16 July crater incandescence was reported, though the ooze-outs and spattering were not visible. On 18 July overnight webcam images showed incandescence in the western vent complex and two ooze-outs were reported around 0000 and 0200 on 19 July. By 0900 there were active ooze-outs along the SW edge of the crater floor. Measurements made from an overflight on 19 July indicated that the crater floor was infilled about 133 m and 98 million cubic meters of lava had erupted since 29 September 2021 (figure 520). On 20 July around 1600 active ooze-outs were visible along the N edge of the crater, which continued through the next day. Extensive ooze-outs occurred along the W margin during 24 July until 1900; on 26 July minor ooze-outs were noted along the N margin. Minor spattering was visible on 29 July along the E margin of the lake. The sulfur dioxide emission rates ranged 650-2,800 tons per day (t/d), the higher of which was measured on 8 July (figure 519).
Activity during August 2022. The eruption continued in the Halema’uma’u crater at the western vent. According to HVO the lava in the active lake remained at the level of the bounding levees. Occasional minor ooze-outs were observed along the margins of the crater floor. Strong nighttime crater incandescence was visible after midnight on 6 August over the western vent cone. During 6-7 August scattered small lava lobes were active along the crater floor and incandescence persisted above the western vent through 9 August. During 7-9 August HVO reported a single lava effusion source was active along the NW margin of the crater floor. Measurements from an overflight on 4 August indicated that the crater floor was infilled about 136 m total and that 102 million cubic meters of lava had been erupted since the start of the eruption. Lava breakouts were reported along the N, NE, E, S, and W margins of the crater during 10-16 August. Another overflight survey conducted on 16 August indicated that the crater floor infilled about 137 m and 104 million cubic meters of lava had been erupted since September 2021. Measured sulfur dioxide emissions rates ranged 1,150-2,450 t/d, the higher of which occurred on 8 August.
Activity during September 2022. During September, lava effusion continued from the western vent into the active lava lake and onto the crater floor. Intermittent minor ooze-outs were reported through the month. A small ooze-out was visible on the W crater floor margin at 0220 on 2 September, which showed decreasing surface activity throughout the day, but remained active through 3 September. On 3 September around 1900 a lava outbreak occurred along the NW margin of the crater floor but had stopped by the evening of 4 September. Field crews monitoring the summit lava lake on 9 September observed spattering on the NE margin of the lake that rose no higher than 10 m, before falling back onto the lava lake crust (figure 521). Overflight measurements on 12 September indicated that the crater floor was infilled a total of 143 m and 111 million cubic meters of lava had been erupted since September 2021. Extensive breakouts in the W and N part of the crater floor were reported at 1600 on 20 September and continued into 26 September. The active part of the lava lake dropped by 10 m while other parts of the crater floor dropped by several meters. Summit tiltmeters recorded a summit seismic swarm of more than 80 earthquakes during 1500-1800 on 21 September, which occurred about 1.5 km below Halema’uma’u; a majority of these were less than Mw 2. By 22 September the active part of the lava lake was infilled about 2 m. On 23 September the western vent areas exhibited several small spatter cones with incandescent openings, along with weak, sporadic spattering (figure 522). The sulfur dioxide emission rate ranged from 930 t/d to 2,000 t/d, the higher of which was measured on 6 September.
Activity during October 2022. Activity during October declined slightly compared to previous months, though lava effusions persisted from the western vent into the active lava lake and onto the crater floor during October (figure 523). Slight variations in the lava lake were noted throughout the month. HVO reported that around 0600 on 3 October the level of the lava lake has lowered slightly. Overflight measurements taken on 5 October indicated that the crater floor was infilled a total of about 143 m and that 111 million cubic meters of lava had been effused since September 2021. During 6-7 October the lake gradually rose 0.5 m. Sulfur dioxide measurements made on 22 October had an emission rate of 700 t/d. Another overflight taken on 28 October showed that there was little to no change in the elevation of the crater floor: the crater floor was infilled a total of 143 m and 111 million cubic meters of lava had erupted since the start of the eruption.
Activity during November 2022. Activity remained low during November, though HVO reported that lava from the western vent continued to effuse into the active lava lake and onto the crater floor throughout the month. The rate of sulfur dioxide emissions during November ranged from 300-600 t/d, the higher amount of which occurred on 9 November.
Activity during December 2022. Similar low activity was reported during December, with lava effusing from the western vent into the active lava lake and onto the crater floor. During 4-5 December the active part of the lava lake was slightly variable in elevation and fluctuated within 1 m. On 9 December HVO reported that lava was no longer erupting from the western vent in the Halema’uma’u crater and that sulfur dioxide emissions had returned to near pre-eruption background levels; during 10-11 December, the lava lake had completely crusted over, and no incandescence was visible (figure 524). Time lapse camera images covering the 4-10 December showed that the crater floor showed weak deflation and no inflation. Some passive events of crustal overturning were reported during 14-15 December, which brought fresh incandescent lava to the lake surface. The sulfur dioxide emission rate was approximately 200 t/d on 14 December. A smaller overturn event on 17 December and another that occurred around 0000 and into the morning of 20 December were also detected. A small seismic swarm was later detected on 30 December.
Geologic Background. Kilauea overlaps the E flank of the massive Mauna Loa shield volcano in the island of Hawaii. Eruptions are prominent in Polynesian legends; written documentation since 1820 records frequent summit and flank lava flow eruptions interspersed with periods of long-term lava lake activity at Halemaumau crater in the summit caldera until 1924. The 3 x 5 km caldera was formed in several stages about 1,500 years ago and during the 18th century; eruptions have also originated from the lengthy East and Southwest rift zones, which extend to the ocean in both directions. About 90% of the surface of the basaltic shield volcano is formed of lava flows less than about 1,100 years old; 70% of the surface is younger than 600 years. The long-term eruption from the East rift zone between 1983 and 2018 produced lava flows covering more than 100 km2, destroyed hundreds of houses, and added new coastline.
Information Contacts: Hawaiian Volcano Observatory (HVO), U.S. Geological Survey, PO Box 51, Hawai'i National Park, HI 96718, USA (URL: http://hvo.wr.usgs.gov/).
Nyamulagira (DR Congo) — November 2023 Cite this Report
Nyamulagira
DR Congo
1.408°S, 29.2°E; summit elev. 3058 m
All times are local (unless otherwise noted)
Lava flows and thermal activity during May-October 2023
Nyamulagira (also known as Nyamuragira) is a shield volcano in the Democratic Republic of Congo with the summit truncated by a small 2 x 2.3 km caldera with walls up to about 100 m high. Documented eruptions have occurred within the summit caldera, as well as from numerous flank fissures and cinder cones. The current eruption period began in April 2018 and has more recently been characterized by summit crater lava flows and thermal activity (BGVN 48:05). This report describes lava flows and variable thermal activity during May through October 2023, based on information from the Observatoire Volcanologique de Goma (OVG) and various satellite data.
Lava lake activity continued during May. The MIROVA (Middle InfraRed Observation of Volcanic Activity) system recorded moderate-to-strong thermal activity throughout the reporting period; activity was more intense during May and October and relatively weaker from June through September (figure 95). The MODVOLC thermal algorithm, detected a total of 209 thermal alerts. There were 143 hotspots detected during May, eight during June, nine during September, and 49 during October. This activity was also reflected in infrared satellite images, where a lava flow was visible in the NW part of the crater on 7 May and strong activity was seen in the center of the crater on 4 October (figure 96). Another infrared satellite image taken on 12 May showed still active lava flows along the NW margin of the crater. According to OVG lava effusions were active during 7-29 May and moved to the N and NW parts of the crater beginning on 9 May. Strong summit crater incandescence was visible from Goma (27 km S) during the nights of 17, 19, and 20 May (figure 97). On 17 May there was an increase in eruptive activity, which peaked at 0100 on 20 May. Notable sulfur dioxide plumes drifted NW and W during 19-20 May (figure 98). Drone footage acquired in partnership with the USGS (United States Geological Survey) on 20 May captured images of narrow lava flows that traveled about 100 m down the W flank (figure 99). Data from the Rumangabo seismic station indicated a decreasing trend in activity during 17-21 May. Although weather clouds prevented clear views of the summit, a strong thermal signature on the NW flank was visible in an infrared satellite image on 22 May, based on an infrared satellite image. On 28 May the lava flows on the upper W flank began to cool and solidify. By 29 May seismicity returned to levels similar to those recorded before the 17 May increase. Lava effusion continued but was confined to the summit crater; periodic crater incandescence was observed.
Low-level activity was noted during June through October. On 1 June OVG reported that seismicity remained at lower levels and that crater incandescence had been absent for three days, though infrared satellite imagery showed continued lava effusion in the summit crater. The lava flows on the flanks covered an estimated 0.6 km2. Satellite imagery continued to show thermal activity confined to the lava lake through October (figure 96), although no lava flows or significant sulfur dioxide emissions were reported.
Geologic Background. Africa's most active volcano, Nyamulagira (also known as Nyamuragira), is a massive high-potassium basaltic shield about 25 km N of Lake Kivu and 13 km NNW of the steep-sided Nyiragongo volcano. The summit is truncated by a small 2 x 2.3 km caldera that has walls up to about 100 m high. Documented eruptions have occurred within the summit caldera, as well as from the numerous flank fissures and cinder cones. A lava lake in the summit crater, active since at least 1921, drained in 1938, at the time of a major flank eruption. Recent lava flows extend down the flanks more than 30 km from the summit as far as Lake Kivu; extensive lava flows from this volcano have covered 1,500 km2 of the western branch of the East African Rift.
Information Contacts: Observatoire Volcanologique de Goma (OVG), Departement de Geophysique, Centre de Recherche en Sciences Naturelles, Lwiro, D.S. Bukavu, DR Congo; Hawai'i Institute of Geophysics and Planetology (HIGP) - MODVOLC Thermal Alerts System, School of Ocean and Earth Science and Technology (SOEST), Univ. of Hawai'i, 2525 Correa Road, Honolulu, HI 96822, USA (URL: http://modis.higp.hawaii.edu/); MIROVA (Middle InfraRed Observation of Volcanic Activity), a collaborative project between the Universities of Turin and Florence (Italy) supported by the Centre for Volcanic Risk of the Italian Civil Protection Department (URL: http://www.mirovaweb.it/); NASA Global Sulfur Dioxide Monitoring Page, Atmospheric Chemistry and Dynamics Laboratory, NASA Goddard Space Flight Center (NASA/GSFC), 8800 Greenbelt Road, Goddard, Maryland, USA (URL: https://so2.gsfc.nasa.gov/); Copernicus Browser, Copernicus Data Space Ecosystem, European Space Agency (URL: https://dataspace.copernicus.eu/browser/); Charles Balagizi, Goma Volcano Observatory, Departement de Geophysique, Centre de Recherche en Sciences Naturelles, Lwiro, D.S. Bukavu, DR Congo.
Bagana (Papua New Guinea) — October 2023 Cite this Report
Bagana
Papua New Guinea
6.137°S, 155.196°E; summit elev. 1855 m
All times are local (unless otherwise noted)
Explosions, ash plumes, ashfall, and lava flows during April-September 2023
The remote volcano of Bagana is located in central Bougainville Island, Papua New Guinea. Recorded eruptions date back to 1842 and activity has consisted of effusive activity that has built a small lava dome in the summit crater and occasional explosions that produced pyroclastic flows. The most recent eruption has been ongoing since February 2000 and has produced occasional explosions, ash plumes, and lava flows. More recently, activity has been characterized by ongoing effusive activity and ash emissions (BGVN 48:04). This report updates activity from April through September 2023 that has consisted of explosions, ash plumes, ashfall, and lava flows, using information from the Darwin Volcanic Ash Advisory Center (VAAC) and satellite data.
An explosive eruption was reported on 7 July that generated a large gas-and-ash plume to high altitudes and caused significant ashfall in local communities; the eruption plume had reached upper tropospheric (16-18 km altitude) altitudes by 2200, according to satellite images. Sulfur dioxide plumes were detected in satellite images on 8 July and indicated that the plume was likely a mixture of gas, ice, and ash. A report issued by the Autonomous Bougainville Government (ABG) (Torokina District, Education Section) on 10 July noted that significant ash began falling during 2000-2100 on 7 July and covered most areas in the Vuakovi, Gotana (9 km SW), Koromaketo, Laruma (25 km W) and Atsilima (27 km NW) villages. Pyroclastic flows also occurred, according to ground-based reports; small deposits confined to one drainage were inspected by RVO during an overflight on 17 July and were confirmed to be from the 7 July event. Ashfall continued until 10 July and covered vegetation, which destroyed bushes and gardens and contaminated rivers and streams.
RVO reported another eruption on 14 July. The Darwin VAAC stated that an explosive event started around 0830 on 15 July and produced an ash plume that rose to 16.5 km altitude by 1000 and drifted N, according to satellite images. The plume continued to drift N and remained visible through 1900, and by 2150 it had dissipated.
Ashfall likely from both the 7 and 15 July events impacted about 8,111 people in Torokina (20 km SW), including Tsito/Vuakovi, Gotana, Koromaketo, Kenaia, Longkogari, Kenbaki, Piva (13 km SW), and Atsinima, and in the Tsitovi district, according to ABG. Significant ashfall was also reported in Ruruvu (22 km N) in the Wakunai District of Central Bougainville, though the thickness of these deposits could not be confirmed. An evacuation was called for the villages in Wakunai, where heavy ashfall had contaminated water sources; the communities of Ruruvu, Togarau, Kakarapaia, Karauturi, Atao, and Kuritaturi were asked to evacuate to a disaster center at the Wakunai District Station, and communities in Torokina were asked to evacuate to the Piva District station. According to a news article, more than 7,000 people needed temporary accommodations, with about 1,000 people in evacuation shelters. Ashfall had deposited over a broad area, contaminating water supplies, affecting crops, and collapsing some roofs and houses in rural areas. Schools were temporarily shut down. Intermittent ash emissions continued through the end of July and drifted NNW, NW, and SW. Fine ashfall was reported on the coast of Torokina, and ash plumes also drifted toward Laruma and Atsilima.
A small explosive eruption occurred at 2130 on 28 July that ejected material from the crater vents, according to reports from Torokina, in addition to a lava flow that contained two lobes. A second explosion was detected at 2157. Incandescence from the lava flow was visible from Piva as it descended the W flank around 2000 on 29 July (figure 47). The Darwin VAAC reported that a strong thermal anomaly was visible in satellite images during 30-31 July and that ash emissions rose to 2.4 km altitude and drifted WSW on 30 July. A ground report from RVO described localized emissions at 0900 on 31 July.
The Darwin VAAC reported that ash plumes were identified in satellite imagery at 0800 and 1220 on 12 August and rose to 2.1 km and 3 km altitude and drifted NW and W, respectively. A news report stated that aid was sent to more than 6,300 people that were adversely affected by the eruption. Photos taken during 17-19 August showed ash emissions rising no higher than 1 km above the summit and drifting SE. A small explosion generated an ash plume during the morning of 19 August. Deposits from small pyroclastic flows were also captured in the photos. Satellite images captured lava flows and pyroclastic flow deposits. Two temporary seismic stations were installed near Bagana on 17 August at distances of 7 km WSW (Vakovi station) and 11 km SW (Kepox station). The Kepox station immediately started to record continuous, low-frequency background seismicity.
Satellite data. Little to no thermal activity was detected during April through mid-July 2023; only one anomaly was recorded during early April and one during early June, according to MIROVA (Middle InfraRed Observation of Volcanic Activity) data (figure 48). Thermal activity increased in both power and frequency during mid-July through September, although there were still some short gaps in detected activity. MODVOLC also detected increased thermal activity during August; thermal hotspots were detected a total of five times on 19, 20, and 27 August. Weak thermal anomalies were also captured in infrared satellite images on clear weather days throughout the reporting period on 7, 12, and 17 April, 27 May, 1, 6, 16, and 31 July, and 19 September (figure 48); a strong thermal anomaly was visible on 31 July. Distinct sulfur dioxide plumes that drifted generally NW were intermittently captured by the TROPOMI instrument on the Sentinel-5P satellite and sometimes exceeded two Dobson Units (DUs) (figure 49).
Geologic Background. Bagana volcano, in a remote portion of central Bougainville Island, is frequently active. This massive symmetrical cone was largely constructed by an accumulation of viscous andesitic lava flows. The entire edifice could have been constructed in about 300 years at its present rate of lava production. Eruptive activity is characterized by non-explosive effusion of viscous lava that maintains a small lava dome in the summit crater, although occasional explosive activity produces pyroclastic flows. Lava flows with tongue-shaped lobes up to 50 m thick and prominent levees descend the flanks on all sides.
Information Contacts: Rabaul Volcano Observatory (RVO), Geohazards Management Division, Department of Mineral Policy and Geohazards Management (DMPGM), PO Box 3386, Kokopo, East New Britain Province, Papua New Guinea; Darwin Volcanic Ash Advisory Centre (VAAC), Bureau of Meteorology, Northern Territory Regional Office, PO Box 40050, Casuarina, NT 0811, Australia (URL: http://www.bom.gov.au/info/vaac/); MIROVA (Middle InfraRed Observation of Volcanic Activity), a collaborative project between the Universities of Turin and Florence (Italy) supported by the Centre for Volcanic Risk of the Italian Civil Protection Department (URL: http://www.mirovaweb.it/); Hawai'i Institute of Geophysics and Planetology (HIGP) - MODVOLC Thermal Alerts System, School of Ocean and Earth Science and Technology (SOEST), Univ. of Hawai'i, 2525 Correa Road, Honolulu, HI 96822, USA (URL: http://modis.higp.hawaii.edu/); NASA Global Sulfur Dioxide Monitoring Page, Atmospheric Chemistry and Dynamics Laboratory, NASA Goddard Space Flight Center (NASA/GSFC), 8800 Greenbelt Road, Goddard, Maryland, USA (URL: https://so2.gsfc.nasa.gov/); Copernicus Browser, Copernicus Data Space Ecosystem, European Space Agency (URL: https://dataspace.copernicus.eu/browser/); Autonomous Bougainville Government, P.O Box 322, Buka, AROB, PNG (URL: https://abg.gov.pg/); Andrew Tupper (Twitter: @andrewcraigtupp); Simon Carn, Geological and Mining Engineering and Sciences, Michigan Technological University, 1400 Townsend Drive, Houghton, MI 49931, USA (URL: http://www.volcarno.com/, Twitter: @simoncarn); Radio NZ (URL: https://www.rnz.co.nz/news/pacific/494464/more-than-7-000-people-in-bougainville-need-temporary-accommodation-after-eruption); USAID, 1300 Pennsylvania Ave, NW, Washington DC 20004, USA (URL: https://www.usaid.gov/pacific-islands/press-releases/aug-08-2023-united-states-provides-immediate-emergency-assistance-support-communities-affected-mount-bagana-volcanic-eruptions).
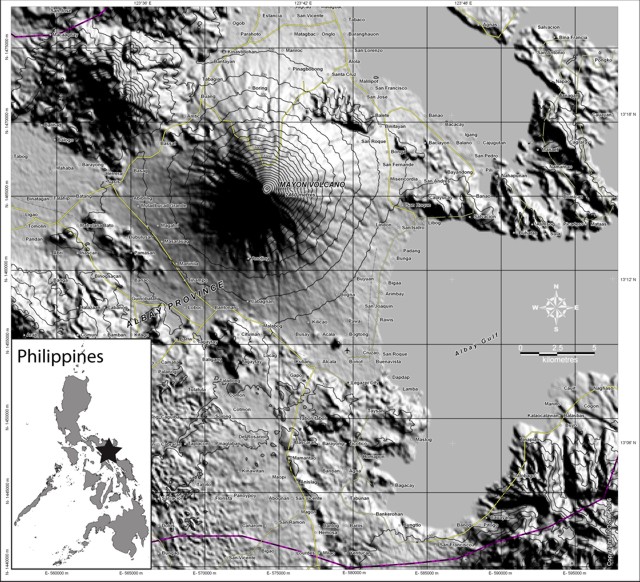
Mayon (Philippines) — October 2023 Cite this Report
Mayon
Philippines
13.257°N, 123.685°E; summit elev. 2462 m
All times are local (unless otherwise noted)
Lava flows, pyroclastic flows, ash emissions, and seismicity during April-September 2023
Mayon is located in the Philippines and has steep upper slopes capped by a small summit crater. Historical eruptions date back to 1616 CE that have been characterized by Strombolian eruptions, lava flows, pyroclastic flows, and mudflows. Eruptions mostly originated from a central conduit. Pyroclastic flows and mudflows have commonly descended many of the approximately 40 drainages that surround the volcano. The most recent eruption occurred during June through October 2022 and consisted of lava dome growth and gas-and-steam emissions (BGVN 47:12). A new eruption was reported during late April 2023 and has included lava flows, pyroclastic density currents, ash emissions, and seismicity. This report covers activity during April through September 2023 based on daily bulletins from the Philippine Institute of Volcanology and Seismology (PHIVOLCS).
During April through September 2023, PHIVOLCS reported near-daily rockfall events, frequent volcanic earthquakes, and sulfur dioxide measurements. Gas-and-steam emissions rose 100-900 m above the crater and drifted in different directions. Nighttime crater incandescence was often visible during clear weather and was accompanied by incandescent avalanches of material. Activity notably increased during June when lava flows were reported on the S, SE, and E flanks (figure 52). The MIROVA graph (Middle InfraRed Observation of Volcanic Activity) showed strong thermal activity coincident with these lava flows, which remained active through September (figure 53). According to the MODVOLC thermal algorithm, a total of 110 thermal alerts were detected during the reporting period: 17 during June, 40 during July, 27 during August, and 26 during September. During early June, pyroclastic density currents (PDCs) started to occur more frequently.
Low activity was reported during much of April and May; gas-and-steam emissions rose 100-900 m above the crater and generally drifted in different directions. A total of 52 rockfall events and 18 volcanic earthquakes were detected during April and 147 rockfall events and 13 volcanic events during May. Sulfur dioxide flux measurements ranged between 400-576 tons per day (t/d) during April, the latter of which was measured on 29 April and between 162-343 t/d during May, the latter of which was measured on 13 May.
Activity during June increased, characterized by lava flows, pyroclastic density currents (PDCs), crater incandescence and incandescent rockfall events, gas-and-steam emissions, and continued seismicity. Weather clouds often prevented clear views of the summit, but during clear days, moderate gas-and-steam emissions rose 100-2,500 m above the crater and drifted in multiple directions. A total of 6,237 rockfall events and 288 volcanic earthquakes were detected. The rockfall events often deposited material on the S and SE flanks within 700-1,500 m of the summit crater and ash from the events drifted SW, S, SE, NE, and E. Sulfur dioxide emissions ranged between 149-1,205 t/d, the latter of which was measured on 10 June. Short-term observations from EDM and electronic tiltmeter monitoring indicated that the upper slopes were inflating since February 2023. Longer-term ground deformation parameters based on EDM, precise leveling, continuous GPS, and electronic tilt monitoring indicated that the volcano remained inflated, especially on the NW and SE flanks. At 1000 on 5 June the Volcano Alert Level (VAL) was raised to 2 (on a 0-5 scale). PHIVOLCS noted that although low-level volcanic earthquakes, ground deformation, and volcanic gas emissions indicated unrest, the steep increase in rockfall frequency may indicate increased dome activity.
A total of 151 dome-collapse PDCs occurred during 8-9 and 11-30 June, traveled 500-2,000 m, and deposited material on the S flank within 2 km of the summit crater. During 8-9 June the VAL was raised to 3. At approximately 1947 on 11 June lava flow activity was reported; two lobes traveled within 500 m from the crater and deposited material on the S (Mi-isi), SE (Bonga), and E (Basud) flanks. Weak seismicity accompanied the lava flow and slight inflation on the upper flanks. This lava flow remained active through 30 June, moving down the S and SE flank as far as 2.5 km and 1.8 km, respectively and depositing material up to 3.3 km from the crater. During 15-16 June traces of ashfall from the PDCs were reported in Sitio Buga, Nabonton, City of Ligao and Purok, and San Francisco, Municipality of Guinobatan. During 28-29 June there were two PDCs generated by the collapse of the lava flow front, which generated a light-brown ash plume 1 km high. Satellite monitors detected significant concentrations of sulfur dioxide beginning on 29 June. On 30 June PDCs primarily affected the Basud Gully on the E flank, the largest of which occurred at 1301 and lasted eight minutes, based on the seismic record. Four PDCs generated between 1800 and 2000 that lasted approximately four minutes each traveled 3-4 km on the E flank and generated an ash plume that rose 1 km above the crater and drifted N and NW. Ashfall was recorded in Tabaco City.
Similar strong activity continued during July; slow lava effusion remained active on the S and SE flanks and traveled as far as 2.8 km and 2.8 km, respectively and material was deposited as far as 4 km from the crater. There was a total of 6,983 rockfall events and 189 PDCs that affected the S, SE, and E flanks. The volcano network detected a total of 2,124 volcanic earthquakes. Continuous gas-and-steam emissions rose 200-2,000 m above the crater and drifted in multiple directions. Sulfur dioxide emissions averaged 792-4,113 t/d, the latter of which was measured on 28 July. During 2-4 July three PDCs were generated from the collapse of the lava flow and resulting light brown plumes rose 200-300 m above the crater. Continuous tremor pulses were reported beginning at 1547 on 3 July through 7 July at 1200, at 2300 on 8 July and going through 0300 on 10 July, and at 2300 on 16 July, as recorded by the seismic network. During 6-9 July there were 10 lava flow-collapse-related PDCs that generated light brown plumes 300-500 m above the crater. During 10-11 July light ashfall was reported in some areas of Mabinit, Legazpi City, Budiao and Salvacion, Daraga, and Camalig, Albay. By 18 July the lava flow advanced 600 m on the E flank as well.
During 1733 on 18 July and 0434 on 19 July PHIVOLCS reported 30 “ashing” events, which are degassing events accompanied by audible thunder-like sounds and entrained ash at the crater, which produced short, dark plumes that drifted SW. These events each lasted 20-40 seconds, and plume heights ranged from 150-300 m above the crater, as recorded by seismic, infrasound, visual, and thermal monitors. Three more ashing events occurred during 19-20 July. Short-term observations from electronic tilt and GPS monitoring indicate deflation on the E lower flanks in early July and inflation on the NW middle flanks during the third week of July. Longer-term ground deformation parameters from EDM, precise leveling, continuous GPS, and electronic tilt monitoring indicated that the volcano was still generally inflated relative to baseline levels. A short-lived lava pulse lasted 28 seconds at 1956 on 21 July, which was accompanied by seismic and infrasound signals. By 22 July, the only lava flow that remained active was on the SE flank, and continued to extend 3.4 km, while those on the S and E flanks weakened markedly. One ashing event was detected during 30-31 July, whereas there were 57 detected during 31 July-1 August; according to PHIVOLCS beginning at approximately 1800 on 31 July eruptive activity was dominated by phases of intermittent ashing, as well as increased in the apparent rates of lava effusion from the summit crater. The ashing phases consisted of discrete events recorded as low-frequency volcanic earthquakes (LFVQ) typically 30 seconds in duration, based on seismic and infrasound signals. Gray ash plume rose 100 m above the crater and generally drifted NE. Shortly after these ashing events began, new lava began to effuse rapidly from the crater, feeding the established flowed on the SE, E, and E flanks and generating frequent rockfall events.
Intensified unrest persisted during August. There was a total of 4,141 rockfall events, 2,881 volcanic earthquakes, which included volcanic tremor events, 32 ashing events, and 101 PDCs detected throughout the month. On clear weather days, gas-and-steam emissions rose 300-1,500 m above the crater and drifted in different directions (figure 54). Sulfur dioxide emissions averaged 735-4,756 t/d, the higher value of which was measured on 16 August. During 1-2 August the rate of lava effusion decreased, but continued to feed the flows on the SE, S, and E flanks, maintaining their advances to 3.4 km, 2.8 km, and 1.1 km from the crater, respectively (figure 55). Rockfall and PDCs generated by collapses at the lava flow margins and from the summit dome deposited material within 4 km of the crater. During 3-4 August there were 10 tremor events detected that lasted 1-4 minutes. Short-lived lava pulse lasted 35 seconds and was accompanied by seismic and infrasound signals at 0442 on 6 August. Seven collapses were recorded at the front of the lava flow during 12-14 August.
During September, similar activity of slow lava effusion, PDCs, gas-and-steam emissions, and seismicity continued. There was a total of 4,452 rockfall events, 329 volcanic earthquakes, which included volcanic tremor events, two ashing events, and 85 PDCs recorded throughout the month. On clear weather days, gas-and-steam emissions rose 100-1,500 m above the crater and drifted in multiple directions. Sulfur dioxide emissions averaged 609-2,252 t/d, the higher average of which was measured on 6 September. Slow lava effusion continued advancing on the SE, S, and E flanks, maintaining lengths of 3.4 km, 2.8 km, and 1.1 km, respectively. Rockfall and PDC events generated by collapses along the lava flow margins and at the summit dome deposited material within 4 km of the crater.
Geologic Background. Symmetrical Mayon, which rises above the Albay Gulf NW of Legazpi City, is the most active volcano of the Philippines. The steep upper slopes are capped by a small summit crater. Recorded eruptions since 1616 CE range from Strombolian to basaltic Plinian, with cyclical activity beginning with basaltic eruptions, followed by longer periods of andesitic lava flows. Eruptions occur predominately from the central conduit and have also produced lava flows that travel far down the flanks. Pyroclastic density currents and mudflows have commonly swept down many of the approximately 40 ravines that radiate from the summit and have often damaged populated lowland areas. A violent eruption in 1814 killed more than 1,200 people and devastated several towns.
Information Contacts: Philippine Institute of Volcanology and Seismology (PHIVOLCS), Department of Science and Technology, University of the Philippines Campus, Diliman, Quezon City, Philippines (URL: http://www.phivolcs.dost.gov.ph/); MIROVA (Middle InfraRed Observation of Volcanic Activity), a collaborative project between the Universities of Turin and Florence (Italy) supported by the Centre for Volcanic Risk of the Italian Civil Protection Department (URL: http://www.mirovaweb.it/); Hawai'i Institute of Geophysics and Planetology (HIGP) - MODVOLC Thermal Alerts System, School of Ocean and Earth Science and Technology (SOEST), Univ. of Hawai'i, 2525 Correa Road, Honolulu, HI 96822, USA (URL: http://modis.higp.hawaii.edu/); Copernicus Browser, Copernicus Data Space Ecosystem, European Space Agency (URL: https://dataspace.copernicus.eu/browser/); William Rogers, Legazpi City, Albay Province, Philippines.
Nishinoshima (Japan) — October 2023 Cite this Report
Nishinoshima
Japan
27.247°N, 140.874°E; summit elev. 100 m
All times are local (unless otherwise noted)
Eruption plumes and gas-and-steam plumes during May-August 2023
Nishinoshima, located about 1,000 km S of Tokyo, is a small island in the Ogasawara Arc in Japan. The island is the summit of a massive submarine volcano that has prominent submarine peaks to the S, W, and NE. Eruptions date back to 1973 and the current eruption period began in October 2022. Recent activity has consisted of small ash plumes and fumarolic activity (BGVN 48:07). This report covers activity during May through August 2023, using information from monthly reports of the Japan Meteorological Agency (JMA) monthly reports and satellite data.
Activity during May through June was relatively low. The Japan Coast Guard (JCG) did overflights on 14 and 22 June and reported white gas-and-steam emissions rising 600 m and 1,200 m from the central crater of the pyroclastic cone, respectively (figure 125). In addition, multiple white gas-and-steam emissions rose from the inner rim of the W side of the crater and from the SE flank of the pyroclastic cone. Discolored brown-to-green water was observed around almost the entire perimeter of the island; on 22 June light green discolored water was observed off the S coast of the island.
Observations from the Himawari meteorological satellite confirmed an eruption on 9 and 10 July. An eruption plume rose 1.6 km above the crater and drifted N around 1300 on 9 July. Satellite images acquired at 1420 and 2020 on 9 July and at 0220 on 10 July showed continuing emissions that rose 1.3-1.6 km above the crater and drifted NE and N. The Tokyo VAAC reported that an ash plume seen by a pilot and identified in a satellite image at 0630 on 21 July rose to 3 km altitude and drifted S.
Aerial observations conducted by JCG on 8 August showed a white-and-gray plume rising from the central crater of the pyroclastic cone, and multiple white gas-and-steam emissions were rising from the inner edge of the western crater and along the NW-SE flanks of the island (figure 126). Brown-to-green discolored water was also noted around the perimeter of the island.
Intermittent low-to-moderate power thermal anomalies were recorded in the MIROVA graph (Middle InfraRed Observation of Volcanic Activity), showing an increase in both frequency and power beginning in July (figure 127). This increase in activity coincides with eruptive activity on 9 and 10 July, characterized by eruption plumes. According to the MODVOLC thermal alert algorithm, one thermal hotspot was recorded on 20 July. Weak thermal anomalies were also detected in infrared satellite imagery, accompanied by strong gas-and-steam plumes (figure 128).
Geologic Background. The small island of Nishinoshima was enlarged when several new islands coalesced during an eruption in 1973-74. Multiple eruptions that began in 2013 completely covered the previous exposed surface and continued to enlarge the island. The island is the summit of a massive submarine volcano that has prominent peaks to the S, W, and NE. The summit of the southern cone rises to within 214 m of the ocean surface 9 km SSE.
Information Contacts: Japan Meteorological Agency (JMA), 1-3-4 Otemachi, Chiyoda-ku, Tokyo 100-8122, Japan (URL: http://www.jma.go.jp/jma/indexe.html); Tokyo Volcanic Ash Advisory Center (VAAC), 1-3-4 Otemachi, Chiyoda-ku, Tokyo 100-8122, Japan (URL: http://ds.data.jma.go.jp/svd/vaac/data/); MIROVA (Middle InfraRed Observation of Volcanic Activity), a collaborative project between the Universities of Turin and Florence (Italy) supported by the Centre for Volcanic Risk of the Italian Civil Protection Department (URL: http://www.mirovaweb.it/); Copernicus Browser, Copernicus Data Space Ecosystem, European Space Agency (URL: https://dataspace.copernicus.eu/browser/).
Krakatau (Indonesia) — October 2023 Cite this Report
Krakatau
Indonesia
6.1009°S, 105.4233°E; summit elev. 285 m
All times are local (unless otherwise noted)
White gas-and-steam plumes and occasional ash plumes during May-August 2023
Krakatau is located in the Sunda Strait between Java and Sumatra, Indonesia. Caldera collapse during the catastrophic 1883 eruption destroyed Danan and Perbuwatan cones and left only a remnant of Rakata. The post-collapse cone of Anak Krakatau (Child of Krakatau) was constructed within the 1883 caldera at a point between the former Danan and Perbuwatan cones; it has been the site of frequent eruptions since 1927. The current eruption period began in May 2021 and has recently consisted of Strombolian eruptions and ash plumes (BGVN 48:07). This report describes lower levels of activity consisting of ash and white gas-and-steam plumes during May through August 2023, based on information provided by the Indonesian Center for Volcanology and Geological Hazard Mitigation, referred to as Pusat Vulkanologi dan Mitigasi Bencana Geologi (PVMBG), MAGMA Indonesia, and satellite data.
Activity was relatively low during May and June. Daily white gas-and-steam emissions rose 25-200 m above the crater and drifted in different directions. Five ash plumes were detected at 0519 on 10 May, 1241 on 11 May, 0920 on 12 May, 2320 on 12 May, and at 0710 on 13 May, and rose 1-2.5 km above the crater and drifted SW. A webcam image taken on 12 May showed ejection of incandescent material above the vent. A total of nine ash plumes were detected during 6-11 June: at 1434 and 00220 on 6 and 7 June the ash plumes rose 500 m above the crater and drifted NW, at 1537 on 8 June the ash plume rose 1 km above the crater and drifted SW, at 0746 and at 0846 on 9 June the ash plumes rose 800 m and 3 km above the crater and drifted SW, respectively, at 0423, 1431, and 1750 on 10 June the ash plumes rose 2 km, 1.5 km, and 3.5 km above the crater and drifted NW, respectively, and at 0030 on 11 June an ash plume rose 2 km above the crater and drifted NW. Webcam images taken on 10 and 11 June at 0455 and 0102, respectively, showed incandescent material ejected above the vent. On 19 June an ash plume at 0822 rose 1.5 km above the crater and drifted SE.
Similar low activity of white gas-and-steam emissions and few ash plumes were reported during July and August. Daily white gas-and-steam emissions rose 25-300 m above the crater and drifted in multiple directions. Three ash plumes were reported at 0843, 0851, and 0852 on 20 July that rose 500-2,000 m above the crater and drifted NW.
The MIROVA (Middle InfraRed Observation of Volcanic Activity) graph of MODIS thermal anomaly data showed intermittent low-to-moderate power thermal anomalies during May through August 2023 (figure 140). Although activity was often obscured by weather clouds, a thermal anomaly was visible in an infrared satellite image of the crater on 12 May, accompanied by an eruption plume that drifted SW (figure 141).
Geologic Background. The renowned Krakatau (frequently mis-named as Krakatoa) volcano lies in the Sunda Strait between Java and Sumatra. Collapse of an older edifice, perhaps in 416 or 535 CE, formed a 7-km-wide caldera. Remnants of that volcano are preserved in Verlaten and Lang Islands; subsequently the Rakata, Danan, and Perbuwatan cones were formed, coalescing to create the pre-1883 Krakatau Island. Caldera collapse during the catastrophic 1883 eruption destroyed Danan and Perbuwatan, and left only a remnant of Rakata. This eruption caused more than 36,000 fatalities, most as a result of tsunamis that swept the adjacent coastlines of Sumatra and Java. Pyroclastic surges traveled 40 km across the Sunda Strait and reached the Sumatra coast. After a quiescence of less than a half century, the post-collapse cone of Anak Krakatau (Child of Krakatau) was constructed within the 1883 caldera at a point between the former Danan and Perbuwatan cones. Anak Krakatau has been the site of frequent eruptions since 1927.
Information Contacts: Pusat Vulkanologi dan Mitigasi Bencana Geologi (PVMBG, also known as Indonesian Center for Volcanology and Geological Hazard Mitigation, CVGHM), Jalan Diponegoro 57, Bandung 40122, Indonesia (URL: http://www.vsi.esdm.go.id/); MAGMA Indonesia, Kementerian Energi dan Sumber Daya Mineral (URL: https://magma.esdm.go.id/v1); MIROVA (Middle InfraRed Observation of Volcanic Activity), a collaborative project between the Universities of Turin and Florence (Italy) supported by the Centre for Volcanic Risk of the Italian Civil Protection Department (URL: http://www.mirovaweb.it/); Copernicus Browser, Copernicus Data Space Ecosystem, European Space Agency (URL: https://dataspace.copernicus.eu/browser/).
Villarrica (Chile) — October 2023 Cite this Report
Villarrica
Chile
39.42°S, 71.93°W; summit elev. 2847 m
All times are local (unless otherwise noted)
Strombolian activity, gas-and-ash emissions, and crater incandescence during April-September 2023
Villarrica, in central Chile, consists of a 2-km-wide caldera that formed about 3,500 years ago and is located at the base of the presently active cone at the NW margin of a 6-km-wide caldera. Historical eruptions eruptions date back to 1558 and have been characterized by mild-to-moderate explosive activity with occasional lava effusions. The current eruption period began in December 2014 and has recently consisted of nighttime crater incandescence, ash emissions, and seismicity (BGVN 48:04). This report covers activity during April through September 2023 and describes occasional Strombolian activity, gas-and-ash emissions, and nighttime crater incandescence. Information for this report primarily comes from the Southern Andes Volcano Observatory (Observatorio Volcanológico de Los Andes del Sur, OVDAS), part of Chile's National Service of Geology and Mining (Servicio Nacional de Geología y Minería, SERNAGEOMIN) and satellite data.
Seismicity during April consisted of long period (LP) events and tremor (TRE); a total of 9,413 LP-type events and 759 TR-type events were detected throughout the month. Nighttime crater incandescence persisted and was visible in the degassing column. Sulfur dioxide data was obtained using Differential Absorption Optical Spectroscopy Equipment (DOAS) that showed an average value of 1,450 ± 198 tons per day (t/d) during 1-15 April and 1,129 ± 201 t/d during 16-30 April, with a maximum daily value of 2,784 t/d on 9 April. Gas-and-steam emissions of variable intensities rose above the active crater as high as 1.3 km above the crater on 13 April. Strombolian explosions were not observed and there was a slight decrease in the lava lake level.
There were 14,123 LP-type events and 727 TR-type events detected during May. According to sulfur dioxide measurements taken with DOAS equipment, the active crater emitted an average value of 1,826 ± 482 t/d during 1-15 May and 912 ± 41 t/d during 16-30 May, with a daily maximum value of 5,155 t/d on 13 May. Surveillance cameras showed continuous white gas-and-steam emissions that rose as high as 430 m above the crater on 27 May. Nighttime incandescence illuminated the gas column less than 300 m above the crater rim was and no pyroclastic emissions were reported. A landslide was identified on 13 May on the E flank of the volcano 50 m from the crater rim and extending 300 m away; SERNAGEOMIN noted that this event may have occurred on 12 May. During the morning of 27 and 28 May minor Strombolian explosions characterized by incandescent ejecta were recorded at the crater rim; the last reported Strombolian explosions had occurred at the end of March.
Seismic activity during June consisted of five volcano-tectonic (VT)-type events, 21,606 LP-type events, and 2,085 TR-type events. The average value of sulfur dioxide flux obtained by DOAS equipment was 1,420 ± 217 t/d during 1-15 June and 2,562 ± 804 t/d, with a maximum daily value of 4,810 t/d on 17 June. White gas-and-steam emissions rose less than 480 m above the crater; frequent nighttime crater incandescence was reflected in the degassing plume. On 12 June an emission rose 100 m above the crater and drifted NNW. On 15 June one or several emissions resulted in ashfall to the NE as far as 5.5 km from the crater, based on a Skysat satellite image. Several Strombolian explosions occurred within the crater; activity on 15 June was higher energy and ejected blocks 200-300 m on the NE slope. Surveillance cameras showed white gas-and-steam emissions rising 480 m above the crater on 16 June. On 19 and 24 June low-intensity Strombolian activity was observed, ejecting material as far as 200 m from the center of the crater to the E.
During July, seismicity included 29,319 LP-type events, 3,736 TR-type events, and two VT-type events. DOAS equipment recorded two days of sulfur dioxide emissions of 4,220 t/d and 1,009 t/d on 1 and 13 July, respectively. Constant nighttime incandescence was also recorded and was particularly noticeable when accompanied by eruptive columns on 12 and 16 July. Minor explosive events were detected in the crater. According to Skysat satellite images taken on 12, 13, and 16 July, ashfall deposits were identified 155 m S of the crater. According to POVI, incandescence was visible from two vents on the crater floor around 0336 on 12 July. Gas-and-ash emissions rose as high as 1.2 km above the crater on 13 July and drifted E and NW. A series of gas-and-steam pulses containing some ash deposited material on the upper E flank around 1551 on 13 July. During 16-31 July, average sulfur dioxide emissions of 1,679 ± 406 t/d were recorded, with a maximum daily value of 2,343 t/d on 28 July. Fine ash emissions were also reported on 16, 17, and 23 July.
Seismicity persisted during August, characterized by 27,011 LP-type events, 3,323 TR-type events, and three VT-type events. The average value of sulfur dioxide measurements taken during 1-15 August was 1,642 ± 270 t/d and 2,207 ± 4,549 t/d during 16-31 August, with a maximum daily value of 3,294 t/d on 27 August. Nighttime crater incandescence remained visible in degassing columns. White gas-and-steam emissions rose 480 m above the crater on 6 August. According to a Skysat satellite image from 6 August, ash accumulation was observed proximal to the crater and was mainly distributed toward the E slope. White gas-and-steam emissions rose 320 m above the crater on 26 August. Nighttime incandescence and Strombolian activity that generated ash emissions were reported on 27 August.
Seismicity during September was characterized by five VT-type events, 12,057 LP-type events, and 2,058 TR-type events. Nighttime incandescence persisted. On 2 September an ash emission rose 180 m above the crater and drifted SE at 1643 (figure 125) and a white gas-and-steam plume rose 320 m above the crater. According to the Buenos Aires VAAC, periods of continuous gas-and-ash emissions were visible in webcam images from 1830 on 2 September to 0110 on 3 September. Strombolian activity was observed on 2 September and during the early morning of 3 September, the latter event of which generated an ash emission that rose 60 m above the crater and drifted 100 m from the center of the crater to the NE and SW. Ashfall was reported to the SE and S as far as 750 m from the crater. The lava lake was active during 3-4 September and lava fountaining was visible for the first time since 26 March 2023, according to POVI. Fountains captured in webcam images at 2133 on 3 September and at 0054 on 4 September rose as high as 60 m above the crater rim and ejected material onto the upper W flank. Sulfur dioxide flux of 1,730 t/d and 1,281 t/d was measured on 3 and 4 September, respectively, according to data obtained by DOAS equipment.
Strong Strombolian activity and larger gas-and-ash plumes were reported during 18-20 September. On 18 September activity was also associated with energetic LP-type events and notable sulfur dioxide fluxes (as high as 4,277 t/d). On 19 September Strombolian activity and incandescence were observed. On 20 September at 0914 ash emissions rose 50 m above the crater and drifted SSE, accompanied by Strombolian activity that ejected material less than 100 m SSE, causing fall deposits on that respective flank. SERNAGEOMIN reported that a Planet Scope satellite image taken on 20 September showed the lava lake in the crater, measuring 32 m x 35 m and an area of 0.001 km2. Several ash emissions were recorded at 0841, 0910, 1251, 1306, 1312, 1315, and 1324 on 23 September and rose less than 150 m above the crater. The sulfur dioxide flux value was 698 t/d on 23 September and 1,097 t/d on 24 September. On 24 September the Volcanic Alert Level (VAL) was raised to Orange (the third level on a four-color scale). SENAPRED maintained the Alert Level at Yellow (the middle level on a three-color scale) for the communities of Villarrica, Pucón (16 km N), Curarrehue, and Panguipulli.
During 24-25 September there was an increase in seismic energy (observed at TR-events) and acoustic signals, characterized by 1 VT-type event, 213 LP-type events, and 124 TR-type events. Mainly white gas-and-steam emissions, in addition to occasional fine ash emissions were recorded. During the early morning of 25 September Strombolian explosions were reported and ejected material 250 m in all directions, though dominantly toward the NW. On 25 September the average value of sulfur dioxide flux was 760 t/d. Seismicity during 25-30 September consisted of five VT-type events, 1,937 LP-type events, and 456 TR-type events.
During 25-29 September moderate Strombolian activity was observed and ejected material as far as the crater rim. In addition, ash pulses lasting roughly 50 minutes were observed around 0700 and dispersed ENE. During 26-27 September a TR episode lasted 6.5 hours and was accompanied by discrete acoustic signals. Satellite images from 26 September showed a spatter cone on the crater floor with one vent that measured 10 x 14 m and a smaller vent about 35 m NE of the cone. SERNAGEOMIN reported an abundant number of bomb-sized blocks up to 150 m from the crater, as well as impact marks on the snow, which indicated explosive activity. A low-altitude ash emission was observed drifting NW around 1140 on 28 September, based on webcam images. Between 0620 and 0850 on 29 September an ash emission rose 60 m above the crater and drifted NW. During an overflight taken around 1000 on 29 September scientists observed molten material in the vent, a large accumulation of pyroclasts inside the crater, and energetic degassing, some of which contained a small amount of ash. Block-sized pyroclasts were deposited on the internal walls and near the crater, and a distal ash deposit was also visible. The average sulfur dioxide flux measured on 28 September was 344 t/d. Satellite images taken on 29 September ashfall was deposited roughly 3 km WNW from the crater and nighttime crater incandescence remained visible. The average sulfur dioxide flux value from 29 September was 199 t/d. On 30 September at 0740 a pulsating ash emission rose 1.1 km above the crater and drifted NNW (figure 126). Deposits on the S flank extended as far as 4.5 km from the crater rim, based on satellite images from 30 September.
Infrared MODIS satellite data processed by MIROVA (Middle InfraRed Observation of Volcanic Activity) showed intermittent thermal activity during April through September, with slightly stronger activity detected during late September (figure 127). Small clusters of thermal activity were detected during mid-June, early July, early August, and late September. According to the MODVOLC thermal alert system, a total of four thermal hotspots were detected on 7 July and 3 and 23 September. This activity was also intermittently captured in infrared satellite imagery on clear weather days (figure 128).
Geologic Background. The glacier-covered Villarrica stratovolcano, in the northern Lakes District of central Chile, is ~15 km south of the city of Pucon. A 2-km-wide caldera that formed about 3,500 years ago is located at the base of the presently active, dominantly basaltic to basaltic andesite cone at the NW margin of a 6-km-wide Pleistocene caldera. More than 30 scoria cones and fissure vents are present on the flanks. Plinian eruptions and pyroclastic flows that have extended up to 20 km from the volcano were produced during the Holocene. Lava flows up to 18 km long have issued from summit and flank vents. Eruptions documented since 1558 CE have consisted largely of mild-to-moderate explosive activity with occasional lava effusion. Glaciers cover 40 km2 of the volcano, and lahars have damaged towns on its flanks.
Information Contacts: Servicio Nacional de Geología y Minería (SERNAGEOMIN), Observatorio Volcanológico de Los Andes del Sur (OVDAS), Avda Sta María No. 0104, Santiago, Chile (URL: http://www.sernageomin.cl/); Proyecto Observación Villarrica Internet (POVI) (URL: http://www.povi.cl/); Sistema y Servicio Nacional de Prevención y Repuesta Ante Desastres (SENAPRED), Av. Beauchef 1671, Santiago, Chile (URL: https://web.senapred.cl/); Buenos Aires Volcanic Ash Advisory Center (VAAC), Servicio Meteorológico Nacional-Fuerza Aérea Argentina, 25 de mayo 658, Buenos Aires, Argentina (URL: http://www.smn.gov.ar/vaac/buenosaires/inicio.php); MIROVA (Middle InfraRed Observation of Volcanic Activity), a collaborative project between the Universities of Turin and Florence (Italy) supported by the Centre for Volcanic Risk of the Italian Civil Protection Department (URL: http://www.mirovaweb.it/); Hawai'i Institute of Geophysics and Planetology (HIGP) - MODVOLC Thermal Alerts System, School of Ocean and Earth Science and Technology (SOEST), Univ. of Hawai'i, 2525 Correa Road, Honolulu, HI 96822, USA (URL: http://modis.higp.hawaii.edu/); Copernicus Browser, Copernicus Data Space Ecosystem, European Space Agency (URL: https://dataspace.copernicus.eu/browser/).
Merapi (Indonesia) — October 2023 Cite this Report
Merapi
Indonesia
7.54°S, 110.446°E; summit elev. 2910 m
All times are local (unless otherwise noted)
Frequent incandescent avalanches during April-September 2023
Merapi, located just north of the major city of Yogyakarta in central Java, Indonesia, has had activity within the last 20 years characterized by pyroclastic flows and lahars accompanying growth and collapse of the steep-sided active summit lava dome. The current eruption period began in late December 2020 and has more recently consisted of ash plumes, intermittent incandescent avalanches of material, and pyroclastic flows (BGVN 48:04). This report covers activity during April through September 2023, based on information from Balai Penyelidikan dan Pengembangan Teknologi Kebencanaan Geologi (BPPTKG), the Center for Research and Development of Geological Disaster Technology, a branch of PVMBG which specifically monitors Merapi. Additional information comes from the Pusat Vulkanologi dan Mitigasi Bencana Geologi (PVMBG, also known as Indonesian Center for Volcanology and Geological Hazard Mitigation, CVGHM), MAGMA Indonesia, the Darwin Volcanic Ash Advisory Centre (VAAC), and various satellite data.
Activity during April through September 2023 primarily consisted of incandescent avalanches of material that mainly affected the SW and W flanks and traveled as far as 2.3 km from the summit (table 25) and white gas-and-steam emissions that rose 10-1,000 m above the crater.
Table 25. Monthly summary of avalanches and avalanche distances recorded at Merapi during April through September 2023. The number of reported avalanches does not include instances where possible avalanches were heard but could not be visually confirmed as a result of inclement weather. Data courtesy of BPPTKG (April-September 2023 daily reports).
| Month |
Average number of avalanches per day |
Distance avalanches traveled (m) |
| Apr 2023 |
19 |
1,200-2,000 |
| May 2023 |
22 |
500-2,000 |
| Jun 2023 |
18 |
1,200-2,000 |
| Jul 2023 |
30 |
300-2,000 |
| Aug 2023 |
25 |
400-2,300 |
| Sep 2023 |
23 |
600-2,000 |
BPPTKG reported that during April and May white gas-and-steam emissions rose 10-750 m above the crater, incandescent avalanches descended 500-2,000 m on the SW and W flanks (figure 135). Cloudy weather often prevented clear views of the summit, and sometimes avalanches could not be confirmed. According to a webcam image, a pyroclastic flow was visible on 17 April at 0531. During the week of 28 April and 4 May a pyroclastic flow was reported on the SW flank, traveling up to 2.5 km. According to a drone overflight taken on 17 May the SW lava dome volume was an estimated 2,372,800 cubic meters and the dome in the main crater was an estimated 2,337,300 cubic meters.
During June and July similar activity persisted with white gas-and-steam emissions rising 10-350 m above the crater and frequent incandescent avalanches that traveled 300-2,000 m down the SW, W, and S flanks (figure 136). Based on an analysis of aerial photos taken on 24 June the volume of the SW lava dome was approximately 2.5 million cubic meters. A pyroclastic flow was observed on 5 July that traveled 2.7 km on the SW flank. According to the Darwin VAAC multiple minor ash plumes were identified in satellite images on 19 July that rose to 3.7 km altitude and drifted S and SW. During 22, 25, and 26 July a total of 17 avalanches descended as far as 1.8 km on the S flank.
Frequent white gas-and-steam emissions continued during August and September, rising 10-450 m above the crater. Incandescent avalanches mainly affected the SW and W flanks and traveled 400-2,300 m from the vent (figure 137). An aerial survey conducted on 10 August was analyzed and reported that estimates of the SW dome volume was 2,764,300 cubic meters and the dome in the main crater was 2,369,800 cubic meters.
Frequent and moderate-power thermal activity continued throughout the reporting period, according to a MIROVA (Middle InfraRed Observation of Volcanic Activity) analysis of MODIS satellite data (figure 138). There was an increase in the number of detected anomalies during mid-May. The MODVOLC thermal algorithm recorded a total of 47 thermal hotspots: six during April, nine during May, eight during June, 15 during July, four during August, and five during September. Some of this activity was captured in infrared satellite imagery on clear weather days, sometimes accompanied by incandescent material on the SW flank (figure 139).
Geologic Background. Merapi, one of Indonesia's most active volcanoes, lies in one of the world's most densely populated areas and dominates the landscape immediately north of the major city of Yogyakarta. It is the youngest and southernmost of a volcanic chain extending NNW to Ungaran volcano. Growth of Old Merapi during the Pleistocene ended with major edifice collapse perhaps about 2,000 years ago, leaving a large arcuate scarp cutting the eroded older Batulawang volcano. Subsequent growth of the steep-sided Young Merapi edifice, its upper part unvegetated due to frequent activity, began SW of the earlier collapse scarp. Pyroclastic flows and lahars accompanying growth and collapse of the steep-sided active summit lava dome have devastated cultivated lands on the western-to-southern flanks and caused many fatalities.
Information Contacts: Balai Penyelidikan dan Pengembangan Teknologi Kebencanaan Geologi (BPPTKG), Center for Research and Development of Geological Disaster Technology (URL: http://merapi.bgl.esdm.go.id/, Twitter: @BPPTKG); MAGMA Indonesia, Kementerian Energi dan Sumber Daya Mineral (URL: https://magma.esdm.go.id/v1); Pusat Vulkanologi dan Mitigasi Bencana Geologi (PVMBG, also known as Indonesian Center for Volcanology and Geological Hazard Mitigation, CVGHM), Jalan Diponegoro 57, Bandung 40122, Indonesia (URL: http://www.vsi.esdm.go.id/); Darwin Volcanic Ash Advisory Centre (VAAC), Bureau of Meteorology, Northern Territory Regional Office, PO Box 40050, Casuarina, NT 0811, Australia (URL: http://www.bom.gov.au/info/vaac/); MIROVA (Middle InfraRed Observation of Volcanic Activity), a collaborative project between the Universities of Turin and Florence (Italy) supported by the Centre for Volcanic Risk of the Italian Civil Protection Department (URL: http://www.mirovaweb.it/); Hawai'i Institute of Geophysics and Planetology (HIGP) - MODVOLC Thermal Alerts System, School of Ocean and Earth Science and Technology (SOEST), Univ. of Hawai'i, 2525 Correa Road, Honolulu, HI 96822, USA (URL: http://modis.higp.hawaii.edu/); Copernicus Browser, Copernicus Data Space Ecosystem, European Space Agency (URL: https://dataspace.copernicus.eu/browser/); Øystein Lund Andersen (URL: https://www.oysteinlundandersen.com/, https://twitter.com/oysteinvolcano).
Ebeko
Russia
50.686°N, 156.014°E; summit elev. 1103 m
All times are local (unless otherwise noted)
Moderate explosive activity with ash plumes continued during June-November 2023
Ebeko, located on the N end of Paramushir Island in Russia’s Kuril Islands just S of the Kamchatka Peninsula, consists of three summit craters along a SSW-NNE line at the northern end of a complex of five volcanic cones. Observed eruptions date back to the late 18th century and have been characterized as small-to-moderate explosions from the summit crater, accompanied by intense fumarolic activity. The current eruptive period began in June 2022, consisting of frequent explosions, ash plumes, and thermal activity (BGVN 47:10, 48:06). This report covers similar activity during June-November 2023, based on information from the Kamchatka Volcanic Eruptions Response Team (KVERT) and satellite data.
Moderate explosive activity continued during June-November 2023 (figures 50 and 51). According to visual data from Severo-Kurilsk, explosions sent ash 2-3.5 km above the summit (3-4.5 km altitude) during most days during June through mid-September. Activity after mid-September was slightly weaker, with ash usually reaching less than 2 km above the summit. According to KVERT the volcano in October and November was, with a few exceptions, either quiet or obscured by clouds that prevented satellite observations. KVERT issued Volcano Observatory Notices for Aviation (VONA) on 8 and 12 June, 13 and 22 July, 3 and 21 August, and 31 October warning of potential aviation hazards from ash plumes drifting 3-15 km from the volcano. Based on satellite data, KVERT reported a persistent thermal anomaly whenever weather clouds permitted viewing.
Geologic Background. The flat-topped summit of the central cone of Ebeko volcano, one of the most active in the Kuril Islands, occupies the northern end of Paramushir Island. Three summit craters located along a SSW-NNE line form Ebeko volcano proper, at the northern end of a complex of five volcanic cones. Blocky lava flows extend west from Ebeko and SE from the neighboring Nezametnyi cone. The eastern part of the southern crater contains strong solfataras and a large boiling spring. The central crater is filled by a lake about 20 m deep whose shores are lined with steaming solfataras; the northern crater lies across a narrow, low barrier from the central crater and contains a small, cold crescentic lake. Historical activity, recorded since the late-18th century, has been restricted to small-to-moderate explosive eruptions from the summit craters. Intense fumarolic activity occurs in the summit craters, on the outer flanks of the cone, and in lateral explosion craters.
Information Contacts: Kamchatka Volcanic Eruptions Response Team (KVERT), Far Eastern Branch, Russian Academy of Sciences, 9 Piip Blvd., Petropavlovsk-Kamchatsky, 683006, Russia (URL: http://www.kscnet.ru/ivs/kvert/).
Search Bulletin Archive by Publication Date
Select a month and year from the drop-downs and click "Show Issue" to have that issue displayed in this tab.
The default month and year is the latest issue available.
Bulletin of the Global Volcanism Network - Volume 36, Number 09 (September 2011)
Managing Editor: Richard Wunderman
Additional Reports (Unknown)
Tonga: Photo from space on 13 April 2011 raises questions about drifting pumice rafts
Asosan (Japan)
Small ash-bearing eruptions during May and to lesser extent in June 2011
Erebus (Antarctica)
Lava lake convects and spews spatter and gases in December 2010
Mayon (Philippines)
Brief seismic crisis in May 2011, low activity follows
Nabro (Eritrea)
First historically observed eruption began 13 June 2011
Santa Maria (Guatemala)
Eruption on 26 April 2010; ongoing activity through September 2011
Stromboli (Italy)
Recent activity; plumbing insights; new water vapor flux technique; hydrogeology
Tofua (Tonga)
Elaborative comments on April 2010 observations
Turrialba (Costa Rica)
Frequent degassing and occasional ashfall, March 2010-June 2011
Additional Reports (Unknown) — September 2011 Cite this Report
Additional Reports
Unknown
Unknown, Unknown; summit elev. m
All times are local (unless otherwise noted)
Tonga: Photo from space on 13 April 2011 raises questions about drifting pumice rafts
This report presents a serendipitous observation near Tofua, possibly indicative of volcanism elsewhere (not on Tofua). A photo of Tofua and vicinity from space taken on 13 April 2011 displays significant material on the sea surface - the possible relict of an eruption at some unknown center.
A photo taken from space by Astronaut Paulo Nespoli (figure 1) could suggest an eruption in the Southern Pacific region at an unknown volcano. Nespoli took the photo from the International Space Station on 13 April 2011 (Nespoli, 2011). It shows occasional white clouds over the island's high points, and a thin gray-blue plume indicative of Tofua's volcanic emissions wafting to the SE.
The elongate and sinuous bands of debris seen in the photo are suggestive of floating pumice seen before in the region (eg., see Home Reef, BGVN 31:09; 31:10; 31:12; 32:04; 33:05; 33:12; Metis Shoal, BGVN 20:06). If this is pumice in elongate strands such as seen from Home Reef's 2006 eruption, it could also be derived from deposits of an older eruption. Debris floating in strands are most conspicuous at upper left of figure 1, where they form a curve cut by the photograph's left edge. Faintly linked to that area is a thinner strand of sinuous debris. Other strands of similar width appear elsewhere.
Reference. Nespoli, P., 2011, Tofua Island, Tonga: Flickr (uploaded 18 April 2011) (URL: http://www.flickr.com/photos/magisstra/5618223635/).
Geologic Background. Reports of floating pumice from an unknown source, hydroacoustic signals, or possible eruption plumes seen in satellite imagery.
Information Contacts:
Asosan
Japan
32.8849°N, 131.085°E; summit elev. 1592 m
All times are local (unless otherwise noted)
Small ash-bearing eruptions during May and to lesser extent in June 2011
After small ash-bearing eruptions, the Alert Level on Aso was raised from 1 to 2 (on a scale of 1-5) on 17 May 2011. Aso, the largest volcano in SW Japan, consists of a large, 24-km-diameter caldera located on the Japanese island of Kyushu (figure 27). Under normal conditions the area within the caldera is restricted and, with the raising of the Alert Level, authorities restricted entry within 1 km of Naka-dake cone, containing one of the active craters that comprise the Aso volcanic complex.
Fumarole temperature from hydrogen isotopic ratios. The temperature of fumarole gas is a primary observation used at many volcanoes. Tsunogai and others (2011) describe a method of using hydrogen isotope ratios to determine fumarolic temperature. Because the isotopes can be collected at a distance from the vent and without entering the crater, this method offers several advantages. Aso was one of the volcanoes where this technique was applied because it has a deep crater that makes direct sampling and at-vent measurements impractical. Direct sampling of gases is potentially far more hazardous. Infrared measurements may suffer bias when cooled, outgassed material, such as ash, obstructs the hotter portions of the plume. Such measurements could understate the emission's radiant heat and thus its temperature.
We previously published a topographic map depicting the Aso caldera and the location of Naka-dake within the caldera (BGVN 19:09 ), one of 17 central cones. Of these, Naka-dake is the most active. Naka-dake has a crater lake at its summit that contributes to its tendency towards phreatic and mud eruptions.
Aso resides in a National Park of the same name. Naka-dake is easily accessible by public transport and is a popular tourist destination. The rims of the active crater area contain parking and viewpoints accessible by toll road or the Arcosan Ropeway (steel-cabled aerial tramway). At the rim, massive concrete structures offer some protection from falling ballistics in the case of sudden explosions. Another attraction in the area is the Aso Volcano Museum, which features a webcam and photos of phreatic eruptions at Aso.
Aso has been highly active in recent years, but rarely to an extent where it has become dangerous to people. Aso erupted from 10 June 2003 to 14 Jan 2004 (BGVN 29:01). During that time Aso mainly erupted mud, associated with volcanic tremors, and a small amount of ash. A rise in thermal activity in the area may have been a contributing factor in the eruption (Volcano Research Center, University Tokyo). On 14 April 2005, the volcano erupted again, forcing five tourists to be evacuated after hundreds of small earthquakes were detected in the prior two weeks.
May-June 2011 unrest. The latest series of eruptions began on 6 May 2011 with mud erupting about 5-10 m from the hot caldera lake. On 13 May the temperature of fumarolic emissions in the caldera had increased. The Japan Meteorological Agency noted that "A small volcanic flame [glow?] has been observed at nights at the crater pits in the center of Naka-dake." On 15 May, Naka-dake erupted a small amount of ash, with the plume rising to an altitude of 2.1 km. One approach to measuring areas of elevated temperature involves infrared photographs. Visible and infrared photos of Naka-dake crater documented temperature increases in the crater from 21 April to 15 May (figure 28). The temperature of fumarolic emissions in the crater reached around 370°C (the temperature measurement method was not disclosed).
On 16 May, an eruption sent one plume to an altitude of 1.8-2.1 km and another ash plume to 2.4 km, according to the Tokyo Volcanic Ash Advisory Center. A video depicting the plume that day can be found on Youtube (Asahi.com, 2011). The video shows aerial footage of the plume, which is bent downwind. The emission is constant but not vigorous.
Rocks ejected from Naka-dake on 17 May landed in restricted areas, and ash plumes rose to an altitude of 1.8 km. Ash plumes continued rising to similar altitudes through the end of May, and small scale eruptions continued through 10 June, accompanied by low level seismicity. No additional plumes were reported through mid-October. The website of the Mt. Aso Ropeway noted that entry restrictions ended on 20 June 2011, allowing them to carry passengers.
References. Asahi.com, 2011, Naka Erupting, YouTube (URL: http://www.youtube.com/watch?v=uBKJnM2JIZs), posted 16 May 2011.
Tsunogai, U., Kamimura, K., Anzai, S., Nakagawa, F., and Komatsu, K., 2011, Hydrogen isotopes in volcanic plumes: Tracers for remote temperature sensing of fumaroles, Geochimica et Cosmochimica Acta, v. 75, no. 16, p. 4531-4546.
Geologic Background. The 24-km-wide Asosan caldera was formed during four major explosive eruptions from 300,000 to 90,000 years ago. These produced voluminous pyroclastic flows that covered much of Kyushu. The last of these, the Aso-4 eruption, produced more than 600 km3 of airfall tephra and pyroclastic-flow deposits. A group of 17 central cones was constructed in the middle of the caldera, one of which, Nakadake, is one of Japan's most active volcanoes. It was the location of Japan's first documented historical eruption in 553 CE. The Nakadake complex has remained active throughout the Holocene. Several other cones have been active during the Holocene, including the Kometsuka scoria cone as recently as about 210 CE. Historical eruptions have largely consisted of basaltic to basaltic andesite ash emission with periodic strombolian and phreatomagmatic activity. The summit crater of Nakadake is accessible by toll road and cable car, and is one of Kyushu's most popular tourist destinations.
Information Contacts: Japan Meteorological Agency (JMA), 1-3-4 Otemachi, Chiyoda-ku, Tokyo 100-8122, Japan (URL: http://www.jma.go.jp/); Volcano Research Center, VRC-ERI, Univ. Tokyo (URL: http://www.eri.u-tokyo.ac.jp/VRC/index_E.html); Wordtravels (URL: http://www.wordtravels.com/Travelguide/Countries/Japan/Map).
Erebus (Antarctica) — September 2011 Cite this Report
Erebus
Antarctica
77.53°S, 167.17°E; summit elev. 3794 m
All times are local (unless otherwise noted)
Lava lake convects and spews spatter and gases in December 2010
This report includes first-hand observations of Erebus's crater, which includes the persistent Ray lava lake, a body that remained molten, though considerably crusted over, in December 2010. Several recent studies on Erebus presented maps and gas emissions measured by open-path FTIR spectroscopy in December 2004. Our last report on Erebus covered ongoing lava lake activity through October 2007 (BGVN 33:03). MODVOLC thermal alerts occurred during 2007 and continued at least into late 2011. Mt. Erebus is located on the western half of Ross Island (figure 11).
December 2010 observations. Csatho and others (2008) used laser scanning (LIDAR) acquired from aircraft in 2001 to study the morphology of the Erebus summit area (figure 12). The crater contains the persistent and convecting Ray lava lake. A second lava lake is occasionally active in the Werner vent (Werner lava lake). The authors noted the elevation of the surfaces of the inner crater's two lava lakes, both at ~3,515 m, was about the same as another active vent in the crater. Ray lava lake (~750 m2), which was discovered in 1972, sits in the inner crater's NE sector, and is larger than Werner lava lake (~166 m2).
Kayla Iacovino posted a blog on 15 December 2010 about then-recent conditions on the summit of Erebus (Iacovino, 2011). She noted that the weather for the past few days was unusually clear (figure 13). In addition, she presented a shot of a churning lava lake (by Clive Oppenheimer) which was somewhat obscured by steam over the lake. Iacovino noted that during her 2010 visit, only Ray lava lake was active. It had shrunk in size (some of it had crusted over) since December 2009. She commented that "There were a lot of bursts of activity in the lake, including some bomb-throwing eruptions (although no bombs made it out of the crater) and a couple of very active fumaroles on the lava lake's perimeter. The plume was essentially constant."
Oppenheimer provided two other views during the same December 2010 field season. One shows the crater, and the other, the active lava lake, large portions of which were covered by crust (figures 14 and 15).
2004 gas measurements. A study of the gas emissions conducted in December 2004 (Oppenheimer and Kyle, 2008) concluded with the statements below.
"We measured the emissions of seven gas species from Werner and Ray lava lakes at Erebus volcano by open-path FTIR spectroscopy. The results are among the few available for a highly alkalic magmatic system. Compared to typical subduction zone related volcanoes, Erebus gas is CO2-rich (consistent with abundant CO2 in olivine hosted melt inclusions sampled from Erebus basanite), and the CO2/CO ratio is lower (and perfectly consistent with the oxygen fugacity of Erebus phonolite estimated from the composition of component minerals). Combination of the measured gas proportions with the estimated SO2 flux carried by the plume provides estimates of the fluxes of all the other species. This yields the first measurements of the fluxes of H2O (~860 Mg per day) and carbonyl sulfide (~0.5 Mg per day). By mass, CO2 is the major component of the plume, and the estimated CO2 flux is ~1,300 Mg per day....
"The H2O/CO2 ratio and HF content of the individual plumes emitted by the two lava lakes are distinct, and point to a more 'evolved' gas released from Werner lake. This could indicate that the Werner lake is fed by a shallow offshoot of the conduit that supplies the Ray lake, or that magma feeding Werner lake is more comprehensively degassed due to a higher degree of crystallization....
References. Oppenheimer, C., Kyle, P.R., 2008, Probing the magma plumbing of Erebus volcano, Antarctica, by open-path FTIR spectroscopy of gas emissions, Journal of Volcanology and Geothermal Research, v. 177, p. 743-754.
Csatho, B., Schenk, T., Kyle, P., Wilson, T. and Krabill, W. B., 2008, Airborne laser swath mapping of the summit of Erebus volcano, Antarctica: Applications to geological mapping of a volcano, Journal of Volcanology and Geothermal Research, v. 177, no. 3, 531-548.
Iacovino, K., 2010, A view from the top: great weather on Erebus, Science Friday, posted 15 December 2010; accessed 24 October 2011.(URL: http://www.sciencefriday.com/blog/2010/12/a-view-from-the-top-great-weather-on-erebus/
Geologic Background. Mount Erebus, the world's southernmost historically active volcano, overlooks the McMurdo research station on Ross Island. It is the largest of three major volcanoes forming the crudely triangular Ross Island. The summit of the dominantly phonolitic volcano has been modified by one or two generations of caldera formation. A summit plateau at about 3,200 m elevation marks the rim of the youngest caldera, which formed during the late-Pleistocene and within which the modern cone was constructed. An elliptical 500 x 600 m wide, 110-m-deep crater truncates the summit and contains an active lava lake within a 250-m-wide, 100-m-deep inner crater; other lava lakes are sometimes present. The glacier-covered volcano was erupting when first sighted by Captain James Ross in 1841. Continuous lava-lake activity with minor explosions, punctuated by occasional larger Strombolian explosions that eject bombs onto the crater rim, has been documented since 1972, but has probably been occurring for much of the volcano's recent history.
Information Contacts: Kayla Iacovino and Clive Oppenheimer, Cambridge University, Department of Geography, Downing Place, Cambridge, CB2 3EN, UK; Laura K. Jones, Department of Earth and Environmental Science, New Mexico Tech, Socorro, NM 87801, USA; Hawai'i Institute of Geophysics and Planetology (HIGP) MODVOLC Thermal Alerts System, School of Ocean and Earth Science and Technology (SOEST), Univ of Hawai'i, 2525 Correa Road, Honolulu, HI 96822, USA (URL: http://modis.higp.hawaii.edu/).
Mayon (Philippines) — September 2011 Cite this Report
Mayon
Philippines
13.257°N, 123.685°E; summit elev. 2462 m
All times are local (unless otherwise noted)
Brief seismic crisis in May 2011, low activity follows
Mayon volcano (figure 19) underwent an eruptive crisis in late 2009 into early 2010 and a seismic crisis in May 2011. This report provides some final remarks on the late 2009 to early 2010 eruptive crisis, and summarizes activity through 23 September 2011. Our previous report summarized the heightened activity in December 2009, which culminated in the evacuation of 47,000 people from their homes (BGVN 34:12). The eruption waned following the evacuation, and, accordingly, the Philippine Institute of Volcanology and Seismology (PHIVOLCS) lowered the Alert Level from a high of 4 to 3 (on a scale from 0 to 5) on 2 January 2010. At that point, ~2,000 evacuees were still unable to return to their homes. On 13 January, the Alert Level was lowered from 3 to 2, and, according to Sophia Dedace (GMANews), enabled the remaining evacuees to return to their homes. Dedace reported that Governor Joey Salceda estimated the damage to agriculture and infrastructure from Mayon's 2009-2010 eruption at 26.2 million Philippine pesos (~$600,000 USD).
On 2 March 2010, amid continually declining activity at Mayon, PHIVOLCS lowered the Alert Level from 2 to 1. As of 23 September 2011, the Alert Level remained unchanged, indicating, as stated by PHIVOLCS, "low level unrest" and that "no eruption [is] imminent." At Alert Level 1 (and all higher levels), access is prohibited within the 6-km-radius Permanent Danger Zone.
With the exception of May 2011, seismicity (figure 20) typically consisted of no more than a few volcanic earthquakes and rockfall events per day (i.e. less than 50 of either type per month) and relatively low SO2 flux (averaged per month on figure 20). Mayon typically vented ash-free steam at weak-to-moderate intensities, and crater glow persisted, observable by residents at night.
During May 2011 there was a significant increase in seismicity, reaching a daily maximum of 38 volcanic earthquakes on 25 May. This increase coincided with a slight increase in the SO2 flux (averaged per month, figure 20). The increase in both seismicity and SO2 flux was short-lived, and activity declined to relatively low levels by June 2011.
Geologic Background. Symmetrical Mayon, which rises above the Albay Gulf NW of Legazpi City, is the most active volcano of the Philippines. The steep upper slopes are capped by a small summit crater. Recorded eruptions since 1616 CE range from Strombolian to basaltic Plinian, with cyclical activity beginning with basaltic eruptions, followed by longer periods of andesitic lava flows. Eruptions occur predominately from the central conduit and have also produced lava flows that travel far down the flanks. Pyroclastic density currents and mudflows have commonly swept down many of the approximately 40 ravines that radiate from the summit and have often damaged populated lowland areas. A violent eruption in 1814 killed more than 1,200 people and devastated several towns.
Information Contacts: Philippine Institute of Volcanology and Seismology (PHIVOLCS), Department of Science and Technology, University of the Philippines Campus, Diliman, Quezon City, Philippines (URL: http://www.phivolcs.dost.gov.ph/); GMANews.TV, 6/F GMA Network Center, EDSA corner Timog Avenue, Diliman, Quezon City, 1101, PHILIPPINES (URL: http://www.gmanews.tv/index.html); United Nations Institute for Training and Research's (UNITAR's) Operational Satellite Applications Programme (UNOSAT), Palais des Nations, CH-1211 Geneva 10, Switzerland (URL: http://www.unitar.org/unosat/); Ginkgo Maps (URL: http://www.ginkgomaps.com/).
Nabro (Eritrea) — September 2011 Cite this Report
Nabro
Eritrea
13.37°N, 41.7°E; summit elev. 2218 m
All times are local (unless otherwise noted)
First historically observed eruption began 13 June 2011
The first documented historical eruption at Nabro began on 13 June 2011. Nabro lies in a belt of active volcanoes that follows the Red Sea and lies in the Afar Triangle in Southern Eritrea near the border with Ethiopia (figure 1). An earthquake swarm began on 12 June 2011. The swarm included an M 5.1 earthquake in the vicinity of Nabro and early the next day, satellite remote sensing revealed a large ash plume. Tensions remain in the war-ravaged border region of Eritrea and Ethopia; despite an official cease fire, access to the region remains limited. Nabro's eruption delivered large and concentrated SO2 plumes, dropped ash over extensive areas, forced thousands of evacuations, and, according to the Eritrean government, led to fatalities.
Nabro lies in the midst of a chain of volcanoes (figure 2; dashed lines indicate trends of volcanic ranges). Each of the three main volcanoes on figure 2 contains a prominent summit crater or caldera (figures 3 and 4).
Seismic precursors. According to an article in the Ethiopian Journal issued on 13 June 2011, a series of moderate earthquakes struck the Eritrea-Ethiopia border region on the evening of 12 June 2011. The U.S. Geological Survey (USGS) reported a total of 14 light-to-moderate earthquakes in the border area, the two strongest being M 5.7, both centered in Eritrea. The series began at 1837 hours when an M 5.1 earthquake struck ~128 km WNW of Assab, a port city in the southern Red Sea region of Eritrea. It occurred at ~10 km depth and was followed by seven smaller ones, between M 4.5 and M 4.8, during the next 2.5 hours. Those were then followed by earthquakes of M 4.7, 4.8, and 5.0. Soon after, at 2332 hours, the first M 5.7 earthquake struck about 123 km WNW of Assab at a depth of 10 km. It was quickly followed by the second M 5.7 earthquake and other smaller earthquakes.
Eruption. The Toulouse Volcanic Ash Advisory Center (VAAC) reported that an eruption from Nabro (originally attributed to Dubbi, ~25 km NNE of Nabro) started between 0300 and 0500 on 13 June 2011. The eruption plume initially rose to altitudes of 9.1-13.7 km; it was detected at altitudes of 6.1-10.7 km during 13-14 June.
According to the Eritrean Ministry of Information, ashfall covered hundreds of square kilometers, and the government evacuated area residents. Eye witnesses first observed the eruption at about 2100 on 13 June. Satellite images that same day showed the plume drifting more than 1,000 km NW, over parts of Sudan. On 14 June 2011 news articles reported that a detached ash cloud was detected over southern Israel. Throughout the eruption, satellite images were nearly the only source of new information about activity.
The Addis Fortune website reported that, although the major eruption took place in Nabro, large quantities of dust from the earthquake occurred in the town of Afambo (~26.5 km N of Nabro). It also reported that the Eritrean government announced that inhabitants had moved to safe areas. The well-known Afdera salt accumulation site in the depression was covered in volcanic ash. The salt, extracted for human and other consumption, had thus become inedible. The ash clouds also caused the cancellation of some domestic and international flights in Eritrea and Ethiopia.
During the week of 15-21 June 2011, Nabro continued to produce plumes. Based on analyses of satellite imagery during that period, the Toulouse VAAC reported that plumes comprised mostly of water and SO2 rose to altitudes of 6.1-7.9 km (figure 5). Ash was occasionally detected near the volcano. Satellite imagery posted on the MODIS/MODVOLC website showed a dark brown ash plume fanning out to the SW on 19 June. By 19 June, the altitude of Nabro's ash plume dropped from a maximum of 14 km to 7.6 km. The ash halted flights in eastern Africa for a time. The eruption killed seven people, according to the Eritrean government, although later reports appeared to discount that. Other reports indicated that thousands were affected in both Eritrea and Ethiopia, though news was sparse.
A thermal satellite image acquired at night on 19 June revealed a 15-km-long lava flow that had traveled NW (figure 6). A high-altitude plume, likely rich in water vapor, rose from erupting vents; a diffuse ash-rich plume drifted SW. The more restricted plume on 19 June enabled images to reveal a NW-trending lava flow that extended ~15 km from the summit area, although the area of venting remained obscured by a water-rich plume.
On 22 June a report from the Eritrea Ministry of Energy and Mines stated that the ash and lava covered hundreds of square meters. A satellite image acquired that day showed a gas-and-ash plume rising from the caldera and drifting W. An image from 24 June showed the erupting vent, plumes and emissions, and lava flows (figure 7).
During 22-26 June large amounts of SO2 in the region continued to be detected by satellite images. Based on analyses of satellite imagery, the Toulouse VAAC reported that during 26-27 June plumes reached altitudes of up to 6.1 km.
An annotated satellite image acquired on 29 June (figure 8) showed a clear view of the eruption. NASA Earth Observatory analysts labeled what they inferred to be the vent, an area in the main caldera's center and likely engulfing both the two inner craters with either very hot lava or with fresh tephra that probably formed cones or other features whose surface cooled quickly. An ash plume rose from the vent and drifted S. Based on analyses of satellite imagery, the Toulouse VAAC reported that on 16 July an ash plume from Nabro rose to altitudes below 5.5 km. A weak eruption detected on 17 July decreased through the day then appeared to stop.
According to an article by the South Africa Weather and Disaster Information Service (SAWDIS) dated 30 June 2011, a press release from the Eritrean Government disclosed that, though the advancing lava in the nearby village of Sireru had slowed down, a large area of land covered by vegetation was destroyed and river beds were covered within 24 hours.
NASA's Earth Observatory noted that images from 28 September showed heat from the vent in the central crater and from an area 1.3 km S of the vent that indicated an active lava flow. A small and diffuse plume rose from the vent. A region of seemingly thicker black ash (that completely covered the sparse vegetation) was noted S of the crater and thinner layers of ash (with some areas of visible vegetation) flanked either side of the region.
MODVOLC Thermal Alerts. Prior to 12 June 2011 the MODVOLC website indicated that no thermal alerts were measured over at least the past 5 years. The onset of thermal alerts was a 3-pixel area detected at 0115 on 13 June 2011 (2215 on 12 June UTC), followed by nearly daily measurements through 1 September 2011. Since that date, several alerts per week have been measured for Nabro up to 5 November 2011.
Some individual satellite passes measured high numbers of alerts. A 9-pixel alert occurred on 8 September, and as many as 95 pixels were measured for a single satellite pass at 2245 on 17 June. Other single orbital passes during June-August measured alerts of 50 to more than 70 pixels.
Reference. Wiart, P., and Oppenheimer, C., 2005, Large magnitude silicic volcanism in north Afar: the Nabro Volcanic Range and Ma'alalta volcano, Bulletin of Volcanology, v. 67, no. 2, pp. 99-115.
Geologic Background. The Nabro stratovolcano is the highest volcano in the Danakil depression of northern Ethiopia and Eritrea, at the SE end of the Danakil Alps. Nabro, along with Mallahle, Asavyo, and Sork Ale volcanoes, collectively comprise the Bidu volcanic complex SW of Dubbi volcano. This complex stratovolcano constructed primarily of trachytic lava flows and pyroclastics, is truncated by nested calderas 8 and 5 km in diameter. The larger caldera is widely breached to the SW. Rhyolitic obsidian domes and basaltic lava flows were erupted inside the caldera and on its flanks. Some very recent lava flows were erupted from NNW-trending fissures transverse to the trend of the volcanic range.
Information Contacts: NASA Earth Observatory (URL: http://earthobservatory.nasa.gov); MODIS/MODVOLC, Hawai'i Institute of Geophysics and Planetology (HIGP) MODVOLC Thermal Alerts System, School of Ocean and Earth Science and Technology (SOEST), Univ. of Hawai'i, 2525 Correa Road, Honolulu, HI (URL: http://modis.higp.hawaii.edu/); Toulouse Volcanic Ash Advisory Centre (VAAC) (URL: http://www.meteo.fr/vaac/); NASA Global Sulfur Dioxide Monitoring (URL: http://so2.gsfc.nasa.gov/index.php); Jet Propulsion Laboratory (URL: http://photojournal.jpl.nasa.gov); S.A. Weather and Disaster Information Service. (SAWDIS) (URL: http://saweatherobserver.blogspot.com); Ethiopian Journal (URL: http://www.ethjournal.com); Addis Fortune (URL: http://www.addisfortune.com); Simon Carn, Dept of Geological and Mining Engineering and Sciences, Michigan Technological University, 1400 Townsend Dr., Houghton, MI 49931, USA (URL: https://so2.gsfc.nasa.gov/).
Santa Maria (Guatemala) — September 2011 Cite this Report
Santa Maria
Guatemala
14.757°N, 91.552°W; summit elev. 3745 m
All times are local (unless otherwise noted)
Eruption on 26 April 2010; ongoing activity through September 2011
The following report provides information from May 2010 through mid-October 2011 on Santa Maria volcano and its active dome complex, Santiaguito. The last report (BGVN 35:03) covered activity form 2008 to April 2010. The sources for this report are Guatemala's Instituto Nacional de Sismologia, Vulcanologia, Meteorologia e Hidrologia (INSIVUMEH) and Washington Volcanic Ash Advisory Center (VAAC). Santa Maria's eruptive history from the Global Volcanism Program database identifies the current eruption as beginning 22 June 1922 and continuing to mid-October 2011. The database's criteria for an eruption ending requires at least a 3-month pause in volcanic emissions (Siebert and others, 2010).
A recent report concerned the eruption of 26 April 2010, an event mentioned at the end of our last report (BGVN 35:03). A table summarizes some significant activity during the current reporting period. It is notable that during about nine months of 2011 (up to early October), MODVOLC measured thermal alerts several times each month (in each instance covering an area of 1 to 3 pixels). In comparison, during 2009, seven thermal alerts were measured and, during 2010, three alerts were measured.
More details on the 26 April 2010 eruption. Chigna (2010) noted the 26 April 2010 eruption of Santiaguito was associated with four large seismic events (M 3.9 at 0624, M 4.92 at 0648, M 5.89 at 0723, and M 5.72 at 0758). The seismic network recently established at the volcano permitted first-time recognition of some seismic signals known as tornillos ['screws' in Spanish; defined by Morrissey and Mastin (2000) as monochromatic, long period seismic events lasting a few minutes, with long codas of progressively decreasing amplitude that may be eruption precursors] (figure 34a). Pyroclastic flows were generated within the gullies on the S flank. An ash column rose to an altitude of 15 km, drifting to the W, NW, N, NE, and E, causing closure of village schools SW of Santiaguito and in the Quetzaltenango area. The ashfall was reported out to 7.3 km from the volcano; civil aeronautics alerted air traffic to avoid the plume within a radius of 80 km.
Activity from May 2010 to early-October 2011. Tables 3 and 4, summarizing activity from May 2010 through early-October 2011, document nearly continuous explosions, plumes, and pyroclastic flows. Various mass wasting processes were common, particularly block avalanches and lahars, often set into motion by precipitation.
Table 3. Summary of available information on explosions, plumes, and other volcanic emissions of Santa Maria volcano reported during May-December 2010. "--" is 'not reported' in original VAAC reports. Courtesy of INSIVUMEH, Washington VAAC, and MODVOLC.
| Date |
Explosions noted |
Plume color and composition |
Plume Height |
Drift Direction |
Other Activity |
| 07 May 2010 |
17 weak to moderate |
Gray |
2.9-3.4 km |
SW |
-- |
| 10 May 2010 |
-- |
White |
75 m |
-- |
-- |
| 19 May 2010 |
Yes |
Ash |
2.9-3.4 km |
SW |
Hot lahars carried blocks |
| 20 May 2010 |
Yes |
-- |
3.3 km |
E |
Pyroclastic flow to SW |
| 04 Jun 2010 |
-- |
-- |
-- |
-- |
Lahar carried blocks |
| 19-20 Jul 2010 |
24 in 48-hour period |
Ash |
300-900 m |
SE, W |
-- |
| 05-06 Aug 2010 |
-- |
Steam |
-- |
SW |
Lahars carried trees, blocks |
| 01 Sep 2010 |
-- |
Ash |
100 m |
SE |
Pyroclastic flow to SW |
| 02 Sep 2010 |
Yes |
Ash |
500-1,000 m |
W, SW |
Block avalanches on W flank |
| 06 Sep 2010 |
Yes |
Ash |
500-1,000 m |
W, SW |
-- |
| 11 Sep 2010 |
Yes |
Ash |
1 km |
E, SE |
Pyroclastic flows (2) to 3 km SW |
| 13 Sep 2010 |
-- |
White |
100 m |
S |
-- |
| 22 Oct 2010 |
Yes |
Ash |
300 m |
SW |
Block avalanches on S and SW flanks |
| 26 Oct 2010 |
-- |
Steam |
150 m |
-- |
-- |
| 29 Oct 2010 |
Yes |
Ash |
900 m |
SW |
Pyroclastic flow down SW flank to 5 km S |
| 31 Oct 2010 |
-- |
Ash |
-- |
W |
-- |
| 17, 22 Nov |
Yes |
Ash |
0.7-1 km |
E, SE |
-- |
| 19 Nov 2010 |
-- |
-- |
-- |
-- |
Ashfall to the S |
| 08 Dec 2010 |
Yes |
Ash |
700 m |
SE |
Block avalanches; ashfall to SE |
| 10 Dec 2010 |
-- |
Ash |
-- |
21 km W |
-- |
| 13-14 Dec 2010 |
Yes |
Ash |
300-700 m |
SE |
Block avalanches; pyroclastic flows |
| 29-30 Dec 2010 |
Yes |
Ash |
300-600 m |
S, SE |
Ashfall |
Table 4. Summary of available information on explosions, plumes, and other volcanic emissions of Santa Maria volcano reported during January through early-October 2011. "--" is 'not reported' in original VAAC reports. Courtesy of INSIVUMEH, Washington VAAC, and MODVOLC.
| Date |
Explosions noted |
Plume color and composition |
Plume Height |
Drift Direction |
Other Activity |
| 01 Jan 2011 |
-- |
-- |
-- |
W |
Satellite thermal anomalies |
| 03-04 Jan 2011 |
Yes |
Ash |
700 m |
SW |
Avalanches to W flank |
| 05-06 Jan 2011 |
Yes |
Ash |
400-500 m |
SW |
-- |
| 08 Jan 2011 |
-- |
Ash? |
-- |
30 km SSW |
-- |
| 10-11 Jan 2011 |
Yes |
Ash |
600 m |
SW, W |
Avalanches on S and E flanks |
| 20-21 Jan 2011 |
-- |
Ash |
4.3-5.2 km |
SW |
Avalanches; rockfalls |
| 23-24 Jan 2011 |
-- |
Ash |
300 m |
N |
-- |
| 02-03 Feb 2011 |
Yes |
Ash |
300 m |
-- |
References. Chigna, G., 2010, Eruption of Santiaguito (1402-03) 26 April 2010. INSIVUMEH (URL: http://www.insivumeh.gob.gt/).
Morrissey, M., and Mastin, L., 2000, Vulcanian eruptions, p. 463-475, in Sigurdsson, H. (ed), Encyclopedia of Volcanoes, Academic Press, San Diego.
Siebert, L., Simkin, T., and Kimberly, P., 2010, Volcanoes of the World, 3rd ed., Berkeley: University of California Press, 568 p.
Geologic Background. Symmetrical, forest-covered Santa María volcano is part of a chain of large stratovolcanoes that rise above the Pacific coastal plain of Guatemala. The sharp-topped, conical profile is cut on the SW flank by a 1.5-km-wide crater. The oval-shaped crater extends from just below the summit to the lower flank, and was formed during a catastrophic eruption in 1902. The renowned Plinian eruption of 1902 that devastated much of SW Guatemala followed a long repose period after construction of the large basaltic andesite stratovolcano. The massive dacitic Santiaguito lava-dome complex has been growing at the base of the 1902 crater since 1922. Compound dome growth at Santiaguito has occurred episodically from four vents, with activity progressing E towards the most recent, Caliente. Dome growth has been accompanied by almost continuous minor explosions, with periodic lava extrusion, larger explosions, pyroclastic flows, and lahars.
Information Contacts: Instituto Nacional de Sismologia, Vulcanologia, Meteorologia e Hydrologia (INSIVUMEH), Unit of Volcanology, Geologic Department of Investigation and Services, 7a Av. 14-57, Zona 13, Guatemala City, Guatemala (URL: http://www.insivumeh.gob.gt/inicio.html); Washington Volcanic Ash Advisory Center (VAAC), Satellite Analysis Branch (SAB), NOAA/NESDIS E/SP23, NOAA Science Center Room 401, 5200 Auth Rd, Camp Springs, MD 20748, USA (URL: http://www.ospo.noaa.gov/Products/atmosphere/vaac/); MODVOLC-HIGP, Hawai'i Institute of Geophysics and Planetology (HIGP) MODVOLC Thermal Alerts System, School of Ocean and Earth Science and Technology (SOEST), Univ. of Hawai'i, 2525 Correa Road, Honolulu, HI 96822, USA (URL: http://modis.higp.hawaii.edu/).
Stromboli (Italy) — September 2011 Cite this Report
Stromboli
Italy
38.789°N, 15.213°E; summit elev. 924 m
All times are local (unless otherwise noted)
Recent activity; plumbing insights; new water vapor flux technique; hydrogeology
Activity at Stromboli (figure 76), since February 2010 (BGVN 35:03) through 11 October 2011 was generally of medium to low intensity, with minor fluctuations typical for Stromboli. Istituto Nazionale di Geofisica e Vulcanologia (INGV) reported occasional episodes of increased activity; note that the dates provided below are illustrative and by no means all-inclusive. This generally occurred as either more intense explosions or increased spattering (figure 77). More intense explosions often generated coarse pyroclastics and/or expelled erupted products farther than during typical activity, sometimes to the summit platform (Pizzo sopra la Fossa) overlooking the active craters, and beyond. For example, some specific pronounced events took place on 19 December 2010, 5 August, and 5 September 2011.
On 30 June 2010, incandescent material thrown from the vent caused small fires on the upper flanks of the volcano. Increased spattering activity often resulted in intra- and, less frequently, extra-crater lava flows (figure 78a and b, respectively) such as those seen during 18-23 October 2010, 1-2 August, and 7 September 2011. The extra-crater lava flows of 1-2 August from the northernmost vent were the first observed since December 2010; they extended only a few hundred meters downslope (figure 78a). Extra-crater lava flows were often accompanied by land- or rock-slides down Sciara del Fuoco, fed by material that broke free from lava flow fronts and rolled down slope (e.g. 1 August 2011).
Some of the parameters reported by INGV during February 2010 to October 2011 included seismic, deformation, visual observation, and gas flux. The flux of CO2 and SO2, and particularly the CO2/SO2 ratio measured in the plumes, provided insight into the provenance of the generally discreet gas discharges ("gas slugs") that regularly burst upon reaching Stromboli's vent. INGV reported that a coupled increase in the CO2/SO2 ratio and decrease of SO2 flux (seen, for example, during the weeks of 5-12 and 19-26 September 2011) indicated an increased contribution of volatiles from deeper portions of the magmatic system.
Recent insight into magma generation. A study of erupted ash textures and compositions by D'Oriano and others (2011) yielded results comparable with the implications of the CO2/SO2 ratio reported by INGV. The authors use the commonly accepted terms for two separate populations of magma at Stromboli; these terms are presented and used herein.
"LP magmas" are those with low porphyricity (similar sized phenocrysts) that are considered to have relatively deeper origins and simple cooling histories. "HP magmas" are those with high porphyricity (multiple size populations of phenocrysts) that are considered to reside in a shallow reservoir in the crust and have more complex, multiple stage cooling histories.
D'Oriano and others (2011) found that there is a coupled, possibly persistent ascent of deep-derived CO2 and small amounts of LP magma. They concluded that the coupled ascent of LP magma and CO2 is transient and does not disturb the HP magma that resides in the shallow reservoir. See figure 79 for a schematic of the plumbing and magma storage zones of Stromboli.
New technique for measuring plume water vapor concentration. LIDAR (Light Detection and Ranging) has been used for the first time to measure water vapor flux of a volcanic plume. Fiorani and others (2011) used a CO2 laser-based LIDAR system called ATLAS (Agile Tuned Lidar for Atmospheric Sensing) at Stromboli to measure both wind speed and water vapor concentration of the erupted plume. When combined, the measurements yielded water vapor flux of the plume. Their measurements agreed with measurements obtained from traditional methods, and were the first such measurements at an active volcano.
Hydrogeology of Stromboli. A detailed geophysical survey of Stromboli revealed some hydrogeological features of the volcano (figure 80). Revil and others (2011) conducted a survey measuring electrical resistivity, soil CO2 concentrations, soil temperature, and self-potential along two profiles (a and b, figures 80 and 81). Their survey focused on the Pizzo crater (near the active vents), and the Rina Grande sector collapse on the E side of the island. They published a detailed schematic interpretation of fluid-flow pathways along the two profiles (figure 81).
The authors identified an unconfined aquifer above the villages of Scari and San Vincenzo. They stated that the Rina Grande sector collapse is the "most important structural control for magmatic and hydrothermal fluids" in the upper part of the Stromboli edifice, and that it hosts the two main diffuse degassing areas of the edifice. They further concluded that the hydrothermal system reaches shallow levels in the lower part of the Rina Grande collapse (profile b, figures 80 and 81). This fact, they wrote, "raises questions about the mechanical stability of this [E] flank of the edifice".
References. Aiuppa, A., Bertagnini, A., Métrich, N., Moretti, R., Di Muro, A., Liuzzo, M., Tamburello, G., 2010, A model of degassing for Stromboli volcano, Earth and Planetary Science Letters, v. 295, no. 1-2, p. 195-204 (DOI: 10.1016/j.epsl.2010.03.040).
D'Oriano, C., Bertagnini, A., and Pompilio, M., 2011, Ash erupted during normal activity at Stromboli (Aeolian Islands, Italy) raises questions on how the feeding system works, Bulletin of Volcanology, v. 73, no. 5, p. 471-477 (DOI:10.1007/s00445-010-0425-0).
Fiorani, L., Colao, F., Palucci, A., Poreh, D., Aiuppa, A., and Giudice, G., 2011, First-time lidar measurement of water vapor flux in a volcanic plume, Optics Communications, v. 284, no. 5, p. 1295-1298 (DOI:10.1016/j.optcom.2010.10.082).
Revil, A., Finizola, A., Ricci, T., Delcher, E., Peltier, A., Barde-Cabusson, S., Avard, G., Bailly, T., Bennati, L., Byrdina, S., Colonge, J., Di Gangi, F., Douillet, G., Lupi, M., Letort, J., and Tsang Hin Sun, E., 2011, Hydrogeology of Stromboli volcano, Aeolian Islands (Italy) from the interpretation of resistivity tomograms, self-potential, soil temperature and soil CO2 concentration measurements, Geophysical Journal International, v. 186, no. 3, p. 1078-1094 (DOI:10.1111/j.1365-246X.2011.05112.x).
Geologic Background. Spectacular incandescent nighttime explosions at Stromboli have long attracted visitors to the "Lighthouse of the Mediterranean" in the NE Aeolian Islands. This volcano has lent its name to the frequent mild explosive activity that has characterized its eruptions throughout much of historical time. The small island is the emergent summit of a volcano that grew in two main eruptive cycles, the last of which formed the western portion of the island. The Neostromboli eruptive period took place between about 13,000 and 5,000 years ago. The active summit vents are located at the head of the Sciara del Fuoco, a prominent scarp that formed about 5,000 years ago due to a series of slope failures which extends to below sea level. The modern volcano has been constructed within this scarp, which funnels pyroclastic ejecta and lava flows to the NW. Essentially continuous mild Strombolian explosions, sometimes accompanied by lava flows, have been recorded for more than a millennium.
Information Contacts: Boris Behncke and Mauro Coltelli, Istituto Nazionale di Geofisica e Vulcanologia (INGV), Sezione di Catania, 95125 Catania (URL: http://www.ct.ingv.it/); Ginkgo Maps (URL: http://www.ginkgomaps.com/); Italian Air Force (URL: http://www.aeronautica.difesa.it/); Tom Pfeiffer, Volcano Discovery (URL: http://www.volcanodiscovery.com/); Gijs de Reijke, Arnhem High School, Nijmegen, Netherlands.
Tofua
Tonga
19.75°S, 175.07°W; summit elev. 515 m
All times are local (unless otherwise noted)
Elaborative comments on April 2010 observations
This report on Tofua elaborates on observations in our previous report (BGVN 36:07).
Several maps show Tofua (figure 7) with respect to other geographic features, and also areas of responsibility of Volcanic Ash Advisory Centers in the region. A map of islands in the main part of the Archipelago appeared in BGVN 34:02.
Mark Belvedere (Kalia Foundation) sent additional comments regarding his visit to Tofua on 24 April 2010 (see BGVN 36:07). Belvedere noted that at night as they approached the island the glow from the active crater flickered and was visible ~50 km from the volcano. The glow was absent during the day but a plume was conspicuous. In describing his approach to the crater he stated that "As I was walking up towards [it] the area was littered with lava stone from the sizes of golf balls to beach balls." The observation of those ejecta made him nervous. To him, the crater "looked like an air-breathing red hot lava tube ready to shoot out lava stones at any moment but NO I didn't stay to physically see it shooting out the lava nor the lava stones."
Upon reaching the summit the visitors were surprised at how unstable the rim looked. Belvedere had to have his companions hold his feet in order to lean out over the crater to get the photo shown in our previous report (BGVN 36:07). He guessed the distance to the sloping crater floor was on the order of 50 m. The low-level eruptions accompanied larger ash plumes. The plumes were quite reflective at night. A sulfurous odor prevailed.
Stuart Kershaw's attempts to create a video with narration on the scene proved difficult because the eruptions were broken with pauses of about 8-15 minutes, and each pulse behaved differently in terms of how much sound they generated.
Geologic Background. The low, forested Tofua Island in the central part of the Tonga Islands group is the emergent summit of a large stratovolcano that was seen in eruption by Captain Cook in 1774. The summit contains a 5-km-wide caldera whose walls drop steeply about 500 m. Three post-caldera cones were constructed at the northern end of a cold fresh-water caldera lake, whose surface lies only 30 m above sea level. The easternmost cone has three craters and produced young basaltic andesite lava flows, some of which traveled into the caldera lake. The largest and northernmost of the cones, Lofia, has a steep-sided crater that is 70 m wide and 120 m deep and has been the source of historical eruptions, first reported in the 18th century. The fumarolically active crater of Lofia has a flat floor formed by a ponded lava flow.
Information Contacts: Mark Belvedere, Kalia Foundation USA, 4515 SW Natchez Ct., Tualatin, OR 97062, USA (www.kaliafoundation.org); Treasure Island Eueiki Eco Resort, Vava'u, Kingdom of Tonga (www.tongaislandresort.com); Stuart Kershaw, In the Dark Productions (URL: http://inthedarkproductions.co.uk/); Sakopo Lolohea, Tongan Visitor Bureau, Ministry of Tourism. Vuna Rd., Nuku'alofa, Tonga (URL: http://www.tonga.holiday.com/).
Turrialba (Costa Rica) — September 2011 Cite this Report
Turrialba
Costa Rica
10.025°N, 83.767°W; summit elev. 3340 m
All times are local (unless otherwise noted)
Frequent degassing and occasional ashfall, March 2010-June 2011
During 5-6 January 2010, Turrialba discharged a phreatic eruption that resulted in a new vent and ashfall up to 30 km from the crater (BGVN 35:02). This report discusses activity from February 2010 through October 2011. Portions of this report were initially synthesized and edited by Shereena Dyer, as part of a graduate student writing assignment in a volcanology class at Oregon State University under the guidance of professor Shan de Silva.
Since the January eruption, Turrialba (figure 23) has continued to eject gas and ash intermittently, maintained elevated fumarolic output and temperatures, and produced strong SO2-bearing plumes from the vent. This activity continued over much of the reporting interval. The Observatorio Vulcanológico y Sismológico de Costa Rica-Universidad Nacional (OVSICORI-UNA) annual report highlighted the 5-6 January eruption as the key event during 2010. According to OVSICORI-UNA, field observations on 6 January found that two small vents had opened and joined together on the SE inner wall of the SW crater. Current monitoring includes a web camera 600 m from the active crater that takes an image every 10 seconds.
After the 5-6 January eruptions, emission levels dropped. In late February 2010, scientists found a pool of molten sulfur at the base of the S crater wall with a temperature of 153°C.
OVSICORI-UNA reported that scientists visited Turrialba on 7 March 2010. A gas plume, common with this volcano, was observed that night rising 1.5 km above the crater and drifting NW. Noises from the crater were described as sounding like a jet engine and rumblings. The January 2010 vent emitted gas in March with surface temperatures between 300 and 320°C. Small blocks 3-12 cm in diameter and of different colors dominated the surface around the vent. Lithics ejected 30-50 m away from the vent measured 170°C. Incandescence seen at night originated from the vent that ejected reddish-colored tephra. Two SO2 measurements taken on or around 13 March from a ground-based spectrometer yielded 1,100 and 750 t/d, the former taken closer to the volcano.
According to OVSICORI-UNA, most of the gas emitted in April originated from the January 2010 vent; in April it produced plumes that rose 2 km above the crater rim. Gas also rose from other areas, including fissures SW of the W crater and from multiple vents and fissures in the main crater. Gas plumes mainly drifted NW, W, and SW, coinciding with areas where vegetation had suffered the greatest damage from the gases.
In April 2010, OVSICORI-UNA reported that multiple years of rain data had been collected at the station La Silvia on the W flank and was frequently found to be acidic (pH often well below 5). During 2007 though mid-2010, the rain had pH 2.8-5.7 and elevated specific conductivity (figure 24). Note that the lowest pH values on the plot were collected during 2009 and 2010.
In May scientists noted that on the NW, W, SW sides there were new effects of acid-rain-damaged leaves and vegetation up to 4 km from the main crater. During August, observers noted farms 18 km SW of Turrialba with burns on onions, chemical damage attributed to volcanic gases.
A farm 3 km NW of the summit appears in comparative photos from 2007 and 2011 (figure 25). The houses in the photos were abandoned for a few months after the seismic swarms in the middle of 2007. The residents returned during February-March 2008, only to permanently leave in the middle of 2008 due to harsh atmospheric conditions. This farm remained abandoned in November 2011. Many others were also abandoned in areas of intense impact.
Based on web camera views, the Washington Volcanic Ash Advisory Center (VAAC) reported that on 24 July 2010 a plume of steam, gas, and ash drifted W. Over the next three hours, the plume became more diffuse and steam-rich. Another ash emission was observed on 15 August 2010; the plume drifted about 600 m E of the active crater. Satellite imagery showed an approximately 10-km-wide ash plume drifting 15 km W.
The volcano was relatively quiet during November and December. In January 2011, vegetation damage from acid rain could be observed on the SW, W, and NW flanks. Residents in the village of Silvia, 2.3 km SW of the crater, reported a strong stench of SO2 during the month. On 14 January, nearby residents reported minor ashfall and rumbling noises, and again, strong sulfurous odors. OVSICORI closed the Turrialba Volcano National Park temporarily, evacuated a few people as a precaution, and installed a surveillance base in the town of La Central (~4 km SW of the crater). OVSICORI-UNA noted that a blue-and-white gas plume rose from Turrialba the next day.
During a visit to the volcano in January 2011, OVSICORI-UNA found that a 2- to 5-cm-thick layer of freshly ejected material, with clasts ranging in size from a few millimeters to 5 cm, blanketed the W edge of the crater. Officials discovered two small landslides on the walls of the crater. The walls were considered unsafe due to the loose material. The cavity in the crater that formed in January 2010 had been widened as a result of falling material and the W part of the cavity was offset by about 4 m. A new cavity in the vent appeared to have formed from one of the explosions. Heavy rainfall created a large gully, incising the W edge of the crater at a depth of 0.4-1.5 m. Despite the intense rainfall, the crater was covered in sulfur-bearing deposits. An "eerie sound," which at times could be heard kilometers from the summit, was associated with the emission of gas. A gray plume had a temperature at the vent ranging from 480-498°C.
OVSICORI-UNA reported that on 9 June 2011 scientists conducting fieldwork at Turrialba observed a new lake in the SW crater. Since February, rock landslides along with abundant mud and clay had accumulated in the bottom of the crater, blocking the vent. Meteoric water from rains starting in May had formed a light-green-colored lake that was 70 m in diameter and ~1 m deep. Minor bubbling in the SW and NE shores was noted, and steam and sulfur dioxide gas emissions rose from many fumarolic vents around the crater.
OVSICORI-UNA reported on 12 October 2011 that degassing at Turrialba had affected the vegetation, soil, infrastructure, and economy (figure 25). Acidification of the soil had impaired, possibly permanently, vegetation growth; the economic effect on farms and livestock has yet to be determined. A school building near the volcano was still used by students and teachers, despite having been deemed unsafe. The extent of the effect of acidification on livestock and the economy had not yet been determined.
Reference. OVSICORI-UNA, 2010, Real-time webcamera of Turrialba volcano, Costa Rica (URL: http://www.ovsicori.una.ac.cr/vulcanologia/videoturri.html)
Geologic Background. Turrialba, the easternmost of Costa Rica's Holocene volcanoes, is a large vegetated basaltic-to-dacitic stratovolcano located across a broad saddle NE of Irazú volcano overlooking the city of Cartago. The massive edifice covers an area of 500 km2. Three well-defined craters occur at the upper SW end of a broad 800 x 2200 m summit depression that is breached to the NE. Most activity originated from the summit vent complex, but two pyroclastic cones are located on the SW flank. Five major explosive eruptions have occurred during the past 3500 years. A series of explosive eruptions during the 19th century were sometimes accompanied by pyroclastic flows. Fumarolic activity continues at the central and SW summit craters.
Information Contacts: Observatorio Vulcanológico y Sismológico de Costa Rica-Universidad Nacional (OVSICORI-UNA), Apartado 86-3000, Heredia, Costa Rica (URL: http://www.ovsicori.una.ac.cr/); Washington Volcanic Ash Advisory Center (VAAC), Satellite Analysis Branch (SAB), NOAA/NESDIS E/SP23, NOAA Science Center Room 401, 5200 Auth Rd, Camp Springs, MD 20746, USA (URL: http://www.ospo.noaa.gov/Products/atmosphere/vaac/).