Recently Published Bulletin Reports
Erebus (Antarctica) Lava lake remains active; most thermal alerts recorded since 2019
Rincon de la Vieja (Costa Rica) Frequent phreatic explosions during July-December 2023
Bezymianny (Russia) Explosion on 18 October 2023 sends ash plume 8 km high; lava flows and incandescent avalanches
Kilauea (United States) Low-level lava effusions in the lava lake at Halema’uma’u during July-December 2022
Nyamulagira (DR Congo) Lava flows and thermal activity during May-October 2023
Bagana (Papua New Guinea) Explosions, ash plumes, ashfall, and lava flows during April-September 2023
Mayon (Philippines) Lava flows, pyroclastic flows, ash emissions, and seismicity during April-September 2023
Nishinoshima (Japan) Eruption plumes and gas-and-steam plumes during May-August 2023
Krakatau (Indonesia) White gas-and-steam plumes and occasional ash plumes during May-August 2023
Villarrica (Chile) Strombolian activity, gas-and-ash emissions, and crater incandescence during April-September 2023
Merapi (Indonesia) Frequent incandescent avalanches during April-September 2023
Ebeko (Russia) Moderate explosive activity with ash plumes continued during June-November 2023
Erebus (Antarctica) — January 2024  Cite this Report
Erebus
Antarctica
77.53°S, 167.17°E; summit elev. 3794 m
All times are local (unless otherwise noted)
Lava lake remains active; most thermal alerts recorded since 2019
The lava lake in the summit crater of Erebus has been active since at least 1972. Located in Antarctica overlooking the McMurdo Station on Ross Island, it is the southernmost active volcano on the planet. Because of the remote location, activity is primarily monitored by satellites. This report covers activity during 2023.
The number of thermal alerts recorded by the Hawai'i Institute of Geophysics and Planetology’s MODVOLC Thermal Alerts System increased considerably in 2023 compared to the years 2020-2022 (table 9). In contrast to previous years, the MODIS instruments aboard the Aqua and Terra satellites captured data from Erebus every month during 2023. Consistent with previous years, the lowest number of anomalous pixels were recorded in January, November, and December.
Table 9. Number of monthly MODIS-MODVOLC thermal alert pixels recorded at Erebus during 2017-2023. See BGVN 42:06 for data from 2000 through 2016. The table was compiled using data provided by the HIGP – MODVOLC Thermal Alerts System.
| Year |
Jan |
Feb |
Mar |
Apr |
May |
Jun |
Jul |
Aug |
Sep |
Oct |
Nov |
Dec |
SUM |
| 2017 |
0 |
21 |
9 |
0 |
0 |
1 |
11 |
61 |
76 |
52 |
0 |
3 |
234 |
| 2018 |
0 |
21 |
58 |
182 |
55 |
17 |
137 |
172 |
103 |
29 |
0 |
0 |
774 |
| 2019 |
2 |
21 |
162 |
151 |
55 |
56 |
75 |
53 |
29 |
19 |
1 |
0 |
624 |
| 2020 |
0 |
2 |
16 |
18 |
4 |
4 |
1 |
3 |
18 |
3 |
1 |
6 |
76 |
| 2021 |
0 |
9 |
1 |
0 |
2 |
56 |
46 |
47 |
35 |
52 |
5 |
3 |
256 |
| 2022 |
1 |
13 |
55 |
22 |
15 |
32 |
39 |
19 |
31 |
11 |
0 |
0 |
238 |
| 2023 |
2 |
33 |
49 |
82 |
41 |
32 |
70 |
64 |
42 |
17 |
5 |
11 |
448 |
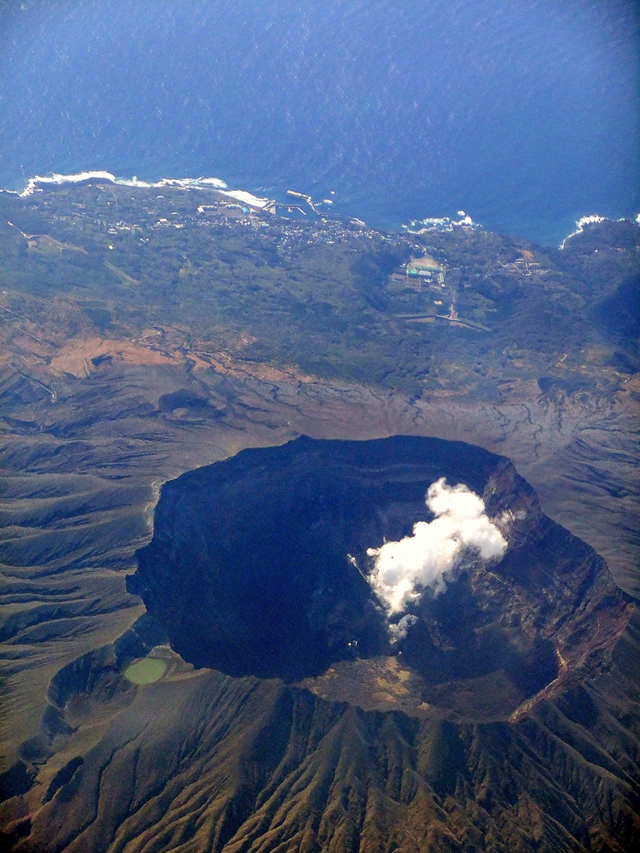
Sentinel-2 infrared images showed one or two prominent heat sources within the summit crater, accompanied by adjacent smaller sources, similar to recent years (see BGVN 46:01, 47:02, and 48:01). A unique image was obtained on 25 November 2023 by the OLI-2 (Operational Land Imager-2) on Landsat 9, showing the upper part of the volcano surrounded by clouds (figure 32).
Geologic Background. Mount Erebus, the world's southernmost historically active volcano, overlooks the McMurdo research station on Ross Island. It is the largest of three major volcanoes forming the crudely triangular Ross Island. The summit of the dominantly phonolitic volcano has been modified by one or two generations of caldera formation. A summit plateau at about 3,200 m elevation marks the rim of the youngest caldera, which formed during the late-Pleistocene and within which the modern cone was constructed. An elliptical 500 x 600 m wide, 110-m-deep crater truncates the summit and contains an active lava lake within a 250-m-wide, 100-m-deep inner crater; other lava lakes are sometimes present. The glacier-covered volcano was erupting when first sighted by Captain James Ross in 1841. Continuous lava-lake activity with minor explosions, punctuated by occasional larger Strombolian explosions that eject bombs onto the crater rim, has been documented since 1972, but has probably been occurring for much of the volcano's recent history.
Information Contacts: Hawai'i Institute of Geophysics and Planetology (HIGP) - MODVOLC Thermal Alerts System, School of Ocean and Earth Science and Technology (SOEST), Univ. of Hawai'i, 2525 Correa Road, Honolulu, HI 96822, USA (URL: http://modis.higp.hawaii.edu/); Copernicus Browser, Copernicus Data Space Ecosystem, European Space Agency (URL: https://dataspace.copernicus.eu/browser/); NASA Earth Observatory, EOS Project Science Office, NASA Goddard Space Flight Center, Goddard, Maryland, USA (URL: https://earthobservatory.nasa.gov/images/152134/erebus-breaks-through).
Rincon de la Vieja (Costa Rica) — January 2024 Cite this Report
Rincon de la Vieja
Costa Rica
10.83°N, 85.324°W; summit elev. 1916 m
All times are local (unless otherwise noted)
Frequent phreatic explosions during July-December 2023
Rincón de la Vieja is a volcanic complex in Costa Rica with a hot convecting acid lake that exhibits frequent weak phreatic explosions, gas-and-steam emissions, and occasional elevated sulfur dioxide levels (BGVN 45:10, 46:03, 46:11). The current eruption period began June 2021. This report covers activity during July-December 2023 and is based on weekly bulletins and occasional daily reports from the Observatorio Vulcanologico Sismologica de Costa Rica-Universidad Nacional (OVSICORI-UNA).
Numerous weak phreatic explosions continued during July-December 2023, along with gas-and-steam emissions and plumes that rose as high as 3 km above the crater rim. Many weekly OVSICORI-UNA bulletins included the previous week's number of explosions and emissions (table 9). For many explosions, the time of explosion was given (table 10). Frequent seismic activity (long-period earthquakes, volcano-tectonic earthquakes, and tremor) accompanied the phreatic activity.
Table 9. Number of reported weekly phreatic explosions and gas-and-steam emissions at Rincón de la Vieja, July-December 2023. Counts are reported for the week before the Weekly Bulletin date; not all reports included these data. Courtesy of OVSICORI-UNA.
| OVSICORI Weekly Bulletin |
Number of explosions |
Number of emissions |
| 28 Jul 2023 |
6 |
14 |
| 4 Aug 2023 |
10 |
12 |
| 1 Sep 2023 |
13 |
11 |
| 22 Sep 2023 |
12 |
13 |
| 29 Sep 2023 |
6 |
11 |
| 6 Oct 2023 |
12 |
5 |
| 13 Oct 2023 |
7 |
9 |
| 20 Oct 2023 |
1 |
15 |
| 27 Oct 2023 |
3 |
23 |
| 3 Nov 2023 |
3 |
10 |
| 17 Nov 2023 |
0 |
Some |
| 24 Nov 2023 |
0 |
14 |
| 8 Dec 2023 |
4 |
16 |
| 22 Dec 2023 |
8 |
18 |
Table 10. Summary of activity at Rincón de la Vieja during July-December 2023. Weak phreatic explosions and gas emissions are noted where the time of explosion was indicated in the weekly or daily bulletins. Height of plumes or emissions are distance above the crater rim. Courtesy of OVSICORI-UNA.
| Date |
Time |
Description of Activity |
| 1 Jul 2023 |
0156 |
Explosion. |
| 2 Jul 2023 |
0305 |
Explosion. |
| 4 Jul 2023 |
0229, 0635 |
Event at 0635 produced a gas-and-steam plume that rose 700 m and drifted W; seen by residents in Liberia (21 km SW). |
| 9 Jul 2023 |
1843 |
Explosion. |
| 21 Jul 2023 |
0705 |
Explosion. |
| 26 Jul 2023 |
1807 |
Explosion. |
| 28 Jul 2023 |
0802 |
Explosion generated a gas-and-steam plume that rose 500 m. |
| 30 Jul 2023 |
1250 |
Explosion. |
| 31 Jul 2023 |
2136 |
Explosion. |
| 11 Aug 2023 |
0828 |
Explosion. |
| 18 Aug 2023 |
1304 |
Explosion. |
| 21 Aug 2023 |
1224 |
Explosion generated gas-and-steam plumes rose 500-600 m. |
| 22 Aug 2023 |
0749 |
Explosion generated gas-and-steam plumes rose 500-600 m. |
| 24 Aug 2023 |
1900 |
Explosion. |
| 25 Aug 2023 |
0828 |
Event produced a steam-and-gas plume that rose 3 km and drifted NW. |
| 27-28 Aug 2023 |
0813 |
Four small events; the event at 0813 on 28 August lasted two minutes and generated a steam-and-gas plume that rose 2.5 km. |
| 1 Sep 2023 |
1526 |
Explosion generated plume that rose 2 km and ejected material onto the flanks. |
| 2-3 Sep 2023 |
- |
Small explosions detected in infrasound data. |
| 4 Sep 2023 |
1251 |
Gas-and-steam plume rose 1 km and drifted W. |
| 7 Nov 2023 |
1113 |
Explosion. |
| 8 Nov 2023 |
0722 |
Explosion. |
| 12 Nov 2023 |
0136 |
Small gas emissions. |
| 14 Nov 2023 |
0415 |
Small gas emissions. |
According to OVSICORI-UNA, during July-October the average weekly sulfur dioxide (SO2) flux ranged from 68 to 240 tonnes/day. However, in mid-November the flux increased to as high as 334 tonnes/day, the highest value measured in recent years. The high SO2 flux in mid-November was also detected by the TROPOMI instrument on the Sentinel-5P satellite (figure 43).
Geologic Background. Rincón de la Vieja, the largest volcano in NW Costa Rica, is a remote volcanic complex in the Guanacaste Range. The volcano consists of an elongated, arcuate NW-SE-trending ridge constructed within the 15-km-wide early Pleistocene Guachipelín caldera, whose rim is exposed on the south side. Sometimes known as the "Colossus of Guanacaste," it has an estimated volume of 130 km3 and contains at least nine major eruptive centers. Activity has migrated to the SE, where the youngest-looking craters are located. The twin cone of Santa María volcano, the highest peak of the complex, is located at the eastern end of a smaller, 5-km-wide caldera and has a 500-m-wide crater. A Plinian eruption producing the 0.25 km3 Río Blanca tephra about 3,500 years ago was the last major magmatic eruption. All subsequent eruptions, including numerous historical eruptions possibly dating back to the 16th century, have been from the prominent active crater containing a 500-m-wide acid lake located ENE of Von Seebach crater.
Information Contacts: Observatorio Vulcanológico Sismológica de Costa Rica-Universidad Nacional (OVSICORI-UNA), Apartado 86-3000, Heredia, Costa Rica (URL: http://www.ovsicori.una.ac.cr/); NASA Global Sulfur Dioxide Monitoring Page, Atmospheric Chemistry and Dynamics Laboratory, NASA Goddard Space Flight Center (NASA/GSFC), 8800 Greenbelt Road, Goddard MD 20771, USA (URL: https://so2.gsfc.nasa.gov/).
Bezymianny (Russia) — November 2023 Cite this Report
Bezymianny
Russia
55.972°N, 160.595°E; summit elev. 2882 m
All times are local (unless otherwise noted)
Explosion on 18 October 2023 sends ash plume 8 km high; lava flows and incandescent avalanches
Bezymianny, located on Russia’s Kamchatka Peninsula, has had eruptions since 1955 characterized by dome growth, explosions, pyroclastic flows, ash plumes, and ashfall. Activity during November 2022-April 2023 included gas-and-steam emissions, lava dome collapses generating avalanches, and persistent thermal activity. Similar eruptive activity continued from May through October 2023, described here based on information from weekly and daily reports of the Kamchatka Volcano Eruptions Response Team (KVERT), notices from Tokyo VAAC (Volcanic Ash Advisory Center), and from satellite data.
Overall activity decreased after the strong period of activity in late March through April 2023, which included ash explosions during 29 March and 7-8 April 2023 that sent plumes as high as 10-12 km altitude, along with dome growth and lava flows (BGVN 48:05). This reduced activity can be seen in the MIROVA thermal detection system graph (figure 56), which was consistent with data from the MODVOLC thermal detection system and with Sentinel-2 satellite images that showed persistent hotspots in the summit crater when conditions allowed observations. A renewed period of strong activity began in mid-October 2023.
Activity increased significantly on 17 October 2023 when large collapses began during 0700-0830 on the E flanks of the lava dome and continued to after 0930 the next day (figure 57). Ash plumes rose to an altitude of 4.5-5 km, extending 220 km NNE by 18 October. A large explosion at 1630 on 18 October produced an ash plume that rose to an altitude of 11 km (8 km above the summit) and drifted NNE and then NW, extending 900 km NW within two days at an altitude of 8 km. Minor ashfall was noted in Kozyrevsk (45 km WNW). At 0820 on 20 October an ash plume was identified in satellite images drifting 100 km ENE at altitudes of 4-4.5 km.
Lava flows and hot avalanches from the dome down the SE flank continued over the next few days, including 23 October when clear conditions allowed good observations (figures 58 and 59). A large thermal anomaly was observed over the volcano through 24 October, and in the summit crater on 30 October (figure 60). Strong fumarolic activity continued, with numerous avalanches and occasional incandescence. By the last week of October, volcanic activity had decreased to a level consistent with that earlier in the reporting period.
Aviation warnings were frequently updated during 17-20 October. KVERT issued a Volcano Observatory Notice for Aviation (VONA) on 17 October at 1419 and 1727 (0219 and 0527 UTC) raising the Aviation Color Code (ACC) from Yellow to Orange (second highest level). The next day, KVERT issued a VONA at 1705 (0505 UTC) raising the ACC to Red (highest level) but lowered it back to Orange at 2117 (0917 UTC). After another decrease to Yellow and back to Orange, the ACC was reduced to Yellow on 20 October at 1204 (0004 UTC). In addition, the Tokyo VAAC issued a series of Volcanic Ash Advisories beginning on 16 October and continuing through 30 October.
Geologic Background. The modern Bezymianny, much smaller than its massive neighbors Kamen and Kliuchevskoi on the Kamchatka Peninsula, was formed about 4,700 years ago over a late-Pleistocene lava-dome complex and an edifice built about 11,000-7,000 years ago. Three periods of intensified activity have occurred during the past 3,000 years. The latest period, which was preceded by a 1,000-year quiescence, began with the dramatic 1955-56 eruption. This eruption, similar to that of St. Helens in 1980, produced a large open crater that was formed by collapse of the summit and an associated lateral blast. Subsequent episodic but ongoing lava-dome growth, accompanied by intermittent explosive activity and pyroclastic flows, has largely filled the 1956 crater.
Information Contacts: Kamchatka Volcanic Eruptions Response Team (KVERT), Far Eastern Branch, Russian Academy of Sciences, 9 Piip Blvd., Petropavlovsk-Kamchatsky, 683006, Russia (URL: http://www.kscnet.ru/ivs/kvert/); Kamchatka Volcanological Station, Kamchatka Branch of Geophysical Survey, (KB GS RAS), Klyuchi, Kamchatka Krai, Russia (URL: http://volkstat.ru/); Tokyo Volcanic Ash Advisory Center (VAAC), 1-3-4 Otemachi, Chiyoda-ku, Tokyo 100-8122, Japan (URL: http://ds.data.jma.go.jp/svd/vaac/data/); Hawai'i Institute of Geophysics and Planetology (HIGP) - MODVOLC Thermal Alerts System, School of Ocean and Earth Science and Technology (SOEST), Univ. of Hawai'i, 2525 Correa Road, Honolulu, HI 96822, USA (URL: http://modis.higp.hawaii.edu/); MIROVA (Middle InfraRed Observation of Volcanic Activity), a collaborative project between the Universities of Turin and Florence (Italy) supported by the Centre for Volcanic Risk of the Italian Civil Protection Department (URL: http://www.mirovaweb.it/); Copernicus Browser, Copernicus Data Space Ecosystem, European Space Agency (URL: https://dataspace.copernicus.eu/browser/).chr
Kilauea (United States) — January 2023 Cite this Report
Kilauea
United States
19.421°N, 155.287°W; summit elev. 1222 m
All times are local (unless otherwise noted)
Low-level lava effusions in the lava lake at Halema’uma’u during July-December 2022
Kīlauea is the southeastern-most volcano in Hawaii and overlaps the E flank of the Mauna Loa volcano. Its East Rift Zone (ERZ) has been intermittently active for at least 2,000 years. An extended eruption period began in January 1983 and was characterized by open lava lakes and lava flows from the summit caldera and the East Rift Zone. During May 2018 magma migrated into the Lower East Rift Zone (LERZ) and opened 24 fissures along a 6-km-long NE-trending fracture zone that produced lava flows traveling in multiple directions. As lava emerged from the fissures, the lava lake at Halema'uma'u drained and explosions sent ash plumes to several kilometers altitude (BGVN 43:10).
The current eruption period started during September 2021 and has recently been characterized by lava effusions, spatter, and sulfur dioxide emissions in the active Halema’uma’u lava lake (BGVN 47:08). Lava effusions, some spatter, and sulfur dioxide emissions have continued during this reporting period of July through December 2022 using daily reports, volcanic activity notices, and abundant photo, map, and video data from the US Geological Survey's (USGS) Hawaiian Volcano Observatory (HVO).
Summary of activity during July-December 2022. Low-level effusions have continued at the western vent of the Halema’uma’u crater during July through early December 2022. Occasional weak ooze-outs (also called lava break outs) would occur along the margins of the crater floor. The overall level of the active lava lake throughout the reporting period gradually increased due to infilling, however it stagnated in mid-September (table 13). During September through November, activity began to decline, though lava effusions persisted at the western vent. By 9 December, the active part of the lava lake had completely crusted over, and incandescence was no longer visible.
Table 13. Summary of measurements taken during overflights at Kīlauea that show a gradual increase in the active lava lake level and the volume of lava effused since 29 September 2021. Lower activity was reported during September-October. Data collected during July-December 2022. Courtesy of HVO.
| Date: |
Level of the active lava lake (m): |
Cumulative volume of lava effused (million cubic meters): |
| 7 Jul 2022 |
130 |
95 |
| 19 Jul 2022 |
133 |
98 |
| 4 Aug 2022 |
136 |
102 |
| 16 Aug 2022 |
137 |
104 |
| 12 Sep 2022 |
143 |
111 |
| 5 Oct 2022 |
143 |
111 |
| 28 Oct 2022 |
143 |
111 |
Activity during July 2022. Lava effusions were reported from the western vent in the Halema’uma’u crater, along with occasional weak ooze-outs along the margins of the crater floor. The height of the lava lake was variable due to deflation-inflation tilt events; for example, the lake level dropped approximately 3-4 m during a summit deflation-inflation event reported on 1 July. Webcam images taken during the night of 6-12 July showed intermittent low-level spattering at the western vent that rose less than 10 m above the vent (figure 519). Measurements made during an overflight on 7 July indicated that the crater floor was infilled about 130 m and that 95 million cubic meters of lava had been effused since 29 September 2021. A single, relatively small lava ooze-out was active to the S of the lava lake. Around midnight on 8 July there were two brief periods of lava overflow onto the lake margins. On 9 July lava ooze-outs were reported near the SE and NE edges of the crater floor and during 10-11 July they occurred near the E, NE, and NW edges. On 16 July crater incandescence was reported, though the ooze-outs and spattering were not visible. On 18 July overnight webcam images showed incandescence in the western vent complex and two ooze-outs were reported around 0000 and 0200 on 19 July. By 0900 there were active ooze-outs along the SW edge of the crater floor. Measurements made from an overflight on 19 July indicated that the crater floor was infilled about 133 m and 98 million cubic meters of lava had erupted since 29 September 2021 (figure 520). On 20 July around 1600 active ooze-outs were visible along the N edge of the crater, which continued through the next day. Extensive ooze-outs occurred along the W margin during 24 July until 1900; on 26 July minor ooze-outs were noted along the N margin. Minor spattering was visible on 29 July along the E margin of the lake. The sulfur dioxide emission rates ranged 650-2,800 tons per day (t/d), the higher of which was measured on 8 July (figure 519).
Activity during August 2022. The eruption continued in the Halema’uma’u crater at the western vent. According to HVO the lava in the active lake remained at the level of the bounding levees. Occasional minor ooze-outs were observed along the margins of the crater floor. Strong nighttime crater incandescence was visible after midnight on 6 August over the western vent cone. During 6-7 August scattered small lava lobes were active along the crater floor and incandescence persisted above the western vent through 9 August. During 7-9 August HVO reported a single lava effusion source was active along the NW margin of the crater floor. Measurements from an overflight on 4 August indicated that the crater floor was infilled about 136 m total and that 102 million cubic meters of lava had been erupted since the start of the eruption. Lava breakouts were reported along the N, NE, E, S, and W margins of the crater during 10-16 August. Another overflight survey conducted on 16 August indicated that the crater floor infilled about 137 m and 104 million cubic meters of lava had been erupted since September 2021. Measured sulfur dioxide emissions rates ranged 1,150-2,450 t/d, the higher of which occurred on 8 August.
Activity during September 2022. During September, lava effusion continued from the western vent into the active lava lake and onto the crater floor. Intermittent minor ooze-outs were reported through the month. A small ooze-out was visible on the W crater floor margin at 0220 on 2 September, which showed decreasing surface activity throughout the day, but remained active through 3 September. On 3 September around 1900 a lava outbreak occurred along the NW margin of the crater floor but had stopped by the evening of 4 September. Field crews monitoring the summit lava lake on 9 September observed spattering on the NE margin of the lake that rose no higher than 10 m, before falling back onto the lava lake crust (figure 521). Overflight measurements on 12 September indicated that the crater floor was infilled a total of 143 m and 111 million cubic meters of lava had been erupted since September 2021. Extensive breakouts in the W and N part of the crater floor were reported at 1600 on 20 September and continued into 26 September. The active part of the lava lake dropped by 10 m while other parts of the crater floor dropped by several meters. Summit tiltmeters recorded a summit seismic swarm of more than 80 earthquakes during 1500-1800 on 21 September, which occurred about 1.5 km below Halema’uma’u; a majority of these were less than Mw 2. By 22 September the active part of the lava lake was infilled about 2 m. On 23 September the western vent areas exhibited several small spatter cones with incandescent openings, along with weak, sporadic spattering (figure 522). The sulfur dioxide emission rate ranged from 930 t/d to 2,000 t/d, the higher of which was measured on 6 September.
Activity during October 2022. Activity during October declined slightly compared to previous months, though lava effusions persisted from the western vent into the active lava lake and onto the crater floor during October (figure 523). Slight variations in the lava lake were noted throughout the month. HVO reported that around 0600 on 3 October the level of the lava lake has lowered slightly. Overflight measurements taken on 5 October indicated that the crater floor was infilled a total of about 143 m and that 111 million cubic meters of lava had been effused since September 2021. During 6-7 October the lake gradually rose 0.5 m. Sulfur dioxide measurements made on 22 October had an emission rate of 700 t/d. Another overflight taken on 28 October showed that there was little to no change in the elevation of the crater floor: the crater floor was infilled a total of 143 m and 111 million cubic meters of lava had erupted since the start of the eruption.
Activity during November 2022. Activity remained low during November, though HVO reported that lava from the western vent continued to effuse into the active lava lake and onto the crater floor throughout the month. The rate of sulfur dioxide emissions during November ranged from 300-600 t/d, the higher amount of which occurred on 9 November.
Activity during December 2022. Similar low activity was reported during December, with lava effusing from the western vent into the active lava lake and onto the crater floor. During 4-5 December the active part of the lava lake was slightly variable in elevation and fluctuated within 1 m. On 9 December HVO reported that lava was no longer erupting from the western vent in the Halema’uma’u crater and that sulfur dioxide emissions had returned to near pre-eruption background levels; during 10-11 December, the lava lake had completely crusted over, and no incandescence was visible (figure 524). Time lapse camera images covering the 4-10 December showed that the crater floor showed weak deflation and no inflation. Some passive events of crustal overturning were reported during 14-15 December, which brought fresh incandescent lava to the lake surface. The sulfur dioxide emission rate was approximately 200 t/d on 14 December. A smaller overturn event on 17 December and another that occurred around 0000 and into the morning of 20 December were also detected. A small seismic swarm was later detected on 30 December.
Geologic Background. Kilauea overlaps the E flank of the massive Mauna Loa shield volcano in the island of Hawaii. Eruptions are prominent in Polynesian legends; written documentation since 1820 records frequent summit and flank lava flow eruptions interspersed with periods of long-term lava lake activity at Halemaumau crater in the summit caldera until 1924. The 3 x 5 km caldera was formed in several stages about 1,500 years ago and during the 18th century; eruptions have also originated from the lengthy East and Southwest rift zones, which extend to the ocean in both directions. About 90% of the surface of the basaltic shield volcano is formed of lava flows less than about 1,100 years old; 70% of the surface is younger than 600 years. The long-term eruption from the East rift zone between 1983 and 2018 produced lava flows covering more than 100 km2, destroyed hundreds of houses, and added new coastline.
Information Contacts: Hawaiian Volcano Observatory (HVO), U.S. Geological Survey, PO Box 51, Hawai'i National Park, HI 96718, USA (URL: http://hvo.wr.usgs.gov/).
Nyamulagira (DR Congo) — November 2023 Cite this Report
Nyamulagira
DR Congo
1.408°S, 29.2°E; summit elev. 3058 m
All times are local (unless otherwise noted)
Lava flows and thermal activity during May-October 2023
Nyamulagira (also known as Nyamuragira) is a shield volcano in the Democratic Republic of Congo with the summit truncated by a small 2 x 2.3 km caldera with walls up to about 100 m high. Documented eruptions have occurred within the summit caldera, as well as from numerous flank fissures and cinder cones. The current eruption period began in April 2018 and has more recently been characterized by summit crater lava flows and thermal activity (BGVN 48:05). This report describes lava flows and variable thermal activity during May through October 2023, based on information from the Observatoire Volcanologique de Goma (OVG) and various satellite data.
Lava lake activity continued during May. The MIROVA (Middle InfraRed Observation of Volcanic Activity) system recorded moderate-to-strong thermal activity throughout the reporting period; activity was more intense during May and October and relatively weaker from June through September (figure 95). The MODVOLC thermal algorithm, detected a total of 209 thermal alerts. There were 143 hotspots detected during May, eight during June, nine during September, and 49 during October. This activity was also reflected in infrared satellite images, where a lava flow was visible in the NW part of the crater on 7 May and strong activity was seen in the center of the crater on 4 October (figure 96). Another infrared satellite image taken on 12 May showed still active lava flows along the NW margin of the crater. According to OVG lava effusions were active during 7-29 May and moved to the N and NW parts of the crater beginning on 9 May. Strong summit crater incandescence was visible from Goma (27 km S) during the nights of 17, 19, and 20 May (figure 97). On 17 May there was an increase in eruptive activity, which peaked at 0100 on 20 May. Notable sulfur dioxide plumes drifted NW and W during 19-20 May (figure 98). Drone footage acquired in partnership with the USGS (United States Geological Survey) on 20 May captured images of narrow lava flows that traveled about 100 m down the W flank (figure 99). Data from the Rumangabo seismic station indicated a decreasing trend in activity during 17-21 May. Although weather clouds prevented clear views of the summit, a strong thermal signature on the NW flank was visible in an infrared satellite image on 22 May, based on an infrared satellite image. On 28 May the lava flows on the upper W flank began to cool and solidify. By 29 May seismicity returned to levels similar to those recorded before the 17 May increase. Lava effusion continued but was confined to the summit crater; periodic crater incandescence was observed.
Low-level activity was noted during June through October. On 1 June OVG reported that seismicity remained at lower levels and that crater incandescence had been absent for three days, though infrared satellite imagery showed continued lava effusion in the summit crater. The lava flows on the flanks covered an estimated 0.6 km2. Satellite imagery continued to show thermal activity confined to the lava lake through October (figure 96), although no lava flows or significant sulfur dioxide emissions were reported.
Geologic Background. Africa's most active volcano, Nyamulagira (also known as Nyamuragira), is a massive high-potassium basaltic shield about 25 km N of Lake Kivu and 13 km NNW of the steep-sided Nyiragongo volcano. The summit is truncated by a small 2 x 2.3 km caldera that has walls up to about 100 m high. Documented eruptions have occurred within the summit caldera, as well as from the numerous flank fissures and cinder cones. A lava lake in the summit crater, active since at least 1921, drained in 1938, at the time of a major flank eruption. Recent lava flows extend down the flanks more than 30 km from the summit as far as Lake Kivu; extensive lava flows from this volcano have covered 1,500 km2 of the western branch of the East African Rift.
Information Contacts: Observatoire Volcanologique de Goma (OVG), Departement de Geophysique, Centre de Recherche en Sciences Naturelles, Lwiro, D.S. Bukavu, DR Congo; Hawai'i Institute of Geophysics and Planetology (HIGP) - MODVOLC Thermal Alerts System, School of Ocean and Earth Science and Technology (SOEST), Univ. of Hawai'i, 2525 Correa Road, Honolulu, HI 96822, USA (URL: http://modis.higp.hawaii.edu/); MIROVA (Middle InfraRed Observation of Volcanic Activity), a collaborative project between the Universities of Turin and Florence (Italy) supported by the Centre for Volcanic Risk of the Italian Civil Protection Department (URL: http://www.mirovaweb.it/); NASA Global Sulfur Dioxide Monitoring Page, Atmospheric Chemistry and Dynamics Laboratory, NASA Goddard Space Flight Center (NASA/GSFC), 8800 Greenbelt Road, Goddard, Maryland, USA (URL: https://so2.gsfc.nasa.gov/); Copernicus Browser, Copernicus Data Space Ecosystem, European Space Agency (URL: https://dataspace.copernicus.eu/browser/); Charles Balagizi, Goma Volcano Observatory, Departement de Geophysique, Centre de Recherche en Sciences Naturelles, Lwiro, D.S. Bukavu, DR Congo.
Bagana (Papua New Guinea) — October 2023 Cite this Report
Bagana
Papua New Guinea
6.137°S, 155.196°E; summit elev. 1855 m
All times are local (unless otherwise noted)
Explosions, ash plumes, ashfall, and lava flows during April-September 2023
The remote volcano of Bagana is located in central Bougainville Island, Papua New Guinea. Recorded eruptions date back to 1842 and activity has consisted of effusive activity that has built a small lava dome in the summit crater and occasional explosions that produced pyroclastic flows. The most recent eruption has been ongoing since February 2000 and has produced occasional explosions, ash plumes, and lava flows. More recently, activity has been characterized by ongoing effusive activity and ash emissions (BGVN 48:04). This report updates activity from April through September 2023 that has consisted of explosions, ash plumes, ashfall, and lava flows, using information from the Darwin Volcanic Ash Advisory Center (VAAC) and satellite data.
An explosive eruption was reported on 7 July that generated a large gas-and-ash plume to high altitudes and caused significant ashfall in local communities; the eruption plume had reached upper tropospheric (16-18 km altitude) altitudes by 2200, according to satellite images. Sulfur dioxide plumes were detected in satellite images on 8 July and indicated that the plume was likely a mixture of gas, ice, and ash. A report issued by the Autonomous Bougainville Government (ABG) (Torokina District, Education Section) on 10 July noted that significant ash began falling during 2000-2100 on 7 July and covered most areas in the Vuakovi, Gotana (9 km SW), Koromaketo, Laruma (25 km W) and Atsilima (27 km NW) villages. Pyroclastic flows also occurred, according to ground-based reports; small deposits confined to one drainage were inspected by RVO during an overflight on 17 July and were confirmed to be from the 7 July event. Ashfall continued until 10 July and covered vegetation, which destroyed bushes and gardens and contaminated rivers and streams.
RVO reported another eruption on 14 July. The Darwin VAAC stated that an explosive event started around 0830 on 15 July and produced an ash plume that rose to 16.5 km altitude by 1000 and drifted N, according to satellite images. The plume continued to drift N and remained visible through 1900, and by 2150 it had dissipated.
Ashfall likely from both the 7 and 15 July events impacted about 8,111 people in Torokina (20 km SW), including Tsito/Vuakovi, Gotana, Koromaketo, Kenaia, Longkogari, Kenbaki, Piva (13 km SW), and Atsinima, and in the Tsitovi district, according to ABG. Significant ashfall was also reported in Ruruvu (22 km N) in the Wakunai District of Central Bougainville, though the thickness of these deposits could not be confirmed. An evacuation was called for the villages in Wakunai, where heavy ashfall had contaminated water sources; the communities of Ruruvu, Togarau, Kakarapaia, Karauturi, Atao, and Kuritaturi were asked to evacuate to a disaster center at the Wakunai District Station, and communities in Torokina were asked to evacuate to the Piva District station. According to a news article, more than 7,000 people needed temporary accommodations, with about 1,000 people in evacuation shelters. Ashfall had deposited over a broad area, contaminating water supplies, affecting crops, and collapsing some roofs and houses in rural areas. Schools were temporarily shut down. Intermittent ash emissions continued through the end of July and drifted NNW, NW, and SW. Fine ashfall was reported on the coast of Torokina, and ash plumes also drifted toward Laruma and Atsilima.
A small explosive eruption occurred at 2130 on 28 July that ejected material from the crater vents, according to reports from Torokina, in addition to a lava flow that contained two lobes. A second explosion was detected at 2157. Incandescence from the lava flow was visible from Piva as it descended the W flank around 2000 on 29 July (figure 47). The Darwin VAAC reported that a strong thermal anomaly was visible in satellite images during 30-31 July and that ash emissions rose to 2.4 km altitude and drifted WSW on 30 July. A ground report from RVO described localized emissions at 0900 on 31 July.
The Darwin VAAC reported that ash plumes were identified in satellite imagery at 0800 and 1220 on 12 August and rose to 2.1 km and 3 km altitude and drifted NW and W, respectively. A news report stated that aid was sent to more than 6,300 people that were adversely affected by the eruption. Photos taken during 17-19 August showed ash emissions rising no higher than 1 km above the summit and drifting SE. A small explosion generated an ash plume during the morning of 19 August. Deposits from small pyroclastic flows were also captured in the photos. Satellite images captured lava flows and pyroclastic flow deposits. Two temporary seismic stations were installed near Bagana on 17 August at distances of 7 km WSW (Vakovi station) and 11 km SW (Kepox station). The Kepox station immediately started to record continuous, low-frequency background seismicity.
Satellite data. Little to no thermal activity was detected during April through mid-July 2023; only one anomaly was recorded during early April and one during early June, according to MIROVA (Middle InfraRed Observation of Volcanic Activity) data (figure 48). Thermal activity increased in both power and frequency during mid-July through September, although there were still some short gaps in detected activity. MODVOLC also detected increased thermal activity during August; thermal hotspots were detected a total of five times on 19, 20, and 27 August. Weak thermal anomalies were also captured in infrared satellite images on clear weather days throughout the reporting period on 7, 12, and 17 April, 27 May, 1, 6, 16, and 31 July, and 19 September (figure 48); a strong thermal anomaly was visible on 31 July. Distinct sulfur dioxide plumes that drifted generally NW were intermittently captured by the TROPOMI instrument on the Sentinel-5P satellite and sometimes exceeded two Dobson Units (DUs) (figure 49).
Geologic Background. Bagana volcano, in a remote portion of central Bougainville Island, is frequently active. This massive symmetrical cone was largely constructed by an accumulation of viscous andesitic lava flows. The entire edifice could have been constructed in about 300 years at its present rate of lava production. Eruptive activity is characterized by non-explosive effusion of viscous lava that maintains a small lava dome in the summit crater, although occasional explosive activity produces pyroclastic flows. Lava flows with tongue-shaped lobes up to 50 m thick and prominent levees descend the flanks on all sides.
Information Contacts: Rabaul Volcano Observatory (RVO), Geohazards Management Division, Department of Mineral Policy and Geohazards Management (DMPGM), PO Box 3386, Kokopo, East New Britain Province, Papua New Guinea; Darwin Volcanic Ash Advisory Centre (VAAC), Bureau of Meteorology, Northern Territory Regional Office, PO Box 40050, Casuarina, NT 0811, Australia (URL: http://www.bom.gov.au/info/vaac/); MIROVA (Middle InfraRed Observation of Volcanic Activity), a collaborative project between the Universities of Turin and Florence (Italy) supported by the Centre for Volcanic Risk of the Italian Civil Protection Department (URL: http://www.mirovaweb.it/); Hawai'i Institute of Geophysics and Planetology (HIGP) - MODVOLC Thermal Alerts System, School of Ocean and Earth Science and Technology (SOEST), Univ. of Hawai'i, 2525 Correa Road, Honolulu, HI 96822, USA (URL: http://modis.higp.hawaii.edu/); NASA Global Sulfur Dioxide Monitoring Page, Atmospheric Chemistry and Dynamics Laboratory, NASA Goddard Space Flight Center (NASA/GSFC), 8800 Greenbelt Road, Goddard, Maryland, USA (URL: https://so2.gsfc.nasa.gov/); Copernicus Browser, Copernicus Data Space Ecosystem, European Space Agency (URL: https://dataspace.copernicus.eu/browser/); Autonomous Bougainville Government, P.O Box 322, Buka, AROB, PNG (URL: https://abg.gov.pg/); Andrew Tupper (Twitter: @andrewcraigtupp); Simon Carn, Geological and Mining Engineering and Sciences, Michigan Technological University, 1400 Townsend Drive, Houghton, MI 49931, USA (URL: http://www.volcarno.com/, Twitter: @simoncarn); Radio NZ (URL: https://www.rnz.co.nz/news/pacific/494464/more-than-7-000-people-in-bougainville-need-temporary-accommodation-after-eruption); USAID, 1300 Pennsylvania Ave, NW, Washington DC 20004, USA (URL: https://www.usaid.gov/pacific-islands/press-releases/aug-08-2023-united-states-provides-immediate-emergency-assistance-support-communities-affected-mount-bagana-volcanic-eruptions).
Mayon (Philippines) — October 2023 Cite this Report
Mayon
Philippines
13.257°N, 123.685°E; summit elev. 2462 m
All times are local (unless otherwise noted)
Lava flows, pyroclastic flows, ash emissions, and seismicity during April-September 2023
Mayon is located in the Philippines and has steep upper slopes capped by a small summit crater. Historical eruptions date back to 1616 CE that have been characterized by Strombolian eruptions, lava flows, pyroclastic flows, and mudflows. Eruptions mostly originated from a central conduit. Pyroclastic flows and mudflows have commonly descended many of the approximately 40 drainages that surround the volcano. The most recent eruption occurred during June through October 2022 and consisted of lava dome growth and gas-and-steam emissions (BGVN 47:12). A new eruption was reported during late April 2023 and has included lava flows, pyroclastic density currents, ash emissions, and seismicity. This report covers activity during April through September 2023 based on daily bulletins from the Philippine Institute of Volcanology and Seismology (PHIVOLCS).
During April through September 2023, PHIVOLCS reported near-daily rockfall events, frequent volcanic earthquakes, and sulfur dioxide measurements. Gas-and-steam emissions rose 100-900 m above the crater and drifted in different directions. Nighttime crater incandescence was often visible during clear weather and was accompanied by incandescent avalanches of material. Activity notably increased during June when lava flows were reported on the S, SE, and E flanks (figure 52). The MIROVA graph (Middle InfraRed Observation of Volcanic Activity) showed strong thermal activity coincident with these lava flows, which remained active through September (figure 53). According to the MODVOLC thermal algorithm, a total of 110 thermal alerts were detected during the reporting period: 17 during June, 40 during July, 27 during August, and 26 during September. During early June, pyroclastic density currents (PDCs) started to occur more frequently.
Low activity was reported during much of April and May; gas-and-steam emissions rose 100-900 m above the crater and generally drifted in different directions. A total of 52 rockfall events and 18 volcanic earthquakes were detected during April and 147 rockfall events and 13 volcanic events during May. Sulfur dioxide flux measurements ranged between 400-576 tons per day (t/d) during April, the latter of which was measured on 29 April and between 162-343 t/d during May, the latter of which was measured on 13 May.
Activity during June increased, characterized by lava flows, pyroclastic density currents (PDCs), crater incandescence and incandescent rockfall events, gas-and-steam emissions, and continued seismicity. Weather clouds often prevented clear views of the summit, but during clear days, moderate gas-and-steam emissions rose 100-2,500 m above the crater and drifted in multiple directions. A total of 6,237 rockfall events and 288 volcanic earthquakes were detected. The rockfall events often deposited material on the S and SE flanks within 700-1,500 m of the summit crater and ash from the events drifted SW, S, SE, NE, and E. Sulfur dioxide emissions ranged between 149-1,205 t/d, the latter of which was measured on 10 June. Short-term observations from EDM and electronic tiltmeter monitoring indicated that the upper slopes were inflating since February 2023. Longer-term ground deformation parameters based on EDM, precise leveling, continuous GPS, and electronic tilt monitoring indicated that the volcano remained inflated, especially on the NW and SE flanks. At 1000 on 5 June the Volcano Alert Level (VAL) was raised to 2 (on a 0-5 scale). PHIVOLCS noted that although low-level volcanic earthquakes, ground deformation, and volcanic gas emissions indicated unrest, the steep increase in rockfall frequency may indicate increased dome activity.
A total of 151 dome-collapse PDCs occurred during 8-9 and 11-30 June, traveled 500-2,000 m, and deposited material on the S flank within 2 km of the summit crater. During 8-9 June the VAL was raised to 3. At approximately 1947 on 11 June lava flow activity was reported; two lobes traveled within 500 m from the crater and deposited material on the S (Mi-isi), SE (Bonga), and E (Basud) flanks. Weak seismicity accompanied the lava flow and slight inflation on the upper flanks. This lava flow remained active through 30 June, moving down the S and SE flank as far as 2.5 km and 1.8 km, respectively and depositing material up to 3.3 km from the crater. During 15-16 June traces of ashfall from the PDCs were reported in Sitio Buga, Nabonton, City of Ligao and Purok, and San Francisco, Municipality of Guinobatan. During 28-29 June there were two PDCs generated by the collapse of the lava flow front, which generated a light-brown ash plume 1 km high. Satellite monitors detected significant concentrations of sulfur dioxide beginning on 29 June. On 30 June PDCs primarily affected the Basud Gully on the E flank, the largest of which occurred at 1301 and lasted eight minutes, based on the seismic record. Four PDCs generated between 1800 and 2000 that lasted approximately four minutes each traveled 3-4 km on the E flank and generated an ash plume that rose 1 km above the crater and drifted N and NW. Ashfall was recorded in Tabaco City.
Similar strong activity continued during July; slow lava effusion remained active on the S and SE flanks and traveled as far as 2.8 km and 2.8 km, respectively and material was deposited as far as 4 km from the crater. There was a total of 6,983 rockfall events and 189 PDCs that affected the S, SE, and E flanks. The volcano network detected a total of 2,124 volcanic earthquakes. Continuous gas-and-steam emissions rose 200-2,000 m above the crater and drifted in multiple directions. Sulfur dioxide emissions averaged 792-4,113 t/d, the latter of which was measured on 28 July. During 2-4 July three PDCs were generated from the collapse of the lava flow and resulting light brown plumes rose 200-300 m above the crater. Continuous tremor pulses were reported beginning at 1547 on 3 July through 7 July at 1200, at 2300 on 8 July and going through 0300 on 10 July, and at 2300 on 16 July, as recorded by the seismic network. During 6-9 July there were 10 lava flow-collapse-related PDCs that generated light brown plumes 300-500 m above the crater. During 10-11 July light ashfall was reported in some areas of Mabinit, Legazpi City, Budiao and Salvacion, Daraga, and Camalig, Albay. By 18 July the lava flow advanced 600 m on the E flank as well.
During 1733 on 18 July and 0434 on 19 July PHIVOLCS reported 30 “ashing” events, which are degassing events accompanied by audible thunder-like sounds and entrained ash at the crater, which produced short, dark plumes that drifted SW. These events each lasted 20-40 seconds, and plume heights ranged from 150-300 m above the crater, as recorded by seismic, infrasound, visual, and thermal monitors. Three more ashing events occurred during 19-20 July. Short-term observations from electronic tilt and GPS monitoring indicate deflation on the E lower flanks in early July and inflation on the NW middle flanks during the third week of July. Longer-term ground deformation parameters from EDM, precise leveling, continuous GPS, and electronic tilt monitoring indicated that the volcano was still generally inflated relative to baseline levels. A short-lived lava pulse lasted 28 seconds at 1956 on 21 July, which was accompanied by seismic and infrasound signals. By 22 July, the only lava flow that remained active was on the SE flank, and continued to extend 3.4 km, while those on the S and E flanks weakened markedly. One ashing event was detected during 30-31 July, whereas there were 57 detected during 31 July-1 August; according to PHIVOLCS beginning at approximately 1800 on 31 July eruptive activity was dominated by phases of intermittent ashing, as well as increased in the apparent rates of lava effusion from the summit crater. The ashing phases consisted of discrete events recorded as low-frequency volcanic earthquakes (LFVQ) typically 30 seconds in duration, based on seismic and infrasound signals. Gray ash plume rose 100 m above the crater and generally drifted NE. Shortly after these ashing events began, new lava began to effuse rapidly from the crater, feeding the established flowed on the SE, E, and E flanks and generating frequent rockfall events.
Intensified unrest persisted during August. There was a total of 4,141 rockfall events, 2,881 volcanic earthquakes, which included volcanic tremor events, 32 ashing events, and 101 PDCs detected throughout the month. On clear weather days, gas-and-steam emissions rose 300-1,500 m above the crater and drifted in different directions (figure 54). Sulfur dioxide emissions averaged 735-4,756 t/d, the higher value of which was measured on 16 August. During 1-2 August the rate of lava effusion decreased, but continued to feed the flows on the SE, S, and E flanks, maintaining their advances to 3.4 km, 2.8 km, and 1.1 km from the crater, respectively (figure 55). Rockfall and PDCs generated by collapses at the lava flow margins and from the summit dome deposited material within 4 km of the crater. During 3-4 August there were 10 tremor events detected that lasted 1-4 minutes. Short-lived lava pulse lasted 35 seconds and was accompanied by seismic and infrasound signals at 0442 on 6 August. Seven collapses were recorded at the front of the lava flow during 12-14 August.
During September, similar activity of slow lava effusion, PDCs, gas-and-steam emissions, and seismicity continued. There was a total of 4,452 rockfall events, 329 volcanic earthquakes, which included volcanic tremor events, two ashing events, and 85 PDCs recorded throughout the month. On clear weather days, gas-and-steam emissions rose 100-1,500 m above the crater and drifted in multiple directions. Sulfur dioxide emissions averaged 609-2,252 t/d, the higher average of which was measured on 6 September. Slow lava effusion continued advancing on the SE, S, and E flanks, maintaining lengths of 3.4 km, 2.8 km, and 1.1 km, respectively. Rockfall and PDC events generated by collapses along the lava flow margins and at the summit dome deposited material within 4 km of the crater.
Geologic Background. Symmetrical Mayon, which rises above the Albay Gulf NW of Legazpi City, is the most active volcano of the Philippines. The steep upper slopes are capped by a small summit crater. Recorded eruptions since 1616 CE range from Strombolian to basaltic Plinian, with cyclical activity beginning with basaltic eruptions, followed by longer periods of andesitic lava flows. Eruptions occur predominately from the central conduit and have also produced lava flows that travel far down the flanks. Pyroclastic density currents and mudflows have commonly swept down many of the approximately 40 ravines that radiate from the summit and have often damaged populated lowland areas. A violent eruption in 1814 killed more than 1,200 people and devastated several towns.
Information Contacts: Philippine Institute of Volcanology and Seismology (PHIVOLCS), Department of Science and Technology, University of the Philippines Campus, Diliman, Quezon City, Philippines (URL: http://www.phivolcs.dost.gov.ph/); MIROVA (Middle InfraRed Observation of Volcanic Activity), a collaborative project between the Universities of Turin and Florence (Italy) supported by the Centre for Volcanic Risk of the Italian Civil Protection Department (URL: http://www.mirovaweb.it/); Hawai'i Institute of Geophysics and Planetology (HIGP) - MODVOLC Thermal Alerts System, School of Ocean and Earth Science and Technology (SOEST), Univ. of Hawai'i, 2525 Correa Road, Honolulu, HI 96822, USA (URL: http://modis.higp.hawaii.edu/); Copernicus Browser, Copernicus Data Space Ecosystem, European Space Agency (URL: https://dataspace.copernicus.eu/browser/); William Rogers, Legazpi City, Albay Province, Philippines.
Nishinoshima (Japan) — October 2023 Cite this Report
Nishinoshima
Japan
27.247°N, 140.874°E; summit elev. 100 m
All times are local (unless otherwise noted)
Eruption plumes and gas-and-steam plumes during May-August 2023
Nishinoshima, located about 1,000 km S of Tokyo, is a small island in the Ogasawara Arc in Japan. The island is the summit of a massive submarine volcano that has prominent submarine peaks to the S, W, and NE. Eruptions date back to 1973 and the current eruption period began in October 2022. Recent activity has consisted of small ash plumes and fumarolic activity (BGVN 48:07). This report covers activity during May through August 2023, using information from monthly reports of the Japan Meteorological Agency (JMA) monthly reports and satellite data.
Activity during May through June was relatively low. The Japan Coast Guard (JCG) did overflights on 14 and 22 June and reported white gas-and-steam emissions rising 600 m and 1,200 m from the central crater of the pyroclastic cone, respectively (figure 125). In addition, multiple white gas-and-steam emissions rose from the inner rim of the W side of the crater and from the SE flank of the pyroclastic cone. Discolored brown-to-green water was observed around almost the entire perimeter of the island; on 22 June light green discolored water was observed off the S coast of the island.
Observations from the Himawari meteorological satellite confirmed an eruption on 9 and 10 July. An eruption plume rose 1.6 km above the crater and drifted N around 1300 on 9 July. Satellite images acquired at 1420 and 2020 on 9 July and at 0220 on 10 July showed continuing emissions that rose 1.3-1.6 km above the crater and drifted NE and N. The Tokyo VAAC reported that an ash plume seen by a pilot and identified in a satellite image at 0630 on 21 July rose to 3 km altitude and drifted S.
Aerial observations conducted by JCG on 8 August showed a white-and-gray plume rising from the central crater of the pyroclastic cone, and multiple white gas-and-steam emissions were rising from the inner edge of the western crater and along the NW-SE flanks of the island (figure 126). Brown-to-green discolored water was also noted around the perimeter of the island.
Intermittent low-to-moderate power thermal anomalies were recorded in the MIROVA graph (Middle InfraRed Observation of Volcanic Activity), showing an increase in both frequency and power beginning in July (figure 127). This increase in activity coincides with eruptive activity on 9 and 10 July, characterized by eruption plumes. According to the MODVOLC thermal alert algorithm, one thermal hotspot was recorded on 20 July. Weak thermal anomalies were also detected in infrared satellite imagery, accompanied by strong gas-and-steam plumes (figure 128).
Geologic Background. The small island of Nishinoshima was enlarged when several new islands coalesced during an eruption in 1973-74. Multiple eruptions that began in 2013 completely covered the previous exposed surface and continued to enlarge the island. The island is the summit of a massive submarine volcano that has prominent peaks to the S, W, and NE. The summit of the southern cone rises to within 214 m of the ocean surface 9 km SSE.
Information Contacts: Japan Meteorological Agency (JMA), 1-3-4 Otemachi, Chiyoda-ku, Tokyo 100-8122, Japan (URL: http://www.jma.go.jp/jma/indexe.html); Tokyo Volcanic Ash Advisory Center (VAAC), 1-3-4 Otemachi, Chiyoda-ku, Tokyo 100-8122, Japan (URL: http://ds.data.jma.go.jp/svd/vaac/data/); MIROVA (Middle InfraRed Observation of Volcanic Activity), a collaborative project between the Universities of Turin and Florence (Italy) supported by the Centre for Volcanic Risk of the Italian Civil Protection Department (URL: http://www.mirovaweb.it/); Copernicus Browser, Copernicus Data Space Ecosystem, European Space Agency (URL: https://dataspace.copernicus.eu/browser/).
Krakatau (Indonesia) — October 2023 Cite this Report
Krakatau
Indonesia
6.1009°S, 105.4233°E; summit elev. 285 m
All times are local (unless otherwise noted)
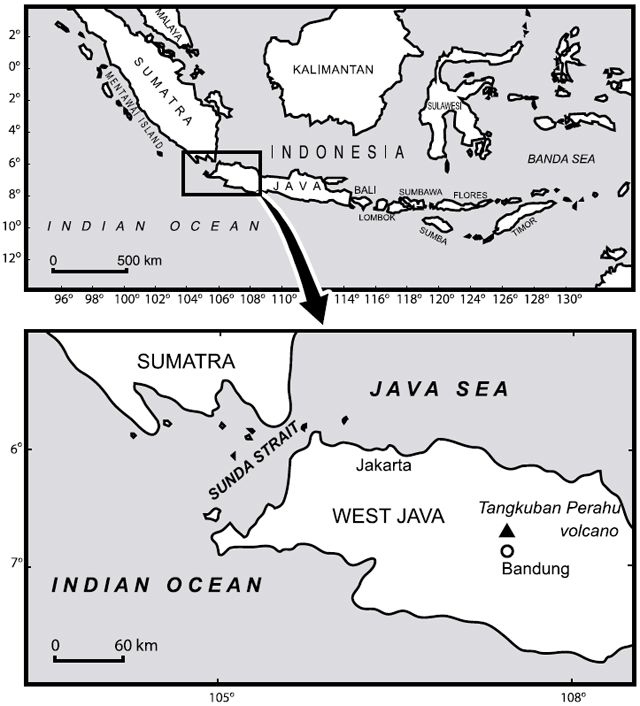
White gas-and-steam plumes and occasional ash plumes during May-August 2023
Krakatau is located in the Sunda Strait between Java and Sumatra, Indonesia. Caldera collapse during the catastrophic 1883 eruption destroyed Danan and Perbuwatan cones and left only a remnant of Rakata. The post-collapse cone of Anak Krakatau (Child of Krakatau) was constructed within the 1883 caldera at a point between the former Danan and Perbuwatan cones; it has been the site of frequent eruptions since 1927. The current eruption period began in May 2021 and has recently consisted of Strombolian eruptions and ash plumes (BGVN 48:07). This report describes lower levels of activity consisting of ash and white gas-and-steam plumes during May through August 2023, based on information provided by the Indonesian Center for Volcanology and Geological Hazard Mitigation, referred to as Pusat Vulkanologi dan Mitigasi Bencana Geologi (PVMBG), MAGMA Indonesia, and satellite data.
Activity was relatively low during May and June. Daily white gas-and-steam emissions rose 25-200 m above the crater and drifted in different directions. Five ash plumes were detected at 0519 on 10 May, 1241 on 11 May, 0920 on 12 May, 2320 on 12 May, and at 0710 on 13 May, and rose 1-2.5 km above the crater and drifted SW. A webcam image taken on 12 May showed ejection of incandescent material above the vent. A total of nine ash plumes were detected during 6-11 June: at 1434 and 00220 on 6 and 7 June the ash plumes rose 500 m above the crater and drifted NW, at 1537 on 8 June the ash plume rose 1 km above the crater and drifted SW, at 0746 and at 0846 on 9 June the ash plumes rose 800 m and 3 km above the crater and drifted SW, respectively, at 0423, 1431, and 1750 on 10 June the ash plumes rose 2 km, 1.5 km, and 3.5 km above the crater and drifted NW, respectively, and at 0030 on 11 June an ash plume rose 2 km above the crater and drifted NW. Webcam images taken on 10 and 11 June at 0455 and 0102, respectively, showed incandescent material ejected above the vent. On 19 June an ash plume at 0822 rose 1.5 km above the crater and drifted SE.
Similar low activity of white gas-and-steam emissions and few ash plumes were reported during July and August. Daily white gas-and-steam emissions rose 25-300 m above the crater and drifted in multiple directions. Three ash plumes were reported at 0843, 0851, and 0852 on 20 July that rose 500-2,000 m above the crater and drifted NW.
The MIROVA (Middle InfraRed Observation of Volcanic Activity) graph of MODIS thermal anomaly data showed intermittent low-to-moderate power thermal anomalies during May through August 2023 (figure 140). Although activity was often obscured by weather clouds, a thermal anomaly was visible in an infrared satellite image of the crater on 12 May, accompanied by an eruption plume that drifted SW (figure 141).
Geologic Background. The renowned Krakatau (frequently mis-named as Krakatoa) volcano lies in the Sunda Strait between Java and Sumatra. Collapse of an older edifice, perhaps in 416 or 535 CE, formed a 7-km-wide caldera. Remnants of that volcano are preserved in Verlaten and Lang Islands; subsequently the Rakata, Danan, and Perbuwatan cones were formed, coalescing to create the pre-1883 Krakatau Island. Caldera collapse during the catastrophic 1883 eruption destroyed Danan and Perbuwatan, and left only a remnant of Rakata. This eruption caused more than 36,000 fatalities, most as a result of tsunamis that swept the adjacent coastlines of Sumatra and Java. Pyroclastic surges traveled 40 km across the Sunda Strait and reached the Sumatra coast. After a quiescence of less than a half century, the post-collapse cone of Anak Krakatau (Child of Krakatau) was constructed within the 1883 caldera at a point between the former Danan and Perbuwatan cones. Anak Krakatau has been the site of frequent eruptions since 1927.
Information Contacts: Pusat Vulkanologi dan Mitigasi Bencana Geologi (PVMBG, also known as Indonesian Center for Volcanology and Geological Hazard Mitigation, CVGHM), Jalan Diponegoro 57, Bandung 40122, Indonesia (URL: http://www.vsi.esdm.go.id/); MAGMA Indonesia, Kementerian Energi dan Sumber Daya Mineral (URL: https://magma.esdm.go.id/v1); MIROVA (Middle InfraRed Observation of Volcanic Activity), a collaborative project between the Universities of Turin and Florence (Italy) supported by the Centre for Volcanic Risk of the Italian Civil Protection Department (URL: http://www.mirovaweb.it/); Copernicus Browser, Copernicus Data Space Ecosystem, European Space Agency (URL: https://dataspace.copernicus.eu/browser/).
Villarrica (Chile) — October 2023 Cite this Report
Villarrica
Chile
39.42°S, 71.93°W; summit elev. 2847 m
All times are local (unless otherwise noted)
Strombolian activity, gas-and-ash emissions, and crater incandescence during April-September 2023
Villarrica, in central Chile, consists of a 2-km-wide caldera that formed about 3,500 years ago and is located at the base of the presently active cone at the NW margin of a 6-km-wide caldera. Historical eruptions eruptions date back to 1558 and have been characterized by mild-to-moderate explosive activity with occasional lava effusions. The current eruption period began in December 2014 and has recently consisted of nighttime crater incandescence, ash emissions, and seismicity (BGVN 48:04). This report covers activity during April through September 2023 and describes occasional Strombolian activity, gas-and-ash emissions, and nighttime crater incandescence. Information for this report primarily comes from the Southern Andes Volcano Observatory (Observatorio Volcanológico de Los Andes del Sur, OVDAS), part of Chile's National Service of Geology and Mining (Servicio Nacional de Geología y Minería, SERNAGEOMIN) and satellite data.
Seismicity during April consisted of long period (LP) events and tremor (TRE); a total of 9,413 LP-type events and 759 TR-type events were detected throughout the month. Nighttime crater incandescence persisted and was visible in the degassing column. Sulfur dioxide data was obtained using Differential Absorption Optical Spectroscopy Equipment (DOAS) that showed an average value of 1,450 ± 198 tons per day (t/d) during 1-15 April and 1,129 ± 201 t/d during 16-30 April, with a maximum daily value of 2,784 t/d on 9 April. Gas-and-steam emissions of variable intensities rose above the active crater as high as 1.3 km above the crater on 13 April. Strombolian explosions were not observed and there was a slight decrease in the lava lake level.
There were 14,123 LP-type events and 727 TR-type events detected during May. According to sulfur dioxide measurements taken with DOAS equipment, the active crater emitted an average value of 1,826 ± 482 t/d during 1-15 May and 912 ± 41 t/d during 16-30 May, with a daily maximum value of 5,155 t/d on 13 May. Surveillance cameras showed continuous white gas-and-steam emissions that rose as high as 430 m above the crater on 27 May. Nighttime incandescence illuminated the gas column less than 300 m above the crater rim was and no pyroclastic emissions were reported. A landslide was identified on 13 May on the E flank of the volcano 50 m from the crater rim and extending 300 m away; SERNAGEOMIN noted that this event may have occurred on 12 May. During the morning of 27 and 28 May minor Strombolian explosions characterized by incandescent ejecta were recorded at the crater rim; the last reported Strombolian explosions had occurred at the end of March.
Seismic activity during June consisted of five volcano-tectonic (VT)-type events, 21,606 LP-type events, and 2,085 TR-type events. The average value of sulfur dioxide flux obtained by DOAS equipment was 1,420 ± 217 t/d during 1-15 June and 2,562 ± 804 t/d, with a maximum daily value of 4,810 t/d on 17 June. White gas-and-steam emissions rose less than 480 m above the crater; frequent nighttime crater incandescence was reflected in the degassing plume. On 12 June an emission rose 100 m above the crater and drifted NNW. On 15 June one or several emissions resulted in ashfall to the NE as far as 5.5 km from the crater, based on a Skysat satellite image. Several Strombolian explosions occurred within the crater; activity on 15 June was higher energy and ejected blocks 200-300 m on the NE slope. Surveillance cameras showed white gas-and-steam emissions rising 480 m above the crater on 16 June. On 19 and 24 June low-intensity Strombolian activity was observed, ejecting material as far as 200 m from the center of the crater to the E.
During July, seismicity included 29,319 LP-type events, 3,736 TR-type events, and two VT-type events. DOAS equipment recorded two days of sulfur dioxide emissions of 4,220 t/d and 1,009 t/d on 1 and 13 July, respectively. Constant nighttime incandescence was also recorded and was particularly noticeable when accompanied by eruptive columns on 12 and 16 July. Minor explosive events were detected in the crater. According to Skysat satellite images taken on 12, 13, and 16 July, ashfall deposits were identified 155 m S of the crater. According to POVI, incandescence was visible from two vents on the crater floor around 0336 on 12 July. Gas-and-ash emissions rose as high as 1.2 km above the crater on 13 July and drifted E and NW. A series of gas-and-steam pulses containing some ash deposited material on the upper E flank around 1551 on 13 July. During 16-31 July, average sulfur dioxide emissions of 1,679 ± 406 t/d were recorded, with a maximum daily value of 2,343 t/d on 28 July. Fine ash emissions were also reported on 16, 17, and 23 July.
Seismicity persisted during August, characterized by 27,011 LP-type events, 3,323 TR-type events, and three VT-type events. The average value of sulfur dioxide measurements taken during 1-15 August was 1,642 ± 270 t/d and 2,207 ± 4,549 t/d during 16-31 August, with a maximum daily value of 3,294 t/d on 27 August. Nighttime crater incandescence remained visible in degassing columns. White gas-and-steam emissions rose 480 m above the crater on 6 August. According to a Skysat satellite image from 6 August, ash accumulation was observed proximal to the crater and was mainly distributed toward the E slope. White gas-and-steam emissions rose 320 m above the crater on 26 August. Nighttime incandescence and Strombolian activity that generated ash emissions were reported on 27 August.
Seismicity during September was characterized by five VT-type events, 12,057 LP-type events, and 2,058 TR-type events. Nighttime incandescence persisted. On 2 September an ash emission rose 180 m above the crater and drifted SE at 1643 (figure 125) and a white gas-and-steam plume rose 320 m above the crater. According to the Buenos Aires VAAC, periods of continuous gas-and-ash emissions were visible in webcam images from 1830 on 2 September to 0110 on 3 September. Strombolian activity was observed on 2 September and during the early morning of 3 September, the latter event of which generated an ash emission that rose 60 m above the crater and drifted 100 m from the center of the crater to the NE and SW. Ashfall was reported to the SE and S as far as 750 m from the crater. The lava lake was active during 3-4 September and lava fountaining was visible for the first time since 26 March 2023, according to POVI. Fountains captured in webcam images at 2133 on 3 September and at 0054 on 4 September rose as high as 60 m above the crater rim and ejected material onto the upper W flank. Sulfur dioxide flux of 1,730 t/d and 1,281 t/d was measured on 3 and 4 September, respectively, according to data obtained by DOAS equipment.
Strong Strombolian activity and larger gas-and-ash plumes were reported during 18-20 September. On 18 September activity was also associated with energetic LP-type events and notable sulfur dioxide fluxes (as high as 4,277 t/d). On 19 September Strombolian activity and incandescence were observed. On 20 September at 0914 ash emissions rose 50 m above the crater and drifted SSE, accompanied by Strombolian activity that ejected material less than 100 m SSE, causing fall deposits on that respective flank. SERNAGEOMIN reported that a Planet Scope satellite image taken on 20 September showed the lava lake in the crater, measuring 32 m x 35 m and an area of 0.001 km2. Several ash emissions were recorded at 0841, 0910, 1251, 1306, 1312, 1315, and 1324 on 23 September and rose less than 150 m above the crater. The sulfur dioxide flux value was 698 t/d on 23 September and 1,097 t/d on 24 September. On 24 September the Volcanic Alert Level (VAL) was raised to Orange (the third level on a four-color scale). SENAPRED maintained the Alert Level at Yellow (the middle level on a three-color scale) for the communities of Villarrica, Pucón (16 km N), Curarrehue, and Panguipulli.
During 24-25 September there was an increase in seismic energy (observed at TR-events) and acoustic signals, characterized by 1 VT-type event, 213 LP-type events, and 124 TR-type events. Mainly white gas-and-steam emissions, in addition to occasional fine ash emissions were recorded. During the early morning of 25 September Strombolian explosions were reported and ejected material 250 m in all directions, though dominantly toward the NW. On 25 September the average value of sulfur dioxide flux was 760 t/d. Seismicity during 25-30 September consisted of five VT-type events, 1,937 LP-type events, and 456 TR-type events.
During 25-29 September moderate Strombolian activity was observed and ejected material as far as the crater rim. In addition, ash pulses lasting roughly 50 minutes were observed around 0700 and dispersed ENE. During 26-27 September a TR episode lasted 6.5 hours and was accompanied by discrete acoustic signals. Satellite images from 26 September showed a spatter cone on the crater floor with one vent that measured 10 x 14 m and a smaller vent about 35 m NE of the cone. SERNAGEOMIN reported an abundant number of bomb-sized blocks up to 150 m from the crater, as well as impact marks on the snow, which indicated explosive activity. A low-altitude ash emission was observed drifting NW around 1140 on 28 September, based on webcam images. Between 0620 and 0850 on 29 September an ash emission rose 60 m above the crater and drifted NW. During an overflight taken around 1000 on 29 September scientists observed molten material in the vent, a large accumulation of pyroclasts inside the crater, and energetic degassing, some of which contained a small amount of ash. Block-sized pyroclasts were deposited on the internal walls and near the crater, and a distal ash deposit was also visible. The average sulfur dioxide flux measured on 28 September was 344 t/d. Satellite images taken on 29 September ashfall was deposited roughly 3 km WNW from the crater and nighttime crater incandescence remained visible. The average sulfur dioxide flux value from 29 September was 199 t/d. On 30 September at 0740 a pulsating ash emission rose 1.1 km above the crater and drifted NNW (figure 126). Deposits on the S flank extended as far as 4.5 km from the crater rim, based on satellite images from 30 September.
Infrared MODIS satellite data processed by MIROVA (Middle InfraRed Observation of Volcanic Activity) showed intermittent thermal activity during April through September, with slightly stronger activity detected during late September (figure 127). Small clusters of thermal activity were detected during mid-June, early July, early August, and late September. According to the MODVOLC thermal alert system, a total of four thermal hotspots were detected on 7 July and 3 and 23 September. This activity was also intermittently captured in infrared satellite imagery on clear weather days (figure 128).
Geologic Background. The glacier-covered Villarrica stratovolcano, in the northern Lakes District of central Chile, is ~15 km south of the city of Pucon. A 2-km-wide caldera that formed about 3,500 years ago is located at the base of the presently active, dominantly basaltic to basaltic andesite cone at the NW margin of a 6-km-wide Pleistocene caldera. More than 30 scoria cones and fissure vents are present on the flanks. Plinian eruptions and pyroclastic flows that have extended up to 20 km from the volcano were produced during the Holocene. Lava flows up to 18 km long have issued from summit and flank vents. Eruptions documented since 1558 CE have consisted largely of mild-to-moderate explosive activity with occasional lava effusion. Glaciers cover 40 km2 of the volcano, and lahars have damaged towns on its flanks.
Information Contacts: Servicio Nacional de Geología y Minería (SERNAGEOMIN), Observatorio Volcanológico de Los Andes del Sur (OVDAS), Avda Sta María No. 0104, Santiago, Chile (URL: http://www.sernageomin.cl/); Proyecto Observación Villarrica Internet (POVI) (URL: http://www.povi.cl/); Sistema y Servicio Nacional de Prevención y Repuesta Ante Desastres (SENAPRED), Av. Beauchef 1671, Santiago, Chile (URL: https://web.senapred.cl/); Buenos Aires Volcanic Ash Advisory Center (VAAC), Servicio Meteorológico Nacional-Fuerza Aérea Argentina, 25 de mayo 658, Buenos Aires, Argentina (URL: http://www.smn.gov.ar/vaac/buenosaires/inicio.php); MIROVA (Middle InfraRed Observation of Volcanic Activity), a collaborative project between the Universities of Turin and Florence (Italy) supported by the Centre for Volcanic Risk of the Italian Civil Protection Department (URL: http://www.mirovaweb.it/); Hawai'i Institute of Geophysics and Planetology (HIGP) - MODVOLC Thermal Alerts System, School of Ocean and Earth Science and Technology (SOEST), Univ. of Hawai'i, 2525 Correa Road, Honolulu, HI 96822, USA (URL: http://modis.higp.hawaii.edu/); Copernicus Browser, Copernicus Data Space Ecosystem, European Space Agency (URL: https://dataspace.copernicus.eu/browser/).
Merapi (Indonesia) — October 2023 Cite this Report
Merapi
Indonesia
7.54°S, 110.446°E; summit elev. 2910 m
All times are local (unless otherwise noted)
Frequent incandescent avalanches during April-September 2023
Merapi, located just north of the major city of Yogyakarta in central Java, Indonesia, has had activity within the last 20 years characterized by pyroclastic flows and lahars accompanying growth and collapse of the steep-sided active summit lava dome. The current eruption period began in late December 2020 and has more recently consisted of ash plumes, intermittent incandescent avalanches of material, and pyroclastic flows (BGVN 48:04). This report covers activity during April through September 2023, based on information from Balai Penyelidikan dan Pengembangan Teknologi Kebencanaan Geologi (BPPTKG), the Center for Research and Development of Geological Disaster Technology, a branch of PVMBG which specifically monitors Merapi. Additional information comes from the Pusat Vulkanologi dan Mitigasi Bencana Geologi (PVMBG, also known as Indonesian Center for Volcanology and Geological Hazard Mitigation, CVGHM), MAGMA Indonesia, the Darwin Volcanic Ash Advisory Centre (VAAC), and various satellite data.
Activity during April through September 2023 primarily consisted of incandescent avalanches of material that mainly affected the SW and W flanks and traveled as far as 2.3 km from the summit (table 25) and white gas-and-steam emissions that rose 10-1,000 m above the crater.
Table 25. Monthly summary of avalanches and avalanche distances recorded at Merapi during April through September 2023. The number of reported avalanches does not include instances where possible avalanches were heard but could not be visually confirmed as a result of inclement weather. Data courtesy of BPPTKG (April-September 2023 daily reports).
| Month |
Average number of avalanches per day |
Distance avalanches traveled (m) |
| Apr 2023 |
19 |
1,200-2,000 |
| May 2023 |
22 |
500-2,000 |
| Jun 2023 |
18 |
1,200-2,000 |
| Jul 2023 |
30 |
300-2,000 |
| Aug 2023 |
25 |
400-2,300 |
| Sep 2023 |
23 |
600-2,000 |
BPPTKG reported that during April and May white gas-and-steam emissions rose 10-750 m above the crater, incandescent avalanches descended 500-2,000 m on the SW and W flanks (figure 135). Cloudy weather often prevented clear views of the summit, and sometimes avalanches could not be confirmed. According to a webcam image, a pyroclastic flow was visible on 17 April at 0531. During the week of 28 April and 4 May a pyroclastic flow was reported on the SW flank, traveling up to 2.5 km. According to a drone overflight taken on 17 May the SW lava dome volume was an estimated 2,372,800 cubic meters and the dome in the main crater was an estimated 2,337,300 cubic meters.
During June and July similar activity persisted with white gas-and-steam emissions rising 10-350 m above the crater and frequent incandescent avalanches that traveled 300-2,000 m down the SW, W, and S flanks (figure 136). Based on an analysis of aerial photos taken on 24 June the volume of the SW lava dome was approximately 2.5 million cubic meters. A pyroclastic flow was observed on 5 July that traveled 2.7 km on the SW flank. According to the Darwin VAAC multiple minor ash plumes were identified in satellite images on 19 July that rose to 3.7 km altitude and drifted S and SW. During 22, 25, and 26 July a total of 17 avalanches descended as far as 1.8 km on the S flank.
Frequent white gas-and-steam emissions continued during August and September, rising 10-450 m above the crater. Incandescent avalanches mainly affected the SW and W flanks and traveled 400-2,300 m from the vent (figure 137). An aerial survey conducted on 10 August was analyzed and reported that estimates of the SW dome volume was 2,764,300 cubic meters and the dome in the main crater was 2,369,800 cubic meters.
Frequent and moderate-power thermal activity continued throughout the reporting period, according to a MIROVA (Middle InfraRed Observation of Volcanic Activity) analysis of MODIS satellite data (figure 138). There was an increase in the number of detected anomalies during mid-May. The MODVOLC thermal algorithm recorded a total of 47 thermal hotspots: six during April, nine during May, eight during June, 15 during July, four during August, and five during September. Some of this activity was captured in infrared satellite imagery on clear weather days, sometimes accompanied by incandescent material on the SW flank (figure 139).
Geologic Background. Merapi, one of Indonesia's most active volcanoes, lies in one of the world's most densely populated areas and dominates the landscape immediately north of the major city of Yogyakarta. It is the youngest and southernmost of a volcanic chain extending NNW to Ungaran volcano. Growth of Old Merapi during the Pleistocene ended with major edifice collapse perhaps about 2,000 years ago, leaving a large arcuate scarp cutting the eroded older Batulawang volcano. Subsequent growth of the steep-sided Young Merapi edifice, its upper part unvegetated due to frequent activity, began SW of the earlier collapse scarp. Pyroclastic flows and lahars accompanying growth and collapse of the steep-sided active summit lava dome have devastated cultivated lands on the western-to-southern flanks and caused many fatalities.
Information Contacts: Balai Penyelidikan dan Pengembangan Teknologi Kebencanaan Geologi (BPPTKG), Center for Research and Development of Geological Disaster Technology (URL: http://merapi.bgl.esdm.go.id/, Twitter: @BPPTKG); MAGMA Indonesia, Kementerian Energi dan Sumber Daya Mineral (URL: https://magma.esdm.go.id/v1); Pusat Vulkanologi dan Mitigasi Bencana Geologi (PVMBG, also known as Indonesian Center for Volcanology and Geological Hazard Mitigation, CVGHM), Jalan Diponegoro 57, Bandung 40122, Indonesia (URL: http://www.vsi.esdm.go.id/); Darwin Volcanic Ash Advisory Centre (VAAC), Bureau of Meteorology, Northern Territory Regional Office, PO Box 40050, Casuarina, NT 0811, Australia (URL: http://www.bom.gov.au/info/vaac/); MIROVA (Middle InfraRed Observation of Volcanic Activity), a collaborative project between the Universities of Turin and Florence (Italy) supported by the Centre for Volcanic Risk of the Italian Civil Protection Department (URL: http://www.mirovaweb.it/); Hawai'i Institute of Geophysics and Planetology (HIGP) - MODVOLC Thermal Alerts System, School of Ocean and Earth Science and Technology (SOEST), Univ. of Hawai'i, 2525 Correa Road, Honolulu, HI 96822, USA (URL: http://modis.higp.hawaii.edu/); Copernicus Browser, Copernicus Data Space Ecosystem, European Space Agency (URL: https://dataspace.copernicus.eu/browser/); Øystein Lund Andersen (URL: https://www.oysteinlundandersen.com/, https://twitter.com/oysteinvolcano).
Ebeko
Russia
50.686°N, 156.014°E; summit elev. 1103 m
All times are local (unless otherwise noted)
Moderate explosive activity with ash plumes continued during June-November 2023
Ebeko, located on the N end of Paramushir Island in Russia’s Kuril Islands just S of the Kamchatka Peninsula, consists of three summit craters along a SSW-NNE line at the northern end of a complex of five volcanic cones. Observed eruptions date back to the late 18th century and have been characterized as small-to-moderate explosions from the summit crater, accompanied by intense fumarolic activity. The current eruptive period began in June 2022, consisting of frequent explosions, ash plumes, and thermal activity (BGVN 47:10, 48:06). This report covers similar activity during June-November 2023, based on information from the Kamchatka Volcanic Eruptions Response Team (KVERT) and satellite data.
Moderate explosive activity continued during June-November 2023 (figures 50 and 51). According to visual data from Severo-Kurilsk, explosions sent ash 2-3.5 km above the summit (3-4.5 km altitude) during most days during June through mid-September. Activity after mid-September was slightly weaker, with ash usually reaching less than 2 km above the summit. According to KVERT the volcano in October and November was, with a few exceptions, either quiet or obscured by clouds that prevented satellite observations. KVERT issued Volcano Observatory Notices for Aviation (VONA) on 8 and 12 June, 13 and 22 July, 3 and 21 August, and 31 October warning of potential aviation hazards from ash plumes drifting 3-15 km from the volcano. Based on satellite data, KVERT reported a persistent thermal anomaly whenever weather clouds permitted viewing.
Geologic Background. The flat-topped summit of the central cone of Ebeko volcano, one of the most active in the Kuril Islands, occupies the northern end of Paramushir Island. Three summit craters located along a SSW-NNE line form Ebeko volcano proper, at the northern end of a complex of five volcanic cones. Blocky lava flows extend west from Ebeko and SE from the neighboring Nezametnyi cone. The eastern part of the southern crater contains strong solfataras and a large boiling spring. The central crater is filled by a lake about 20 m deep whose shores are lined with steaming solfataras; the northern crater lies across a narrow, low barrier from the central crater and contains a small, cold crescentic lake. Historical activity, recorded since the late-18th century, has been restricted to small-to-moderate explosive eruptions from the summit craters. Intense fumarolic activity occurs in the summit craters, on the outer flanks of the cone, and in lateral explosion craters.
Information Contacts: Kamchatka Volcanic Eruptions Response Team (KVERT), Far Eastern Branch, Russian Academy of Sciences, 9 Piip Blvd., Petropavlovsk-Kamchatsky, 683006, Russia (URL: http://www.kscnet.ru/ivs/kvert/).
Search Bulletin Archive by Publication Date
Select a month and year from the drop-downs and click "Show Issue" to have that issue displayed in this tab.
The default month and year is the latest issue available.
Bulletin of the Global Volcanism Network - Volume 37, Number 11 (November 2012)
Managing Editor: Richard Wunderman
Arenal (Costa Rica)
Continued calm with minor gas emissions
Gamalama (Indonesia)
Seismicity precedes small ash-bearing eruptions in September 2012
Kasatochi (United States)
Ramifications of the 7-8 August 2008 eruption
Krakatau (Indonesia)
Many earthquakes and some mild eruptions during October-November 2011
Lengai, Ol Doinyo (Tanzania)
Update on observations and activity during 2011-2012
Machin (Colombia)
Monitoring efforts and intermittent shaking from local earthquakes during 2011-2012
Miyakejima (Japan)
Minor plumes and low seismicity during April 2010-June 2012
Tangkuban Parahu (Indonesia)
Earthquakes and hot gas emissions in August 2012
Arenal (Costa Rica) — November 2012 Cite this Report
Arenal
Costa Rica
10.463°N, 84.703°W; summit elev. 1670 m
All times are local (unless otherwise noted)
Continued calm with minor gas emissions
Since 1968, Arenal experienced periods of moderate-to-robust volcanic activity that continued through September 2010, when activity declined (BGVN 35:07 and 36:04). This report discusses events between December 2010 and October 2012, a period of continued relative tranquility.
Although sporadic Strombolian explosions were reported in December 2010, they soon ceased; since then, no explosions had occurred through as late as October 2012. According to the Observatorio Vulcanologico Sismologica de Costa Rica-Universidad Nacional (OVSICORI), activity was limited to weak gas emissions, primarily through the NE vent in Crater C and through fumaroles in Crater D (figure 113).
During the reporting period, the pH of rain-water gradually increased near the volcano. According to OVSICORI, the gradual decrease in rainfall acidity was associated with reduced magmatic activity.
According to OVSICORI, 2012 was one of the years of lowest activity for Arenal since 1968. No volcano-tectonic earthquakes, volcanic earthquakes, or tremors were recorded during the year, and no magmatic activity was detected. OVSICORI (citing Muller and others, 2011) reported that the Electronic Distance Measurement (EDM) network on the W flank of Arenal showed some subsidence from 2008 to near the end of 2011, but then the rate of subsidence decreased and no deformation occurred in 2012.
In June 2012, OVSICORI reported that night observations and long-exposure photographs of the summit revealed no incandescence. According to OVSICORI, the lack of incandescence indicated that gas emissions were of low temperature (probably <300°C), allowing water vapor to condense rapidly upon contact with the atmosphere. Hydrothermal activity remained low with only a few diffuse fumaroles rising from the N flank of Crater C (figure 113).
According to OVSICORI, an Mw 7.6 earthquake on 5 September 2012 centered on the Nicoya Peninsula (Costa Rica) caused moderate rock avalanches at Arenal, mainly dislodging unstable blocks on the active crater's N and NW rim. However, no changes were noted either in the hot springs around the volcano or in surficial expressions of volcanism.
A special issue of Journal of Volcanology and Geothermal Research was devoted to Arenal volcano (see Reference subsection below).
References. Marsh, B. (ed.), 2006, Arenal volcano, Costa Rica: Magma genesis and volcanological processes, Journal of Volcanology and Geothermal Research, v. 157, issues 1-3.
Muller, C., del Potro, R., Gottsmann, J., Biggs, J., and Van der Laat, R., 2011, Combined GPS, EDM and triangulation surveys of the rapid down-slope motion of the western flank of Arenal Volcano, Costa Rica, American Geophysical Union, Fall Meeting 2011, abstract ## V53C-2639 (Poster).
Geologic Background. Conical Volcán Arenal is the youngest stratovolcano in Costa Rica and one of its most active. The 1670-m-high andesitic volcano towers above the eastern shores of Lake Arenal, which has been enlarged by a hydroelectric project. Arenal lies along a volcanic chain that has migrated to the NW from the late-Pleistocene Los Perdidos lava domes through the Pleistocene-to-Holocene Chato volcano, which contains a 500-m-wide, lake-filled summit crater. The earliest known eruptions of Arenal took place about 7000 years ago, and it was active concurrently with Cerro Chato until the activity of Chato ended about 3500 years ago. Growth of Arenal has been characterized by periodic major explosive eruptions at several-hundred-year intervals and periods of lava effusion that armor the cone. An eruptive period that began with a major explosive eruption in 1968 ended in December 2010; continuous explosive activity accompanied by slow lava effusion and the occasional emission of pyroclastic flows characterized the eruption from vents at the summit and on the upper western flank.
Information Contacts: Observatorio Vulcanologico Sismologica de Costa Rica-Universidad Nacional (OVSICORI-UNA), Apartado 86-3000, Heredia, Costa Rica (URL: http://www.ovsicori.una.ac.cr/); CostaRica21 (URL: http://www.costarica21.com/).
Gamalama (Indonesia) — November 2012 Cite this Report
Gamalama
Indonesia
0.81°N, 127.3322°E; summit elev. 1714 m
All times are local (unless otherwise noted)
Seismicity precedes small ash-bearing eruptions in September 2012
This report discusses a series of small but punctuated eruptions on 15-17 September 2012 associated with the return of seismicity at Gamalama. Fog obscured visibility but ash fell on inhabited areas. The eruptions were judged similar to those seen 4 December 2011 (BGVN 36:12).
As we noted previously, heavy rains after the 4 December 2011 eruptions led to lahars on 27-28 December that killed four people, injured dozens, and displaced thousands (BGVN 36:12). Photos showed that these lahars had carried many meter-diameter blocks into inhabited areas on the lower flanks. Videos from helicopter flights confirmed that in the upslope region, chutes and drainages had also fed finer ash into the lahars.
According to the Center for Volcanology and Geological Hazard Mitigation (CVGHM), on 24 January 2012, after witnessing an interval of generally reduced seismicity, an absence of significant ash-bearing plumes, and weak steam plumes rising only ~100 m above the summit, they lowered the Alert Level from 3 to 2 (on a scale from 1-4).
As geographic background, Gamalama volcano emerges from the sea to form the near-conical 76 km2 Ternate island. The island is situated in the Molucca (Maluku) islands in NE Indonesia about midway between the islands of Borneo and New Guinea (figure 5).
Seismicity and eruptions of September 2012. Significant seismicity and other activity at Gamalama remained low from early 2012 until September. During 1-14 September white plumes were sometimes observed rising ~10 m above the crater. When visibility allowed, these plumes were observed from the local obseratory post at Marikuruba and from the W coast of the island, but fog and clouds generally obscured the view.
The telemetered seismograph system (PS-2) recorded deep volcanic earthquakes, shallow volcanic earthquakes, and local tectonic earthquakes, each occurring fewer than five times during 1-14 September. During that same period, there were 63 long-distance tectonic earthquakes and 42 hot air blasts recorded; once they began, signals interpreted as the hot air blasts amounted to 8 occurrences per day. Visual observations and tremor during this time period appeared similar to this volcano's past behavior.
On 15 September 2012 the following seismic events were recorded: 6 long distance tectonic earthquakes, 9 deep volcanic earthquakes, 2 shallow volcanic earthquakes, 14 hot air blasts accompanied by rumbling sounds, and an interval of tremor began with amplitudes reaching 3-4 mm. Six minutes after the tremor, eruption signals occurred with a maximum amplitude of 40 mm. A phreatic explosion produced ash fall and debris fall. Fog obscured the visibility.
On 16 September 2012, CVGHM reported low-amplitude tremor continuing during 0000-1200 (with 1.5-2.5 mm amplitudes). Medium-to-heavy rain fell at the summit around 1200. At 1358 tremor amplitudes increased to 28 mm, followed 17 min later by a "severe eruption."
That eruption drove an ash-laden plume to ~1 km above the crater. The plume drifted S and SE (figure 6A), and 5 min later ash fell at the observation post. The Alert Level was raised to 3 and visitors and residents were warned not to come within 2.5 km of the crater. CVGHM suggested that the eruption vented at the same location as those of December 2011.
An eruption on 17 September 2012 produced a white-and-gray plume that rose 300 m above the crater and drifted E and SE (figure 6B). Ashfall was reported in the S, SE, and E parts of the island.
Calm prevailed for at least a few weeks after the eruption. Seismicity decreased in early October; on 8 October white plumes rose a mere 10-50 m. The Alert Level was lowered to 2 on 9 October, and the resulting exclusionary zone extended 1.5 km from the crater.
Geologic Background. Gamalama is a near-conical stratovolcano that comprises the entire island of Ternate off the western coast of Halmahera, and is one of Indonesia's most active volcanoes. The island was a major regional center in the Portuguese and Dutch spice trade for several centuries, which contributed to the extensive documentation of activity. Three cones, progressively younger to the north, form the summit. Several maars and vents define a rift zone, parallel to the Halmahera island arc, that cuts the volcano; the S-flank Ngade maar formed after about 14,500–13,000 cal. BP (Faral et al., 2022). Eruptions, recorded frequently since the 16th century, typically originated from the summit craters, although flank eruptions have occurred in 1763, 1770, 1775, and 1962-63.
Information Contacts: Center for Volcanology and Geological Hazard Mitigation (CVGHM), Jl. Diponegoro 57, Bandung, West Java, Indonesia, 40 122 (URL: http://www.vsi.esdm.go.id/); Darwin Volcanic Ash Advisory Centre (VAAC), Bureau of Meteorology, Northern Territory Regional Office, PO Box 40050, Casuarina, NT 0811, Australia (URL: http://www.bom.gov.au/info/vaac/); The Jakarta Post, Jl. Palmerah Barat 142-143, Jakarta 10270, Indonesia (URL: http://www.thejakartapost.com/); Associated Press (AP) (URL: http://www.apimages.com/); USA Today, 7950 Jones Branch Road, McLean, VA 22102 (URL: http://www.usatoday.com/); BBC News (URL: http://www.bbc.co.uk/); United States Department of State - Bureau of Consular Affairs (URL: http://travel.state.gov/); Indonesia Explore (URL: http://indonesiaexplore.com/).
Kasatochi (United States) — November 2012 Cite this Report
Kasatochi
United States
52.177°N, 175.508°W; summit elev. 314 m
All times are local (unless otherwise noted)
Ramifications of the 7-8 August 2008 eruption
Our last report on Kasatochi discussed the eruption of 7-8 August 2008 (BGVN 33:07). Since the 2008 eruption, the volcano has remained quiet except for gas emissions. Erosion and deposition of erupted pyroclastic material are rapidly altering slopes and beaches on the island (Scott and others, 2010). This report highlights studies conducted during 2008-2009 of the uninhabited island. Alaska Volcano Observatory (AVO) still monitors Kasatochi (figure 8) indirectly from the Great Sitkin Island seismic network located 42 km away and from satellite imagery. After the 2008 eruption, and the associated almost total biosystem extinction in 2009, Kasatochi Island became a site for monitoring ecosystem succession.
The terrestrial and surrounding marine environments of Kasatochi Island examined in June and July of 2009 saw changes in abundance or distribution of the ecosystem when compared to patterns observed on earlier surveys conducted in 1996 through June 2008. The largest direct effect of the eruption to individual animals was probably mortality of young birds. Indirect effects on wildlife consisted of the loss of suitable foraging habitats for species that relied on former terrestrial, intertidal, or nearshore-subtidal habitats and the near-total destruction of all former nesting habitats for most species. Although several species attempted to breed in 2009, all except Steller's sea lions failed due to the lack of suitable breeding sites.
The 7-8 August 2008 eruption. One or more of six remote International Monitoring System (IMS) infrasound arrays (figure 9) detected three well-defined eruption pulses of the 7 August 2008 eruption. The first was an infrasonic very long period (IVLP) acoustic pulse (pulse 1) that began at 21:59:44 UTC on 7 August with a gradual onset and duration of ~123 min and a peak RMS pressure of 0.22 Pa. The acoustic origin time was consistent with that computed for seismic signals (22:01 UTC). Pulse 2 began at 01:34:44 UTC on 8 August with a more impulsive onset, a duration of ~59 min and a peak RMS pressure of 0.46 Pa. Pulse 3 started at 04:20:34 on 8 August with an RMS pressure slightly higher than pulse 1 but lower than pulse 2 and a duration of ~33 min.
The formerly steep and rugged island which previously had dense low-growing vegetation similar to other Aleutian Islands (figure 10a), became visibly devoid of vegetation after the 7-8 August 2008 eruption (figure 10b). In brief, the island habitat appeared to have been destroyed.
Table 1 compares physical measurements of the island on 9 April 2004 (4 years prior to the 7-8 August 2008 eruption) to those taken on 17 September 2008 (nearly 6 weeks after the eruption). The aerial extent of the island increased by 40% after the eruption, the crater area increased by 25%, and the lake surface area enlarged by 73%. The accumulation of pyroclastic debris (most visible to the right in figure 10b) resulted in the seaward extension of the entire coastline by about 400 m, thus increasing the diameter of the island by about 800 m.
Table 1. Kasatochi Island's physiographic changes resulting from the 7-8 August 2008 eruption. *Data from 18 April 2009 Quickbird image. Reproduced from Waythomas and others (2010).
| Location |
09 Apr 2004 (pre-eruption) |
17 Sep 2008 (post-eruption) |
Percent change |
| Island area (km2) |
5.0 |
7 |
40 |
| Island perimeter (km) |
10.2 |
10.4 |
2 |
| Crater area (km2) |
1.2 |
1.5* |
25 |
| Lake area (km2) |
0.4 |
1.7* |
73 |
Post-eruption geology - eruptive deposit studies. Waythomas and others (2010) performed tephra studies in summer 2009 and reported that the bulk of the eruptive products from the 2008 eruption were pyroclastic-flow deposits, produced mainly by phreatomagmatic activity. The eruption lasted ~24 hours and included two initial explosive pulses and pauses over a 6-hr period that produced ash-poor eruption clouds, a 10-hr period of continuous ash-rich emissions initiated by an explosive pulse and punctuated by two others, and a final 8-hr period of nearly continuous ash emission and intermittent phreatic and phreatomagmatic activity. The authors reported that the eruption "...resulted in the accumulation of a uniform cover of medium gray-brown fine ash and pyroclastic-surge deposits over all flanks of the volcano. These deposits are 2-3 m thick and consist of silt, fine sand, and granules that are easily eroded by channelized water flows, and turn to sticky muck when wet." The deposits included a basal muddy tephra from eruptions through the shallow crater lake and accidental lithic debris derived from pre-existing lava flows in the crater. The juvenile material, which accounts for about 20-50% of the volume of the deposits, is pumiceous andesite (58-59% SiO2).
Surface erosion on the slopes of Kasatochi volcano determined the transfer of sediment to the marine environment and is largely a function of the local hydrologic conditions. Analysis of satellite images and field studies in 2008 and 2009 have shown that within about one year of the 7-8 August 2008 eruption, significant geomorphic changes associated with surface and coastal erosion occurred (figure 11).
Although technically, sizes of rills and gullies differ, Waythomas and others (2010), using 1 m resolution imagery, could not resolve the size difference; thus they defined both as a narrow, relatively deep, v-shaped or rectangular gully on a hillside formed by flowing water. They observed extensive gully erosion beginning shortly after the eruption and continuing thereafter. Gully erosion removed 300,000 to 600,000 m3 of mostly fine-grained volcanic sediment from the flanks of the volcano, much of which reached the ocean (figure 12).
As seen during the summer of 2009 (Scott and others, 2010), the 2008 volcanic deposits that mantle much of the island mainly consisted of decimeter-thick veneers. Veneers greater than 10 m were found locally on middle-to-upper flanks. Broad aprons and fans up to several tens of meters thick were found along much of the lower flanks below former sea cliffs.
Fans originally extended out to 460 m from the former sea cliffs, but by the summer of 2009, fans on the W, N, and E flanks had been truncated to about half that distance or less by coastal erosion. They terminated in active sea cliffs about 15-20 m high. Fans on the S-side of the island either terminated in low cliffs or, more typically, were buried by post-eruption fans of alluvium and debris-flow deposits or by accreting beach sediments that displaced the shoreline an additional 150-250 m seaward.
Post-eruption habitat - vegetation studies. Talbot and others (2010) searched Kasatochi Island for remnant vegetation and signs of re-vegetation at pre-eruption sampling sites. Plants that apparently survived the eruption dominated early plant communities. The most diverse post-eruption community resembled a widespread pre-eruption community. Figure 13 shows a representative plot containing 11 species assigned to bluff ridge vegetation type that inhabited wave-cut cliffs prior to the eruption. Although this ridge vegetation type is nominally species-poor, in this sampling, the mean-species diversity was generally higher than the other post eruption types (Talbot and others, 2010).
Jewett and others (2010) examined the subtidal zone and reported that algal and faunal communities as well as rocky substrates were buried with volcanic deposits from the Kasatochi 2008 eruption. Existing plants were buried and the former stable rocky habitat was buried well into the subtidal zone. The loss of this rocky habitat may constrain kelp recolonization. However, little information is known regarding ocean current directions and velocities that may ultimately help erode soft-sediments and expose the hard rocky substrates necessary for kelp bed recolonization. Higher trophic marine organisms (for example, phytoplankton, the photosynthesizers that provide energy for a vast number of primary consumers, which in turn provide energy for secondary consumers and decomposers) were also affected by the eruption.
Post-eruption habitat - arthropod studies. A 2009 field campaign recorded 17 post-eruption insect species presumed to be non-breeding survivors and 4-9 breeding species. By 2010, 7 of the species seen in 2009 were lost while 18 post-eruption species survived, most of which were breeding (Ridling, 2012). The arthropod, Agyrtidae: Lyrosoma opacum Mannerheim (figure 14) was found to be the only breeding beetle among the 4-9 species found on post-eruption Kasatochi during the 2009 campaign.
Post-eruption habitat - avian and mammalian studies. Birds have been studied on Kasatochi by the U.S. Fish and Wildlife Service continually since 1996, providing a critical data base to evaluate ecosystem impact and long-term recovery. The pre-eruption avifauna on Kasatochi was dominated by over 200,000 crested and least auklets. Williams and others (2010) determined that most, if not all, of the auklet nesting habitat was covered by the eruption products (figure 15).
The largest direct effect of the eruption on individual animals was likely the mortality of chicks, with an estimated total 20,000-40,000 young birds lost during and shortly after the August 2008 eruption. Drew and others (2010) found that surviving older least auklets around Kasatochi Island showed little change in densities which ranged from 26 to 34 birds per km2. Similar to the least auklet finding, numbers crested auklets were not significantly reduced by the initial explosion. They also returned to attempt breeding in 2009, even though their nesting habitat had been rendered unusable.
Although seven species of birds and mammals attempted to breed in 2009, all but one specie failed due to lack of suitable breeding sites. The one successful breeding specie identified was Steller's sea lions. Williams and others (2010) noted the abundance of sea lions and many seabird species in 2009 was comparable to pre-eruption estimates, suggesting that adult mortality was low for these species. In contrast, shorebirds and passerines, commonly called perching birds, that formerly bred on the island were no longer observed in 2009 and probably perished in the eruption.
Drew and others (2010) also surveyed the marine environment surrounding Kasatochi in June and July of 2009 to document changes, including nutrient abundance, compared to patterns observed in 1996 and 2003. Analysis of SeaWiFS satellite imagery indicated that a large marine chlorophyll-a anomaly may have been the result of ash fertilization during the eruption. Drew and others (2010) found no evidence of continuing marine fertilization from terrestrial runoff 10 months after the eruption.
Post-eruption habitat - volcanic degassing and the landscape. Kasatochi remained quiet except for gas emissions after the 7-8 August 2008 eruption while erosion and deposition have altered the slopes and beaches (figure 16). By April 2009 the level of the crater lake had risen and the lake surface area was 67% larger than it was before the eruption due to an increase in crater diameter (Scott and others, 2010). Fieldwork in summer 2009 determined the locations of various rills and gullies at representative locations on the island. As the gully system on Kasatochi Island began to stabilize and sediment yield declined accordingly, wave action was expected to become the dominant process affecting the landscape (Waythomas and others, 2010).
Post-eruptive landscape - drainage density. As stated by Waythomas and others (2010), "A fundamental landscape property that describes the degree of dissection by gullies and stream channels is drainage density... Drainage density is the ratio of total channel length to drainage-basin area [km/km2]. Changes in drainage density with time indicate that the threshold for erosion by runoff has been exceeded during individual rainfall events, and that the drainage system has yet to reach a state of quasi-equilibrium where routine rainfall events no longer bring about appreciable changes in drainage density. Time-dependent changes in drainage density also are surrogate measures of erosion because an increase in channel length must reflect channel head processes such as landsliding or gullying... Eventually the rates of gully development will decline and drainage density will approach a steady-state value or perhaps decrease. This is commonly due to the stabilizing effects of vegetation growth... We note that prior to the 2008 eruption of Kasatochi, the flanks of the volcano were covered with a nearly continuous mantle of herbaceous tundra, and no surface streams or drainages were present. Thus, prior to the eruption, the drainage density was very low, if not zero, and over time, we expect that the island will return to this condition."
Based on Waythomas and others (2010) and additional satellite image data from years 2008, 2009, and 2011, Julie Herrick calculated two Kasatochi surface drainage parameters: change in drainage density and change in gully volume. These two calculations used vector images to locate gully lines. These lines were superimposed as vectors on the rasterized (bit digitized) images and then a density analysis was performed. Comparisons of the three years by raster calculations (a form of bit analysis) determined the drainage line density as shown in figure 17A. Spatial analysis determined relative increase, decrease and unchanged surface volumes throughout the island as shown in figure 17B.
The recovery of habitats at Kasatochi will depend on erosion of the tephra layer blanketing the island to re-expose former breeding habitats as well as anecdotal introduction of various species.
References. DeGange, A.R., Byrd, G.V., Walker, L.R., and Waythomas, C.F., 2010, Introduction-The Impacts of the 2008 Eruption of Kasatochi Volcano on Terrestrial and Marine Ecosystems in the Aleutian Islands, Alaska, Arctic, Antarctic, and Alpine Research, Vol. 42, No. 3, pp. 245-249.
Drew, G.S., Dragoo, D.E., Renner, M., and Piatt, J.F., 2010, At-sea Observations of Marine Birds and Their Habitats before and after the 2008 Eruption of Kasatochi Volcano, Alaska, Arctic, Antarctic, and Alpine Research, Vol. 42, No. 3, pp. 306-314.
Fee, D., Steffke A., and Garces, M., 2010, Characterization of the 2008 Kasatochi and Okmok eruptions using remote infrasound arrays, Journal of Geophysical Research, 115, D00L10 (DOI: 10.1029/2009JD013621).
Jewett, S.C., Bodkin, J.L., Chenelot, H., Esslinger, G.G., and Hoberg, M.K., 2010, The nearshore Benthic Community of Kasatochi Island, One Year after the 2008 Eruption, Arctic, Antarctic, and Alpine Research, Vol. 42, No. 3, pp. 315-324.
Neal, C.A., McGimsey, R.G., Dixon, J.P., Cameron, C.E., Nuzhdaev, A.A., and Chibisova, M., 2011, 2008 Volcanic activity in Alaska, Kamchatka, and the Kurile Islands: Summary of events and response of the Alaska Volcano Observatory, U.S. Geological Survey Scientific Investigations Report 2010-5243, 94 p.
Ridling, S., 2012, Origins of Post-Eruption Insect Populations on the Volcanic Aleutian Island of Kasatochi (Presentation, URL: www.akentsoc.org/doc/Ridling_S_2012.pptx).
Scott, W.E., Nye, C.J., Waythomas, C.F., and Neal, C.A., 2010, August 2008 Eruption of Kasatochi Volcano, Aleutian Islands, Alaska-Resetting an Island Landscape, Arctic, Antarctic, and Alpine Research, Vol. 42, No. 3, pp. 250-259.
Talbot, S.S., Talbot, S.L., and Walker, L.R., 2010, Post-eruption Legacy Effects and Their Implications for Long-Term Recovery of the Vegetation on Kasatochi Island, Alaska, Arctic, Antarctic, and Alpine Research, Vol. 42, No. 3, pp. 285-296.
Wang, B., Michaelson, G., Ping, C.L., Plumlee, G., and Hageman, P., 2010, Characterization of Pyroclastic Deposits and Pre-eruptive Soils following the 2008 Eruption of Kasatochi Island Volcano, Alaska, Arctic, Antarctic, and Alpine Research, Vol. 42, No. 3, pp. 276-284.
Waythomas, C.F., Scott, W.E., and Nye, C.J., 2010, The Geomorphology of an Aleutian Volcano following a Major Eruption: the 7-8 August 2008 Eruption of Kasatochi Volcano, Alaska, and Its Aftermath, Arctic, Antarctic, and Alpine Research, Vol. 42, No. 3, pp. 260-275.
Williams, J.C., Drummond, B.A., and Buxton, R.T., 2010, Initial effects of the August 2008 volcanic eruption on breeding birds and marine mammals at Kasatochi Island, Alaska, Arctic, Antarctic, and Alpine Research, Vol. 42, No. 3, pp. 306-314.
Geologic Background. Located at the northern end of a shallow submarine ridge trending perpendicular to the Aleutian arc, Kasatochi is small 2.7 x 3.3 km island volcano with a 750-m-wide summit crater lake. The summit reaches only about 300 m elevation, and the lake surface lies less than about 60 m above the sea. A lava dome is located on the NW flank at about 150 m elevation. The asymmetrical island is steeper on the northern side than the southern, and the crater lies north of the center of the island. Reports of activity from the heavily eroded Koniuji volcano to the east probably refer to eruptions from Kasatochi. A lava flow may have been emplaced during the first recorded eruption in 1760. A major explosive eruption in 2008 produced pyroclastic flows and surges that swept into the sea, extending the island's shoreline.
Information Contacts: Alaska Volcano Observatory (AVO), a cooperative program of the U.S. Geological Survey, 4200 University Drive, Anchorage, AK 99508-4667, USA; Geophysical Institute, University of Alaska, PO Box 757320, Fairbanks, AK 99775-7320, USA; and Alaska Division of Geological & Geophysical Surveys, 794 University Ave., Suite 200, Fairbanks, AK 99709, USA (URL: http://www.avo.alaska.edu/); Julie Herrick, Global Volcanism Program, Smithsonian National Museum of Natural History, Washington, DC 20560.
Krakatau (Indonesia) — November 2012 Cite this Report
Krakatau
Indonesia
6.1009°S, 105.4233°E; summit elev. 285 m
All times are local (unless otherwise noted)
Many earthquakes and some mild eruptions during October-November 2011
Our previous report (BGVN 36:08) discussed two eruption episodes: one from 25 October 2010 to March 2011, and another from August 2011 to about 1 October 2011. During the last two weeks of September 2011, the volcano produced persistent volcanic earthquake swarms and thin emissions (BGVN 36:08). This report discusses two visits to the volcano in 2011. Scientists that visited on 8 October 2011 reported degassing and an ongoing seismic swarm then consisting chiefly of M ~1 and smaller earthquakes. During 12-13 November 2011 a photographer noted steady degassing, then observed the start of a 12-hour interval of minor but repeated Stombolian eruptions (see next section).
2011 visits by Øystein Lund Andersen. The photographer and guide Øystein Lund Andersen lives in Jakarta, Indonesia and visits Anak Krakatau often. His website... shows one photo of a seismograph at CVGHM's Pasauran Observatory recording part of a prolonged swarm of small earthquakes from 8 October 2011; Youtube features a video he took on the same subject.
His visit... during 12-13 November 2011 took place during an interval of gas emissions devoid of ash. He stayed up all night to observe Anak Krakatau emit a steady, white, ash-free plume. At dusk on 12 November he noticed that the crater glowed bright red and after a few hours a series of mild Strombolian eruptions occurred in a sequence that lasted 12 hours (figure 29). The time between the eruptions was from 30 seconds to a few minutes. Some of Andersen's photos captured glowing pyroclasts arcing tens of meters above the crater rim (figure 29b, c). Andersen saw ash lava bombs in the plume during these eruptions. He noted that the lava bombs ejected over the crater mainly fell back into the crater. During the night the crater remained almost constantly illuminated by the glowing bombs and the fragments they created when they landed. The eruptions were often accompanied by loud sounds from the volcano.
References. Lockwood, J. and Hazlett, R.W., 2010, Volcanoes: global perspectives. Wiley-Blackwell.
Simkin, T. and Fiske, R.S., 1983, Krakatau, 1883--the volcanic eruption and its effects, Smithsonian Institution Press.
Self, S., Rampino, M.R., 1981, The 1883 eruption of Krakatau, Nature, 294, pp. 699-704.
Geologic Background. The renowned Krakatau (frequently mis-named as Krakatoa) volcano lies in the Sunda Strait between Java and Sumatra. Collapse of an older edifice, perhaps in 416 or 535 CE, formed a 7-km-wide caldera. Remnants of that volcano are preserved in Verlaten and Lang Islands; subsequently the Rakata, Danan, and Perbuwatan cones were formed, coalescing to create the pre-1883 Krakatau Island. Caldera collapse during the catastrophic 1883 eruption destroyed Danan and Perbuwatan, and left only a remnant of Rakata. This eruption caused more than 36,000 fatalities, most as a result of tsunamis that swept the adjacent coastlines of Sumatra and Java. Pyroclastic surges traveled 40 km across the Sunda Strait and reached the Sumatra coast. After a quiescence of less than a half century, the post-collapse cone of Anak Krakatau (Child of Krakatau) was constructed within the 1883 caldera at a point between the former Danan and Perbuwatan cones. Anak Krakatau has been the site of frequent eruptions since 1927.
Information Contacts: Center of Volcanology and Geological Hazard Mitigation (CVGHM), Jalan Diponegoro 57, Bandung 40122, Indonesia (URL: http://www.vsi.esdm.go.id/); Øystein Lund Andersen (URL: http://www.oysteinlundandersen.com/).
Ol Doinyo Lengai (Tanzania) — November 2012 Cite this Report
Ol Doinyo Lengai
Tanzania
2.764°S, 35.914°E; summit elev. 2962 m
All times are local (unless otherwise noted)
Update on observations and activity during 2011-2012
Ol Doinyo Lengai, located close to the N border of Tanzania (figure 153), is both accessible and monitored closely.
Frederick Belton's Ol Doinyo Lengai web site has provided many interesting photos from the expeditions that he has taken to the volcano since his initial visit in 1997, including annual visits until 2006, followed by his last expedition in 2008. In addition, Belton has included in his web site observations, photographs, and other graphics provided by many visitors to Ol Doinyo Lengai; these descripions have been the primary source of reports found in the Bulletin. Recently, Belton informed Bulletin editors that he rarely gets any updates on visits to Ol Doinyo Lengai for his web site, but he did receive one in September 2012. Bulletin editors wrote to a number of past contributors to BGVN; some of their comments are included below.
Belton's web site reported that Frank Möckel and Wendy Blank visited Ol Doinyo Lengai's summit area (figure 154) in September 2012. They climbed the volcano during 14-15 September and camped in the S Crater during the nights of 15 and 16 September (figure 155). Figures 155-160 contain some views they captured at the summit of the volcano. Figures 157 and 158 show what appear to be active spatter cones inside the N Crater. According to Belton, the activity looks very typical of the type frequently seen prior to the last explosive eruption in 2007-2008 (BGVN 32:11). Möckel and Blank reported that on the bottom of the active N Crater they saw fresh black natrocarbonatite lava and active vents, and they heard boiling noises from the bottom of the N Crater. They reported a strong smell of hydrogen sulfide (H2S) everywhere in the area.
Abigail Church, who studied Ol Doinyo Lengai for her PhD dissertation in 1996 and has published several articles on the petrogensis of the natrocarbonatite lavas, now lives in Nairobi, Kenya, and regularly flies over Ol Doinyo Lengai in chartered aircraft. She has flown over and landed on Ol Doinyo Lengai in a helicopter probably 5 times in the last few years. She camped close to the volcano in November 2012 and flew around the summit, however, it was cloudy. On many occasions when she was able to see into the crater, she observed what appeared to be small-scale activity continuing in the base of the deep pit. There are normally 1 or 2 active vents in which one can see very dark material which she assumed was fresh natrocarbonatite lava. She also has good contacts with people in the area and with pilots who fly the routes between Arusha and the Serengeti. On recent flights over Ol Doinyo Lengai, Church has observed that the sides of the central crater within the N Crater are collapsing inwardly, reducing the depth of the crater hole, and that small scale activity in the crater continues. Figures 161-165 show some photographs from 2011 and 2012 of the inside of Ol Doinyo Lengai's N crater.
Hannes Mattsson reported to Bulletin staff that he has 3 PhD projects running on different aspects of Ol Doinyo Lengai volcanism, but he has not been at the volcano for about 1.5 years. He is planning a 6-week field campaign scheduled in mid 2013. He noted that very little current or recent information on Ol Doinyo Lengai is currently available.
Joerg Keller also noted that there are not many recent reports about activity in the crater area. According to reports of Möckel's visit in February 2010 (BGVN 35:05), the access route to and from Ol Doinyo Lengai's summit seems much more difficult to negotiate than before the 2007 eruption. Keller believes that another possible factor leading to less observations of Ol Doinyo Lengai is the change in the crater formations since the eruption of 2007. There seems to be little change since 2008, a stable situation with the new ash cone dominating the entire N crater area completely (see figures in BGVN 32:11 and 33:02, as well as the above photos). The unique crater landscape seen before 2007, with accessible hornitos and lava flows of different ages, and the chance to see active spatter cones, lava pools and flowing lava, was an attraction to visiters. The logistical problems for visiting and climbing the volcano since 2008, incluing safety and political factors, have resulted in greatly diminished numbers of visitors.
Keller reported that Elias Danner, a teenage photographer, filmer, and designer, started Ol Doinyo Lengai photo documentation that shows the ash cone, its deep pit, and, in particular, looks inside the pit with fresh, overlapping lava lobes and vigorously boiling lava pools. Keller received from Danner a video of the boiling lava pools which was so typical and so impressive that he wrote in a recent paper (Keller and Zaitsev, 2012) the following: "The present vertically sided, almost 100 m deep pit crater formed by the 2007-2008 explosive activity is inaccessible. However, since 2008 frequent overflights and reports and photographs by visitors climbing the mountain (Belton, 2012) suggest that new natrocarbonatite effusions are occurring at the bottom of the deep pit. This is indicated from a distance by the typical morphological features of natrocarbonatite appearing as small hornitos and gray pahoehoe flows on the floor of the crater. On 26th June 2011, Elias Danner ... filmed a vigorously boiling and splashing, obviously carbonatitic lava pool at the bottom of the pit, with features very reminiscent of Figs. 5 and 6 in Keller and Krafft (1990)."
MODIS/MODVOLC Satellite Thermal Alerts. Table 26 gives an update of MODVOLC satellite thermal alerts at the Ol Doinyo Lengai summit since a similar update found in BGVN 33:06. It is not uncommon to find thermal alerts down and beyond the sides of the volcano, probably caused by fires. It is possible that fewer thermal alerts are measured by the MODIS satellites because the current deep crater (since the 2007-2008 eruptions) shields some of the hotter areas from the satellite sensors.
Table 26. MODVOLC thermal alerts measured at Ol Doinyo Lengai from 3 April 2008 to December 2012. Courtesy of the Hawai`i Institute of Geophysics and Planetology (HIGP) Thermal Alerts System.
| Date |
Time (UTC) |
Number of pixels |
MODIS Satellite |
| 03 Apr 2008 |
2325 |
1 |
Aqua |
| 13 Dec 2008 |
2005 |
1 |
Terra |
| 13 Nov 2010 |
0810 |
1 (N side of crater) |
Terra |
| 02 Oct 2011 |
1135 |
2 (N side of crater) |
Aqua |
| 02 Oct 2011 |
1925 |
2 (N side of crater) |
Terra |
| 22 Jun 2012 |
0750 |
4 (S side of crater) |
Terra |
References. Belton, F., 2012, Oldoinyo Lengai, The Mountain of God (URL: www.oldoinyolengai.pbworks.com).
Keller, J., and Krafft, M., 1990, Effusive natrocarbonatite activity of Oldoinyo Lengai, June 1988, Bulletin of Volcanology v. 52, pp. 629-645.
Keller, J., and Zaitsev, A.N., 2012, Geochemistry and petrogenetic significance of natrocarbonatites at Oldoinyo Lengai, Tanzania: Composition of lavas from 1988 to 2007, Lithos, v.148, pp. 45-53.
Sherrod, D., Mollel, K., and Nantatwa, O., 2010, Oldoinyo Lengai: Trip Report, March 12-14, 2010, informal report (URL: http:/Sherrod_OldonyoLengai_March12_20106-1.pdf).
Geologic Background. The symmetrical Ol Doinyo Lengai is the only volcano known to have erupted carbonatite tephras and lavas in historical time. The prominent stratovolcano, known to the Maasai as "The Mountain of God," rises abruptly above the broad plain south of Lake Natron in the Gregory Rift Valley. The cone-building stage ended about 15,000 years ago and was followed by periodic ejection of natrocarbonatitic and nephelinite tephra during the Holocene. Historical eruptions have consisted of smaller tephra ejections and emission of numerous natrocarbonatitic lava flows on the floor of the summit crater and occasionally down the upper flanks. The depth and morphology of the northern crater have changed dramatically during the course of historical eruptions, ranging from steep crater walls about 200 m deep in the mid-20th century to shallow platforms mostly filling the crater. Long-term lava effusion in the summit crater beginning in 1983 had by the turn of the century mostly filled the northern crater; by late 1998 lava had begun overflowing the crater rim.
Information Contacts: Frederick Belton, University Studies Department, Middle Tennessee State University, Murfreesboro, TN (URL: http://oldoinyolengai.pbworks.com/); Sonja Bosshard, Institute of Geochemistry and Petrology, Swiss Federal Institute of Technology Zürich (ETH Zürich), Zürich, Switzerland; Laura Carmody, Planetary Geoscience Institute, Department of Earth and Planetary Sciences, University of Tennessee, Knoxville, TN; Abigail Church, The Ker & Downey Safari Tradition, P.O. Box 86, Karen 00502, Kenya; Elias Danner, Elias Danner Productions (URL: http://www.mammut-studios.com/); Joerg Keller, Institut für Geowissenschaften/Mineralogie-Geochemie, Universität Freiburg, Albertstrasse 23b, 79104 Freiburg, Germany; Hannes B. Mattsson, Institute of Geochemistry and Petrology, Swiss Federal Institute of Technology Zürich (ETH Zürich), Zürich, Switzerland; Frank Möckel; Celia Nyamweru, St. Lawrence University; David Sherrod, Cascades Volcano Observatory (CVO), U.S. Geological Survey, Vancouver, WA (URL: https://volcanoes.usgs.gov/observatories/cvo/); Christoph Weber, Volcano Expeditions International (VEI), Muehlweg 11, 74199 Untergruppenbach, Germany (URL: http://www.v-e-i.de/); Ben Wilhelmi, commercial pilot (URL: http://benwilhelmi.typepad.com/benwilhelmi/).
Machin (Colombia) — November 2012 Cite this Report
Machin
Colombia
4.487°N, 75.389°W; summit elev. 2749 m
All times are local (unless otherwise noted)
Monitoring efforts and intermittent shaking from local earthquakes during 2011-2012
Elevated seismicity during January 2011 was discussed in our last report on Cerro Machín volcano (BGVN 36:04). Between September 2010 and January 2011, more than 800 volcano-tectonic (VT) earthquakes were detected per month and local residents reported shaking from these events, particularly during November 2010-February 2011. Here we describe trends in seismicity at Machín from January 2011 to November 2012 and the frequency of seismic swarms. We also include descriptions of monitoring efforts by the Volcanic and Seismological Observatory of Manizales at the Colombia Institute of Geology and Mining (INGEOMINAS) including two field campaigns focused on CO2 emissions from the crater.
Geophysical monitoring. Since January 2011, INGEOMINAS had been monitoring Cerro Machín with a network that included broadband and short-period seismometers, magnetometers, self potential, and an acoustic monitoring system (acoustic flow detection for early flood warning). The deformation network included electronic and dry tilt (longterm monitoring since 2005), and starting in November 2012, three GPS stations were also operating (figure 4). Electronic-distance measurements (EDM) were conducted in 2012 at seven stations (EDM data was available since 2008). Data from these monitoring efforts were available in the INGEOMINAS online technical reports.
Geochemical monitoring. Geochemical monitoring at Cerro Machín has been conducted within the circular crater and the central dome complex (figures 5 and 6). During 2011-2012, geochemical monitoring included diffuse CO2 detection, alkaline traps, and radon monitoring from soil emissions (13 stations were online in November 2012) as well as regular testing at fumarolic and hot spring locations.
In May and September 2012, INGEOMINAS conducted field surveys to measure diffuse carbon dioxide emissions (figure 7). With a mobile LICOR 820 monitoring device, INGEOMINAS technicians traversed the interior crater rim detecting CO2, air temperature, and pressure. The survey on 28 May determined baseline levels of CO2 flux at 28 points within the crater. The survey conducted during 19 and 20 September 2012 detected relatively high CO2 emissions from seven locations along a traverse within the crater. The highest CO2 fluxes ranged between 739 and 8,077 mol·m-2·day-1, and in their technical report, INGEOMINAS noted that future gas monitoring should focus on those sites with peak values.
Seismicity in 2011. Elevated seismicity in late 2010 continued through early 2011 (BGVN 36:04) and local communities reported shaking in January and February 2011 (figure 8). For many months after May 2011, earthquakes per month had declined to below 400 per month. The clear exception to that trend took place during September 2011, a month with over 1,200 earthquakes.
Compared with 2010 activity, fewer seismic swarms were detected in 2011 and in the available record for 2012 (table 2). In 2011, swarms tended to cluster beneath the dome complex and in areas ~2 km S and SE. INGEOMINAS frequently noted earthquake epicenters in an area known as Moralito, a location SE of the volcano near the MRAL GPS station (see figure 4). Deeper earthquakes (frequently at depths between 7 and 18 km) were detected in that region and were attributed to displacements along a fault zone.
Table 2. Seismic swarms detected at Machín during 2010-2012. Days were counted and tallied based on whether one or more swarms occurred. For example, during January-February 2010 there were six swarms recorded. Courtesy of INGEOMINAS.
| Time Period |
Days with swarms |
| Jan-Feb 2010 |
6 |
| Mar 2010 |
1 |
| Apr-Jun 2010 |
8 |
| Jul-Dec 2010 |
27 |
| Jan-May 2011 |
14 |
| Aug 2011 |
1 |
| Jan-Apr 2012 |
4 |
| Sep-Oct 2012 |
6 |
Local residents felt shaking from earthquakes in September 2011 when six occurred with magnitudes greater than 2.5. INGEOMINAS reported that this month had the largest combined free-energy release that year. The largest magnitude event of that group was an M 3.6 volcano-tectonic (VT) earthquake detected at 2013 on 12 September. The average depth of the earthquakes was 4.5 km with some events as deep as 13 km. Epicenters were primarily clustered in the area of Moralito (near the MORA seismic station, see figure 9).
In December 2011, INGEOMINAS reported that rockfall-type seismic signals were detected within the area. A total of 19 signatures were counted on 11 December; some events had durations up to 73 seconds. The largest earthquake that month was an M 2.32 that occurred at 0542 on 1 December.
Seismicity from January to November 2012. Rockfall-type signatures were also recorded in January 2012. These events occurred on 10 January at 1556 and lasted up to 64 seconds. As frequently observed during previous months, VT earthquakes tended to occur beneath the dome, S, and SE in the area of Moralito.
From January to August 2012, seismic swarms occurred intermittently (table 2). Elevated seismicity occurred during April 2012 and was felt by local residents. During this time period, the largest earthquake was an M 2.8 VT detected on 11 April at 0655. In April, VT earthquakes clustered ~1 km S of the dome complex and were ~4 km deep.
During May-August 2012, earthquakes were rarely clustered and occurred at a wide range of depths (0-16 km). In August, several earthquakes were located ~8 km SE of the CIMA station at depths between 12-15 km. The largest earthquake that month was an M 1.45 detected at 2026 on 9 August.
During September-October, seismic swarms occurred on six days (table 2). Local residents in the municipalities of Cajamarca and Ibagué (locations appear in figure 2 of BGVN 36:04) as well as the nearby departments of Quindio, Risaralda, and Caldas reported shaking due to these earthquakes (locations of these districts appear in the regional map of figure 5 in this report). These events were clustered beneath the dome complex at depths between 2 and 5 km. In October, however, relatively large earthquakes were detected in an area ~8 km SE of the dome at depths around 13 km. The largest earthquakes were on 9 September (M 3.6) and on 7 October (M 4.6) prompting INGEOMINAS staff to visit residences and investigate the impact of the events (figure 10). The M 4.6 earthquake was one of several located SE of the dome (near the TAPI seismic station, see figure 9).
In November, INGEOMINAS reported that VT earthquakes continued to occur beneath the dome although at a reduced rate compared to October. Earthquakes tended to occur 2-5 km beneath the dome, and deeper events were detected to the SE at depths between 9 and 15 km. The largest earthquake detected was an M 2.8 on 20 November at 1754. This earthquake was located at a depth of 2.75 km and was ~2 km SW of the dome complex.
Geologic Background. The small Cerro Machín stratovolcano lies at the southern end of the Ruiz-Tolima massif about 20 km WNW of the city of Ibagué. A 3-km-wide caldera is breached to the south and contains three forested dacitic lava domes. Voluminous pyroclastic flows traveled up to 40 km away during eruptions in the mid-to-late Holocene, perhaps associated with formation of the caldera. Late-Holocene eruptions produced dacitic block-and-ash flows that traveled through the breach in the caldera rim to the west and south. The latest known eruption of took place about 800 years ago.
Information Contacts: Instituto Colombiano de Geologia y Mineria (INGEOMINAS), Observatorio Vulcanológico y Sismológico de Manizales, Manizales, Colombia (URL: https://www2.sgc.gov.co/volcanes/index.html).
Miyakejima (Japan) — November 2012 Cite this Report
Miyakejima
Japan
34.094°N, 139.526°E; summit elev. 775 m
All times are local (unless otherwise noted)
Minor plumes and low seismicity during April 2010-June 2012
During April 2010-June 2012 the Japan Meteorological Agency (JMA) maintained the hazard status for Miyake-jima at Alert Level 2, where it had stood since 31 March 2008. Our last report (BGVN 34:06) mentioned a minor eruption at Miyake-jima on 1 April 2009 which produced an ash plume that rose ~600 m above the crater. Since that time, activity was relatively low with up to four minor eruptions occurring during April-July 2010, as reported by the Tokyo Volcanic Ash Advisory Center (VAAC) based on information from JMA.
Eruptions occurred on 11 April, 4 July (two possible eruptions during the early morning), and 21 July 2010; the 21 July eruption was the only eruption for which the Tokyo VAAC issued an altitude and drift direction for the plume (~1.2 km altitude with E drift; table 5). The eruptions were characterized by gas and steam emissions lacking significant ash content (e.g. figure 23).
Table 5. Summary of detailed activity reports for Miyakejima during April 2010-June 2012; '--' indicates data not reported. Courtesy of JMA and Tokyo VAAC.
| Month |
Gas-and-steam plume heights (m above crater rim) |
SO2 flux (metric tons/day) |
Remarks |
| Apr 2010 |
-- |
-- |
11 Apr: Based on information from JMA, Tokyo VAAC reported an eruption at 0840. |
| Jul 2010 |
-- |
-- |
4 Jul: Based on information from JMA, Tokyo VAAC reported possible eruptions at 1019 and 1434. |
| Jul 2010 |
400 |
-- |
21 Jul: Based on information from JMA, Tokyo VAAC reported an eruption at 0928 that produced a plume which rose to an altitude of ~1.2 km (400 m above the crater) and drifted E. |
| Oct 2010 |
100-400 |
500-1,600 |
-- |
| Nov 2010 |
100-400 |
500-1,600 |
Short duration tremor on 11 and 25 November not accompanied by air-shocks or plume changes. |
| Dec 2010 |
100-400 |
500-900 |
-- |
| Jan 2011 |
100-600 |
800-1,000 |
-- |
| Feb 2011 |
100-400 |
1,000 |
-- |
| Mar 2011 |
100-500 |
600-1,100 |
GPS showed continuous deflation from a shallow source. |
| Apr 2011 |
100-500 |
700 |
-- |
| May 2011 |
100-400 |
600-900 |
-- |
| Jun 2011 |
100-300 |
600 |
Low seismicity except for 6 June. Hypocenters located just beneath summit crater. No tremor observed. |
| Jul 2011 |
200-400 |
500 |
Low seismicity centered just beneath summit crater. No tremor observed. |
| Aug 2011 |
200-500 |
800-1,000 |
Low seismicity with small amplitude, short-duration tremor (~80-90 sec); two increases observed on 18 and 27 Aug. Hypocenters located just beneath summit crater. |
| Sep 2011 |
100-600 |
900 |
Low seismicity centered just beneath summit crater. Banded tremor every 20 min. began 23 Sep and continued with smaller amplitudes into Oct. |
| Oct 2011 |
100-400 |
700-900 |
Low seismicity centered just beneath summit crater. Continuing banded tremor from Sep ceased on 28 Oct. |
| Nov 2011 |
100-300 |
500-800 |
Low seismicity centered just beneath summit crater. Volcanic tremor with small amplitude and short duration (~60 sec) occurred on 12 Nov at 0252; however, no infrasonic signal or ashfall was observed. |
| Dec 2011 |
100-300 |
1,100 |
Low seismicity centered just beneath summit crater. No tremor was observed. |
| Jan 2012 |
100-400 |
900-1,200 |
Low seismicity centered just beneath summit crater. Five episodes of volcanic tremor with small amplitude and short duration (~40-100 sec) occurred on 18, 22 and 30 Jan. |
| Feb 2012 |
100-400 |
900 |
Low seismicity centered just beneath summit crater. |
| Mar 2012 |
100-300 |
600-900 |
Aerial observations on 7 Mar revealed high temperature areas located on summit crater's S wall as previously seen in Jan 2010. Low seismicity centered just beneath summit crater; no tremor observed. |
| Apr 2012 |
100-300 |
500-700 |
Low seismicity centered just beneath summit crater; no tremor observed. |
| May 2012 |
100-300 |
400 |
Low seismicity centered just beneath summit crater; no tremor observed. |
| Jun 2012 |
100-200 |
-- |
A relatively large A-type earthquake with its hypocenter located around the crater occurred at 0940 on 28 Jun. A seismic intensity of 1 was detected at Miyakejima-Kamitsuki. No tremor observed. |
JMA reported low levels of seismicity centered just beneath the crater during the reporting interval. Occasional episodes of volcanic tremor occurred, but were not correlated with other data indicating emissions or eruptions (table 5). Sources in Miyakemura village reported that high SO2 concentrations were occasionally detected in some inhabited flank areas.
GPS data revealed contraction in some parts of the edifice, a process that, although diminishing, had continued since 2000. Over the same time period, long-term extension of the baseline along the N-S section of Miyake-jima had been observed since 2006, indicating inflation in deeper portions of the volcano.
Geologic Background. The circular, 8-km-wide island of Miyakejima forms a low-angle stratovolcano that rises about 1,100 m from the sea floor in the northern Izu Islands about 200 km SSW of Tokyo. The basaltic volcano is truncated by small summit calderas, one of which, 3.5 km wide, was formed during a major eruption about 2,500 years ago. Numerous craters and vents, including maars near the coast and radially oriented fissure vents, are present on the flanks. Frequent eruptions have been recorded since 1085 CE at vents ranging from the summit to below sea level, causing much damage on this small populated island. After a three-century-long hiatus ending in 1469 CE, activity has been dominated by flank fissure eruptions sometimes accompanied by minor summit eruptions. A 1.6-km-wide summit crater was slowly formed by subsidence during an eruption in 2000.
Information Contacts: Japan Meteorological Agency (JMA), Otemachi, 1-3-4, Chiyoda-ku Tokyo 100-8122, Japan (URL: http://www.jma.go.jp/); Tokyo Volcanic Ash Advisory Center (VAAC), Tokyo, Japan (URL: http://ds.data.jma.go.jp/svd/vaac/data/).
Tangkuban Parahu (Indonesia) — November 2012 Cite this Report
Tangkuban Parahu
Indonesia
6.77°S, 107.6°E; summit elev. 2084 m
All times are local (unless otherwise noted)
Earthquakes and hot gas emissions in August 2012
Our most recent report on Tangkubanparahu (also known as Tangkuban Perahu) described increased seismicity during April 2005, consisting primarily of volcanic earthquakes and tremor (BGVN 30:12). This report describes elevated seismicity during August-September 2012. The Center of Volcanology and Geological Hazard Mitigation (CVGHM) notes that at least three magmatic eruptions and four phreatic eruptions had occurred at Ratu Crater, the most active vent, during 1829-1994. Ratu Crater is about 30 km N of Bandung in W Java. Figure 1 indicates the general location of the volcano.
The next report we received on Tangkubanparahu described activity starting in August 2012. According to CVGHM, the frequency of earthquakes and tremor increased on both 13 and 23 August. Around this time, hot blasts of sulfuric gases, white in color, rose from Ratu Crater to heights of 50-400 m above the crater's floor. CVGHM reported that the temperature of emissions from Ratu Crater on 24 August was 246°C, compared to a measurement of 111°C on 18 August. On 23 August, the Alert Level was raised to 2 (on a scale of 1-4), and visitors and residents were prohibited within a 1.5-km radius of the active crater.
Seismic activity declined on 23 August; shallow volcanic earthquakes continued to be recorded but were less frequent through 21 September (table 2 provides data through 20 September). Hypocenters of volcanic tremors during this period were located beneath an area W of Ratu Crater at depths of 4-12 km. Soil temperatures at Ratu Crater were 30.5°C on 26 August, then were 35°C on 30 August, but then gradually declined during 31 August-21 September to ~34°C.
Table 2. Type and occurrence of earthquakes at Tangkubanparahu between 24 August and 20 September 2012. Courtesy of CVGHM.
| Date |
Shallow Volcanic |
Deep Volcanic |
Distant Tectonic |
Local Tectonic |
Air Blast |
Tremor episodes (amplitude; duration) |
| 24 Aug-30 Aug 2012 |
76 |
11 |
1 |
2 |
-- |
1 (3-16 mm; 8,100 sec.) |
| 31 Aug-06 Sep 2012 |
66 |
12 |
8 |
3 |
19 |
3 (1-30 mm; 60-18,000 sec.) |
| 07 Sep-13 Sep 2012 |
42 |
6 |
3 |
2 |
53 |
7 (1-10 mm; 63-1,842 sec.) |
| 14 Sep-20 Sep 2012 |
27 |
19 |
13 |
4 |
33 |
5 (5-14 mm; 171-600 sec.) |
Between 5-11 September, sulfur dioxide gas emissions were elevated in an area NW of the crater associated with the plume, but in the latter part of September 2012 concentrations averaged4in Ratu Crater increased from 0.11 in December 2011 to ~4 on 24 August 2012 and remained at that level on 11 September 2012, which suggested to CVGHM that hot fluid was rising to the surface.
Based on seismicity, visual observations, deformation data, gas measurements, and soil and crater lake water temperatures, the Alert Level was lowered to 1 on 21 September 2012.
The eruptive history of Tangkubanparahu was described by Kartadinata and others (2002).
Reference. Kartadinata, M., Okuno, M., Nakamura, T., and Kobayashi, T., 2002, Eruptive history of Tangkuban Perahu volcano, West Java, Indonesia: A preliminary report, Journal of Geography, v. 111, issue 3, p. 404-409.
Geologic Background. Gunung Tangkuban Parahu is a broad stratovolcano overlooking Indonesia's former capital city of Bandung. The volcano was constructed within the 6 x 8 km Pleistocene Sunda caldera, which formed about 190,000 years ago. The volcano's low profile is the subject of legends referring to the mountain of the "upturned boat." The Sunda caldera rim forms a prominent ridge on the western side; elsewhere the rim is largely buried by deposits of the current volcano. The dominantly small phreatic eruptions recorded since the 19th century have originated from several nested craters within an elliptical 1 x 1.5 km summit depression.
Information Contacts: Center of Volcanology and Geological Hazard Mitigation (CVGHM), Jalan Diponegoro 57, Bandung 40122, Indonesia (URL: http://www.vsi.esdm.go.id/).