
The RVO reported that during 28 September-24 October, seismic activity in the Sulu Range declined. Vapor plumes that were emitted from the Silanga Hotsprings were visible about 20 km NE from Bialla. A moderately strong sulfur smell from the Silanga and Talopu hot springs continued to be reported.
Source: Rabaul Volcano Observatory (RVO)
Non-eruptive, but geysers and indications of a shallow dike intrusion
New and revised information has emerged regarding the behavior of the Sulu Range (Johnson, 1971), a volcanic field adjacent to and immediately E of Walo hot springs along the coast in the N-central part of New Britain Island (BGVN 31:07 and 31:09; figure 3). Initial Rabaul Volcanological Observatory (RVO) reports mentioned apparent steam and ash emission during mid-July 2006, but although weak-to-moderate vapor emission occured, and a later section of this report discusses heightened hot spring activity, the reported "forceful dark emissions" have been instead linked to dust during mass wasting.
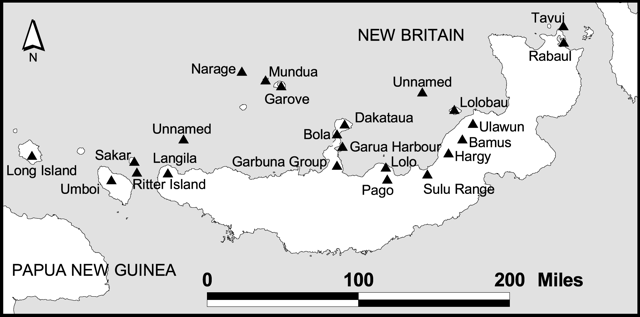 |
Figure 3. A sketch map of New Britain island showing a small portion of the main island of Papua New Guinea (lower left) and New Ireland (upper right). Volcanoes on or adjacent New Britain are labeled. Volcanoes active and erupting frequently in the last decade include (from the SW) Langila, Ulawun, and Rabaul. Volcanoes that have erupted or undergone anomalous unrest in the past few years include (from the SW) Ritter Island, the Garbuna group, Pago, Sulu Range, and Bamus. |
In a 12 April Email message, Steve Saunders clarified the latest RVO views on Sulu's behavior. He noted that ". . . Sulu did not erupt! It was purely a series of seismic cris[es]. The 'emissions' which were reported before we got there turned out to be dust from landslides."
Unusually vigorous hot springs, declining seismicity. Following the first two weeks of unrest during mid-July at Sulu Range, an RVO report discussing 31 July to 2 August activity stated that area hot springs such as those at Walo were undergoing unusually strong activity. This included expelled mud, the emergence of geysers, and abnormal quantities of steam.
RVO noted waning seismicity in late July. Seismicity had declined to relatively low levels, although small volcano-tectonic events continued to be recorded. The small earthquakes were centered around the settlements of Silanga, Sege, and Sale (figure 4; respectively, from Mt.Ruckenberg's summit, located 12.7 km to the SW; 7.2 km SW, and 5.5 km S). The 31 July to 2 August earthquakes were described as more irregular and less frequent than those in preceeding weeks.
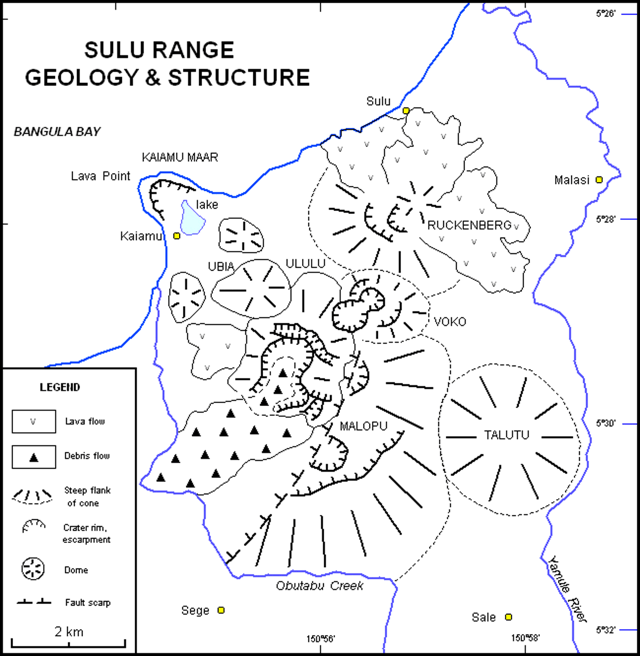 |
Figure 4. Geological map showing the cluster of overlapping cones of the Sulu Range. Walo village lies just off the map near the coast within a few kilometers of the map 's W margin. The thermal area by the same name lies ~ 5 km SW of Lava Point. The prominent cone on the N edge of the Range is called Mount Ruckenberg or Mount Karai. The initial "vent location" was 2 km SW of Mount Karai between Ubia and Ululu volcanoes. Part of that area is crossed by two parallel, closely spaced faults. The narrow zone between those faults was down-thrown. A SW-directed debris flow was also mapped near this area. Three centers in the N, Ruckenberg (Karai), Kaiamu maar, and Voku, are specifically mentioned in the text as areas with recently documented Holocene activity. Modified from a map by Chris McKee, RVO. |
The pattern of located earthquakes defined an irregular ellipse, with major axis 9 km E-W. Two earthquakes represented a 1-2 km extension N from the ellipse under Bangula Bay. There were also two earthquakes offshore about 4-5 km due N of Cape Reilnitz, a broad promontory the most extreme point of which lies 18 km to the W of Mt. Ruckenberg's summit. As of the end of July an area devoid of earthquakes remained; it was 2-3 km in diameter and centered on Walo village.
The RVO estimated that the top of the underlying magma body was 10-15 km deep when volcano-tectonic earthquakes began on 6 July 2006. They judged that volatiles or heat escaping from the magma were responsible for onset of the mud and water ejections at the once quiet hot springs.
Postulated intrusion. Randy White (US Geological Survey) analyzed the July seismic crisis, which in his interpretation did not follow the pattern of a tectonic earthquake with a main shock and associated aftershocks, but did follow behavior of many earthquakes accompanying the onset of volcanic unrest. He attributed the seismicity to a dike intruded to shallow depth (and confined to the subsurface). According to White, the epicenters well outboard of, but surrounding the area of intrusion, occurred in a pattern similar to those accompanying many shallow intrusions.
The elevated seismicity began after a volcano-tectonic earthquake, M ~ 6 on 19 July (BGVN 31:07). It was located on the N side of New Britain, slightly offshore, and a few ten's of kilometers from the Sulu Range. The focal depth was thought to be in the 10-20 km range. White noted that soon after the 19 July earthquake, Australia provided portable seismometers. Once those arrived and began recording data, computed moment tensors indicated that subsequent earthquakes were very shallow. Epicenters occurred slightly W of the Sulu Range.
Short level-lines installed by RVO in August 2006 showed, by November, ~ 2 cm of deflation of the Kaiamu area in relation to a datum ~ 1 km E on the Kaiamu-Sulu track. By April 2006 the measured levels had returned to approximately the August datum line.
To the W of the area at Lasibu a similar pattern existed, with over 2.5 cm of deflation locally measured by November and an approximate return to the datum-line by April 2006. The center of the area delimited by seismicity is swamp and difficult to access. Google satellite images show an interesting series of raised shorelines W of Kaiamu.
Upon prompting from White, Chuck Wicks acquired satellite radar (L-band imagery) from Japanese collaborators for the Sulu Range. The radar data were taken weeks before and weeks after the July seismicity. When processed to obtain radar interferometry, the data indicated over 80 cm of vertical surface deformation. The deformation was centered in a region W of the Sulu Range along an area along the coast ~ 5 km W of Lava Point (Lara Point on some maps). It trends ENE. The data were interpreted as a shallow dike intrusion on the order of ~ 8 m wide trending out beneath Bangula Bay.
Wick's preliminary analysis suggests the intrusion's volume may be on the order of one cubic kilometer. White's qualitative estimate of the volume, from the intensity, style, and duration of the seismicity, were consistent with that analysis. In addition, the strike-slip focal mechanisms seen in the seismic data suggested the dike-intrusion episode caused movement along a nearby strike-slip fault.
Geological investigations conducted in the past several months by Herman Patia and Chris McKee indicated that Sulu Range has been quite active 'recently.' The latest eruptive phase at Kaiamu maar was radiocarbon-dated at 1,300 BP. Since that time at least seven eruptions have taken place at other vents, notably Voko, involving phreatomagmatic eruptions. Ruckenberg (Karai) appears to be the source of the most recent activity. Within the last 200 years it produced lava flows.
Reference. Johnson, RW., 1971, Bamus volcano, Lake Hargay area, and Sulu Range, New Britain: Volcanic geology and petrology: Australia Department of National Development, Bureau of Mineral Resources, Geology and Geophysics, Record 1971/55.
Information Contacts: Steve Saunders, Herman Patia, and Chris McKee, Rabaul Volcanological Observatory (RVO), Department of Mining, Private Mail Bag, Port Moresby Post Office, National Capitol District, Papua New Guinea; USGS Earthquakes Hazard Program (URL: http://earthquakes.usgs.gov/); Randy White and Chuck Wicks, US Geological Survey, 345 Middlefield Rd., MS 977, Menlo Park, CA 94025, USA; United Nations Office for the Coordination of Humanitarian Affairs (URL: https://reliefweb.int/).
The RVO reported that during 28 September-24 October, seismic activity in the Sulu Range declined. Vapor plumes that were emitted from the Silanga Hotsprings were visible about 20 km NE from Bialla. A moderately strong sulfur smell from the Silanga and Talopu hot springs continued to be reported.
Source: Rabaul Volcano Observatory (RVO)
The RVO reported that during 10-15 August, seismic activity in the Sulu Range fluctuated but remained at low levels. Epicenters of occasional high frequency earthquakes were located between the Sulu Range and the Silanga area, approximately 10 km to the SW. Vapor plumes were emitted from the Silanga Hotsprings and on 15 August an explosion was heard from Mato Hotspring.
Source: Rabaul Volcano Observatory (RVO)
The RVO reported that during 31 July-2 August, seismic activity at Sulu Range was at relatively low levels. Earthquakes of Modified Mercalli Intensity 1-2 in areas S were described as being more irregular and occurring at longer intervals.
Source: Rabaul Volcano Observatory (RVO)
The RVO reported that seismic activity from the Sulu Range continued at a high level during 13-15 July. No emissions were reported during this period. According to news reports, on 16 July disaster officials in Papua New Guinea evacuated three villages and moved 1,400 people to camps outside of the hazard zone.
Sources: Rabaul Volcano Observatory (RVO); Association of American Publishers
On 10 July, the RVO reported that "forceful, dark emissions" from the Sulu Range were observed on 7 July and decreased to moderate emissions by the morning of 8 July. On 12 July, aerial inspection confirmed that emissions were coming from a NW-S-trending area between Ubia and Ululu volcanoes. The report also indicated that weak to moderate white vapor emissions were observed on 10 through 12 July and seismic activity had increased in intensity and frequency from 6 July. Loud booming and rumbling noises were accompanied by strong tremor picked up at stations at Garbuna and Ulawun volcanoes. On 11 July it was reported that there was no evidence of ash emission and that three villages north of Mount Karai had been evacuated. A large earthquake (intensity of ~7) occurred on 12 July at 0820 that disturbed the shoreline and caused the sea water to become sediment-laden. Local rivers turned muddy due to continuous ground shaking.
Reports of vegetation die-off from late February had not been confirmed due to lack of resources. The Sulu Range has not been active in historical times.
Source: Rabaul Volcano Observatory (RVO)
Reports are organized chronologically and indexed below by Month/Year (Publication Volume:Number), and include a one-line summary. Click on the index link or scroll down to read the reports.
Seismicity and emissions reported from volcano with no historical eruptions
On 7 July 2006, observers reported the first historical indication of volcanic activity in the Sulu Range of New Britain (in the nation of Papua New Guinea (PNG)). As shown on figure 1, the Sulu Range lies near the N coast of New Britain Island. This spot sits in the Province of West New Britain but in terms of geometry, lies closer to the middle of the island ~100 km E of the prominent, N-trending Willaumez Peninsula and ~200 km SW of Rabaul at the island's E end.
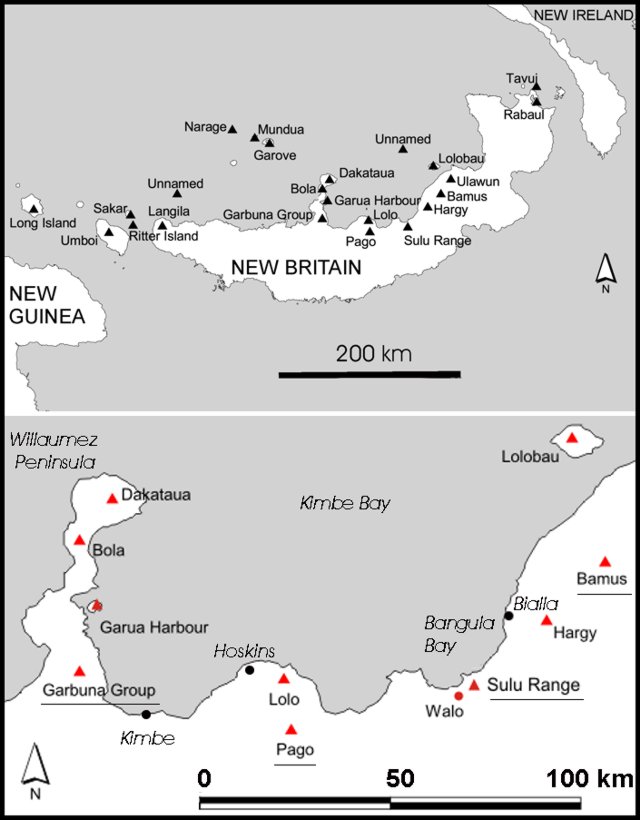 |
Figure 1. Two maps indicating the context of the Sulu Range on New Britain Island. Volcanoes with currently listed Holocene activity are shown (solid triangles). (Top map) Covering all of New Britain and parts of neighboring islands New Guinea and New Ireland. Four volcanoes in this region have become active in the past few years: Garbuna, Pago, Sulu Range, and Bamus. In the cases of Garbuna and the Sulu Range, these were their first recorded historical eruptions. Beyond Bamus to the NE reside the better known Ulawun and Rabaul volcanoes. (Lower map) An enlargement of the area bounded to the W by the Willaumez Peninsula. |
Rabaul Volcano Observatory (RVO) noted that ground observations at the Sulu Range, confirmed by aerial inspection, indicated that the emissions were coming from an area initially incorrectly disclosed as Mount Karai. (Karai is reportedly equivalent to Mount Ruckenberg, mentioned below.) Later reports correcting the initial vent location, stated that the eruption took place 2 km SW of Mount Karai between Ubia and Ululu volcanoes.
Considerable light on the Sulu Range and other volcanoes in the vicinity is shed by an Australian Bureau of Mineral Resources report by Johnson (1971). The coordinates and summit elevation given in the header above apply to the highest point in the Sulu Range, Mount Malopu (synonyms include "Malutu" and "Malobu").
Changes in our nomenclature. We indicate Walo hot springs on the lower map of figure 1, the only feature in this vicinity previously identified in our database on active volcanoes. Walo was listed as a thermal feature in the Melanesian portion of the Catalog of Active Volcanoes of the World (Fisher, 1957) and in Simkin and Siebert (1994). Walo rests in a low swampy area ~ 3 km W of the edge of the Sulu Range, which we apply broadly to a ~ 10 km diameter mountainous area with multiple peaks of ~ 500-600 m elevation. The highland areas associated with the Sulu Range's NE end contains a cone near the coast, which is labeled "Mount Ruckenberg (extinct volcano)" on the Bangula Sheet (Papua New Guinea 1:100,000 Topographic Survey, 1975).
The Sulu Range eruption has spurred restructuring of our naming conventions. Walo is now listed as a thermal feature associated with the larger volcanic field called the Sulu Range (and it preserves the Volcano Number that used to apply only to Walo, 0502-09=).
2006 eruption and earthquakes. RVO reported that there were indications as early as February 2006 that something was changing at Sulu Range because vegetation there was dying off. RVO noted that earthquakes began on 6 July and most river systems near Mount Karai had turned muddy due to the continuous shaking. Seismic activity was followed by the emission of puffs of white vapor from the area and loud booming and rumbling noises accompanied strong tremors.
Eruptions started with forceful dark emissions late on 7 and 8 July and decreased to moderate emissions by 10 July. At the settlement Bialla, ~20 km NE of the Sulu Range, tremors were felt. These were also picked up by the seismic stations at Garbuna and Ulawun (~100 km W and ENE, respectively).
In a report discussing 10-11 July, RVO reported that three villages N of Mount Karai had been evacuated. For the 10th, RVO described the activity as weak-to-moderate emission of white vapor with no evidence of ashfall and with occasional weak-to-moderate roaring noises accompanying the emissions. On the 11th, associated with earthquakes, white puffs discharged. Similar observations of white emissions prevailed through the 12th.
Earthquakes increased both in size and frequency of occurrence, and on 11 July at Bialla they took place every 10-20 minutes. Near Ubia volcano, seismicity was very elevated, with earthquakes every few minutes. At 0820 on 12 July a large earthquake of Modified Mercalli (MM) intensity VII or more occurred in the region. It disturbed the shoreline, which discolored the seawater; shaking also caused the sea surface to become choppy.
The USGS epicenter for the above-cited 12 July (local time) earthquake was listed at very nearly the same time (in UTC, on 11 July at 2222) with epicenter at 5.48°S, 150.83°E, a depth of 37 km and a body magnitude (mb) of 4.90. That spot lies 12 km NE of Sulu Range (using the coordinates listed in the header above). On a table of earthquakes the same day (11 July, UTC), seven others, mb 3.9-4.7 occurred within several hundred kilometers of Sulu Range. All took place earlier, but a pattern of substantial ongoing earthquakes also prevailed later as well.
RVO noted that from 1600 on 12 July to 0900 on 13 July high-frequency earthquakes occurring at the rate of one every minute were recorded on the seismograph deployed at Bialla. The earthquakes recorded were of varying (though unstated) magnitudes and towards 0900 decreased slightly to one every 30 minutes. Shortly afterwards, from 1000 to 1400 on 13 July, the seismograph was deployed in Kaiamu village on the small point immediately NW of the uplands portions of the Sulu Range, where it recorded continuous strings of high frequency earthquakes. Although the instrument was out of service after 1400 on the 13th, recording resumed that afternoon and seismic activity continued at a high level through 0900 on 15 July. During this time, the occurrence of felt earthquakes with maximum MM intensity V increased from one every 40-60 minutes to one every 2-3 minutes. Details of a subsequent decline in seismicity are sketchy.
The last reported visible emissions from the Sulu Range were on 12 July. By early August 2006 seismic activity had decreased to earthquakes of MM intensity I to II occurring at increasing intervals.
Again referring to USGS seismicity tables, the previously mentioned pattern of ongoing earthquakes on 11 July, generally mb 3.9-4.9, continued. An exception, the largest magnitude event during 9-18 July struck 31 km from Sulu Range, listed in UTC on 13 July at 2248; mb 5.1. It was at 39 km depth with epicenter ~12 km away. About 5 hours later a mb 4.7 event was recorded directly at volcano. On the 19th two larger earthquakes struck. One an Ms 6.4 centered 28 km away; the second, an Mw 5.90, 33 km away. These were the largest earthquakes within 50 km during 1 July to 11 September 2006.
References. Fisher N H, 1957, Melanesia: Catalog of Active Volcanoes of the World and Solfatara Fields, Rome, IAVCEI, v. 5, p. 1-105.
Johnson, R.W., 1971, Bamus volcano, Lake Hargy area, and Sulu Range, New Britain: Volcanic geology and petrology, Aust. Bur. Min. Res. Geol. Geophys. Rec, 1971/55, p. 1-36.
Papua New Guinea 1:100,000 Topographic Survey, 1975, Bangula Sheet, Sheet 9187, Series T601: Royal Australian Survey Corps (Reprinted by the National Mapping Bureau, 1985).
Simkin, T., and Siebert, L., 1994, Volcanoes of the World: Geoscience Press, Tucson, Arizona, 349 p. (ISBN 0-945005-12-1).
Information Contacts: Herman Patia and Steve Saunders, Rabaul Volcano Observatory (RVO), P.O. Box 386, Rabaul, Papua New Guinea.
Volcano seismicity declines in September and October 2006
On 31 October 2006 the Rabaul Volcanological Observatory (RVO) issued a followup report to the eruptive activity in the Sulu Range through much of October. Sulu Range was previously discussed in BGVN 31:07, but that report was ambiguous on the nature of the activity that had taken place during July 2006. This report and personal communications establishes that RVO staff are doubtful that the most energetic events were magmatic in character. Furthermore, RVO reported that in the weeks that followed, seismicity continued to decline.
The seismic unrest that began on 6 July declined from over 2,000 daily volcano-tectonic (VT) events to below 50 daily VT events during October (figure 2). The number fluctuated between 35 and 50 from late September to early October and between 5 and 25 during the third week of October.
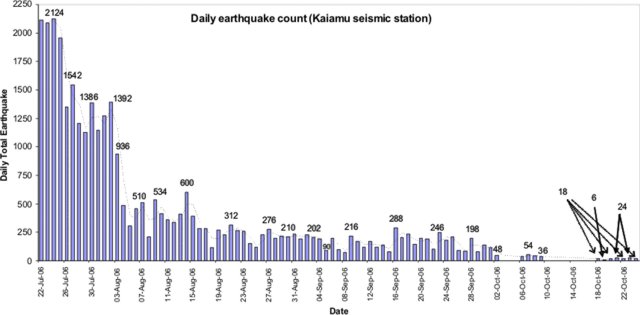 |
Figure 2. Sulu Range seismicity plot of daily VT earthquakes from 22 July 2006 to 24 October 2006 at the Kaiamu Seismic Station. The station did not operate on the days that lack earthquakes. Courtesy of RVO. |
RVO noted that about two to three felt earthquakes with intensity 2 continued to be felt daily at irregular intervals within the Bialla area and that white steam emissions from the Silanga Hot Springs were still visible from Bialla. In addition, a moderately strong sulfur smell from the Silanga and Talopu hot springs continued to be reported.
An analysis by RVO scientists concluded that at no point did magma reach the surface. The declining trend in seismic activity from early to late October may indicate that the new magma that apparently intruded to shallow levels in July is beginning to stall.
A permanent seismic station will be installed at Kaiamu in December 2006 to provide continuous monitoring of activity from the Sulu Range and surrounding areas.
In an extension of elevated regional tectonic seismicity, a strong earthquake, M ~ 6.5, struck the S side of central New Britain on 17 October. The USGS computed the focal depth as ~ 60 km, with epicenter ~ 50 km S of the Sulu Range. According to a USGS machine-generated shaking and intensity map, the Sulu Range lies within the zone of highest computed intensity (VI).
Information Contacts: Steve Saunders and Herman Patia, Rabaul Volcanological Observatory (RVO), Department of Mining, Private Mail Bag, Port Moresby Post Office, National Capitol District, Papua, New Guinea; USGS Earthquakes Hazard Program (URL: http://earthquakes.usgs.gov/)
Non-eruptive, but geysers and indications of a shallow dike intrusion
New and revised information has emerged regarding the behavior of the Sulu Range (Johnson, 1971), a volcanic field adjacent to and immediately E of Walo hot springs along the coast in the N-central part of New Britain Island (BGVN 31:07 and 31:09; figure 3). Initial Rabaul Volcanological Observatory (RVO) reports mentioned apparent steam and ash emission during mid-July 2006, but although weak-to-moderate vapor emission occured, and a later section of this report discusses heightened hot spring activity, the reported "forceful dark emissions" have been instead linked to dust during mass wasting.
|
Figure 3. A sketch map of New Britain island showing a small portion of the main island of Papua New Guinea (lower left) and New Ireland (upper right). Volcanoes on or adjacent New Britain are labeled. Volcanoes active and erupting frequently in the last decade include (from the SW) Langila, Ulawun, and Rabaul. Volcanoes that have erupted or undergone anomalous unrest in the past few years include (from the SW) Ritter Island, the Garbuna group, Pago, Sulu Range, and Bamus. |
In a 12 April Email message, Steve Saunders clarified the latest RVO views on Sulu's behavior. He noted that ". . . Sulu did not erupt! It was purely a series of seismic cris[es]. The 'emissions' which were reported before we got there turned out to be dust from landslides."
Unusually vigorous hot springs, declining seismicity. Following the first two weeks of unrest during mid-July at Sulu Range, an RVO report discussing 31 July to 2 August activity stated that area hot springs such as those at Walo were undergoing unusually strong activity. This included expelled mud, the emergence of geysers, and abnormal quantities of steam.
RVO noted waning seismicity in late July. Seismicity had declined to relatively low levels, although small volcano-tectonic events continued to be recorded. The small earthquakes were centered around the settlements of Silanga, Sege, and Sale (figure 4; respectively, from Mt.Ruckenberg's summit, located 12.7 km to the SW; 7.2 km SW, and 5.5 km S). The 31 July to 2 August earthquakes were described as more irregular and less frequent than those in preceeding weeks.
|
Figure 4. Geological map showing the cluster of overlapping cones of the Sulu Range. Walo village lies just off the map near the coast within a few kilometers of the map 's W margin. The thermal area by the same name lies ~ 5 km SW of Lava Point. The prominent cone on the N edge of the Range is called Mount Ruckenberg or Mount Karai. The initial "vent location" was 2 km SW of Mount Karai between Ubia and Ululu volcanoes. Part of that area is crossed by two parallel, closely spaced faults. The narrow zone between those faults was down-thrown. A SW-directed debris flow was also mapped near this area. Three centers in the N, Ruckenberg (Karai), Kaiamu maar, and Voku, are specifically mentioned in the text as areas with recently documented Holocene activity. Modified from a map by Chris McKee, RVO. |
The pattern of located earthquakes defined an irregular ellipse, with major axis 9 km E-W. Two earthquakes represented a 1-2 km extension N from the ellipse under Bangula Bay. There were also two earthquakes offshore about 4-5 km due N of Cape Reilnitz, a broad promontory the most extreme point of which lies 18 km to the W of Mt. Ruckenberg's summit. As of the end of July an area devoid of earthquakes remained; it was 2-3 km in diameter and centered on Walo village.
The RVO estimated that the top of the underlying magma body was 10-15 km deep when volcano-tectonic earthquakes began on 6 July 2006. They judged that volatiles or heat escaping from the magma were responsible for onset of the mud and water ejections at the once quiet hot springs.
Postulated intrusion. Randy White (US Geological Survey) analyzed the July seismic crisis, which in his interpretation did not follow the pattern of a tectonic earthquake with a main shock and associated aftershocks, but did follow behavior of many earthquakes accompanying the onset of volcanic unrest. He attributed the seismicity to a dike intruded to shallow depth (and confined to the subsurface). According to White, the epicenters well outboard of, but surrounding the area of intrusion, occurred in a pattern similar to those accompanying many shallow intrusions.
The elevated seismicity began after a volcano-tectonic earthquake, M ~ 6 on 19 July (BGVN 31:07). It was located on the N side of New Britain, slightly offshore, and a few ten's of kilometers from the Sulu Range. The focal depth was thought to be in the 10-20 km range. White noted that soon after the 19 July earthquake, Australia provided portable seismometers. Once those arrived and began recording data, computed moment tensors indicated that subsequent earthquakes were very shallow. Epicenters occurred slightly W of the Sulu Range.
Short level-lines installed by RVO in August 2006 showed, by November, ~ 2 cm of deflation of the Kaiamu area in relation to a datum ~ 1 km E on the Kaiamu-Sulu track. By April 2006 the measured levels had returned to approximately the August datum line.
To the W of the area at Lasibu a similar pattern existed, with over 2.5 cm of deflation locally measured by November and an approximate return to the datum-line by April 2006. The center of the area delimited by seismicity is swamp and difficult to access. Google satellite images show an interesting series of raised shorelines W of Kaiamu.
Upon prompting from White, Chuck Wicks acquired satellite radar (L-band imagery) from Japanese collaborators for the Sulu Range. The radar data were taken weeks before and weeks after the July seismicity. When processed to obtain radar interferometry, the data indicated over 80 cm of vertical surface deformation. The deformation was centered in a region W of the Sulu Range along an area along the coast ~ 5 km W of Lava Point (Lara Point on some maps). It trends ENE. The data were interpreted as a shallow dike intrusion on the order of ~ 8 m wide trending out beneath Bangula Bay.
Wick's preliminary analysis suggests the intrusion's volume may be on the order of one cubic kilometer. White's qualitative estimate of the volume, from the intensity, style, and duration of the seismicity, were consistent with that analysis. In addition, the strike-slip focal mechanisms seen in the seismic data suggested the dike-intrusion episode caused movement along a nearby strike-slip fault.
Geological investigations conducted in the past several months by Herman Patia and Chris McKee indicated that Sulu Range has been quite active 'recently.' The latest eruptive phase at Kaiamu maar was radiocarbon-dated at 1,300 BP. Since that time at least seven eruptions have taken place at other vents, notably Voko, involving phreatomagmatic eruptions. Ruckenberg (Karai) appears to be the source of the most recent activity. Within the last 200 years it produced lava flows.
Reference. Johnson, RW., 1971, Bamus volcano, Lake Hargay area, and Sulu Range, New Britain: Volcanic geology and petrology: Australia Department of National Development, Bureau of Mineral Resources, Geology and Geophysics, Record 1971/55.
Information Contacts: Steve Saunders, Herman Patia, and Chris McKee, Rabaul Volcanological Observatory (RVO), Department of Mining, Private Mail Bag, Port Moresby Post Office, National Capitol District, Papua New Guinea; USGS Earthquakes Hazard Program (URL: http://earthquakes.usgs.gov/); Randy White and Chuck Wicks, US Geological Survey, 345 Middlefield Rd., MS 977, Menlo Park, CA 94025, USA; United Nations Office for the Coordination of Humanitarian Affairs (URL: https://reliefweb.int/).
This compilation of synonyms and subsidiary features may not be comprehensive. Features are organized into four major categories: Cones, Craters, Domes, and Thermal Features. Synonyms of features appear indented below the primary name. In some cases additional feature type, elevation, or location details are provided.
Synonyms |
||||
| Sulu Hills | ||||
Cones |
||||
| Feature Name | Feature Type | Elevation | Latitude | Longitude |
|
Malopu, Mount
Malobu, Mount |
Cone | 610 m | 5° 30' 0" S | 150° 56' 0" E |
| Ululu, Mount | Cone | 5° 29' 0" S | 150° 56' 0" E | |
Craters |
||||
| Feature Name | Feature Type | Elevation | Latitude | Longitude |
| Kaiamu | Maar | |||
Domes |
||||
| Feature Name | Feature Type | Elevation | Latitude | Longitude |
|
Ruckenberg, Mount
Karai, Mount |
Dome | 600 m | 5° 28' 0" S | 150° 57' 0" E |
| Talutu, Mount | Dome | 5° 30' 0" S | 150° 57' 0" E | |
| Ubia, Mount | Dome | 5° 29' 0" S | 150° 55' 0" E | |
Thermal |
||||
| Feature Name | Feature Type | Elevation | Latitude | Longitude |
| Silanga Hot Spring | Hot Spring | |||
| Talopu Hot Spring | Hot Spring | |||
| Walo | Thermal | 15 m | 5° 32' 0" S | 150° 54' 0" E |
|
|
||||||||||||||||||||||||
The Global Volcanism Program is not aware of any Holocene eruptions from Sulu Range. If this volcano has had large eruptions (VEI >= 4) prior to 10,000 years ago, information might be found on the Sulu Range page in the LaMEVE (Large Magnitude Explosive Volcanic Eruptions) database, a part of the Volcano Global Risk Identification and Analysis Project (VOGRIPA).
There is data available for 1 deformation periods. Expand each entry for additional details.
| Start Date: 2006 Jul | Stop Date: 2006 Jul | Direction: Unknown | Method: InSAR |
| Magnitude: Unknown | Spatial Extent: Unknown | Latitude: Unknown | Longitude: Unknown |
Remarks: Deformation during an earthquake swarm can be modeled by a dyke intrusion. | |||
Reference List: Wicks et al. 2007*.
Full References:
Wicks, C., R. White, H. Patia, C. Collins, W. Johnson, and H. Yarai, 2007. Surface deformation from ALOS interferometry related to the July 2006 seismic crisis and dike intrusion on central New Britain Island, Papua New Guinea. Eos Trans. AGU, 88(52), Fall Meet. Suppl., Abstract G51C-0621.
There is no Emissions History data available for Sulu Range.
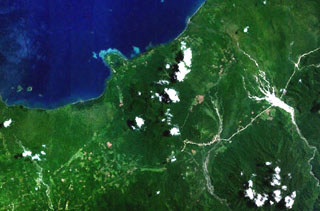 Forested volcanoes of the Sulu Range occupy the center of this NASA Landsat image (N is to the top) of west-central New Britain. This group of partially overlapping small volcanoes and lava domes off Bangula Bay reaches heights of about 600 m. Mount Karai, also known as Mount Ruckenberg, lies on the NE side of the geochemically diverse, basaltic-to-rhyolitic complex. Kaiamu maar forms the peninsula extending about 1 km into Bangula Bay at the NW side of the Sulu Range.
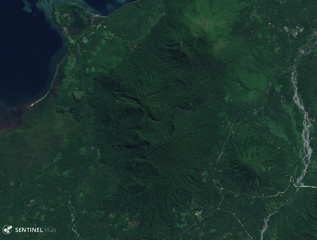 The Sulu Range in New Britain, Papua New Guinea spans this 25 July 2019 Sentinel-2 satellite image (N is at the top), with Mount Malopu in the center to the S, Mount Ululu and Ubia to the N, Mount Ruckenberg to the NE, and Mount Talutu dome to the SE. Kaiamu maar forms the peninsula extending about 1 km into Bangula Bay to the NW.
The maps shown below have been scanned from the GVP map archives and include the volcano on this page. Clicking on the small images will load the full 300 dpi map. Very small-scale maps (such as world maps) are not included. The maps database originated over 30 years ago, but was only recently updated and connected to our main database. We welcome users to tell us if they see incorrect information or other problems with the maps; please use the Contact GVP link at the bottom of the page to send us email.
The following 1 samples associated with this volcano can be found in the Smithsonian's NMNH Department of Mineral Sciences collections, and may be availble for research (contact the Rock and Ore Collections Manager). Catalog number links will open a window with more information.
| Catalog Number | Sample Description | Lava Source | Collection Date |
|---|---|---|---|
| NMNH 116852-1 | Basalt | -- | -- |
| Copernicus Browser | The Copernicus Browser replaced the Sentinel Hub Playground browser in 2023, to provide access to Earth observation archives from the Copernicus Data Space Ecosystem, the main distribution platform for data from the EU Copernicus missions. |
| MIROVA | Middle InfraRed Observation of Volcanic Activity (MIROVA) is a near real time volcanic hot-spot detection system based on the analysis of MODIS (Moderate Resolution Imaging Spectroradiometer) data. In particular, MIROVA uses the Middle InfraRed Radiation (MIR), measured over target volcanoes, in order to detect, locate and measure the heat radiation sourced from volcanic activity. |
| MODVOLC Thermal Alerts | Using infrared satellite Moderate Resolution Imaging Spectroradiometer (MODIS) data, scientists at the Hawai'i Institute of Geophysics and Planetology, University of Hawai'i, developed an automated system called MODVOLC to map thermal hot-spots in near real time. For each MODIS image, the algorithm automatically scans each 1 km pixel within it to check for high-temperature hot-spots. When one is found the date, time, location, and intensity are recorded. MODIS looks at every square km of the Earth every 48 hours, once during the day and once during the night, and the presence of two MODIS sensors in space allows at least four hot-spot observations every two days. Each day updated global maps are compiled to display the locations of all hot spots detected in the previous 24 hours. There is a drop-down list with volcano names which allow users to 'zoom-in' and examine the distribution of hot-spots at a variety of spatial scales. |
|
WOVOdat
Single Volcano View Temporal Evolution of Unrest Side by Side Volcanoes |
WOVOdat is a database of volcanic unrest; instrumentally and visually recorded changes in seismicity, ground deformation, gas emission, and other parameters from their normal baselines. It is sponsored by the World Organization of Volcano Observatories (WOVO) and presently hosted at the Earth Observatory of Singapore.
GVMID Data on Volcano Monitoring Infrastructure The Global Volcano Monitoring Infrastructure Database GVMID, is aimed at documenting and improving capabilities of volcano monitoring from the ground and space. GVMID should provide a snapshot and baseline view of the techniques and instrumentation that are in place at various volcanoes, which can be use by volcano observatories as reference to setup new monitoring system or improving networks at a specific volcano. These data will allow identification of what monitoring gaps exist, which can be then targeted by remote sensing infrastructure and future instrument deployments. |
| Volcanic Hazard Maps | The IAVCEI Commission on Volcanic Hazards and Risk has a Volcanic Hazard Maps database designed to serve as a resource for hazard mappers (or other interested parties) to explore how common issues in hazard map development have been addressed at different volcanoes, in different countries, for different hazards, and for different intended audiences. In addition to the comprehensive, searchable Volcanic Hazard Maps Database, this website contains information about diversity of volcanic hazard maps, illustrated using examples from the database. This site is for educational purposes related to volcanic hazard maps. Hazard maps found on this website should not be used for emergency purposes. For the most recent, official hazard map for a particular volcano, please seek out the proper institutional authorities on the matter. |
| IRIS seismic stations/networks | Incorporated Research Institutions for Seismology (IRIS) Data Services map showing the location of seismic stations from all available networks (permanent or temporary) within a radius of 0.18° (about 20 km at mid-latitudes) from the given location of Sulu Range. Users can customize a variety of filters and options in the left panel. Note that if there are no stations are known the map will default to show the entire world with a "No data matched request" error notice. |
| UNAVCO GPS/GNSS stations | Geodetic Data Services map from UNAVCO showing the location of GPS/GNSS stations from all available networks (permanent or temporary) within a radius of 20 km from the given location of Sulu Range. Users can customize the data search based on station or network names, location, and time window. Requires Adobe Flash Player. |
| DECADE Data | The DECADE portal, still in the developmental stage, serves as an example of the proposed interoperability between The Smithsonian Institution's Global Volcanism Program, the Mapping Gas Emissions (MaGa) Database, and the EarthChem Geochemical Portal. The Deep Earth Carbon Degassing (DECADE) initiative seeks to use new and established technologies to determine accurate global fluxes of volcanic CO2 to the atmosphere, but installing CO2 monitoring networks on 20 of the world's 150 most actively degassing volcanoes. The group uses related laboratory-based studies (direct gas sampling and analysis, melt inclusions) to provide new data for direct degassing of deep earth carbon to the atmosphere. |
| Large Eruptions of Sulu Range | Information about large Quaternary eruptions (VEI >= 4) is cataloged in the Large Magnitude Explosive Volcanic Eruptions (LaMEVE) database of the Volcano Global Risk Identification and Analysis Project (VOGRIPA). |
| EarthChem | EarthChem develops and maintains databases, software, and services that support the preservation, discovery, access and analysis of geochemical data, and facilitate their integration with the broad array of other available earth science parameters. EarthChem is operated by a joint team of disciplinary scientists, data scientists, data managers and information technology developers who are part of the NSF-funded data facility Integrated Earth Data Applications (IEDA). IEDA is a collaborative effort of EarthChem and the Marine Geoscience Data System (MGDS). |

