
The Darwin VAAC reported that an ash plume from Bagana was identified in satellite images rising to 2.1 km (7,000 ft) a.s.l. and drifting SW at 0820 on 22 April. The plume had dissipated by 1420.
Source: Darwin Volcanic Ash Advisory Centre (VAAC)
Ongoing lava extrusion and ash emissions, September 2022-March 2023
The remote Bagana volcano on central Bougainville Island, Papua New Guinea, has been erupting almost continuously since February 2000 and consists of frequent non-explosive lava flows, gas and sulfur dioxide emissions, occasional emissions of ash, and thermal anomalies. Infrequently, explosions producing pyroclastic flows occur (BGVN 46:09, 47:09). The current report describes activity during September 2022-March 2023 using information from the Darwin Volcanic Ash Advisory Center (VAAC) and satellite data.
Eruptive activity continued throughout the reporting period, with persistent thermal activity as seen in satellite images. When visibility allowed, Sentinel-2 images revealed persistent thermal activity in the NE part of the summit crater, with weaker thermal signals on the SE flank, just below the summit (figure 1). Strong activity on 18 November (figure 45) included what appear to be lava flows in the crater and extending down the NW flank, and on the lower SE flank. Gas-and-steam emissions were also visible in most Sentinel-2 images, usually drifting NE.
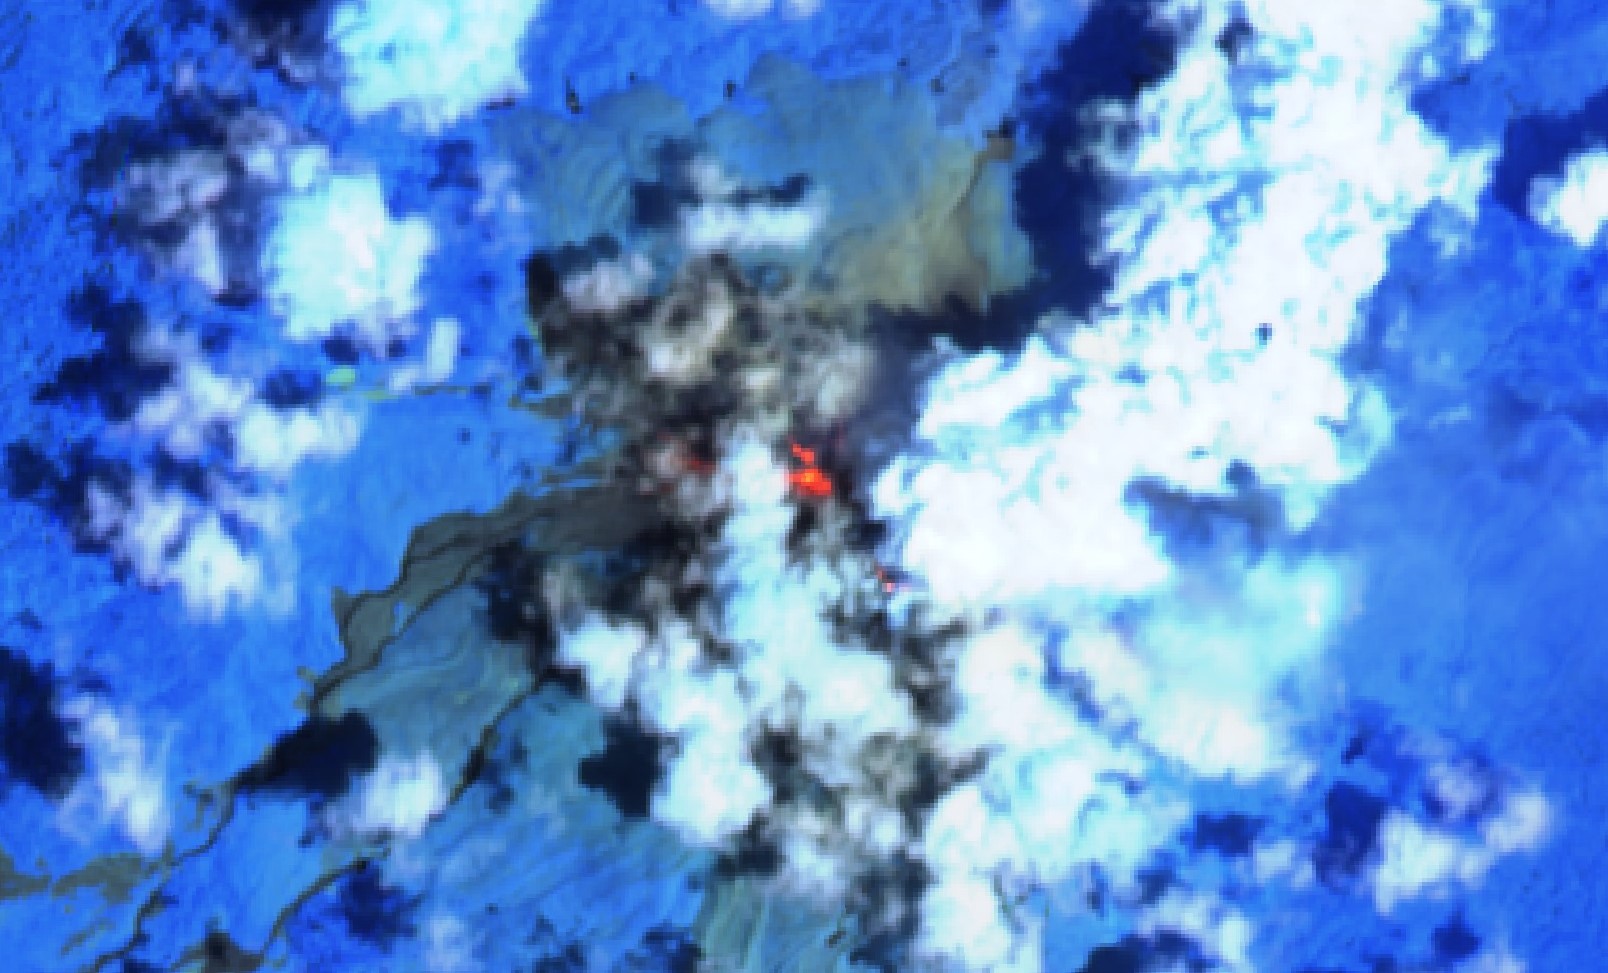 |
Figure 45. Sentinel-2 infrared satellite image of Bagana showing a strong thermal signal in the NE part of the summit crater and extending down the NW flank, with weaker hotspots on the lower SE flank. Images use “Atmospheric penetration” (bands 12, 11, 8A) rendering. Courtesy of Sentinel Hub Playground. |
Consistent with the Sentinel-2 images, the MIROVA thermal detection system showed a persistent low to moderate power anomaly in both MODIS (Moderate Resolution Imaging Spectroradiometer) and VIIRS (Visible Infrared Imaging Radiometer Suite) data, with more frequent and stronger activity during October-November 2022 (figure 46). Hotspots were only detected on three days by the MODIS-MODVOLC system (23 October, 13 November, and 20 November).
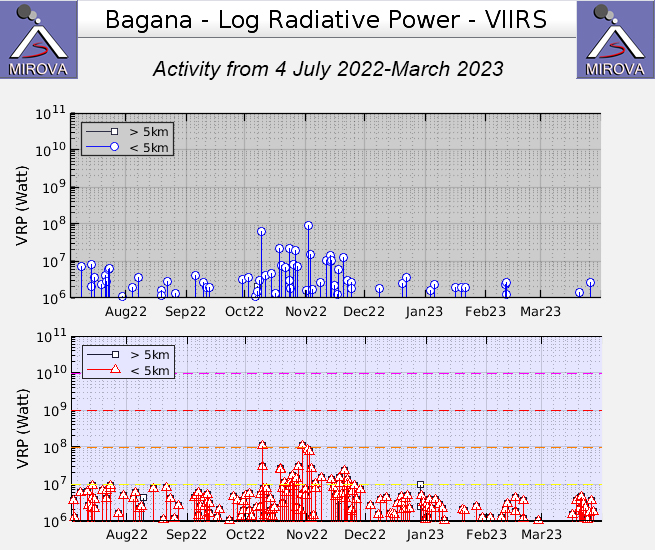 |
Figure 46. Graphs showing thermal anomalies near the crater summit at Bagana during September 2022-March 2023, as recorded by the MIROVA system (Log Radiative Power) using MODIS (top) and VIIRS (bottom) data. Nearly persistent low-to-moderate hotspots were recorded during September through the first part of January, with more persistent and higher power signals during October and November 2022. Courtesy of MIROVA. |
A few strong SO2 plumes were observed by the TROPOMI instrument aboard the Sentinel-5P satellite, mostly during November. They were most prominent during 28 October-5 November 2022, consistent with ash plumes reported by the Darwin VAAC that rose to an altitude of 2.1-2.7 km (or 200-600 m above the summit) during 31 October-2 November.
Information Contacts: MIROVA (Middle InfraRed Observation of Volcanic Activity), a collaborative project between the Universities of Turin and Florence (Italy) supported by the Centre for Volcanic Risk of the Italian Civil Protection Department (URL: http://www.mirovaweb.it/); Sentinel Hub Playground (URL: https://www.sentinel-hub.com/explore/sentinel-playground); Hawai'i Institute of Geophysics and Planetology (HIGP) - MODVOLC Thermal Alerts System, School of Ocean and Earth Science and Technology (SOEST), Univ. of Hawai'i, 2525 Correa Road, Honolulu, HI 96822, USA (URL: http://modis.higp.hawaii.edu/); Darwin Volcanic Ash Advisory Centre (VAAC), Bureau of Meteorology, Northern Territory Regional Office, PO Box 40050, Casuarina, NT 0811, Australia (URL: http://www.bom.gov.au/info/vaac/); NASA Global Sulfur Dioxide Monitoring Page, Atmospheric Chemistry and Dynamics Laboratory, NASA Goddard Space Flight Center (NASA/GSFC), 8800 Greenbelt Road, Goddard, Maryland, USA (URL: https://so2.gsfc.nasa.gov/).
2024: April
2023: July
| August
| November
2022: August
| October
| November
2021: March
| June
| July
| October
| November
2020: February
| April
2018: February
| April
| May
| July
| November
2017: January
| February
| March
| April
| May
| June
| July
| August
| September
| October
| November
| December
2016: March
| April
| May
| June
| July
| August
| September
| October
| November
| December
2015: January
| March
| April
| May
| June
| September
| October
2014: February
| March
| April
| May
| June
| August
| September
| November
| December
2013: February
| March
| April
| May
| June
| September
| November
| December
2012: February
| May
| June
| July
| August
| September
| October
| December
2011: March
| May
| August
| October
2010: February
| April
| May
| June
| July
| August
| September
2009: April
| May
| June
| July
| August
| September
| October
| November
2008: February
| May
| September
| October
| November
| December
2007: January
| March
| May
| June
| August
| September
| October
| December
2006: March
| May
| June
| November
| December
2005: March
| May
| June
| August
| September
2004: April
| May
The Darwin VAAC reported that an ash plume from Bagana was identified in satellite images rising to 2.1 km (7,000 ft) a.s.l. and drifting SW at 0820 on 22 April. The plume had dissipated by 1420.
Source: Darwin Volcanic Ash Advisory Centre (VAAC)
The Darwin VAAC reported that an ash plume was detected in satellite data acquired by the Himawari-9 satellite on 29 November at 2030 UTC. The plume rose as high as 2.1 km a.s.l. and drifted N and NE. The plume dissipated by 0250 UTC on 30 November.
Source: Darwin Volcanic Ash Advisory Centre (VAAC)
The Darwin VAAC reported that an ash plume from Bagana was identified in satellite images rising to 3 km (10,000 ft) a.s.l. and drifting SW at 1300 on 24 November. The plume was continuously emitted for several hours. The plume had dissipated by 0710 on 25 November.
Source: Darwin Volcanic Ash Advisory Centre (VAAC)
RVO received no reports about volcanic activity at Bagana during 31 July-16 August due to the lack of information coming from the Torokina area. Photos of summit activity taken during 17-19 showed ash emissions rising no higher than 1 km above the summit and drifting SE; a small explosion produced an ash plume during the morning of 19 August. Deposits from small pyroclastic flows were also evident in the photos; lava flows and the pyroclastic-flow deposits were also identified in satellite data. Two temporary seismic stations were installed near Bagana on 17 August at distances of 7 km WSW (Vakovi station) and 11 km SW (Kepox station). The Kepox station immediately began recording continuous, low-frequency background seismicity. The Alert Level remained at Stage 2 (on a four-level scale).
Source: Rabaul Volcano Observatory (RVO)
The Darwin VAAC reported that ash plumes from Bagana were visible in satellite images rising to 2.1 km (7,000 ft) a.s.l. at 0800 on 12 August and 3 km (10,000 ft) a.s.l. a few hours later at 1220; the plumes drifted NW and W, respectively. According to a news report aid has been sent to the more than 6,300 people that have been adversely affected by the recent explosive eruptions at Bagana. The report noted that as many as 17,000 residents living near the volcano may be impacted.
Sources: Darwin Volcanic Ash Advisory Centre (VAAC); US Agency for International Development / Bureau for Humanitarian Assistance
The Darwin VAAC reported that an intense thermal anomaly over Bagana was identified in satellite images during 30-31 July. Ash emissions rose to 2.4 km (8,000 ft) a.s.l. and drifted WSW on 30 July. The VAAC received a ground report from RVO describing localized emissions at 0900 on 31 July. Ash was not identified in satellite images, though weather clouds obscured views.
Source: Darwin Volcanic Ash Advisory Centre (VAAC)
RVO reported that the eruption at Bagana continued during 18-29 July. Intermittent ash emissions drifted NNW, NW, and SW. On 26 July fine ashfall was reported on the coast of Torokina (20 km SW). The ash also drifted toward Laruma (25 km W) and Atsilima (27 km NW). During the night of 28 July a small explosive eruption at 2130 ejected lava fragments from the crater vents, according to reports from Torokina. A lava flow with two lobes was also reported. A second explosion occurred at 2157. Incandescence from the lava flow was observed from Piva as it descended the W flank around 2000 on 29 July. The Alert Level remained at 2 (on a four-level scale).
Source: Rabaul Volcano Observatory (RVO)
According to new articles, more than 7,000 people needed temporary accommodations due to the eruption at Bagana, with about 1,000 of those in evacuation shelters. Ashfall was deposited over a broad area, contaminating water supplies, affecting crops, and collapsing some roofs and houses in rural areas. Schools were temporarily shut down. The Alert Level was lowered to Stage 2 (on a four-level scale).
Sources: Radio New Zealand; The National
An explosive eruption at Bagana on 15 July was similar to one that occurred on 7 July. According to the Darwin VAAC an eruption at around 0830 on 15 July produced an ash plume that rose to 16.5 km (54,000 ft) a.s.l. by 1000 and drifted N based on satellite images. The plume was visible continuing to drift N in an image from 1900 but had dissipated by 2150. Ground-based reports indicated that pyroclastic flows had occurred in the vicinity of the volcano; small deposits confined to one drainage were inspected by RVO during an overflight on 17 July, and were confirmed to be from the 7 July event. The Autonomous Bougainville Government (ABG) issued a statement on 17 July noting significant impacts of ashfall in local communities. According to the National Disaster Centre, ashfall from the first event lasted until 10 July; an eruption was also reported by RVO on 14 July. Ashfall (presumably from events on 7 and 15 July) impacted about 8,111 people in Torokina, South Bougainville, including Tsito/Vuakovi, Gotana (9 km SW), Koromaketo, Kenaia, Longkogari, Kenbaki, Piva (13 km SW), and Atsinima (27km WNW) and in the Tsitovi district according to ABG. Significant ashfall was also reported in Ruruvu (22 km N) in the Wakunai District of Central Bougainville. The Alert Level was at Stage 3 (the third level on a four-level scale), confirmed by RVO the evening before. An evacuation was called for the villages in Wakunai, where heavy ashfall had contaminated water sources; the communities of Ruruvu, Togarau, Kakarapaia, Karauturi, Atao, and Kuritaturi were asked to evacuate to a disaster center at the Wakunai District Station within 24 hours. Communities in Torokina, nearest to Bagana, were to immediately evacuate to the Piva District station.
Sources: Autonomous Bougainville Government; Rabaul Volcano Observatory (RVO); Darwin Volcanic Ash Advisory Centre (VAAC); Papua New Guinea National Disaster Centre
An explosive eruption at Bagana on 7 July send a large ash, gas, and steam plume to high altitudes and caused significant ashfall in local communities. A report issued by the Autonomous Bougainville Government (Torokina District, Education Section) on 10 July noted that significant ash began falling during 2000-2100 on 7 July and covered most areas in the Vuakovi, Gotana (9 km SW), Koromaketo, Laruma and Atsilima villages. By about 2200 on 7 July the eruption plume had reached upper tropospheric altitudes based on satellite images. Sulfur dioxide detections in satellite images from 8 July indicated that the plume, likely a mixture of gases, ice, and ash, had risen to 16-18 km (52,500-59,100 ft) a.s.l., reaching the tropopause. Ashfall reportedly continued until 9 July. The ashfall covered vegetation, destroying bushes and gardens, and contaminated rivers and streams used for washing and drinking water; residents drank from coconuts and used fresh ground water accessible through bamboo pipes.
Sources: Andrew Tupper, Natural Hazards Consulting; Simon Carn; Rabaul Volcano Observatory (RVO); Autonomous Bougainville Government
The Darwin VAAC reported that on 2 November ash plumes from Bagana rose to 2.1 km (7,000 ft) a.s.l. and drifted NE based on satellite data. A thermal anomaly was present at the summit.
Source: Darwin Volcanic Ash Advisory Centre (VAAC)
The Darwin VAAC reported that during 31 October-1 November ash plumes from Bagana rose to 2.1-2.7 km (7,000-9,000 ft) a.s.l. and drifted NE, N, and WSW based on satellite data. An intense thermal anomaly was present at the summit.
Source: Darwin Volcanic Ash Advisory Centre (VAAC)
The Darwin VAAC reported that on 22 August an ash plume from Bagana rose to 3 km (10,000 ft) a.s.l. and drifted SW based on satellite and wind model data.
Source: Darwin Volcanic Ash Advisory Centre (VAAC)
The Darwin VAAC reported that on 27 November ash plumes from Bagana rose to 2.1 km (7,000 ft) a.s.l. and drifted NW based on satellite and wind model data.
Source: Darwin Volcanic Ash Advisory Centre (VAAC)
The Darwin VAAC reported that on 14 October an ash plume from Bagana rose to 2.1 km (7,000 ft) a.s.l. and drifted NE based on satellite and wind model data.
Source: Darwin Volcanic Ash Advisory Centre (VAAC)
The Darwin VAAC reported that on 31 July an ash plume from Bagana rose to 4.6 km (15,000 ft) a.s.l. based on a pilot observation. A few hours later steam emissions were identified in satellite images.
Source: Darwin Volcanic Ash Advisory Centre (VAAC)
Based on satellite and wind model data, the Darwin VAAC reported that on 9 July an ash plume from Bagana rose to 1.8 km (6,000 ft) a.s.l. and drifted W.
Source: Darwin Volcanic Ash Advisory Centre (VAAC)
Based on satellite and wind model data, the Darwin VAAC reported that on 14 June an ash plume from Bagana rose to 2.1 km (7,000 ft) a.s.l. and drifted W.
Source: Darwin Volcanic Ash Advisory Centre (VAAC)
Based on satellite and wind model data, the Darwin VAAC reported that on 10 March ash plumes from Bagana rose to 2.4 km (8,000 ft) a.s.l. and drifted NW and WNW.
Source: Darwin Volcanic Ash Advisory Centre (VAAC)
Based on satellite and wind model data, the Darwin VAAC reported that on 1 May an ash plume from Bagana rose to 3 km (10,000 ft) a.s.l. and drifted NW and W.
Source: Darwin Volcanic Ash Advisory Centre (VAAC)
Based on satellite and wind model data, the Darwin VAAC reported that during 30 February-2 March ash plumes from Bagana rose to 1.8-2.1 km (6,000-7,000 ft) a.s.l. and drifted SW and N.
Source: Darwin Volcanic Ash Advisory Centre (VAAC)
On 1 December the Darwin VAAC reported that ash plumes from Bagana were visible in satellite images drifting SE at an altitude of 3 km (10,000 ft) a.s.l. The report also noted the presence of a strong thermal anomaly, and that ash plumes which previously rose to 6.1 km (20,000 ft) a.s.l. had dissipated. Steam plumes drifted SE on 2 December.
Source: Darwin Volcanic Ash Advisory Centre (VAAC)
Based on analyses of satellite imagery and model data, the Darwin VAAC reported that during 29-30 July ash plumes from Bagana rose to altitudes of 1.8-2.1 km (6,000-7,000 ft) a.s.l. and drifted SW. A thermal anomaly was visible on 29 July.
Source: Darwin Volcanic Ash Advisory Centre (VAAC)
Based on analyses of satellite imagery and model data, the Darwin VAAC reported that on 22 July an ash plume from Bagana rose to an altitude of 2.4 km (8,000 ft) a.s.l. and drifted W.
Source: Darwin Volcanic Ash Advisory Centre (VAAC)
Based on analyses of satellite imagery and model data, the Darwin VAAC reported that on 11 May at 0900 an ash plume from Bagana rose to an altitude of 2.1 km (7,000 ft) a.s.l. and drifted SW. The plume dispersed within six hours.
Source: Darwin Volcanic Ash Advisory Centre (VAAC)
Based on analyses of satellite imagery and model data, the Darwin VAAC reported that on 8 May a possible ash plume from Bagana rose to an altitude of 2.1 km (7,000 ft) a.s.l. and drifted W.
Source: Darwin Volcanic Ash Advisory Centre (VAAC)
Based on analyses of satellite imagery and model data, the Darwin VAAC reported that during 14-15 April ash plumes from Bagana rose to altitudes of 2.1-2.4 km (7,000-8,000 ft) a.s.l. and drifted about 110 km SW.
Source: Darwin Volcanic Ash Advisory Centre (VAAC)
Based on analyses of satellite imagery and model data, the Darwin VAAC reported that on 2 March an ash plume from Bagana rose to an altitude of 2.4 km (8,000 ft) a.s.l. and drifted NE.
Source: Darwin Volcanic Ash Advisory Centre (VAAC)
Based on analyses of satellite imagery and model data, the Darwin VAAC reported that during 26-27 February ash plumes from Bagana rose to an altitude of 2.1 km (7,000 ft) a.s.l. and drifted WNW.
Source: Darwin Volcanic Ash Advisory Centre (VAAC)
Based on analyses of satellite imagery and model data, the Darwin VAAC reported that during 7-8 February ash plumes from Bagana rose to an altitude of 2.4 km (8,000 ft) a.s.l. and drifted NE.
Source: Darwin Volcanic Ash Advisory Centre (VAAC)
Based on analyses of satellite imagery and model data, the Darwin VAAC reported that during 25-26 December ash plumes from Bagana rose to an altitude of 2.4 km (8,000 ft) a.s.l. and drifted NE.
Source: Darwin Volcanic Ash Advisory Centre (VAAC)
Based on analyses of satellite imagery and model data, the Darwin VAAC reported that during 15-17 November ash plumes from Bagana rose to an altitude of 2.1 km (7,000 ft) a.s.l. and drifted N, SW, SSW, and W.
Source: Darwin Volcanic Ash Advisory Centre (VAAC)
Based on analyses of satellite imagery and model data, the Darwin VAAC reported that on 3 November an ash plume from Bagana rose to an altitude of 2.4 km (8,000 ft) a.s.l. and drifted NE.
Source: Darwin Volcanic Ash Advisory Centre (VAAC)
Based on analyses of satellite imagery and model data, the Darwin VAAC reported that on 27 October an ash plume from Bagana rose to an altitude of 2.1 km (7,000 ft) a.s.l. and drifted E and NE.
Source: Darwin Volcanic Ash Advisory Centre (VAAC)
Based on analyses of satellite imagery and model data, the Darwin VAAC reported that during 11-12 September an ash plume from Bagana rose to an altitude of 2.1 km (7,000 ft) a.s.l. and drifted NW.
Source: Darwin Volcanic Ash Advisory Centre (VAAC)
Based on analyses of satellite imagery and model data, the Darwin VAAC reported that on 31 August ash plumes from Bagana rose to an altitude of 2.1 km (7,000 ft) a.s.l. and drifted N, W, and SW.
Source: Darwin Volcanic Ash Advisory Centre (VAAC)
Based on analyses of satellite imagery and model data, the Darwin VAAC reported that during 24-28 August ash plumes from Bagana rose to altitudes of 2.1-2.4 km (7,000-8,000 ft) a.s.l. and drifted WNW, W, and SW.
Source: Darwin Volcanic Ash Advisory Centre (VAAC)
Based on analyses of satellite imagery and model data, the Darwin VAAC reported that during 9-10 and 13 August ash plumes from Bagana rose to an altitude of 2.4 km (8,000 ft) a.s.l. and drifted W and NW. Plumes drifted 120 km W on 13 August.
Source: Darwin Volcanic Ash Advisory Centre (VAAC)
Based on analyses of satellite imagery and model data, the Darwin VAAC reported that during 5-8 August ash plumes from Bagana drifted in multiple directions at an altitude of 2.1 km (7,000 ft) a.s.l.
Source: Darwin Volcanic Ash Advisory Centre (VAAC)
Based on analyses of satellite imagery and model data, the Darwin VAAC reported that on 1 August an ash plume from Bagana drifted W at an altitude of 2.1 km (7,000 ft) a.s.l.
Source: Darwin Volcanic Ash Advisory Centre (VAAC)
Based on analyses of satellite imagery and model data, the Darwin VAAC reported that on 23 July an ash plume from Bagana drifted W at an altitude of 2.1 km (7,000 ft) a.s.l.
Source: Darwin Volcanic Ash Advisory Centre (VAAC)
Based on analyses of satellite imagery and model data, the Darwin VAAC reported that on 16 July an ash plume from Bagana drifted W at an altitude of 2.1 km (7,000 ft) a.s.l.
Source: Darwin Volcanic Ash Advisory Centre (VAAC)
Based on analyses of satellite imagery and model data, the Darwin VAAC reported that on 2 July an ash plume from Bagana drifted W at an altitude of 2.1 km (7,000 ft) a.s.l.
Source: Darwin Volcanic Ash Advisory Centre (VAAC)
Based on analyses of satellite imagery and model data, the Darwin VAAC reported that on 22 and 25 June ash plumes from Bagana drifted NW at an altitude of 2.1 km (7,000 ft) a.s.l.
Source: Darwin Volcanic Ash Advisory Centre (VAAC)
Based on analyses of satellite imagery and model data, the Darwin VAAC reported that on 14 June an ash plume from Bagana drifted W at an altitude of 2.1 km (7,000 ft) a.s.l. No ash was identified in inages later that day.
Source: Darwin Volcanic Ash Advisory Centre (VAAC)
Based on analyses of satellite imagery and model data, the Darwin VAAC reported that during 7-8 and 14 June ash plumes from Bagana rose to an altitude of 2.1 km (7,000 ft) a.s.l. and drifted 65 km SW, W, and NW.
Source: Darwin Volcanic Ash Advisory Centre (VAAC)
Based on analyses of satellite imagery and model data, the Darwin VAAC reported that on 3 and 5 May ash plumes from Bagana rose to altitudes of 1.5-2.1 km (5,000-7,000 ft) a.s.l. and drifted W and SE.
Source: Darwin Volcanic Ash Advisory Centre (VAAC)
Based on analyses of satellite imagery and wind data, the Darwin VAAC reported that during 20-22 May ash plumes from Bagana rose 2.4 km (8,000 ft) a.s.l. and drifted W.
Source: Darwin Volcanic Ash Advisory Centre (VAAC)
Based on analyses of satellite imagery and wind data, the Darwin VAAC reported that during 10-14 May ash plumes from Bagana rose to an altitude of 2.1 km (7,000 ft) a.s.l. and drifted SW, W, NW, and E.
Source: Darwin Volcanic Ash Advisory Centre (VAAC)
Based on analyses of satellite imagery and wind data, the Darwin VAAC reported that during 7-9 May ash plumes from Bagana rose to altitudes of 2.1-3 km (7,000-10,000 ft) a.s.l. and drifted over 110 km SE, SSE, and S.
Source: Darwin Volcanic Ash Advisory Centre (VAAC)
Based on analyses of satellite imagery and model data, the Darwin VAAC reported that during 26-28 April ash plumes from Bagana rose to an altitude of 2.1 km (7,000 ft) a.s.l. and drifted N and NE.
Source: Darwin Volcanic Ash Advisory Centre (VAAC)
Based on analyses of satellite imagery and model data, the Darwin VAAC reported that during 16-17 April ash plumes from Bagana rose to altitudes of 1.8-2.1 km (6,000-7,000 ft) a.s.l. and drifted N, SE, and S. Plumes drifted 55-85 km during 19 and 23-24 April.
Source: Darwin Volcanic Ash Advisory Centre (VAAC)
Based on analyses of satellite imagery and model data, the Darwin VAAC reported that during 16-17 April ash plumes from Bagana rose to altitudes of 1.8-2.1 km (6,000-7,000 ft) a.s.l. and drifted N, SE, and S.
Source: Darwin Volcanic Ash Advisory Centre (VAAC)
Based on analyses of satellite imagery and wind model data, the Darwin VAAC reported that during 6-9 April ash plumes from Bagana rose to an altitude of 2.1 km (7,000 ft) a.s.l. and drifted NE, E, S, and W.
Source: Darwin Volcanic Ash Advisory Centre (VAAC)
Based on analyses of satellite imagery and model data, the Darwin VAAC reported that on 29 March an ash plume from Bagana rose to an altitude of 2.1 km (7,000 ft) a.s.l. and drifted SW. On 31 March a NOTAM (notice to airmen) and pilot report suggested that an ash plume rose to an altitude of 2.1 km though ash was not identified in mostly clear satellite images. An ash plume observed on 2 April rose to an altitude of 2.1 km and drifted almost 40 km E.
Source: Darwin Volcanic Ash Advisory Centre (VAAC)
Based on analyses of satellite imagery and model data, the Darwin VAAC reported that during 27-28 March a minor ash plume from Bagana rose to an altitude of 2.1 km (7,000 ft) a.s.l. and drifted 110 km SW and W.
Source: Darwin Volcanic Ash Advisory Centre (VAAC)
Based on analyses of satellite imagery and wind data, the Darwin VAAC reported that on 17 March an ash plume from Bagana rose to an altitude of 2.1 km (7,000 ft) a.s.l. and drifted W. The next day an ash plume rose to an altitude of 3 km (10,000 ft) a.s.l. and drifted almost 85 km W.
Source: Darwin Volcanic Ash Advisory Centre (VAAC)
Based on analyses of satellite imagery and wind data, the Darwin VAAC reported that on 14 March a minor ash emission from Bagana rose to an altitude of 2.4 km (8,000 ft) a.s.l. and drifted WSW.
Source: Darwin Volcanic Ash Advisory Centre (VAAC)
Based on analyses of satellite imagery and wind data, the Darwin VAAC reported that during 4-5 and 7 March ash plumes from Bagana rose to altitudes of 2.1-2.4 km (7,000-8,000 ft) a.s.l. and drifted 65 km W and SW.
Source: Darwin Volcanic Ash Advisory Centre (VAAC)
Based on analyses of satellite imagery, the Darwin VAAC reported that on 26 February a diffuse ash plume from Bagana rose to an altitude of 3 km (10,000 ft) a.s.l. and drifted ESE.
Source: Darwin Volcanic Ash Advisory Centre (VAAC)
Based on analyses of satellite imagery, the Darwin VAAC reported that during 16 and 18-20 February ash plumes from Bagana rose to altitudes of 2.4-3.4 km (8,000-11,000 ft) a.s.l. and drifted SSE, S, and SW. Ash plumes drifted as far as 85 km during 19-20 February.
Source: Darwin Volcanic Ash Advisory Centre (VAAC)
Based on analyses of satellite imagery, the Darwin VAAC reported that on 25 January an ash plume from Bagana rose to an altitude of 3 km (10,000 ft) a.s.l. and drifted SE.
Source: Darwin Volcanic Ash Advisory Centre (VAAC)
Based on analyses of satellite imagery, the Darwin VAAC reported that on 19 January an ash plume from Bagana rose to an altitude of 3 km (10,000 ft) a.s.l. and drifted SE. On 24 January ash plumes visible in satellite images and observed by a pilot rose to altitudes of 3-4.3 km (10,000-14,000 ft) a.s.l and drifted almost 140 km NE.
Source: Darwin Volcanic Ash Advisory Centre (VAAC)
Based on analyses of satellite imagery and model data, the Darwin VAAC reported that during 7-8 January ash plumes from Bagana rose to an altitude of 2.7 km (9,000 ft) a.s.l. and drifted over 45 km NE and E.
Source: Darwin Volcanic Ash Advisory Centre (VAAC)
Based on analyses of satellite imagery and model data, the Darwin VAAC reported that on 31 December ash plumes from Bagana rose to an altitude of 2.1 km (7,000 ft) a.s.l. and drifted 35-55 km NE, E, and ESE. Only weak steam emissions were observed the next day.
Source: Darwin Volcanic Ash Advisory Centre (VAAC)
Based on analyses of satellite imagery and model data, the Darwin VAAC reported that during 22 and 25-27 December ash plumes from Bagana rose to altitudes of 2.1-2.4 km (7,000-8,000 ft) a.s.l. and drifted 45-85 km S, SW, and WSW.
Source: Darwin Volcanic Ash Advisory Centre (VAAC)
Based on analyses of satellite imagery and model data, the Darwin VAAC reported that during 16-17 December ash plumes from Bagana rose to an altitude of 2.1 km (7,000 ft) a.s.l. and drifted E and NE.
Source: Darwin Volcanic Ash Advisory Centre (VAAC)
Based on analyses of satellite imagery and model data, the Darwin VAAC reported that during 8-13 December ash plumes from Bagana rose to an altitude of 2.1 km (7,000 ft) a.s.l. and drifted W, SW, S, and NE.
Source: Darwin Volcanic Ash Advisory Centre (VAAC)
Based on analyses of satellite imagery and model data, the Darwin VAAC reported that during 3-6 December ash plumes from Bagana rose to altitudes of 2.1-3 km (7,000-10,000 ft) a.s.l. and drifted NW, W, WSW, and SW.
Source: Darwin Volcanic Ash Advisory Centre (VAAC)
Based on analyses of satellite imagery and model data, the Darwin VAAC reported that during 4 and 6-8 October ash plumes from Bagana rose to altitudes of 2.1-2.4 km (7,000-8,000 ft) a.s.l. and drifted W, S, ESE, and E.
Source: Darwin Volcanic Ash Advisory Centre (VAAC)
Based on analyses of satellite imagery and model data, the Darwin VAAC reported that during 28-29 October ash plumes from Bagana rose to an altitude of 2.1 km (7,000 ft) a.s.l. and drifted W.
Source: Darwin Volcanic Ash Advisory Centre (VAAC)
Based on analyses of satellite imagery and model data, the Darwin VAAC reported that during 19 and 24-25 October ash plumes from Bagana rose to altitudes of 2.1-3 km (7,000-10,000 ft) a.s.l. and drifted NW and W.
Source: Darwin Volcanic Ash Advisory Centre (VAAC)
Based on analyses of satellite imagery and wind data, the Darwin VAAC reported that on 15 October an ash plume from Bagana rose to an altitude of 2.4 km (8,000 ft) a.s.l. and drifted over 90 km SW. During 18-19 October ash plumes rose to an altitude of 2.1 km (7,000 ft) a.s.l. and drifted 65-120 km SW and NW.
Source: Darwin Volcanic Ash Advisory Centre (VAAC)
Based on analyses of satellite imagery and model data, the Darwin VAAC reported that during 29 September-2 October ash plumes from Bagana rose to an altitude of 2.4 km (8,000 ft) a.s.l. and drifted 45-65 km SE and W.
Source: Darwin Volcanic Ash Advisory Centre (VAAC)
Based on analyses of satellite imagery and model data, the Darwin VAAC reported that on 27 September ash plumes from Bagana rose to an altitude of 2.1 km (7,000 ft) a.s.l. and drifted 85-95 km SW and WSW.
Source: Darwin Volcanic Ash Advisory Centre (VAAC)
Based on analyses of satellite imagery and model data, the Darwin VAAC reported that on 7 September ash plumes from Bagana rose to an altitude of 2.1 km (7,000 ft) a.s.l. and drifted over 35 km NW and W. On 9 September an ash plume rose to an altitude of 3 km (10,000 ft) a.s.l. and drifted 65-160 km SW.
Source: Darwin Volcanic Ash Advisory Centre (VAAC)
Based on analyses of satellite imagery and model data, the Darwin VAAC reported that during 29-30 August ash plumes from Bagana rose to an altitude of 2.1 km (7,000 ft) a.s.l. and drifted W and WNW.
Source: Darwin Volcanic Ash Advisory Centre (VAAC)
Based on analyses of satellite imagery and model data, the Darwin VAAC reported that on 21 August ash plumes from Bagana rose to an altitude of 2.4 km (8,000 ft) a.s.l. and drifted 65-75 km E.
Source: Darwin Volcanic Ash Advisory Centre (VAAC)
Based on analyses of satellite imagery and model data, the Darwin VAAC reported that during 3-8 August ash plumes from Bagana rose to an altitude of 2.1 km (7,000 ft) a.s.l. and drifted SW, WSW, W, and NW.
Source: Darwin Volcanic Ash Advisory Centre (VAAC)
Based on analyses of satellite imagery and model data, the Darwin VAAC reported that during 29 July-1 August ash plumes from Bagana rose to an altitude of 2.1 km (7,000 ft) a.s.l. and drifted SW, W, and NW.
Source: Darwin Volcanic Ash Advisory Centre (VAAC)
Based on analyses of satellite imagery and model data, the Darwin VAAC reported that during 21-23 July ash plumes from Bagana rose to altitudes of 2.1-3 km (7,000-10,000 ft) a.s.l. and drifted 22-55 km SW, W, and NW.
Source: Darwin Volcanic Ash Advisory Centre (VAAC)
Based on analyses of satellite imagery and model data, the Darwin VAAC reported that during 17-18 July ash plumes from Bagana rose to an altitude of 2.4 km (8,000 ft) a.s.l. and drifted over 90 km W and NW.
Source: Darwin Volcanic Ash Advisory Centre (VAAC)
Based on analyses of satellite imagery and model data, the Darwin VAAC reported that during 6-10 July ash plumes from Bagana rose to altitude of 2.1-2.7 km (7,000-9,000 ft) a.s.l. and drifted as far as 120 km SE, SW, W, and NW.
Source: Darwin Volcanic Ash Advisory Centre (VAAC)
Based on analyses of satellite imagery and model data, the Darwin VAAC reported that during 1-5 July ash plumes from Bagana rose to an altitude of 2.7 km (9,000 ft) a.s.l. and drifted 75 km W and SW.
Source: Darwin Volcanic Ash Advisory Centre (VAAC)
Based on analyses of satellite imagery and model data, the Darwin VAAC reported that on 16 June ash plumes from Bagana rose to an altitude of 2.1 km (7,000 ft) a.s.l. and drifted over 45 km W.
Source: Darwin Volcanic Ash Advisory Centre (VAAC)
Based on analyses of satellite imagery and model data, the Darwin VAAC reported that during 8-12 June ash plumes from Bagana rose to an altitude of 2.1 km (7,000 ft) a.s.l. and drifted as far as 85 km SW, W, N, and NE.
Source: Darwin Volcanic Ash Advisory Centre (VAAC)
Based on analyses of satellite imagery and model data, the Darwin VAAC reported that on 2 June ash plumes from Bagana rose to an altitude of 2.1 km (7,000 ft) a.s.l. and drifted 75 km in multiple directions.
Source: Darwin Volcanic Ash Advisory Centre (VAAC)
Based on analyses of satellite imagery and model data, the Darwin VAAC reported that during 25-29 May ash plumes from Bagana rose to an altitude of 2.1 km (7,000 ft) a.s.l. and drifted 75 km in multiple directions.
Source: Darwin Volcanic Ash Advisory Centre (VAAC)
Based on analyses of satellite imagery and model data, the Darwin VAAC reported that on 22 May ash plumes from Bagana rose to an altitude of 2.1 km (7,000 ft) a.s.l. and drifted over 110 km W.
Source: Darwin Volcanic Ash Advisory Centre (VAAC)
Based on analyses of satellite imagery and model data, the Darwin VAAC reported that during 4-9 May ash plumes from Bagana rose to an altitude of 2.1 km (7,000 ft) a.s.l. and drifted almost 140 km SW and W.
Source: Darwin Volcanic Ash Advisory Centre (VAAC)
Based on analyses of satellite imagery and model data, the Darwin VAAC reported that during 27 April-3 May ash plumes from Bagana rose to an altitude of 2.1 km (7,000 ft) a.s.l. and drifted 45-100 km SW, W, and NW.
Source: Darwin Volcanic Ash Advisory Centre (VAAC)
Based on analyses of satellite imagery and model data, the Darwin VAAC reported that during 23-24 and 26 April ash plumes from Bagana rose to altitudes of 2.1-3 km (7,000-10,000 ft) a.s.l. and drifted 25-95 km S, SW, and NW.
Source: Darwin Volcanic Ash Advisory Centre (VAAC)
Based on analyses of satellite imagery and wind-model data, the Darwin VAAC reported that on 24 March ash plumes from Bagana rose to an altitude of 3.6 km (12,000 ft) a.s.l. and drifted 45-55 km NE and ENE.
Source: Darwin Volcanic Ash Advisory Centre (VAAC)
Based on analyses of satellite imagery and model data, the Darwin VAAC reported that on 11 March ash plumes from Bagana rose to an altitude of 2.1 km (7,000 ft) a.s.l. and drifted almost 40 km SE.
Source: Darwin Volcanic Ash Advisory Centre (VAAC)
Based on analyses of satellite imagery and model data, the Darwin VAAC reported that on 3 March a plume from Bagana possibly containing ash rose to an altitude of 2.1 km (7,000 ft) a.s.l. and drifted 110 km NE; ash was not discernible in images and RVO stated that ash was not seen by ground observers. The next day an ash plume rose to an altitude of 2.1 km (7,000 ft) a.s.l. and drifted 45-55 km NE and E.
Source: Darwin Volcanic Ash Advisory Centre (VAAC)
Based on analyses of satellite imagery and wind data, the Darwin VAAC reported that during 29-30 October ash plumes from Bagana rose to altitudes of 2.1-2.4 km (7,000-8,000 ft) a.s.l. and drifted 35-55 km SE, S, SW and W.
Source: Darwin Volcanic Ash Advisory Centre (VAAC)
Based on analyses of satellite imagery and wind data, the Darwin VAAC reported that during 21 and 24-26 October ash plumes from Bagana rose to altitudes of 1.5-2.4 km (5,000-8,000 ft) a.s.l. and drifted 45-85 km W and NW.
Source: Darwin Volcanic Ash Advisory Centre (VAAC)
Based on analyses of satellite imagery and wind data, the Darwin VAAC reported that during 16-20 October ash plumes from Bagana rose to altitudes of 1.8-2.4 km (6,000-8,000 ft) a.s.l. and drifted 20-95 km N, NE, E, and SE.
Source: Darwin Volcanic Ash Advisory Centre (VAAC)
Based on analyses of satellite imagery and wind data, the Darwin VAAC reported that during 24 and 26-27 September ash plumes from Bagana rose to altitudes of 1.8-2.4 km (6,000-8,000 ft) a.s.l. and drifted 35-100 km N, NE, E, and SE.
Source: Darwin Volcanic Ash Advisory Centre (VAAC)
Based on analyses of satellite imagery and wind data, the Darwin VAAC reported that during 4-6 June ash plumes from Bagana rose to an altitude of 2.4 km (8,000 ft) a.s.l. and drifted 45-65 km SW, W and NE.
Source: Darwin Volcanic Ash Advisory Centre (VAAC)
Based on analyses of satellite imagery and wind data, the Darwin VAAC reported that on 28 May an ash plume from Bagana rose to an altitude of 3 km (10,000 ft) a.s.l. and drifted almost 160 km NW.
Source: Darwin Volcanic Ash Advisory Centre (VAAC)
Based on analyses of satellite imagery and wind data, the Darwin VAAC reported that during 1-2 April an ash plume from Bagana drifted 75 km SE and NE.
Source: Darwin Volcanic Ash Advisory Centre (VAAC)
Based on analyses of satellite imagery and wind data, the Darwin VAAC reported that on 26 March a low-level ash plume from Bagana drifted 37 km NE. During 27-29 March ash plumes rose to an altitude of 3 km (10,000 ft) a.s.l. and drifted 55 km NE and N. On 1 April an ash plume drifted 75 km SE.
Source: Darwin Volcanic Ash Advisory Centre (VAAC)
Based on analyses of satellite imagery and wind data, the Darwin VAAC reported that on 21 January ash plumes from Bagana rose to an altitude of 3.7 km (12,000 ft) a.s.l. and drifted 22-40 km NE. The next day ash plumes drifted almost 20 km SW.
Source: Darwin Volcanic Ash Advisory Centre (VAAC)
Based on analyses of satellite imagery and wind data, the Darwin VAAC reported that on 29 December an ash plume from Bagana rose to an altitude of 2.4 km (8,000 ft) a.s.l. and drifted almost 95 km NE.
Source: Darwin Volcanic Ash Advisory Centre (VAAC)
Based on analyses of satellite imagery and wind data, the Darwin VAAC reported that on 9 November an ash plume from Bagana drifted 65 km S.
Source: Darwin Volcanic Ash Advisory Centre (VAAC)
Based on analyses of satellite imagery and wind data, the Darwin VAAC reported that on 21 September an ash plume from Bagana rose to an altitude of 2.4 km (8,000 ft) a.s.l. and drifted 55 km W.
Source: Darwin Volcanic Ash Advisory Centre (VAAC)
During 25-28 August the Darwin VAAC reported ash plumes at Bagana that rose 2.1-2.4 km (7,000-8,000 ft) a.s.l. and drifted 35-65 km W, SW and WNW. The Aviation Color Code remained at Orange.
Source: Darwin Volcanic Ash Advisory Centre (VAAC)
During 25-26 August the Darwin VAAC reported ash plumes at Bagana that rose 2.1-2.4 km (7,000-8,000 ft) a.s.l. and drifted 65-120 km W and WNW. The Aviation Color Code remained at Orange.
Source: Darwin Volcanic Ash Advisory Centre (VAAC)
During 6-12 August, DMPGM reported increasing volcanic activity at Bagana volcano. Thin to thick white vapor plumes from Bagana were accompanied on 6, 8 August by reports of rockfalls. On 10 August an ash plume rose to an estimated several hundred meters above the crater drifting SW and W. Moderate ash was reported in Wakovi (6 km W) and decreased downwind. Residents were advised to evacuate to Gotana (9 km SW) if ashfall continued. On 11 August the Darwin VAAC reported ash plumes rose to 3 km (10,000 ft) a.s.l. and drifted up to 55 km SW. On 12 August Darwin VAAC raised the Aviation Color Code to Red as ash plumes rose to 7.6 km (25,000 ft) a.s.l. and drifted up to 167 km SW.
Sources: Darwin Volcanic Ash Advisory Centre (VAAC); Department of Mineral Policy and Geohazards Management (DMPGM)
Based on analyses of satellite imagery and wind data, the Darwin VAAC reported that during 11-12 June ash plumes from Bagana rose to an altitude of 2.4 km (8,000 ft) a.s.l. and drifted 25-40 km SW and W.
Source: Darwin Volcanic Ash Advisory Centre (VAAC)
Based on analyses of satellite imagery and wind data, the Darwin VAAC reported that on 10 June an ash plume from Bagana rose to an altitude of 2.4 km (8,000 ft) a.s.l. and drifted over 35 km SW.
Source: Darwin Volcanic Ash Advisory Centre (VAAC)
Based on analyses of satellite imagery and wind data, the Darwin VAAC reported that on 27 May an ash plume from Bagana rose to an altitude of 3 km (10,000 ft) a.s.l. and drifted 65 km W.
Source: Darwin Volcanic Ash Advisory Centre (VAAC)
Based on analyses of satellite imagery and wind data, the Darwin VAAC reported that on 1 May an ash plume from Bagana rose to an altitude of 2.1 km (7,000 ft) a.s.l. and drifted over 45 km SSE.
Source: Darwin Volcanic Ash Advisory Centre (VAAC)
Based on analyses of satellite imagery and wind data, the Darwin VAAC reported that on 22 March an ash plume from Bagana rose to an altitude of 3 km (10,000 ft) a.s.l. and drifted 110 km NE.
Source: Darwin Volcanic Ash Advisory Centre (VAAC)
Based on analyses of satellite imagery and wind data, the Darwin VAAC reported that on 12 February an ash plume from Bagana rose to an altitude of 3 km (10,000 ft) a.s.l. and drifted 110 km E.
Source: Darwin Volcanic Ash Advisory Centre (VAAC)
Based on analyses of satellite imagery and wind data, the Darwin VAAC reported that on 22 December an ash plume from Bagana rose to an altitude of 2.7 km (9,000 ft) a.s.l. and drifted 75 km NE.
Source: Darwin Volcanic Ash Advisory Centre (VAAC)
Based on analyses of satellite imagery and wind data, the Darwin VAAC reported that during 5-6 December ash plumes from Bagana drifted 55-65 km W. During 9-10 December ash plumes rose to an altitude of 3 km (10,000 ft) a.s.l. and drifted 35-45 km NE and E.
Source: Darwin Volcanic Ash Advisory Centre (VAAC)
Based on analyses of satellite imagery and wind data, the Darwin VAAC reported that during 14-18 November ash plumes from Bagana rose to an altitude of 2.7 km (9,000 ft) a.s.l. and drifted 35-110 km W and SW.
Source: Darwin Volcanic Ash Advisory Centre (VAAC)
Based on analyses of satellite imagery and wind data, the Darwin VAAC reported that on 19 September an ash plume from Bagana rose to an altitude of 2.7 km (8,000 ft) a.s.l. and drifted 75 km W.
Source: Darwin Volcanic Ash Advisory Centre (VAAC)
Based on analyses of satellite imagery and wind data, the Darwin VAAC reported that during 16-17 September ash plumes from Bagana rose to an altitude of 2.4 km (8,000 ft) a.s.l. and drifted 35-55 km NW and SW.
Source: Darwin Volcanic Ash Advisory Centre (VAAC)
Based on analyses of satellite imagery and wind data, the Darwin VAAC reported that on 17 June an ash plume from Bagana rose to altitudes of 2.1-2.4 km (7,000-8,000 ft) a.s.l. and drifted over 35 km NW.
Source: Darwin Volcanic Ash Advisory Centre (VAAC)
Based on analyses of satellite imagery and wind data, the Darwin VAAC reported that on 4 June an ash plume from Bagana rose to an altitude of 2.4 km (8,000 ft) a.s.l. and drifted over 35 km W.
Source: Darwin Volcanic Ash Advisory Centre (VAAC)
Based on analyses of satellite imagery and wind data, the Darwin VAAC reported that on 24 May an ash plume from Bagana rose to an altitude of 2.1 km (7,000 ft) a.s.l. and drifted over 35 km NW and N.
Source: Darwin Volcanic Ash Advisory Centre (VAAC)
Based on analyses of satellite imagery and wind data, the Darwin VAAC reported that during 5-6 May ash plumes from Bagana rose to an altitude of 2.1 km (7,000 ft) a.s.l. and drifted 75-85 km W.
Source: Darwin Volcanic Ash Advisory Centre (VAAC)
Based on analyses of satellite imagery and wind data, the Darwin VAAC reported that during 10-11 April ash plumes from Bagana rose to an altitude of 2.4 km (8,000 ft) a.s.l. and drifted 75 km SW and W. On 15 April an ash plume rose to an altitude of 1.8 km (6,000 ft) a.s.l. and drifted almost 30 km S and W. The next day ash plumes rose to an altitude of 3 km (10,000 ft) a.s.l. and drifted 65 km SW.
Source: Darwin Volcanic Ash Advisory Centre (VAAC)
Based on analyses of satellite imagery and wind data, the Darwin VAAC reported that on 7 April ash plumes from Bagana rose to an altitude of 3 km (10,000 ft) a.s.l. and drifted almost 85 km SW and WSW. On 9 April an ash plume rose to an altitude of 4 km (13,000 ft) a.s.l. and drifted almost 75 km SW.
Source: Darwin Volcanic Ash Advisory Centre (VAAC)
Based on analyses of satellite imagery and wind data, the Darwin VAAC reported that during 25-26 March ash plumes from Bagana rose to an altitude of 3 km (10,000 ft) a.s.l. and drifted 45-55 km E.
Source: Darwin Volcanic Ash Advisory Centre (VAAC)
Based on analyses of satellite imagery and wind data, the Darwin VAAC reported that during 12-14 February ash plumes from Bagana rose to an altitude of 1.5 km (5,000 ft) a.s.l. and drifted 35-55 km SW and NW.
Source: Darwin Volcanic Ash Advisory Centre (VAAC)
Based on analyses of satellite imagery and wind data, the Darwin VAAC reported that during 8-12 February ash plumes from Bagana rose to altitudes of 1.5-3 km (5,000-10,000 ft) a.s.l. and drifted 35-130 km E and NW.
Source: Darwin Volcanic Ash Advisory Centre (VAAC)
RVO reported that white vapor from Bagana was emitted during 1 November-12 December. Occasional weak incandescence from the crater was observed at night during 3-8, 10, 17-20, and 29-30 November. An eruption during 1200-1300 on 13 December was followed by light ashfall in Arawa (40 km SE) and heavier ashfall in Manetai (11 km E). A small amount of ashfall was reported in Arawa the next day; the volcano was mostly quiet during 14-15 December.
Source: Rabaul Volcano Observatory (RVO)
Based on analyses of satellite imagery, the Darwin VAAC reported that on 3 October an ash plume from Bagana rose to an altitude of 4.3 km (14,000 ft) a.s.l. and drifted 65 km NW.
Source: Darwin Volcanic Ash Advisory Centre (VAAC)
Based on analyses of satellite imagery, the Darwin VAAC reported that on 27 September an ash plume from Bagana rose to an altitude of 2.4 km (8,000 ft) a.s.l. and drifted 37 km N.
Source: Darwin Volcanic Ash Advisory Centre (VAAC)
Based on analyses of satellite imagery, the Darwin VAAC reported that on 2 August ash plumes from Bagana rose to an altitude of 3 km (10,000 ft) a.s.l. and drifted 37 km NW and W.
Source: Darwin Volcanic Ash Advisory Centre (VAAC)
Based on analyses of satellite imagery, the Darwin VAAC reported that on 4 July ash plumes from Bagana rose to altitudes of 2.4-3 km (8,000-10,000 ft) a.s.l. and drifted 55 km W.
Source: Darwin Volcanic Ash Advisory Centre (VAAC)
Based on analyses of satellite imagery, the Darwin VAAC reported that on 10 June ash plumes from Bagana rose to an altitude of 2.4 km (8,000 ft) a.s.l. and drifted 45-130 km SW.
Source: Darwin Volcanic Ash Advisory Centre (VAAC)
According to NASA's Earth Observatory, a satellite image of Bagana acquired on 16 May showed a lava flow on the E flank. Other satellite images indicated that the lava flow was emplaced sometime between March 2011 and February 2012. A plume drifted W.
Source: NASA Earth Observatory
Based on analyses of satellite imagery, the Darwin VAAC reported that on 7 March an ash plume from Bagana rose to an altitude of 2.4 km (8,000 ft) a.s.l. and drifted 37 km SW.
Source: Darwin Volcanic Ash Advisory Centre (VAAC)
Based on analyses of satellite imagery, the Darwin VAAC reported that during 8-9 October ash plumes from Bagana rose to an altitude of 3 km (10,000 ft) a.s.l. and drifted 45-55 km E and NW.
Source: Darwin Volcanic Ash Advisory Centre (VAAC)
Based on analyses of satellite imagery, the Darwin VAAC reported that on 23 August an ash plume from Bagana rose to an altitude of 3 km (10,000 ft) a.s.l. and drifted 93 km SW.
Source: Darwin Volcanic Ash Advisory Centre (VAAC)
Based on analyses of satellite imagery, the Darwin VAAC reported that on 21 August an ash plume from Bagana rose to an altitude of 3 km (10,000 ft) a.s.l. and drifted 93 km SW.
Source: Darwin Volcanic Ash Advisory Centre (VAAC)
Based on analyses of satellite imagery, the Darwin VAAC reported that on 21 May an ash plume from Bagana rose to an altitude of 2.1 km (7,000 ft) a.s.l. and drifted 65 km NW.
Source: Darwin Volcanic Ash Advisory Centre (VAAC)
Based on analyses of satellite imagery, the Darwin VAAC reported that on 16 May an ash plume from Bagana rose to an altitude of 2.1 km (7,000 ft) a.s.l. and drifted 55 km NE.
Source: Darwin Volcanic Ash Advisory Centre (VAAC)
Based on analyses of satellite imagery, the Darwin VAAC reported that during 25-28 March ash plumes from Bagana rose to an altitude of 2.1 km (7,000 ft) a.s.l. and drifted 35-100 km NW, W, and SW.
Source: Darwin Volcanic Ash Advisory Centre (VAAC)
Based on analyses of satellite imagery, the Darwin VAAC reported that during 18-19 March ash plumes from Bagana rose to an altitude of 2.4 km (8,000 ft) a.s.l. and drifted 75-110 km SW.
Source: Darwin Volcanic Ash Advisory Centre (VAAC)
Based on analyses of satellite imagery, the Darwin VAAC reported that on 1 October an ash plume from Bagana rose to an altitude of 2.4 km (8,000 ft) a.s.l. and drifted 75 km NW.
Source: Darwin Volcanic Ash Advisory Centre (VAAC)
Based on analyses of satellite imagery, the Darwin VAAC reported that during 13-15 August ash plumes from Bagana rose to an altitude of 2.4 km (8,000 ft) a.s.l. and drifted 75 km SW and W.
Source: Darwin Volcanic Ash Advisory Centre (VAAC)
Based on analyses of satellite imagery, the Darwin VAAC reported that an ash plume from Bagana rose to an altitude of 2.4 km (8,000 ft) a.s.l. and drifted 75-150 km SW during 10-11 July.
Source: Darwin Volcanic Ash Advisory Centre (VAAC)
Based on analyses of satellite imagery, the Darwin VAAC reported that an ash plume from Bagana rose to an altitude of 2.4 km (8,000 ft) a.s.l. on 4 July and drifted 75 km W.
Source: Darwin Volcanic Ash Advisory Centre (VAAC)
Based on analyses of satellite imagery, the Darwin VAAC reported that ash plumes from Bagana rose to an altitude of 3 km (10,000 ft) a.s.l. during 13-14 June and drifted 75-205 km SW and W.
Source: Darwin Volcanic Ash Advisory Centre (VAAC)
Based on analyses of satellite imagery, the Darwin VAAC reported that ash plumes from Bagana rose to an altitude of 3 km (10,000 ft) a.s.l. during 26-28 May and drifted 30-185 km SW and W.
Source: Darwin Volcanic Ash Advisory Centre (VAAC)
Based on analyses of satellite imagery, the Darwin VAAC reported that an ash plume from Bagana rose to an altitude of 3 km (10,000 ft) a.s.l. on 25 May and drifted 55-160 km NW and W.
Source: Darwin Volcanic Ash Advisory Centre (VAAC)
Based on analyses of satellite imagery, the Darwin VAAC reported that an ash plume from Bagana rose to an altitude of 2.4 km (8,000 ft) a.s.l. on 12 May and drifted 55-75 km W and WSW.
Source: Darwin Volcanic Ash Advisory Centre (VAAC)
Based on analyses of satellite imagery, the Darwin VAAC reported that ash plumes from Bagana rose to altitudes of 2.4-3 km (8,000-10,000 ft) a.s.l. during 6 and 10-11 May and drifted 65 km W and SW.
Source: Darwin Volcanic Ash Advisory Centre (VAAC)
Based on analyses of satellite imagery, the Darwin VAAC reported that during 19-20, 23, 25, and 27 April ash plumes from Bagana rose to altitudes of 1.5-3 km (5,000-10,000 ft) a.s.l. and drifted 35-85 km S, SW, W, and NW.
Source: Darwin Volcanic Ash Advisory Centre (VAAC)
RVO reported that white vapor from Bagana was emitted during 1-21 February. Ash plumes were seen on 5 February and night-time incandescence was seen on 2, 12, 13, and 19 February. Sulfur dioxide plumes drifted ENE during 11-20 February and NNW on 20 and 21 February.
Source: Rabaul Volcano Observatory (RVO)
Based on analyses of satellite imagery, the Darwin VAAC reported that during 11-15 February ash plumes from Bagana rose to an altitude of 2.4 km (8,000 ft) a.s.l. and drifted 20-150 km E and NE.
Source: Darwin Volcanic Ash Advisory Centre (VAAC)
Based on analyses of satellite imagery, the Darwin VAAC reported that on 12 November an ash plume from Bagana rose to an altitude of 3 km (10,000 ft) a.s.l. and drifted 65 km SW.
Source: Darwin Volcanic Ash Advisory Centre (VAAC)
Based on analyses of satellite imagery, the Darwin VAAC reported that on 15 October an ash plume from Bagana rose to an altitude of 2.1 km (7,000 ft) a.s.l. and drifted 55 km SW.
Source: Darwin Volcanic Ash Advisory Centre (VAAC)
Based on analyses of satellite imagery, the Darwin VAAC reported that on 9 October an ash plume from Bagana rose to an altitude of 2.4 km (8,000 ft) a.s.l. and drifted 45 km SW.
Source: Darwin Volcanic Ash Advisory Centre (VAAC)
Based on analyses of satellite imagery, the Darwin VAAC reported that during 17-19 September ash plumes from Bagana rose to an altitude of 2.4 km (8,000 ft) a.s.l. and drifted 25-45 km NW, W, and SW.
Source: Darwin Volcanic Ash Advisory Centre (VAAC)
Based on analyses of satellite imagery, the Darwin VAAC reported that during 12-13 September ash plumes from Bagana rose to an altitude of 2.4 km (8,000 ft) a.s.l. and drifted 35-65 km NW and W.
Source: Darwin Volcanic Ash Advisory Centre (VAAC)
Based on analyses of satellite imagery, the Darwin VAAC reported that on 19 August an ash plume from Bagana rose to an altitude of 2.1 km (7,000 ft) a.s.l. and drifted more than 90 km W.
Source: Darwin Volcanic Ash Advisory Centre (VAAC)
Based on analyses of satellite imagery, the Darwin VAAC reported that on 10 August a diffuse ash plume from Bagana rose to an altitude of 3 km (10,000 ft) a.s.l. and drifted 55 km NW.
Source: Darwin Volcanic Ash Advisory Centre (VAAC)
Based on analyses of satellite imagery, the Darwin VAAC reported that on 19 July an ash plume from Bagana rose to an altitude of 1.8 km (6,000 ft) a.s.l. and drifted 100 km NW.
Source: Darwin Volcanic Ash Advisory Centre (VAAC)
Based on analysis of satellite imagery, the Darwin VAAC reported that on 27 June an ash plume from Bagana rose to an altitude of 2.4 km (8,000 ft) a.s.l. and drifted 110 km SW.
Source: Darwin Volcanic Ash Advisory Centre (VAAC)
Based on analysis of satellite imagery, the Darwin VAAC reported that on 2 June an ash plume from Bagana rose to an altitude of 2.4 km (8,000 ft) a.s.l. and drifted 75 km W.
Source: Darwin Volcanic Ash Advisory Centre (VAAC)
Based on analysis of satellite imagery, the Darwin VAAC reported that on 2 and 4 May ash plumes from Bagana rose to altitudes of 2.4-3 km (8,000-10,000 ft) a.s.l. and drifted 45-55 km NE.
Source: Darwin Volcanic Ash Advisory Centre (VAAC)
Based on analysis of satellite imagery, the Darwin VAAC reported that on 26 April an ash plume from Bagana rose to an altitude of 2.4 km (8,000 ft) a.s.l. and drifted 28 km S.
Source: Darwin Volcanic Ash Advisory Centre (VAAC)
Based on analysis of satellite imagery, the Darwin VAAC reported that on 31 December an ash plume from Bagana rose to an altitude of 2.4 km (8,000 ft) a.s.l.
Source: Darwin Volcanic Ash Advisory Centre (VAAC)
Based on analysis of satellite imagery, the Darwin VAAC reported that on 29 December an ash plume from Bagana drifted about 75 km W. On 30 December an ash plume rose to an altitude of 2.4 km (8,000 ft) a.s.l. and drifted NW.
Source: Darwin Volcanic Ash Advisory Centre (VAAC)
Based on analysis of satellite imagery, the Darwin VAAC reported that on 17 December an ash plume from Bagana rose to an altitude of 3 km (10,000 ft) a.s.l. and drifted W.
Source: Darwin Volcanic Ash Advisory Centre (VAAC)
Based on analysis of satellite imagery, the Darwin VAAC reported that on 16 December an ash plume from Bagana rose to an altitude of 3 km (10,000 ft) a.s.l. and drifted SW.
Source: Darwin Volcanic Ash Advisory Centre (VAAC)
Based on analysis of satellite imagery, the Darwin VAAC reported that on 2 December an ash plume from Bagana rose to an altitude of 3 km (10,000 ft) a.s.l. and drifted NW.
Source: Darwin Volcanic Ash Advisory Centre (VAAC)
Based on analysis of satellite imagery, the Darwin VAAC reported that on 20 November an ash plume from Bagana rose to an altitude of 3 km (10,000 ft) a.s.l. and drifted about 75 km SW. On 26 November a low-level plume drifted W.
Source: Darwin Volcanic Ash Advisory Centre (VAAC)
Based on analysis of satellite imagery, the Darwin VAAC reported that on 8 October low-level ash plumes from Bagana rose to an altitude of 3 km (10,000 ft) a.s.l. and drifted about 55-110 km WSW.
Source: Darwin Volcanic Ash Advisory Centre (VAAC)
Based on analysis of satellite imagery, the Darwin VAAC reported that during 21-22 September low-level ash plumes from Bagana rose to an altitude of 2.4 km (8,000 ft) a.s.l. and drifted SW.
Source: Darwin Volcanic Ash Advisory Centre (VAAC)
Based on analysis of satellite imagery, the Darwin VAAC reported that on 16 September a low-level ash plume from Bagana rose to an altitude of 2.4 km (8,000 ft) a.s.l. and drifted SW.
Source: Darwin Volcanic Ash Advisory Centre (VAAC)
Based on observations of satellite imagery, the Darwin VAAC reported that on 22 May a low-level ash plume from Bagana rose to an altitude of 3.7 km (12,000 ft) a.s.l. and drifted S.
Source: Darwin Volcanic Ash Advisory Centre (VAAC)
Based on observations of satellite imagery and information from RVO, the Darwin VAAC reported that a diffuse plume from Bagana rose to an altitude of less than 3 km (10,000 ft) a.s.l. and drifted SW on 3 March. Later that day an ash-and-steam plume drifted SW.
Source: Darwin Volcanic Ash Advisory Centre (VAAC)
Based on observations of satellite imagery, the Darwin VAAC reported that an ash-and-steam plume from Bagana drifted WSW on 26 December. A plume rose to an altitude of 3 km (10,000 ft) a.s.l. and drifted W on 27 December. RVO advised that intermittent activity was continuing.
Source: Darwin Volcanic Ash Advisory Centre (VAAC)
Based on observations of satellite imagery and reports from the RVO, the Darwin VAAC reported that a plume from Bagana rose to an altitude of 3 km (10,000 ft) a.s.l. and drifted SW on 21 December. An ash-and-steam plume was also visible on 26 December and drifted WSW.
Source: Darwin Volcanic Ash Advisory Centre (VAAC)
Based on observations of satellite imagery, the Darwin VAAC reported that a low-level plume from Bagana drifted SW on 10 December and an ash-and-steam plume was observed on 17 December.
Source: Darwin Volcanic Ash Advisory Centre (VAAC)
RVO reported that during 18 October-10 December white vapor plumes from Bagana were occasionally accompanied by ash plumes generated by rockfalls from the edges of the lava flow on the SE flank. Occasionally, booming and roaring noises were heard and incandescence at the summit was observed. Two explosions were accompanied by ash plumes on 19 and 27 November. Incandescent lava fragments were ejected from the summit on 7 and 9 December. On 9 December, an ash plume rose to an altitude of 2.8 km (9,200 ft) a.s.l. A lava flow became active and was continuously incandescent down the SE flank.
Source: Rabaul Volcano Observatory (RVO)
During 1-18 October, white vapor plumes from Bagana were occasionally accompanied by ash plumes that were generated by rockfalls from the edges of the lava flow on the SE flank. Incandescence was noted during most of the reporting period at the summit and occasionally from the lava flow. Based on observations of satellite imagery, the Darwin VAAC reported that ash plumes drifted N then NW on 19 October.
Sources: Rabaul Volcano Observatory (RVO); Darwin Volcanic Ash Advisory Centre (VAAC)
RVO reported that white vapor emissions from Bagana's summit crater continued during 24 August-30 September. Forceful emissions on 25 August and 12 September were occasionally accompanied by ash clouds produced by collapses at the edges of a lava flow on the SE flank.
Source: Rabaul Volcano Observatory (RVO)
RVO reported that an effusive lava flow from Bagana's summit crater began travelling down the SE flank on 6 August and continued flowing through 23 August. Continuous incandescence was visible down the SE flank during 6-10 August. During 6-23 August, white vapor plumes were occasionally accompanied by ash plumes that were generated by rockfalls from lava-flow edges. Based on satellite imagery, the Darwin VAAC reported that a diffuse plume rose to an altitude of 3.7 km (12,000 ft) a.s.l. on 23 August.
Sources: Rabaul Volcano Observatory (RVO); Darwin Volcanic Ash Advisory Centre (VAAC)
RVO reported that white vapor emissions from Bagana's summit crater continued during 1-11 June. Based on satellite imagery and information from RVO, the Darwin VAAC reported that a low-level diffuse plume rose to an altitude of 3 km (10,000 ft) a.s.l. and drifted W on 11 June.
Sources: Rabaul Volcano Observatory (RVO); Darwin Volcanic Ash Advisory Centre (VAAC)
Based on satellite image observations and information from RVO, the Darwin VAAC reported that a diffuse ash-and-steam plume rose to an altitude of 3.7 km (12,000 ft) a.s.l. on 22 May and drifted W. Another diffuse plume was visible on satellite imagery to an altitude of 3 km (10,000 ft) a.s.l. on 28 May.
Source: Darwin Volcanic Ash Advisory Centre (VAAC)
RVO reported that white vapor emissions from Bagana's summit crater continued during 10 March-20 May. Emissions were occasionally forceful, and were accompanied by ash clouds during 17 March, 1 April, and 3-5 April. Weak roaring noises were heard on 4 April. Summit incandescence was visible on 20 and 24 March and 17 May. Based on satellite imagery and information from RVO, the Darwin VAAC reported that a diffuse plume rose to an altitude of 3 km (10,000 ft) a.s.l. and drifted SW on 20 May. RVO reported that forceful, white emissions on 21 May produced plumes to an altitude of 2.3 km (8,200 ft) a.s.l. and drifted W.
Sources: Rabaul Volcano Observatory (RVO); Darwin Volcanic Ash Advisory Centre (VAAC)
RVO reported that white vapor emissions from Bagana continued during 10 January-9 March. Emissions were occasionally forceful, and on 3 March were accompanied by an ash cloud that drifted E. Summit incandescence was visible on 7 and 8 March. Based on satellite imagery, the Darwin VAAC reported that a diffuse plume rose to an altitude of 2.4 km (8,000 ft) a.s.l. and drifted WSW on 10 March.
Sources: Rabaul Volcano Observatory (RVO); Darwin Volcanic Ash Advisory Centre (VAAC)
A diffuse plume from Bagana was visible on satellite imagery drifting SE on 9 January.
Source: Darwin Volcanic Ash Advisory Centre (VAAC)
Geologic Summary. Bagana volcano, occupying a remote portion of central Bougainville Island, is one of Melanesia's youngest and most active volcanoes. Bagana is a massive symmetrical lava cone largely constructed by an accumulation of viscous andesitic lava flows. The entire lava cone could have been constructed in about 300 years at its present rate of lava production. Eruptive activity at Bagana is characterized by non-explosive effusion of viscous lava that maintains a small lava dome in the summit crater, although explosive activity occasionally producing pyroclastic flows also occurs. Lava flows form dramatic, freshly preserved tongue-shaped lobes up to 50-m-thick with prominent levees that descend the volcano's flanks on all sides.
Source: Darwin Volcanic Ash Advisory Centre (VAAC)
Based on satellite imagery, the Darwin VAAC reported that an ash plume from Bagana rose to an altitude of 3 km (10,000 ft) a.s.l. on 5 December.
Source: Darwin Volcanic Ash Advisory Centre (VAAC)
A diffuse plume from Bagana was visible on satellite imagery on 22 November. The height and direction of the plume were not reported.
Source: Darwin Volcanic Ash Advisory Centre (VAAC)
An ash-and-steam plume from Bagana was visible on satellite imagery on 18 June drifting SW. The height of the plume was not reported.
Source: Darwin Volcanic Ash Advisory Centre (VAAC)
On 4 May, satellite imagery showed an ash plume from Bagana at a height of ~3 km (10,000 ft) a.s.l. extending 4 km W.
Source: Darwin Volcanic Ash Advisory Centre (VAAC)
During 16 February to 31 March, activity at Bagana was at moderate levels. Mostly gas emissions occurred, but on 27 March an ash cloud was emitted. During 15-31 March, observers noted moderate-to-bright incandescence, projections of lava fragments, and a lava flow traveling down the volcano's SSW flank.
Source: Rabaul Volcano Observatory (RVO) via the Darwin Volcanic Ash Advisory Center
Ash was emitted from Bagana during 17-18 September and drifted W and NW. During 14-18 September, incandescence from the volcano was visible at night. On the 18th, observers described what could have been cascading volcanic material detached from a possible active lava flow.
Source: Rabaul Volcano Observatory (RVO)
During 15-21 August, volcanic activity at Bagana remained at low levels. Variable amounts of thick "white vapor" were emitted from the summit crater. During several nights, dull-to-moderately bright incandescence was visible. On the 20th, lava flowed from volcano's main crater. Incandescent lava avalanches occasionally originated from unstable areas of the lava flow.
Source: Rabaul Volcano Observatory (RVO) via the Darwin Volcanic Ash Advisory Center
Based on information from the US Air Force Weather Agency, the Darwin VAAC reported that an ash plume from Bagana was visible at a height of ~3 km (10,000 ft a.s.l.), extending ~40 km SW of the summit. The Darwin VAAC did not see ash on satellite imagery.
Source: Darwin Volcanic Ash Advisory Centre (VAAC)
A thin plume emitted from Bagana was visible on satellite imagery on 30 June. The height of the plume was not reported.
Source: Darwin Volcanic Ash Advisory Centre (VAAC)
A plume from Bagana was visible on satellite imagery on 21 June extending W. The height of the plume was not reported.
Source: Darwin Volcanic Ash Advisory Centre (VAAC)
During 8-10 June, several low-level plumes emitted from Bagana were visible on satellite imagery. They extended predominately to the WSW.
Source: Darwin Volcanic Ash Advisory Centre (VAAC)
A plume from Bagana was observed on satellite imagery on 7 June initially extending 65 km WSW, then W later in the day. The height of the plume was not known.
Source: Darwin Volcanic Ash Advisory Centre (VAAC)
Satellite imagery taken at 0551 on 13 May revealed a thin plume extending 28 km (15 nm) ESE below 3 km altitude (10,000 feet). Similar plumes, blowing W, were identified at 0537 on the 14th and at 0634 on 15 May.
Source: Darwin Volcanic Ash Advisory Centre (VAAC)
The Darwin VAAC reported that on 17 March at 0726 a very small plume and hot spot were visible on satellite imagery.
Source: Darwin Volcanic Ash Advisory Centre (VAAC)
An ash plume from Bagana was visible on satellite imagery during 26-27 May. The plume reached a height of ~3 km a.s.l. and extended ~130 km NW.
Source: Darwin Volcanic Ash Advisory Centre (VAAC)
According to a news article, following the emission of new lava from Bagana on 27 April, local volcanologists and a team of provincial disaster delegates conducted an aerial inspection of the area around the volcano on 2 May. The team concluded that the lava flows were not an immediate threat to the safety of villagers near the volcano. A spokesperson for Papua New Guinea's national Disaster Center reportedly said, "the aerial inspection team noted a continual effusion of lava flowing in a south-westerly direction but there is a lot of vegetation in the area which is acting as a buffer."
Sources: Australian Associated Press; Reuters
A helicopter pilot reported to RVO that new lava was being emitted from Bagana around 1240 on 27 April. According to information from the village of Torokina, the lava flow was estimated to be about 8-9 km from the village. RVO was uncertain about the local topography between the volcano and Torokina, and therefore could not assess the degree of danger for the residents of the village from the lava flow. RVO has no monitoring equipment at Bagana.
Source: Rabaul Volcano Observatory (RVO)
Reports are organized chronologically and indexed below by Month/Year (Publication Volume:Number), and include a one-line summary. Click on the index link or scroll down to read the reports.
Sluggish lava flow continuing on N flank
A sluggish lava flow remained active on the N flank of Bagana, but no explosions have been reported there in the past 2 years.
Information Contacts: R. Cooke, RVO.
N flank lava flow remains active
An aerial inspection on 14 September showed that lava continued to flow down the N flank, as it has since late 1976. No explosive activity has been reported during this phase of lava flow extrusion.
Information Contacts: R. Cooke, RVO.
Lava extrusion continues; small nuées ardentes
"Moderate to strong emission of white vapour continued throughout March. An active lava flow descending the [established lava channel on] the N slope had reached 2/3 of the way down the mountain. Small nuée ardente-type avalanches caused by collapse of the flow front were observed during an aerial inspection on 9 January."
Information Contacts: C. McKee, RVO.
Increased vapor emission; sluggish lava flow
From 5-7 March, the weak white vapor emissions from the summit increased to a thick high-pressure plume rising to 2,000 m above the summit. Vapor release remained high until 21 March, but no glow was reported. Vapor emission was again strong at the end of the month.
Aerial inspections on the mornings of 15, 16, and 17 March revealed a thick but apparently normal plume being released from the lava dome occupying the summit crater. The viscous blocky lava flow on the N flank appeared to be moving extremely slowly, perhaps a few meters per week. At the source of this flow, the maximum lava temperature (measured by a portable infrared optical pyrometer from a helicopter) was only 175°C on the slow-moving, blocky surface.
During 24 hours of seismic monitoring from the W flank at 1,100 m altitude, 540 B-type events and one or two sharp, impulsive, shallow events were recorded.
Information Contacts: P. de Saint-Ours, RVO.
Gas measurements on 8 September
[Richard Stoiber, Stanley Williams, and Chris McKee used a COSPEC to measure the rate of SO2 emission from several volcanoes in Papua New Guinea during September (table 1). Plumes at Bagana and Manam were strong, and Ulawun's plume was small. Activity at Langila was weak 11 September, but had intensified during measurements the next day. The quiet-phase data were collected from the ground; all other data were acquired while flying under the plumes.]
Table 1. Rates of SO2 emission at Bagana, Langila, Manam, and Ulawun, Papua New Guinea, September 1983. Airborne COSPEC data from R. Stoiber, S. Williams, and C. McKee.
| Date | Volcano | SO2 t/d |
| 08 Sep 1983 | Bagana | 3,100 |
| 11 Sep 1983 | Langila | 74 |
| 11 Sep 1983 | Ulawun | 71 |
| 12 Sep 1983 | Langila | 1,300 |
| 12 Sep 1983 | Manam | 920 |
Information Contacts: C. McKee, RVO; R. Stoiber and S. Williams, Dartmouth College.
Glow, explosions, incandescent boulders
"A marked increase in activity was observed from Bagana in December, with an increase in vapour emission and darkening of the plume early in the month. Bright glow was observed at night on 7 December followed by explosion and rumbling noises on the 8th and the emission of abundant blue vapour. On the 14th, incandescent boulders were observed tumbling down the upper NW flank. By the end of the month activity had decreased again, with no glow at night and the emission of moderate amounts of slightly brownish vapour."
Information Contacts: P. Lowenstein, RVO.
Two active lava flows
"The increase of summit activity noted in December resulted in [pulses of lava down the channel on the N flank] of the volcano from 5 January onwards. This lava remained active throughout the month and produced plumes of white and grey vapour."
Information Contacts: P. Lowenstein, RVO.
Sounds, glow, tephra emissions; but no new lava flows
"The increased activity continued in February and March. Occasional brown and grey tephra emissions were observed, and rumbling and explosion sounds were heard 17 km away. Nighttime summit glows were occasionally seen.
"New lava flows were reported in January, but aerial inspections have failed to confirm these reports. They indicated a relatively static body of lava extending about 200 m from the summit, but this is an old lava flow. The main development of the known active lava flow at Bagana in recent times has been a sharp change in direction of flow on the lower slopes. The nose of the flow is now abutting the dome on the W foot of Bagana after completing a 60°C turn toward the W from the established flow channel on the N flank."
Information Contacts: C. McKee, RVO.
Lava production continues; SO2-rich plume
"The predominately effusive eruption continued. When last observed (21 July), the viscous blocky lava flow on the NW flank had reached an altitude of 1,000 m and had an estimated volume of 1.3 x 10⁶ m3. A moderate plume of dense, white, SO2-rich gases continued to be emitted from the summit crater. Seismicity from the volcano was at a low level, with only a few B-type and explosion earthquakes per day."
Information Contacts: P. de Saint-Ours, RVO.
Lava flow continues; earthquake swarm
"An uncharacteristic swarm of shallow tectonic-like earthquakes together with banded low-amplitude harmonic tremor commenced on 19 October about 2000 and continued through October. During the previous week the NW lava flow collapsed to form a well-defined lava channel below the point where the flow turns sharply W. The toe of the lava flow continued to encroach on a satellite dome at the W foot of Bagana. Numerous solfataras have given a distinctive facia to the ESE summit."
Information Contacts: K. McCue, Bougainville Island Copper Ltd.
Lava dome grows & spawns avalanches; seismicity builds
"A new eruptive phase started in October 1984. The extrusion of a fresh batch of andesitic magma into the summit crater was accompanied by a marked increase in the volume of vapour rising above the crater, an increase in the area of fumarolic activity in and around the crater, night glows, and incandescent material tumbling down the flanks. Simultaneously, volcanic seismicity increased from fewer than 10 B-type events per day to over 100 per day by 19 October; harmonic tremor appeared on the 12th and became sub-continuous after the 15th. A relative drop in volcano seismicity (24-27 October) was followed by re-intensification. The daily frequency of events was about 1000 by 11 November, and consistently above this after 15 November. Strong tremor was recorded for periods of several hours on 4, 5, 9, 13, 18, 20, and 22 November. Explosion earthquakes were occasionally recorded.
"An aerial inspection by Bougainville Island Copper Ltd. geologists revealed that the dome of viscous andesite had bulged to about 15 m above the crater rim and lava was spilling over the N, E, and W parts of the rim. Debris on these three flanks corroborated the observations of incandescent material avalanching down the sides of the volcano, presumably from collapse of parts of the dome. Paradoxically, the long-established lava flow channel on the N flank of the volcano seems to have been drained, leaving an empty lava channel from the crater rim down to about 1,100 m altitude."
Information Contacts: P. de Saint-Ours, RVO; K. McCue, Bougainville Island Copper Ltd.
Lava extrusion and avalanches from dome; new fumaroles
"Eruptive activity was at about the same intensity as in November. Slow effusion of viscous andesitic lava continued in the summit crater, and unstable parts of the crater dome collapsed, causing avalanches of incandescent lava blocks. [Strong fumarolic activity was continuing] on the upper E flank to about 200 m below the crater rim."
Information Contacts: C. McKee, RVO; Bougainville Island Copper Ltd.
Bulging dome; ash-laden plume; N lava flow continues
"Bagana's summit crater dome continued growing through January, to fill 95% of the crater and bulge up to about 30 m above the crater rim. A thick, ash-laden plume was fed by numerous sources in the dome. A large solfataric area on the upper E flank of the volcano was also contributing vapours to the plume. An ash haze was observed stretching horizontally more than 100 km to the NE at about 2,000 m altitude. The steep flanks of the volcano were covered with thin ash deposits and a large number of blocks from avalanches of unstable parts of the dome.
"The long-established N lava flow was still active, and was broadening and thickening on the NW basal slopes at about 900 m altitude. Frequent avalanching was taking place from the [edges of the flow near its terminus]."
Information Contacts: P. de Saint-Ours, RVO.
Rockfalls from flank lava flow; strong vapor emission
"Eruptive activity continued at Bagana in February, although summit explosive activity was absent, or sporadic and very weak. Strong vapour emission continued, and the very light ash content in the plume was considered to be an effect of entrainment of dust from occasional avalanches on the sides of the summit lava dome. Frequent rockfalls from the edges of the active lava flow on the [N and] NW flanks of Bagana continued."
Information Contacts: C. McKee, RVO.
Activity declines; vapor emission; occasional glow
"Activity at Bagana in March was back to normal, after a period of vigorous activity that began in October 1984. The daily totals of volcanic earthquakes ranged from 0 to 3, and summit glow was observed on only 3 nights: 16, 25, and 31 March. Moderate-to-strong white vapour emission continued."
Information Contacts: C. McKee, RVO.
Continued mild activity
"Inspection by Bougainville Island Copper, Ltd. geologists, confirmed the ongoing mild eruptive activity, with extremely slow but sustained progress of the blocky andesite flow active (since [1975]) on the [N and] NW flanks. Weak glow was occasionally observed at night above the summit crater. The viscous lava dome in the crater continued to gently release a faint vapour plume. Seismicity remained weak with a few B-type earthquakes occurring daily."
Information Contacts: C. McKee, RVO.
Explosions; weak glow; increased seismicity
"A moderate level of activity was observed during November with occasional reports of weak nighttime glows from the summit crater and occasional audible explosions. Seismic activity increased in the middle of the month to about 50 earthquakes per day. Previous levels were generally less than 10. This level of seismic activity persisted to the end of the month."
Information Contacts: P. Lowenstein, RVO.
Occasional night glow from summit throughout December
"Following moderate activity in November, the seismicity declined to 5-20 events per day. Occasional reports of weak nighttime glow from the summit were received throughout December."
Information Contacts: P. Lowenstein, RVO.
New extrusive phase
"A new extrusive phase from Bagana's summit crater commenced on 16 February. The extrusion was preceded by several days' increase in seismicity, including three periods of 'tremor,' 30 minutes long (on the 5th and 6th) and an increase in the number of B-type events after the 10th. An increase in the amount of vapour released from the crater was also noted from the 7th onward.
"On the 16th, the vapour cloud became thick and coloured, while the seismicity rose suddenly to 140-175 events/day. From that night until the 21st, weak night glow from the crater was observed and extrusions of lava resulted in numerous incandescent avalanches of boulders on the NW, N, and NE flanks of the cone.
"At the end of the month, seismicity was still at a high level (>100 events/day), with periods of 'tremor' (on the 20th, 26th, and 28th), although visible activity had declined.
"Similar phases of extrusive activity occurred in November 1985 and January 1986 and resulted in increased movement of the long-established blocky lava flow down the N flank of the volcano."
Information Contacts: P. Lowenstein, RVO.
Increased lava extrusion continues; B-type event
"The phase of stronger extrusive activity continued into March, and was detected both seismically and visually. There were occasional reports of moderate to strong white to dark brown emissions from the summit, which displayed a weak glow whenever visible at night.
"The seismicity, which increased sharply in mid-February, declined slightly during the first week of March, but rose again steadily to a peak of 145 B-type events/day on the 12th before gradually declining to ~20 events/day at month's end."
Information Contacts: P. Lowenstein, RVO.
Strong plumes; glow; debris slides from lava flow
"Stronger activity continued in April. On most days, strong white to brown emissions from the summit were reported. Weak crater glow was often observed at night, and on one occasion the upper part of the N flank's active lava flow was also observed to be glowing. Occasional debris slides from the flanks of the lava flow produced impressive ash clouds. Seismicity increased from about 20 B-type events/day in early April to about 50-60 events/day at mid-month, staying at that level for the rest of April."
Information Contacts: P. Lowenstein, RVO.
Plumes; rockfall events from active lava flow
"Stronger activity continued through May. Moderate to strong white to brown emissions were reported daily. Weak glow from the summit was visible on five nights. There were 40-70 low-frequency seismic events/day, about the same as during the last half of April. Most of these events are probably due to rockfalls from the margins of the active lava flow."
Information Contacts: P. Lowenstein, RVO.
Ash emission declines, lava flow still active
"The phase of stronger activity weakened during the second half of July. Activity during the first half of the month was similar to that of the latter part of June, with 20-40 seismic events/day (probably rockfalls off the active lava flow). Occasional summit incandescence was reported. Emissions consisted of moderate to strong white vapours and moderate brown ash clouds. For the second half of the month, the activity appeared to be declining as the seismicity decreased to 10-20 events/day.
"During an aerial inspection on the 29th, moderate emissions of off-white vapour were observed. Although voluminous, the emissions were being released gently and no emission column was formed. A faint brown tint in the emission plume suggested that it contained some ash. This ash was not being produced by explosive shattering and fragmentation of lava, but is believed to result from fine comminution of fragments broken off relatively cool blocks on the surface of the active lava mound in the summit crater.
"In contrast to previous reports, no true lava dome was observed in the crater. Several rockfalls from the margins of the active lava flow were observed during the inspection flight. The lava channel on the upper flank was full, and several terraces were observed in the distal parts of the flow where new lava units had overridden older units. Arcuate pressure ridges were common on the distal part of the lava flow.
"During the 1986 phase of stronger activity, spillover of lava from the summit crater has been occurring on the upper E flanks. Two adjacent scree deposits were observed there. This observation tends to confirm occasional reports of incandescence on this part of the volcano."
Information Contacts: J. Mori and C. McKee, RVO.
Continued viscous lava extrusion; small explosions
"The phase of viscous lava extrusion from the summit crater continued into August at a moderate level as evidenced from visual observations and seismicity. Reports suggest that surges of lava into the active flow channel on the N flank took place on 6-7 and 31 August. White to brown emissions were usually quietly released from the crater, which was illuminated by a weak glow at night. Small explosions were reported 17-22 August. Rumbling noises were occasionally heard. Seismicity fluctuated throughout the month from 15 to 75 B-type events/day."
Information Contacts: P. de Saint-Ours and C. McKee, RVO.
Small summit exlosion; rockfall events decline
"The predominately effusive eruption continued, although a decline in seismicity (probably mostly rockfall events from the active lava flow) was registered. Daily totals of volcano-seismic events ranged between 5 and 35, and the month's total was about 500. In August, 10-75 events/day were recorded and the total for the month was 1345.
"One small summit explosion was seen on 9 September. The products of this explosion included lava fragments that were incandescent in daylight. Summit glows were observed on the nights of the 12th, 14th, and 22nd. Emissions from the summit consisted mostly of moderate to strong white vapours or brown-grey vapour and ash clouds."
Information Contacts: C. McKee, RVO.
Continued lava extrusion; vapor emissions
"Seismicity and visual surveys indicated that the viscous extrusive phase from Bagana's summit crater continued into October at a moderate level. [White to brown emissions] were quietly released from the crater, with a weak glow at night. Daily reports of glow on the northern flank of the volcano from 21 to 29 October suggested that new lava was flowing into the active channel. Seismicity remained at 0-25 B-type events/day, the lowest rate since January."
Information Contacts: P. Lowenstein and P. de Saint-Ours, RVO.
Lava extrusion continues
"Seismicity and a bright glow at night from the summit indicated that lava extrusion continued at a low to moderate rate throughout November. Moderate amounts of white to brown emissions were quietly released."
Information Contacts: B. Talai and P. Lowenstein, RVO.
Lava extrusion probably continuing
December observations indicated that the lava extrusion that has been ongoing for most of 1986 was probably continuing. A weak glow was often seen at night. [White and brown emissions] from the summit were moderate to strong.
Information Contacts: J. Mori and P. Lowenstein, RVO.
Lava extrusion probably continuing
Visual observations and seismicity indicated that viscous lava extrusion was probably continuing at a low level in January. Emissions from the summit consisted of moderate to strong white and occasionally brown vapours [and ash]. Weak glow from the summit was often visible at night.
Information Contacts: B. Talai and P. Lowenstein, RVO.
Occasional crater glow; vapor and ash emission
"In February, weak to strong, white to grey emissions were commonly observed, and strong brown emissions were noted once. Crater glow was occasionally seen. Seismic activity appeared to be unchanged from last month's low level."
Information Contacts: P. Lowenstein, RVO.
Lava flow active; stronger seismicity
Eruptive activity continued through March, apparently accompanied by increased seismicity. The summit vent emitted mostly moderate to strong white to brown-gray vapor and ash clouds. Blue vapour emissions were observed 17-19 March. Weak summit glows were reported on most nights and incandescent lava fragments were ejected to ~50 m above the summit on 31 March. Rumbling sounds accompanied the eruption. Rockslides from the edges of the lava flow on the N and NW flanks indicated that effusion was continuing.
Although seismic recordings were intermittent, seismicity appeared to have begun increasing on 11 March [see also 12:4]. The highest daily total of volcanic earthquakes was 110. A total of 333 earthquakes were recorded for the month (the highest total since September 1986) but the actual number of earthquakes could have been significantly higher.
Information Contacts: B. Talai and P. Lowenstein, RVO.
Ash emissions and summit glow continue
The activity level in April appeared similar to that in March. Moderate to strong white, gray, and brown emissions were reported. Summit glow was seen occasionally and was especially bright on 1 April. Seismic recording was patchy in April; recordings were made on only 6 days, down from 16 days in March. Increased seismic activity on 12 and 15 March was followed by a period of stronger activity beginning 27 March that probably persisted through 1 or 2 April. Seismicity was at a low level on 6 April but had increased considerably by 16 April when ~60 events were recorded. Activity then subsided and from 23 to 26 April very few volcanic earthquakes were recorded.
Information Contacts: C. McKee and P. Lowenstein, RVO.
Activity declines; vapor emission continues
Activity appeared to decline in May compared to the previous few months' activity. Moderate to strong brown emissions continued but glow from the summit was noted only once.
Information Contacts: J. Mori and P. Lowenstein, RVO.
Lava flow remains active
Activity continued at a steady moderate level throughout June. Strong white vapour emissions were occasionally tinged with brown or grey ash. Several aerial inspections and close-up ground observations suggested that most of the emitted ash was derived from debris avalanches from the summit area where a mound of lava filled the crater. Rock slides were common at the edges of the active lava flow on the N to NW flanks. Occasional incandescent ejections from the summit were reported by a schoolteacher living near the S base of the volcano. Glow from the summit was reported often, although volcanologists camped at the E base of the volcano on 17-18 June did not observe any summit incandescence.
An experiment with paint marks on the central part of the lava flow and adjacent marks on the levee banks indicated that the speed of the flow at ~1,200 m elevation was only 1-2 m/day. At this elevation the flow channel is ~20-30 m wide and possibly 10 m deep. These measurements indicate a flow rate of 200-600 m3/day or ~105 m3/year. The total volume of the flow since 1975 is ~106 m3.
Information Contacts: C. McKee and P. Lowenstein, RVO.
Vapor emissions continue; no incandescence seen
Activity may have declined in July although moderate to strong, thick, white, vapor emissions were observed throughout the month. No sounds were heard and no night glow from the summit crater was seen. Night glow . . . is thought to be evidence of lava flow activity.
Information Contacts: B. Talai and P. Lowenstein, RVO.
Ash plume; incandescent rockfalls
A moderately thick white to brown plume was continuously released from the summit crater. Plume emission intensified 14-15 August when incandescent rockfalls down the N and W flanks and strong night glow from the summit were reported. On 29 August the summit crater was reported to be completely filled with a smoking lava dome that continued to feed the long-active lava flow on the N flank. Seismicity remained at a low level throughout the month, with 10-20 rockfall events/day.
Information Contacts: C. McKee, P. de Saint-Ours, and P. Lowenstein, RVO.
Pyroclastic avalanches end 12-year lava flow
"On 8 September between 0600 and 0800, a series of pyroclastic avalanches descended the E flank. There were no reports of any explosive activity at the time, but low-level ash clouds were seen on the flanks. Later in the day, a new lava flow was reported on the E side of the summit.
"The cumulative deposit of these avalanches covered an area of ~1 km2. Its outline was complex because about half of the material formed a fan-shaped deposit on a gently sloping bench near the E foot of Bagana. Most of the other material moved 2.5 km from the summit, filling an arcuate depression between Bagana and neighboring Reini volcano. The deposit had a maximum thickness of 10-20 m and is poorly sorted; clast size ranged from fine ash to several-meter-wide blocks. The clasts were andesitic and mostly dense, although some show a slight degree of vesiculation.
"The deposit was still somewhat inflated when inspected on 15 September and numerous rootless fumaroles were active in the central part. The fumaroles were releasing sulphurous gases and depositing sulphur at some vents. The ground around many fumaroles had collapsed, producing craters as large as 1 m across and 20 cm deep. The craters indicated that a considerable amount of gas release had already taken place by 15 September. Crater density was >50% in the central part of the deposit. Near-surface temperatures were measured using a 30-cm-long mercury-in-glass thermometer; the highest temperature recorded was 460°C.
"Eight days before this activity, an increase in high-frequency earthquakes began. By about 5 September, seismicity had built up to several hundred of these events/day. During this time some long-duration (1-5 minute) seismic events occurred that were interpreted as probable rockslides. At the presumed time of the pyroclastic avalanches, a high-frequency tremor was recorded that lasted about 2 hours. Another event of this type, though considerably smaller in amplitude and lasting only half an hour, occurred on 11 September.
"The pyroclastic avalanches may have been caused by mechanical failure of the summit crater wall, which in turn destabilized the active lava dome. The dome then began shedding material in a series of hot avalanches down the E flank . . . . The lack of accompanying explosive activity, the predominantly unvesiculated nature of the clasts, and the lava dome source, suggest that the deposit is of the non-explosive block and ashflow type. These were the first pyroclastic flows recorded at Bagana since the ones that accompanied explosive activity in 1966.
"Within a few days after its appearance the new lava flow showed little activity. At the end of the month, it was ~100-200 m long, 50-100 m wide, and perhaps 10-20 m thick. Activity of the lava flow on the N flank of Bagana has probably ended, 12 years after its commencement."
Information Contacts: J. Mori, C. McKee, and P. Lowenstein, RVO.
Continuous vapor emissions; weak glow
Following the September pyroclastic avalanches, Bagana emitted continuous moderate-strong white vapour for most of October. Weak glow from the summit was visible during the first 2 weeks of the month. Seismicity was at a low level, except from 15-19 October when a total of 75 events were recorded.
Information Contacts: J. Mori, D. Lolok, and P. Lowenstein, RVO.
Vapor emission still moderate-strong; weak glow
Bagana continued to emit moderate-strong white vapors during November. Weak glow from the summit was seen on 6, 13, and 14 November. The number of long-duration seismic events (interpreted as rockfalls from the lava flow) showed a slight increase during the first part of the month to about 40/day, but the activity declined to 10/day by the end of the month.
Information Contacts: P. Lowenstein, RVO.
Strong steam emissions; low seismicity
The summit was often obscured in December, but when visible at mid-month strong white emissions were observed. Seismicity was at a low level of about 10 volcanic earthquakes/day with a recorded maximum of 30/day on 9 December; the seismograph was not operating for part of the month.
Information Contacts: C. McKee and P. Lowenstein, RVO.
Summit glow and vapor emission
Low-level activity continued through January, with the summit area continuously producing moderate to heavy white vapor. Glow from the summit was noted on several nights during the month. Seismicity was at a low level with only 1-10 events recorded/day.
Information Contacts: J. Mori and P. Lowenstein, RVO.
Lava flow from summit dome nears base of volcano
Activity continued at a low level through February, with the summit area continuously producing moderate to strong white vapor. Glow was noted from the summit on several nights during the month. Seismicity was at a low level with only a few (1-10) events recorded/day. During an aerial inspection on the 25th, the new E-flank lava flow had descended to an elevation of ~1,150 m, close to the foot of the volcano. The flow was ~1.5 km long, and its terminus was ~100 m wide and 20-30 m thick.
The lava dome in the summit crater had a flat top but its sides were very steep, particularly noticeable on its SW flank where the dome stood ~30-40 m above [the SW rim] of the summit crater. The lava flow was being fed from the top of the dome and it appeared that the direction of flow could change quite easily.
Information Contacts: P. de Saint-Ours and C. McKee, RVO.
Summit glow above new dome
Low-level activity continued through March, with continuous production of moderate to strong white vapour from the summit area. Summit glow was noted on several nights during the month. Seismicity was at a low level, with only 1-10 events recorded/day.
Information Contacts: P. de Saint-Ours and C. McKee, RVO.
E flank lava flow continues to advance
"April activity was steady with moderate to strong emissions of white vapours from the summit area, and a small number (up to ~15) of seismic events/day. During an aerial inspection on the 26th, the emission plume was dense and white in colour, and rose ~1.2 km above [the] summit. Its length was ~5-10 km.
"The nose of the active lava flow on the E flank had advanced ~50-100 m since the last inspection in late February. It had also widened as it spread out on the more gentle lower slopes of the cone. The flow appeared to be as much as 50 m thick in places and there were occasional slides of unstable material from the edges. The September 1987 pyroclastic avalanche deposit at the E base of the cone was also inspected. Many of the rootless fumaroles were still steaming. The craters and sulphur deposits around many of these fumaroles have been preserved."
Information Contacts: D. Lolok, C. McKee, and B. Talai, RVO.
Continued lava extrusion and weak seismicity
"Mild eruptive activity consisting of non-explosive lava emission continued at Bagana. Volcano-seismicity was weak with only a few events recorded/day."
Information Contacts: C. McKee and P. Lowenstein, RVO.
Increased lava production feeds new lobe
"An aerial inspection . . . on 5 September confirmed seismic evidence of increased lava effusion. A new lava lobe was observed on the S side of the one that had been active since September 1987. When the volcano was last inspected in April 1988, only one lobe (~1 km long) was present. It appears that this lobe had not advanced much beyond its April position. The new lobe was fed directly from the summit and its broad, moderately-sloping nose was ~200-300 m beyond the first lobe's terminus. Rockslides on the lobe's edges were observed . . . and pale-brown dust mantled the nose of the lobe, indicating that rockslides were occurring frequently. This observation confirmed seismic evidence of repeated rockslides. The top of the summit lava dome was flat. Voluminous white vapour emissions were fed from diffuse sources on the dome's upper flanks. The emission plume was 10-20 km long."
Information Contacts: C. McKee and P. Lowenstein, RVO.
Seismic data indicate continued lava extrusion
"Bagana's level of activity in October was steady. From the number of explosive earthquakes (1-12/day) and rockfall-related tremor (90-300 events/day), it is believed that the volcano is still extruding lava from its summit crater at a slow steady rate."
Information Contacts: D. Lolok, B. Talai, and P. Lowenstein, RVO.
Summit lava extrusion continues; seismic swarm
"Seismic activity continued at a steady low level until 7 November when a swarm of 1,500 small explosion-type earthquakes were recorded. Visual reports were obtained of red material sliding or rolling down the E slopes of the volcano on the 6th and pale brown dust/vapour rising from the same area on the 7th. Seismic activity then returned to a normal level with 15 rockfall-related tremor events/day, indicating continued slow steady extrusion of lava from the summit crater. Seismic telemetry to Rabaul stopped on the 14th. Records continued to be obtained at Panguna until the nearby Mt. Kupara repeater station, containing RVO telemetry equipment, was destroyed on 2 December."
Information Contacts: I. Itikarai and P. Lowenstein, RVO.
Avalanche breaches summit; lava drains from crater
"A minor collapse took place near the summit early on 22 January. The summit was reported to be glowing bright red at about 0430, then changed from red to yellow as it became even brighter. This activity culminated in an avalanche of incandescent boulders down the SE flank . . . . Shortly afterward, a large plume of ash and vapour developed. Inspections . . . on 28 January and 3 February revealed that structural failure had occurred at the outflow point of the lava flow on the E edge of the summit. The breach that was formed allowed rapid drainage of lava, forming a crater at Bagana's summit. The lava in the crater has a flat surface and appears to be flowing freely through the breach.
"It is concluded that the bright glow from the summit seen on 22 January resulted from the emergence of a pulse of hotter, more fluid lava which destabilized the edge of the dome and initiated the breaching."
Information Contacts: C. McKee, H. Patia, and P. de Saint-Ours, RVO.
Lava flow advances; new avalanche deposits
"Observer reports and recorded seismicity indicate that increased activity . . . is continuing. Inspections on 3 and 4 March by personnel from Bougainville Island Copper Ltd. revealed that a new deposit of avalanche debris was present on the SE flank. The deposit was dark in colour and extended from the summit . . . to the mid-flank level (~1,000 m altitude). Vegetation around the edges of the deposit had been killed. The avalanche occurred sometime between 3 February and 3 March. The profile of E flank lava flow's terminus had changed, suggesting overriding of older parts of the flow by new lobes and possible advance of the flow nose.
"On 18 March, the pilot of a passing aircraft reported a lava flow on the SE flank and copious ash around and above the volcano. However, an inspection on 12 April indicated that the deposit was probably formed by a rockfall from the inactive nose of of the E flank lava flow (at ~880 m altitude). The proximal part of the flow was still active. It appeared that a new thin lobe was overriding older lava in the main flow channel. An ash mantle on the upper E flank indicated that rockfalls (detected seismically) were occurring in this area. The flow was bent to the S at ~1,150 m altitude. It may be significant that the first lobe of this now compound flow terminated at about this point.
"Since 8 March (when seismic recording . . . was restored) seismicity has been dominated by relatively long-duration, low-frequency, spindle-shaped events. This activity is attributed to rockfalls on the margin of the active lava flow. Daily totals of these events ranged between ~90 and 300. Summit activity has continued to consist of moderate to strong emission of white vapour rich in sulphur dioxide."
Information Contacts: C. McKee, RVO.
Numerous rockfalls from new lava flow
"Observer reports indicated that the increased level of activity was continuing. Emissions were moderate to strong and consisted of white-grey (with occasional brown) ash and vapour clouds. Ashfalls around the summit area, due to rockfalls from a new lava flow on the S flank, were reported 7-11 and 25 May. Glows from the active lava flow were seen 2-3, 16-17, 22, and 24 May. Rumbling noises, correlating well with rockfalls, were heard 1-5, 12-14, and 23 May.
"Seismic monitoring . . . lapsed at the beginning of May because of an inability to maintain telemetry equipment during the current period of civil disturbance on Bougainville Island."
Information Contacts: H. Patia and C. McKee, RVO.
Explosions; S-flank lava flow remains active
"Bagana is currently the most active volcano in Papua New Guinea. Unfortunately, civil disturbance on Bougainville Island Island prevents proper monitoring. The observer reported fluctuating night glows from the summit and from the new (blocky) lava flow on the S flank. Incandescent rockfalls were frequent on all flanks, accompanied by rumbling sounds. Explosions and incandescent projections over the crater were reported 10 and 12-15 June. The thick, white to brown plume . . . produced occasional light ashfalls downwind."
Information Contacts: P. de Saint-Ours and B. Talai, RVO.
Lava production and vigorous SO2 emission
Quoted material is from RVO, with additional information on SO2 flux supplied by S. Williams. "Moderate eruptive activity continued . . . throughout July. The summit crater released moderate to strong volumes of thick white and sometimes grey emissions. Intermittent low rumbling sounds with occasional mild explosions were heard at the observation post ~10 km S of Bagana. Occasional night glows from the summit were observed, and rockfalls continued on the active lava flow(s). The effusive activity was not clearly seen during the aerial inspection, although voluminous white emissions on the S flank . . . probably originated from a steaming lava flow."
During an SO2 monitoring flight on the 27th from 0830 to 0910, a strong convoluted white cloud emanated from Bagana's summit, rising only slightly before being blown ~25-30 km downwind. The plume contained no ash but varied in size and opacity. Four traverses yielded SO2 flux measurements of 4,870, 4,800, 1,930, and 2,390 t/d. The large measured variations corresponded well with visual estimates of variation in the plume size. Based on the duration of the observations and the relative times of the traverses, the estimated weighted average of the flux data was 3,230 t/d. The September 1983 data were similar (yielding a mean value of 3,100 t/d) but showed less variation (2,300, 3,000, 4,200, 2,800, 3,000 t/d) suggesting a more steady state of degassing at that time.
Information Contacts: B. Talai and C. McKee, RVO; S. Williams, Louisiana State Univ.
Rockfalls; glow; vigorous gas emission
"Activity was at a moderate level during August. The summit crater released moderate to strong volumes of thick white and occasionally grey emissions. Rumbling noises were heard from time to time throughout the month, sometimes accompanied by small explosions. Night glows were observed 29-30 August. Rockfalls were observed on the S flank of the volcano, and on the 28th and 30th, light ashfalls were observed on the W flank."
Information Contacts: I. Itikarai and C. McKee, RVO.
Frequent rockfalls from active lava flows
"Activity continued at a moderate-strong level in September. Strong emission of thick white vapours continued from the summit area. The emissions were reportedly grey on a few days. Rumbling and explosion noises were heard occasionally at the observation post, ~8 km S of Bagana.
"Rockfalls from active lava flows were observed frequently in a broad area on Bagana's S flank. A visit to the seismic transmitter site (~2 km SW on the summit) by staff of Bougainville Island Copper Limited in late September revealed that rockfalls had occurred nearby.
"Seismic monitoring . . . resumed 28 September. Consistent with visual observations, the seismograms contain a large number of rockfall events, on the order of 100-120/day. A few A- and B-type events were also recorded daily."
Information Contacts: C. McKee, RVO.
Frequent rockfalls; weak explosions; glow
"Activity was at a relatively low level during October. The summit steadily released thick white vapour of moderate volume, with occasional grey clouds associated with reported weak explosions. Weak glow was occasionally seen at night over the summit, and rockfalls continued on the flanks. Seismicity was dominated by rockfall events (6-70/day), but occasional B-type events (0-8/day) were also recorded."
Information Contacts: C. McKee, RVO.
Lava overflows summit crater; explosions
"Mild sustained eruptive activity continued throughout November. Aerial reconnaissance on the 10th and 11th revealed that the summit, fully occupied by blocky lava, was overflowing on several sides. A main lava flow, active since 1987, extended to the foot of the volcano on the E flank (13:02). Lava also progressed slowly into the channel of the N lava flow (inactive since 1987), into the upper part of the prominent [1966-75] lava channel on the S flank, and spread over the upper NW flank. Very frequent rockfalls or avalanches occurred on all sides below the summit, producing short-lived red glow at night.
"An SO2-laden vapour plume, formed by numerous fumaroles in cracks in the lava-filled crater and the weathered upper flanks, quietly drifted as much as 20 km downwind. Slow and quiet lava effusion was only disturbed by occasional explosions (3, 16, and 25 November) which generated a black cloud above the summit. The seismicity continued to be dominated by rockfall events (2-94/day) and a few B-type events (0-4/day)."
Information Contacts: D. Lolok and P. de Saint-Ours, RVO.
Lava overflows crater; rockfalls
"Mild, sustained, eruptive activity continued throughout December. Numerous rockfalls or avalanches occurred from the unstable blocky flows that slowly spilled over all sides of the summit crater, producing short-lived, red incandescence at night. The seismicity continued to be dominated by rockfall events (several tens/day), with only a few B-type events and occasional swarms of discontinuous tremor (1/2 hour on the 18th and 3 hours on the 21st)."
Information Contacts: P. de Saint-Ours, RVO.
Continued slow summit lava extrusion; new lava pulses every 4-5 days
"Mild but steady eruptive activity continued as a result of slow extrusion of blocky lava in the summit crater. The main visible activity consisted of frequent rockfalls of (night-glowing) rock avalanches from the summit onto all flanks of the volcano. New pulses of lava were seen spilling onto the SE flank and into the [1966-75] lava channel at 4-5-day intervals. Abundant fumaroles are present within the crater which is weakly glowing at night. Two low explosions were reported on the 10th and 27th. Seismicity continued to be dominated by rockfall events (several tens/day), but occasional B-type events were also recorded. Seismic monitoring . . . ceased on the 24th, due to the loss of telemetry as the result of the current civil disturbance . . . ."
Information Contacts: I. Itikarai and P. de Saint-Ours, RVO.
White and occasional gray emissions; summit extrusion of blocky lava continues
"Mild eruptive activity continued in February. Regular reporting of observations ceased on the 12th but it appears that the more-or-less steady extrusion of viscous blocky lava continued through the month. Frequent rockfalls occurred on the W, S, and E flanks. Glow from the summit area was seen occasionally. Emissions were mostly white vapours, but grey emission clouds were reported on a few days."
Information Contacts: C. McKee, RVO.
Rockfalls from blocky lava flow; ash column
"In the current period of social unrest on Bougainville Island Island, no instrumental data is being recorded, and the only information on Bagana's activity is from visual observations from a site 15 km SSW of the volcano.
"When observations resumed on 3 April, Bagana was in a fairly high level of activity. Thick, white, ash-laden vapour was being forcefully emitted from the summit area. [An explosion in the summit crater] on the 3rd produced a black column, and loud rumbling noises were heard until the 4th.
"Numerous rockfalls (including daytime glowing avalanches) were observed in early April on the SE and E flanks of the cone, where a slowly progressing blocky lava flow has been active since 1987. This activity together with the reportedly stronger vapour and ash emission may suggest that a new pulse of viscous lava extrusion took place in the summit crater in the first few days of April.
"The mountain was often covered by atmospheric clouds or rainstorms, but a weak, night, summit glow was intermittently observed until the 21st, with occasional (night-glowing) rockfalls occurring until the 24th."
Information Contacts: P. de Saint-Ours and C. McKee, RVO.
Frequent ash emissions, rumbling
"Bagana was at a fairly high level of activity throughout May. On most days, thick white or grey clouds were emitted from the summit area and loud rumbling noises were heard. On the 6th, 8th, 20th, 21st, 23rd, and 26th, 1-3 explosions produced dark ash-laden columns to 2 km above the summit. Weak red glow was observed on most nights during the last 3 weeks of the month.
"The blocky lava flow being slowly extruded from the summit crater was seen to overflow on several days onto the upper E, SE, and SW flanks. Small to moderate rockfalls were reported daily on the E and S sides of the volcano."
Information Contacts: P. de Saint-Ours and C. McKee, RVO.
Thick ash-laden emission; avalanches from block lava flows
"Activity was at a fairly high level throughout June. On most days, thick white clouds were emitted from the summit area and rumbling noises were heard. One to three explosions [per day] occurred on 14, 16, 22, and 24 June, producing thick ash-laden columns to 6 km above the summit. A red glow was observed on all nights when the summit was clearly visible.
"The blocky lava flow being slowly extruded from the summit crater was seen on occasion to overflow onto the upper E, SE, and SW flanks, and rockfalls or debris avalanches (some glowing) were reported daily on the E and SE sides of the volcano."
Information Contacts: P. de Saint-Ours and C. McKee, RVO.
Blocky lava overflows onto SE and E flanks
"Activity continued at a steady level in July. White and grey emissions were released during most days from the summit, accompanied by low rumbling noises. Explosions occurred on 3, 13, 16-18, 20, 25, and 26 July, producing brown to black plumes. A weak red glow was observed over the crater on most nights.
"The blocky lava flow being slowly extruded from the summit crater was seen on two occasions to overflow onto the SE and E flanks, with rockfalls reported on most days."
Information Contacts: H. Patia and C. McKee, RVO.
Summit block lava extrusion and plume emission; reporting problems
"Due to social unrest and political isolation on Bougainville Island Island, instrumental data is no longer being recorded and no reliable reports of visual observation were received. From the sparse reports of observations received between 12 and 27 August, it is presumed that the volcano is still extruding a blocky lava flow from its summit crater with accompanying moderate to strong white to grey plumes, summit night glow, and numerous rockfalls."
Information Contacts: I. Itikarai and C. McKee, RVO.
Continued extrusion of viscous lava; occasional dome collapse episodes
"Socio-political unrest on Bougainville Island Island has prevented transmission of any reports of Bagana's activity since late July 1990. However, Bagana's former observer recently arrived in Rabaul and confirmed that the volcano has remained active, with slow, continuous extrusion of sluggish lava into the summit crater and onto the volcano's flanks. A significant change occurred on the night of 14 January 1991, when part of the summit lava dome collapsed onto the SE flank of the volcano, and initiated a new lava channel between the 1966-75 and 1987-90 lava flows. Apparently, the blocky lava flow is slowly advancing in the saddle between Bagana and the nearby Pleistocene Reini Volcano. Other minor collapses of the summit dome occurred occasionally onto the SW flank (and possibly other parts of the volcano). The current activity is apparently similar to that reported up to mid-1990, with release of a brownish white plume from the dome, extremely slow extrusion of lava, and frequent tumbling of rocks down the flanks of the volcano."
Information Contacts: H. Patia, P. de Saint-Ours, and B. Talai, RVO.
Vapor emissions produce SO2-rich plume 15-20 km long
Although one of Melanesia's youngest and most active volcanoes, reports on Bagana are infrequent. Bagana sits along Bougainville's axial highlands ~140 km NW of the 16 August, M 7.8 earthquake's epicenter. Following the earthquake, a report from the Buka Passage Administration Office described a change in activity. Specifically, the report mentioned "black thick clouds coming out of the volcano" and stated that "lava had fallen along the SW coastline." The report included a request for RVO to carry out an inspection. As a result, Chris McKee (RVO) flew around the volcano on 22 August.
McKee noted moderate-to-strong vapor emissions forming a 15-20 km long plume. While the plume looked white near Bagana's summit, downwind a prevailing brown color suggested high SO2 concentrations in the emissions. No ash was noted in the plume. The summit, a region occupied by a blocky lava dome, fed the plume from numerous sources. There was no appreciable force in the emissions and the plume rose only slightly above the summit.
A lava flow that has been active for several years was observed on the volcano's SW flank. In late August the flow's front was estimated to have reached 580 m elevation. In overview, conditions at the volcano appeared stable. There was no indication of recent explosive activity.
Although reports documenting activity have been absent since early 1991, reported Bagana eruptions in the interval 1972-87 described activity that included long-term lava effusion and slow dome growth, coupled with moderate explosive activity ending with dome destruction. After destruction there was a return to dome growth and lava flows.
Information Contacts: Patrice de Saint-Ours and Ben Talai, RVO.
Infrared data show nearly continuous activity during 2001-2002
Throughout 2001 and 2002, MODIS detected quasi-continuous thermal alerts at Bagana (figure 1). The most recent report is from August 1995 (BGVN 20:08). The MODIS data are presented here as valuable objective evidence of more recent activity. MODIS thermal alerts were recorded on 16 September, 3, 19, and 26 November, and 10, 12, 28, and 30 December 2000. The 2001-2002 MODIS anomalies were relatively stable with an average alert ratio of -0.63 and generally they consisted of 1 or 2 alert pixels. The maximum alert ratio detected (-0.51) occurred on 21 November 2002 when the number of alert-pixels was at its two-year maximum of 5. This is likely to indicate a higher degree of activity than usual, in which case it is likely to represent effusion of a new lava flow or a pyroclastic flow in the act of emplacement. Coordinates of alert pixels generally clustered tightly around the summit, with a slight preference towards the NW (figure 2). Activity may be genuinely concentrated on this part of the cone, but another explanation would be a 300-m error in the supposed location of the summit relative to the MODIS geocoding. However, the 5-pixel alert of 21 November 2002 is strung out towards the E, which is likely to represent an eastward-flowing lava (or pyroclastic) flow ~2 km long.
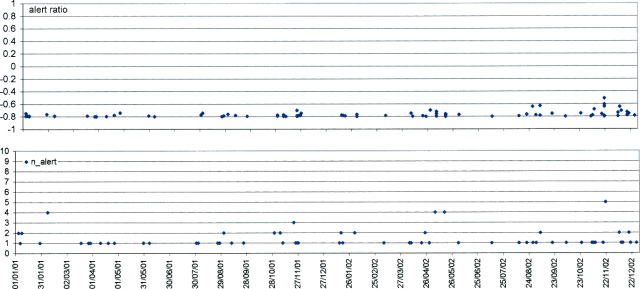 |
Figure 1. MODIS thermal alerts on Bagana during 2001-2002. Courtesy of Diego Coppola and David Rothery, The Open University. |
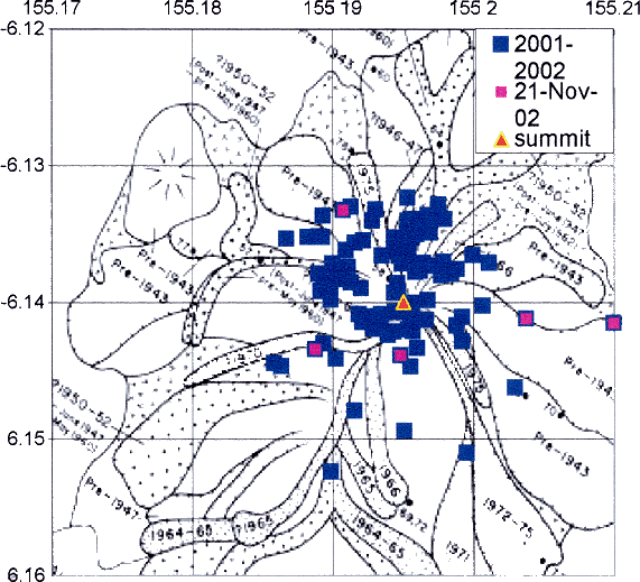 |
Figure 2. Locations of MODIS alert-pixels on Bagana during 2001-2002. Courtesy of Diego Coppola and David Rothery, The Open University. |
Information Contacts: Diego Coppola and David A. Rothery, Department of Earth Sciences, The Open University, Milton Keynes, MK7 6AA, United Kingdom.
Abundant MODIS thermal alerts during March 2003-February 2004
Continued MODIS thermal alerts during March 2003-February 2004 (table 2) suggests that activity continued over the year ending February 2004. No corroborative reports of activity have been received from the Rabaul Volcano Observatory or the Darwin Volcanic Ash Advisory Centre.
Table 2. Nights on which MODIS thermal alerts were recorded for Bagana, for the year ending February 2004. Thermal alerts recorded in daylight hours have been omitted for data reliability reasons (one case on 23 October 2003). Data courtesy HIGP MODIS Thermal Alert System.
| Month | Days with Thermal Alerts |
| Mar 2003 | 13, 19, 26, 31 |
| Apr 2003 | 2, 11, 18, 25 |
| May 2003 | 18, 20 |
| Jun 2003 | 19, 26 |
| Jul 2003 | 21, 23, 25 |
| Aug 2003 | 4, 6, 8, 13, 24, 29 |
| Sep 2003 | 16 |
| Oct 2003 | 2, 4, 07, 13, 18, 27 |
| Nov 2003 | 5, 10, 12 |
| Dec 2003 | 3 |
| Jan 2004 | 13, 15, 20, 24, 31 |
| Feb 2004 | 5 |
Information Contacts: HIGP MODIS Thermal Alert System, Hawaii Institute of Geophysics and Planetology, School of Ocean and Earth Science and Technology, University of Hawaii at Manoa (URL: http://modis.higp.hawaii.edu/).
Block-lava flows descend flanks and raise concern for settlers
The Rabaul Volcano Observatory (RVO) received a report on 28 April from a pilot of the Hevi Lift helicopter company stating that new lava had come from Bagana volcano the day before. RVO has had no monitoring equipment at Bagana since 1989. Although they hope to again install monitoring instruments in the future, they could not confirm the visual observations instrumentally.
Bagana has been in long-term eruption since 1972, although reports ceased in 1995 because of political and economic unrest. MODIS satellite observations began in 2000, and almost monthly thermal alerts have been recorded since September 2000.
According to a news article, on 2 May local volcanologists and a team of provincial disaster delegates conducted an aerial inspection of the area around Bagana. At that time, the team concluded that the lava flows were not an immediate threat to the safety of villagers near the volcano. According to news reports a spokesperson for Papua New Guinea's national Disaster Center said the aerial inspection team noted a continual effusion of lava flowing in a southwesterly direction, but there was a great deal of vegetation in the area which acted as a buffer.
A later news article also noted that in the long term the lava flows could expose local hamlets to danger. The hamlets were constructed in the 1990s by people displaced by civil unrest.
RVO staff sent a series of photos and brief notes regarding their visit. Ima Itikarai commented that during his trip clouds affected the quality of the photos. Figure 3 shows a hamlet, which sits 3 km from the active block-lava flow front and 6.5 km from the summit, well within reach of pyroclastic flows similar to those in 1952, 1960, and 1966.
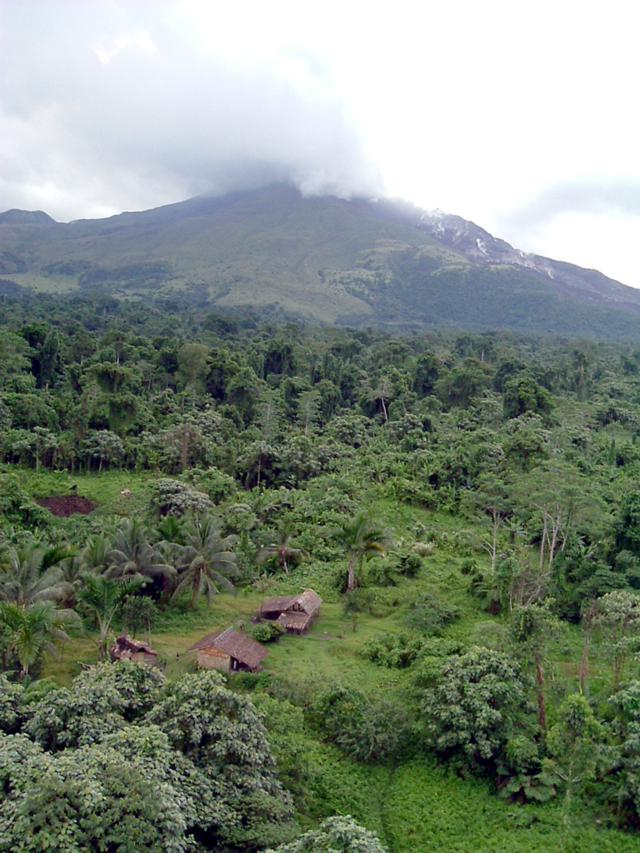 |
Figure 3. An overview of the scene on the SW region surrounding Bagana illustrating a potentially threatened hamlet and the erupting volcano and block-lava flow in the background. Courtesy of Ima Itikarai, RVO. |
At about the same time but in clearer weather, another photographer, Peter Mildner, took the photo in figure 4. It shows Bagana's summit and the active block-lava flow at a point where the levees had become 'bank full.' Figure 5 shows the lava flow pouring over the levees at various points. The lava flow's toe was also being overridden.
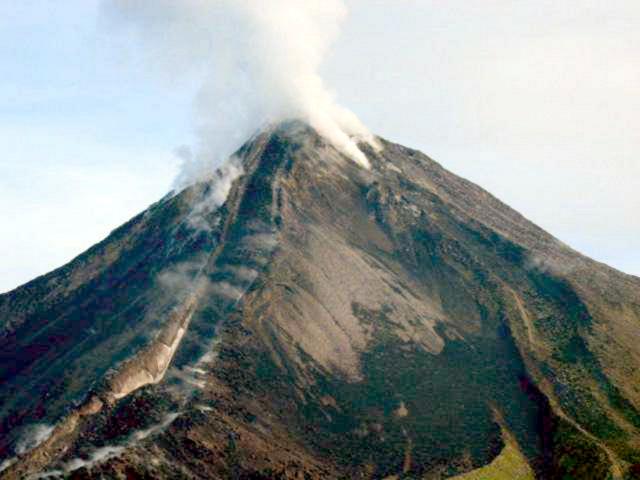 |
Figure 4. Bagana summit and upper flanks as seen in April 2004 showing the active block-lava flow on the SW side (steaming, at left center). A second block-lava flow path may have begun to descend the leveed banks on the right (note abundant steam on upper right-hand slopes). Copyrighted photo by Peter Mildner provided courtesy of Ima Itikarai, RVO. |
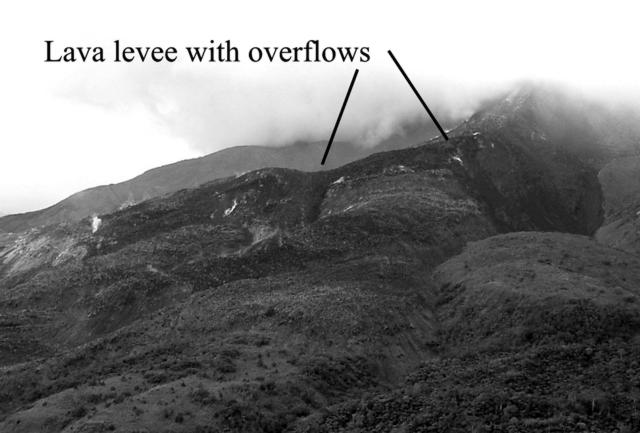 |
Figure 5. Closer view of the block-lava flow down Bagana's SW flank taken in April or May 2004, on a day with considerable low clouds. The initially confined lava flow followed the leveed path and then began to escape at several places. The fresh block lava's darker color stands in mild contrast to sparsely vegetated, older levee banks, which have a speckled appearance. Courtesy of Ima Itikarai, RVO. |
Information Contacts: Ima Itikarai and Herman Patia, Rabaul Volcano Observatory (RVO), P.O. Box 386, Rabaul, Papua New Guinea; Papua New Guinea Post-Courier; The National; The Australian.
MODVOLC thermal alerts peak in July 2003 and April 2004
MODVOLC alerts occurred at the same rate as in 2001-2002 (BGVN 28:01), with quasi-continuous alerts from January 2003 to May 2004 (figure 6). These were mostly one- or two-pixel alerts with an average alert ratio of -0.712. On 21 July 2003 activity appeared to have intensified, with an alert ratio of -0.328 and three alert pixels detected. By 13 August 2003 activity was back to 'normal' levels. Then on 18 April 2004, activity picked up again, with a maximum alert ratio for this period of -0.135, along with a maximum number of four alert pixels on 22 April (Aqua satellite) and 6 May 2004 (Terra satellite).
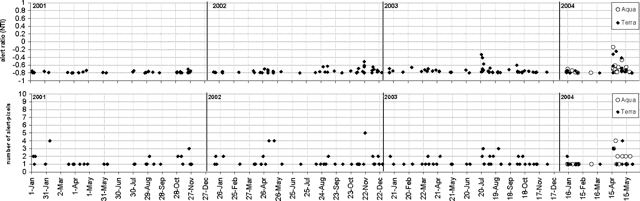 |
Figure 6. MODIS thermal alerts from Bagana for 1 January 2001-31 May 2004. Thermal alerts collated by Charlotte Saunders and David Rothery; data courtesy of the Hawaii Institute of Geophysics and Planetology's MODIS thermal alert team. |
Data acquisition and analysis. Reports from Diego Coppola and David A. Rothery provided analyses of MODIS thermal alerts during 2001 and 2002 (using the MODVOLC alert-detection algorithm) extracted from the MODIS Thermal Alerts website (http://modis.hgip.hawaii.edu/) maintained by the University of Hawaii HIGP MODIS Thermal Alerts team (BGVN 28:01). Rothery and Charlotte Saunders provided updates to 31 May 2004. MODVOLC data are now routinely available from the Aqua satellite (equator crossing times 0230 and 1430 local time) in addition to the original Terra satellite (equator crossing times 1030 and 2230 local time).
Information Contacts: David A. Rothery and Charlotte Saunders, Department of Earth Sciences, The Open University, Milton Keynes, MK7 6AA, United Kingdom.
Lava flows and occasional ash plumes during April-September 2005
Bagana was last reported on in June 2004 (BGVN 29:06) summarizing MODIS thermal alerts during 1 January 2001-31 May 2004. Lava flows, which had erupted at an unknown time, were described in BGVN 29:05. Bagana has been in long-term eruption since 1972, but the volcano's remote location and intervals of separatist conflict on the island had restricted access by observatory staff, and subsequent reports remained infrequent. Several Rabaul Volcano Observatory (RVO) reports addressed Bagana volcanism during March-September 2005, revealing conditions seen on the ground. There were numerous MODVOLC thermal alerts posted for Bagana during the reporting interval. The rest of the reports relied on satellite-based observations of plumes produced for the purpose of aircraft safety.
RVO noted that during April 2005 Bagana continued its effusive eruption of lava. The summit crater released weak to moderate volumes of thick white vapor on most days. Occasional gray to brown ash plumes were reported. White vapor was visible in some areas of the SW flank. Summit glow was visible on most nights when it was clear, associated with the active lava flow on the upper S flanks. White vapor visible on the upper SW flank during daytime was also associated with a lava flow. Occasional loud roaring noises like jet engines and booming noises were heard on 17, 19, and 30 April. Some of the noises accompanied emission of thick, dark gray ash clouds.
According to the Darwin Volcanic Ash Advisory Centre (VAAC), on 17 March 2005 at 0726 a very small plume to ~ 2.4 km altitude and hot spot were visible on satellite imagery. Satellite imagery at 0551 on 13 May revealed a thin plume extending 28 km ESE below 3 km altitude. Similar plumes, blowing W, were identified at 0537 on 14 May and at 0634 on 15 May.
A plume from Bagana was observed in satellite imagery for 8 June. Darwin VAAC stated that the plume initially extended 65 km WSW, then W later in the day. The height of the plume was not stated. US Air Force Weather Agency analysts indicated that at 0955 local time on 8 June (2355 UTC on 7 June) the plume extended at least ~ 38 km W, rising up to ~ 3 km, and the MODIS image they provided showed four volcanoes in the region all emitting plumes (figure 7).
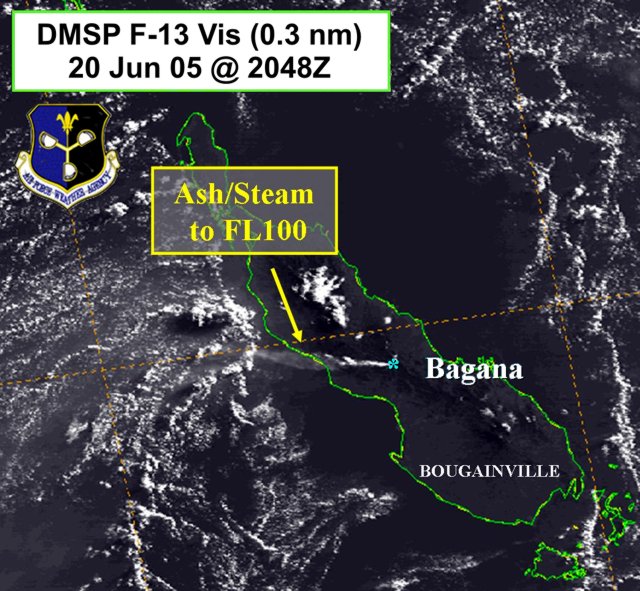 |
Figure 7. A DMSP image highlighting a Bagana plume seen on 20 June 2005. For scale, near its broad SE end, Bougainville island is ~50 km wide (measured in the NE-SW direction). Both images provided courtesy of NASA and the US AFWA. |
During 13-19 June, Bagana was relatively quiet with variable amounts of white vapor emitted from the crater. Weak projections of incandescent lava were visible until 17 June. During 8-10 June, several low-level plumes emitted from Bagana were visible on satellite imagery extending mainly to the WSW. A plume from Bagana visible on satellite imagery on 21 June extended W. The height of the plume was not reported. A thin plume emitted from Bagana was visible on satellite imagery on 30 June. The height of the plume was not reported.
During 10-16 August, the Darwin VAAC reported that satellite observations showed an ash plume from Bagana visible at a height of ~ 3 km, extending ~ 40 km SW of the summit. Ash was not visible on the image.
During 15-21 August, volcanic activity at Bagana remained at low levels. Variable amounts of thick white vapor were emitted from the summit crater. During several nights, dull-to-moderately bright incandescence was visible. Occasional low roaring noises were heard on 15 and 20 August. At night dull to moderately bright glow was visible on 16, 18, 20, and 21 August. On 20 August, lava flowed from the main crater. Incandescent lava avalanches occasionally originated from unstable areas of the lava flow.
Between 22 and 28 August 2005, Bagana was quiet. The summit crater released variable amounts of white vapor throughout. Continuous roaring noises were heard during a 30-minute period on 23 August, and bright glow was visible the nights of 23 and 24 August. There was a single expulsion of a thick dark ash plume on 24 August.
During 12-18 September 2005, occasional small volumes of ash escaped, and emissions consisted chiefly of weak to moderate volumes of white vapor. Beginning on 17 September occasional sub-continuous booming noises commenced. Some of the booming noises were accompanied by forceful emissions of whitish-brown ash clouds. This activity continued on 18 September. Ash plumes from the activity drifted to W and NW resulting in fine ashfall in downwind areas. Occasional sub-continuous jet-like noises began to occur on 18 September along with a reported lava flow. Glow was observed at night on 14 and 18 September. This could have been associated with cascading lava detached from steep portions of an active lava flow.
The seismograph remained off from 15 August onward through the reporting period due to technical problems.
Information Contacts: Rabaul Volcano Observatory (RVO), P.O. Box 386, Rabaul, Papua New Guinea ; Darwin Volcanic Ash Advisory Centre (VAAC), Bureau of Meteorology, Northern Territory Regional Office, PO Box 40050, Casuarina, Northern Territory 0811, Australia (URL: http://www.bom.gov.au/info/vaac/).
Lava flows and ash emission throughout March 2006
Little activity had been recorded at Bagana since 18 September 2005, when forceful emissions of whitish-brown ash occurred, accompanied by ash fall in downwind areas and large booming noises. From the end of January to mid-April 2006 there were brief periods of effusive activity. The summit crater released moderate to dense white vapor throughout this time.
Emissions were forceful on 27 February, and on 3, 5, 7, 13, 22, 24, and 29 March. Denser emissions of pale gray ash clouds were reported on 27 March. Rumbling and roaring noises were heard on 15-16, 22, and 26-28 March. Moderate to bright glow was accompanied by projections of lava fragments and the advance of a lava flow down the S-SW flank, which was visible from 15 March until the end of the month. During April, the summit crater continued to release white vapor. A forceful emission was recorded on 8 April. A weak glow was visible on 9 April. Occasional weak rumbling noises were heard on 12-13 and 15 April. On 4 May, there was an ash plume visible on satellite imagery at a height of ~ 3 km (10,000 ft) altitude that extended 4 km W. On 18 June there was an ash-and-steam plume drifting SW; the height of the plume was not recorded.
Information Contacts: Ima Itikarai and Herman Patia, Rabaul Volcano Observatory (RVO), P.O. Box 386, Rabaul, Papua New Guinea.
Almost daily thermal anomalies over past year; plumes and glow
Brief periods of effusive activity took place during January to mid-April 2006 (BGVN 31:05), with ash-and-steam emissions reported as late as 18 June 2006. Activity has continued since that time through early June 2007, with evidence coming from either MODIS thermal satellite data, observations of glow, or plume observations from the ground or satellites (figure 8). It appears that there were three episodes of increased plume generation, two periods of frequent glow observations, and almost daily MODIS anomalies over that one-year time frame.
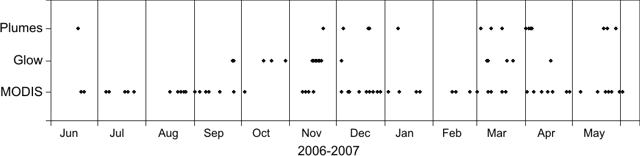 |
Figure 8. Summary of daily activity at Bagana, 18 June 2006-5 June 2007. Plumes are all varieties (steam or ash) reported by RVO or Darwin VAAC; glow as reported by RVO; MODIS data indicates days with at least one thermal pixel detected. Compiled from MODIS/HIGP data, Darwin VAAC reports, and RVO reports. |
The Rabaul Volcano Observatory (RVO) noted that between 18 September and 4 December 2006 only white vapor was released; some of these emissions were forceful. Jet engine-like roaring noises were heard on 11 and 20 November. Variable glow was visible on 25-26 September, 15, 20, and 29 October, 15-21 November, and 4 December. The lava flow on the S flank was active only on 15 October.
There were no aviation warnings after June until a diffuse plume became visible on satellite imagery on 22 November. Based on satellite imagery, the Darwin Volcanic Ash Advisory Centre (VAAC) reported subsequent plumes on 5 December (ash), 21-22 December (ash-and steam), and 9 January 2007.
RVO reported that white vapor emissions from the summit crater continued during 10 January-21 May 2007. Emissions were occasionally forceful and were accompanied by ash clouds on 3 and 17 March, as well as 1 and 3-5 April. Summit incandescence was visible on 7, 8, 20, and 24 March, and 17 May. Based on satellite imagery, the Darwin VAAC reported diffuse plumes to altitudes of 2.4 and 3 km on 10 March and 20 May, respectively. Forceful, white emissions on 21 May produced plumes that rose to an altitude of 2.3 km and drifted W. Diffuse ash-and-steam plumes were seen in satellite images again on 22 and 28 May, rising to altitudes of 3.7 and 3 km, respectively.
Moderate Resolution Imaging Spectroradiometers (MODIS) satellite thermal anomaly data reported by the Hawai'i Institute of Geophysics and Planetology (HIGP) revealed frequent thermal anomalies during 20 June-24 July 2006, 16 August-3 October 2006, 9 November 2006-23 January 2007, and 13 February-2 June 2007.
Information Contacts: Herman Patia, Rabaul Volcano Observatory (RVO), P.O. Box 386, Rabaul, Papua New Guinea; Darwin Volcanic Ash Advisory Centre (VAAC), Bureau of Meteorology, Northern Territory Regional Office, PO Box 40050, Casuarina, Northern Territory 0811, Australia (URL: http://www.bom.gov.au/info/vaac/); Hawai'i Institute of Geophysics and Planetology (HIGP) Hot Spots System, University of Hawai'i, 2525 Correa Road, Honolulu, HI 96822, USA (URL: http://modis.higp.hawaii.edu/).
June 2007-March 2008, ongoing emissions including a pyroclastic flow
Lava flows, pyroclastic flows, loud noises, and repeated forceful emissions were witnessed during June 2007-March 2008. Previously, there were brief periods of effusive activity and almost daily thermal anomalies during June 2006 through May 2007 (BGVN 32:04). Emissions during June 2007 consisted largely of steam of variable density.
On 12 June, there was a particularly forceful emission. Glow was observed on the night of 14 June. This kind of behavior continued into July. On 8 July observers saw glow and watched a single forceful release of pale gray ash.
On 14 July, Bagana generated a particularly forceful release that generated a pyroclastic flow. The release spewed out thick, dark-gray ash. The pyroclastic flow descended the S flank of the volcano stopping at the base near a small hot-spring-fed lake located at the head of the Torokina river. Since that event, rock falls from the edge of the active lava flow triggered thin ash clouds of light brown color from the S flank. This was accompanied by a loud roaring noise persisting into 15 July.
On 6 August, some emissions occasionally contained gray ash. The lava flow from the summit crater on the SE flank became active again and continued through 23 August. Thick white plumes escaped forcefully during 13-16 August. Ash clouds seen then were attributed to rock falls from collapse at the edges of the active lava flow. The Darwin VAAC reported that a diffuse plume rose to an altitude of 3.7 km on 23 August.
A particularly forceful emission occurred on 25 August and 12 September and the latter generated thin gray ash clouds directed over the SE flank.
Into October, the summit continued to release gentle emission of thin to thick white vapor. A weak to bright fluctuating glow was visible at night from 2-5 October and a continuous rumbling noise that lasted about an hour was heard on 5 October. On 6 October, there was a particularly forceful emission and the lava flow on the SE flank became active. Observers saw the lava flow emitting glow as it passed down the SE flank on 6-7, 10-12, and 17 October. Occasional thin pale gray ash clouds observed at the edges of the active lava flow were visible on 9-10, and 14-15 October. Based on satellite imagery, the Darwin VAAC reported that ash plumes drifted N then NW on 19 October.
White vapor escaped through November and into December. It was occasionally accompanied by plumes containing ash that were generated along the lava flow.
Two explosions sent forth ash plumes on 19 and 27 November. The SE-flank lavas descended almost continuously and lava fragments vented at the summit on 7 and 9 December. On 9 December an ash plume rose to an altitude of 2.8 km; another on 17 December rose to uncertain height; and one on 26-27 December rose to 3 km altitude and drifted W.
Activity in January through March was generally weak but persistent, with earthquakes absent. Satellite imagery and information from RVO led the Darwin VAAC to report a diffuse plume on 3 March. It rose to an altitude of less than 3 km and drifted SW. Later that day, an ash-and-steam plume drifted SW.
Throughout the reporting period, the MODVOLC satellite system typically detected multiple thermal anomalies monthly. The system uses MODIS (the Moderate Resolution Imaging Spectroradiometer) and a processing algorithm and staff at HIGP (see Information Contacts, below).
Information Contacts: Herman Patia, Rabaul Volcano Observatory (RVO), P.O. Box 386, Rabaul, Papua New Guinea; Darwin Volcanic Ash Advisory Centre (VAAC), Bureau of Meteorology, Northern Territory Regional Office, PO Box 40050, Casuarina, Northern Territory 0811, Australia (URL: http://www.bom.gov.au/info/vaac/); Hawai'i Institute of Geophysics and Planetology (HIGP) Hot Spots System, University of Hawai'i, 2525 Correa Road, Honolulu, HI 96822, USA (URL: http://modis.higp.hawaii.edu/).
Lava flows and ash emissions from March to December 2008
Lava flows, pyroclastic flows, and repeated forceful ash emissions were noted at Bagana (figure 9) from June 2007 through March 2008 (BGVN 33:03). Lava flows and ash emissions continued from the end of May 2008 through 16 December 2008. No reports were received for April 2008.
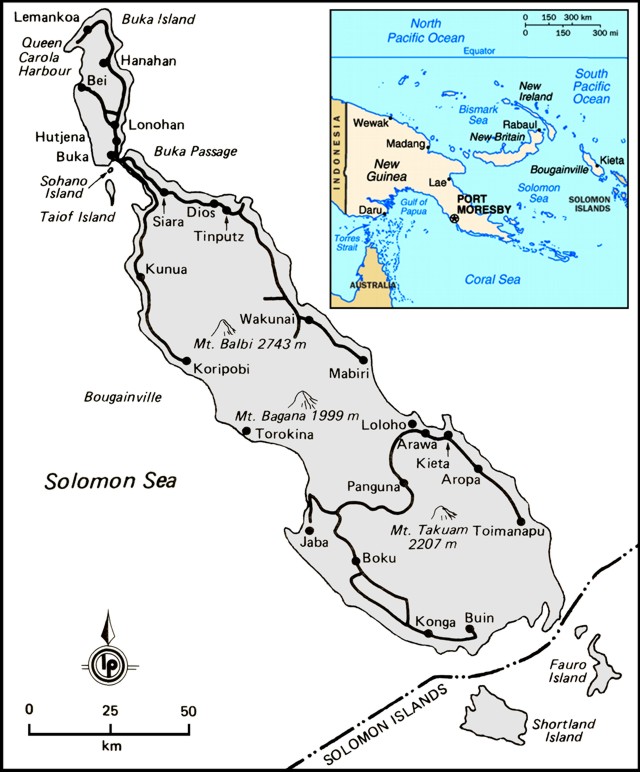 |
Figure 9. Map of Bougainville Island showing adjacent islands and key cities, including Arawa, the disputed capital and largest settlement of the province. Panguna is the location of an enormous gold- and silver-bearing porphyry-copper deposit in the volcanic highlands (Sillitoe, R. H., 1997), and the site of an open-pit mine which closed in 1989. A decade of civil war surrounding the mine hampered reporting on Bougainville's volcanoes. Base map modified from Lightbody and Wheeler (1985). |
In May 2008 the Rabaul Volcanological Observatory (RVO) noted that sluggish lava flowed from the summit towards the S and the Torokina River, along with small ash emissions from the summit that rose a few hundred meters. Smaller dust clouds formed from the lava flow fronts. Night glow was common, as were booming and rumbling noises. On 15 May 2008 the lava flows accelerated and the glow brightened. Activity was low during June. RVO noted variable volumes of white vapor from the summit crater. Occasional loud booming noises were heard, and on the night of 8 June, a weak glow was visible. RVO reports for August through much of December were absent.
Based on observations of satellite imagery, the Darwin Volcanic Ash Advisory Center published aviation advisories for Bagana. From May through December, eight low level ash plumes were observed (table 3). The highest was noted on 22 May, when the plume rose to 3.7 km altitude and drifted S at about 23 km/hour.
Table 3. Darwin VAAC advisories describing ash plumes from Bagana during May 2008 to December 2008.
| Date | Plume Altitude | Drift Directions | Remarks |
| 22 May 2008 | 3.7 km | S | ~23 km/hour |
| 16 Sep 2008 | 2.4 km | SW | -- |
| 22 Sep 2008 | 2.4 km | SW | -- |
| 08 Oct 2008 | 3 km | WSW | Extended 55-110 km |
| 20 Nov 2008 | 3 km | SW | Extended 75 km |
| 26 Nov 2008 | -- | W | -- |
| 02 Dec 2008 | 3 km | NW | -- |
| 16 Dec 2008 | 3 km | SW | -- |
MODVOLC. These satellite-derived infrared alerts were consistent with ongoing Bagana eruptions. As previously reported, MODIS/MODVOLC thermal alerts were abundant during 2006-2007 (BGVN 32:04) and through March 2008 (BGVN 33:03). Thermal alerts continued to be detected from April through the end of December 2008. During this time, the alerts were issued 4-12 times per month. The system, using MODIS (the Moderate Resolution Imaging Spectroradiometer) and the MODVOLC algorithm, is processed by the staff at the Hawaii Institute of Geophysics and Planetology (HIGP).
References. Sillitoe, R. H., 1997, Characteristics and controls of the largest porphyry copper-gold and epithermal gold deposits in the circum-Pacific region: Australian Journal of Earth Sciences, v. 44, no. 3, p. 373-388.
Lightbody, M., and Wheeler, T., 1985, Papua New Guinea, a travel survival kit: Lonely Planet Publications, 256 p., ISBN 0 908086 59 8.
Information Contacts: Rabaul Volcanological Observatory (RVO), Dept of Mining, Private Mail Bag, Port Moresby Post Office, National Capitol District, Papua New Guinea (URL: http://www.pngndc.gov.pg/); Darwin Volcanic Ash Advisory Centre (VAAC), Bureau of Meteorology, Northern Territory Regional Office, PO Box 40050, Casuarina, NT 0811, Australia (URL: http://www.bom.gov.au/info/vaac/); Hawai'i Institute of Geophysics and Planetology (HIGP) Thermal Alerts System, School of Ocean and Earth Science and Technology (SOEST), Univ. of Hawai'i, 2525 Correa Road, Honolulu, HI 96822, USA (URL: http://modis.higp.hawaii.edu/).
Intermittent ash plumes through November 2009; active lava flow
The eruptive activity at Bagana that began in September 2000 continued through late 2009. As previously reported, lava flows and ash emissions occurred during 2008 through at least mid-December (BGVN 33:03 and 33:11). Similar activity, confirmed by visual observations and satellite data, continued through the end of 2009.
Based on analysis of satellite imagery, the Darwin VAAC reported ash plumes on 17 and 29-31 December 2008. Intermittent ash plumes continued to be reported throughout 2009 based on both satellite imagery and visual observations (table 4). Thermal anomalies identified in MODIS data (figure 10) were also intermittent throughout 2009. The frequency and number of daily alert pixels was higher during 1 June-10 August.
Table 4. Ash plumes from Bagana seen on satellite imagery or by visual observations during 2009. Courtesy of the Darwin VAAC and RVO.
| Date | Plume Altitude | Drift Directions | Remarks |
| 17 Dec 2008 | 3 km | W | -- |
| 29 Dec 2008 | -- | W | Extended 75 km |
| 30 Dec 2008 | 2.4 km | NW | -- |
| 31 Dec 2008 | 2.4 km | -- | -- |
| 26 Apr 2009 | 2.4 km | S | Extended 28 km |
| 02 May 2009 | 3 km | NE | Extended 55 km |
| 04 May 2009 | 2.4 km | NE | Extended 45 km |
| 02 Jun 2009 | 2.4 km | W | Extended 75 km |
| 27 Jun 2009 | 2.4 km | SW | Extended 110 km |
| 19 Jul 2009 | 1.8 km | NW | Extended 100 km |
| 20 Jul 2009 | -- | -- | Dense gray ash clouds |
| 26 Jul 2009 | -- | -- | Dense gray ash clouds |
| 30 Jul 2009 | -- | -- | Dense gray ash clouds |
| 10 Aug 2009 | 3 km | NW | Diffuse ash plume extended 55 km |
| 19 Aug 2009 | 2.1 km | W | Extended 90 km |
| 09 Sep 2009 | -- | -- | Light-gray ash emissions |
| 10 Sep 2009 | -- | -- | Light-gray ash emissions |
| 12 Sep 2009 | 2.4 km | NW | Extended 37 km |
| 13 Sep 2009 | 2.4 km | W | Extended 65 km |
| 16 Sep 2009 | -- | -- | Light-gray ash emissions |
| 17 Sep 2009 | 2.4 km | W, SW | Extended 46 km |
| 18 Sep 2009 | 2.4 km | SW, NW | Extended 37 km |
| 19 Sep 2009 | 2.4 km | NW | Extended 28 km |
| 09 Oct 2009 | 2.4 km | SW | Extended 45 km |
| 15 Oct 2009 | 2.1 km | SW | Extended 55 km |
| 12 Nov 2009 | 3 km | SW | Extended 65 km |
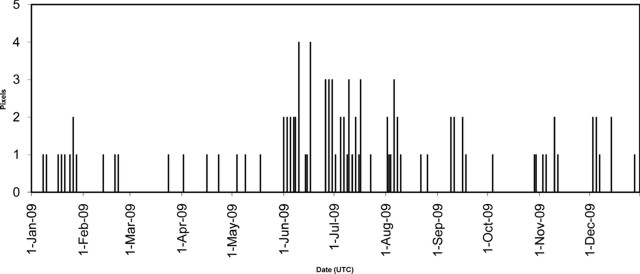 |
Figure 10. Maximum number of daily thermal alert pixels at Bagana as identified by the MODVOLC system during 2009. Data comes from MODIS instruments on both Aqua and Terra satellites; the total shown is the maximum pixels per satellite per pass on a given day (UTC). Courtesy of Hawai'i Institute of Geophysics and Planetology (HIGP) Thermal Alerts System. |
Activity continued at a low level during February 2009 with white vapor emissions from the summit. Occasional loud booming noises were heard between 6 and 13 February. Collapses from the edge of an active lava flow resulted in glowing lava fragments moving down the SW flank that were visible at night on 7 February.
During April both the Main Crater and the Northwest Vent released moderate volumes of white vapor. The emissions from Northwest Vent ceased on 14 April. A single moderately loud booming noise was heard on 23 April from the Main Crater. Intermittent ash plumes extending in various directions were reported by the Darwin VAAC on 26 April, on 2 and 4 May, and again on 2 and 27 June.
July 2009 emissions from the summit crater consisted of white vapor. Single loud booming noises were heard on 15, 16, and 20 July. An ash plume reported by the Darwin VAAC extended 100 km NW on 19 July, and RVO noted dense gray ash clouds on 20, 26, and 30 July. A weak glow was visible on most nights during the month. The lava flow was reported active only on 1 July, when collapses from the leading edge resulted in rapid movement of glowing lava fragments on the SW flank.
During August the Darwin VAAC reported ash plumes on the 10th and 19th. RVO noted that the summit was obscured by atmospheric clouds throughout the first week of September. After that it was clear on most days until the end of October. Activity consisted of dense white emissions, except for 9, 10, and 16 September when small amounts of light gray ash were released. Occasional weak glow was observed on the 9th, but moderately bright glow was seen during 16, 19, 21, and 26 September. More ash plumes were seen in satellite imagery during 12-13 and 17-19 September.
Glow was observed on 3 October, which seems to have been associated with the dislodging of lava fragments from the active flow. Discrete booming noises were heard on 2, 4, and 9 October. The Darwin VAAC reported ash plumes on 9 and 15 October, and 12 November.
Information Contacts: Rabaul Volcano Observatory (RVO), PO Box 386, Rabaul, Papua New Guinea; Darwin Volcanic Ash Advisory Centre (VAAC), Bureau of Meteorology, Northern Territory Regional Office, PO Box 40050, Casuarina, NT 0811, Australia (URL: http://www.bom.gov.au/info/vaac/); Hawai'i Institute of Geophysics and Planetology (HIGP) Thermal Alerts System, School of Ocean and Earth Science and Technology (SOEST), Univ. of Hawai'i, 2525 Correa Road, Honolulu, HI 96822, USA (URL: http://modis.higp.hawaii.edu/).
Occasional thermal alerts from possible lava flows during early 2010
A report issued in October 2009 (Arumba, 2009) described Bagana as the most active in Papua New Guinea due to its sub-continuous effusive activity, which continued in 2009. "The effusive emissions of lava from the summit crater rolled down the western flanks of the volcano. The volume of lava was too insignificant to cause any alarm." The volcano is andesitic and its lava flows tend to be ten's of meters thick. Parks (1948) photographed Bagana in eruption, and Blake (1968) discussed its geology.
Emission of lava flows, intermittent ash plumes, and thermal anomalies that were evident through December 2009 (BGVN 34:11). Reports from the Rabaul Volcano Observatory (RVO) indicated activity continuing through February 2010.
According to RVO the S-flank lava flow resumed in January 2010, and there was occasional roaring and booming from the main vent. On 5 February observers saw dense gray eruption clouds, presumably signifying ash. Weak glow was seen on the nights of 2, 12, 13, and 19 February. For the rest of the month, variable volumes of white vapor were released from the summit vents;no noises were heard.
MODIS/MODVOLC thermal alerts continued. Alerts were recorded on 13, 24, 29, and 31 January; 7, 10, 14, and 19 February; and 16 March 2010. On 16 March, the Terra satellite recorded four hot pixels.
References. Arumba, J., 2009, Agenda Item 3, Coordinating Committee for Geoscience Programmes in East and Southeast Asia (CCOP), 46th CCOP Annual Session, 18-23 October 2009, Vungtau, Vietnam; Member Country Report of Papua New Guinea, October 2009, Annual member country report, 16 p.
Blake, D.H., 1968, Post Miocene volcanoes on Bougainville Island, territory of Papua and New Guinea: Bull. Volcanology, v. 32(1), p. 121-138.
Parks, F.L. (photographer), 1948, Volcano erupts?A crater on Bougainville obliges high-ranking amateur photographer: Life Magazine, November 29, 1948, p. 42.
Information Contacts: Ima Itikarai, Rabaul Volcano Observatory (RVO), PO Box 386, Rabaul, Papua New Guinea; Hawai'i Institute of Geophysics and Planetology (HIGP) Thermal Alerts System, School of Ocean and Earth Science and Technology (SOEST), Univ. of Hawai'i, 2525 Correa Road, Honolulu, HI 96822, USA (URL: http://modis.higp.hawaii.edu/).
Occasional ash plumes during 11 February-1 October 2010
This report discusses thermal anomalies and occasional ash plumes at Bagana during February into October 2010, with some satellite thermal data (MODVOLC) as late as early 2011. Our previous report (BGVN 35:02) also noted small lava flows, occasional ash plumes, and thermal anomalies from October 2009 through February 2010.
Historical records describe frequent eruptions since 1842. Bagana lacks instrumental monitoring and sits far from population centers. Many recent observations are remote-sensing based, although the Rabaul Volcano Observatory (RVO) produces reports with direct air- and ground-based observations. Bagana's flanks are covered with andesitic lava flows up to 50 m thick (Blake, 1968). The flows typically descend the mid-slope within the confines of tall lava levees, but emerge from the levees on the outer flanks to form sub-circular flow fields. Bagana's thick lava flows are visible [from the International Space Station] (figure 11).
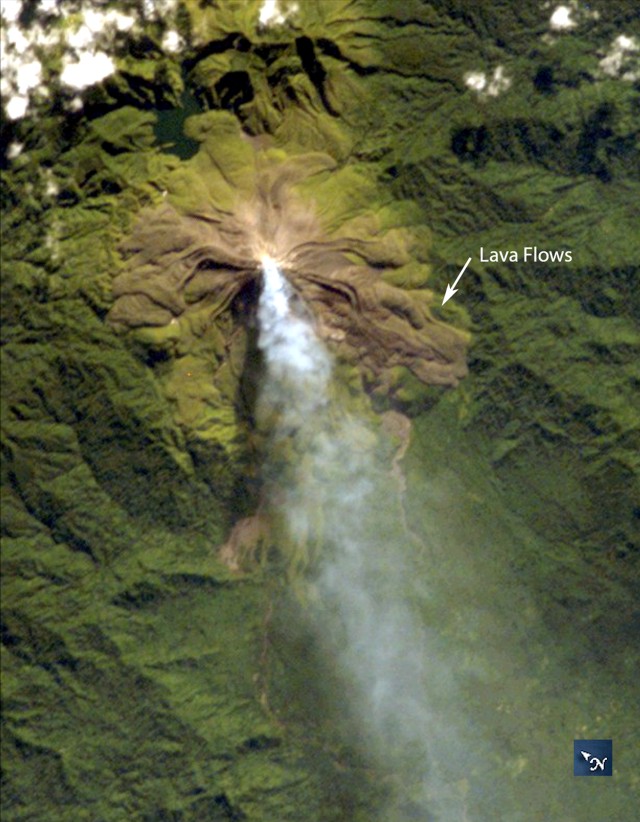 |
Figure 11. An International Space Station photo taken on 2 April 2007 showing a diffuse white vapor plume extending SSW from Bagana's summit. The volcano is known for ongoing activity and lava flows of noteworthy thickness (~50 m thick). The brown-to-olive colors of the volcano stand out amidst the green of tropical rain forest. Astronaut Photo ISS014-E-18844. Courtesy NASA. |
Activity. Between 10 February 2010 and 1 October 2010, the Darwin Volcanic Ash Advisory Center (VAAC) reported one or a few ash plumes per month from Bagana. Many rose to ~3 km and drifted from 20-205 km (table 5). According to RVO, ash plumes were seen on 5 February and night-time incandescence was seen on 2, 12, 13, and 19 February. White vapor was emitted during 1-21 February. Sulfur dioxide plumes drifted ENE during 11-20 February and NNW on 20 and 21 February. Consistent with the thick lava flows, MODVOLC detected well over 100 thermal anomalies at Bagana in the year ending 10 February 2011.
Table 5. Summary of ash plumes from Bagana reported during 1 February-October 2010. Courtesy of the Darwin Volcanic Ash Advisory Centre (VAAC).
| Date | Altitude (km) | Drift (distance and direction) |
| 11-15 Feb 2010 | 2.4 | 18-150 km E, NE |
| 19-20, 23, 25 and 27 Apr 2010 | 1.5-3 | 35-85 km S, SW, W, NW |
| 06, 10-12 May 2010 | 2.4-3 | 55-75 km W, SW, WSW |
| 25-28 May 2010 | 3 | 30-185 km NW, W, SW |
| 13-14 Jun 2010 | 3 | 75-205 km SW, W |
| 04 Jul 2010 | 2.4 | 75 km W |
| 10-11 Jul 2010 | 2.4 | 75-150 km SW |
| 13-15 Aug 2010 | 2.4 | 75 km SW, W |
| 01 Oct 2010 | 2.4 | 75 km NW |
Reference. Blake D H, 1968. Post Miocene volcanoes on Bougainville Island, Territory of Papua and New Guinea. Bull Volc, 32: 121-140
Information Contacts: Darwin Volcanic Ash Advisory Centre (VAAC), Bureau of Meteorology, Northern Territory Regional Office, PO Box 40050, Casuarina, NT 0811, Australia (URL: http://www.bom.gov.au/info/vaac/); Rabaul Volcano Observatory (RVO), PO Box 386, Rabaul, Papua New Guinea; NASA Earth Observatory (URL: http://earthobservatory.nasa.gov/); Hawai'i Institute of Geophysics and Planetology (HIGP) MODVOLC Thermal Alerts System, School of Ocean and Earth Science and Technology (SOEST), Univ. of Hawai'i, 2525 Correa Road, Honolulu, HI 96822, USA (URL: http://modis.higp.hawaii.edu/); Image Science and Analysis Laboratory, NASA-Marshall Space Flight Center (URL: http://eol.jsc.nasa.gov).
Eruption continues during 2011-2013; ash plumes and lava flows
Our last report discussed events at Bagana volcano into early 2011 (BGVN 36:01). One of the most active volcanoes in Papua New Guinea, in eruption since at least early 2000, Bagana is located on the mountainous spine of Bougainville Island. Bagana is far from cities and hard to reach due to the rough terrain (see location map in BGVN 33:11). Monitoring and reporting are often fragmentary and based on distant observers or satellite remote sensors (e.g., MODVOLC thermal alerts).
Bagana emits volcanic gases (primarily water vapor, carbon dioxide and sulfur dioxide) almost continuously, and frequently extrudes thick lava flows. According to Darwin Volcanic Ash Advisory Centre (VAAC) reports, ash plumes from Bagana since our last report in 2011 have ranged in altitude between about 2 and 4.3 km. Figure 12 shows satellite imagery of a recent lava flow on the Bagana's E flank.
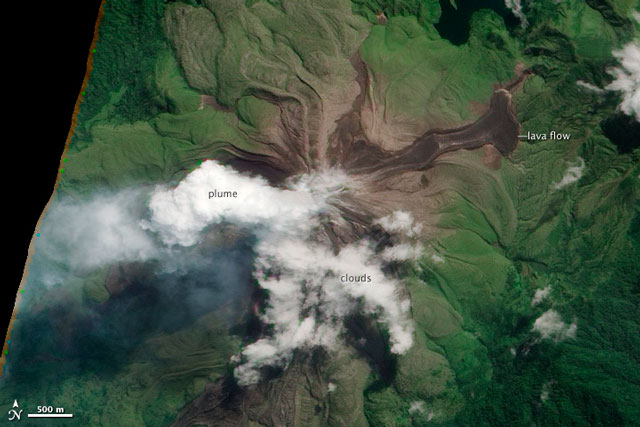 |
Figure 12. This natural-color image reveals a fresh lava flow on Bagana's E flank. The image was collected by the Advanced Land Imager (ALI) aboard the Earth Observing-1 (EO-1) satellite on 16 May 2012. Previous imagery from Landsat 7 showed that this lava flow was emplaced between March 2011 and February 2012. The fresh lava is dark brown. Older lava flows are covered in light green vegetation, and the surrounding forests are dark green. The plume and weather clouds are both white. NASA images by Jesse Allen and Robert Simmon using EO-1 ALI data; original caption by Robert Simmon. Courtesy of NASA Earth Observatory web site. |
The Papua New Guinea Department of Mineral Policy & Geohazards Management (DMPGM) reported that Bagana has been generally quiet since our previous report. Between March 2011 and February 2012, a lava flow occurred on the E flank (figure 12), and intermittent, weak emissions of thin to thick white vapor was observed. MODVOLC thermal alerts were frequent almost every month during the reporting period. Some geographical insight may serve toward a better understanding of the text below (figure 13).
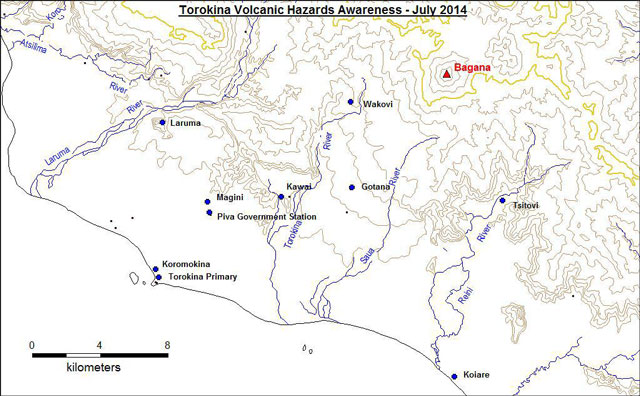 |
Figure 13. Topographic map showing the area around Bagana volcano. The map was prepared for a 1-month community awareness program conducted by the Rabaul Volcano Observatory and the Bagana Observer newspaper. The program was focused around the Torokina area but it also covered some areas in the S and E parts of Bougainville island. Courtesy of DMPGM. |
Rabaul Volcano Observatory (RVO) reported an ash eruption on 13 December 2012. Reports of light ashfall at Arawa (40 km SE of Bagana) were made, and a report of slightly thicker ashfall came from Manetai (~11 km E). No ashfall was reported at Torokina (SW).
The website Panaramio hosts several photos of Bagana taken in January 2013 looking from the W to SW. The images show a steep-sided cone with vigorous steaming coming from an extensive portion of the summit area (Tate, 2013).
During 6-12 August 2014, DMPGM reported increasing activity. Thin to thick white vapor plumes were accompanied on 6 and 8 August by reports of rockfalls. On 10 August, an ash plume rose to an estimated several hundred meters above the crater and drifted SW and W. Moderate ash was reported in Wakovi (6 km WSW), and residents were advised to evacuate to Gotana (~9 km SW of the summit) if ashfall continued. On 11 August, the Darwin VAAC reported ash plumes that rose to an altitude of 3 km and drifted up to 55 km SW. On 12 August, Darwin VAAC raised the Aviation Color Code to Red as ash plumes rose to an altitude of 7.6 km and drifted up to 167 km SW. It was lowered to Orange the next day. During 25-28 August, ash plumes rose 2.1-2.4 km in altitude.
Reference. Tate, Peter John, 2013, Two photos taken in the Autonomous Region of Bougainville, Papua New Guinea (S. Basious, photographer)(URL: http://www.panoramio.com/photo/86632789 and http://www.panoramio.com/photo/86632796); Panoramio-Google Maps (uploaded 26 February 2013; accessed September 2014).
Information Contacts: Papua New Guinea Department of Mineral Policy & Geohazards Management (DMPGM), Port Moresby, Papua New Guinea; MODVOLC, Hawai'i Institute of Geophysics and Planetology (HIGP) Thermal Alerts System, School of Ocean and Earth Science and Technology (SOEST), Univ. of Hawai'i, 2525 Correa Road, Honolulu, HI 96822, USA (URL: http://modis.higp.hawaii.edu/); NASA Earth Observatory (URL: http://earthobservatory.nasa.gov/NaturalHazards); Darwin Volcanic Ash Advisory Centre (VAAC), Bureau of Meteorology, Northern Territory Regional Office, PO Box 40050, Casuarina, NT 0811, Australia (URL: http://www.bom.gov.au/info/vaac/); and Rabaul Volcano Observatory (RVO), PO Box 386, Rabaul, Papua New Guinea.
August 2014 to mid-April 2015, numerous ash plumes emitted
Bagana is one of Melanesia's youngest and most active volcanoes; it is located on Bougainville Island, Papua New Guinea (figure 14). [This report includes] a short summary of activity... from January 2013 through July 2014 (partly described in BGVN 39:06) [with more details for] August 2014-April 2015. The information included in this report primarily was found in material published by the Darwin Volcanic Ash Advisory Center (VAAC). Rabaul Volcano Observatory (RVO) [reports described] activity from August 2014.... [Local time (UTC + 11 hours) is used] for cases and observations reported by observers on the ground (two cases, on 10 and 12 August 2014); [UTC is used in other cases]....
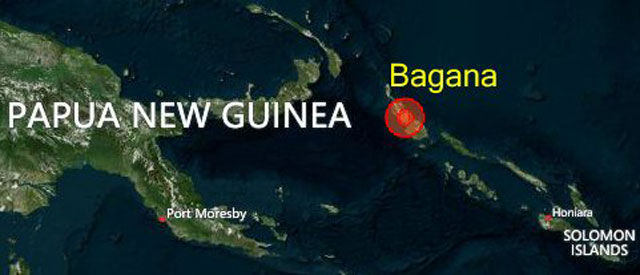 |
Figure 14. Image highlights the location of Bagana on Bougainville Island, Papua New Guinea. Bagana is located in a remote central portion of Bougainville Island. Papua New Guinea is located in SW Pacific, to the N and NE of Australia. Courtesy of the Darwin Volcanic Ash Advisory Center (VAAC). |
Activity during January 2013-July 2014. During this interval, Bagana's activity was mainly characterized by the emission of ash plumes. Based on information in Volcanic Ash Advisories (VAAs) published by the Darwin VAAC, in 2013 ash plumes from Bagana ranged from 1.8-4 km in altitude above sea level (a.s.l.) and drifted between 35 and 130 km. These plumes drifted towards the SW-N-E.
Through July 2014, ash plumes from Bagana ranged from 2.1-3 km in altitude a.s.l. and drifted 25-110 km according to the Darwin VAAC's VAAs. Ash plumes again drifted to the SW-N-E, and also to the SSE.
August-December 2014. This section documents activity at Bagana from August to December 2014. Information on Bagana's activity was scarce during October and December. From August through December, Bagana's Aviation Color Code (ACC) was mainly Orange; however, as noted below, on 12 August 2014, Bagana's ACC was upgraded to Red, the highest of the four colors in the Code. During this interval, ash plumes ranged from 2.1-7.6 km in altitude a.s.l. and drifted as much as 167 km. The plumes drifted to the SW-NE.
At the beginning of August 2014, variable amounts of thin to thick white vapor were seen being emitted from Bagana. During the second week of August, activity at Bagana increased. On 6 and 8 August, noises associated with rock falls were reported. According to the RVO, these rockfalls "may have been triggered by breakaway of large blocky lava from the front lobe of ongoing effusive lava flows which are [well known] for Bagana activity."
According to a 10 August 2014 RVO report, around 0500 local time on 10 August 2014, an eruption began at Bagana that emitted an ash plume with a height estimated at several hundred meters above the crater. Personnel at the government station at Piva in Torokina (figure 13, BGVN 39:06), reported that Bagana continued to emit variable thick dark ash clouds throughout the day. Ash clouds were blown to the SW and W, and possibly to the NW. In Wakovi, 6 km W of Bagana, ashfall was reported to have destroyed small tree branches, banana trees, and potato gardens. Ashfall was also reported in Laruma and at the Piva government station. RVO further stated, "Conditions at Gotana, located about 9 km southwest from the volcano, are slightly better and people from Wakovi have been urged to move there if ashfall continues and conditions deteriorates."
Whether any Wakovi residents did evacuate is uncertain.
From 2332 UTC on 10 August to 2132 UTC on 11 August, a volcanic ash plume was seen in satellite imagery (figure 15). The plume rose to an altitude of 3.1 km a.s.l. and eventually extended 167 km SW. On 12 August 2014, the Darwin VAAC observed ash clouds rising to an altitude of 7.6 km a.s.l., resulting in Bagana's ACC to be increased to Red. The plumes eventually extended 167 km SW. In their VAAs from 12 August UTC, the Darwin VAAC remarked that an ongoing eruption (described as low-level in VAAs from 0700-~1000 UTC) was observed on satellite. In some of those VAAs, they also stated, "Ash from [the] initial explosive eruption [was] partially obscured by thunderstorm activity and [was] becoming detached from [the] volcano."
According to a 13 August 2014 RVO report, at 1810 local time on 12 August, an earthquake was felt with an intensity of II on the Modified Mercalli Scale. The report stated that the earthquake was tectonic in origin. That RVO report also stated that areas in the W and SW were affected by ashfall. They described the level of exposure from ash as moderate in Wakovi and low around Kawai, Gotana and Piva government station (figure 13, BGVN 39:06).
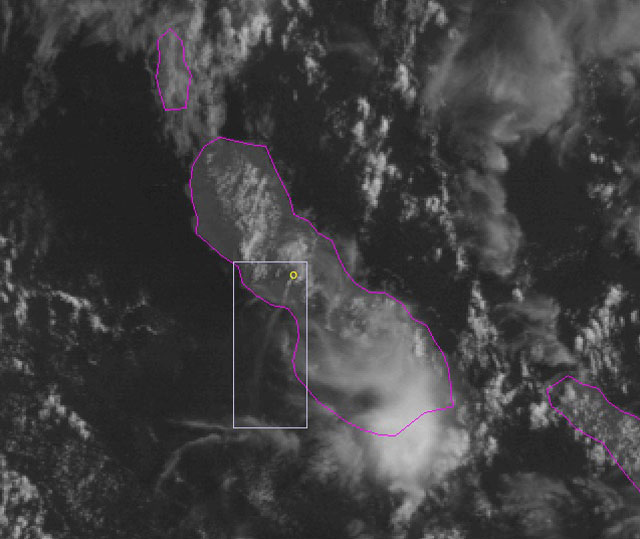 |
Figure 15. A MTSAT-2 Visible satellite image captured on 10 August at 23:32 UTC. Volcanic ash plume emitted from Bagana is enclosed in the white rectangle. This plume was observed to an altitude of 3.1 km a.s.l and eventually drifted 167 km SW. On the image, Bagana is represented by the yellow circle. Taken from 6-14 August 2014 Weekly Activity report compiled by the Darwin VAAC. |
According to the 13-19 August 2014 Darwin VAAC Weekly Activity report, Bagana's ACC was downgraded to Orange; the specific date when the downgrade occurred was not stated. Bagana's ACC remained Orange through the end of the year. RVO reported that since 10 August, there were ash emissions, but Bagana's level of activity had decreased.
From 25-28 August 2014, ash plumes, identified on satellite images, ranged from altitudes of 2.1-2.4 km a.s.l. and extended from 35-120 km, mainly to the W and WNW and some to the SW. From 19-31 August, RVO reported that Bagana's activity was characterized by weak to moderate white vapor. They reported light gray ash plumes blowing SW on 19 and 27 August and a dull glow emanating from the summit on 19, 27, 29, and 31 August. Low roaring noises were also briefly heard on 27 August according to the RVO.
During September 2014, the Darwin VAAC reported a narrow ash plume on satellite imagery at 2132 UTC on 13 September. The plume was observed at an altitude of 2.4 km a.s.l and extended 139 km to the W. Then at 2332 UTC on 20 September, another ash plume was observed at 2.4 km a.s.l. This plume extended 56 km W. In the available Darwin VAAC Weekly Activity reports, only Bagana's ACC was reported during the month of October.
In November 2014, an ash plume that extended 65 km S was observed at 2132 UTC on 8 November. In a VAA released at 0232 UTC on 9 November, the Darwin VAAC reported that ash from Bagana had dissipated in the satellite imagery. At the end of December 2014, Darwin VAAC reported an ash plume from Bagana on 29 December. The plume rose to an altitude of 2.4 km a.s.l. and extended ~95 km NE.
January through 14 April 2015. This section discusses Bagana activity from January to mid-April 2015. During this interval, Bagana's ACC was reported as Orange by the Darwin VAAC. During much of February and March 2015, Bagana's ACC was the only information reported in the available Darwin VAAC Weekly Activity reports. In this interval, ash plumes rose up to3.7 km in altitude a.s.l. and drifted to the N-NE-SE and to the SW.
At 2232 UTC on 20 January 2015, an ash plume was identified on satellite images. Darwin VAAC considered the plume to be low-level and it extended 37 km NE at an altitude of 3.7 km a.s.l. At 0032 UTC on 21 January, Darwin VAAC identified the ash plume again on satellite imagery. In that satellite image, the plume extended 22 km NE at an altitude of 3.7 km a.s.l. After that, the Darwin VAAC reported a meteorological cloud that covered the area. Later at 2232 UTC on 21 January, the plume was seen drifting 18 km SW at an altitude of 2.7 km a.s.l (figure 16).
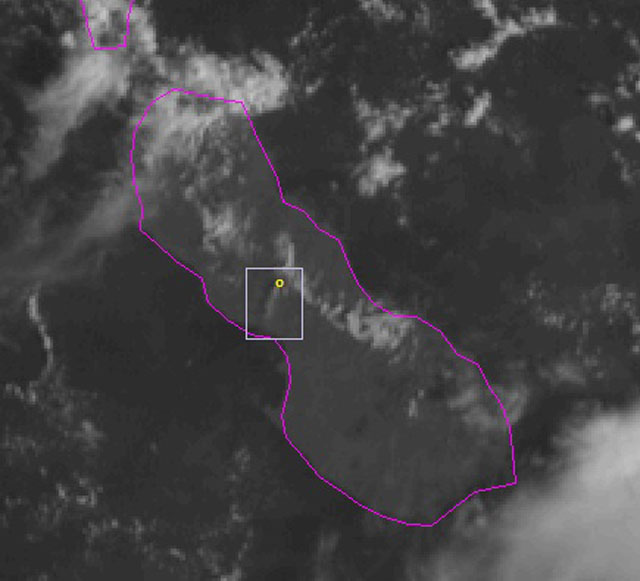 |
Figure 16. An MTSAT-2 satellite image captured at 2232 UTC 21 January 2015. The volcanic ash plume in within the rectangle drifted 18 km SW at an altitude of 2.7 km. Bagana is represented by the yellow circle. Taken from the 21-27 January 2015 issue of the Weekly Activity report compiled by the Darwin VAAC. |
On 25 March 2015, an ash plume was identified on satellite imagery at 2132 UTC. The plume was observed at 2.1 km and drifted 37 km N-NE. At 2132 UTC on 26 March, another volcanic plume was observed at 3.1 km and extended 56 km NE. The Darwin VAAC reported observing a consistent plume until 0108 UTC on 30 March, when ash had dissipated. When the consistent plume was first observed was not stated in the 25-31 March 2015 Darwin VAAC Weekly Activity report. Darwin VAAC also reported a plume on satellite images at 2132 UTC on 31 March. The plume drifted 74 km SE at an altitude of 2.1 km. The plume then shifted to the NE before a VAA at 0438 UTC on 2 April reported that the ash had dissipated. In the 8-14 April 2015 Weekly Activity report, the ACC remained at Orange.
Information Contacts: Darwin Volcanic Ash Advisory Centre (VAAC), Bureau of Meteorology, Northern Territory Regional Office, PO Box 40050, Casuarina, NT 0811, Australia (URL: http://www.bom.gov.au/info/vaac/); and Rabaul Volcano Observatory, Department of Mineral Policy and Geohazards Management, Volcanological Observatory Geohazards Management Division, P.O. Box 386, Kokopo, East New Britain Province, Papua New Guinea.
Ongoing ash plumes and thermal anomalies through early 2016
Bagana is one of the most active volcanoes in Papua New Guinea, and has been in eruption since at least early 2000 (BGVN 39:06). It is monitored by the Rabaul Volcano Observatory (RVO) and the Darwin Volcanic Ash Advisory Centre (VAAC), though reports are often fragmentary and based on distant observers or satellite remote sensing. The last recorded lava flow was emplaced sometime between March 2011 and February 2012 (BGVN 39:06), and an ash plume on 10 August 2014 rose to 7.6 km altitude (BGVN 39:12). Intermittent ash plumes rising to 2.5 km were reported for the rest of 2014.
During January 2015 thru February 2016 there were no reports from RVO, so the primary data sources for activity at the volcano were Darwin VAAC, MODIS/MODVOLC, and MIROVA data. The volcano exhibited intermittent low level eruptive activity characterized by ash plumes and thermal anomalies, and was not quiet for more than a month at a time during this period.
During 20-21 January 2015, ash plumes to 3.7 km, drifting up to 35 km NE and SW, were reported by Darwin VAAC. MODVOLC thermal anomalies were also observed on 18 and 20 January. While no activity was recorded for February, there were continuous VAAC reports from 25 March through 1 April. The ash plumes were reported at 2-3 km altitude, and drifting 35-75 km N, NE, and SE. Only one thermal anomaly, on 16 March, was reported that month. Although no VAAC reports or MODVOLC thermal data were recorded in April and early May, MIROVA data (figure 17) indicated a low level of ongoing activity during this time.
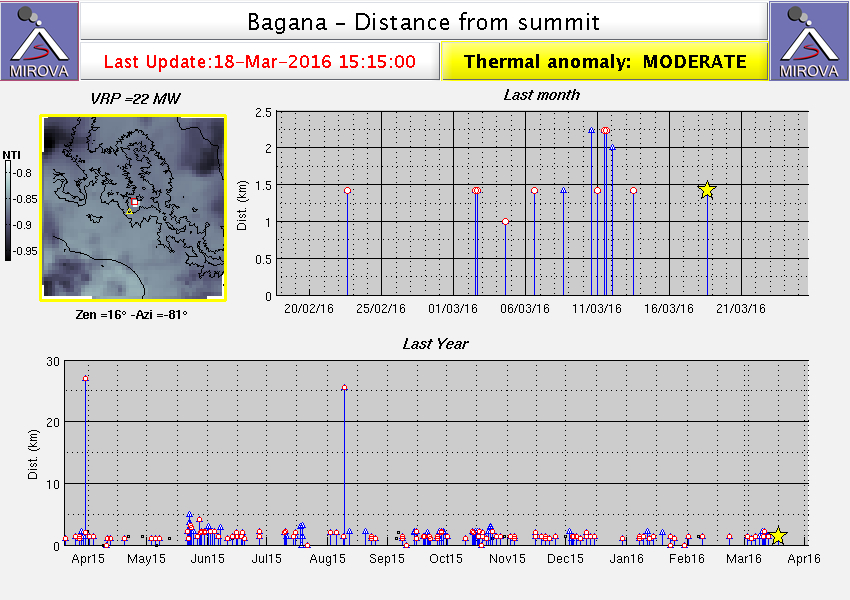 |
Figure 17. MIROVA data at Bagana for the period 1 April 2015 to 18 March 2016. Note continued intermittent activity within a few kilometers of the summit during this period. Intervals of increased activity in late May-early June, late September and late October 2015 correspond with VAAC reports and/or MODIS thermal data, confirming ongoing activity. Courtesy of MIROVA. |
Activity picked up again in late May 2015 with more extensive MODVOLC thermal anomalies of multiple pixels on 21 and 22 May, and then more intermittent data on 23, 24, 26, 28, 30 May and 2 June. The first VAAC report during this interval was on 27 May with a plume reported to 3 km, drifting 160 km NW. Additional thermal activity recorded on 4 and 6 June corroborates with VAAC reports from 3-5 June of an ash plume rising to 2.4 km and drifting 45-65 km SW. Numerous thermal anomalies were also recorded by MIROVA during early June.
Even though no more ash plumes were reported until September, thermal anomalies were recorded on 15 June, and 10, 15, and 19 July by MODVOLC, and also show intermittently in the MIROVA data during the late June through September window. September brought more reports of ash plumes on 23-24 and 26-27 and MODVOLC thermal anomalies on days 8, 15, 26 and 28. The ash plumes rose to 1.8 to 2.4 km and drifted 35-100 km N, NE, E, and SE.
While MODVOLC thermal anomalies were only recorded on 14 and 19 October, VAAC ash reports were issued three separate times, over 16-20, 24-26, and 29-30 October. None of the ash plumes rose higher than 2.4 km or drifted farther than 95 km; plumes went in all wind directions during these events. Although there were no more VAAC reports through February 2016, MODVOLC thermal anomalies on 20 November and 6 December 2015, as well as 7 and 23 January 2016 are all consistent with ongoing low level eruptive activity. These data are supported by MIROVA thermal anomalies during this time as well (figure 17).
Information Contacts: Darwin Volcanic Ash Advisory Centre (VAAC), Bureau of Meteorology, Northern Territory Regional Office, PO Box 40050, Casuarina, NT 0811, Australia (URL: http://www.bom.gov.au/info/vaac/); Hawai'i Institute of Geophysics and Planetology (HIGP) MODVOLC Thermal Alerts System, School of Ocean and Earth Science and Technology (SOEST), Univ. of Hawai'i, 2525 Correa Road, Honolulu, HI 96822, USA (URL: http://modis.higp.hawaii.edu/); MIROVA, a collaborative project between the Universities of Turin and Florence (Italy) supported by the Centre for Volcanic Risk of the Italian Civil Protection Department (URL: http://www.mirovaweb.it/).
Regular ash plumes and intermittent thermal anomalies during January-June 2016
Volcanic activity at Bagana for the first half of 2016 was characterized by intermittent ash emissions and thermal anomalies similar to 2015. Evidence comes from the Darwin VAAC (Volcanic Ash Advisory Center) and MODIS infrared satellite data as processed by both MODVOLC (Moderate Resolution Imaging Spectroradiometer) and MIROVA (Middle InfraRed Observation of Volcanic Activity) , and OMI (Ozone Monitoring Instrument) SO2 data. No ground observations were reported during this time. The intermittent yet continuous nature of the eruption is best seen in the MIROVA data (figure 18).
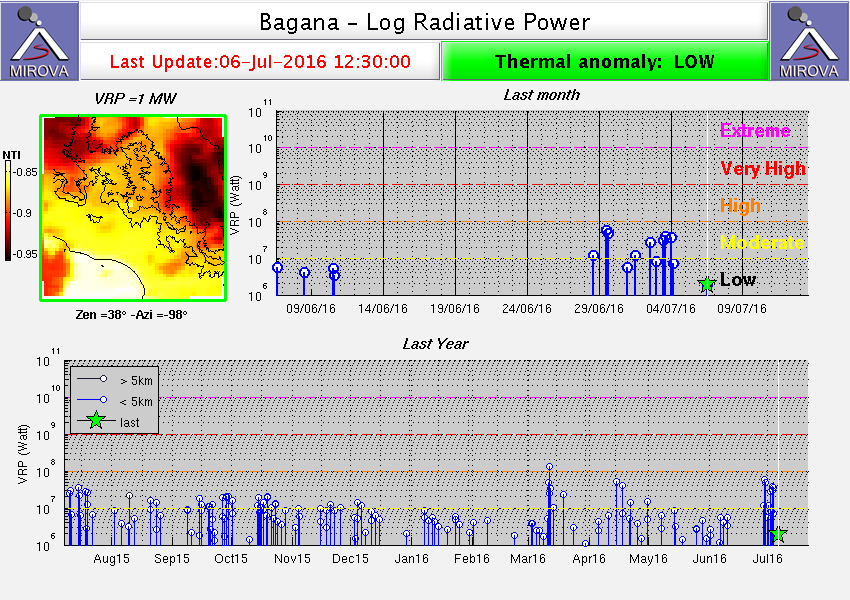 |
Figure 18. Infrared MODIS data processed by MIROVA showing the Log Radiative Power, characterizing the strength of the thermal anomaly, for Bagana from July 2015 through June 2016. The Volcanic Radiative Power (VRP) is a measurement of the heat radiated by the volcanic activity at the time of a satellite acquisition. It is calculated in watts (W) and represents a combined measurement of the area of the volcanic emitter and its "effective radiating temperature" (higher than 600° K, or 327°C). This "excess" radiance is linearly related to the radiative power. Note continued pulses of moderate radiative power between January and June 2016, with episodes in early March and late April approaching 108 VRP. Image courtesy MIROVA. |
MODVOLC only recorded single-pixel anomalies twice in January (7 and 23) near the summit on the north side. MIROVA (figure 18) also shows anomalies, likely on the same days in January and several other days in January and February, at levels consistently below 107 Watts VRP, indicating that Volcanic Radiative Power (VRP) was low but at detectable in January and February.
Darwin VAAC issued reports on ash plumes three times in March (3-4, 11, and 24). During 3-4 and 11 March, the plumes rose to 2.1 km and drifted 40-110 km N, NE and SE. A higher plume on 24 March rose to 3.6 km and was observed and modeled drifting 45-55 km NE and ENE. Additionally, the 11 March event was captured by MODVOLC as three pixels N and W of the summit. A small SO2 anomaly on 15 March was observed by the OMI instrument (figure 19); it quickly dissipated to the ESE within 48 hours. Another MODVOLC anomaly on 18 March of two pixels appeared a short distance NNE of the summit.
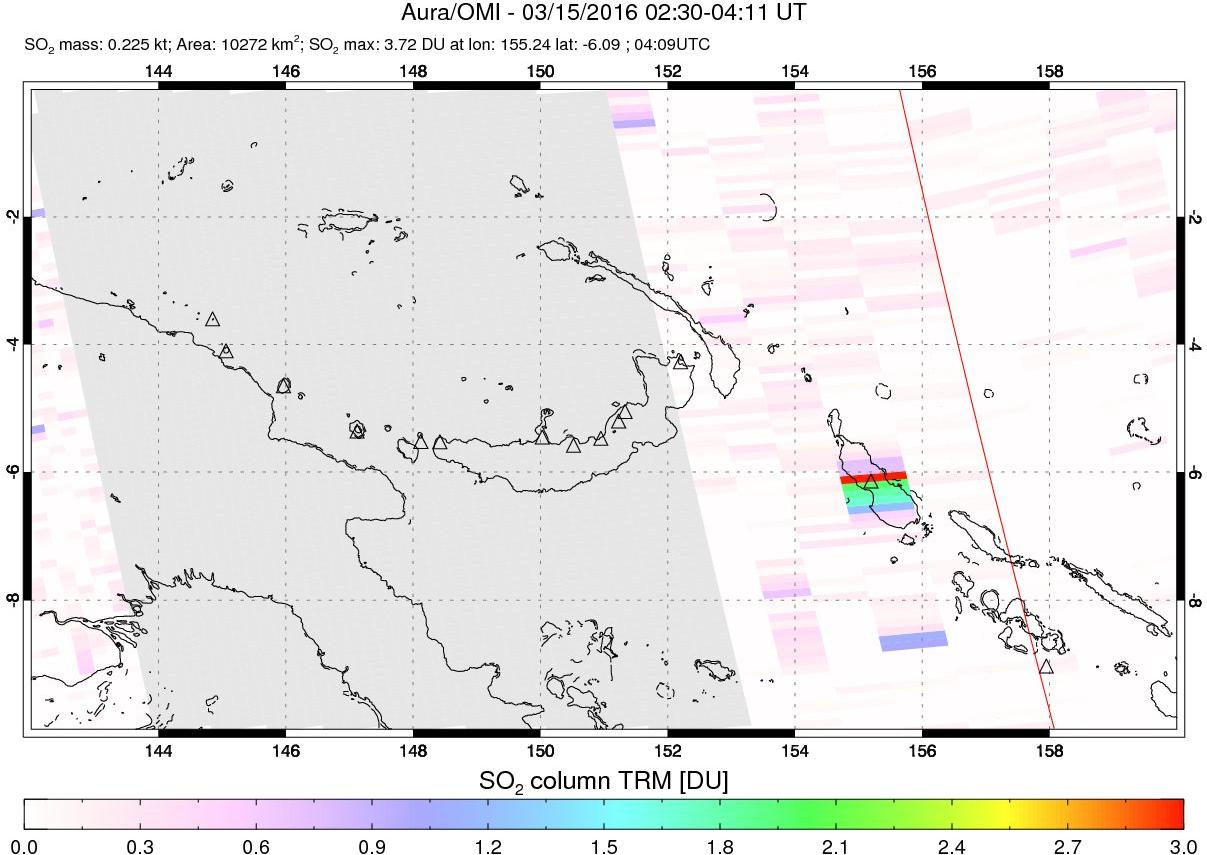 |
Figure 19. SO2 anomaly from OMI over Bagana on 15 March 2016. It appeared very diffuse on the 16 and 17 March images, and drifted ESE. Bagana is the triangle underneath the SO2 anomaly. Image courtesy of NASA Goddard Space Flight Center. |
MODVOLC thermal anomalies of one or two pixels appeared three times in April (14, 17, and 21), all without corresponding Darwin VAAC reports. They were located slightly N, NE, and NW of the summit. Darwin VAAC reported two separate plume events later in April and early May. During 23-24 April a plume was observed at 2.1-3 km altitude drifting 25-35 km S and SW. An extended report of plumes from 26 April to 5 May by Darwin VAAC likely correlate with the MIROVA VRP spikes during that period (figure 18). These plumes rose to 2.1 km and drifted 45-100 km SW, W, and NW. The plumes were "clearly observed" by Darwin VAAC during this interval in visible satellite imagery on 26 and 28 April and 3 and 4 May.
Six more series of Darwin VAAC reports of ash plumes between 7 May and 16 June indicate continued activity. All plume heights were recorded as 2.1 km and drift distances were up to 140 km in various directions. Four of the report series only lasted up to 36 hours (7-8 May, 22 May, 2 June, and 16 June), but two of the report series covered longer periods of plume activity (25-29 May, 8-12 June).
Information Contacts: Darwin Volcanic Ash Advisory Centre (VAAC), Bureau of Meteorology, Northern Territory Regional Office, PO Box 40050, Casuarina, NT 0811, Australia (URL: http://www.bom.gov.au/info/vaac/); MIROVA, a collaborative project between the Universities of Turin and Florence (Italy) supported by the Centre for Volcanic Risk of the Italian Civil Protection Department (URL: http://www.mirovaweb.it/); Hawai'i Institute of Geophysics and Planetology (HIGP), MODVOLC Thermal Alerts System, School of Ocean and Earth Science and Technology (SOEST), Univ. of Hawai'i, 2525 Correa Road, Honolulu, HI 96822, USA (URL: http://modis.higp.hawaii.edu/); OMI (Ozone Monitoring Instrument), Global Sulfur Dioxide Monitoring, Atmospheric Chemistry & Dynamics, NASA Goddard Space Flight Center, Goddard, Maryland, USA (URL: https://so2.gsfc.nasa.gov/)
Frequent ash plumes and thermal anomalies from July 2016 through mid-June 2017
Eruptive activity has been ongoing at Bagana since February 2000, and frequently active for over 150 years. Due to the remote location of this volcano, the most reliable observations of activity come from the identification of ash plumes in satellite imagery by the Darwin Volcanic Ash Advisory Centre (VAAC) and thermal anomalies from satellite infrared sensors.
Since July 2016 (BGVN 41:07), the Darwin VAAC issued aviation warnings of ash plumes almost every week through mid-June 2017. The plumes typically rose to between 1.8 and 3.4 km; the most commonly reported altitude of the plume was about 2.1 km. The plumes drifted in multiple directions depending on the local wind patterns. Drift directions were not always reported, but a few reached 110-120 km, and one was observed as far as 160 km away on 7 September 2016.
MODIS data processed by the MIROVA algorithm (figure 20) reinforce the Darwin VAAC reports of a nearly continuous eruption since July 2016 through mid-June 2017. Frequent MODVOLC thermal alerts, also based on MODIS satellite-based data, corroborate the MIROVA analysis.
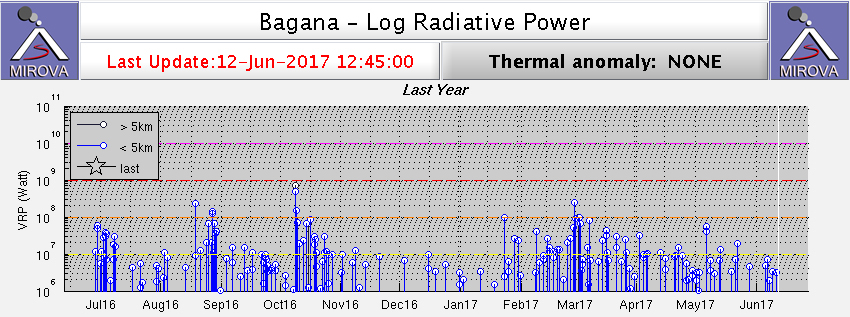 |
Figure 20. Thermal anomalies at Bagana shown on a MIROVA plot (Log Radiative Power) for the year ending 12 June 2017. Courtesy of MIROVA. |
Information Contacts: Darwin Volcanic Ash Advisory Centre (VAAC), Bureau of Meteorology, Northern Territory Regional Office, PO Box 40050, Casuarina, NT 0811, Australia (URL: http://www.bom.gov.au/info/vaac/); MIROVA (Middle InfraRed Observation of Volcanic Activity), a collaborative project between the Universities of Turin and Florence (Italy) supported by the Centre for Volcanic Risk of the Italian Civil Protection Department (URL: http://www.mirovaweb.it/); Hawai'i Institute of Geophysics and Planetology (HIGP), MODVOLC Thermal Alerts System, School of Ocean and Earth Science and Technology (SOEST), Univ. of Hawai'i, 2525 Correa Road, Honolulu, HI 96822, USA (URL: http://modis.higp.hawaii.edu/).
Intermittent ash plumes and thermal anomalies continue through 15 April 2018
Bagana is a relatively remote volcano on Bougainville Island that is poorly monitored except by satellite. The most recent eruptive phase began on or before early 2000 with intermittent ash plumes and thermal anomalies (BGVN 41:04, 41:07, 42:08). During the period 13 June 2017-15 April 2018, this same pattern of activity continued. Intermittent ash plumes rose to 2.1-2.4 km altitude (table 6). Plume activity was especially elevated during August 2017. Satellite data indicate that both plume activity and thermal alerts had decreased markedly by the beginning of March 2018.
Table 6. Summary of ash plumes from Bagana reported during 14 June 2017-15 April 2018. Courtesy of the Darwin Volcanic Ash Advisory Centre (VAAC).
| Date | Max Plume Altitude (km) | Plume Drift |
| 14 Jun 2017 | 2.1 | 65 km SW, W, NW |
| 22, 25 Jun 2017 | 2.1 | NW |
| 02 Jul 2017 | 2.1 | W |
| 16 Jul 2017 | 2.1 | W |
| 23 Jul 2017 | 2.1 | W |
| 01 Aug 2017 | 2.1 | W |
| 05-08 Aug 2017 | 2.1 | Multiple |
| 09-10, 13 Aug 2017 | 2.4 | W, NW (120 km W on 13 Aug) |
| 24-28 Aug 2017 | 2.1-2.4 | WNW, W, SW |
| 31 Aug 2017 | 2.1 | N, W, SW |
| 11-12 Sep 2017 | 2.1 | NW |
| 27 Oct 2017 | 2.1 | E, NE |
| 03 Nov 2017 | 2.4 | NE |
| 15-17 Nov 2017 | 2.1 | N, SW, SSW, W |
| 25-26 Dec 2017 | 2.4 | NE |
| 07-08 Feb 2018 | 2.4 | NE |
| 26-27 Feb 2018 | 2.1 | WNW |
| 02 Mar 2018 | 2.4 | NE |
| 14-15 Apr 2018 | 2.1-2.4 | 110 km SW |
Thermal anomalies, based on MODIS satellite instruments analyzed using the MODVOLC algorithm, were observed 0-3 days each month during June-November 2017, seven days in December 2017, one day in January 2018, and two days in February 2018. More than two pixels were recorded on 4-5 and 9 December (up to five pixels), 31 January (4 pixels), and 4 February (5 pixels).
The MIROVA (Middle InfraRed Observation of Volcanic Activity) volcano hotspot detection system, also based on analysis of MODIS data, recorded a moderate number of thermal alerts within 5 km of the volcano from June through late November 2017, except for a decrease between mid-September and mid-October (figure 21). Activity rose sharply during the end of November through early December and again during the first half of January before tapering off, a pattern inconsistent with the reported ash plumes. Few hotspots were detected between mid-February through 15 April, a pattern consistent with the MODVOLC data.
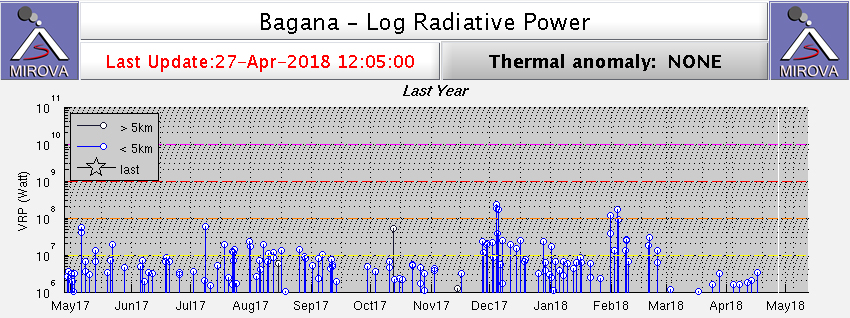 |
Figure 21. Thermal anomalies at Bagana shown on a MIROVA plot (Log Radiative Power) for the year ending 27 April 2018. Courtesy of MIROVA. |
Sulfur dioxide anomalies since June 2016 above 2.5 Dobson Units (Ozone Monitoring Instrument, OMI) or above 1.6 Dobson Units (Ozone Mapping and Profiler Suite, OMPS) occurred in 2016 on 4 and 6 July, 10-11 October, 11 November, and 3 December. Similar emissions were detected in 2017 on 30 January, 3 and 19 March, 15 April, 5 August, and 2 and 7 December. The satellite data showed high levels of SO2 in 2018 on 8 and 24 February, and 29 March.
Information Contacts: Darwin Volcanic Ash Advisory Centre (VAAC), Bureau of Meteorology, Northern Territory Regional Office, PO Box 40050, Casuarina, NT 0811, Australia (URL: http://www.bom.gov.au/info/vaac/); MIROVA, a collaborative project between the Universities of Turin and Florence (Italy) supported by the Centre for Volcanic Risk of the Italian Civil Protection Department (URL: http://www.mirovaweb.it/); Hawai'i Institute of Geophysics and Planetology (HIGP) - MODVOLC Thermal Alerts System, School of Ocean and Earth Science and Technology (SOEST), Univ. of Hawai'i, 2525 Correa Road, Honolulu, HI 96822, USA (URL: http://modis.higp.hawaii.edu/); NASA Goddard Space Flight Center (NASA/GSFC), Global Sulfur Dioxide Monitoring Page, Atmospheric Chemistry and Dynamics Laboratory, 8800 Greenbelt Road, Goddard, Maryland, USA (URL: https://so2.gsfc.nasa.gov/).
Intermittent ash plumes; thermal anomalies continue through January 2019
The relatively remote Bagana volcano, located on Bougainville Island, Papua New Guinea, is poorly monitored and most of the available data is obtained by satellites (figure 22). The most recent eruptive phase began on or before early 2000 with intermittent ash plumes and detected thermal anomalies (BGVN 41:04, 41:07, 42:08, 43:05). The Darwin Volcanic Ash Advisory Centre (VAAC) monitors satellite imagery for ash plumes that could impact aviation.
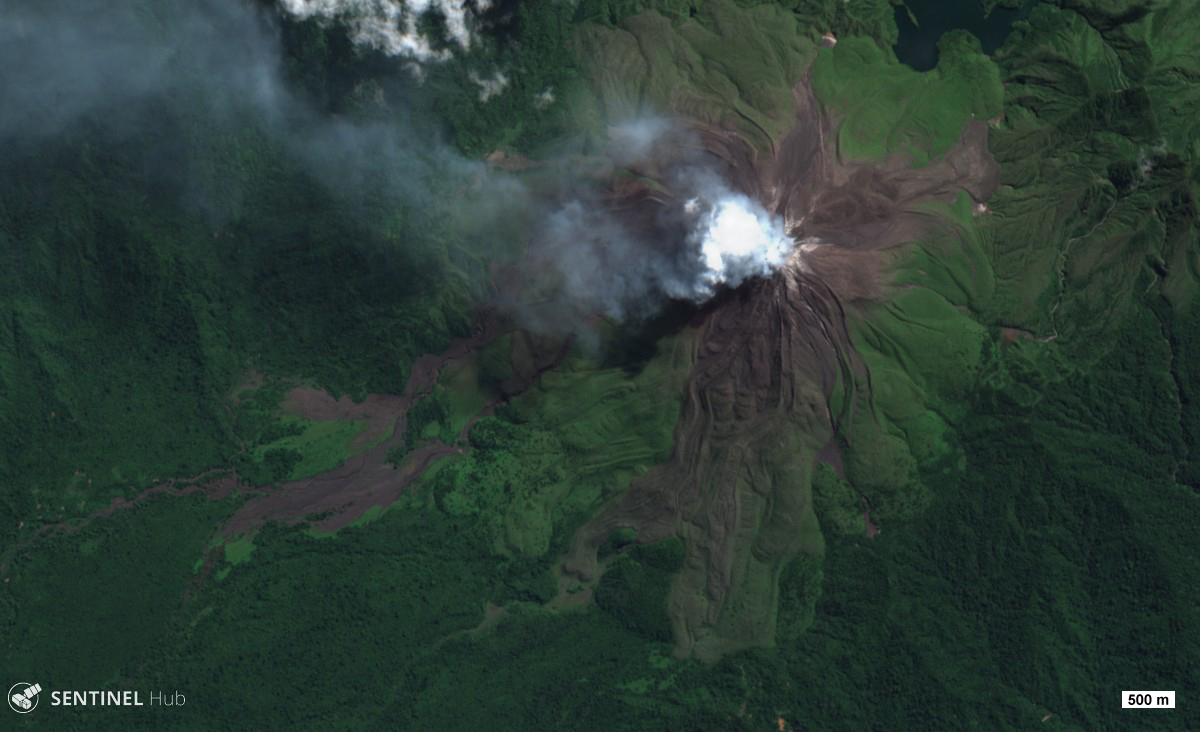 |
Figure 22. Sentinel-2 satellite image (natural color, bands 4, 3, 2) of Bagana on 28 May 2018. Courtesy of Sentinel Hub Playground. |
Cloud cover obscured the volcano during much of the reporting period, but significant ash plumes were identified five times by the Darwin Volcanic Ash Advisory Centre (VAAC), in May, July, and December 2018 (table 6). Infrared satellite imagery from Sentinel-2 frequently showed thermal anomalies, both at the summit and caused by hot material moving down the flanks (figure 23).
Table 6. Summary of ash plumes from Bagana reported during May 2018 through January 2019. Courtesy of the Darwin Volcanic Ash Advisory Centre (VAAC).
| Date | Max Plume Altitude (km) | Plume Drift |
| 08 May 2018 | 2.1 | W |
| 11 May 2018 | 2.1 | SW |
| 22 Jul 2018 | 2.4 | W |
| 29-30 Jul 2018 | 1.8-2.1 | SW |
| 01 Dec 2018 | 3-6.1 | SE |
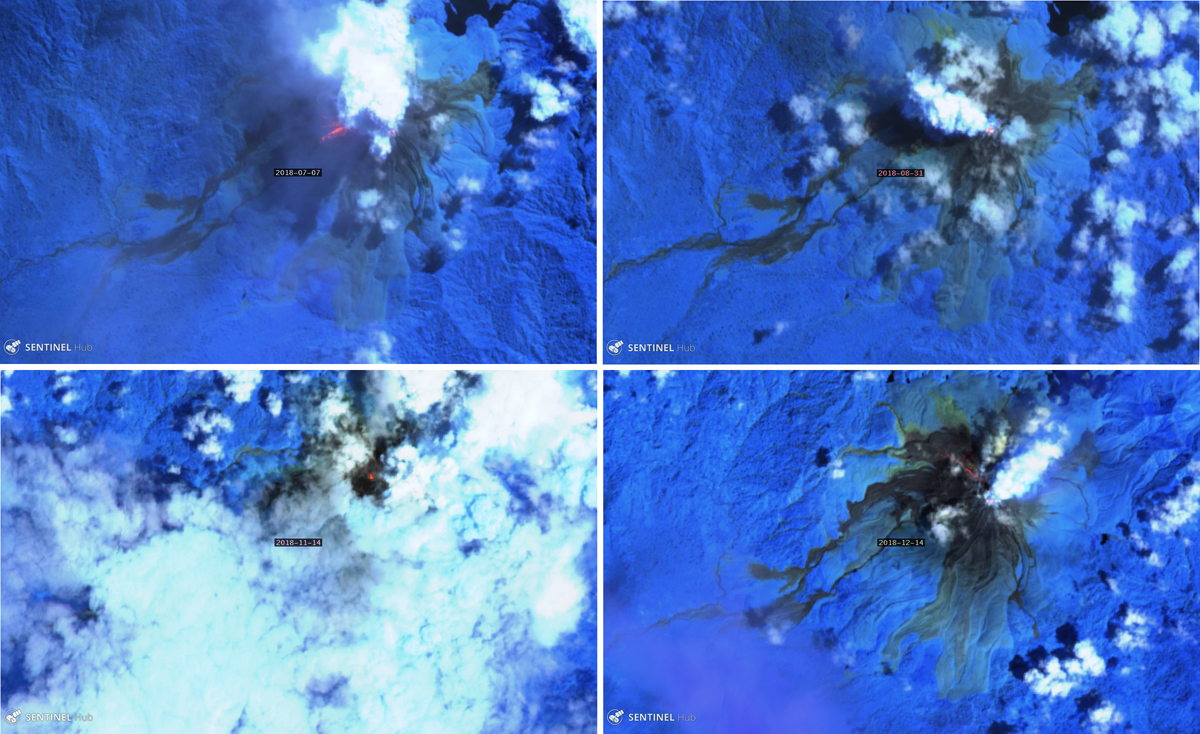 |
Figure 23. Infrared satellite images from Sentinel-2 (atmospheric penetration, bands 12, 11, 8A) showing hot areas at the summit and on the flanks on 7 July (top left), 31 August (top right), 14 November (bottom left) and 14 December (bottom right) 2018. Courtesy of Sentinel Hub Playground. |
The MIROVA (Middle InfraRed Observation of Volcanic Activity) volcano hotspot detection system, recorded a large number of thermal alerts within 5 km of the summit throughout this reporting period (figure 24). Thermal alerts increased in number and intensity beginning mid-July 2018. This pattern is also consistent with the MODVOLC data (also based on MODIS satellite data). A total of 76 thermal anomaly pixels were recorded during the reporting period; of these, greater than 40 pixels were observed during July 2018 alone with 13 pixels reported in December 2018.
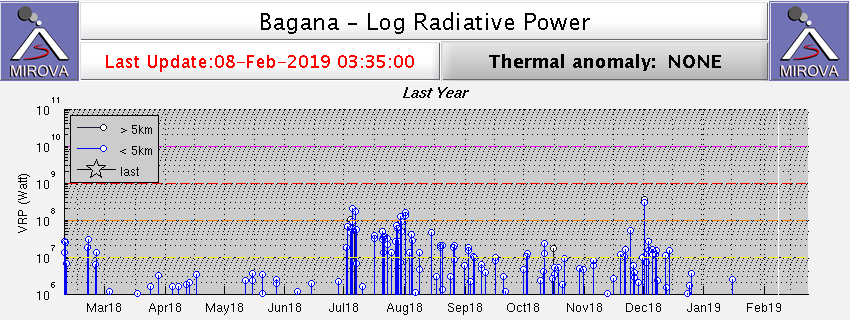 |
Figure 24. Thermal anomalies identified at Bagana by the MIROVA system (log radiative power) for the year ending 8 February 2019. Courtesy of MIROVA. |
Small sulfur dioxide (SO2) anomalies were detected by the AuraOMI instrument during this period, the highest being in the range of 1.5-1.8 Dobson Units (DU). Emissions in this range occurred during 7, 21, and 28 July, and 3-5 and 19 December 2018.
Information Contacts: Darwin Volcanic Ash Advisory Centre (VAAC), Bureau of Meteorology, Northern Territory Regional Office, PO Box 40050, Casuarina, NT 0811, Australia (URL: http://www.bom.gov.au/info/vaac/); MIROVA, a collaborative project between the Universities of Turin and Florence (Italy) supported by the Centre for Volcanic Risk of the Italian Civil Protection Department (URL: http://www.mirovaweb.it/); Hawai'i Institute of Geophysics and Planetology (HIGP) – MODVOLC Thermal Alerts System, School of Ocean and Earth Science and Technology (SOEST), Univ. of Hawai'i, 2525 Correa Road, Honolulu, HI 96822, USA (URL: http://modis.higp.hawaii.edu/); NASA Goddard Space Flight Center (NASA/GSFC), Global Sulfur Dioxide Monitoring Page, Atmospheric Chemistry and Dynamics Laboratory, 8800 Greenbelt Road, Goddard, Maryland, USA (URL: https://so2.gsfc.nasa.gov/).
Infrequent thermal anomalies, no ash emissions, February-May 2019
With historical eruptions reported back to 1842, Papua New Guinea's Bagana volcano on the island of Bougainville has been characterized by viscous andesitic lava flows down the steep flanks of its cone, along with intermittent ash plumes and pyroclastic flows. Ongoing thermal anomalies and frequent ash plumes have been typical of activity during the current eruption since it began in early 2000. Activity declined significantly in December 2018 and remained low through May 2019, the period covered in this report (figure 25). Information for this report comes primarily from satellite images and thermal data.
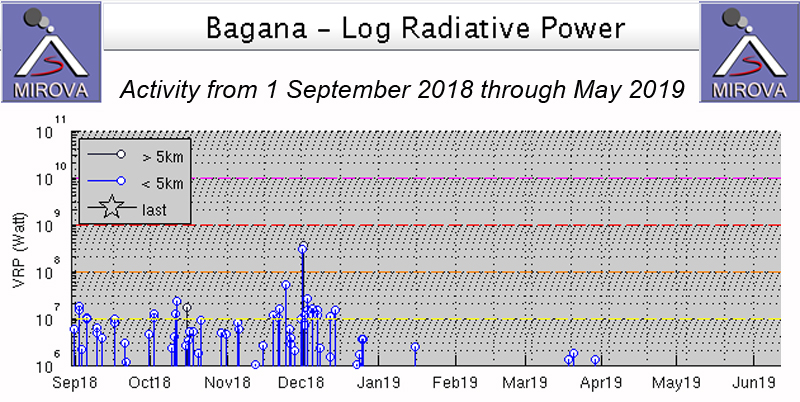 |
Figure 25. The MIROVA plot of radiative power at Bagana from 1 September 2018 through May 2019 shows a marked decline in thermal activity during December 2018 after ash explosions and satellite observations of flows during the previous months. Courtesy of MIROVA. |
The last ash emission at Bagana was reported on 1 December 2018 by the Darwin Volcanic Ash Advisory Center (VAAC). A Sentinel-2 satellite image showed a linear thermal anomaly trending NW from the summit on 14 December (BGVN 50:01). On 8 January 2019, an image contained a dense steam plume drifting E and a very faint thermal anomaly on the N flank a few hundred meters from the summit. A more distinct thermal anomaly at the summit appeared on 22 February 2019 (figure 26). A visitor to the region photographed incandescence on the flank, likely from the volcano, at dawn around 19 February 2019 (figure 27).
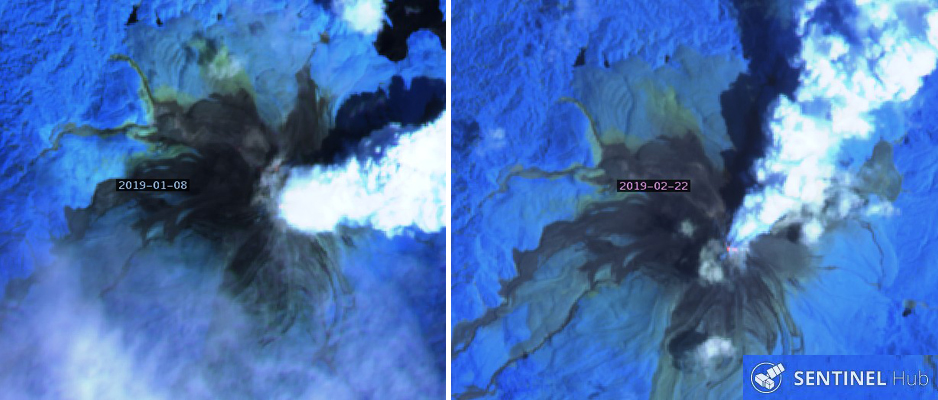 |
Figure 26. Sentinel-2 satellite imagery revealed thermal anomalies at Bagana in January and February 2019. Left: a very faint thermal anomaly was N of the summit at the edge of the E-drifting steam plume on 8 January 2019. Right: A thermal anomaly was located at the summit, at the base of the NE-drifting steam plume on 22 February 2019. Sentinel-2 satellite images with "Atmospheric Penetration" rendering (bands 12, 11, 8A). Courtesy of Sentinel Hub Playground. |
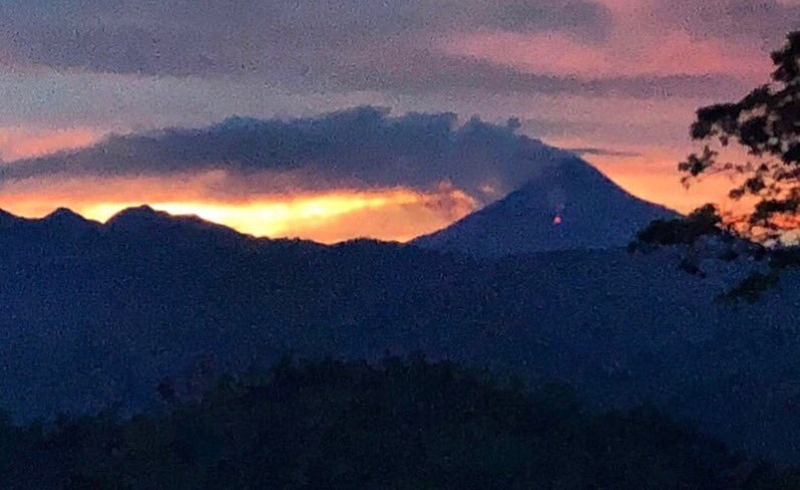 |
Figure 27. A visitor near Bagana spotted incandescence on the flank at dawn, possibly from a lava flow. Posted online 19 February 2019. Courtesy of Emily Stanford. |
Two faint thermal anomalies were visible at the summit in satellite imagery on 19 March; a single one appeared on 29 March 2019 (figure 28). No thermal anomalies were recorded in Sentinel-2 images during April or May, but steam plumes and gas emissions were visible through cloud cover on multiple occasions (figure 29).
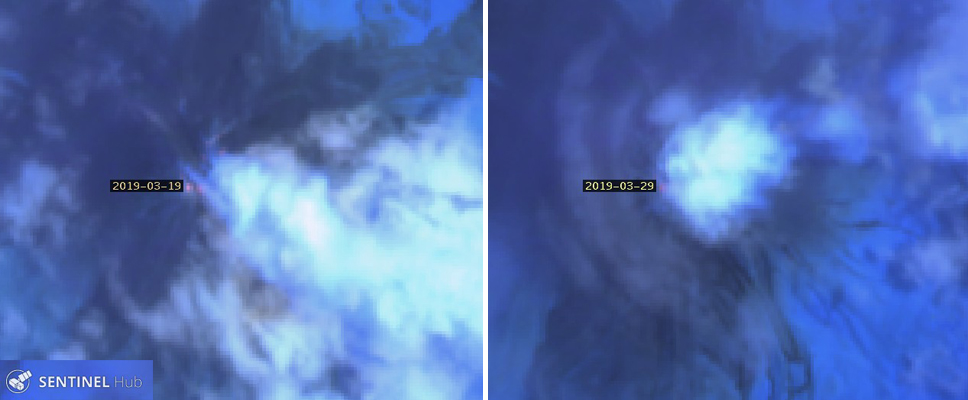 |
Figure 28. Faint thermal anomalies at Bagana were recorded in satellite imagery twice during March 2019. Left: 19 March, two anomalies appear right of the date label. Right: 29 March, a small anomaly appears right of the date label. Sentinel-2 image rendered with "Atmospheric Penetration" (bands 12, 11, 8A). Courtesy of Sentinel Hub Playground. |
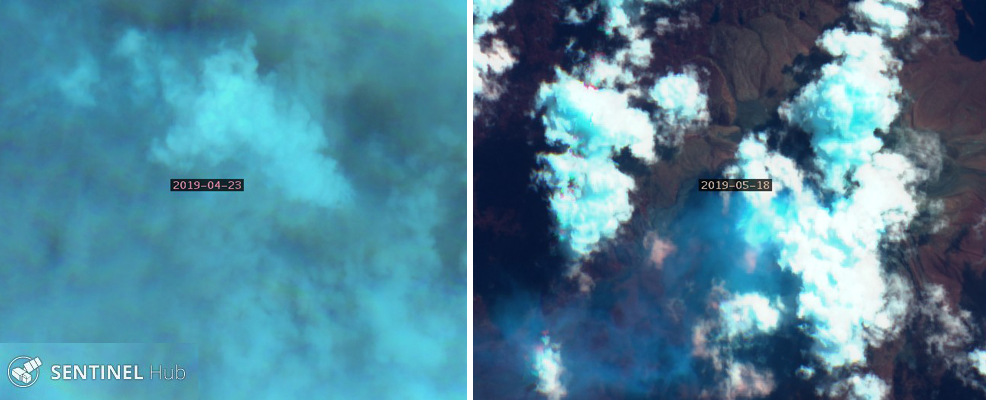 |
Figure 29. Steam and gas emissions at Bagana were recorded in satellite imagery during April and May 2019. Left: A steam plume drifted NW from the summit on 23 April, visible through dense cloud cover. Right: A gas plume drifted SW from the summit on 18 May. Sentinel-2 image with "Geology" rendering (bands 12, 4, 2). Courtesy of Sentinel Hub Playground. |
Information Contacts: MIROVA (Middle InfraRed Observation of Volcanic Activity), a collaborative project between the Universities of Turin and Florence (Italy) supported by the Centre for Volcanic Risk of the Italian Civil Protection Department (URL: http://www.mirovaweb.it/); Darwin Volcanic Ash Advisory Centre (VAAC), Bureau of Meteorology, Northern Territory Regional Office, PO Box 40050, Casuarina, NT 0811, Australia (URL: http://www.bom.gov.au/info/vaac/); Sentinel Hub Playground (URL: https://www.sentinel-hub.com/explore/sentinel-playground); Emily Stanford (Twitter: https://twitter.com/NerdyBatLady, image posted at https://twitter.com/NerdyBatLady/status/1098052063009792001/photo/1).
Intermittent gas-and-steam emissions and thermal anomalies during June-November 2019
Bagana volcano is found in a remote portion of central Bougainville Island in Papua New Guinea. The most recent eruptive phase that began in early 2000 has produced ash plumes and thermal anomalies (BGVN 44:06, 50:01). Activity has remained low between January-July 2019 with rare thermal anomalies and occasional steam plumes. This reporting period updates information for June-November 2019 and includes thermal anomalies and intermittent gas-and-steam emissions. Thermal data and satellite imagery are the primary sources of information for this report.
MIROVA (Middle InfraRed Observation of Volcanic Activity) analysis of MODIS satellite data showed an increased number of thermal anomalies within 5 km from the summit beginning in late July-early August (figure 30). Two Sentinel-2 thermal satellite images showed faint, roughly linear thermal anomalies, indicative of lava flows trending EW and NS on 7 July 2019 and 6 August, respectively (figure 31). Weak thermal hotspots were briefly detected in late September-early October after a short hiatus in September. No thermal anomalies were recorded in Sentinel-2 past August due to cloud cover; however, gas-and-steam emissions were visible on 7 July and in September (figures 31, 32, and 33).
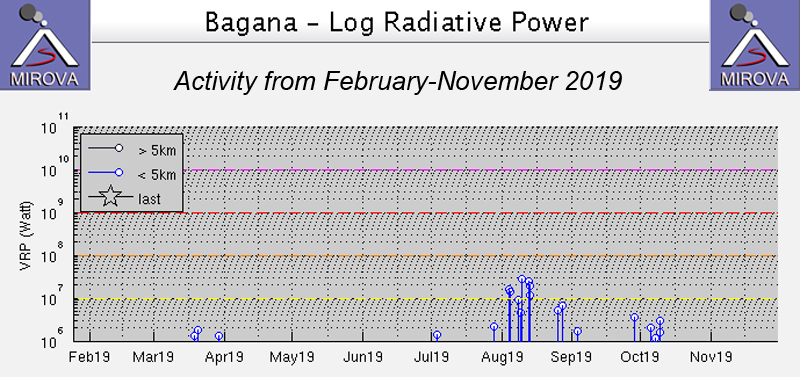 |
Figure 30. Thermal anomalies near the crater summit at Bagana during February-November 2019 as recorded by the MIROVA system (Log Radiative Power) increased in frequency and power in early August. A small cluster was detected in early October after a brief pause in activity in early September. Courtesy of MIROVA. |
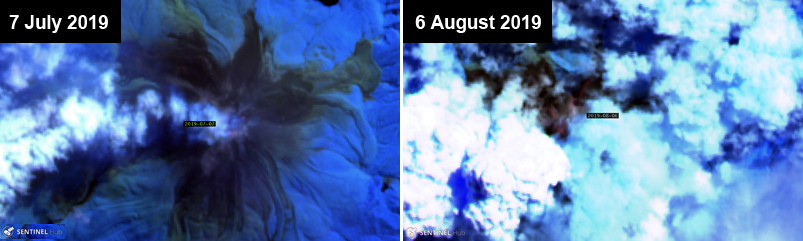 |
Figure 31. Sentinel-2 thermal satellite imagery showing small thermal anomalies at Bagana between July-August 2019. Left: A very faint thermal anomaly and a gas-and-steam plume is seen on 7 July 2019. Right: Two small thermal anomalies are faintly seen on 6 August 2019. Both Sentinel-2 satellite images with "Atmospheric penetration" (bands 12, 11, 8A) rendering; courtesy of Sentinel Hub Playground. |
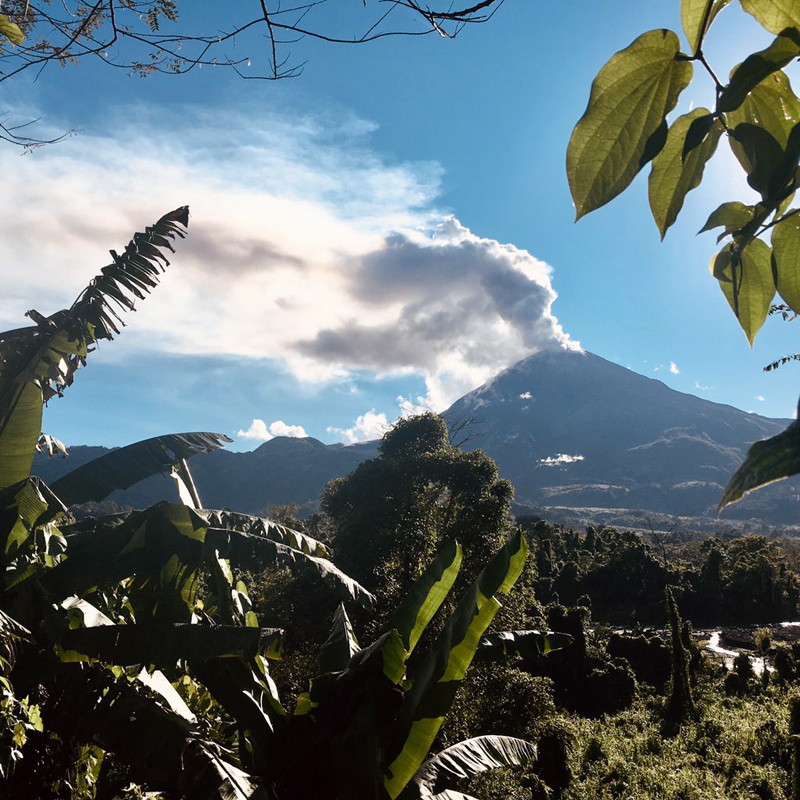 |
Figure 32. A gas-and-steam plume rising from the summit of Bagana on 18 September 2019. Courtesy of Brendan McCormick Kilbride (University of Manchester). |
The Deep Carbon Observatory (DCO) scientific team partnered with the Rabaul Volcano Observatory and the Bougainville Disaster Office to observe activity at Bagana and collect gas data using drone technology during two weeks of field work in mid-September 2019. For this field work, the major focus was to understand the composition of the volcanic gas emitted at Bagana and measure the concentration of these gases. Since Bagana is remote and difficult to climb, research about its gas emissions has been limited. The recent advancements in drone technology has allowed for new data collection at the summit of Bagana (figure 33). Most of the emissions consisted of water vapor, according to Brendan McCormick Kilbride, one of the volcanologists on this trip. During 14-19 September there was consistently a strong gas-and-steam plume from Bagana (figure 34).
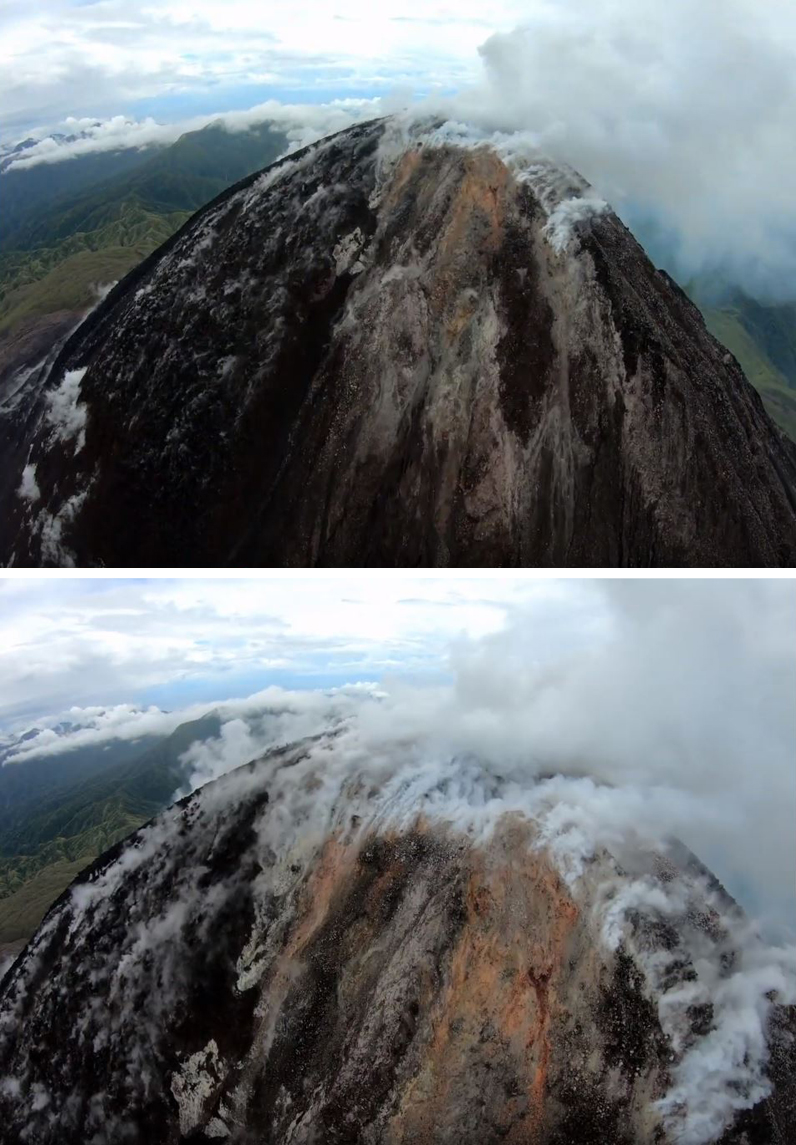 |
Figure 33. Degassing plumes seen from drone footage 100 m above the summit of Bagana on 18 September 2019. Top: Zoomed out view of the summit of Bagana degassing. Bottom: Closer perspective of the gases emitted from Bagana. Courtesy of Kieran Wood (University of Bristol) and the Bristol Flight Laboratory. |
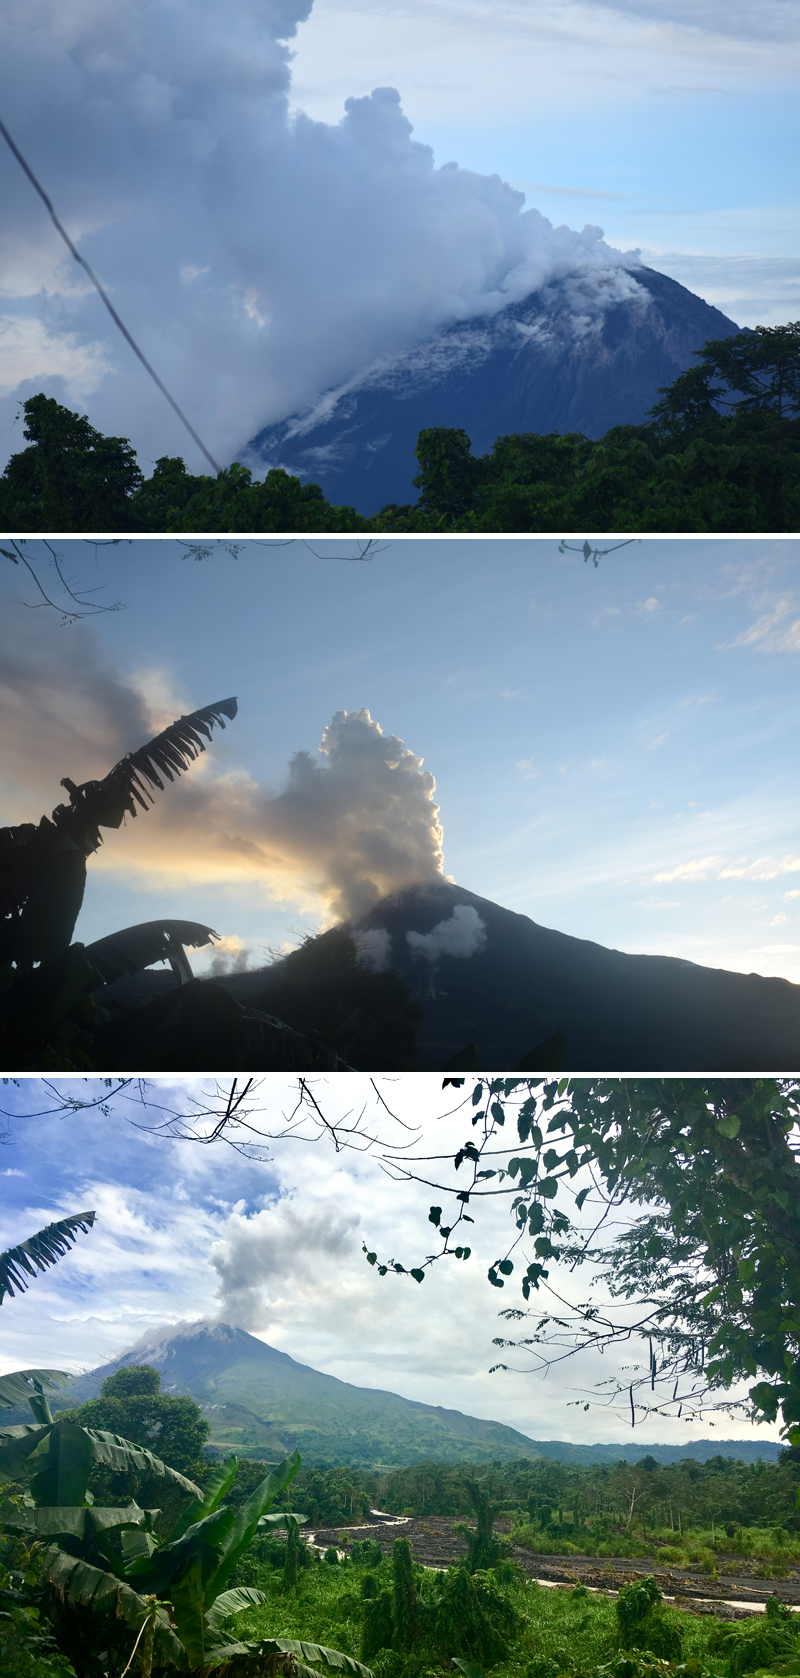 |
Figure 34. Photos of gas-and-steam plumes rising from Bagana between 14-19 September 2019. Courtesy of Brendan McCormick Kilbride (University of Manchester). |
Information Contacts: MIROVA (Middle InfraRed Observation of Volcanic Activity), a collaborative project between the Universities of Turin and Florence (Italy) supported by the Centre for Volcanic Risk of the Italian Civil Protection Department (URL: http://www.mirovaweb.it/); Sentinel Hub Playground (URL: https://www.sentinel-hub.com/explore/sentinel-playground); Brendan McCormick Kilbride, University of Manchester, Manchester M13 9PL, United Kingdom (URL: https://www.research.manchester.ac.uk/portal/brendan.mccormickkilbride.html, Twitter: https://twitter.com/BrendanVolc); Kieran Wood, University of Bristol, Bristol BS8 1QU, United Kingdom (URL: http://www.bristol.ac.uk/engineering/people/kieran-t-wood/index.html, Twitter: https://twitter.com/DrKieranWood, video posted at https://www.youtube.com/watch?v=A7Hx645v0eU); University of Bristol Flight Laboratory, Bristol BS8 1QU, United Kingdom (Twitter: https://twitter.com/UOBFlightLab).
Ash plumes during 29 February-2 March and 1 May 2020
Bagana lies in a nearly inaccessible mountainous tropical rainforest area of Bougainville Island in Papua New Guinea and is primarily monitored by satellite imagery of ash plumes and thermal anomalies. After a state of elevated activity that lasted through December 2018 (BGVN 43:05, 44:06, 44:12), the volcano entered a quieter period that persisted through at least May 2020. This report focuses on activity between December 2019 and May 2020.
Atmospheric clouds often obscured satellite views of the volcano during the reporting period. When the volcano could be observed, light-colored gas plumes were often observed (figure 35). Based on satellite and wind model data, the Darwin Volcanic Ash Advisory Centre (VAAC) reported that during 29 February-2 March ash plumes rose to an altitude of 1.8-2.1 km and drifted SW and N. On 1 May an ash plume rose to an altitude of 3 km and drifted NW and W. According to both Darwin VAAC volcanic ash advisories, the Aviation Color Code was Orange (second highest of four hazard levels).
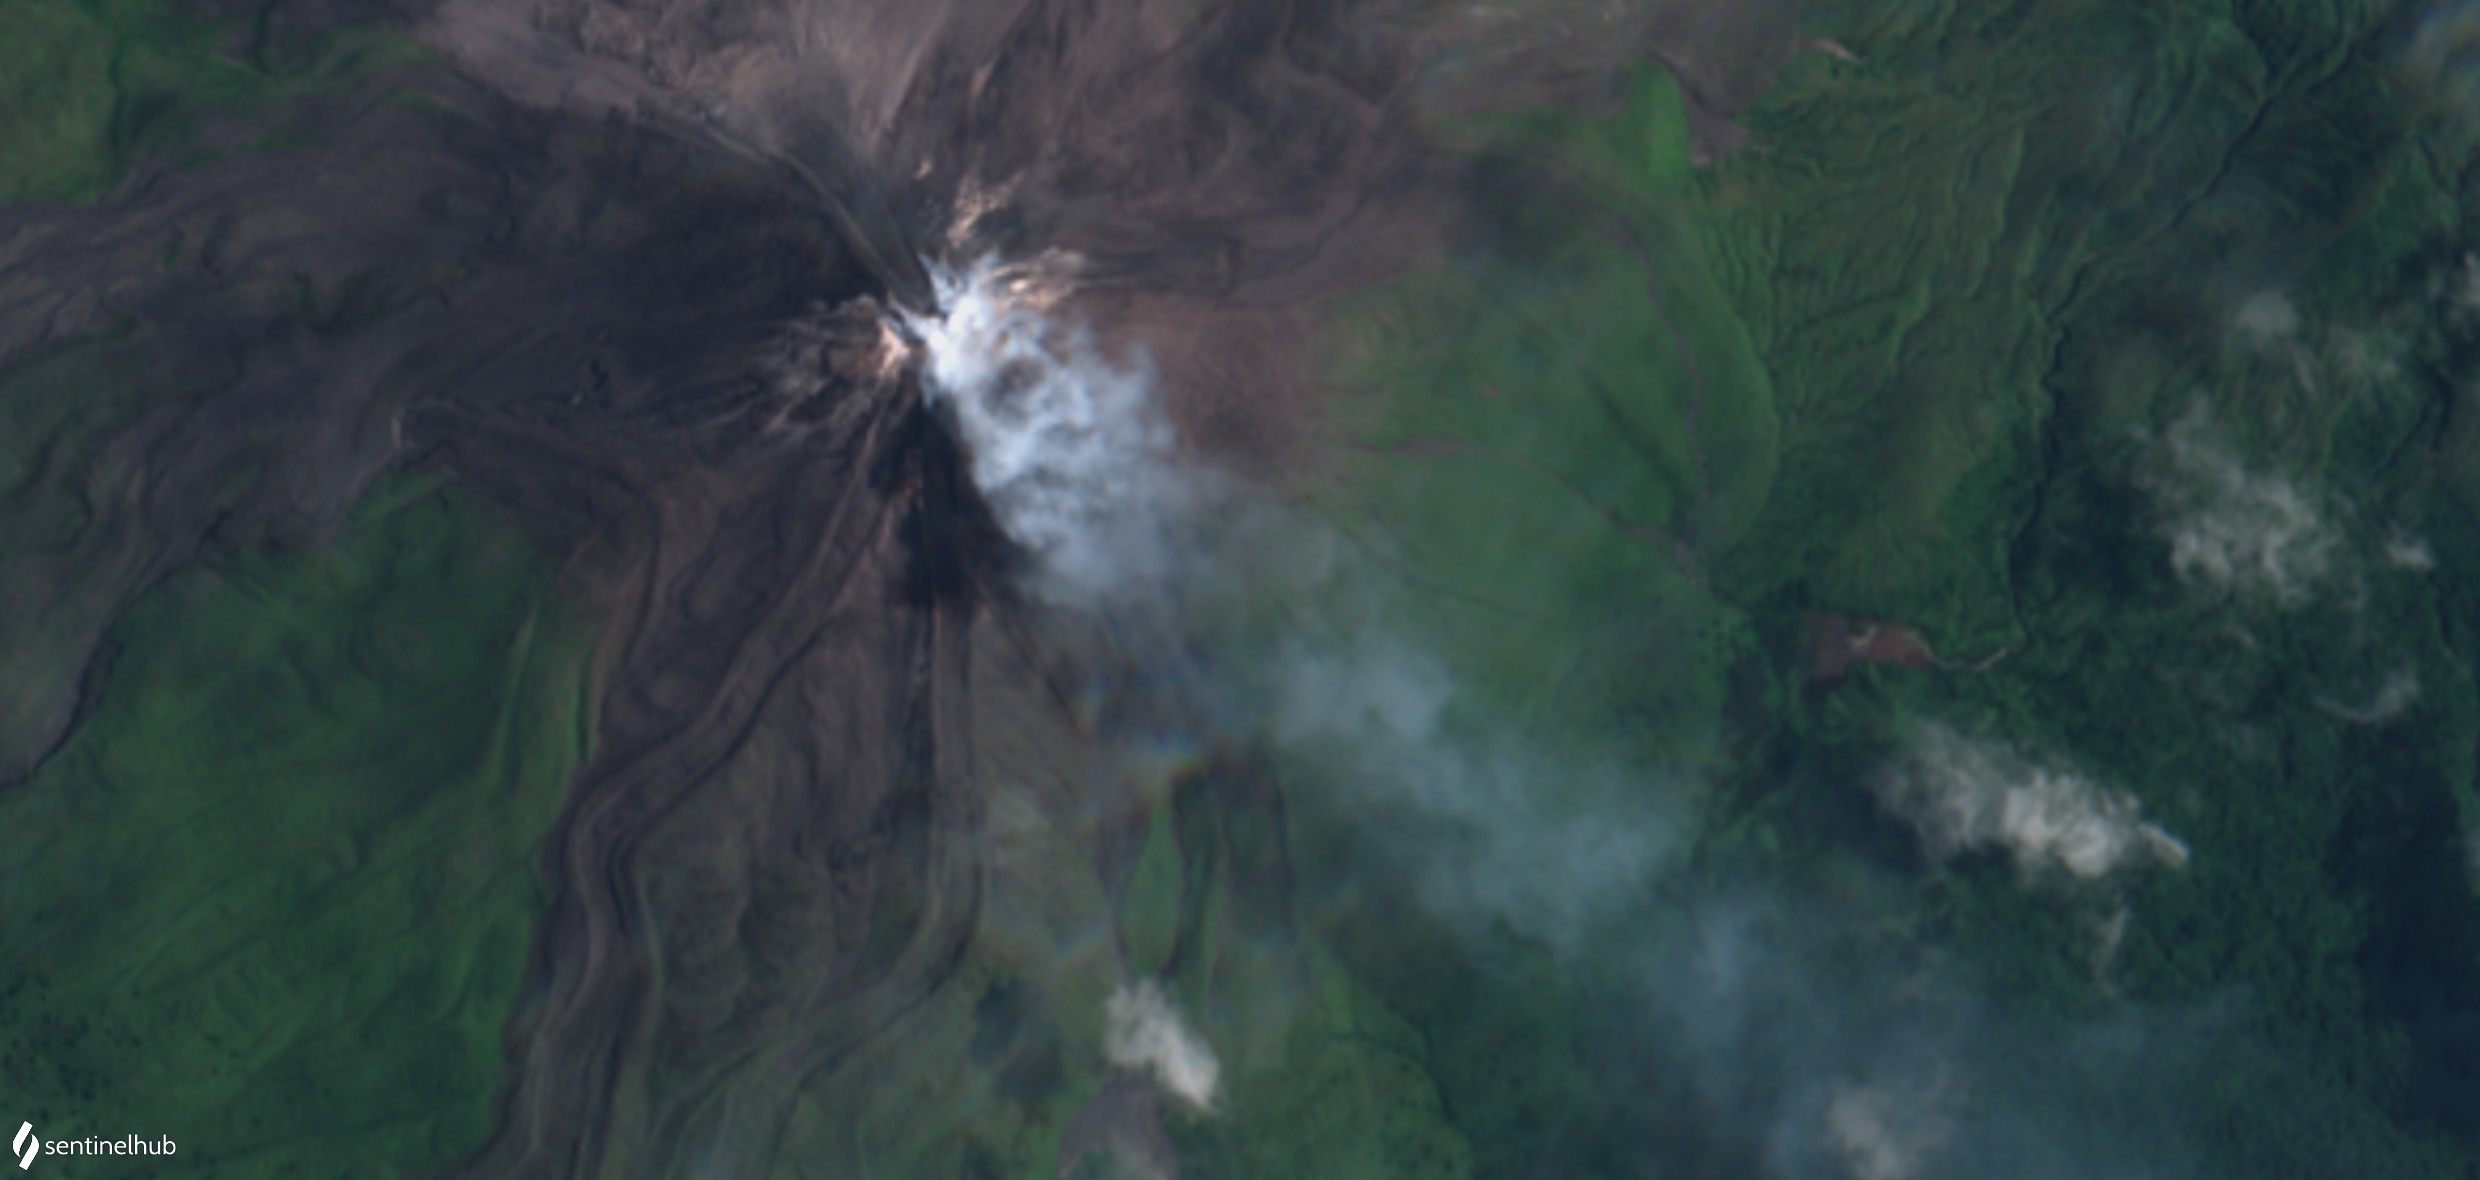 |
Figure 35. Sentinel-2 image of Bagana, showing a gas plume drifting SE on 13 March 2020, during a period when the Darwin VAAC had not reported any ash explosions (Natural Color rendering, bands 4, 3, 2). Courtesy of Sentinel Hub Playground. |
During the reporting period, the MIROVA (Middle InfraRed Observation of Volcanic Activity) volcano hotspot detection system recorded only intermittent thermal anomalies, all of which were of low radiative power. Sulfur dioxide emissions detected by satellite-based instruments over this reporting period were at low levels.
Information Contacts: Darwin Volcanic Ash Advisory Centre (VAAC), Bureau of Meteorology, Northern Territory Regional Office, PO Box 40050, Casuarina, NT 0811, Australia (URL: http://www.bom.gov.au/info/vaac/); Sentinel Hub Playground (URL: https://www.sentinel-hub.com/explore/sentinel-playground); MIROVA (Middle InfraRed Observation of Volcanic Activity), a collaborative project between the Universities of Turin and Florence (Italy) supported by the Centre for Volcanic Risk of the Italian Civil Protection Department (URL: http://www.mirovaweb.it/); Global Sulfur Dioxide Monitoring Page, Atmospheric Chemistry and Dynamics Laboratory, NASA Goddard Space Flight Center (NASA/GSFC), 8800 Greenbelt Road, Goddard, Maryland, USA (URL: https://so2.gsfc.nasa.gov/).
Ongoing thermal anomalies possibly indicating lava flows during May-December 2020
Bagana is a remote volcano located in central Bougainville Island in Papua New Guinea with eruptions dating back to 1842. The current eruption period began in February 2000, with more recent activity characterized by thermal anomalies along with gas-and-steam and ash plumes (BGVN 44:12 and 45:07). Typical activity consists of episodes of lava flows and intermittent strong passive degassing, especially sulfur dioxide. This report covers activity from May-December 2020 using primarily thermal data and satellite imagery.
MIROVA (Middle InfraRed Observation of Volcanic Activity) analysis of MODIS satellite data showed a cluster of intermittent low-power thermal anomalies during June through early August, followed by a period of quiescence during August to mid-October, with the exception of two anomalies detected in early September (figure 36). Thermal activity slightly increased again by mid-October and continued infrequently through December at low levels. This pattern of thermal activity is also reflected in three Sentinel-2 thermal satellite images that showed faint, roughly linear, thermal anomalies, indicative of lava flows trending NE and NW on 21 June, NE on 1 July, and W on 23 November (figure 37). On clear weather days, gas-and-steam emissions could be seen in satellite imagery on 30 August, 4 October, and 23 November, each of which drifted W (figure 37). Gas-and-steam emissions on 13 December drifted E.
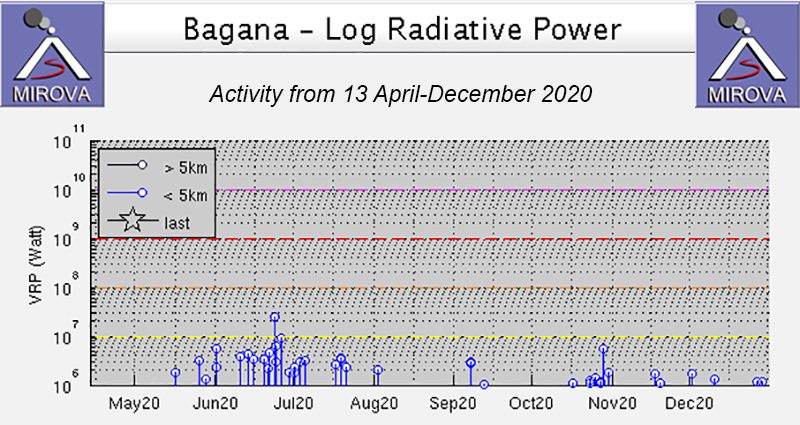 |
Figure 36. Intermittent low-power thermal anomalies were detected at Bagana during late May-December 2020 as recorded by the MIROVA system (Log Radiative Power). Relatively higher power and frequency anomalies were detected during June-early August. Thermal activity declined after early August into mid-October, with the exception of two thermal anomalies in early September. Activity increased again slightly by mid-October and continued through December, but at a lower power and frequency. Courtesy of MIROVA. |
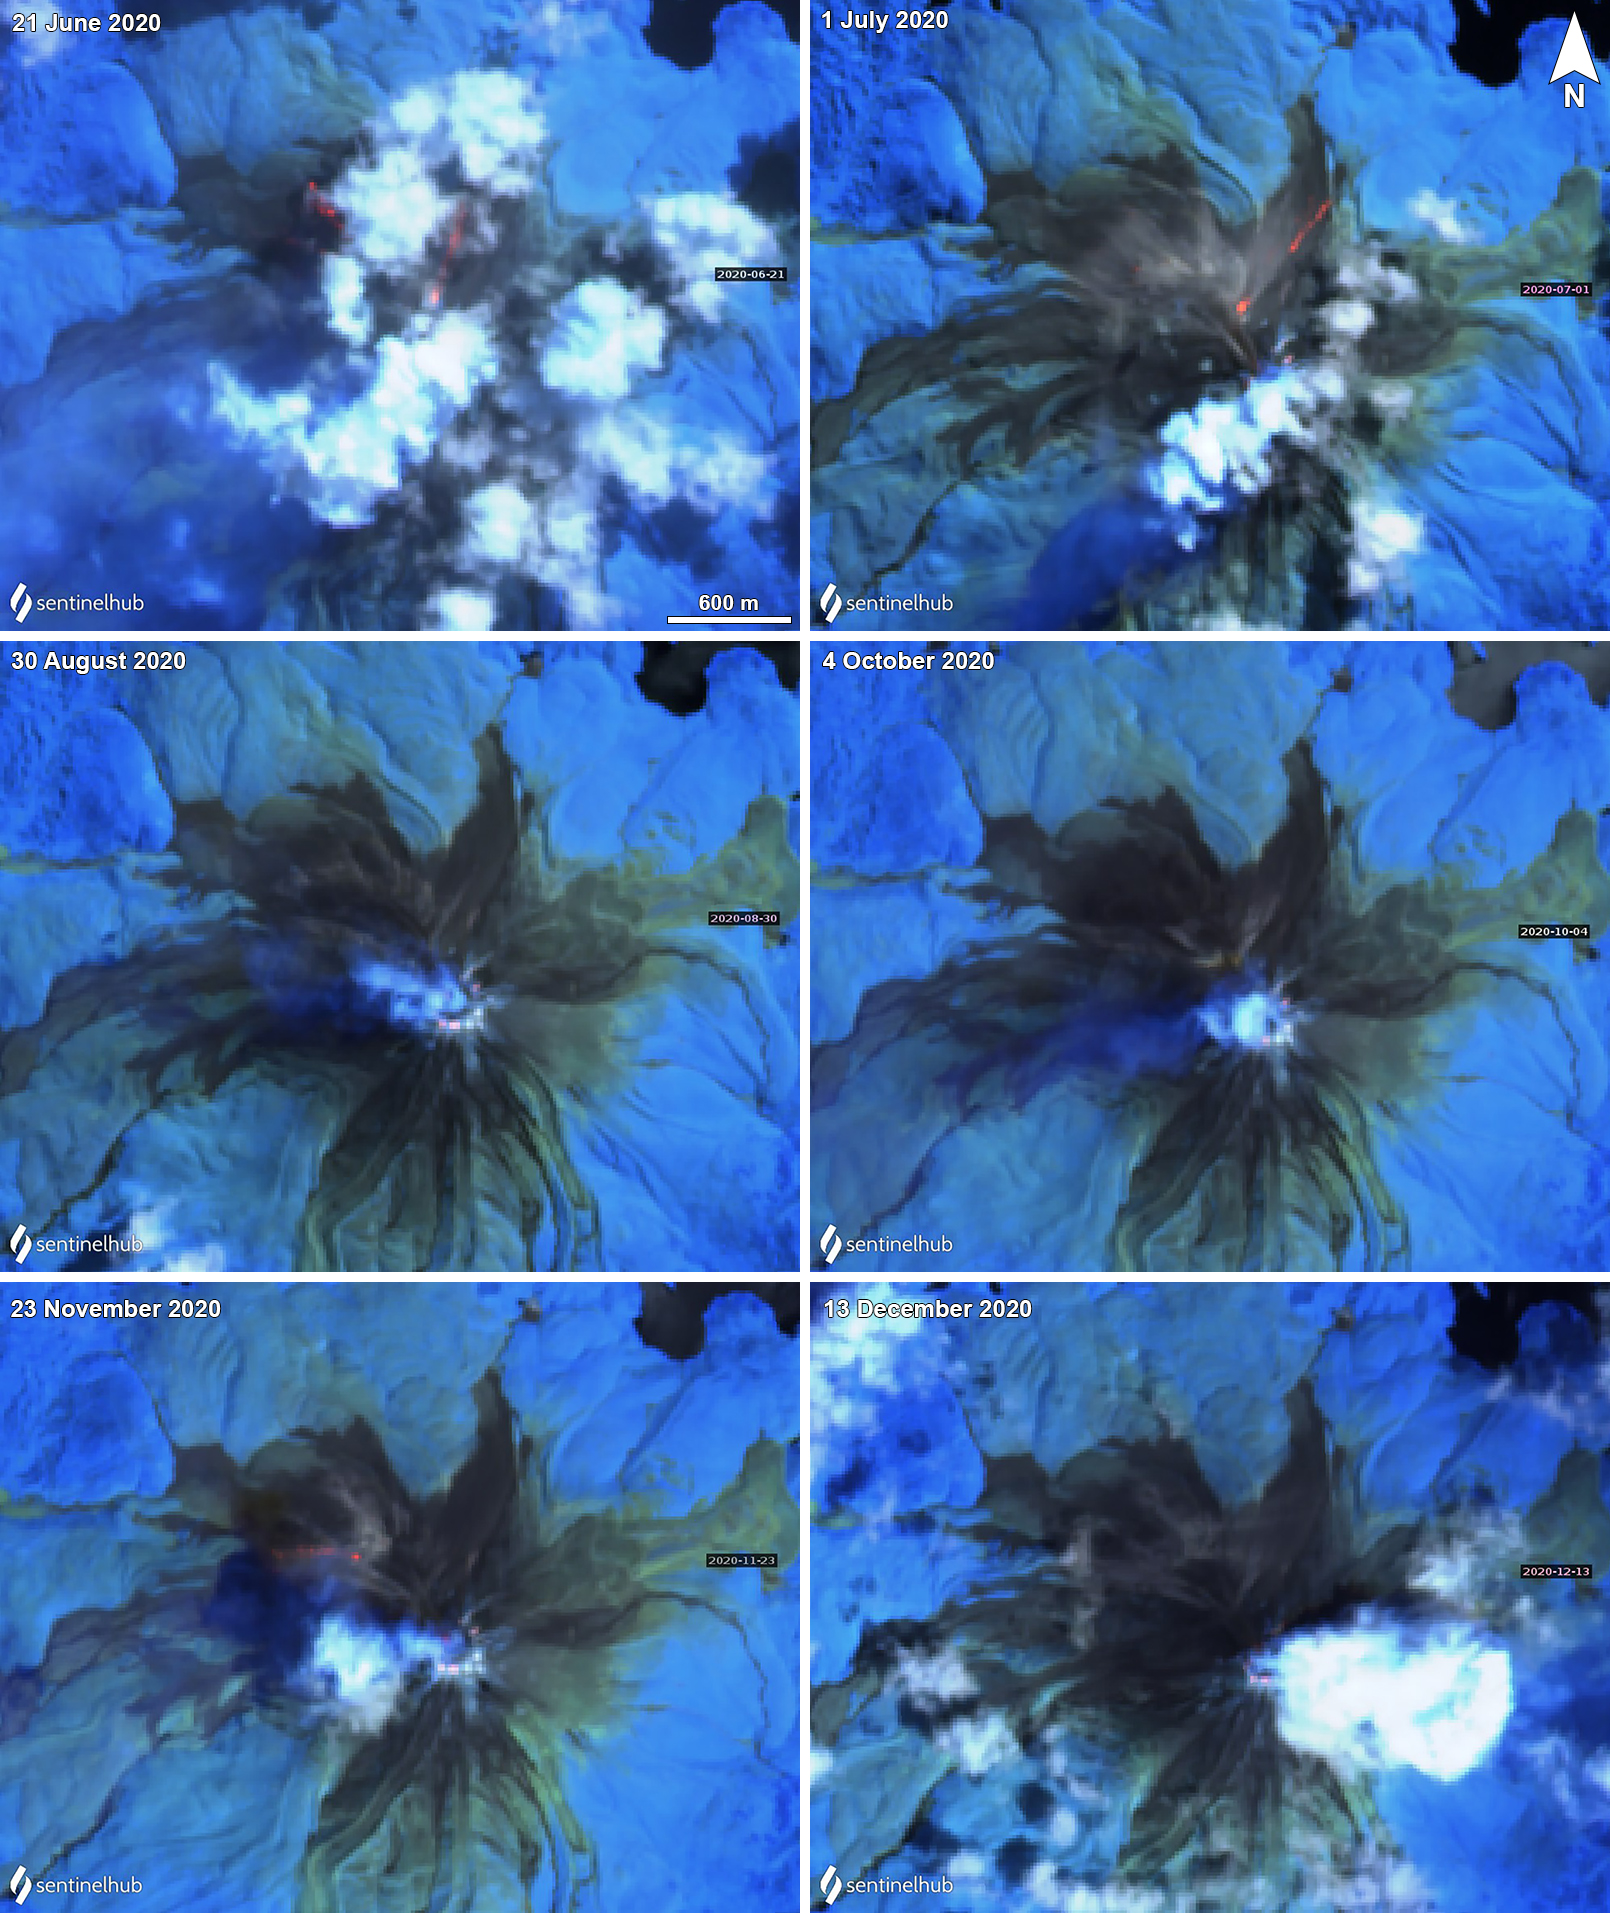 |
Figure 37. Sentinel-2 thermal satellite imagery showing weak thermal anomalies at Bagana during June through December 2020. Top left: Faint, linear thermal anomalies on 21 June 2020 on the NE and NW flanks, which could represent lava effusion, though clouds covered much of the area. Top right: Hot material traveling down the NE flank on 1 July 2020. Middle left and right: Gas-and-steam emissions rising from the summit crater and drifting W on 30 August and 4 October 2020; very faint thermal anomalies can be observed in the crater. Bottom left: Gas-and-steam emissions in the summit crater drifted W on 23 November 2020, and a probable lava flow is visible extending down the NW flank. Bottom right: Gas-and-steam emissions rose above the summit crater on 13 December 2020 and drifted E. Sentinel-2 images with "Atmospheric penetration" (bands 12, 11, 8A) rendering. Courtesy of Sentinel Hub Playground. |
Information Contacts: MIROVA (Middle InfraRed Observation of Volcanic Activity), a collaborative project between the Universities of Turin and Florence (Italy) supported by the Centre for Volcanic Risk of the Italian Civil Protection Department (URL: http://www.mirovaweb.it/); Sentinel Hub Playground (URL: https://www.sentinel-hub.com/explore/sentinel-playground).
Intermittent thermal anomalies continue and a possible lava flow during March 2021
Bagana, located in central Bougainville Island in Papua New Guinea, is a remote volcano that has had historical eruptions dating back to 1842. The current eruption period began in February 2000 and has more recently consisted of ongoing thermal anomalies, possible lava flows, and gas-and-steam emissions (BGVN 46:01). This report updates information from January through August 2021 and describes continuing thermal anomalies, lava flows, ash emissions, and sulfur dioxide emissions using information from the Darwin Volcanic Ash Advisory Center (VAAC) and various satellite data.
MIROVA (Middle InfraRed Observation of Volcanic Activity) analysis of MODIS satellite data showed intermittent low-power thermal anomalies during January through August (figure 38). During late February the power of the thermal anomalies gradually increased and remained high during most of March due to possible lava flows that were present near the summit crater. This activity gradually decreased in power during April and remained low until early June, though these anomalies were still lower in power compared to those in March. The intensity of the thermal anomalies gradually increased throughout August. According to the MODVOLC thermal algorithm, a total of eight thermal alerts were detected near the summit area on 9 March (2), 11 March (1), 13 March (1), 16 March (1), 30 March (1), 1 April (1), and 6 June (1) 2021. These thermal alerts, as well as those that were higher in power according to the MIROVA graph, were detected by Sentinel-2 infrared satellite imagery, though cloud cover often prevented a clear view of the summit (figure 39). A strong anomaly was initially detected on 26 February in the summit crater, and by 13 March incandescent material was visible the N flank. Thermal activity suggesting a lava flow extended down the N flank on 23 March. Distinct sulfur dioxide plumes accompanied the stronger thermal anomalies, based on data from the TROPOMI instrument on the Sentinel-5P satellite (figure 40).
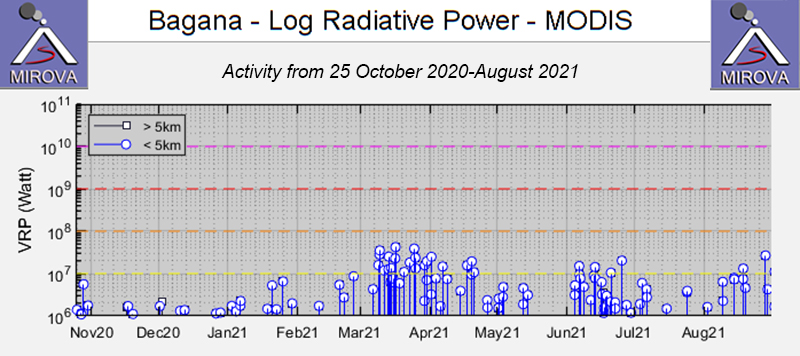 |
Figure 38. Intermittent low- to moderate- thermal anomalies detected at Bagana during January through August 2021 as recorded by the MIROVA system (Log Radiative Power). During late February the power of the anomalies gradually increased and remained high during March due to the incandescent material detected near the summit crater. In April the anomalies decreased again in power and remained low until another brief increase occurred in early June and late August. Courtesy of MIROVA. |
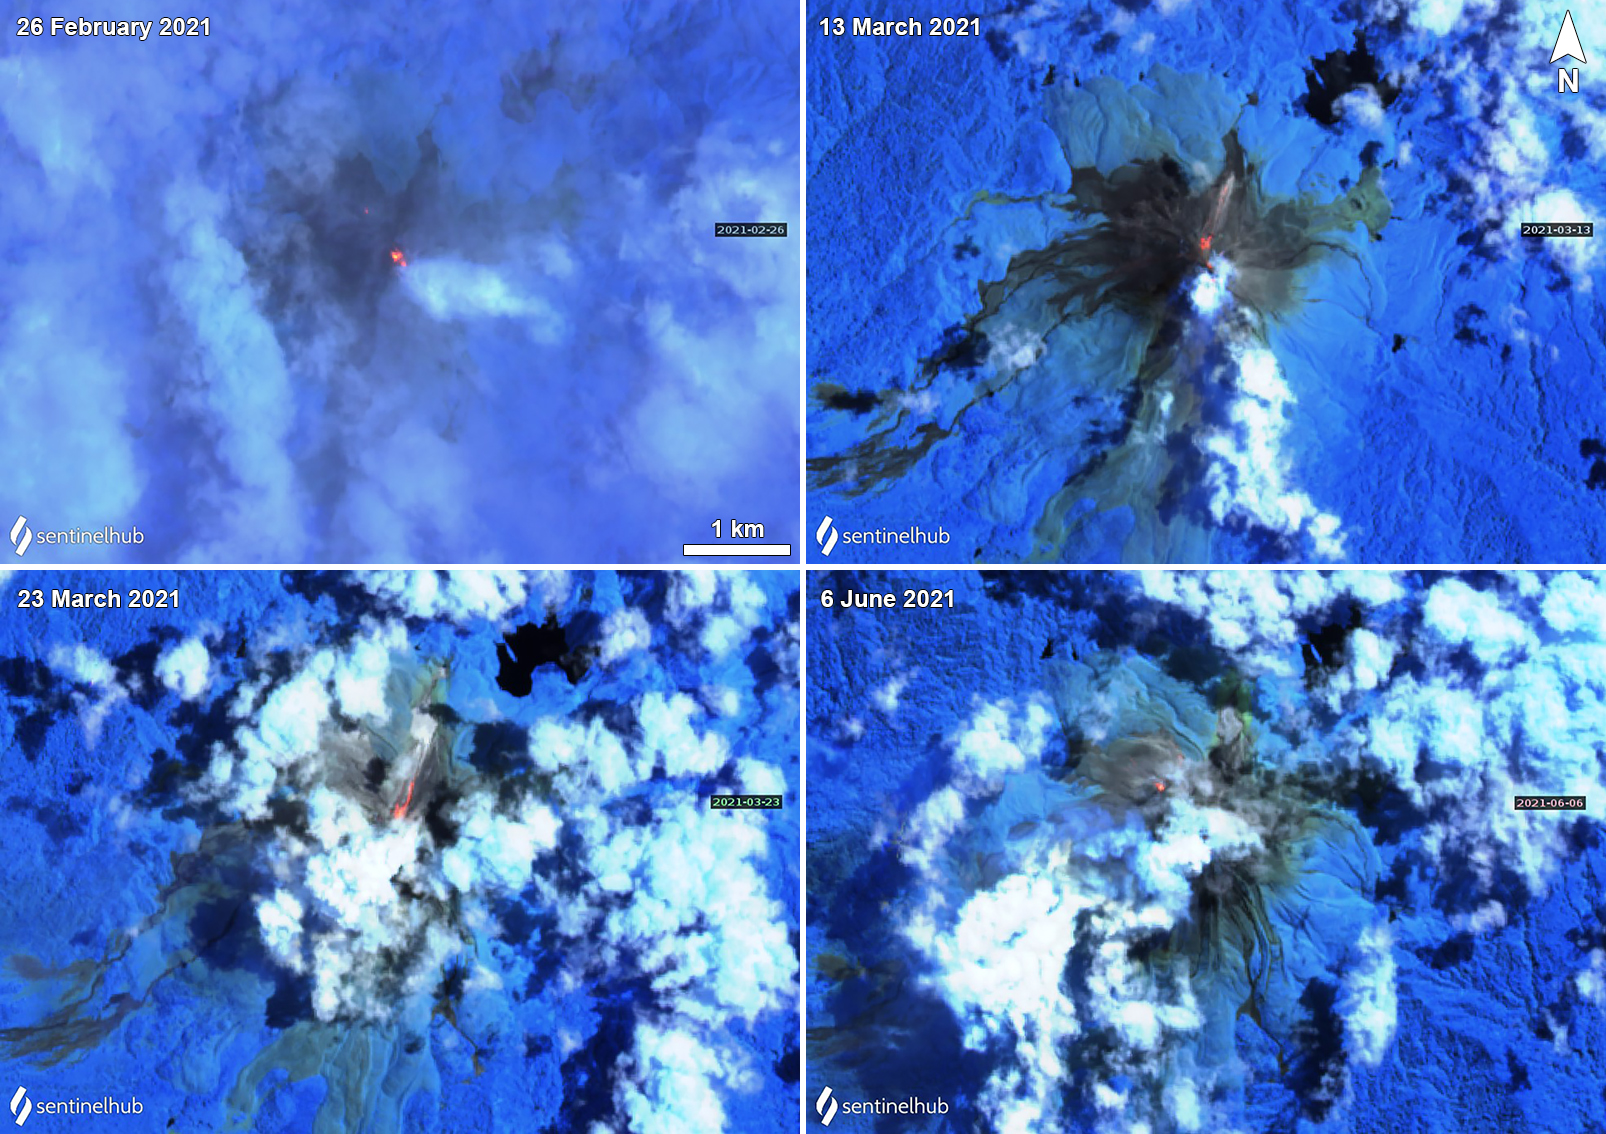 |
Figure 39. Sentinel-2 infrared satellite images showing a persistent thermal anomaly in the summit crater of Bagana on 26 February (top left), 13 March (top right), 23 March (bottom left), and 6 June (bottom right) 2021. On 13 March incandescent material was visible on the N flank, which by 23 March appeared to be a lava flow. Sentinel-2 images with "Atmospheric penetration" (bands 12, 11, 8A) rendering. Courtesy of Sentinel Hub Playground. |
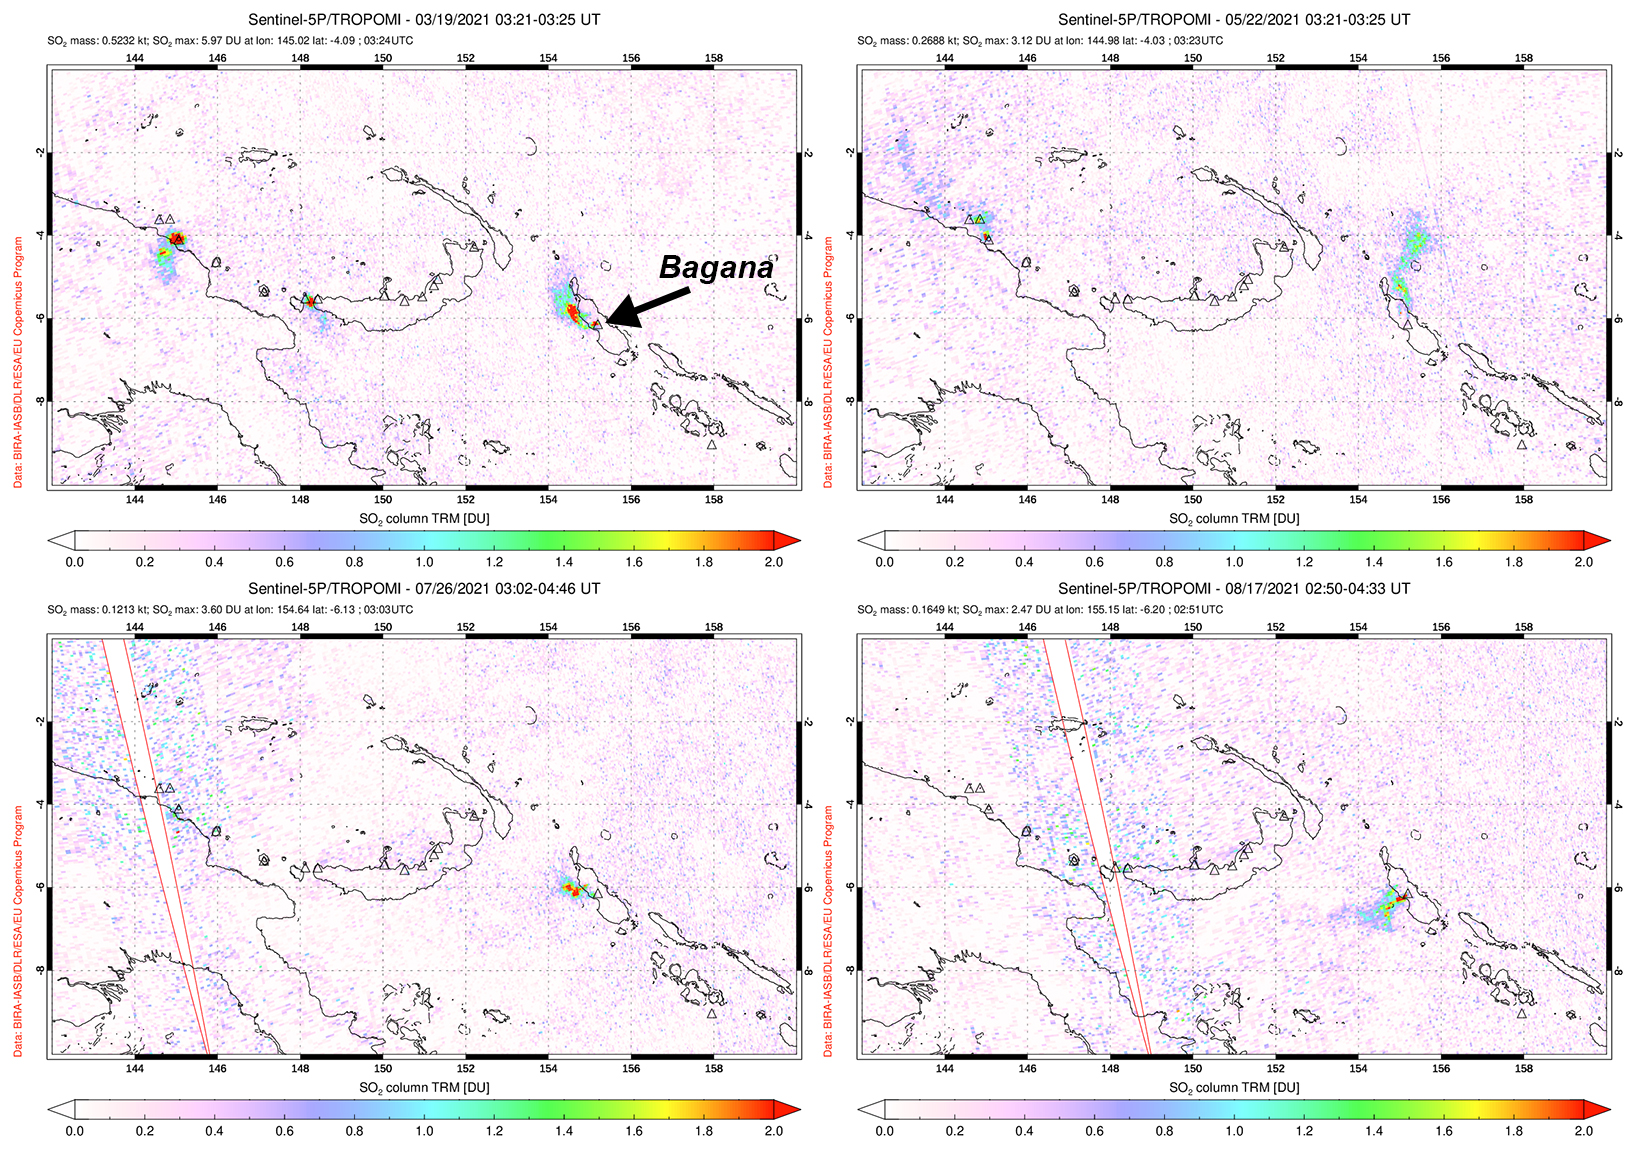 |
Figure 40. Distinct sulfur dioxide plumes were detected from Bagana on 19 March (top left), 22 May (top right), 26 July (bottom left), and 17 August (bottom right) 2021. Some of these plumes exceeded 2 Dobson Units (DUs) and drifted in different directions. Data is from the TROPOMI instrument on the Sentinel-5P satellite. Courtesy of NASA Global Sulfur Dioxide Monitoring Page. |
Ash emissions reported by the Darwin VAAC on 10 March rose to 2.4 km altitude and drifted NW, based on HIMAWARI-8 satellite images. On 14 June the ash plume rose to 2.1 km altitude and drifted W. Another ash plume on 9 July rose to 1.8 km altitude and drifted W. A Darwin VAAC report issued on 31 July described an ash plume that rose to a maximum altitude of 4.6 km and drifted W, followed by gas-and-steam emissions; however, this was not clearly visible due to the weather.
Information Contacts: Darwin Volcanic Ash Advisory Centre (VAAC), Bureau of Meteorology, Northern Territory Regional Office, PO Box 40050, Casuarina, NT 0811, Australia (URL: http://www.bom.gov.au/info/vaac/); MIROVA (Middle InfraRed Observation of Volcanic Activity), a collaborative project between the Universities of Turin and Florence (Italy) supported by the Centre for Volcanic Risk of the Italian Civil Protection Department (URL: http://www.mirovaweb.it/); Hawai'i Institute of Geophysics and Planetology (HIGP) - MODVOLC Thermal Alerts System, School of Ocean and Earth Science and Technology (SOEST), Univ. of Hawai'i, 2525 Correa Road, Honolulu, HI 96822, USA (URL: http://modis.higp.hawaii.edu/); NASA Global Sulfur Dioxide Monitoring Page, Atmospheric Chemistry and Dynamics Laboratory, NASA Goddard Space Flight Center (NASA/GSFC), 8800 Greenbelt Road, Goddard, Maryland, USA (URL: https://so2.gsfc.nasa.gov/); Sentinel Hub Playground (URL: https://www.sentinel-hub.com/explore/sentinel-playground).
Ash plumes and thermal activity with possible lava flows during September 2021-August 2022
Bagana is a remote volcano that has had historical eruptions dating back to 1842 and is located in central Bougainville Island in Papua New Guinea. Frequent eruptive activity is characterized by non-explosive lava effusions that maintain a small lava dome in the summit crater. Occasional explosive activity has occurred, which has produced pyroclastic flows. The current eruption period began in February 2000 and has consisted of ongoing thermal anomalies, possible lava flows, and gas-and-ash emissions (BGVN 46:09). This report covers activity during September 2021 through August 2022 based on information from the Darwin Volcanic Ash Advisory Center (VAAC) and various satellite data.
Thermal activity of variable intensity persisted throughout the reporting period, based on satellite data. MIROVA reported consistent thermal anomalies throughout the reporting period (figure 41) based upon Sentinel-2 MODIS Thermal Volcanic Activity. According to the MODVOLC thermal algorithm, a total of 13 thermal anomalies were detected on 1, 19, and 24 September 2021, 12 and 17 October, 11 November, 24, 25, and 29 April 2022, and 2, 13, and 22 May. Some of this thermal activity was reflected in Sentinel-2 infrared satellite images, which showed summit crater incandescence, as well as incandescent material, possibly from cooling lava flows, occasionally descending the NW flank, such as on 24 September 2021, 8 November, 23 December, 1 and 6 February 2022, 12 and 22 May, and 6 July (figure 42). Occasional gas-and-steam emissions were visible in satellite images (figure 43). Distinct sulfur dioxide plumes were relatively frequent throughout the reporting period. The column abundances, as measured by the TROPOMI instrument on the Sentinel-5P satellite, often exceeded two Dobson Units (DUs) (figure 44), and the plumes drifted in different directions.
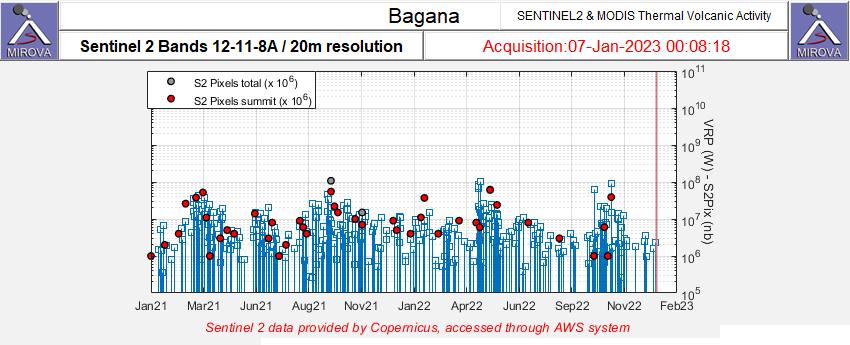 |
Figure 41. Frequent and consistent thermal anomalies (red dots) were detected at Bagana during September 2021 through August 2022 as recorded by the Sentinel-2 MODIS Thermal Volcanic Activity data (bands 12, 11, 8A). The strength of these anomalies varied. Courtesy of MIROVA. |
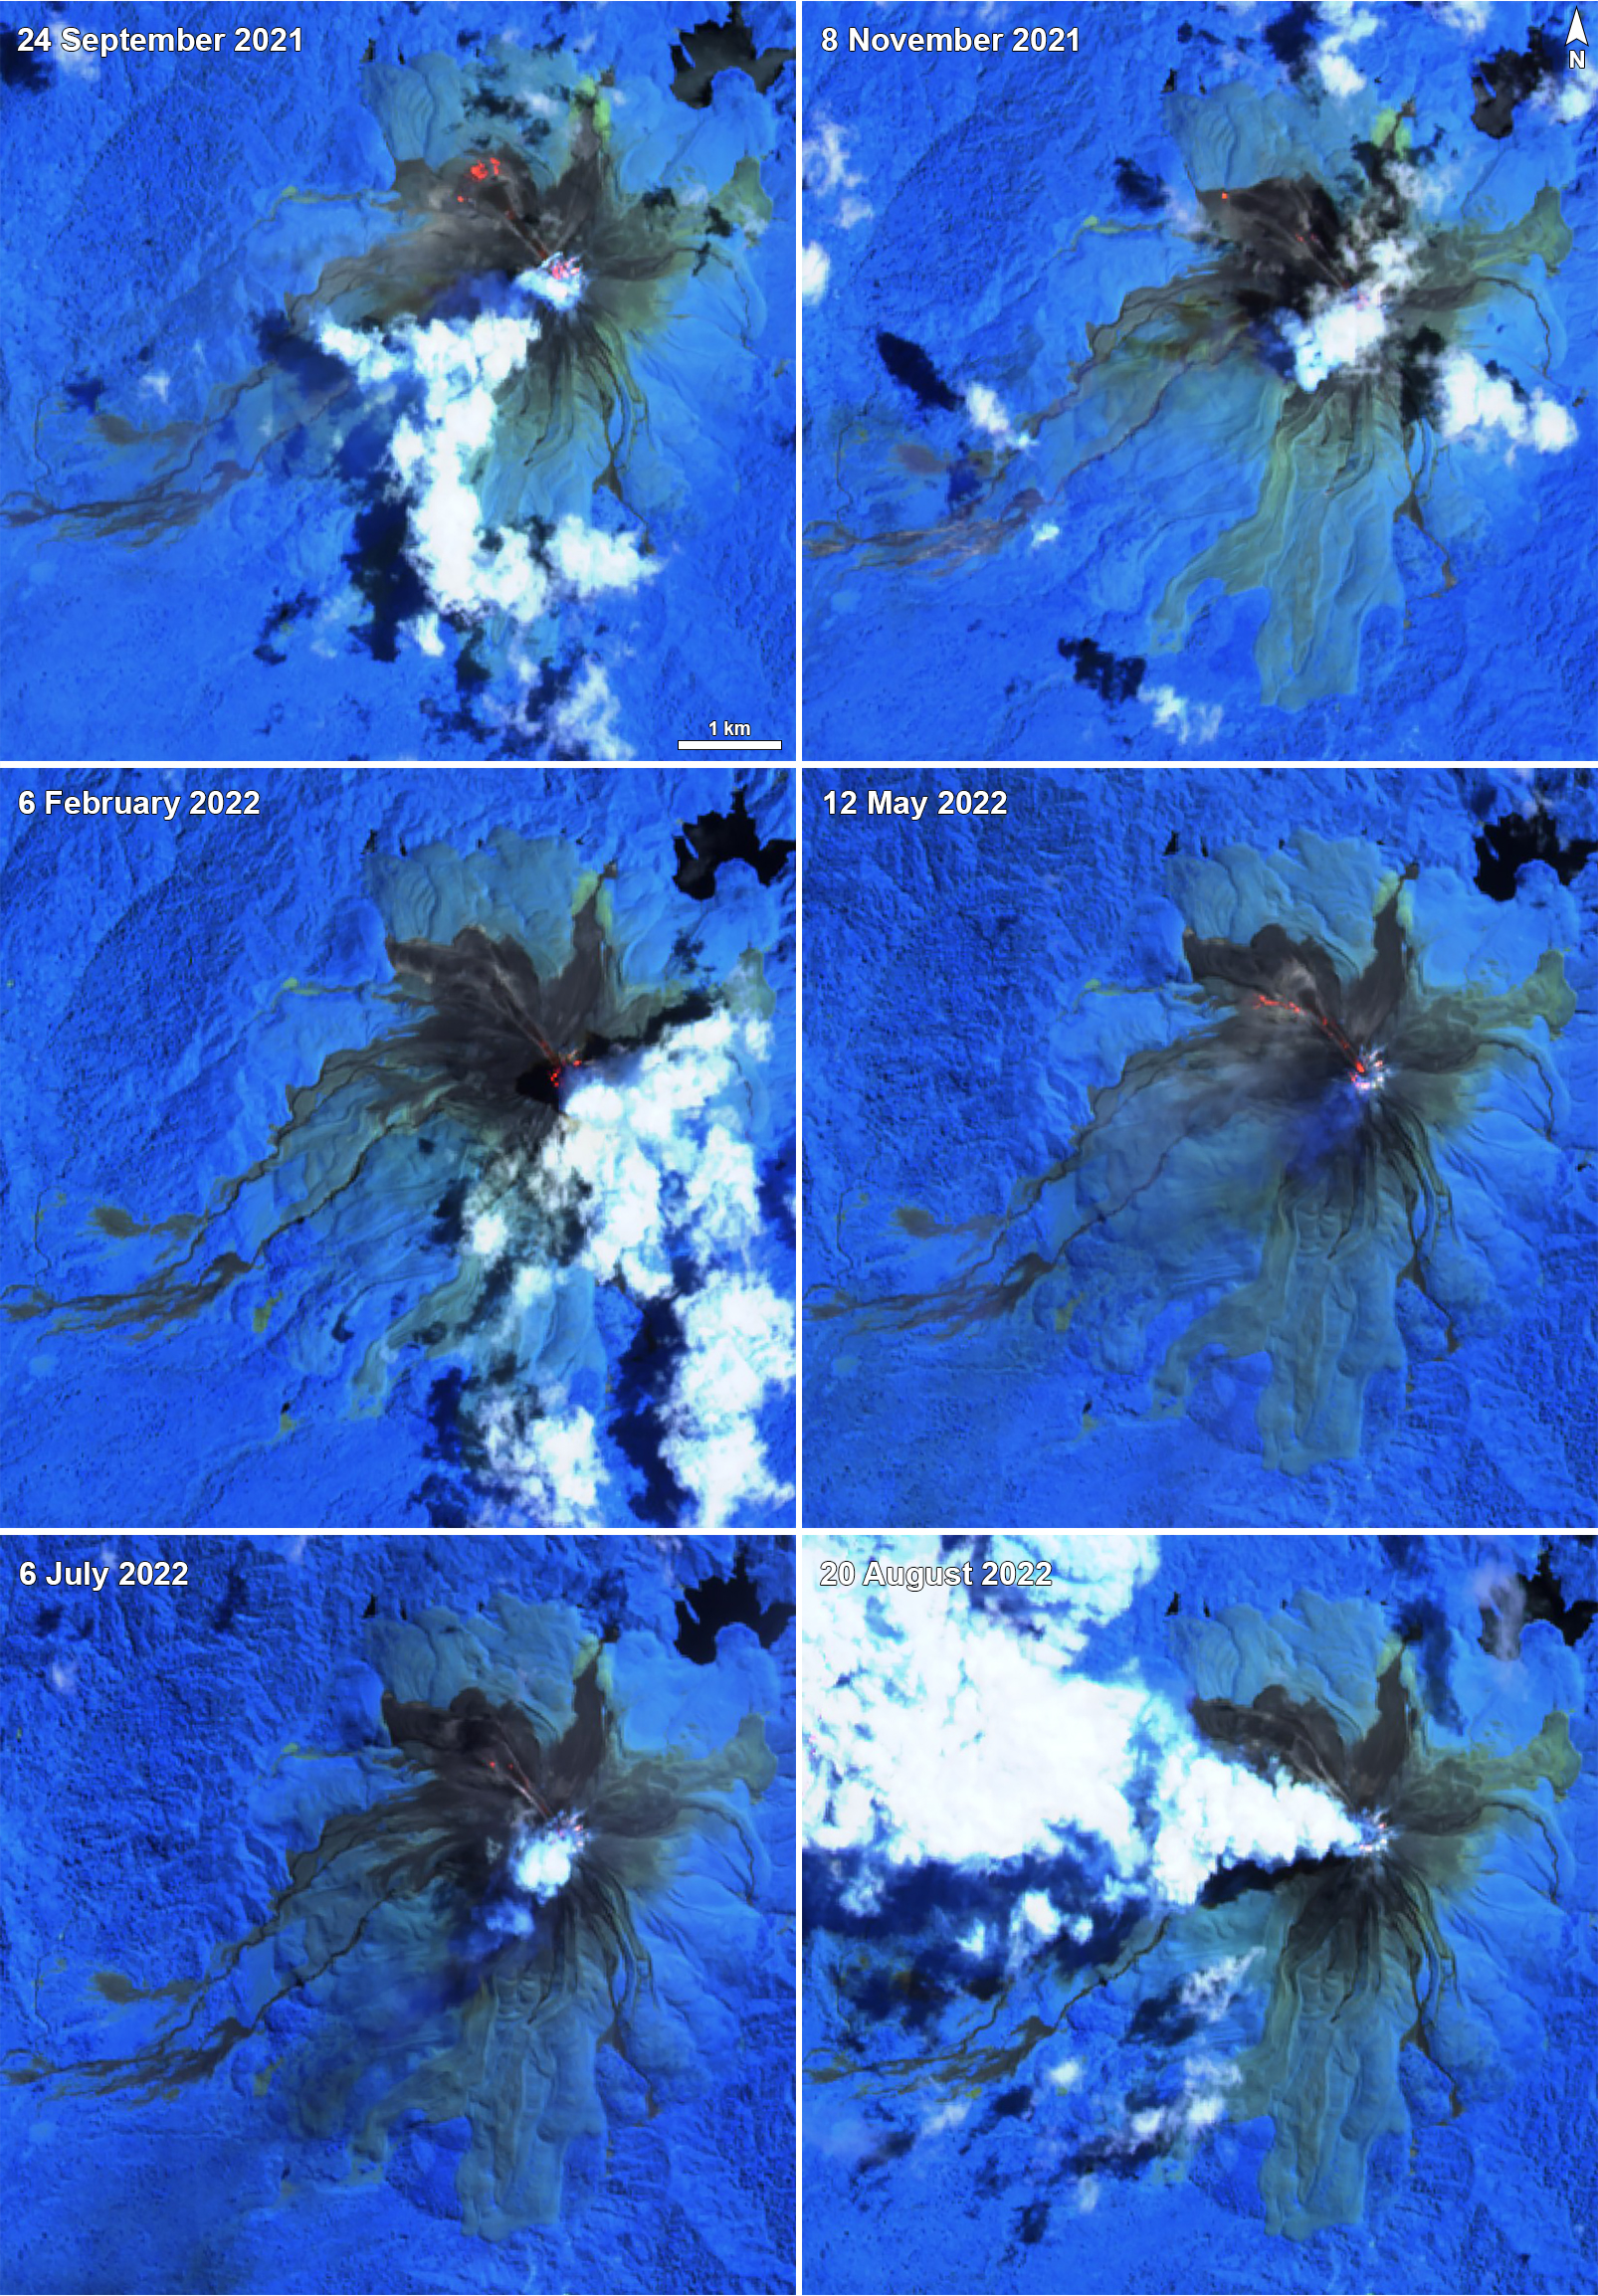 |
Figure 42. Sentinel-2 infrared satellite images showing thermal incandescence in both the summit crater and on the dominantly NW flank of Bagana on 24 September 2021 (top left), 8 November 2021 (top right), 6 February 2022 (middle left), 12 May 2022 (middle right), 6 July 2022 (bottom left), and 20 August 2022 (bottom right). Occasional white gas-and-steam emissions were also visible. In each of these images except on 20 August, traces of incandescent material are visible on the NW flank. Sentinel-2 images with "Atmospheric penetration" (bands 12, 11, 8A) rendering. Courtesy of Sentinel Hub Playground. |
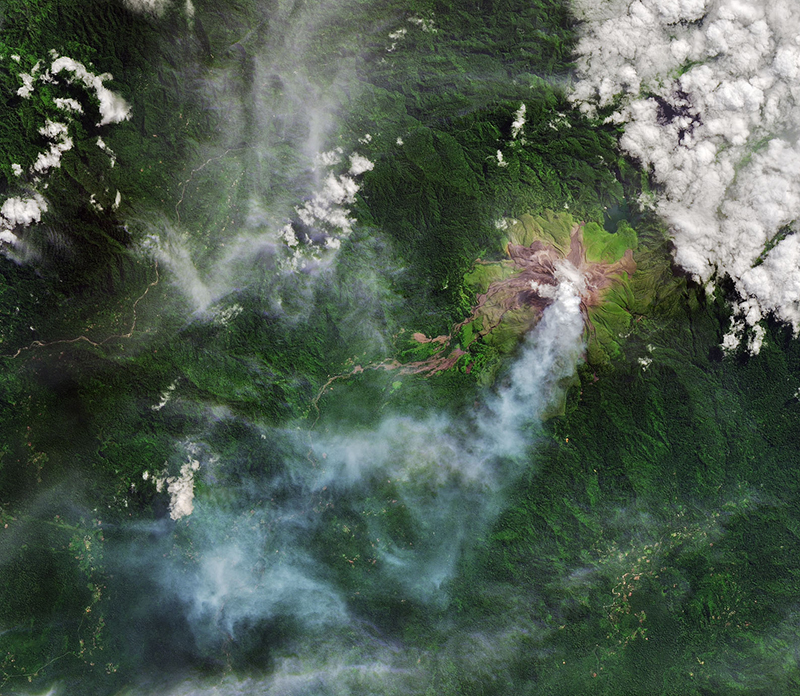 |
Figure 43. Satellite image of Bagana showing a clear view of the summit and a white gas-and-steam plume drifting SW on 28 May 2022. Courtesy of Joshua Stevens (NASA Earth Observatory). |
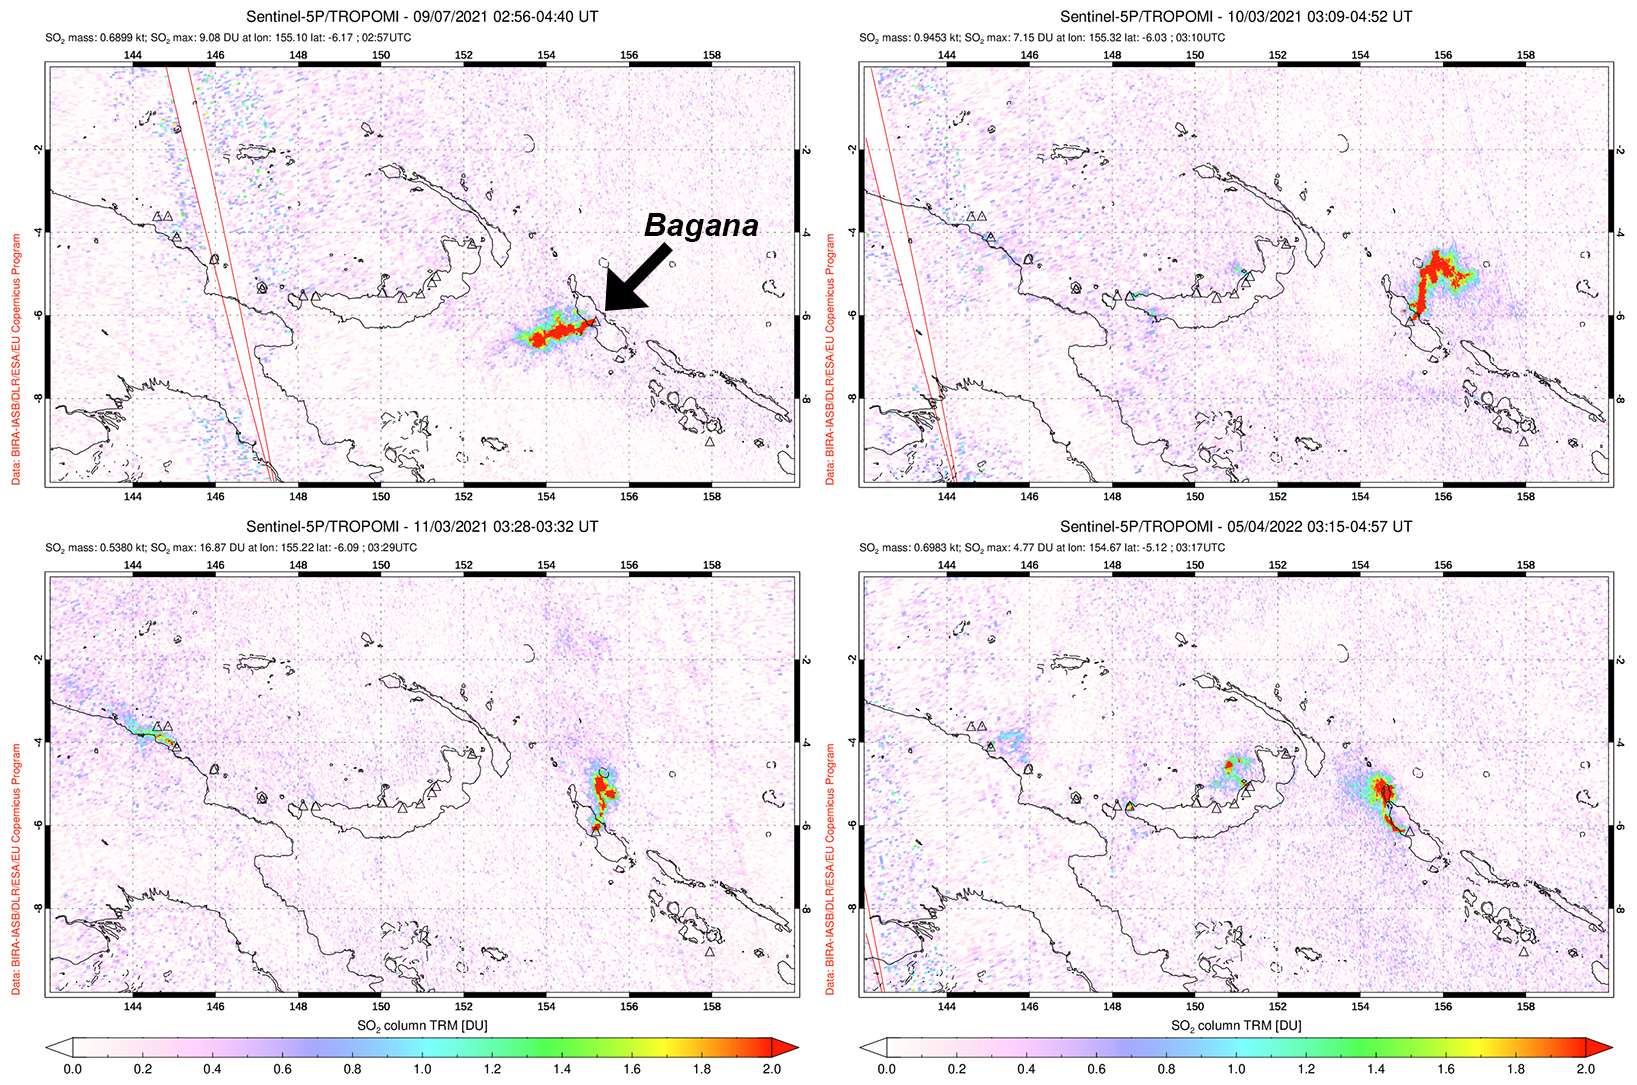 |
Figure 44. Distinct sulfur dioxide plumes were detected from Bagana on 7 September 2021 (top left), 3 October 2021 (top right), 3 November 2021 (bottom left), and 4 May 2022 (bottom right). Each of these plumes exceeded 2 Dobson Units (DUs) and drifted in different directions. Data is from the TROPOMI instrument on the Sentinel-5P satellite. Courtesy of NASA Global Sulfur Dioxide Monitoring Page. |
The Darwin VAAC issued a total of seven notices during the reporting period. On October 2021 the reported ash plume rose to 2.1 km altitude and drifted NE based on satellite and wind model data. On 27 November continuous ash plumes also rose to 2.1 km altitude and drifted NW. Minor gas-and-steam emissions were also noted. On 22 August an ash plume rose to 3 km altitude and drifted SW, accompanied by continuous gas-and-steam emissions.
Information Contacts: Darwin Volcanic Ash Advisory Centre (VAAC), Bureau of Meteorology, Northern Territory Regional Office, PO Box 40050, Casuarina, NT 0811, Australia (URL: http://www.bom.gov.au/info/vaac/); MIROVA (Middle InfraRed Observation of Volcanic Activity), a collaborative project between the Universities of Turin and Florence (Italy) supported by the Centre for Volcanic Risk of the Italian Civil Protection Department (URL: http://www.mirovaweb.it/); Hawai'i Institute of Geophysics and Planetology (HIGP) - MODVOLC Thermal Alerts System, School of Ocean and Earth Science and Technology (SOEST), Univ. of Hawai'i, 2525 Correa Road, Honolulu, HI 96822, USA (URL: http://modis.higp.hawaii.edu/); NASA Global Sulfur Dioxide Monitoring Page, Atmospheric Chemistry and Dynamics Laboratory, NASA Goddard Space Flight Center (NASA/GSFC), 8800 Greenbelt Road, Goddard, Maryland, USA (URL: https://so2.gsfc.nasa.gov/); Sentinel Hub Playground (URL: https://www.sentinel-hub.com/explore/sentinel-playground); Joshua Stevens, NASA Earth Observatory, EOS Project Science Office, NASA Goddard Space Flight Center, Goddard, Maryland 20771, USA (URL: http://earthobservatory.nasa.gov/).
Ongoing lava extrusion and ash emissions, September 2022-March 2023
The remote Bagana volcano on central Bougainville Island, Papua New Guinea, has been erupting almost continuously since February 2000 and consists of frequent non-explosive lava flows, gas and sulfur dioxide emissions, occasional emissions of ash, and thermal anomalies. Infrequently, explosions producing pyroclastic flows occur (BGVN 46:09, 47:09). The current report describes activity during September 2022-March 2023 using information from the Darwin Volcanic Ash Advisory Center (VAAC) and satellite data.
Eruptive activity continued throughout the reporting period, with persistent thermal activity as seen in satellite images. When visibility allowed, Sentinel-2 images revealed persistent thermal activity in the NE part of the summit crater, with weaker thermal signals on the SE flank, just below the summit (figure 1). Strong activity on 18 November (figure 45) included what appear to be lava flows in the crater and extending down the NW flank, and on the lower SE flank. Gas-and-steam emissions were also visible in most Sentinel-2 images, usually drifting NE.
|
Figure 45. Sentinel-2 infrared satellite image of Bagana showing a strong thermal signal in the NE part of the summit crater and extending down the NW flank, with weaker hotspots on the lower SE flank. Images use “Atmospheric penetration” (bands 12, 11, 8A) rendering. Courtesy of Sentinel Hub Playground. |
Consistent with the Sentinel-2 images, the MIROVA thermal detection system showed a persistent low to moderate power anomaly in both MODIS (Moderate Resolution Imaging Spectroradiometer) and VIIRS (Visible Infrared Imaging Radiometer Suite) data, with more frequent and stronger activity during October-November 2022 (figure 46). Hotspots were only detected on three days by the MODIS-MODVOLC system (23 October, 13 November, and 20 November).
|
Figure 46. Graphs showing thermal anomalies near the crater summit at Bagana during September 2022-March 2023, as recorded by the MIROVA system (Log Radiative Power) using MODIS (top) and VIIRS (bottom) data. Nearly persistent low-to-moderate hotspots were recorded during September through the first part of January, with more persistent and higher power signals during October and November 2022. Courtesy of MIROVA. |
A few strong SO2 plumes were observed by the TROPOMI instrument aboard the Sentinel-5P satellite, mostly during November. They were most prominent during 28 October-5 November 2022, consistent with ash plumes reported by the Darwin VAAC that rose to an altitude of 2.1-2.7 km (or 200-600 m above the summit) during 31 October-2 November.
Information Contacts: MIROVA (Middle InfraRed Observation of Volcanic Activity), a collaborative project between the Universities of Turin and Florence (Italy) supported by the Centre for Volcanic Risk of the Italian Civil Protection Department (URL: http://www.mirovaweb.it/); Sentinel Hub Playground (URL: https://www.sentinel-hub.com/explore/sentinel-playground); Hawai'i Institute of Geophysics and Planetology (HIGP) - MODVOLC Thermal Alerts System, School of Ocean and Earth Science and Technology (SOEST), Univ. of Hawai'i, 2525 Correa Road, Honolulu, HI 96822, USA (URL: http://modis.higp.hawaii.edu/); Darwin Volcanic Ash Advisory Centre (VAAC), Bureau of Meteorology, Northern Territory Regional Office, PO Box 40050, Casuarina, NT 0811, Australia (URL: http://www.bom.gov.au/info/vaac/); NASA Global Sulfur Dioxide Monitoring Page, Atmospheric Chemistry and Dynamics Laboratory, NASA Goddard Space Flight Center (NASA/GSFC), 8800 Greenbelt Road, Goddard, Maryland, USA (URL: https://so2.gsfc.nasa.gov/).
This compilation of synonyms and subsidiary features may not be comprehensive. Features are organized into four major categories: Cones, Craters, Domes, and Thermal Features. Synonyms of features appear indented below the primary name. In some cases additional feature type, elevation, or location details are provided.
Synonyms |
||||
| Bogana | ||||
Cones |
||||
| Feature Name | Feature Type | Elevation | Latitude | Longitude |
| Bagana | Lava cone | |||
|
|
||||||||||||||||||||||||
There is data available for 25 confirmed Holocene eruptive periods.
2000 Feb 28 (in or before) - 2024 Apr 19 (continuing) Confirmed Eruption Max VEI: 2
| Episode 1 | Eruption Episode | ||||||||||||||||||||||||||||||||||||||||
|---|---|---|---|---|---|---|---|---|---|---|---|---|---|---|---|---|---|---|---|---|---|---|---|---|---|---|---|---|---|---|---|---|---|---|---|---|---|---|---|---|
| 2000 Feb 28 (in or before) - 2024 Apr 19 (continuing) | Evidence from Observations: Reported | |||||||||||||||||||||||||||||||||||||||
|
List of 6 Events for Episode 1
| ||||||||||||||||||||||||||||||||||||||||
1972 Jul 2 ± 182 days - 1995 Jul 2 (in or after) ± 182 days Confirmed Eruption Max VEI: 2
| Episode 1 | Eruption Episode | |||||||||||||||||||||||||||||||||||||||||||||
|---|---|---|---|---|---|---|---|---|---|---|---|---|---|---|---|---|---|---|---|---|---|---|---|---|---|---|---|---|---|---|---|---|---|---|---|---|---|---|---|---|---|---|---|---|---|
| 1972 Jul 2 ± 182 days - 1995 Jul 2 (in or after) ± 182 days | Evidence from Observations: Reported | ||||||||||||||||||||||||||||||||||||||||||||
|
List of 7 Events for Episode 1
| |||||||||||||||||||||||||||||||||||||||||||||
1970 May 21 ± 15 days - 1971 Aug 16 (in or after) ± 15 days Confirmed Eruption Max VEI: 2
| Episode 1 | Eruption Episode | ||||||||||||||||||||||||||||||
|---|---|---|---|---|---|---|---|---|---|---|---|---|---|---|---|---|---|---|---|---|---|---|---|---|---|---|---|---|---|---|
| 1970 May 21 ± 15 days - 1971 Aug 16 (in or after) ± 15 days | Evidence from Observations: Reported | |||||||||||||||||||||||||||||
|
List of 4 Events for Episode 1
| ||||||||||||||||||||||||||||||
1968 Aug 16 ± 15 days - 1968 Aug 16 ± 15 days Confirmed Eruption Max VEI: 2
| Episode 1 | Eruption Episode | |||||||||||||||||||||||||
|---|---|---|---|---|---|---|---|---|---|---|---|---|---|---|---|---|---|---|---|---|---|---|---|---|---|
| 1968 Aug 16 ± 15 days - 1968 Aug 16 ± 15 days | Evidence from Observations: Reported | ||||||||||||||||||||||||
|
List of 3 Events for Episode 1
| |||||||||||||||||||||||||
1966 Mar 20 - 1967 Nov 30 Confirmed Eruption Max VEI: 3
| Episode 1 | Eruption Episode | |||||||||||||||||||||||||||||||||||||||||||||
|---|---|---|---|---|---|---|---|---|---|---|---|---|---|---|---|---|---|---|---|---|---|---|---|---|---|---|---|---|---|---|---|---|---|---|---|---|---|---|---|---|---|---|---|---|---|
| 1966 Mar 20 - 1967 Nov 30 | Evidence from Observations: Reported | ||||||||||||||||||||||||||||||||||||||||||||
|
List of 7 Events for Episode 1
| |||||||||||||||||||||||||||||||||||||||||||||
1964 Apr 24 - 1965 Jul 2 ± 182 days Confirmed Eruption Max VEI: 2
| Episode 1 | Eruption Episode | |||||||||||||||||||||||||||||||||||||||||||||
|---|---|---|---|---|---|---|---|---|---|---|---|---|---|---|---|---|---|---|---|---|---|---|---|---|---|---|---|---|---|---|---|---|---|---|---|---|---|---|---|---|---|---|---|---|---|
| 1964 Apr 24 - 1965 Jul 2 ± 182 days | Evidence from Observations: Reported | ||||||||||||||||||||||||||||||||||||||||||||
|
List of 7 Events for Episode 1
| |||||||||||||||||||||||||||||||||||||||||||||
1962 Feb 15 - 1963 Jul 2 ± 182 days Confirmed Eruption Max VEI: 2
| Episode 1 | Eruption Episode | ||||||||||||||||||||||||||||||||||||||||
|---|---|---|---|---|---|---|---|---|---|---|---|---|---|---|---|---|---|---|---|---|---|---|---|---|---|---|---|---|---|---|---|---|---|---|---|---|---|---|---|---|
| 1962 Feb 15 - 1963 Jul 2 ± 182 days | Evidence from Observations: Reported | |||||||||||||||||||||||||||||||||||||||
|
List of 6 Events for Episode 1
| ||||||||||||||||||||||||||||||||||||||||
1961 Jul 26 Confirmed Eruption Max VEI: 2
| Episode 1 | Eruption Episode | |||||||||||||||||||||||||
|---|---|---|---|---|---|---|---|---|---|---|---|---|---|---|---|---|---|---|---|---|---|---|---|---|---|
| 1961 Jul 26 - Unknown | Evidence from Observations: Reported | ||||||||||||||||||||||||
|
List of 3 Events for Episode 1
| |||||||||||||||||||||||||
1959 Jul 2 (?) ± 182 days - 1960 May 16 ± 15 days Confirmed Eruption Max VEI: 2
| Episode 1 | Eruption Episode | ||||||||||||||||||||||||||||||||||||||||
|---|---|---|---|---|---|---|---|---|---|---|---|---|---|---|---|---|---|---|---|---|---|---|---|---|---|---|---|---|---|---|---|---|---|---|---|---|---|---|---|---|
| 1959 Jul 2 (?) ± 182 days - 1960 May 16 ± 15 days | Evidence from Observations: Reported | |||||||||||||||||||||||||||||||||||||||
|
List of 6 Events for Episode 1
| ||||||||||||||||||||||||||||||||||||||||
1956 Jul 2 ± 182 days Confirmed Eruption Max VEI: 2
| Episode 1 | Eruption Episode | |||||||||||||||||||||||||
|---|---|---|---|---|---|---|---|---|---|---|---|---|---|---|---|---|---|---|---|---|---|---|---|---|---|
| 1956 Jul 2 ± 182 days - Unknown | Evidence from Observations: Reported | ||||||||||||||||||||||||
|
List of 3 Events for Episode 1
| |||||||||||||||||||||||||
1953 Jun 16 ± 15 days - 1953 Sep 16 ± 15 days Confirmed Eruption Max VEI: 3
| Episode 1 | Eruption Episode | ||||||||||||||||||||||||||||||||||||||||
|---|---|---|---|---|---|---|---|---|---|---|---|---|---|---|---|---|---|---|---|---|---|---|---|---|---|---|---|---|---|---|---|---|---|---|---|---|---|---|---|---|
| 1953 Jun 16 ± 15 days - 1953 Sep 16 ± 15 days | Evidence from Observations: Reported | |||||||||||||||||||||||||||||||||||||||
|
List of 6 Events for Episode 1
| ||||||||||||||||||||||||||||||||||||||||
1952 Feb 29 - 1952 Oct 16 ± 15 days Confirmed Eruption Max VEI: 4
| Episode 1 | Eruption Episode | |||||||||||||||||||||||||||||||||||||||||||||
|---|---|---|---|---|---|---|---|---|---|---|---|---|---|---|---|---|---|---|---|---|---|---|---|---|---|---|---|---|---|---|---|---|---|---|---|---|---|---|---|---|---|---|---|---|---|
| 1952 Feb 29 - 1952 Oct 16 ± 15 days | Evidence from Observations: Reported | ||||||||||||||||||||||||||||||||||||||||||||
|
List of 7 Events for Episode 1
| |||||||||||||||||||||||||||||||||||||||||||||
1948 Dec 1 ± 30 days - 1951 Dec 1 ± 30 days Confirmed Eruption Max VEI: 3
| Episode 1 | Eruption Episode | |||||||||||||||||||||||||||||||||||||||||||||||||||||||
|---|---|---|---|---|---|---|---|---|---|---|---|---|---|---|---|---|---|---|---|---|---|---|---|---|---|---|---|---|---|---|---|---|---|---|---|---|---|---|---|---|---|---|---|---|---|---|---|---|---|---|---|---|---|---|---|
| 1948 Dec 1 ± 30 days - 1951 Dec 1 ± 30 days | Evidence from Observations: Reported | ||||||||||||||||||||||||||||||||||||||||||||||||||||||
|
List of 9 Events for Episode 1
| |||||||||||||||||||||||||||||||||||||||||||||||||||||||
1945 - 1947 Confirmed Eruption Max VEI: 2
| Episode 1 | Eruption Episode | ||||||||||||||||||||||||||||||
|---|---|---|---|---|---|---|---|---|---|---|---|---|---|---|---|---|---|---|---|---|---|---|---|---|---|---|---|---|---|---|
| 1945 - 1947 | Evidence from Observations: Reported | |||||||||||||||||||||||||||||
|
List of 4 Events for Episode 1
| ||||||||||||||||||||||||||||||
1943 Apr 7 (in or before) Confirmed Eruption Max VEI: 1
| Episode 1 | Eruption Episode | ||||||||||||||||||||
|---|---|---|---|---|---|---|---|---|---|---|---|---|---|---|---|---|---|---|---|---|
| 1943 Apr 7 (in or before) - Unknown | Evidence from Observations: Reported | |||||||||||||||||||
|
List of 2 Events for Episode 1
| ||||||||||||||||||||
1939 Jan 30 (?) Confirmed Eruption Max VEI: 2
| Episode 1 | Eruption Episode | |||||||||||||||||||||||||||||||||||
|---|---|---|---|---|---|---|---|---|---|---|---|---|---|---|---|---|---|---|---|---|---|---|---|---|---|---|---|---|---|---|---|---|---|---|---|
| 1939 Jan 30 (?) - Unknown | Evidence from Observations: Reported | ||||||||||||||||||||||||||||||||||
|
List of 5 Events for Episode 1
| |||||||||||||||||||||||||||||||||||
1938 May 15 Confirmed Eruption Max VEI: 3
| Episode 1 | Eruption Episode | ||||||||||||||||||||||||||||||
|---|---|---|---|---|---|---|---|---|---|---|---|---|---|---|---|---|---|---|---|---|---|---|---|---|---|---|---|---|---|---|
| 1938 May 15 - Unknown | Evidence from Observations: Reported | |||||||||||||||||||||||||||||
|
List of 4 Events for Episode 1
| ||||||||||||||||||||||||||||||
1937 Sep 7 Confirmed Eruption Max VEI: 3
| Episode 1 | Eruption Episode | |||||||||||||||||||||||||
|---|---|---|---|---|---|---|---|---|---|---|---|---|---|---|---|---|---|---|---|---|---|---|---|---|---|
| 1937 Sep 7 - Unknown | Evidence from Observations: Reported | ||||||||||||||||||||||||
|
List of 3 Events for Episode 1
| |||||||||||||||||||||||||
[ 1909 Jul ] Uncertain Eruption
| Episode 1 | Eruption Episode | |||||||||||||||
|---|---|---|---|---|---|---|---|---|---|---|---|---|---|---|---|
| 1909 Jul - Unknown | Evidence from Unknown | ||||||||||||||
|
List of 1 Events for Episode 1
| |||||||||||||||
1908 Jul 15 Confirmed Eruption Max VEI: 2 (?)
| Episode 1 | Eruption Episode | |||||||||||||||||||||||||
|---|---|---|---|---|---|---|---|---|---|---|---|---|---|---|---|---|---|---|---|---|---|---|---|---|---|
| 1908 Jul 15 - Unknown | Evidence from Observations: Reported | ||||||||||||||||||||||||
|
List of 3 Events for Episode 1
| |||||||||||||||||||||||||
1899 Confirmed Eruption
| Episode 1 | Eruption Episode | ||||
|---|---|---|---|---|
| 1899 - Unknown | Evidence from Observations: Reported | |||
1897 May 16 (?) Confirmed Eruption Max VEI: 2
| Episode 1 | Eruption Episode | |||||||||||||||||||||||||
|---|---|---|---|---|---|---|---|---|---|---|---|---|---|---|---|---|---|---|---|---|---|---|---|---|---|
| 1897 May 16 (?) - Unknown | Evidence from Observations: Reported | ||||||||||||||||||||||||
|
List of 3 Events for Episode 1
| |||||||||||||||||||||||||
1894 - 1895 Confirmed Eruption Max VEI: 2
| Episode 1 | Eruption Episode | ||||||||||||||||||||||||||||||
|---|---|---|---|---|---|---|---|---|---|---|---|---|---|---|---|---|---|---|---|---|---|---|---|---|---|---|---|---|---|---|
| 1894 - 1895 | Evidence from Observations: Reported | |||||||||||||||||||||||||||||
|
List of 4 Events for Episode 1
| ||||||||||||||||||||||||||||||
1883 Dec 31 ± 30 days Confirmed Eruption Max VEI: 3
| Episode 1 | Eruption Episode | |||||||||||||||||||||||||
|---|---|---|---|---|---|---|---|---|---|---|---|---|---|---|---|---|---|---|---|---|---|---|---|---|---|
| 1883 Dec 31 ± 30 days - Unknown | Evidence from Observations: Reported | ||||||||||||||||||||||||
|
List of 3 Events for Episode 1
| |||||||||||||||||||||||||
1865 ± 3 years - 1883 Confirmed Eruption Max VEI: 2
| Episode 1 | Eruption Episode | ||||||||||||||||||||
|---|---|---|---|---|---|---|---|---|---|---|---|---|---|---|---|---|---|---|---|---|
| 1865 ± 3 years - 1883 | Evidence from Observations: Reported | |||||||||||||||||||
|
List of 2 Events for Episode 1
| ||||||||||||||||||||
1842 Mar 15 Confirmed Eruption Max VEI: 1
| Episode 1 | Eruption Episode | ||||||||||||||||||||
|---|---|---|---|---|---|---|---|---|---|---|---|---|---|---|---|---|---|---|---|---|
| 1842 Mar 15 - Unknown | Evidence from Observations: Reported | |||||||||||||||||||
|
List of 2 Events for Episode 1
| ||||||||||||||||||||
There is no Deformation History data available for Bagana.
There is no Emissions History data available for Bagana.
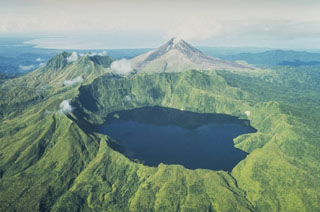 The caldera lake of Billy Mitchell in front of the unvegetated Bagana volcano. The Solomon Sea can be seen in the distance to the SW. Two major explosive eruptions from Billy Mitchell, one about 900 and the other about 370 years ago, produced ashfall that covered most of the N half of Bougainville Island and pyroclastic flow and surge deposits that extend 25 km to the E coast. The younger eruption may have been responsible for formation of the summit caldera.
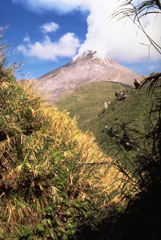 A plume rises above the Bagana summit lava dome on 18 June 1987. To the right of this view an older lava flow from Bagana is visible. The extrusion of viscous andesitic lava flows has occurred throughout much of the 20th century.
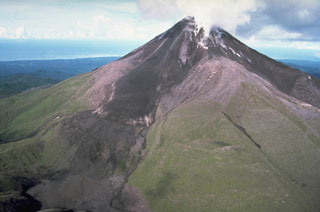 Plumes rise from a slow-moving andesite lava flow descending the NW flank of Bagana on 26 April 1988. The flow at that time had been moving for about 3 or 4 years and is typical of the lava extrusion that began in 1972. This volcano was largely constructed by an accumulation of viscous andesite lava flows like this one.
 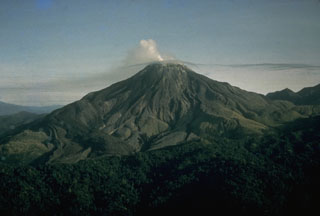 Bagana volcano is seen here on 7 October 1964 from the S with the 1964 lava flow descending the western flank to the left. About halfway down the flank the flow divides into four lobes, two of which flow to the W and the other two towards the camera to the S. The 1964 eruption began with explosive activity on 24 April. Lava extrusion soon began and continued into 1965.
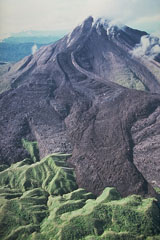 Bagana volcano, on Papua New Guinea's Bougainville Island, is characterized by the extrusion of thick, viscous andesitic lava flows. This photo shows a large lava flow with prominent lateral levees descending from the summit and ponding against forested hills at the base of the volcano. Bagana is constructed almost entirely of overlapping lava-flow lobes. Slow lava extrusion, occasionally accompanied by explosive activity, has been common since the mid-1800s.
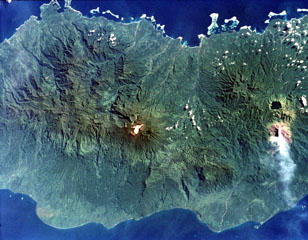 Tore volcano is in the Emperor Range on NW Bougainville Island. The Tore massif lies to the left of Balbi volcano, which is the light-colored area at the center of the image. Two Pleistocene ignimbrites from Tore formed a broad fan that extends the coastline to the W (lower left). The dark-colored caldera lake of Billy Mitchell volcano is at the right, above a plume originating from Bagana volcano. N is to the upper left of this NASA image.
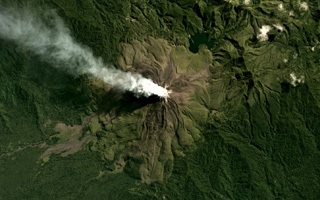 The flanks of Bagana are composed of radial lava flows that erupted from a central summit crater where a gas plume is emitting and dispersing NW, visible in this June 2019 Planet Labs satellite image monthly mosaic (N is at the top; this image is approximately 12 km across). At 2.5 km NW from the crater is a lava dome, and to the NE is the eroded Reini cone.
The maps shown below have been scanned from the GVP map archives and include the volcano on this page. Clicking on the small images will load the full 300 dpi map. Very small-scale maps (such as world maps) are not included. The maps database originated over 30 years ago, but was only recently updated and connected to our main database. We welcome users to tell us if they see incorrect information or other problems with the maps; please use the Contact GVP link at the bottom of the page to send us email.
There are no samples for Bagana in the Smithsonian's NMNH Department of Mineral Sciences Rock and Ore collection.
| Copernicus Browser | The Copernicus Browser replaced the Sentinel Hub Playground browser in 2023, to provide access to Earth observation archives from the Copernicus Data Space Ecosystem, the main distribution platform for data from the EU Copernicus missions. |
| MIROVA | Middle InfraRed Observation of Volcanic Activity (MIROVA) is a near real time volcanic hot-spot detection system based on the analysis of MODIS (Moderate Resolution Imaging Spectroradiometer) data. In particular, MIROVA uses the Middle InfraRed Radiation (MIR), measured over target volcanoes, in order to detect, locate and measure the heat radiation sourced from volcanic activity. |
| MODVOLC Thermal Alerts | Using infrared satellite Moderate Resolution Imaging Spectroradiometer (MODIS) data, scientists at the Hawai'i Institute of Geophysics and Planetology, University of Hawai'i, developed an automated system called MODVOLC to map thermal hot-spots in near real time. For each MODIS image, the algorithm automatically scans each 1 km pixel within it to check for high-temperature hot-spots. When one is found the date, time, location, and intensity are recorded. MODIS looks at every square km of the Earth every 48 hours, once during the day and once during the night, and the presence of two MODIS sensors in space allows at least four hot-spot observations every two days. Each day updated global maps are compiled to display the locations of all hot spots detected in the previous 24 hours. There is a drop-down list with volcano names which allow users to 'zoom-in' and examine the distribution of hot-spots at a variety of spatial scales. |
|
WOVOdat
Single Volcano View Temporal Evolution of Unrest Side by Side Volcanoes |
WOVOdat is a database of volcanic unrest; instrumentally and visually recorded changes in seismicity, ground deformation, gas emission, and other parameters from their normal baselines. It is sponsored by the World Organization of Volcano Observatories (WOVO) and presently hosted at the Earth Observatory of Singapore.
GVMID Data on Volcano Monitoring Infrastructure The Global Volcano Monitoring Infrastructure Database GVMID, is aimed at documenting and improving capabilities of volcano monitoring from the ground and space. GVMID should provide a snapshot and baseline view of the techniques and instrumentation that are in place at various volcanoes, which can be use by volcano observatories as reference to setup new monitoring system or improving networks at a specific volcano. These data will allow identification of what monitoring gaps exist, which can be then targeted by remote sensing infrastructure and future instrument deployments. |
| Volcanic Hazard Maps | The IAVCEI Commission on Volcanic Hazards and Risk has a Volcanic Hazard Maps database designed to serve as a resource for hazard mappers (or other interested parties) to explore how common issues in hazard map development have been addressed at different volcanoes, in different countries, for different hazards, and for different intended audiences. In addition to the comprehensive, searchable Volcanic Hazard Maps Database, this website contains information about diversity of volcanic hazard maps, illustrated using examples from the database. This site is for educational purposes related to volcanic hazard maps. Hazard maps found on this website should not be used for emergency purposes. For the most recent, official hazard map for a particular volcano, please seek out the proper institutional authorities on the matter. |
| IRIS seismic stations/networks | Incorporated Research Institutions for Seismology (IRIS) Data Services map showing the location of seismic stations from all available networks (permanent or temporary) within a radius of 0.18° (about 20 km at mid-latitudes) from the given location of Bagana. Users can customize a variety of filters and options in the left panel. Note that if there are no stations are known the map will default to show the entire world with a "No data matched request" error notice. |
| UNAVCO GPS/GNSS stations | Geodetic Data Services map from UNAVCO showing the location of GPS/GNSS stations from all available networks (permanent or temporary) within a radius of 20 km from the given location of Bagana. Users can customize the data search based on station or network names, location, and time window. Requires Adobe Flash Player. |
| DECADE Data | The DECADE portal, still in the developmental stage, serves as an example of the proposed interoperability between The Smithsonian Institution's Global Volcanism Program, the Mapping Gas Emissions (MaGa) Database, and the EarthChem Geochemical Portal. The Deep Earth Carbon Degassing (DECADE) initiative seeks to use new and established technologies to determine accurate global fluxes of volcanic CO2 to the atmosphere, but installing CO2 monitoring networks on 20 of the world's 150 most actively degassing volcanoes. The group uses related laboratory-based studies (direct gas sampling and analysis, melt inclusions) to provide new data for direct degassing of deep earth carbon to the atmosphere. |
| Large Eruptions of Bagana | Information about large Quaternary eruptions (VEI >= 4) is cataloged in the Large Magnitude Explosive Volcanic Eruptions (LaMEVE) database of the Volcano Global Risk Identification and Analysis Project (VOGRIPA). |
| EarthChem | EarthChem develops and maintains databases, software, and services that support the preservation, discovery, access and analysis of geochemical data, and facilitate their integration with the broad array of other available earth science parameters. EarthChem is operated by a joint team of disciplinary scientists, data scientists, data managers and information technology developers who are part of the NSF-funded data facility Integrated Earth Data Applications (IEDA). IEDA is a collaborative effort of EarthChem and the Marine Geoscience Data System (MGDS). |

