The Vanuatu Meteorology and Geohazards (VMGD) reported that unrest continued at Gaua during August. Sulfur dioxide emissions were identified in satellite images on 3 August and steam and/or gas emissions were visible in satellite images rising from the vent during 3-5 and 12 August. The Alert Level remained at 2 (on a scale of 0-5) and the public was warned to stay away from the main cone.
Source: Vanuatu Meteorology and Geohazards Department (VMGD)
Ash plumes visible in November 2021 and April 2022
Gaua Island in Vanuatu, also known as Santa María, is roughly 20 km in diameter and consists of a stratovolcano with a 6 x 9 km-wide summit caldera. Mount Garet (also known as Garat) in the SW part of the caldera is the active cone, with three pit craters across the summit area, and is the dominant site of eruptions recorded since July 1962. The crescent-shaped Lake Letas is east of Mount Garet. The most recent eruption period occurred during 17 September-10 October 2011. This report updates information since July 2013 through May 2022 and uses information primarily from monthly bulletins of the Vanuatu Meteorology and Geo-Hazards Department (VMGD) and various satellite data.
Occasional gas-and-steam emissions originating from Mt. Garet have been reported by VMGD and were visible in satellite imagery and by local observers. In addition, local residents and visitors occasionally reported the smell of sulfur near the cone. A white gas-and-steam emission was visible in Planet Labs satellite imagery on 28 September 2016 (figure 25). Similar gas-and-steam emissions were reported on 31 October 2017, 8 December 2017, 19 March 2018 in monthly VMGD reports. Ongoing gas-and-steam emissions from Mt. Garet persisted through May 2022, based on satellite images and reports from local observers (figure 26).
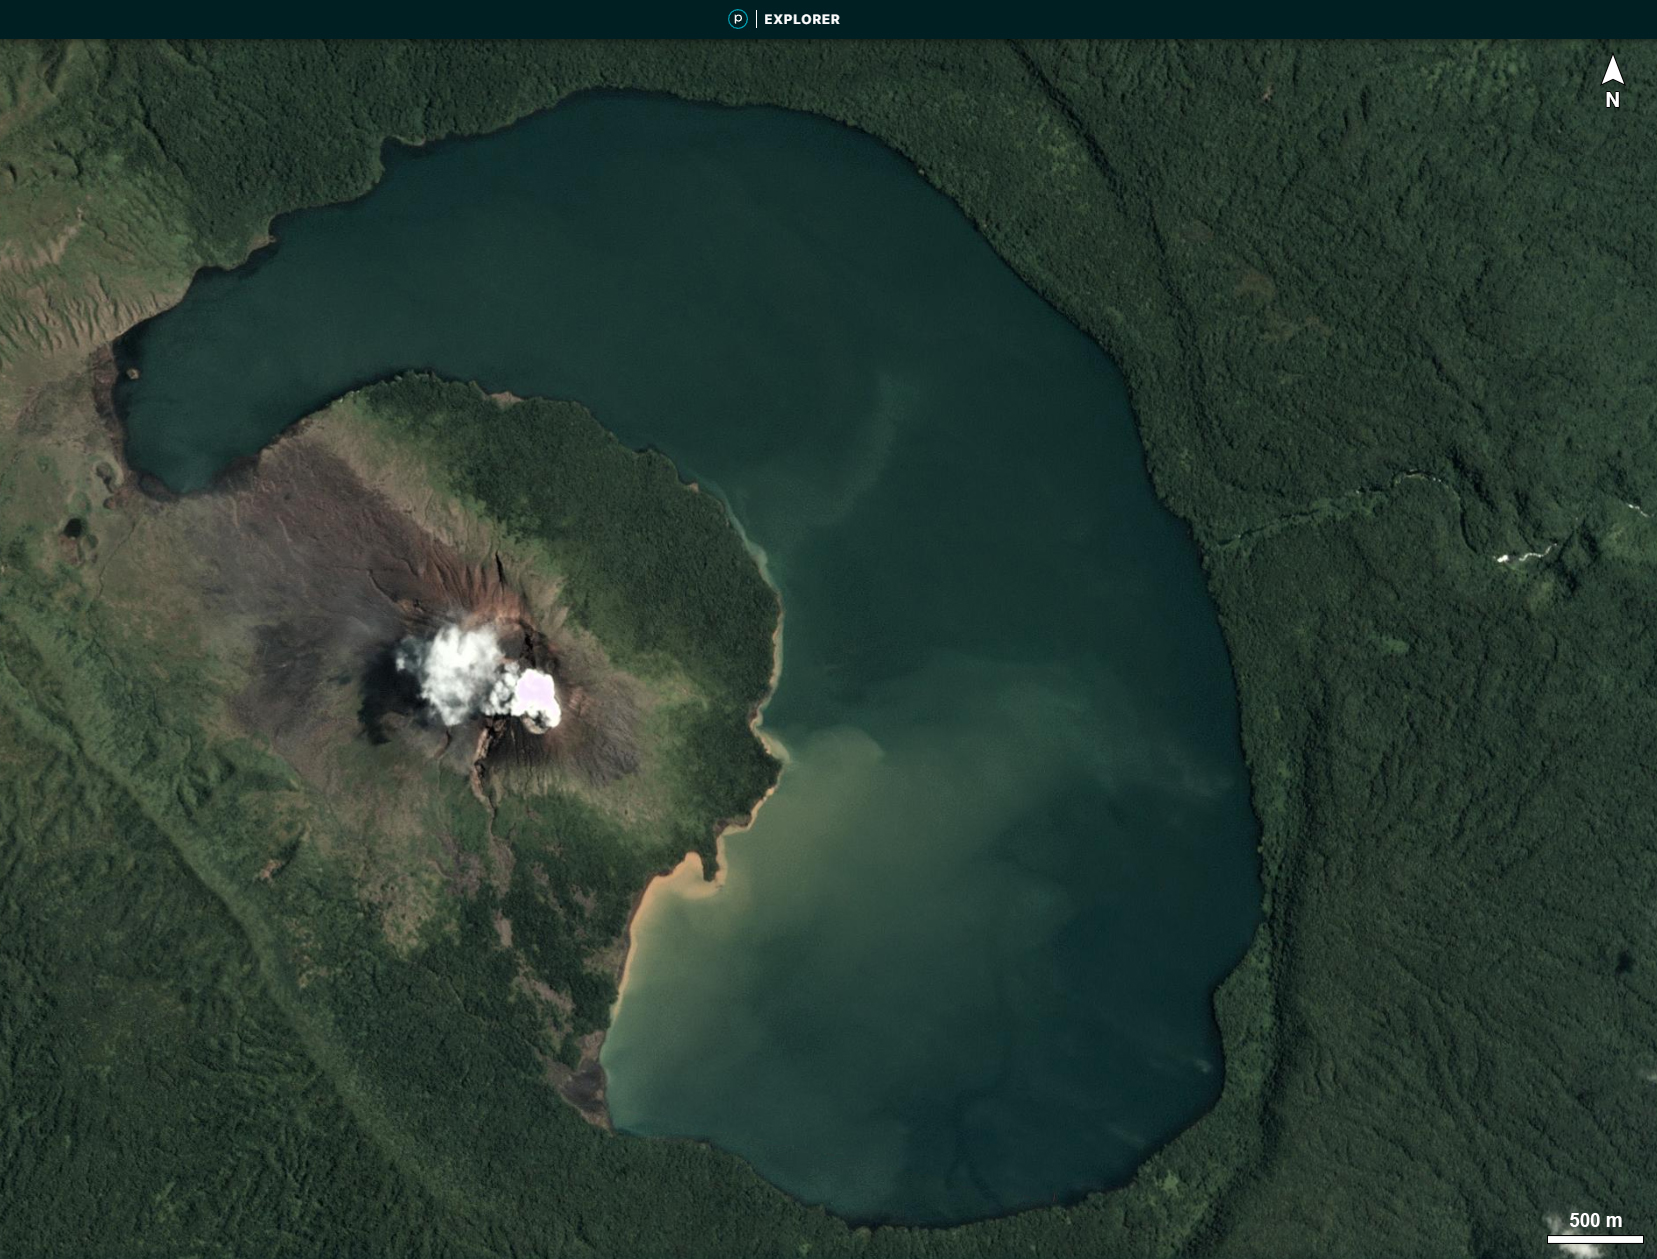 |
Figure 25. Planet Labs satellite image of white gas-and-steam emissions rising above Mt. Garet at Gaua on 28 September 2016. North is to the top of the figure. Courtesy of Planet Labs. |
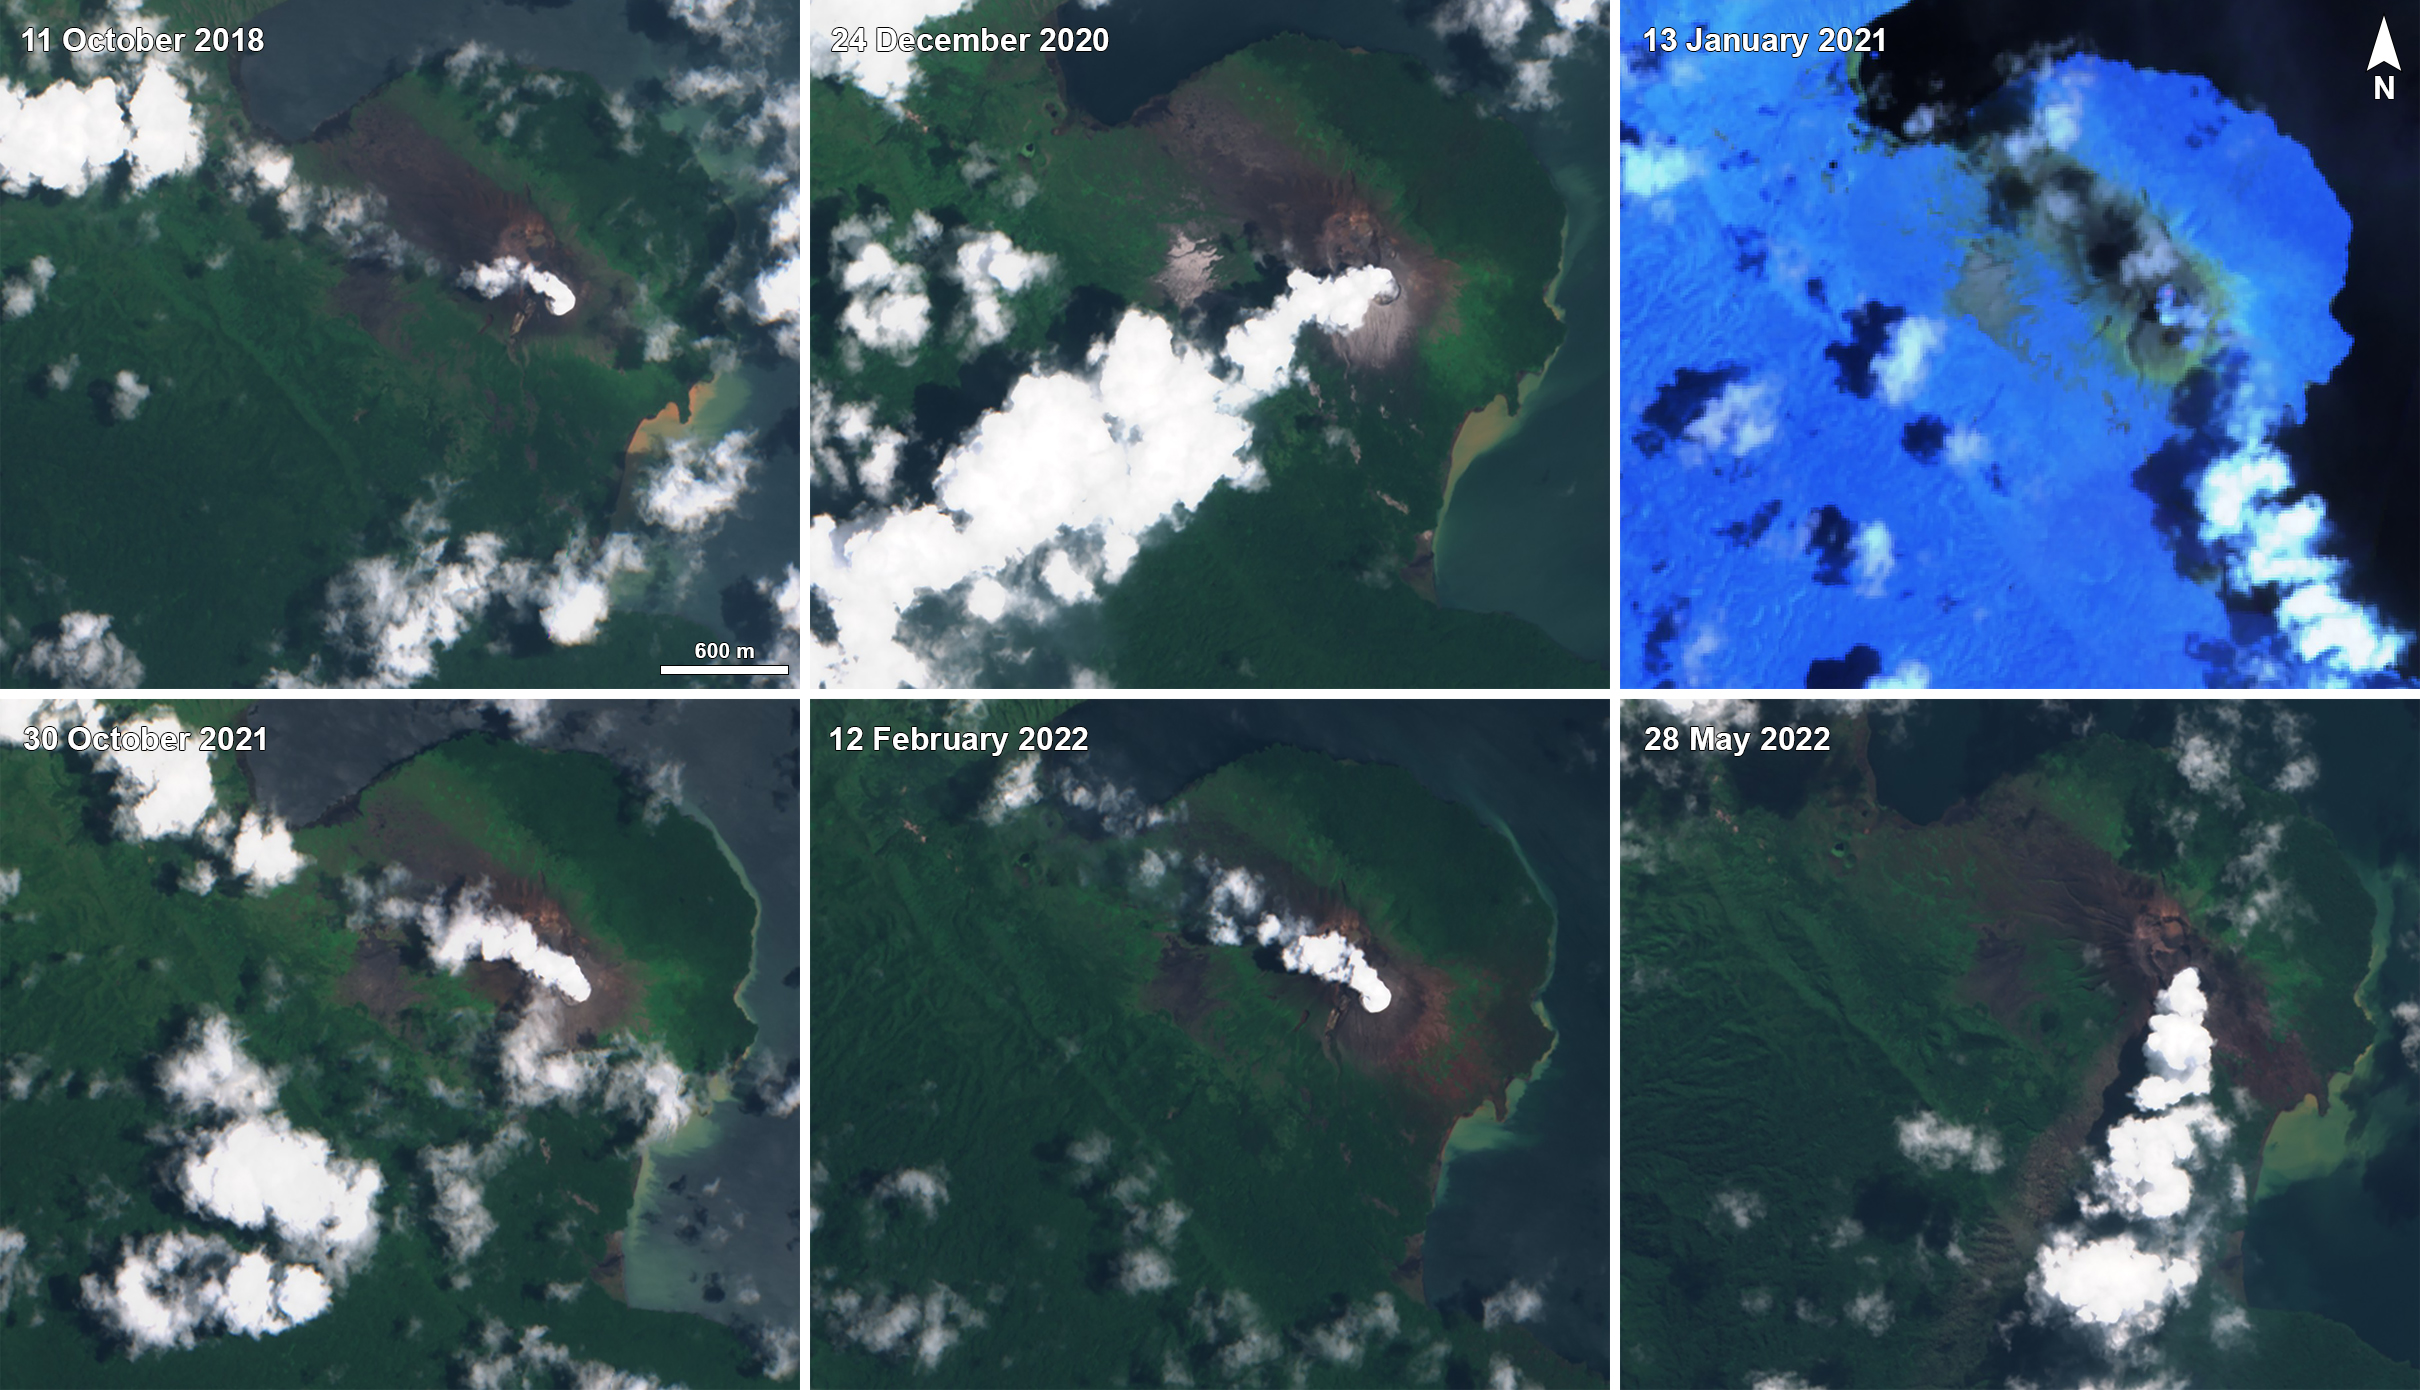 |
Figure 26. Sentinel-2 satellite imagery showed intermittent white gas-and-steam plumes rising above Mt. Garet at Gaua from 11 October 2018 through 28 May 2022 and drifting in different directions. On 13 January 2021 a weak thermal anomaly in the summit crater was detected in an infrared satellite image, accompanied by gas-and-steam emissions. Images show gas-and-steam emissions on 11 October 2018 (top left), 24 December 2020 (top middle), 13 January 2021 (top right), 30 October 2021 (bottom left), 12 February 2022 (bottom middle), and 28 May 2022 (bottom right). The image from 13 January 2021 uses “Atmospheric penetration” rendering (bands 12, 11, 8a) and the rest use “Natural color” (bands 4, 3, 2). Courtesy of Sentinel Hub Playground. |
An ash plume that rose above Mt. Garet on 16 November 2021 was reported by VMGD based on ground observations and satellite data. Ash deposits were also reported in the caldera area and in villages to the west; sulfuric gas odors continued to be noted by visitors. The MIROVA thermal anomaly data showed weak thermal anomalies in late February and mid-April 2022. VMGD warned of a sulfurous odor near the cone on 28 April. On 3 May 2022 local residents, especially in Naveto in the NE part of the island, heard a loud explosion and saw a dense ash plume rising above Mt. Garet during 0900-0930 (figure 27).
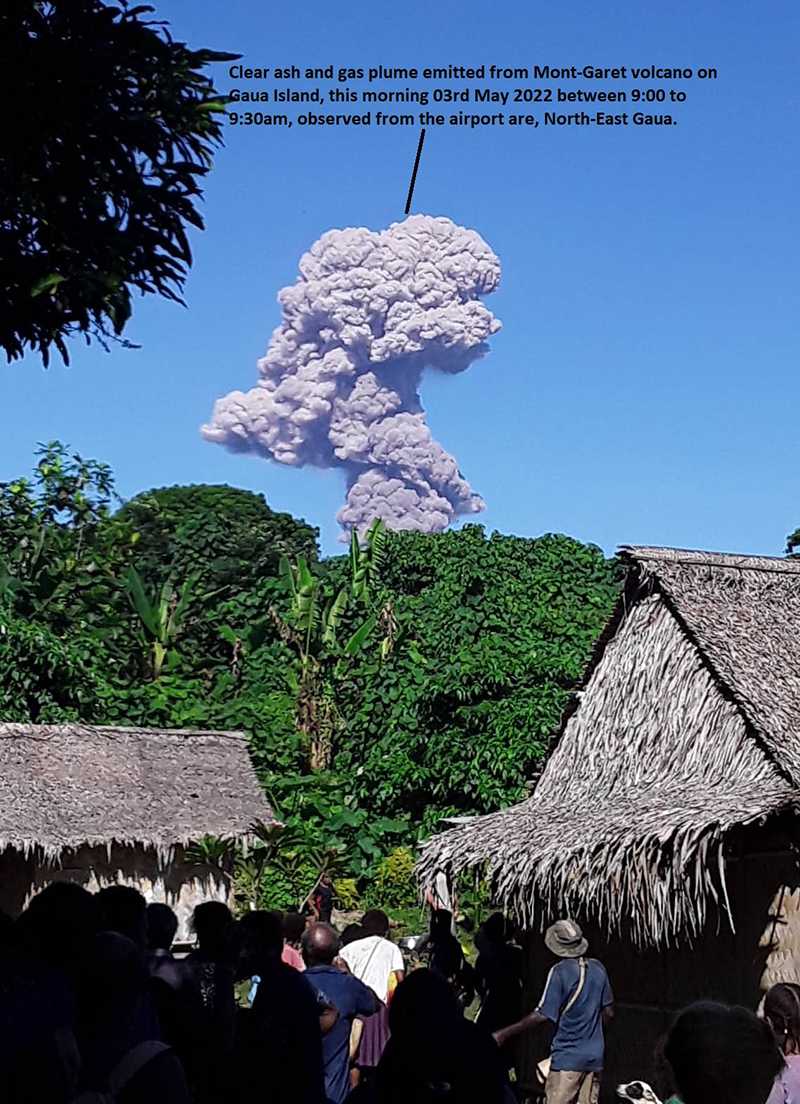 |
Figure 27. Photo of an ash-and-gas plume rising above Mt. Garet at Gaua between 0900-0930 on 3 May 2022. Photo was taken from the NE of the volcano. Courtesy of VMGD. |
Information Contacts: Geo-Hazards Division, Vanuatu Meteorology and Geo-Hazards Department (VMGD), Ministry of Climate Change Adaptation, Meteorology, Geo-Hazards, Energy, Environment and Disaster Management, Private Mail Bag 9054, Lini Highway, Port Vila, Vanuatu (URL: http://www.vmgd.gov.vu/, https://www.facebook.com/VanuatuGeohazardsObservatory/); MIROVA (Middle InfraRed Observation of Volcanic Activity), a collaborative project between the Universities of Turin and Florence (Italy) supported by the Centre for Volcanic Risk of the Italian Civil Protection Department (URL: http://www.mirovaweb.it/); Sentinel Hub Playground (URL: https://www.sentinel-hub.com/explore/sentinel-playground).
2025: March
| April
| May
| June
| July
| August
2022: April
| May
2013: April
| August
2011: October
2010: January
| April
| May
| June
| December
2009: September
| October
| November
| December
The Vanuatu Meteorology and Geohazards (VMGD) reported that unrest continued at Gaua during August. Sulfur dioxide emissions were identified in satellite images on 3 August and steam and/or gas emissions were visible in satellite images rising from the vent during 3-5 and 12 August. The Alert Level remained at 2 (on a scale of 0-5) and the public was warned to stay away from the main cone.
Source: Vanuatu Meteorology and Geohazards Department (VMGD)
The Vanuatu Meteorology and Geohazards Department (VMGD) reported that unrest continued at Gaua during the month of July. Satellite images taken on 2-4, 7, and 9 July showed continuous steam and/or gas emissions from the vent. Sulfur dioxide emissions were detected in satellite images from 28 July. Additionally, a low-level thermal anomaly was recorded in satellite images from 7 and 11 July. The alert level remained at 2 (on a scale of 0-5), and the public was warned to stay away from the main cone.
Source: Vanuatu Meteorology and Geohazards Department (VMGD)
On 27 June the Vanuatu Meteorology and Geohazards (VMGD) reported that unrest continued at Gaua during the month. Steam and/or gas emissions from the vent were visible in satellite images during 9-10 and 17 June and sulfur dioxide emissions were identified during 10-11 June. The Alert Level remained at 2 (on a scale of 0-5) and the public was warned to stay away from the main cone.
Source: Vanuatu Meteorology and Geohazards Department (VMGD)
On 28 May the Vanuatu Meteorology and Geohazards (VMGD) reported that unrest continued at Gaua. Steam and/or gas emissions from the vent were visible in satellite images during the month; sulfur dioxide emissions were identified in images on 19 and 24 May. A moderate-level thermal anomaly was identified in a satellite image on 17 May, indicative of increased surface temperatures. The Alert Level remained at 2 (on a scale of 0-5) and the public was warned to stay away from the main cone.
Source: Vanuatu Meteorology and Geohazards Department (VMGD)
On 24 April the Vanuatu Meteorology and Geohazards (VMGD) reported that unrest continued at Gaua. Sulfur dioxide emissions were identified in satellite images during 2-3 and 6-8 April, and steam and/or gas emissions from the vent were visible in images on 17 April. A low-level thermal anomaly was identified in satellite images on 4, 11, and 19 April, indicative of increased surface temperatures. The Alert Level remained at 2 (on a scale of 0-5) and the public was warned to stay away from the main cone.
Source: Vanuatu Meteorology and Geohazards Department (VMGD)
On 27 March the Vanuatu Meteorology and Geohazards (VMGD) reported that volcanic emissions consisting of steam and/or gas continued to be emitted at Gaua based on satellite images. Sulfur dioxide gas was detected in the emissions on 1 March. The Alert Level remained at 2 (on a scale of 0-5) and the public was warned to stay away from the main cone.
Source: Vanuatu Meteorology and Geohazards Department (VMGD)
On 27 May Vanuatu Meteorology and Geo-Hazards (VMGD) reported that steam emissions continued to be emitted at Gaua based on satellite images and local observers. The steam plumes may have contained volcanic gases. Alert Level remained at 2 (on a scale of 0-5) and the public was warned to stay away from the main cone.
Source: Vanuatu Meteorology and Geohazards Department (VMGD)
On 28 April the Vanuatu Meteorology and Geo-Hazards Department (VMGD) reported ongoing steam-and-gas emissions from Gaua’s Mt. Garet, and warned visitors that they may notice a sulfur odor near the cone. On 3 May local villages, especially in Naveto in the NE part of the island, heard a loud explosion and then saw a dense ash plume rising from Mt. Garet during 0900-0930. The Alert Level remained at 2 (on a scale of 0-5).
Source: Vanuatu Meteorology and Geohazards Department (VMGD)
On 14 August the Vanuatu Geohazards Observatory reported that [volcanic tremor] at Gaua had increased [slightly] since June.... The Alert Level remained at 1 (on a scale of 0-4) [and ash plumes remained likely]. [The last clear report of ash emission was in October 2011. Steam plumes were observed from aircraft on 29 April and from the International Space Station on 31 May 2013.]
Source: Vanuatu Meteorology and Geohazards Department (VMGD)
The Wellington VAAC reported that on 29 April a plume from Gaua was observed from an aircraft. Satellite imagery did not indicate ash.
Source: Wellington Volcanic Ash Advisory Center (VAAC)
Based on a hazards assessment during 17-18 October, the Vanuatu Geohazards Observatory reported that Gaua had been emitting ash since September. Ash fell on western parts of the island. The Alert Level remained at 1 (on a scale of 0-4).
Source: Vanuatu Meteorology and Geohazards Department (VMGD)
Vanuatu Geohazards Observatory reported that the seismic network monitoring Gaua detected volcanic activity in August. Gas plumes were detected by the OMI satellite on 17, 27, and 28 September, and ashfall was reported in the N, E, and W parts of Gaua on 10 October by local authorities. The Alert Level remained at 1 (on a scale of 0-4).
Source: Vanuatu Meteorology and Geohazards Department (VMGD)
On 21 December, the Vanuatu Geohazards Observatory reported that volcanic activity from Gaua had been low since September. Recent observations indicated that the near-vent vegetation and vegetation exposed to trade winds on the W side of the island was again growing. Seismic data showed a decreasing number of events. The Alert Level was lowered to 1 (on a scale of 0-4).
Source: Vanuatu Meteorology and Geohazards Department (VMGD)
Based on information from the Vanuatu Geohazards Observatory, the Wellington VAAC reported that during 16-19 June ash plumes from Gaua rose to an altitude of 3 km (10,000 ft) a.s.l. On 19 June the plume drifted more than 90 km W.
Source: Wellington Volcanic Ash Advisory Center (VAAC)
Based on information from the Vanuatu Geohazards Observatory, the Wellington VAAC reported that on 7 June an ash plume from Gaua rose to an altitude of 3 km (10,000 ft) a.s.l.
Source: Wellington Volcanic Ash Advisory Center (VAAC)
Based on information from the Vanuatu Geohazards Observatory, the Wellington VAAC reported that on 26 May an ash plume from Gaua rose to an altitude of 3 km (10,000 ft) a.s.l.
Source: Wellington Volcanic Ash Advisory Center (VAAC)
Based on information from the Vanuatu Geohazards Observatory and analyses of satellite imagery, the Wellington VAAC reported that during 18-19 and 21-22 May ash plumes from Gaua rose to an altitude of 3 km (10,000 ft) a.s.l. and occasionally drifted W.
Source: Wellington Volcanic Ash Advisory Center (VAAC)
Based on information from the Vanuatu Geohazards Observatory, the Wellington VAAC reported that on 11 May an ash plume from Gaua rose to an altitude of 3 km (10,000 ft) a.s.l.
Source: Wellington Volcanic Ash Advisory Center (VAAC)
On 11 May the Vanuatu Geohazards Observatory reported that field observations of Gaua revealed continued activity during April through the beginning of May. Significant emissions of gas and ash caused damage to vegetation around the crater and in areas on the NW, W, and SW parts of the island, the dominant wind directions. Lahars on the W part of the island were seen in April. Seismic data revealed that tremors had become more frequent since the beginning of the year. The Vanuatu Volcano Alert Level (VVAL) remained at 2 (on a scale of 0-4).
Source: Vanuatu Meteorology and Geohazards Department (VMGD)
Based on information from the Vanuatu Geohazards Observatory, the Wellington VAAC reported that on 29 April and 2 May ash plumes from Gaua were seen on satellite imagery drifting W and NW at an altitude of 3 km (10,000 ft) a.s.l.
Source: Wellington Volcanic Ash Advisory Center (VAAC)
Based on analysis of MODIS satellite imagery and information from the Vanuatu Geohazards Observatory, the Wellington VAAC reported ash plumes from Gaua during 13-16 and 19-21 April. The plumes regularly rose to altitudes of 3 km (10,000 ft) a.s.l. The advisories on 14-15 April noted that the plumes were mostly steam. A spokesman for the Vanuatu Disaster Management Office described the activity as "huge, dark plumes" in an AAP news report.
Sources: Vanuatu Meteorology and Geohazards Department (VMGD); Wellington Volcanic Ash Advisory Center (VAAC); Australian Associated Press
On 7 April, the Vanuatu Geohazards Observatory reported that recent field observations of Gaua confirmed significant changes in activity. Gas plumes were detected daily by satellite images. During the end of March through the beginning of April, ash plumes rose daily to altitudes of 2.1-3 km (7,000-10,000 ft) a.s.l. Explosions were heard in nearby villages. Starting on 3 April villagers living in the N and S parts of the island reported ashfall and saw bombs ejected from Gaua. Based on Vanuatu Geohazards Observatory information, the Wellington VAAC reported that during 8-12 April ash plumes rose to an altitude of 3 km (10,000 ft) a.s.l. Ash plumes were seen on satellite imagery on 11 and 12 April drifting S and SE. The Vanuatu Volcano Alert Level (VVAL) remained at 2 (on a scale of 0-4).
Sources: Vanuatu Meteorology and Geohazards Department (VMGD); Wellington Volcanic Ash Advisory Center (VAAC)
On 29 January, the Vanuatu Geohazards Observatory reported significant changes in Gaua's activity over the previous two weeks. They noted that since 16 January more gas was emitted and multiple explosions produced denser and darker ash plumes. During 22-29 January, the water level in the river to the E that Lake Letas feeds rose 10 cm. Gas-and-ash plumes rose 3 km and drifted S and W. On 24 January nearby villagers reported seeing ejected material from Strombolian activity. The Wellington VAAC reported that on 27 January an ash cloud was seen on satellite imagery. Strong explosions were seen and heard from East Gaua on 29 January. According to the VAAC, the Vanuatu Geohazards Observatory reported that gas-and-ash plumes rose to altitudes of 3 km (10,000 ft) a.s.l. and drifted S and W that same day.
Sources: Vanuatu Meteorology and Geohazards Department (VMGD); Wellington Volcanic Ash Advisory Center (VAAC)
Based on analyses of satellite imagery and pilot observations, the Wellington VAAC reported that on 21 January an ash plume from Gaua rose to an altitude of 3 km (10,000 ft) a.s.l. and drifted S. An ash cloud was seen in satellite imagery on 26 January.
Source: Wellington Volcanic Ash Advisory Center (VAAC)
On 13 January, Vanuatu Geohazards Observatory reported that ash emissions that had become denser and darker on 14 December continued. Ashfall persisted in the W part of the island and satellite imagery showed gas emissions. The Vanuatu Volcano Alert Level (VVAL) remained at 2 (on a scale of 0-4).
Source: Vanuatu Meteorology and Geohazards Department (VMGD)
On 14 December, Vanuatu Geohazards Observatory reported that activity from Gaua during the previous month was characterized by continuous ash emissions accompanied by periodic steam emissions. Ashfall was reported in the W part of the island. Satellite imagery revealed that periods of significant gas emissions were more frequent than during November. Ash emissions during 14-18 December were thicker and darker, and possibly represented a new eruptive phase. Ash plumes continued to drift W and produce ashfall. The Vanuatu Volcanic Alert Level remained at 2 (on a scale of 0-4).
Source: Vanuatu Meteorology and Geohazards Department (VMGD)
The Vanuatu Geohazards Observatory reported that a large explosion from Gaua's Mount Garat on 18 November was followed by high dense ash plumes. Seismicity increased on 25 October and remained significant through 24 November. According to news articles, an explosion that caused ashfall in inhabited areas on 26 November prompted the evacuation of more than 300 people. The Alert Level was raised to 4, the second highest level on a scale of 0-5.
Sources: Vanuatu Meteorology and Geohazards Department (VMGD); Agence France-Presse (AFP)
On 13 October, Vanuatu Geohazards Observatory confirmed that Gaua's Mount Garat was erupting based on fieldwork done by scientists during 3-7 October. Seismic records showed multiple explosions, and a gas flux measurement of 3,000 metric tons of sulfur dioxide was detected on 3 October. The Alert Level was raised to 2 (on a scale of 0-5).
Source: Vanuatu Meteorology and Geohazards Department (VMGD)
According to news articles from 2 October, increased seismicity at Gaua was detected during the previous two weeks. Villagers living nearby reported ashfall and sulfur odors. Both villagers and a pilot flying past Gaua heard explosions. The Alert Level was raised to 1 (on a scale of 0-5).
Source: Radio Australia
Reports are organized chronologically and indexed below by Month/Year (Publication Volume:Number), and include a one-line summary. Click on the index link or scroll down to read the reports.
Increased fumarolic activity; vegetation killed
"An increase in fumarolic activity was noted by VANAIR pilots since April. On 13 July, a detailed aerial survey was conducted over the island during a VANAIR flight. Strong continuous degassing was observed, forming a dense white plume from the SE crater of Mt. Gharat cone. The NW slopes of the cone were largely denuded of vegetation, and the area of the caldera affected by the prevailing SE trade winds had burned vegetation. Due to this increasing activity, we plan to install a seismological station to monitor the volcano as soon as possible.
"Gaua is a composite volcano with a large (8 x 6 km) central caldera occupied by Lake Letas (428 m elev). Mt. Gharat (797 m elev) is an active basaltic cone located near the center of this caldera. Only solfataric activity was recorded from 1868 to 1962 (Mallick and Ash, 1975). Beginning in 1962, central crater explosions with frequent associated ash columns were reported nearly every year until 1977. Information on activity from 1977 to 1990 is scarce, but the volcano was probably quiet, with only minor steam emissions from the SE crater." [BVE reported strong gas emission in mid-1980, a black plume on 9 July 1981, and a brown plume with tephra on 18 April 1982.]
Reference. Mallick, D.I.J., and Ash, R.P., 1975, Geology of the southern Banks Islands: New Hebrides Geological Survey Regional Report, 33 p.
Information Contacts: C. Robin and M. Monzier, ORSTOM, Nouméa, New Caledonia; M. Lardy and C. Douglas, ORSTOM, Vanuatu; C. Mortimer, Dept. of Geology, Mines, and Rural Water Supply, Vanuatu; J. Eissen, ORSTOM, France.
Large steam-and-gas plume observed in mid-July
Activity observed during 14-15 July consisted of a large steam-and-gas plume with a strong SO2 odor. Numerous fumarolic zones covered with yellow sulfur deposits dotted the interior wall of the crater. Fairly strong degassing was taking place from the NW part of the depression. An active fumarole rose from the high interior N part of the crater (T = 119 ± 5°C). The dominant vent sent a plume W from the caldera. The highest temperature of the hot sub-lacustrine fumaroles in the NE part of the lake, in the vicinity of the seismic station, varied between 34 and 65°C. The northernmost attained a temperature of 62°C.
The cone that dominates the NW part of the caldera is composed of five principal craters. The bottom of the northernmost crater is occupied in part by a small shallow pool of greenish water. The active crater is situated on the SE flank of the cone (Mt. Garat).
Information Contacts: Henry Gaudru, C. Pittet, C. Bopp, and G. Borel, Société Volcanologique Européenne, C.P. 1, 1211 Genève 17, Switzerland (URL: http://www.sveurop.org/); Michel Lardy, Centre ORSTOM, B.P. 76, Port Vila, Vanuatu.
Solfatara activity from a crater on Mt. Garat
During a 6-10 September visit by John Seach to the Gaua caldera and the cone of Mt. Garat, of the five craters only Crater A was solfatarically active (figure 1). The W side of the caldera lake was stained yellow by sulfurous mud and emitted a strong SO2 smell. The water temperature was measured at 30.1°C while that of the lake shore mud was 35.1°C. The Mt. Garat cone was largely denuded of vegetation around the craters. Only on the NE side near Crater E was there any regrowth on top. Moss and grasses had regrown on the flanks of the cone, to within 20 m of the E side of Crater E. Fallen trees were scattered around the rims of all five craters.
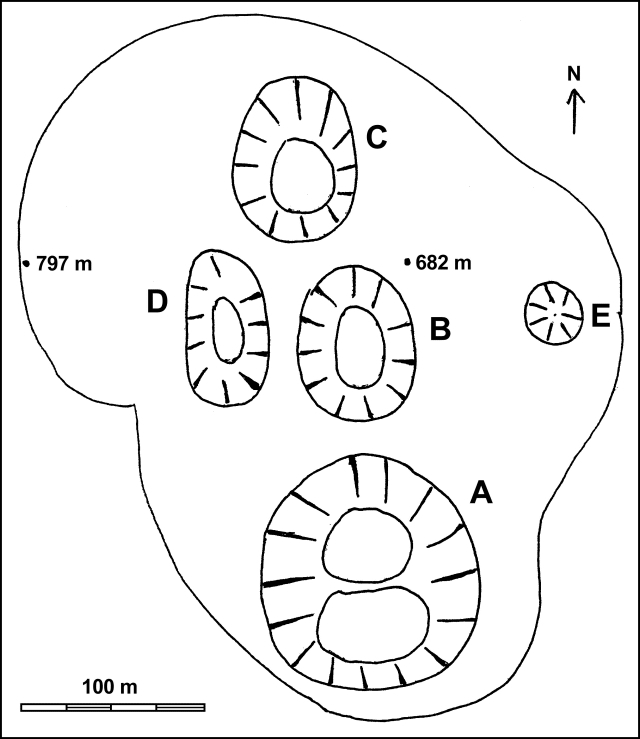 |
Figure 1. Sketch map showing the positions of the five summit craters (A-E) on Mt. Garat within the Gaua caldera (larger solid line), 6-10 September 1999. Courtesy of John Seach. |
Hot, whistling ground with a temperature of 97.6°C was located 20 m S of the Mt. Garat summit, located along the W summit crater rim. Fumarole fields were found both inside and outside of the summit crater rim. Another fumarole field with a temperature of 45.3°C was located ~25 m SW of Crater B. Steam was observed venting ~2 km SW of Crater E but was not approached due to its remote location.
The active Crater A is located on the SE side of the Mt. Garat cone. The E crater wall contained solfataras emitting white vapor with a strong SO2 smell and a temperature of 95.0°C. The solfataras were surrounded by bright yellow deposits, and were active up to the rim of the crater. Solfatara plumes were easily visible from a distance of 5 km on the E shore of the lake. On the SE crater floor, a solfatara constantly vented 102.7°C vapor. Continuous loud high-pressure venting noises originated from along the N and W walls and the W floor of the crater. A pile of blocks coated in yellow deposits rested on the SW floor; mild degassing with a temperature of 99.7°C occurred here. Large blocks 1-2 m in diameter littered the SW wall and floor of the crater. The floor of the crater was split into two levels with the N level being ~5 m below the S level. Large cracks ~3 m deep were present on the S floor. Two 3-m-diameter blocks sat near a brown pond on the low, N-level floor. Rockfalls were heard coming from the E wall. Mild acid rain fell inside the crater, which was mostly filled with white vapor. At times, twin plumes emitting from the crater were visible, rising to a height of 100 m.
Craters B and C are similar in size and depth (figure 2), are denuded of vegetation, contain standing, devastated trees (figure 3), have and flat silty floors with brown ponds. The crater walls contain tuffs, cinders, and scattered blocks. Crater D is the shallowest of the five and has a flat and silty floor containing a shallow brown pond and standing, devastated trees. A 3 m-diameter block was observed on the E wall. Crater E is the smallest crater, ~20 m wide and 20 m deep. It is cone-shaped with blocks and a full cover of vegetation inside.
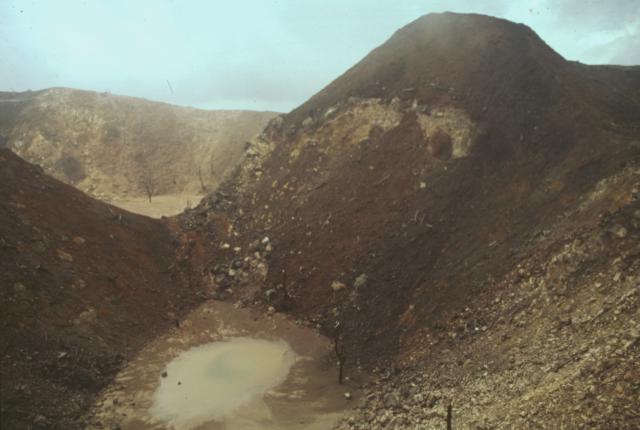 |
Figure 2. View towards the NNW of two inactive craters (B in the foreground, C in the background) in the summit area of Mt. Garat within the Gaua caldera, September 1999. The peak on the right is at 682 m elevation. Courtesy of John Seach. |
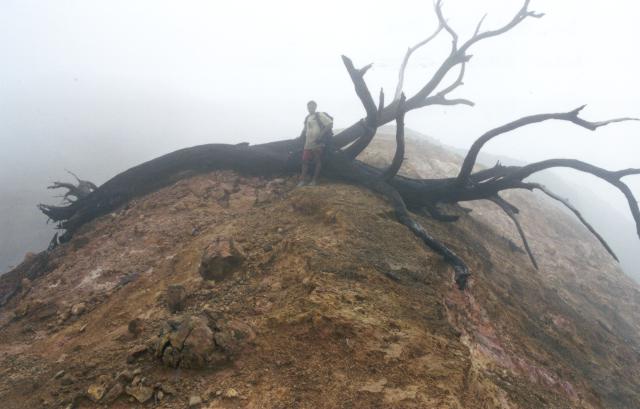 |
Figure 3. Devastated tree at the NW edge of the Mt. Garat cone within the Gaua caldera, 8 September 1999. Courtesy of John Seach. |
Background. The roughly 20-km-diameter Gaua Island, also known as Santa Maria, consists of a basaltic-to-andesitic stratovolcano with a 6 x 9 km summit caldera. Small parasitic vents near the caldera rim fed Pleistocene lava flows that reached the coast on several sides of the island; several littoral cones were formed where these lava flows reached the sea. Quiet collapse that formed the roughly 700-m-deep caldera was followed by extensive ash eruptions. Construction of the historically active cone of Mount Garat (Gharat) and other small cinder cones in the SW part of the caldera has left a crescent-shaped caldera lake named Letas (figure 4). The symmetrical, flat-topped Mount Garat cone is topped by three pit craters.
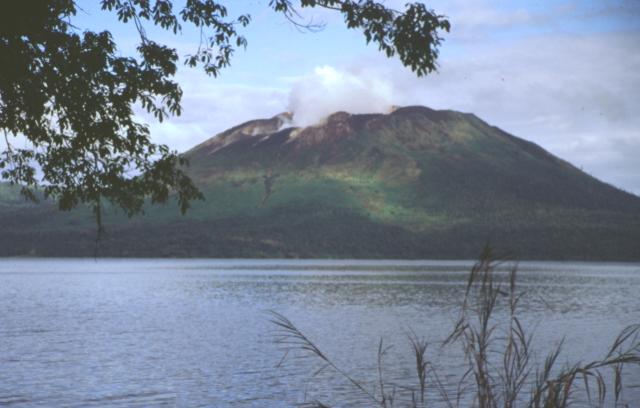 |
Figure 4. View of a fumarolic plume rising from a cone on the SE flank of Mt. Garat in the Gaua caldera, September 1999. Lake Letas is in the foreground. Courtesy of John Seach. |
Only solfataric activity was recorded from 1868 to 1962. Beginning in 1962, central crater explosions with frequent associated ash columns were reported nearly every year until 1977. Information after 1977 is scarce, but steam was reported in mid-1980 and ash plumes were reported in July 1981 and April 1982. Increased fumarolic activity was noted and the NW slopes of the cone were denuded of vegetation in July 1991 (BGVN 16:07). Strong fumarolic activity was continuing in July 1996 (BGVN 21:09).
Information Contacts: John Seach, P.O. Box 16, Chatsworth Island, NSW 2469, Australia.
Eruptions during September-November 2009 cause ashfall and evacuations
An eruption on Gaua Island in September 2009 was described in a report from the Vanuatu Geohazards unit (Vanuatu Department of Geology, Mines, and Water Resources, DGMWR) sent by Esline Garaebiti on 16 November. A later government report and several news reports extended into late November. According to the DGMWR, elevated volcanism in 1973 led to the evacuation of the entire island, which then was home to 600 people; Gaua Island now has more than 3,000 residents. News reports cited no fatalities and by the end of November hundreds of evacuees had moved to the safer E side of the island.
Gaua island, round in shape, is ~20 km in diameter and lies in the N part of the archipelago (Banks Islands, Torba Province), ~ 100 km NE of the closest parts of the island Espiritu Santo (figure 5). The volcano is basaltic to andesitic in composition, and it contains a 6 x 9 km summit caldera that is ~ 700 m deep. Within the caldera sits Mount Garat (Gharat), a prominent cone that supports the summit and the crater complex that is the scene of the eruption. This caldera contains a large, crescent-shaped lake (Lake Letas) (Thery and Thery, 1995).
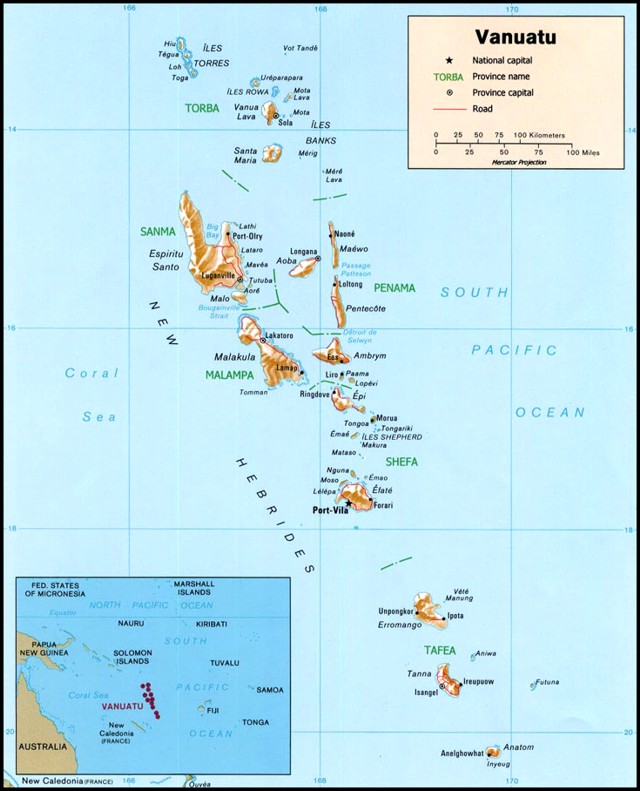 |
Figure 5. Map of Vanuatu (formerly New Hebrides) showing major islands and province names. On this map Gaua island is labeled with its other name, Santa Maria. Inset shows Vanuatu with respect to other islands in this portion of the South Pacific. Ambrym volcano, S of Gaua at the E extent of Malampa province, sits on the island of the same name. Courtesy of Relief Web and from an original map by the Central Intelligence Agency. |
Activity during September-October 2009. Toward the end of September 2009, the island's inhabitants reported both strong degassing from Mount Garat's summit, gradual discoloration of the SW part of Lake Letas, and the strong smell of sulfur in the villages on the W coast. Mont Garat eruptions probably started on 27 September 2009.
Around noon on 29 September 2009 a group of young men hunting close to the volcano witnessed a series of large explosions propelling an umbrella-shaped column of ash up to a height of ~ 3 km. They also noted a small pyroclastic flow limited to the W caldera. Due to prevailing E wind on that day, minor ashfalls were reported on the W part of Gaua. This explosive episode was also detected by the satellite-borne ozone monitoring instrument (OMI ) in measurements of sulfur dioxide (SO2) emissions the same day (figure 6).
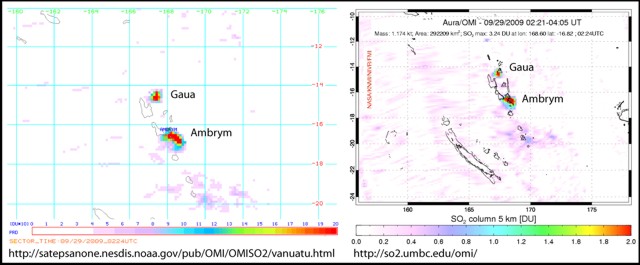 |
Figure 6. SO2 emissions recorded over and around Gaua at 0224 UTC on 29 September 2009 corresponding to the eruptive activity seen in the field. Note the higher, but normal, SO2 emission above Ambrym ~250 km farther S. Courtesy of DGMWR, with data provided by the OMI website. |
During 2-8 October 2009 a DGMWR team visiting the volcano found elevated SO2. They recorded an average flux of ~ 3,000 tons/day. They also noted an increase of the discolored area in Lake Létas (figures 7 and 8). Vegetation on NW part of the volcanic edifice, present in 2007, had been burned by acidic gases released from the volcano (figure 9). The team indicated that gas emissions had begun days to weeks earlier to cause such damage.
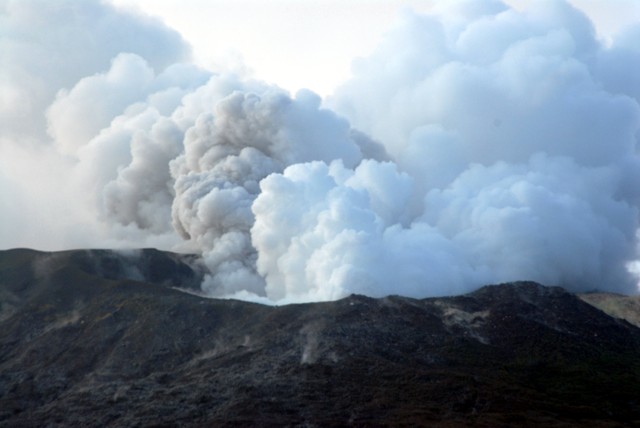 |
Figure 7. Continuous degassing from the summit crater of Gaua. There are at least three active vents in the crater, one of which released a combination ash and gas. Photo taken 6 October 2009, courtesy S. Wallez. |
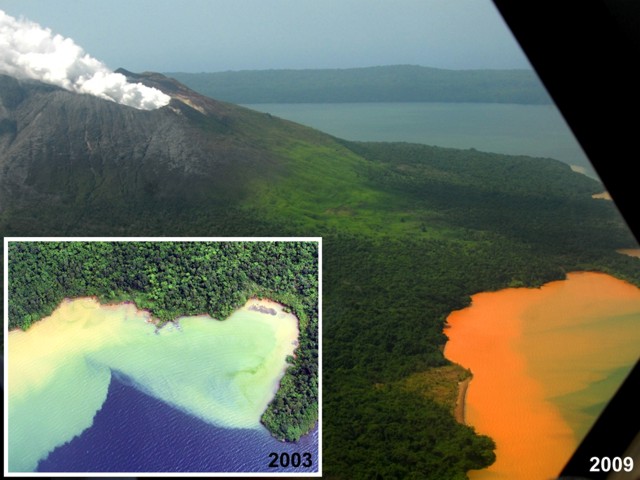 |
Figure 8. Strong discoloration was present at Gaua in the SW part of Lake Létas in 2003 (inset) and in 2009 (background). The 2003 photo showed discoloration with shades of green to pale yellow. The 2009 photo showed intense red-orange discoloration. Photos courtesy DGMWR (2003) and S. Wallez (2009). |
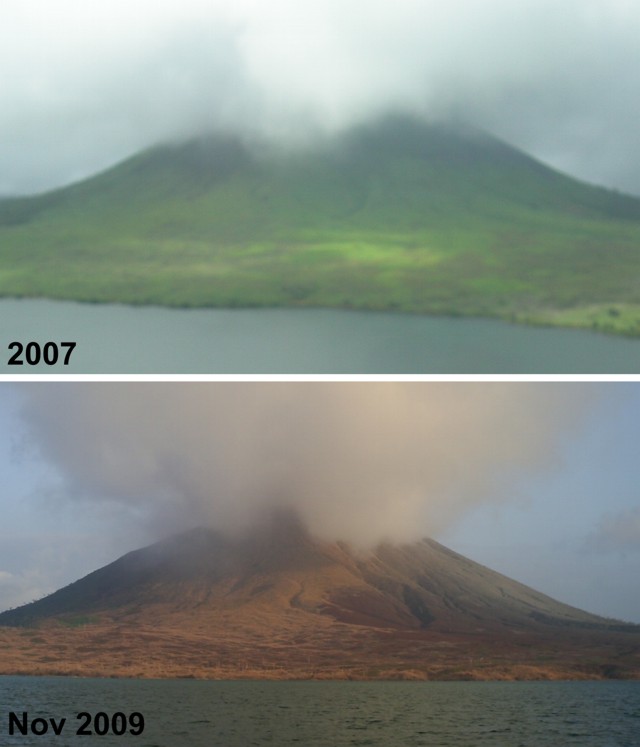 |
Figure 9. Views of Gaua's NW flank taken in the year 2007 and in November 2009, highlighting the almost complete loss of green vegetation. Photos courtesy of P. Bani, Research Institute for Development (IRD). |
The team installed a seismic station on 2 October 2009 to help track the volcanic activity. Many explosions were recorded during 10-11 October (figure 10), and on 13 October the seismic signals suggested strong volcanism as well as continuous degassing. Consequently the Alert Level was raised to 2 (on a scale of 0-4), advising the population not to venture close to the volcano and to stay out of potential drainages that might serve as flow paths.
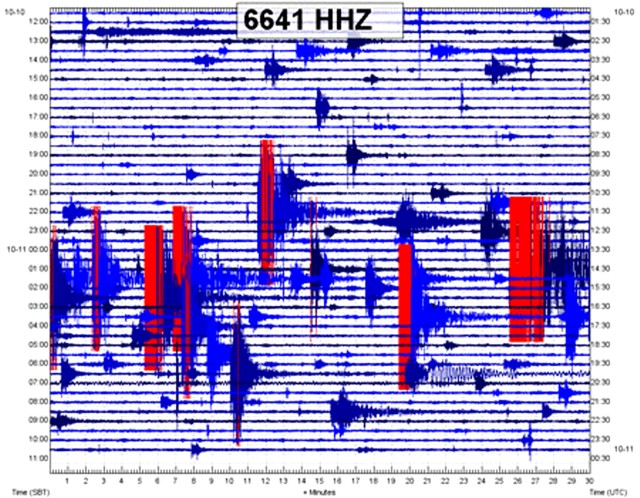 |
Figure 10. Seismic record from the Gaua seismic station illustrating that many explosions occurred between 1200 on 10 October 2009 and 1200 on 11 October 2009. Courtesy of DGMWR. |
Activity during November 2009. From the end of October to around 4 November, witnesses noted explosions with strong ash emissions (figure 11). A substantial ash plume, both reported by observers and confirmed by seismic recording, occurred on 31 October 2009. This was followed by ashfall in the NW part of the island, where 53 inhabitants were relocated to safer areas.
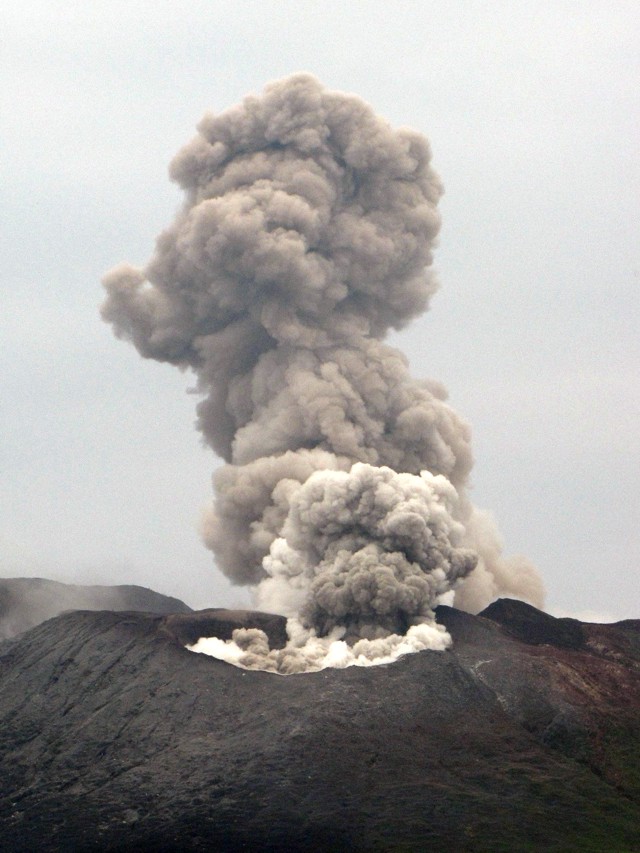 |
Figure 11. Plumes released at Gaua on 3 November 2009. All three active vents emitted plumes, one a vigorous ash plume. Photo courtesy of Sylvain Todman, DGMWR. |
Gaua Bulletin No. 3 from DGMWR, dated 24 November 2009, reported a large explosion around 1400 on 18 November. The explosion produced very dense and high ash columns that blew W. The ash plumes from the 31 October and 18 November events photographed from the airport but were apparently not assessed for plume heights. Activity remained significant through at least 24 November. DGMWR recommended alert level 2 and noted the persisting danger of ashfalls and mudflows.
News media reports and other data. Radio Australia News reported on 2 October 2009 that the last time the hazard concern was so high was in 1974 when volcanism led to inhabitants evacuated from the island for months. According to Radio Australia News in an interview with Charles Bice (one of the Gaua Island community headmen), the early explosions had been heard by both residents and pilots on Air Vanuatu flights. During September-October, residents also found ash on their cabbage crops.
A 26 November Agency France-Presse report indicated that the Red Cross was dispensing containers and water purification tablets. It said the public had suffered respiratory problems and diaharrea. Rural water supplies often come from surface water, or from rainwater collected from areas such as roofs, and then stored in open drums or cisterns. These sources are often vulnerable to contamination from ashfall.
A Vanuatu newspaper article by Len Garae printed after 18 November noted that by then the first phase of evacuation, aided by three ships, had taken ~ 159 villagers from the high-risk zone on the W side of the island to the E side of the island. The article stated that a larger eruption would mean evacuation of an additional 200 villagers on the island's W shoreline. An even more vigorous eruption would require inter-island ships to move residents to other islands.
A Vanuatu news article emphasized three new explosion on 26 November and one on 27 November. It said that the additional villagers on the W side of the island were in the process of evacuating. Although yet to be confirmed elsewhere, the article said "the entire village of 'Waterfall' was destroyed by landslides."
MODIS thermal alerts were absent during the 2009 eruption.
A video shot in January 2003 from a low-flying helicopter showed fumarolic plumes rising from the summit craters. The video is available on YouTube from Geoff Mackley (http://www.youtube.com/user/geoffmackley).
Reference. Thery, L., and Thery, J., 1995, Bathymetrie du lac Letas lle de GAUA (Banks) (Vanuatu), Port-Vila, Vanuatu: Institut Francais de Recherche Scientifique pour le Developpement en Cooperation, 1995. 17 p. : ill., maps; 28 cm. Series?Sciences de la terre geologie-geophysique ; no. 10 (in French and English)
Information Contacts: E. Garaebiti, S. Todman, C. Haruel, D. Charley, D. Nakedau, J. Cevuard, and A. Worwor, Department of Geology, Mines and Water Resources (DGMWR), Geohazards Unit, Vanuatu (URL: http://www.vmgd.gov.vu/vmgd/); P. Bani, Institut de recherche pour la developpment (IRD), Noumea, New Caledonia (URL: http://www.ird.nc/); OMI (Ozone Monitoring Instrument) Sulfur Dioxide Group, Joint Center for Earth Systems Technology, University of Maryland Baltimore County (UMBC), 1000 Hilltop Circle, Baltimore, MD 21250, USA (URL: https://so2.gsfc.nasa.gov/); Relief Web (URL: https://reliefweb.int/); Agence France-Press (AFP) (URL: http://www.afp.com/); Radio Australia News (URL: http://www.radioAustralianews.net.au); The Independent/L'Indépednant, Vanuatu (URL: http://www.independent.vu/); Geoff Mackley, PO Box 12926, Penrose, Auckland 1135, New Zealand (URL: http://www.youtube.com/user/geoffmackley, http://www.geoffmackley.com/).
Significant ashfall through early January 2010
Beginning on 29 September 2009, Gaua produced a series of eruptions from Mount Garat, a cone in the SW portion of its caldera. The eruptions generated a small pyroclastic flow, thick ash plumes, and elevated sulfur dioxide (SO2) levels. Our last report (BGVN 34:10) described these events through November 2009. This new report carries events into February 2010, and discusses ongoing eruptions and stress on residents. We also present a December 2009 hazard map created by the Vanuatu Department of Geology, Mines and Water Resources (DGMWR) and the New Zealand GNS Science.
A news article on 29 November (Radio New Zealand International) quoted Brad Scott (New Zealand GNS), "Downwind ashfall is falling on the forest, it's falling on the villages, it's falling on the gardens. In some places it's already started to create a desert, in other places it's only light ashfall. But people are suffering from sore eyes, throat inflammation, and [intestinal] problem[s] ...."
The health aspects of the eruption were also noted in the Vanuatu Daily Post on 24 November 2009, stating that the drinking water in the affected area was "contaminated with ash and many of the villagers depend only on spring water by the sea for cooking and drinking. Island cabbages and other greens must be thoroughly washed before they are cooked."
According to the DGMWR and Brad Scott, Gaua continued to erupt in December 2009 and early January 2010, with even stronger explosions than those previously described (BGVN 34:10). According to DGMWR, this eruptive phase was different from previous Gaua eruptions, with denser and darker plumes (figure 12). The Alert Level remained at 2 (on a scale of 0-4).
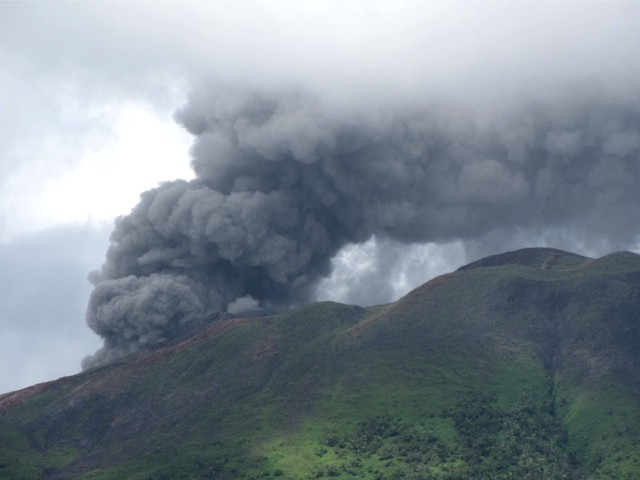 |
Figure 12. Photo of an ash plume from Gaua taken on 31 December 2009, viewed from the caldera rim. Courtesy of Vanuatu Department of Geology, Mines and Water Resources (DGMWR). |
Ash emissions and ashfall were significant (figure 13). Beginning on 14 December and continuing at least through 8 January 2010, the emission of fine ash from Gaua had been continuous, with ashfall blown W (figure 14). Chemical analysis of the ashfall carried out by York University in England found high concentrations of toxic chemicals. As a result of the ashfall, 257 people were relocated to the upwind side of the island during the last week of November.
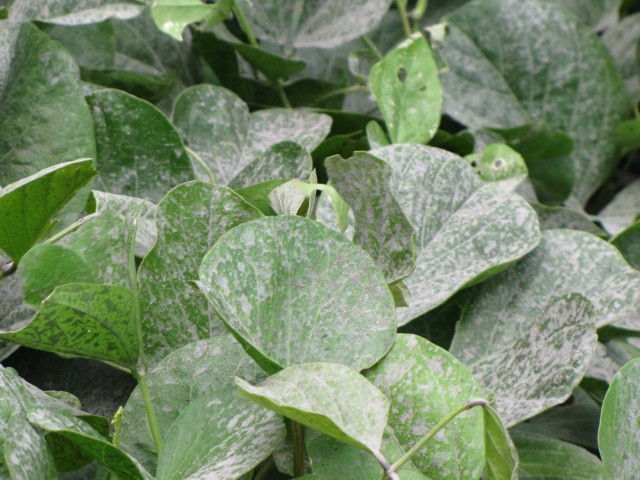 |
Figure 13. Ash from Gaua on 29 December 2009 that fell on plants in Quetekaveau village. Courtesy of DGMWR. |
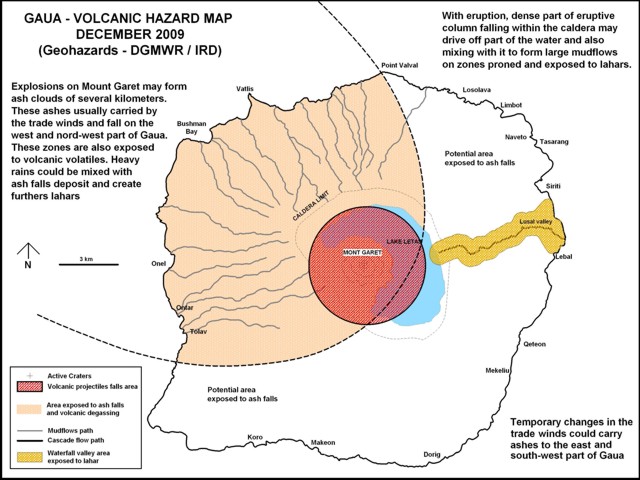 |
Figure 14. Volcanic hazards map of Gaua illustrating the caldera's topographic margin, the active inner cone (Mount Garet), and Lake Letas, which curves around the N to E to S sides of the caldera floor. The zones 1 (red), 2 (orange), 3 (yellow), and 4 (white or unshaded) are discussed in text. Modified from DGMWR Bulletin Number 4 (14 December 2009). |
The 3-km inner circle centered on the active vent (figure 14) represents the area of greatest risk (1, red zone), a region where volcanic projectiles are likely and access is officially banned. A second area of risk lies inside a curve around Mount Garet and surrounding the island's NW side (2, orange zone), a region so delineated because of likely distribution of ongoing plumes by trade winds. This zone is considered exposed to ash and gas; with heavy rains, the water could mix with tephra to create lahars.
A third area of risk (3, yellow zone) trends E-W and forms an elongate region that follows the caldera lake's established drainage along the Lussal valley. Floods and lahars are indicated here. Note the settlements of Lebal (on the E coast directly S of the river mouth) and Siriti (~3 km N of Lebal). A sudden eruption could send material into the lake, and the resulting displaced water or water-and-ash mixture would surge down the Lussal river drainage. The villages on the other part of the island (4, white or unshaded) could receive light ashfall, should the wind direction temporarily change.
An 18 January 2010 satellite image (taken by the ozone monitoring instrument) quantifying emissions from Gaua showed the persistence of significant gas flux (figure 15). These emissions became more frequent in December, although the daily SO2 gas flux stayed steady around 3,000 metric tons per day.
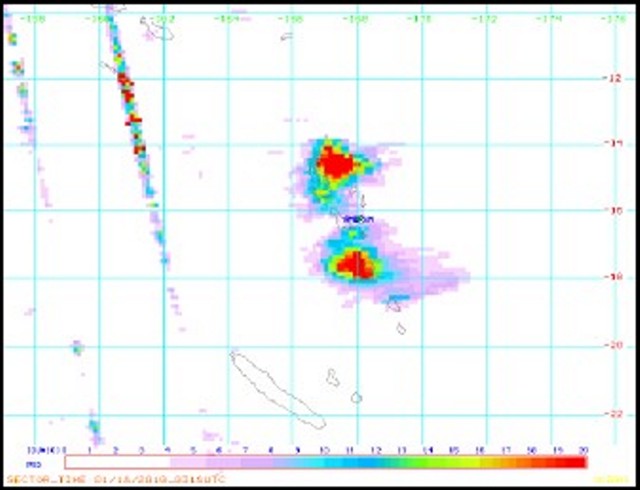 |
Figure 15. OMI satellite data showing SO2 degassing over Ambrym and Gaua volcanoes on 18 January 2010. Courtesy of OMI Sulfur Dioxide Group and DGMWR. |
Based on analyses of satellite imagery and pilot observations, the Wellington VAAC reported that at 1300 on 21 January an ash plume rose to an altitude of 3 km and drifted S. They also detected another ash cloud on MODIS satellite imagery on 26 January blowing SE at 3 km altitude.
DGMWR Bulletin Number 7 (dated 29 January 2010) reported that more gas had been emitted since 16 January 2010, followed by multiple explosions with thicker and darker ash plumes. These plumes rose to more than 3 km high and blew towards surrounding villages in the S and W (figures 15 and 16). On 24 January 2010 villagers witnessed strong Strombolian activity.
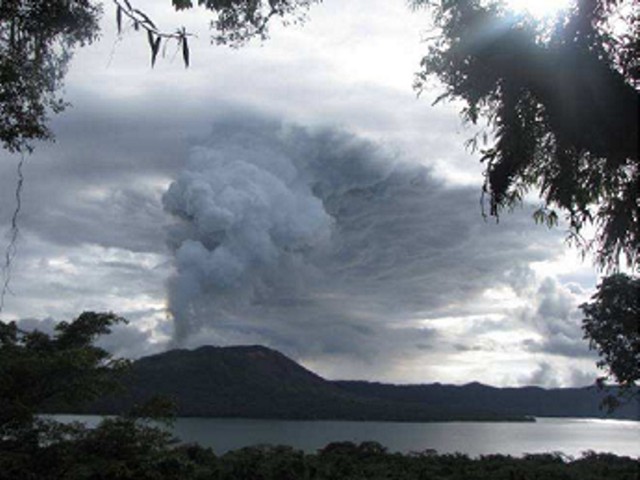 |
Figure 16. Ash and gas cloud emission directed to the S part of Gaua Island on 23 January 2009. Courtesy of DGMWR. |
The Wellington VAAC reported that on 27 January an ash cloud was seen on satellite imagery. Strong explosions were seen and heard from East Gaua on 29 January. According to the VAAC, the Vanuatu Geohazards Observatory reported that gas-and-ash plumes to altitudes of 3 km altitude that drifted S and W on 29 January and 4 February.
As of 1 February 2010, the hazard status was at Level 2 on the Vanuatu Volcano Alert Level (VVAL) (table 1), but the activity was still increasing. Visitors were advised to avoid approaching the volcano.
Table 1. The hazard status of the crisis on Gaua is addressed with a five-stage scale called the Vanuatu Volcanic Alert Level (VVAL). Courtesy of Vanuatu Geohazards Observatory.
| Hazard Level | Description |
| Level 0 | Normal low-level activity. |
| Level 1 | Increased activity, danger near crater only. |
| Level 2 | Moderate eruptions, danger close to the volcano vent, within parts of Volcanic Hazards Map Red Zone. |
| Level 3 | Large eruption, danger in specific areas within parts of Volcanic Hazards Map Red and Yellow Zones. |
| Level 4 | Very large eruption, island-wide danger (including areas within Red, Yellow and Green Zones). |
The MODIS/MODVOLC satellite thermal alerts website showed a 1-pixel alert at 2225 on 21 January 2010, the only alert during the previous year.
Information Contacts: E. Garaebiti, S. Todman, C. Haruel, D. Charley, D. Nakedau, J. Cevuard, and A. Worwor, Department of Geology, Mines and Water Resources (DGMWR), Geohazards Unit, Vanuatu (URL: http://www.vmgd.gov.vu/vmgd/); Brad Scott, Volcano Surveillance, GNS Science, Wairakei Research Centre, Private Bag 2000, Taupo 3352, New Zealand (URL: http://www.gns.cri.nz/); OMI (Ozone Monitoring Instrument) Sulfur Dioxide Group, Joint Center for Earth Systems Technology, University of Maryland Baltimore County (UMBC), 1000 Hilltop Circle, Baltimore, MD 21250, USA (URL: https://so2.gsfc.nasa.gov/); Vanuatu Daily Post (URL: http://www.dailypost.vu/); Radio New Zealand International (URL: http://www.mzi.com/); Wellington Volcanic Ash Advisory Centre, Meteorological Service of New Zealand Limited, 30 Salamanca Road, Kelburn, PO Box 722, Wellington, New Zealand(URL: http://vaac.metservice.com/vaac/); Hawai'i Institute of Geophysics and Planetology (HIGP) Thermal Alerts System, School of Ocean and Earth Science and Technology (SOEST), Univ. of Hawai'i, 2525 Correa Road, Honolulu, HI 96822, USA (URL: http://modis.higp.hawaii.edu/).
Significant emissions of gas and ash through 19 June 2010
Beginning in September 2009, eruptions at Gaua included emissions with heavy ashfall, a small pyroclastic flow, and strong Strombolian activity. Eruptions were also accompanied by strong and continuous degassing, and elevated SO2 levels (BGVN 34:10 and 34:12).
The previous report discussed activity through 1 February 2010. This report covers activity between 2 February 2010 and 19 June 2010. However, no information was available for February or March from the Vanuatu Geohazards Observatory (VGO). Satellite thermal alerts from the MODVOLC system occurred on 28 March and 6 April (both one pixel).
In early April 2010 activity increased. The VGO reported that the ash plumes became thicker and higher (figure 17) and rose daily to altitudes of 2.1-3 km. Starting on 3 April, villagers living in the N and S parts of the island reported ashfall and frequently saw volcanic bombs ejected. Explosions were heard in nearby villages. Tremor counts after 1 January 2010 increased with time at least through 7 May (figure 18).
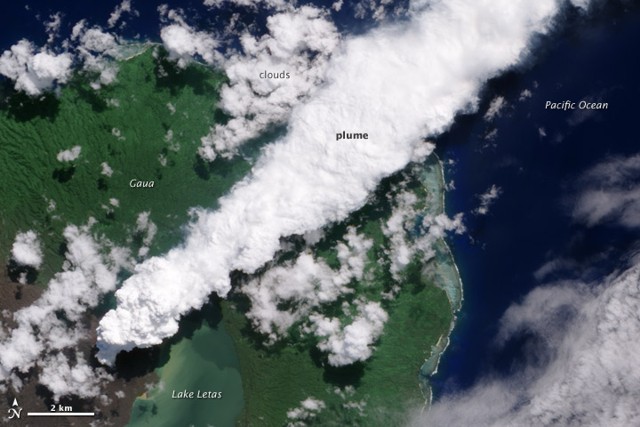 |
Figure 17. Satellite image of a dense steam-rich ash plume from Guau blowing directly NE on 24 April 2010. The steam is brighter white than the surrounding lower-altitude clouds. Vegetation is green, as is Lake Letas. Vegetation to the S and W of the volcano, damaged by ash and acidic volcanic gases, is dark gray-brown. Image taken by the Advanced Land Imager aboard NASA's Earth Observing-1 (EO-1) spacecraft. Courtesy NASA Earth Observatory. |
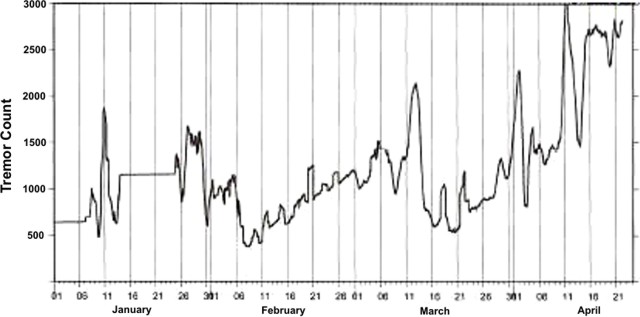 |
Figure 18. Tremor counts at Gaua between 1 January 2010 and about 22 April 2010. Courtesy of VGO. |
According to a 21 April news account the Red Cross disaster management officer in Vanuatu, Augustin Garae, told Radio New Zealand International that the fumes and ashfall had become a health hazard, with ash and acid rain affecting food crops and contaminating the water. News media on 19 April reported that Vanuatu government officials had made preparations to evacuate the approximately 3,000 residents of Gaua Island, who were threatened by ash, poisonous gases, and landslides.
On 11 May, the VGO reported that field observations revealed continued activity during April through the beginning of May. Significant emissions of gas and ash caused damage to vegetation around the crater and in areas on the NW, W, and SW parts of the island, the dominant wind directions. Lahars on the W part of the island were seen in April. Seismic data revealed that tremors had become more frequent since the beginning of the year. The VGO has advised visitors to stay away from the restricted area, especially within 3 km zone around the volcano.
Based on information from the VGO and satellite imagery, the Wellington VAAC reported ash plumes from Gaua on 8-16 April, 19-21 April, 29 April, 2 May, 11 May, 18-19 May, 21-22 May, 26 May, 7 June, and 16-19 June that all rose to an altitude of 3 km. On 19 June, the plume drifted more than 90 km W. The advisories on 14-15 April noted that the plumes were mostly steam. A spokesman for the Vanuatu Disaster Management Office described the activity as "huge, dark plumes" in a news report.
Information Contacts: E. Garaebiti, S. Todman, C. Haruel, D. Charley, D. Nakedau, J. Cevuard, and A. Worwor, Vanuatu Geohazards Observatory (VGO), Department of Geology, Mines and Water Resources (DGMWR), Vanuatu (URL: http://www.vmgd.gov.vu/vmgd/); Wellington Volcanic Ash Advisory Centre, Meteorological Service of New Zealand Limited, 30 Salamanca Road, Kelburn, PO Box 722, Wellington, New Zealand (URL: http://vaac.metservice.com/vaac/); Hawai'i Institute of Geophysics and Planetology (HIGP) Thermal Alerts System, School of Ocean and Earth Science and Technology (SOEST), Univ. of Hawai'i, 2525 Correa Road, Honolulu, HI 96822, USA (URL: http://modis.higp.hawaii.edu/); Sydney Morning Herald (URL: http://news.smh.com.au/); Radio New Zealand International (URL: http://www.rnzi.com/).
Drops in both tremor and caustic effects on vegetation after mid-2010
The Vanuatu Geohazards Observatory (VGO) report of December 2010 noted seismicity activity and gas emissions during the period from September 2010 through 21 December 2010. This follows the more substantial emissions reported through 19 June 2010. The Ambrym report figure in BGVN 36:05 showing a 2 August 2010 satellite image of the region, includes a plume from Gaua visible for at least 80 km.
The geologic map of Vanuatu (figure 19), formerly called the New Hebrides islands, is centered ~2,200 km N off the New Zealand coast and ~2,100 km NE off the coast of Australia (figure 19). Gaua is sometimes referred to as residing on the island of Santa Maria. This island is also sometimes labeled Gaua, and volcano's topographic high is sometimes called Mont-Geret. The map locates the archepelago's major islands, volcanoes, igneous and metamorphic rocks. Most of the Pliocene and Quaternary islands have been formed by volcanic growth, with uplift in a few cases. Those islands containing older Tertiary rocks resulted from differential elevation of fault bounded blocks (Mitchel and Warden, 1971). Map revised from one on the VGO web site.
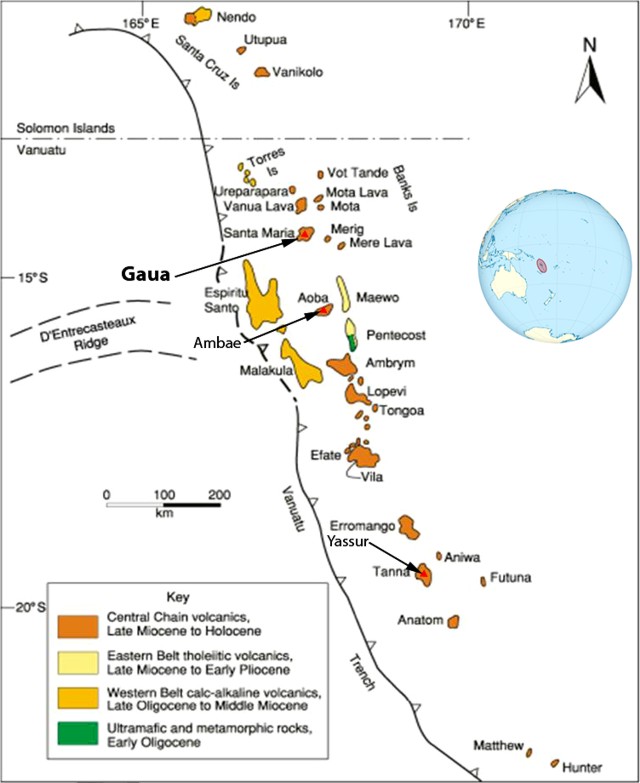 |
Figure 19. Geologic map of Vanuatu. Gaua island is labeled with its alternate name, Santa Maria (Gaua volcano is also called Mont-Geret). The volcano Ambae is situated on Aoba island; the volcano Ambrym, on Ambrym island; and the volcano Yasur, on Tanna island. The key shows basic igneous and metamorphic rock units. Those islands containing older Tertiary rocks have resulted from differential elevation of fault bounded blocks (Mitchel and Warden, 1971). Map revised from one on the VGO web site. |
Based on VGO information, the Wellington VAAC reported that on 7 and 16-19 June 2010 an ash plume from Gaua rose to an altitude of ~3 km. On 19 June the plume drifted more than 90 km W but later plume dispersal and emissions were obscured on satellite imagery.
Late 2010 observations on Gaua indicated renewed growth of the vegetation near the volcano's vent and on the island's leeward W side. That area had suffered damage during April-May 2010 due to gas emissions (BGVN 35:05). These observations suggested diminished emissions from the volcano.
Since September 2010, seismic monitoring showed decreasing numbers of counts of volcano-related earthquakes (figure 20). The Alert Level of Gaua volcano was lowered to Level 1 in December 2010. No satellite thermal alerts were measured by MODVOLC during 6 April 2010 through late July 2011.
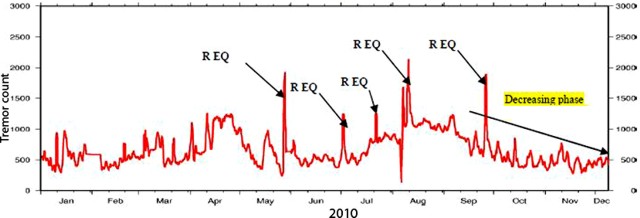 |
Figure 20. Gaua volcanic tremor counts recorded for the year 2010. REG adjacent to large pulse traces identify regional earthquakes and/or earthquakes close to Gaua unrelated to volcanic activity. Our previous report (BGVN 35:05) presented a similar plot through 22 April 2010. Courtesy of VGO. |
Reference. Mitchel, AH and Warden, AJ, 1971, Geological evolution of the New Hebrides island arc, Journal of Geological Soc. of London, October 1971, 127, p. 501-529 (DOI: 10.1144/gsjgs.127.5.0501)
Information Contacts: Vanuatu Geohazards Observatory (VGO), Department of Geology, Mines and Water Resources (DGMWR), Vanuatu (URL: http://www.vmgd.gov.vu/vmgd/); MODIS/MODVOLC thermal alerts satellite system, Hawai'i Institute of Geophysics and Planetology (HIGP) Thermal Alerts System, School of Ocean and Earth Science and Technology (SOEST), Univ. of Hawai'i, 2525 Correa Road, Honolulu, HI 96822, USA (URL: http://modis.higp.hawaii.edu/).
Ongoing eruptions from Mt. Garat during 2011
Gaua awoke in 2009 (BGVN 34:10) and has continued sporadic eruptions and seismic unrest into 2012. Our last Bulletin report discussed events at Gaua (and island of the same name) into late 2010, with some later seismic and thermal data (BGVN 35:05). A new report from the Vanuatu Geohazards Observatory (VGO) issued in October 2011 contains a new hazards map (figure 21).
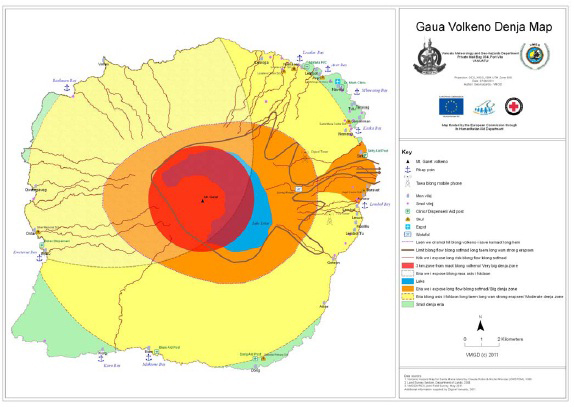 |
Figure 21. An updated hazard map for Gaua ("Gaua Volkeno Denja Map" in local parlance). Note the crescent-shaped Lake Letas (blue, and overlain with other colors) wrapping around the N and E sides of the active center's ~800-m-tall summit (Mt. Garat). An earlier map appeared in BGVN 34:12. From the VGO Bulletin issued on 26 October 2011. [Note: This image is very low resolution; a higher resolution version of this map and explanation of symbols will be posted if it becomes available.] |
In addition, a new geosciences publication, Globe Magazine, contained photos (figures 22 and 23) and a brief discussion of Gaua's behavior as late as early 2010 (Scott and others, 2010). The report included the following statements on events at the volcano and efforts to bolster instrumental observations.
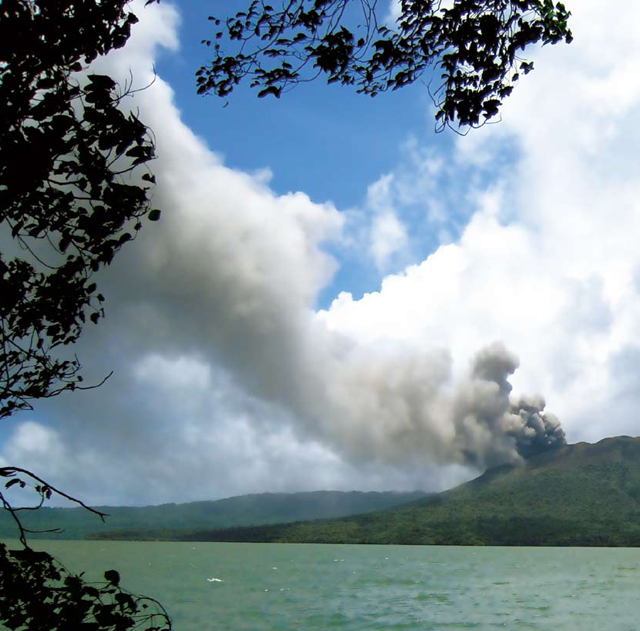 |
Figure 22. Undated photo of Gaua in the course of a modest ash-bearing eruption at Mt. Garat. The water in the foreground is Lake Letas, which surrounds the N to SE flanks. From Scott and others (2010). |
 |
Figure 23. Vanuatu Geohazards Unit staff member Jimmy Loic checking one of the GNS Science seismic stations installed on Gaua. From Scott and others (2010). |
"Mount Garet [Garat] on Gaua, a 20-km-diameter island 400 km N of the capital Port Vila, started erupting in September 2009, and by late November there were signs that eruptions might become larger and more explosive. Because of its remoteness and the vulnerability of its population of about 3,000 to volcanic ash, the Vanuatu government decided immediate action was needed. The main concerns are volcanic ash contaminating water supplies and anxiety caused by the erratic behaviour of the volcano.
"The volcano has been erupting mostly steam and fine ash. However, in early 2010 several more explosive eruptions threw scoria bombs up to 2 km from the crater. The ash has been falling mostly on villages and fields W and NW of the volcano, and more than 200 people living in those areas have been relocated.
"Based on their observations and the recent history of eruptions on Gaua, volcanologists from GNS Science and Vanuatu concluded that the eruptive activity is most likely to continue for some months at a level similar to that seen so far. The New Zealand government's international aid and development agency, NZAID, has funded the visits by GNS Science. NZAID has subsequently asked GNS Science to provide the Vanuatu government with three seismographs and to train local staff in their use, and in data analysis and interpretation."
2011 activity. VGO reported on 10 October 2011 that data collected by the Gaua monitoring system showed the existence of earthquakes caused by volcanic activity in August 2011. OMI satellite images clearly showed degassing during 17 and 27-28 September 2011, indicating ongoing activity. According to VGO, on 10 October local authorities reported ashfall on the NE and W sides of Gaua Island.
VGO issued a report on 26 October 2011 that described an activity assessment made during 17-18 October 2011. The report confirmed Gaua's ash emissions since September 2011, with ash distribution dictated by trade winds. Seismic data suggested eruptive activity since June 2011, but the intensity of the activity was lower than during 2009-2010.
VGO indicated that two scenarios were envisaged for Gaua. Activity could intensify with little or no warning and then cease. On the other hand, activity could continue more regularly, causing ashfall in the neighboring communities, especially those on the W side of the island that are exposed to trade winds. With this analysis, the Alert Level of Gaua remained at level 1 (on a scale from 0-4), meaning that activity had slightly increased, with the risk remaining near the volcano crater, within the red zone (see figure 21).
Reference. Scott, B., Jolly, A., Sherburn, S., and Jolly, G., 2010, Expert advice on Vanuatu volcano, Globe Magazine, Issue 1 (July 2010); pp. 12-13. Published by GNS Science (New Zealand; Editor, John Callan; Chief Executive, Alex Malahoff); ISSN 1179-7177 (Print); ISSN 1179-7185 (Online)
Information Contacts: Vanuatu Geohazards Observatory (VGO), Department of Geology, Mines and Water Resources (DGMWR), Vanuatu (URL: http://www.vmgd.gov.vu/vmgd/).
Hazard status raised; emissions continue into 2013; plume observed from above
In our June 2012 Bulletin report (BGVN 37:06), we noted ongoing eruptions from Gaua during much of 2011. On 5 December 2011, the Vanuatu Meteorology and Geohazards Department (VMGD) changed the status of Gaua volcano from a dormant to an active volcano.
The Wellington Volcanic Ash Advisory Center (VAAC) reported that on 29 April 2013 a plume from Gaua was observed from an aircraft. Satellite imagery did not indicate ash. Astronauts on the International Space Station saw and photographed Gaua's E-blowing plume on 31 May 2013 (figure 24). During the year ending in mid-July 2013, there were no MODVOLC thermal alerts.
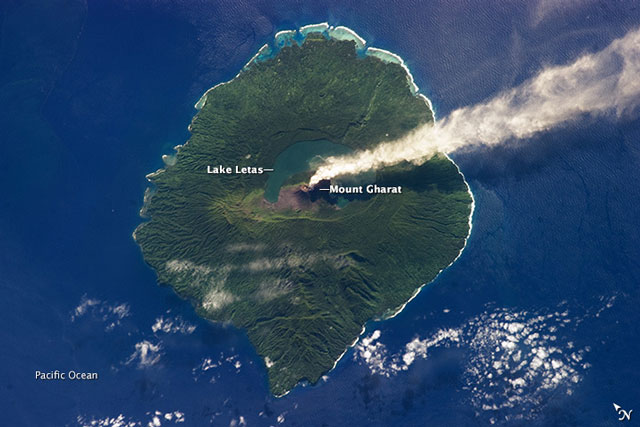 |
Figure 24. Steam plume from Gaua volcano as photographed from the International Space Station on 31 May 2013. For scale, the island is 20 km in diameter. Note N arrow at lower right. Astronaut photograph ISS036-E-5647, taken on Expedition 36 with a Nikon D3S digital camera using a 400 mm lens, and is provided by the ISS Crew Earth Observations and the Image Science & Analysis Laboratory, Johnson Space Center. The image has been cropped and enhanced to improve contrast, and lens artifacts have been removed. Original caption by William L. Stefanov, Jacobs/JETS at NASA JSC. |
The Alert Level remained at level 1 (out of 4) signifying that changes in activity could occur without, or with little, warning. VMGD continued this status through at least mid-August 2013, although they noted a slight increase in tremor since their June report. This status indicates that ashfalls will continue to be expected in areas exposed to trade winds. Strong degassing of the volcano could be accompanied by acid rainfall.
Information Contacts: Vanuatu Geohazards Observatory (URL: http://www.vmgd.gov.vu/vmgd/); Vanuatu Meteorology and Geohazards Department (URL: http:// http://www.meteo.gov.vu/); Wellington Volcanic Ash Advisory Center (VAAC) (URL: vaac.metservice.com); and Hawai'i Institute of Geophysics and Planetology, MODVOLC Thermal Alert System, School of Ocean and Earth Science and Technology (SOEST), Univ. of Hawai'i , 2525 Correa Road, Honolulu, HI 96822 USA (URL: http://modis.higp.hawaii.edu/).
Ash plumes visible in November 2021 and April 2022
Gaua Island in Vanuatu, also known as Santa María, is roughly 20 km in diameter and consists of a stratovolcano with a 6 x 9 km-wide summit caldera. Mount Garet (also known as Garat) in the SW part of the caldera is the active cone, with three pit craters across the summit area, and is the dominant site of eruptions recorded since July 1962. The crescent-shaped Lake Letas is east of Mount Garet. The most recent eruption period occurred during 17 September-10 October 2011. This report updates information since July 2013 through May 2022 and uses information primarily from monthly bulletins of the Vanuatu Meteorology and Geo-Hazards Department (VMGD) and various satellite data.
Occasional gas-and-steam emissions originating from Mt. Garet have been reported by VMGD and were visible in satellite imagery and by local observers. In addition, local residents and visitors occasionally reported the smell of sulfur near the cone. A white gas-and-steam emission was visible in Planet Labs satellite imagery on 28 September 2016 (figure 25). Similar gas-and-steam emissions were reported on 31 October 2017, 8 December 2017, 19 March 2018 in monthly VMGD reports. Ongoing gas-and-steam emissions from Mt. Garet persisted through May 2022, based on satellite images and reports from local observers (figure 26).
|
Figure 25. Planet Labs satellite image of white gas-and-steam emissions rising above Mt. Garet at Gaua on 28 September 2016. North is to the top of the figure. Courtesy of Planet Labs. |
|
Figure 26. Sentinel-2 satellite imagery showed intermittent white gas-and-steam plumes rising above Mt. Garet at Gaua from 11 October 2018 through 28 May 2022 and drifting in different directions. On 13 January 2021 a weak thermal anomaly in the summit crater was detected in an infrared satellite image, accompanied by gas-and-steam emissions. Images show gas-and-steam emissions on 11 October 2018 (top left), 24 December 2020 (top middle), 13 January 2021 (top right), 30 October 2021 (bottom left), 12 February 2022 (bottom middle), and 28 May 2022 (bottom right). The image from 13 January 2021 uses “Atmospheric penetration” rendering (bands 12, 11, 8a) and the rest use “Natural color” (bands 4, 3, 2). Courtesy of Sentinel Hub Playground. |
An ash plume that rose above Mt. Garet on 16 November 2021 was reported by VMGD based on ground observations and satellite data. Ash deposits were also reported in the caldera area and in villages to the west; sulfuric gas odors continued to be noted by visitors. The MIROVA thermal anomaly data showed weak thermal anomalies in late February and mid-April 2022. VMGD warned of a sulfurous odor near the cone on 28 April. On 3 May 2022 local residents, especially in Naveto in the NE part of the island, heard a loud explosion and saw a dense ash plume rising above Mt. Garet during 0900-0930 (figure 27).
|
Figure 27. Photo of an ash-and-gas plume rising above Mt. Garet at Gaua between 0900-0930 on 3 May 2022. Photo was taken from the NE of the volcano. Courtesy of VMGD. |
Information Contacts: Geo-Hazards Division, Vanuatu Meteorology and Geo-Hazards Department (VMGD), Ministry of Climate Change Adaptation, Meteorology, Geo-Hazards, Energy, Environment and Disaster Management, Private Mail Bag 9054, Lini Highway, Port Vila, Vanuatu (URL: http://www.vmgd.gov.vu/, https://www.facebook.com/VanuatuGeohazardsObservatory/); MIROVA (Middle InfraRed Observation of Volcanic Activity), a collaborative project between the Universities of Turin and Florence (Italy) supported by the Centre for Volcanic Risk of the Italian Civil Protection Department (URL: http://www.mirovaweb.it/); Sentinel Hub Playground (URL: https://www.sentinel-hub.com/explore/sentinel-playground).
|
|
||||||||||||||||||||||||||||
There is data available for 18 confirmed eruptive periods.
2022 May 3 - 2022 May 3 Confirmed Eruption (Explosive / Effusive) VEI: 1
| Episode 1 | Eruption (Explosive / Effusive) | Mt. Garet | |||||||||||||||||||||||
|---|---|---|---|---|---|---|---|---|---|---|---|---|---|---|---|---|---|---|---|---|---|---|---|---|
| 2022 May 3 - 2022 May 3 | Evidence from Observations: Reported | |||||||||||||||||||||||
| On 3 May local residents, especially in Naveto in the NE part of the island, heard a loud explosion and then saw a dense ash plume rising from Mt. Garet during 0900-0930. | ||||||||||||||||||||||||
|
List of 3 Events for Episode 1 at Mt. Garet
|
||||||||||||||||||||||||
2021 Nov 16 - 2021 Nov 16 Confirmed Eruption (Explosive / Effusive) VEI: 1
| Episode 1 | Eruption (Explosive / Effusive) | Mt. Garet | |||||||||||||||||||||||
|---|---|---|---|---|---|---|---|---|---|---|---|---|---|---|---|---|---|---|---|---|---|---|---|---|
| 2021 Nov 16 - 2021 Nov 16 | Evidence from Observations: Reported | |||||||||||||||||||||||
| An ash plume that rose above Mt. Garet on 16 November 2021 was reported by VMGD based on ground observations and satellite data. Ash deposits were also reported in the caldera area and in villages to the west. | ||||||||||||||||||||||||
|
List of 3 Events for Episode 1 at Mt. Garet
|
||||||||||||||||||||||||
2011 Sep 17 - 2011 Oct 10 Confirmed Eruption (Explosive / Effusive) VEI: 1
| Episode 1 | Eruption (Explosive / Effusive) | Mt. Garat | ||||||||||||||||||||||||||||
|---|---|---|---|---|---|---|---|---|---|---|---|---|---|---|---|---|---|---|---|---|---|---|---|---|---|---|---|---|---|
| 2011 Sep 17 - 2011 Oct 10 | Evidence from Observations: Reported | ||||||||||||||||||||||||||||
|
List of 4 Events for Episode 1 at Mt. Garat
|
|||||||||||||||||||||||||||||
2009 Sep 27 - 2010 Jun 19 Confirmed Eruption (Explosive / Effusive) VEI: 2
| Episode 1 | Eruption (Explosive / Effusive) | Mt. Garat | |||||||||||||||||||||||||||||||||||||||||||
|---|---|---|---|---|---|---|---|---|---|---|---|---|---|---|---|---|---|---|---|---|---|---|---|---|---|---|---|---|---|---|---|---|---|---|---|---|---|---|---|---|---|---|---|---|
| 2009 Sep 27 - 2010 Jun 19 | Evidence from Observations: Reported | |||||||||||||||||||||||||||||||||||||||||||
|
List of 7 Events for Episode 1 at Mt. Garat
|
||||||||||||||||||||||||||||||||||||||||||||
1982 Apr 18 - 1982 Apr 18 Confirmed Eruption (Explosive / Effusive) VEI: 2
| Episode 1 | Eruption (Explosive / Effusive) | Mt. Garat | ||||||||||||||||||||||||||||
|---|---|---|---|---|---|---|---|---|---|---|---|---|---|---|---|---|---|---|---|---|---|---|---|---|---|---|---|---|---|
| 1982 Apr 18 - 1982 Apr 18 | Evidence from Observations: Reported | ||||||||||||||||||||||||||||
|
List of 4 Events for Episode 1 at Mt. Garat
|
|||||||||||||||||||||||||||||
1981 Jul 9 - 1981 Jul 9 Confirmed Eruption (Explosive / Effusive) VEI: 1 (?)
| Episode 1 | Eruption (Explosive / Effusive) | Mt. Garat | ||||||||||||||||||||||||||||
|---|---|---|---|---|---|---|---|---|---|---|---|---|---|---|---|---|---|---|---|---|---|---|---|---|---|---|---|---|---|
| 1981 Jul 9 - 1981 Jul 9 | Evidence from Observations: Reported | ||||||||||||||||||||||||||||
|
List of 4 Events for Episode 1 at Mt. Garat
|
|||||||||||||||||||||||||||||
1980 Jul 2 ± 182 days Confirmed Eruption (Explosive / Effusive) VEI: 1 (?)
| Episode 1 | Eruption (Explosive / Effusive) | Mt. Garat | ||||||||||||||||||
|---|---|---|---|---|---|---|---|---|---|---|---|---|---|---|---|---|---|---|---|
| 1980 Jul 2 ± 182 days - Unknown | Evidence from Observations: Reported | ||||||||||||||||||
|
List of 2 Events for Episode 1 at Mt. Garat
|
|||||||||||||||||||
1977 Apr 13 - 1977 Apr 13 Confirmed Eruption (Explosive / Effusive) VEI: 2
| Episode 1 | Eruption (Explosive / Effusive) | Mt. Garat | ||||||||||||||||||
|---|---|---|---|---|---|---|---|---|---|---|---|---|---|---|---|---|---|---|---|
| 1977 Apr 13 - 1977 Apr 13 | Evidence from Observations: Reported | ||||||||||||||||||
|
List of 2 Events for Episode 1 at Mt. Garat
|
|||||||||||||||||||
1976 Jan 15 ± 5 days Confirmed Eruption (Explosive / Effusive) VEI: 2
| Episode 1 | Eruption (Explosive / Effusive) | Mt. Garat | ||||||||||||||||||
|---|---|---|---|---|---|---|---|---|---|---|---|---|---|---|---|---|---|---|---|
| 1976 Jan 15 ± 5 days - Unknown | Evidence from Observations: Reported | ||||||||||||||||||
|
List of 2 Events for Episode 1 at Mt. Garat
|
|||||||||||||||||||
1973 Oct 9 - 1974 Jan 21 Confirmed Eruption (Explosive / Effusive) VEI: 2
| Episode 1 | Eruption (Explosive / Effusive) | Mt. Garat (upper SE flank) | |||||||||||||||||||||||||||||||||||||||||||
|---|---|---|---|---|---|---|---|---|---|---|---|---|---|---|---|---|---|---|---|---|---|---|---|---|---|---|---|---|---|---|---|---|---|---|---|---|---|---|---|---|---|---|---|---|
| 1973 Oct 9 - 1974 Jan 21 | Evidence from Observations: Reported | |||||||||||||||||||||||||||||||||||||||||||
|
List of 7 Events for Episode 1 at Mt. Garat (upper SE flank)
|
||||||||||||||||||||||||||||||||||||||||||||
1971 May 12 - 1971 May 13 Confirmed Eruption (Explosive / Effusive) VEI: 2
| Episode 1 | Eruption (Explosive / Effusive) | Mt. Garat (upper SE flank) | |||||||||||||||||||||||
|---|---|---|---|---|---|---|---|---|---|---|---|---|---|---|---|---|---|---|---|---|---|---|---|---|
| 1971 May 12 - 1971 May 13 | Evidence from Observations: Reported | |||||||||||||||||||||||
|
List of 3 Events for Episode 1 at Mt. Garat (upper SE flank)
|
||||||||||||||||||||||||
1969 Sep 22 Confirmed Eruption (Explosive / Effusive) VEI: 2
| Episode 1 | Eruption (Explosive / Effusive) | Mt. Garat | |||||||||||||||||||||||
|---|---|---|---|---|---|---|---|---|---|---|---|---|---|---|---|---|---|---|---|---|---|---|---|---|
| 1969 Sep 22 - Unknown | Evidence from Observations: Reported | |||||||||||||||||||||||
|
List of 3 Events for Episode 1 at Mt. Garat
|
||||||||||||||||||||||||
1968 Jul 2 ± 182 days - 1968 Dec 1 ± 30 days Confirmed Eruption (Explosive / Effusive) VEI: 2
| Episode 1 | Eruption (Explosive / Effusive) | Mt. Garat (upper SE flank) | |||||||||||||||||||||||
|---|---|---|---|---|---|---|---|---|---|---|---|---|---|---|---|---|---|---|---|---|---|---|---|---|
| 1968 Jul 2 ± 182 days - 1968 Dec 1 ± 30 days | Evidence from Observations: Reported | |||||||||||||||||||||||
|
List of 3 Events for Episode 1 at Mt. Garat (upper SE flank)
|
||||||||||||||||||||||||
1967 Jul 16 ± 15 days Confirmed Eruption (Explosive / Effusive) VEI: 2
| Episode 1 | Eruption (Explosive / Effusive) | Mt. Garat | |||||||||||||||||||||||
|---|---|---|---|---|---|---|---|---|---|---|---|---|---|---|---|---|---|---|---|---|---|---|---|---|
| 1967 Jul 16 ± 15 days - Unknown | Evidence from Observations: Reported | |||||||||||||||||||||||
|
List of 3 Events for Episode 1 at Mt. Garat
|
||||||||||||||||||||||||
1966 Jul 2 ± 182 days Confirmed Eruption (Explosive / Effusive) VEI: 2
| Episode 1 | Eruption (Explosive / Effusive) | Mt. Garat | |||||||||||||||||||||||
|---|---|---|---|---|---|---|---|---|---|---|---|---|---|---|---|---|---|---|---|---|---|---|---|---|
| 1966 Jul 2 ± 182 days - Unknown | Evidence from Observations: Reported | |||||||||||||||||||||||
|
List of 3 Events for Episode 1 at Mt. Garat
|
||||||||||||||||||||||||
1965 Sep 27 - 1965 Sep 30 (on or after) Confirmed Eruption (Explosive / Effusive) VEI: 3
| Episode 1 | Eruption (Explosive / Effusive) | Mt. Garat | ||||||||||||||||||||||||||||
|---|---|---|---|---|---|---|---|---|---|---|---|---|---|---|---|---|---|---|---|---|---|---|---|---|---|---|---|---|---|
| 1965 Sep 27 - 1965 Sep 30 (on or after) | Evidence from Observations: Reported | ||||||||||||||||||||||||||||
|
List of 4 Events for Episode 1 at Mt. Garat
|
|||||||||||||||||||||||||||||
1963 Sep 15 ± 5 days - 1963 Nov 9 (on or after) Confirmed Eruption (Explosive / Effusive) VEI: 2
| Episode 1 | Eruption (Explosive / Effusive) | Mt. Garat (upper SE flank) | |||||||||||||||||||||||
|---|---|---|---|---|---|---|---|---|---|---|---|---|---|---|---|---|---|---|---|---|---|---|---|---|
| 1963 Sep 15 ± 5 days - 1963 Nov 9 (on or after) | Evidence from Observations: Reported | |||||||||||||||||||||||
|
List of 3 Events for Episode 1 at Mt. Garat (upper SE flank)
|
||||||||||||||||||||||||
1962 Jul 16 (on or before) ± 15 days Confirmed Eruption (Explosive / Effusive) VEI: 2 (?)
| Episode 1 | Eruption (Explosive / Effusive) | Mt. Garat | |||||||||||||||||||||||
|---|---|---|---|---|---|---|---|---|---|---|---|---|---|---|---|---|---|---|---|---|---|---|---|---|
| 1962 Jul 16 (on or before) ± 15 days - Unknown | Evidence from Observations: Reported | |||||||||||||||||||||||
|
List of 3 Events for Episode 1 at Mt. Garat
|
||||||||||||||||||||||||
This compilation of synonyms and subsidiary features may not be comprehensive. Features are organized into four major categories: Cones, Craters, Domes, and Thermal Features. Synonyms of features appear indented below the primary name. In some cases additional feature type, elevation, or location details are provided.
Synonyms |
||||
| Santa Maria | Lacona | Lakona | Gog | Steaming Hill Lake | ||||
Cones |
||||
| Feature Name | Feature Type | Elevation | Latitude | Longitude |
| Burilan | Cone | 126 m | 14° 15' 0.00" S | 167° 25' 0.00" E |
| Garet, Mount
Gharat, Mount Garat, Mount |
Cone - Crater | 729 m | 14° 16' 57.00" S | 167° 31' 0.00" E |
| Kweteon | Cone | 14° 17' 0.00" S | 167° 34' 0.00" E | |
| Losolava-Tarasag | Cone | 14° 15' 0.00" S | 167° 33' 0.00" E | |
| North Makeon | Cone | 582 m | 14° 19' 0.00" S | 167° 30' 0.00" E |
| Ontar | Cone | 14° 17' 0.00" S | 167° 27' 0.00" E | |
| West Losolava | Cone | 14° 14' 0.00" S | 167° 30' 0.00" E | |
Thermal |
||||
| Feature Name | Feature Type | Elevation | Latitude | Longitude |
| Sladen Boiling Springs | Hot Spring | 14° 16' 0.00" S | 167° 28' 0.00" E | |
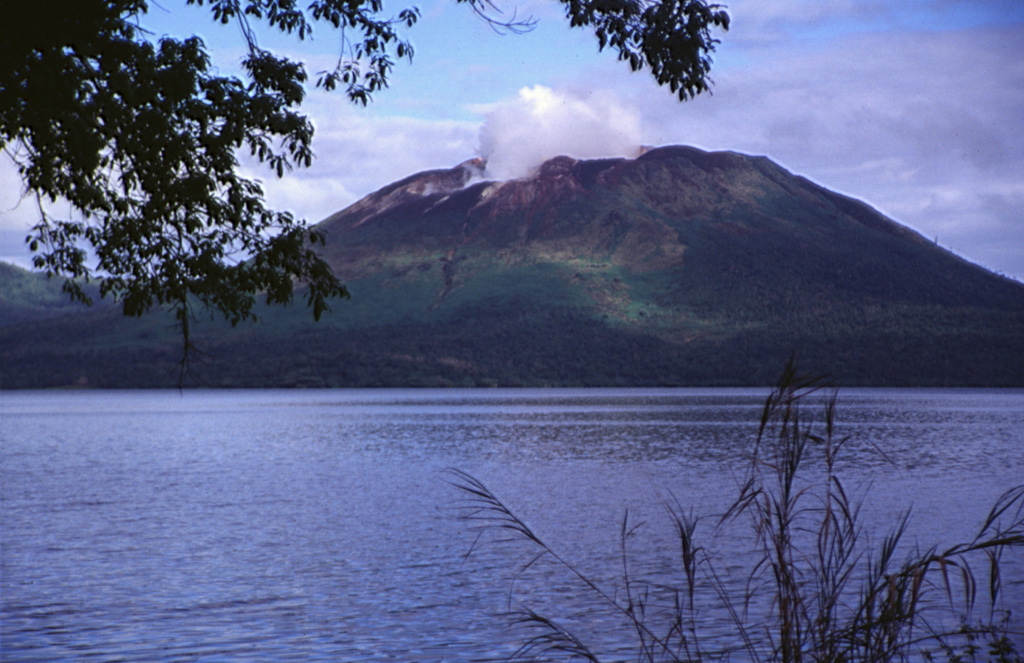
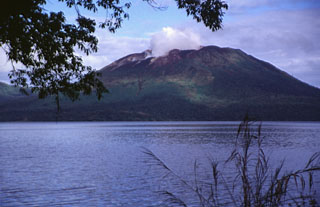 A plume rises from the active crater of Mount Garat in this view across Lake Letas, within the 6 x 9 km summit caldera of Gaua volcano (also known as Santa Maria). Three craters are located at the top of Mount Garat. The onset of eruptive activity from a vent high on the SE flank in 1962 ended a long period of dormancy.
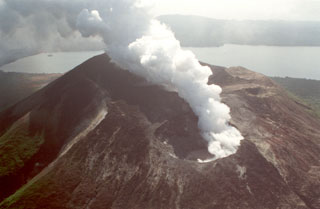 The summit crater complex of Mt. Garat with Lake Letas in the background, seen here from the S. A plume rises from the SE crater. Strong continuous degassing began following an increase in fumarolic activity in April 1991 and was continuing at the time of this July 1991 photo. Mt. Garat is located within the 6 x 9 km wide caldera that is partially filled by Lake Letas. The northern caldera rim is in the background.
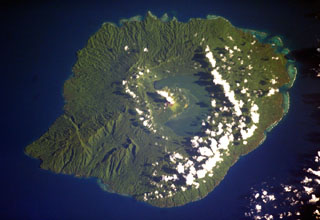 Crescent-shaped Lake Letas partially fills the summit caldera of Gaua volcano, curving around the historically active post-caldera Mount Garat. Several young lava flows from flank vents reached the coast and form the smoother areas along the flanks of the volcano. The 6 x 9 km caldera is bound by a series of discontinuous, bifurcating faults. The dissected terrain on the SW (lower left) is part of an older series of tuff cones and lavas.
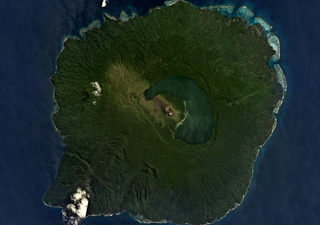 The 40-km-wide volcanic Guaya Island contains Lake Letas within a 6 x 8 km caldera in the center of this September 2019 Planet Labs satellite image monthly mosaic (N is at the top). The active Mount Garet formed within the caldera and has two summit craters; explosive eruptive activity occurred from the SE crater in 2009-2010. Smaller cones and lava flows have formed across the flanks.
There are no samples for Gaua in the Smithsonian's NMNH Department of Mineral Sciences Rock and Ore collection.
| Copernicus Browser | The Copernicus Browser replaced the Sentinel Hub Playground browser in 2023, to provide access to Earth observation archives from the Copernicus Data Space Ecosystem, the main distribution platform for data from the EU Copernicus missions. |
| MIROVA | Middle InfraRed Observation of Volcanic Activity (MIROVA) is a near real time volcanic hot-spot detection system based on the analysis of MODIS (Moderate Resolution Imaging Spectroradiometer) data. In particular, MIROVA uses the Middle InfraRed Radiation (MIR), measured over target volcanoes, in order to detect, locate and measure the heat radiation sourced from volcanic activity. |
| MODVOLC Thermal Alerts | Using infrared satellite Moderate Resolution Imaging Spectroradiometer (MODIS) data, scientists at the Hawai'i Institute of Geophysics and Planetology, University of Hawai'i, developed an automated system called MODVOLC to map thermal hot-spots in near real time. For each MODIS image, the algorithm automatically scans each 1 km pixel within it to check for high-temperature hot-spots. When one is found the date, time, location, and intensity are recorded. MODIS looks at every square km of the Earth every 48 hours, once during the day and once during the night, and the presence of two MODIS sensors in space allows at least four hot-spot observations every two days. Each day updated global maps are compiled to display the locations of all hot spots detected in the previous 24 hours. There is a drop-down list with volcano names which allow users to 'zoom-in' and examine the distribution of hot-spots at a variety of spatial scales. |
|
WOVOdat
Single Volcano View Temporal Evolution of Unrest Side by Side Volcanoes |
WOVOdat is a database of volcanic unrest; instrumentally and visually recorded changes in seismicity, ground deformation, gas emission, and other parameters from their normal baselines. It is sponsored by the World Organization of Volcano Observatories (WOVO) and presently hosted at the Earth Observatory of Singapore.
GVMID Data on Volcano Monitoring Infrastructure The Global Volcano Monitoring Infrastructure Database GVMID, is aimed at documenting and improving capabilities of volcano monitoring from the ground and space. GVMID should provide a snapshot and baseline view of the techniques and instrumentation that are in place at various volcanoes, which can be use by volcano observatories as reference to setup new monitoring system or improving networks at a specific volcano. These data will allow identification of what monitoring gaps exist, which can be then targeted by remote sensing infrastructure and future instrument deployments. |
| Volcanic Hazard Maps | The IAVCEI Commission on Volcanic Hazards and Risk has a Volcanic Hazard Maps database designed to serve as a resource for hazard mappers (or other interested parties) to explore how common issues in hazard map development have been addressed at different volcanoes, in different countries, for different hazards, and for different intended audiences. In addition to the comprehensive, searchable Volcanic Hazard Maps Database, this website contains information about diversity of volcanic hazard maps, illustrated using examples from the database. This site is for educational purposes related to volcanic hazard maps. Hazard maps found on this website should not be used for emergency purposes. For the most recent, official hazard map for a particular volcano, please seek out the proper institutional authorities on the matter. |
| IRIS seismic stations/networks | Incorporated Research Institutions for Seismology (IRIS) Data Services map showing the location of seismic stations from all available networks (permanent or temporary) within a radius of 0.18° (about 20 km at mid-latitudes) from the given location of Gaua. Users can customize a variety of filters and options in the left panel. Note that if there are no stations are known the map will default to show the entire world with a "No data matched request" error notice. |
| UNAVCO GPS/GNSS stations | Geodetic Data Services map from UNAVCO showing the location of GPS/GNSS stations from all available networks (permanent or temporary) within a radius of 20 km from the given location of Gaua. Users can customize the data search based on station or network names, location, and time window. Requires Adobe Flash Player. |
| DECADE Data | The DECADE portal, still in the developmental stage, serves as an example of the proposed interoperability between The Smithsonian Institution's Global Volcanism Program, the Mapping Gas Emissions (MaGa) Database, and the EarthChem Geochemical Portal. The Deep Earth Carbon Degassing (DECADE) initiative seeks to use new and established technologies to determine accurate global fluxes of volcanic CO2 to the atmosphere, but installing CO2 monitoring networks on 20 of the world's 150 most actively degassing volcanoes. The group uses related laboratory-based studies (direct gas sampling and analysis, melt inclusions) to provide new data for direct degassing of deep earth carbon to the atmosphere. |
| Large Eruptions of Gaua | Information about large Quaternary eruptions (VEI >= 4) is cataloged in the Large Magnitude Explosive Volcanic Eruptions (LaMEVE) database of the Volcano Global Risk Identification and Analysis Project (VOGRIPA). |
| EarthChem | EarthChem develops and maintains databases, software, and services that support the preservation, discovery, access and analysis of geochemical data, and facilitate their integration with the broad array of other available earth science parameters. EarthChem is operated by a joint team of disciplinary scientists, data scientists, data managers and information technology developers who are part of the NSF-funded data facility Integrated Earth Data Applications (IEDA). IEDA is a collaborative effort of EarthChem and the Marine Geoscience Data System (MGDS). |

