PVMBG noted that due to visual and instrumental monitoring results as well as level of potential hazards the Alert Level for Kelut was lowered to 1 (on a scale of 1-4) on 12 August. Residents and visitors were advised to not approach the crater rim, crater floor, or the rivers that disgorge from Kelut.
Source: Pusat Vulkanologi dan Mitigasi Bencana Geologi (PVMBG, also known as CVGHM)
Eruption with plume top over 26 km altitude; ~7 deaths and over 100,000 refugees
On 13 February 2014, the Indonesian National Board for Disaster Management (Badan Nasional Penanggulangan Bencana-BNPB) reported that a major eruption occurred at Kelut (also known as Kelud) volcano in East Java, Indonesia. Ground-based observers had little insight about the ash plume height, but a number of satellite observations helped to constrain the height and other eruption parameters such the direction of plume movement. CALIPSO satellite data revealed that a rapidly rising portion of the plume ejected material up to an altitude exceeding ~26 km, well into the tropical stratosphere. Most of the less rapidly rising portions of the plume remained lower, at 19-20 km altitude. The 2014 eruption destroyed a dome emplaced in the volcano's caldera during the previous eruption in 2007 (BGVN 33:03 and 33:07). According to BNPB in a report issued on 18 February 2014, ~7 people were killed and ~100,000 evacuated. At least one commercial aircraft flew into the plume, later landing successfully but incurring costly engine damage.
This report discusses the pre- and syn-eruption observations from the early January through 25 February 2014. Much of the detailed reporting used here came from the Indonesian Centre for Volcanology and Geological Hazard Mitigation (CVGHM; also known as Pusat Vulkanologi dan Mitigasi Bencana Geologi, PVMBG). Kelut is located just S of Surabaya (Surabaja), Indonesia's second largest city (see figure 8 in BGVN 33:03).
Pre-eruption. According to CVGHM, the lake-water temperature in the crater increased 5.5°C during 10 September 2013 to 2 February 2014. During 1 January-2 February 2014 the number of shallow volcanic earthquakes at Kelut volcano increased. During 3-10 February 2014, seismic activity at Kelut was dominated by both shallow and deep volcanic earthquakes; some hypocenters were 3 km below the summit. Real-time Seismic-Amplitude Measurement (RSAM, a gauge of volcanic seismicity) values increased on 6 and 9 February 2014. Inflation was detected at one station.
Peaks of pre-eruptive seismicity occurred during 15-16 and 28 January, and 2-13 February. Table 3 also portrays the available early 2014 seismic data from CVGHM, but it can be hard to see the aforementioned detail because the various entries on table's rows generally summarize multiple days and some of the time intervals differ. The number of deep volcanic earthquakes fluctuated but generally increased overall. Earthquakes often occurred at 2-8 km depth. Based on these observations, on 2 February the Alert Level was raised to from 1 to 2 (on a scale with increasing severity in the range 1-4). Tiltmeter data on 10 February indicated inflation.
Table 3. Seismicity at Kelut volcano during January and into 13 February 2014. Note that the data stream changed abruptly on 13 February when four of Kelut's 5 seismic stations were destroyed by eruptive material. Courtesy of CVGHM.
| Time period 2014 (no. of days) | Shallow/deep volcanic earthquakes (VB / VA) | Deep/local tectonic earthquakes (TJ) (nr-none reported) | Low frequency earthquakes (LF) |
| 1-7 Jan (7) | 14 / 1 | 44 / -- | 4 |
| 8-14 Jan (7) | 18 / 4 | 32 / -- | 2 |
| 15-21 Jan (7) | 38 / 34 | 27 / -- | 0 |
| 22-31 Jan (10) | 234 / 74 | 79 / 2 | 1 |
| 1-3 Feb (3) | 111 / 30 | 3 / -- | 0 |
| 3-10 Feb (8) | 693 / 297 | 50 / -- | 0 |
| 13 Feb (1) | 440 / 1,135 | 1 / 3 | 198 |
Crater lake water temperatures continued to increase after September 2013, particularly during 23 January-9 February. Temperatures decreased slightly when measured on 10 February. On 10 February, based on the factors noted above, CVGHM increased the Alert Level to 3. This excluded visitors and residents from within a 5-km radius of the crater.
Eruption on 13 February. At 2115 on 13 February the Alert Level for Kelut was raised to 4, extending the exclusionary zone to a 10-km radius. As noted above, BNPB reported that a major eruption occurred less than two hours later at 2250, followed by another large explosion at 2330. NASA reported that satellite images showed the Kelut eruption about 2 hours later on 13 February 2014 at ~2315 local time (1615 UTC).
According to a Darwin VAAC (2014) weekly activity report, the eruption was seen on the hourly MTSAT-2 IR satellite for 1632 UTC (2332 local time) on 13 February, where it appeared as a rapidly expanding cloud. More details came from 10-minute IR data being used on a special basis in the High Ice Project in Darwin, which captured the eruption clearly as a small cluster of cold pixels on a 1610 UTC (2310 local time) IR image. Later analysis found a small low altitude plume as early as 1540 UTC (2240 local time) at Kelut on the MTSAT-1R satellite; this is the earliest reported start time for the eruption.
According to CVGHM, ash plumes rose to an altitude of 17 km and caused ashfall in areas NE, NW, W, and elsewhere as far as Pacitan (133 km WSW), Kulon Progo (236 km W), Temanggung (240 km WNW), and Banyuwangi (228 km E). As ash began to blanket parts of the region, 40 airline flights were cancelled; impacted airports included Juanda (81 km NE), Adi Sucipto Yogya (208 km W), and Adi Sumarmo Solo (175 km WNW). News articles reported that flights in and out of seven airports were cancelled or rerouted.
Figures 15 and 16 show satellite images of the plume taken on 13 February 2014. The image at the top of figure 15 portrays the scene at 0030 local time and the trace of the path across it taken by the satellite. At ~1813 UTC on 13 February. CALIPSO (Cloud-Aerosol Lidar and Infrared Pathfinder Satellite Observation). CALIPSO flew over the plume deploying CALIOP (a lidar instrument, essentially a laser range finder that creates a profile of clouds and particles in the atmosphere). This is one of the favored instruments for cloud height measurement. It is part of the A-Train, a constellation of multiple satellites and instruments that follow the same track on polar orbits and cross the equator within seconds to minutes of each other. This allows near-simultaneous observations. CALIOP data revealed that the Kelut ash cloud was generally at an altitude of 18-19 km, with some cloud/ash material reaching a maximum height of ~26 km. This is sufficiently high, and the A-Train data capabilities are sufficiently large to cause great interest, and more refined estimates of height and other parameters are likely to follow.
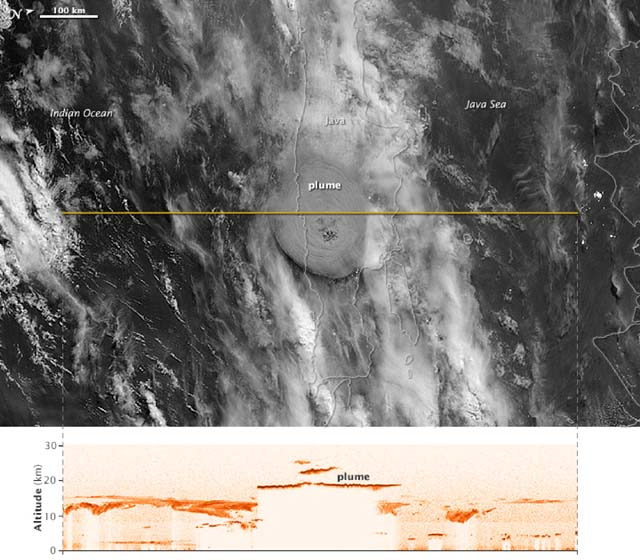 |
Figure 15. Figure 15 (top and bottom). At 0030 local time (1730 UTC 13 February) on 14 February, the Visible Infrared Imaging Radiometer Suite (VIIRS) on the Suomi NPP satellite acquired the top image as the gray circular ash plume over Kelut reached above a lighter-colored weather-cloud deck. Forty minutes later, at 0110 local time (1810 UTC 13 February), the Cloud-Aerosol Lidar and Infrared Pathfinder Satellite Observation (CALIPSO) satellite flew over the plume with its lidar instrument. The instrument recorded the ash cloud at nearly 20 km altitude, with sections of the plume reaching to nearly 26 km. Courtesy of NASA Earth Observatory; image by Jesse Allen, using data provided by the CALIPSO team; caption by Holli Riebeek. |
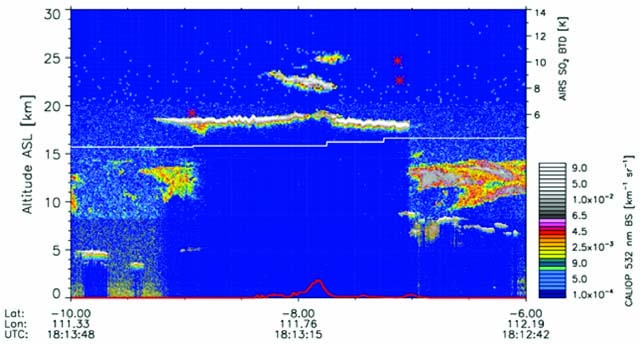 |
Figure 16. A cross-section through the Kelut volcanic plume from data acquired on 14 February 2014. The image zooms in on CALIPSO data for the tallest parts of the volcanic cloud (using the CALIOP data). The white line shows the approximate troposphere-stratosphere boundary. Some wave structure (small white oscillations) is apparent in the umbrella region. The vertical scale on the left shows computed altitude, and on the lower right shows the color scale for intensity of the 532 nm wavelength backscatter. The horizontal scale and labels at the bottom of the figure shows the latitude, longitude, and time in UTC for the vertical sounding across the transect. The red trace across the bottom of the figure shows land topography, with the volcano at the center. The AIRS (atmospheric infrared sounder) determined SO2 brightness temperature differences (BTD-scale at upper right) referring to features such as the red stars, where AIRS detected SO2 towards the edge of the cloud. Courtesy of Carn and Telling (2014). |
Figure 17 shows a view of an eruption at 0030 local time on 14 February. In Figure 18, a plane, service vehicle, and boarding area are shown covered by ash at Yogyakarta airport, 215 km E of Kelut. Closer to the volcano, ashfall and tephra blocks 5-8 cm in diameter caused structures to collapse, including schools, homes, and businesses.
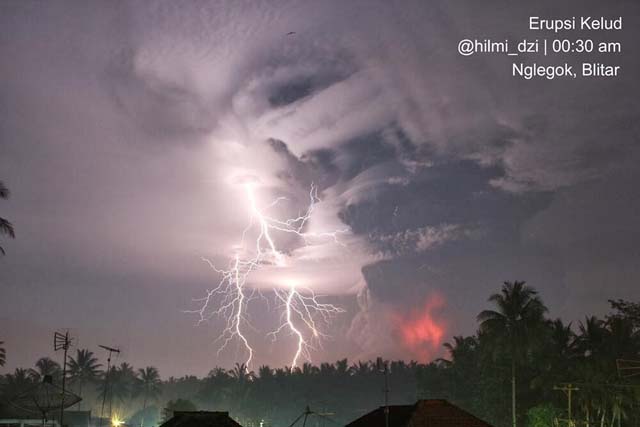 |
Figure 17. A photo of the eruption of Kelut at 0030 on 14 February 2014, with lightning being generated in the ash plume. Courtesy of Volcano Discovery web site (URL: http:pic.twitter.com/ypy7kx9615 / @hilmi_dzi). |
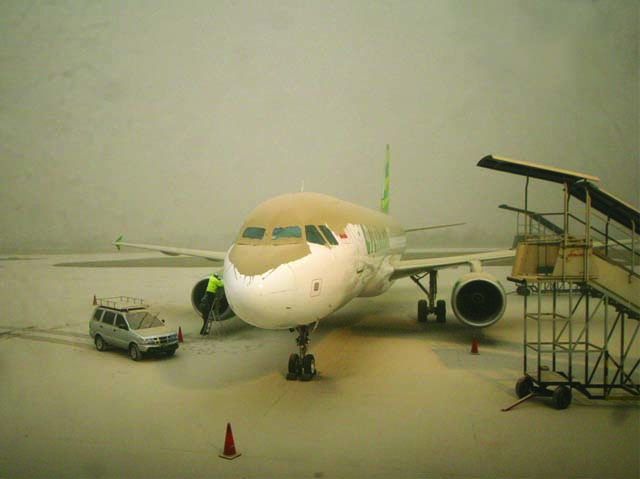 |
Figure 18. Image of a tan-colored ash blanket covering the landscape, including a parked jet liner and service vehicle, at Yogyakarta airport, 215 km W of Kelut, taken 14 February 2014. Image from NBC News web site (BIMO SATRIO / EPA). |
As a result of this eruption, four of the five Kelut seismic stations were destroyed, after which, volcanic and low-frequency earthquakes were not recorded. Subsequently, available seismicity recorded at the one remaining station, 5 km away, was dominated by continuous tremor with amplitudes ranging from 0.5 to 15 mm. That station later recorded declining seismicity during 14-20 February. Two more seismic stations were installed on 16 February, 2-3 km from the crater.
On 14 February, gray-to-black plumes rose 400-600 m above the crater, and on 15 February grayish white plumes rose as high as 3 km (figure 19).
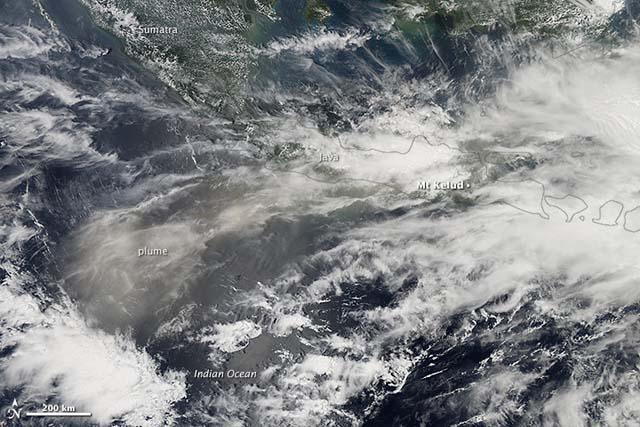 |
Figure 19. The eruption of Kelut (labeled just to the right of the image's center) on 13 February 2014 sent a large plume of ash drifting W across Java and over the Indian Ocean. This satellite image, acquired 14 February, shows widespread tan atmospheric discoloration from the ash plume. According to an advisory issued by the Australian Bureau of Meteorology, ash had reached 13 km in altitude, prompting the closure of several airports. Three people were killed, and Indonesian authorities have evacuated more than 75,000 people from their homes. NASA Earth Observatory, image by Jesse Allen and caption by Adam Voiland, using data from the Land Atmosphere Near real-time Capability for EOS (LANCE). |
On 14 February BNPB reported that the eruption had killed four people (but later estimates were higher): one died due to a collapsing wall, one from ash inhalation, and two from "shortness of breath." All four victims lived within 7 km of Kelut in the regency of Malang, an area that received ashfall up to 20 cm thick.
By 0600 on 14 February, BNPB reported that the number of displaced people reached 100,248, but the report also noted that volcanic activity had declined. Later that day BNPB noted that 76,388 people remained evacuated. Seismicity continued to decline and was at moderate levels during 15-17 February. During 16-20 February white plumes rose as high as 1 km and drifted N, NE, and E. Data from satellite instruments provided a 14 February 2014 image on sulfur dioxide (SO2) from Kelut (figure 20). The plume had spread primarily W of the volcano.
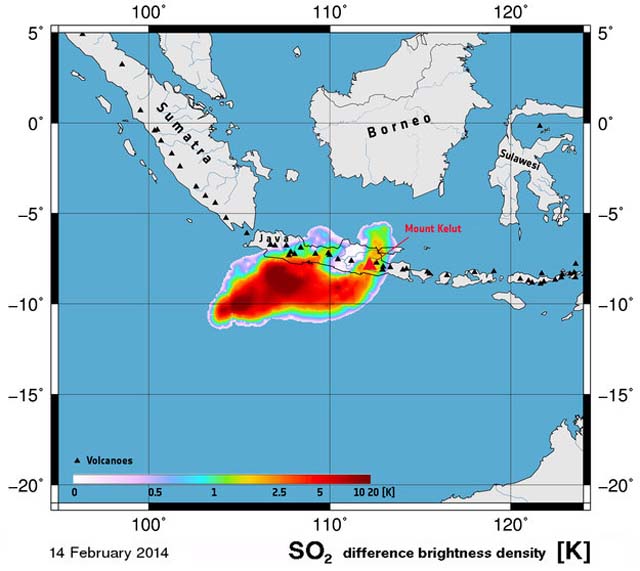 |
Figure 20. Sulfur dioxide burdens measured from Kelut (red triangle) over the Indonesian island of Java and Indian Ocean in the early morning of 14 February 2014 following the Kelut eruption. This image is based on data from the IASI instrument on the MetOp mission. Courtesy of European Space Agency (2014). |
Heavy rain on 18 February caused lahars in Ngobo, Mangli (Kediri, 35 km WNW), Bladak (Blitar, 20 km SW), and Konto (Malang, 35 km E). BNPB noted that the lahars flooded five houses and one mosque, and destroyed two homes and one bridge. An 18 February BNPB report noted that a total of 7 people in Malang regency had died, and that the ashfall had affected farms, including cattle health and dairy production, and the water supply. Damage to infrastructure in Malang included 3,782 houses, 20 government buildings, 251 schools, 9 hospitals, and 36 churches.
The Alert Level was lowered from 4 to 3 on 20 February and to 2 on 28 February based on decreased amplitude of tremors and thick clouds of white smoke continuously emitted from the crater instead of dark grey. At this point, visitors and residents were prohibited from approaching the crater within a radius of 5 km, but residents outside of this zone were permitted to return home.
Only a single pixel MODVOLC satellite thermal alert was measured during the interval from 13 February through March 2014. The alert occurred at 1515 hours UTC on 20 February 2014, the first alert measured since nearly daily alerts from Kelut's last eruption, 18 November 2007-23 January 2008. During the February 2014 eruption, cloudy weather over Kelut was a major factor that precluded some alerts from being measured, but those visualized suggest that the recent Kelut eruption continued until at least 20 February 2014.
A satellite image made available thanks to the International Charter Space and Major Disasters (2014) was acquired on 18 February and interpreted by the U.S. Geological Survey. The image reveals the impact of the eruption on the summit area and regions peripheral to it (figure 21).
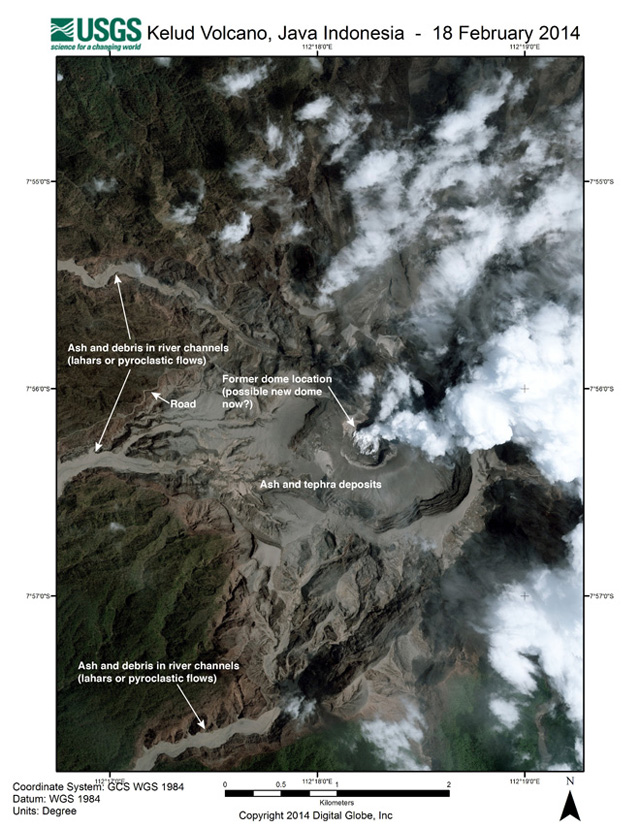 |
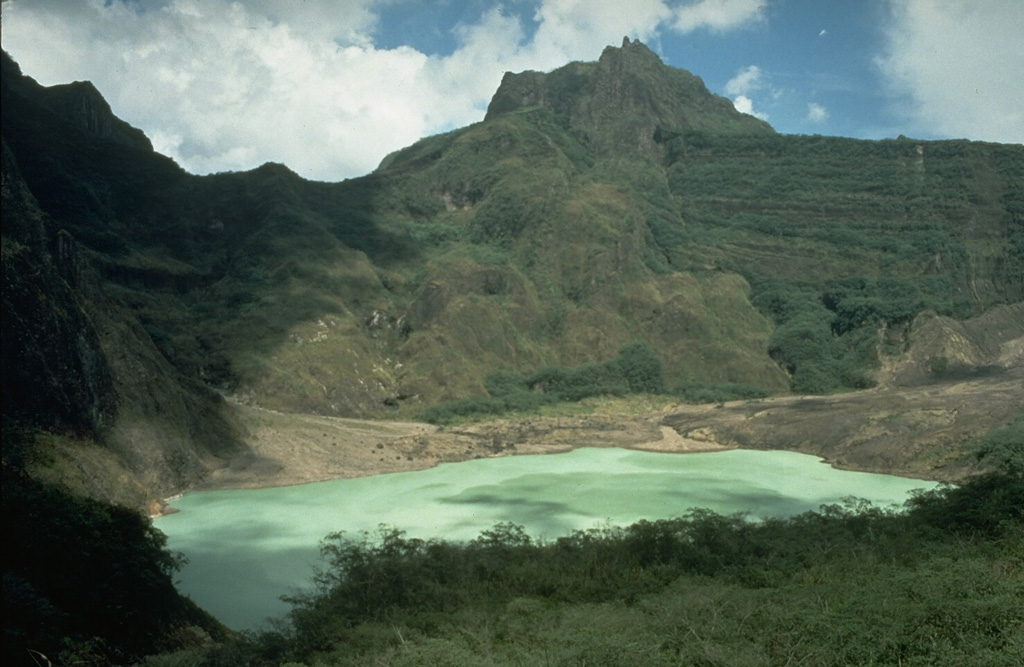
Figure 21. Satellite image of the crater area of Kelud, acquired on 18 February 2014. The former dome was destroyed during the 14 February eruption and significant ash and debris were deposited on the volcano slopes and in the river channels from lahars and pyroclastic flows around the volcano. Steam can be seen rising from the central crater. Courtesy of International Charter Space and Major Disasters (2014); source was WorldView, acquired 18/02/2014 by DigitalGlobe Inc.; map produced by USGS, and found online at Klemetti (2014c). |
Later visits disclosed that the 2014 eruption had left a large crater 400 m in diameter and destroyed the 2007 dome, parking area, and access stairs in the crater (see figures 22 and 23).
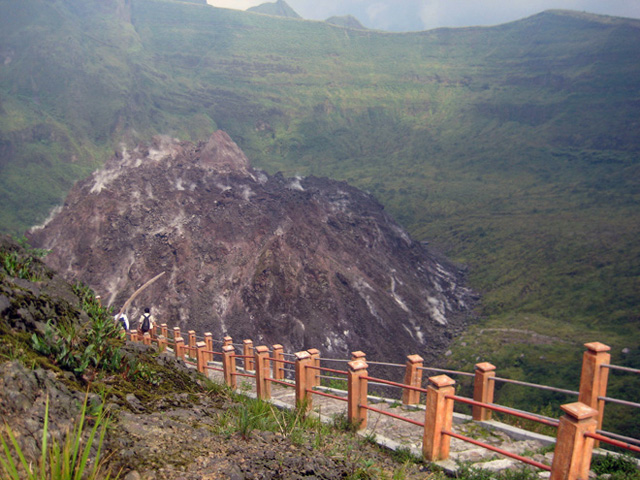 |
Figure 22. Photograph of the inner dome in Kelut volcano taken in 2010, showing the then- existing lava dome from the 2007 eruption and the access stairs to the crater, both of which were destroyed by the February 2014 eruption. Image courtesy of Zahidayat / Flickr, from Klemetti (2014b). |
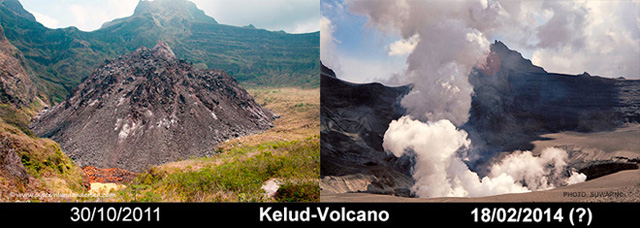 |
Figure 23. (Left) The Kelut lava dome that grew in the crater in 2007, photographed 30 October 2011 by Andersen (2011). In front of the dome was the small portion of what was left of the volcanic lake that used to fill the crater. (Right) The crater of Kelut seen on the morning of 18 February 2014 (photo by Suwarno, a local photographer, via Andersen), showing that the 2014 eruption forcefully removed the dome. Comparison figure came from Andersen (2014). |
A group of photographs taken by Oystein Lund Andersen (2014) during a visit from 22 to 23 February show after-eruption images, including steam rising from the crater area, ash and volcanic bombs deposited 2-5 km from Kelut's crater, and damage to trees and other vegetation by pyroclastic flows (for example, Figures 24 and 25). In addition, photographs showed that steam continued to rise from the crater through 25 February 2014. Andersen observed that activity at the volcano has decreased, but it was still unknown what exactly the situation at the vent is, whether or not a new lava dome is forming there.
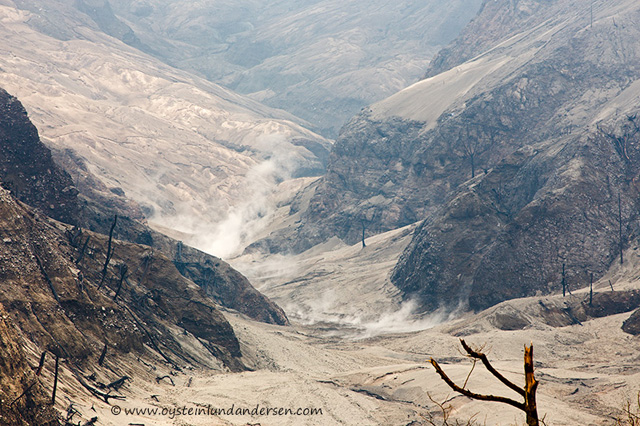 |
Figure 24. Steaming pyroclastic flow deposits in one of the valleys below the crater, a once forested area ~1 km SW of the crater .Photo taken at 1157 on 22 February 2014. Courtesy of Andersen (2014). |
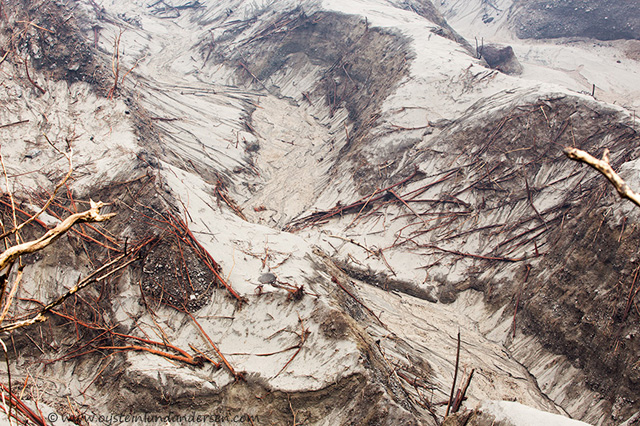 |
Figure 25. A lush green forest once stood here, now covered by deposits from a pyroclastic flow and scattered remains of large felled trees. Photo taken at 1205 on 22 February 2014. Courtesy of Andersen (2014). |
Airliner encounters plume. A commercial A320 airliner carrying passengers from Perth, Australia, to Jakarta, Indonesia, encountered an ash plume from Kelut near Indonesia on 14 February 2014. The incident was reported by the West Australian (Perth) newspaper and the Sydney Morning Herald (14 February). The reports noted that the airliner left Perth on 14 February 2014 at 0225 local time and flew through the ash cloud before arriving safely in Jakarta at 0550 local time. The estimated cost to replace the two engines of the Airbus aircraft was reported to be $20 million (US dollars). The A320 was grounded after the flight.
Morning Herald reporter Amanda Hoh (2014) reported that a "flight from Perth to Jakarta on Friday morning was filled with smoke after the plane flew into Indonesia's volcanic ash cloud…Richard Craig, from Perth, was on a flight to Jakarta at about 5am on Friday [14 February] when he said the plane suddenly flew into the ash cloud about 30 minutes before landing" Passenger Craig was quoted to have said "It was just starting to get light then it suddenly went quite dark and what I thought was smoke appeared in the cabin out the front, started coming out of the air vent and alarm went off and beeped a few times," he said. "There was an unusual smell. It wasn't like smoke, a slightly sweet smell. More like a very fine smoke…" The smoke cleared within a few minutes and Craig noted that the pilot announced that "it was a volcanic ash cloud and that 'no one was aware of it in the area.'" The plane landed safely.
Summary of damage. According to the International Federation of Red Cross and Red Crescent Societies (IFRC) (2014), "over the first few days the eruption affected 201,228 people (58,341 families) from 35 villages in three districts: Blitar, Kediri, and Malang... As of 14 February 2014, there had been seven fatalities and 70 people in hospitals in serious condition suffering from ash inhalation. Around this time the number of internally displaced persons (IDPs) had reduced to 100,248 people who had evacuated and camped across the province in 172 IDP camps set up to cater for their basic needs... In addition to the volcanic ash, heavy rain fell and produced cold lahar flooding in Malang, Kediri and Blitar districts. This caused further damage to buildings, farm lands, and roads."
Table 4 gives data on damage to structures in the 3 affected districts surrounding Kelut through February 2014. The figures are expected to increase once a more thorough assessment is made.
Table 4. An initial assessment of the damage to housing and other buildings as a result of Kelut eruption volcanic ash. Courtesy of IFRC (2014).
| District | Totally damaged | Moderately damaged | Minor damaged |
| Kediri | 8,622 | 5,426 | 5,088 |
| Malang | 1,514 | 1,066 | 1,378 |
| Bitar | 957 | 878 | 1,578 |
| Totals | 11,093 | 7,370 | 8,044 |
As reported on 24 February 2014 in the Jakarta Globe (Pitaloka, 2014), "torrential rain in East Java on 23 February 2014 prompted local officials to impose a safety curfew over some areas affected by the eruption of Mount Kelud for fear that rainwater could mix with volcanic dust, triggering mud flows." The Head of the Malang Disaster Mitigation Agency, Hafi Lutfi, said rain had triggered landslides that damaged several sections of mountain road. "A mud flow in Padansari village on Thursday [13 February] washed away two houses and two bridges, although no casualties were reported... Volcanic mud was carried down the mountain's slopes by the river, which flows through Kasembon, Ngantang and Pujon subdistricts" (figure 26).
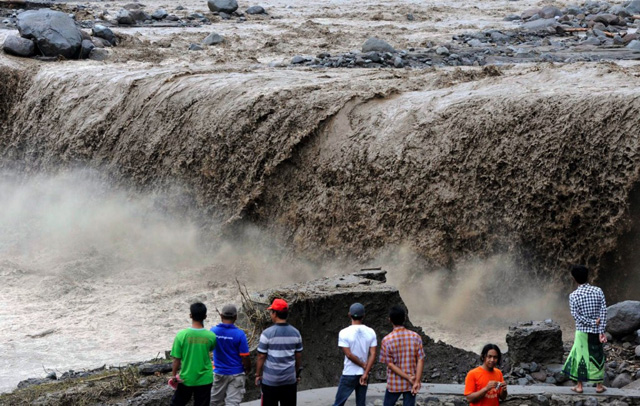 |
Figure 26. Villagers stand on the remains of a bridge washed out in Malang district near Pandansari village. The bridge succumbed to water mixed with volcanic material from Mount Kelut's eruption on 19 February 2014. From Pitaloka (2014); EPA photo by Fully Handoko. |
Lutfi was reported to have stated further that the "impact of Mount Kelud's eruption will extend far beyond the initial cleanup efforts. Fruit farmers reportedly lost more than Rp 24 billion ($2 million) in revenue as ash and debris destroyed whole fields of apples, durian and rambutan that were ready for harvest. The trees, covered in a thick coating of ash, had withered from lack of sunlight."
Background. The CVGHM reported that activity at Kelut last occurred in 2007, beginning with an increase in seismic activity and an eruption in October 2007. The activity ended with an effusive eruption on 3-4 November 2007 resulting with a crater lake surrounding a central lava dome (BGVN 33:03, 33:07, and 37:03).
References. Andersen, O.L., 2014 (22 February), Kelud Volcano, East-Java, Indonesia (URL: http://www.oysteinlundandersen.com/Volcanoes/Kelud/Kelud-Volcano-Indonesia-February-2014.html)
Andersen, O.L., 2011 (30 October), Mt. Kelud Volcano, Indonesia, 30 October 2011(URL: http://www.oysteinlundandersen.com/Volcanoes/Kelud/Kelud-Volcano-Indonesia-October-2011.html).
Carn, S., and Telling, J., 2014, Kelut 2014, IAVCEI (International Association of Volcanology and Chemistry of the Earth's Interior) Remote Sensing Commission (RSC) (URL: https://sites.google.com/site/iavceirscweb/eruptions/kelut-2014)
CIMSS Satellite Blog, 2014 (13 February), Eruption of the Kelut volcano in Java, Indonesia (URL: http://cimss.ssec.wisc.edu/goes/blog/archives/14910 ).
European Space Agency (ESA), 2014 (14 February), Kelut volcano grounds air travel, ESA Observing the Earth web site (URL: http://www.esa.int/Our_Activities/Observing_the_Earth/Kelut_volcano_grounds_air_travel).
Hoh, A., 2014 (14 February), Volcano eruption cancels Bali, Phuket flights and closes Indonesian airports, The Sydney Morning Herald (URL: 14http://www.smh.com.au/travel/travel-incidents/volcano-eruption-cancels-bali-phuket-flights-and-closes-indonesian-airports-20140214-32qd8.html)
International Charter Space and Major Disasters, (2014), Mount Kelud volcanic eruption in Indonesia (URL: http://www.disasterscharter.org/web/charter/activation_details?p_r_p_1415474252_assetId=ACT-481)
International Federation of Red Cross and Red Crescent Societies, 2014 (3 March), Emergency plans of action (EPofA), Indonesia: Volcanic eruption - Mt. Kelud (URL: http://reliefweb.int/sites/reliefweb.int/files/resources/MDRID009dref.pdf).
Klemetti, E., 2014a (11 February), Indonesian Eruption Update for February 11, 2014: Kelut and Sinabung (URL: http://www.wired.com/wiredscience/2014/02/indonesias-kelut-placed-highest-alert/)
Klemetti, E., 2014b (13 February), Significant Eruption Started at Indonesia's Kelut (URL: http://www.wired.com/wiredscience/2014/02/significant-eruption-started-indonesias-kelut/).
Klemetti, E., 2014c (24 February), Kelud, Before and After the Eruption (URL: http://www.wired.com/wiredscience/2014/02/kelud-eruption/).
National Aeronautics and Space Administration (NASA) Goddard Space Flight Center, 2014 (13 February), Kelut (Kelud) Eruption- February 13, 2014 (URL: http://so2.gsfc.nasa.gov/pix/special/2014/kelut/Kelut_summary_Feb14_2014.html)
Pitaloka, D.A., 2014 (24 February), Torrential Rain Worsens Kelud Misery, Jakarta Globe (URL: http://www.thejakartaglobe.com/news/torrential-rain-worsens-kelud-misery).
Volcano Discovery, 2014 (2 March), Kelut volcano news (URL: http://www.volcanodiscovery.Kelut volcano news & eruption updates _ 27 Sep 2007 - 2 Mar 2014.htm).
Information Contacts: Indonesian Centre for Volcanology and Geological Hazard Mitigation – CVGHM (also known as Pusat Vulkanologi dan Mitigasi Bencana Geologi (PVMBG)), Jalan Diponegoro 57, Bandung 40122, Indonesia (URL: http://www.vsi.esdm.go.id/); Darwin Volcanic Ash Advisory Centre (VAAC), Australian Bureau of Meteorology, Northern Territory Regional Office, PO Box 40050, Casuarina NT 0811, Australia (URL: http://www.bom.gov.au/info/vaac); MODVOLC, Hawai'i Institute of Geophysics and Planetology (HIGP) Thermal Alerts System, School of Ocean and Earth Science and Technology (SOEST), Univ. of Hawai'i, 2525 Correa Road, Honolulu, HI 96822, USA (URL: http://modis.higp.hawaii.edu/); Badan Nasional Penanggulangan Bencana (BNPB – Indonesian National Board for Disaster Management), Jl. Ir.H.Juanda No. 36 Jakarta Pusat, Indonesia (URL: http://www.bnpb.go.id); CIMSS (NOAA's Cooperative Institute for Meteorological Satellite Studies), University of Wisconsin – Madison's Space Science and Engineering Center (SSEC) (URL: http://cimss.ssec.wisc.edu/goes/blog/about); NOAA Satellite and Information Service, Automated OMI SO2 Alert System, High SO2 Concentration Areas (URL: http://satepsanone.nesdis.noaa.gov/pub/OMI/OMISO2/Alert/alert.html); National Aeronautics and Space Administration (NASA) Goddard Space Flight Center (URL: http://so2.gsfc.nasa.gov); European Space Agency (URL: http://www.esa.int); West Australian (Perth) news (URL: http://au.news.yahoo.com/a/21467336/); Sydney Morning Herald (URL: http://www.smh.com.au); Andersen, Oystein Lund (URL: http://www.oysteinlundandersen.com/); IAVCEI Remote Sensing Commission website (URL: https://sites.google.com/site/iavceirscweb/eruptions/kelut-2014); and Simon Carn, Department of Geological and Mining Engineering and Sciences, Michigan Technical University, Houghton, MI.
2014: January
| February
| August
2009: June
2007: September
| October
| November
2006: May
2001: January
| February
| April
PVMBG noted that due to visual and instrumental monitoring results as well as level of potential hazards the Alert Level for Kelut was lowered to 1 (on a scale of 1-4) on 12 August. Residents and visitors were advised to not approach the crater rim, crater floor, or the rivers that disgorge from Kelut.
Source: Pusat Vulkanologi dan Mitigasi Bencana Geologi (PVMBG, also known as CVGHM)
PVMBG noted that the Alert Level for Kelut was lowered to 2 (on a scale of 1-4) on 28 February.
Source: Pusat Vulkanologi dan Mitigasi Bencana Geologi (PVMBG, also known as CVGHM)
PVMBG reported that on 14 February, the day after a large eruption at Kelut that began at 2250 on 13 February, gray-to-black plumes rose 400-600 m above the crater. On 15 February grayish white plumes rose as high as 3 km. During 16-20 February white plumes rose as high as 1 km and drifted N, NE, and E. Heavy rain on 18 February caused lahars in Ngobo, Mangli (Kediri, 35 km WNW), Bladak (Blitar, 20 km SW), and Konto (Malang, 35 km E). BNPB noted that the lahars flooded five houses and one mosque, and destroyed two homes and one bridge.
The report noted that four out of the five seismic stations monitoring Kelut were destroyed during the eruption. The one remaining station, 5 km away, recorded declining seismicity during 14-20 February. Two more seismic stations were installed, 2-3 km from the crater, on 16 February. The Alert Level was lowered to 3 on 20 February. Visitors and residents were prohibited from approaching the crater within a radius of 5 km; residents outside of the 5-km restricted zone were permitted to return home.
Sources: Pusat Vulkanologi dan Mitigasi Bencana Geologi (PVMBG, also known as CVGHM); Badan Nacional Penanggulangan Bencana (BNPB)
PVMBG reported that at 2115 on 13 February the Alert Level for Kelut was raised to 4 (on a scale of 1-4). Visitors and residents were prohibited from approaching the crater within a 10-km radius. BNPB reported that a major eruption occurred less than two hours later at 2250, followed by another large explosion at 2330. Ash plumes rose to an altitude of 17 km (55,800 ft) a.s.l. and caused ashfall in areas NE, NW, and W, as far as Pacitan (133 km WSW), Kulon Progo (236 km W), Temanggung (240 km WNW), and Banyuwangi (228 km E). Forty flights from the Juanda (81 km NE), Adi Sucipto Yogya (208 km W), and Adi Sumarmo Solo (175 km WNW) airports were cancelled. News articles reported that flights in and out of seven airports were cancelled or rerouted. Ashfall and tephra 5-8 cm in diameter caused structures to collapse, including schools, homes, and businesses.
On 14 February BNPB reported that the eruption had killed four people: one died due to a collapsing wall, one from ash inhalation, and two from “shortness of breath”. All four victims lived within 7 km of Kelut in the regency of Malang, an area that received ashfall up to 20 cm thick. By 0600 the number of displaced people reached 100,248, but the report also noted that activity had declined. A report issued later that day noted that 76,388 people remained evacuated. Seismicity continued to decline and was at moderate levels during 15-17 February. An 18 February report noted that a total of seven people in Malang had died, and that the ashfall had affected cattle health and dairy production, farms, and the water supply. Damage to infrastructure in Malang included 3,782 houses, 20 government buildings, 251 schools, nine hospitals, and 36 churches.
Sources: Pusat Vulkanologi dan Mitigasi Bencana Geologi (PVMBG, also known as CVGHM); Badan Nacional Penanggulangan Bencana (BNPB); Jakarta Globe
PVMBG reported that during 3-10 February seismic activity at Kelut was dominated by both shallow and deep volcanic earthquakes; earthquake hypocenters were 3 km below the summit. RSAM values increased on 6 and 9 February. Inflation was detected at one station. Crater lake water temperatures increased since September 2013, particularly during 23 January-9 February. Temperatures decreased slightly on 10 February. Based on increased seismicity, inflation, and higher water temperatures, PVMBG increased the Alert Level to 3 (on a scale of 1-4) on 10 February. Visitors and residents were prohibited from approaching the crater within a 5-km radius.
Source: Pusat Vulkanologi dan Mitigasi Bencana Geologi (PVMBG, also known as CVGHM)
PVMBG reported that during 1 January-2 February the number of shallow volcanic earthquakes at Kelut increased, with peaks of seismicity occurring during 15-16 January, 28 January, and 2 February. The number of volcanic earthquakes also fluctuated but increased overall. Earthquakes occurred 2-8 km below Kelut. The temperature in the crater lake increased 5.5 degrees Celsius since 10 September 2013. On 2 February the Alert Level was raised to 2 (on a scale of 1-4).
Source: Pusat Vulkanologi dan Mitigasi Bencana Geologi (PVMBG, also known as CVGHM)
On 9 June, CVGHM reported that the Alert Level for Kelut was lowered to 1 (on a scale of 1-4). No changes had been seen; occasional diffuse white plumes rose 50-150 above the crater. CVGHM recommended that people not approach the lava dome due to instability of the area and the presence of potentially high temperatures and poisonous gases.
Source: Pusat Vulkanologi dan Mitigasi Bencana Geologi (PVMBG, also known as CVGHM)
CVGHM reported that on 29 November, the Alert level for Kelut was lowered from 3 to 2 (on a scale of 1-4), due to a decrease in seismicity and a lack of deformation. Observations of video footage from a camera on 25 November revealed that the lava dome was still active. Visitors and tourists were advised not to go within a 1.5-km radius of the crater lake.
Source: Pusat Vulkanologi dan Mitigasi Bencana Geologi (PVMBG, also known as CVGHM)
CVGHM reported that on 6 November, temperatures at the surface of Kelut's crater lake measured 75 degrees Celsius and the newly exposed lava dome surface measured 150-210 degrees Celsius. Plumes inhibited clear views of the lava dome. CVGHM lowered the Alert Status of Kelut on 8 November from 4 to 3 (on a scale of 1-4), due to a decrease in seismicity and stability indicated by deformation-monitoring instruments. CVGHM recommended that evacuees could return to their homes, but activity within a 3-km radius was restricted.
According on a news article, a volcanologist reported that the lava dome was 250 m in diameter and 120 m above the crater lake surface. On 11 November, a plume rose to an altitude of 3.7 km (12,000 ft) a.s.l. and ashfall was reported in several areas.
Sources: Pusat Vulkanologi dan Mitigasi Bencana Geologi (PVMBG, also known as CVGHM); Agence France-Presse (AFP)
CVGHM reported that a series of earthquakes from Kelut during 24-31 October were dominated by shallow events and tremor. Seismicity intensified during 2-3 November, and then decreased on 4 November. On 2 November the temperature of the crater lake was 50 degrees Celsius, the highest temperature recorded. On 4 November, white plumes rose to an altitude of 2 km (6,600 ft) a.s.l. and drifted N. Observations of video footage from a closed-circuit television camera revealed that a black mass protruded from the lake and was likely the cause of the plumes. The Alert Level remained at 4 (on a scale of 1-4).
Source: Pusat Vulkanologi dan Mitigasi Bencana Geologi (PVMBG, also known as CVGHM)
CVGHM reported that the Alert Level for Kelut remained at 4 (on a scale of 1-4) during 17-23 October. According to news articles, several thousand evacuated people remained in shelters.
Sources: Pusat Vulkanologi dan Mitigasi Bencana Geologi (PVMBG, also known as CVGHM); Agence France-Presse (AFP)
CVGHM reported that the Alert Status of Kelut was raised on 16 October from 3 to 4 (on a scale of 1-4). During 15-28 September, gas discharge from the crater lake increased and spread in a radius of 5 m. Inflation around the summit occurred during 13-16 October. On 16 October, the temperature in the crater lake increased to 37.8 degrees C.
In conjunction with the elevated Alert Status, CVGHM recommended to the local authorities that villagers within a 10 km radius should evacuate. According to a news article, about 50,000 people evacuated on 16 October. On 17 October, thousands of people returned to their homes to tend to crops and animals, and to get food.
Sources: Pusat Vulkanologi dan Mitigasi Bencana Geologi (PVMBG, also known as CVGHM); Associated Press
According to news articles, carbon dioxide and other gases emitted from Kelut reached 7 times normal levels. Increased seismicity and gas emissions prompted people from villages near the summit to self-evacuate. Villagers and tourists were advised not go within a 5 km radius of the active crater.
Source: Reuters
CVGHM reported that the Alert Status of Kelut was raised on 29 September from 2 to 3 (on a scale of 1-4) based on observations, increased seismic activity, deformation measurements, and changes of crater lake water chemistry and temperature. Villagers and tourists were advised not go within a 5 km radius of the active crater.
Sources: Pusat Vulkanologi dan Mitigasi Bencana Geologi (PVMBG, also known as CVGHM); Agence France-Presse (AFP)
CVGHM reported that the Alert Status of Kelut was raised on 11 September from 1 to 2 (on a scale of 1-4). According to a news report, the water in the crater lake increased in temperature and changed color from the usual green to yellow. Villagers and tourists were advised not go within a 5 km radius of the active crater.
Sources: Pusat Vulkanologi dan Mitigasi Bencana Geologi (PVMBG, also known as CVGHM); Agence France-Presse (AFP)
Based on a pilot report, the Darwin VAAC reported that on 18 May an ash plume from Kelut reached a height of 5.5 km (18,000 ft) a.s.l. The report was not verified by ground observations. [Correction: VAAC report did not mention ash in the plume]
Source: Darwin Volcanic Ash Advisory Centre (VAAC)
VSI reported that there were no major changes in volcanic activity at Kelut during 2-9 April. The temperature of the water in the crater lake decreased slightly. On 2 April the lake was at 48.5°C and on 9 April it was at 48°C. The volcano remained at Alert Level 2 (on a scale of 1-4).
Source: Pusat Vulkanologi dan Mitigasi Bencana Geologi (PVMBG, also known as CVGHM)
In the wake of earlier concern about renewed volcanic activity at Kelut, the VSI reported that during 12-17 February the temperature of Kelut's crater lake decreased and its pH increased. The temperature decreased to 47.5°C from a range of 50.1 °C to 51 °C, measured during 29 January to 7 February. The pH of the water increased to 5.3 from 5, measured on 7 February. The volcano remained at Alert Level 2 (on a scale of 1-4).
Source: Pusat Vulkanologi dan Mitigasi Bencana Geologi (PVMBG, also known as CVGHM)
VSI scientists found that the temperature of Kelut's crater lake had increased and its pH dropped as follows. During 29 January to 7 February the lake's temperature ranged from 50.1 °C to 51 °C, compared with 47.5 °C on 18 January and 38.5 °C on 8 January. On 7 February the pH of the water was 5, compared with measurements of 6.3 in January 2001 and 6.9 in November 2000. The volcano remained at Alert Level 2 (ranging from 1-4).
Source: Pusat Vulkanologi dan Mitigasi Bencana Geologi (PVMBG, also known as CVGHM)
The VSI reported that activity remained normal during 23-29 January. There were no major changes since the previous week when the Alert Level was raised from level 1 to 2 on 19 January after several monitored parameters changed at the volcano. Kelut remained at Alert Level 2 (on a scale of 1-4).
Source: Pusat Vulkanologi dan Mitigasi Bencana Geologi (PVMBG, also known as CVGHM)
On 19 January the VSI raised the Alert Level at Kelut from 1 to 2 (on a scale of 1-4). The temperature of the crater lake increased, the volcano inflated 5.5-6 mm, and a 5 cm increase in crater lake water level took place on 21 January.
Source: Pusat Vulkanologi dan Mitigasi Bencana Geologi (PVMBG, also known as CVGHM)
Reports are organized chronologically and indexed below by Month/Year (Publication Volume:Number), and include a one-line summary. Click on the index link or scroll down to read the reports.
Explosive eruption produces heavy tephra falls, pyroclastic flows, and lahars; more than 30 people killed
A strong explosive eruption on 10 February produced a large cloud and heavy tephra falls. Although evacuation began before the onset of the eruption, more than 30 people were reported killed in the densely populated area near the volcano.
Local seismicity increased to ~10x the normal rate between the middle and end of November, then returned to background levels. A second episode of increased seismicity occurred during the second and third weeks of January, accompanied by a rise in crater lake temperature from 32 to 38°C. Enhanced earthquake activity was again detected 7 February, and lake temperature peaked at 39-41°C. Measurements on 8 February indicated that lake pH had decreased to 4.2 from its usual 4.9, and hydrophones in the lake recorded noise at 3x normal levels. However, seismicity and hydrophone noise declined that day and remained relatively quiet until the onset of the eruption. During the night of 9-10 February, transmission from the lake instruments (via the ARGOS satellite) ceased. VSI issued an evacuation warning on 10 February at 1000. Press sources estimated the number of evacuees at 60,000.
The eruption began 10 February at 1141, with the strongest explosive phase at 1250, and activity continued until 1700. Pyroclastic flows traveled [5-6] km down the steep-walled valley on the E flank (from the breach in the summit crater), filling it to a depth of ~10 m. The crater lake was emptied during the eruption. However, most of the damage and casualties were attributed to heavy tephra falls that reached 20-30 cm thickness. In Nglegok (~55 km SW of the volcano) residents reported falls of fist-sized tephra, with some material that was head-sized. About 15 cm of ash accumulated at Blitar, ~25 km SW of the summit. Ashfalls were also reported from Malang, ~35 km E of Kelut. The weight of the tephra caused houses to collapse, trapping their occupants. As of 20 February, the official death toll had risen to 32, with >500 homes and 50 schools destroyed and many others damaged.
Tracking of the plume by satellite was made difficult by heavy weather cloud activity in the area. Imagery from Japan's GMS satellite at 1300 showed a bright cloud 53 km across centered over the volcano. At 1347, a NOAA polar orbiter image revealed that the plume, still roughly circular and centered over the volcano, had grown to ~160 km in diameter. Preliminary temperature analysis suggested that the top of the dense cloud was at ~12 km altitude, although diffuse material could have extended higher. By 1600, GMS data indicated that the plume had drifted slightly WSW and was ~310 km long. Very diffuse-appearing material could be seen extending to the NW coast of Australia, ~1,400 km from Kelut, on a NOAA polar orbiter image the next day at 1347. Dispersed remnants of the plume could be traced on GMS images until 1900.
Small explosions with associated glow and/or lightning were continuing during the night of 11-12 February, accompanied by strong seismic activity. A second strong explosive episode occurred between 1512 and 1827 on 12 February. Incandescent tephra rose 7 km above the crater. Rains triggered a major lahar on 15 February that moved downslope at 40-60 km/hour, inundating parts of subdistricts ~16 km NNW (Kepung) and 17 and 28 km NW (Ploso Klaten and Guran) of the summit, forcing residents to flee to high ground. Further heavy rains during the night of 16-17 February forced 50,000 Kepung subdistrict residents to flee. Minor eruptive activity for ~2 hours that night sent thick ash clouds to ~600 m above the vent. Additional lahars the next day moved downslope at ~45 km/hour, destroying hundreds of hectares of agricultural land.
Further Reference. Sudradjat, Adjat, 1991, A preliminary account of the 1990 eruption of the Kelut volcano: Geol. Jahrbuch, v. A127, p. 447-462.
Information Contacts: VSI; Y. Sawada, JMA; O. Karst, SAB; U.S. Embassy, Jakarta; T. Casadevall, USGS; Jakarta Post; UPI.
February eruption created new pit crater and emptied crater lake; high-temperature gas emission
The following is from Patrick Allard. "Joint investigations . . . were conducted by volcanologists from VSI, the French CNRS, and Paris Univ on 19 July, 25 August, and 2 September. Many months after the 10-12 February explosive eruption, intense activity was persisting.
"The topography of the crater (figure 1) was deeply modified by the eruption. The former crater lake (~2 x 10⁶ m3), blasted out during the initial eruptive phase, has been replaced by a pit crater ~450 x 500 m wide and 100 m deep. The walls of the pit are very steep and unstable, leading to frequent landslides. A lake of muddy water (85°C), 150 x 160 m, occupies its SE floor. Strong, loud emission of steam and gas (193°C, ~14 bars pressure for a steam-saturated reservoir) continuously occurs from two blowing vents N of the lake, contributing much of the plume that rises a few hundred meters above the crater rim. Gas samples were taken from these vents 19 July.
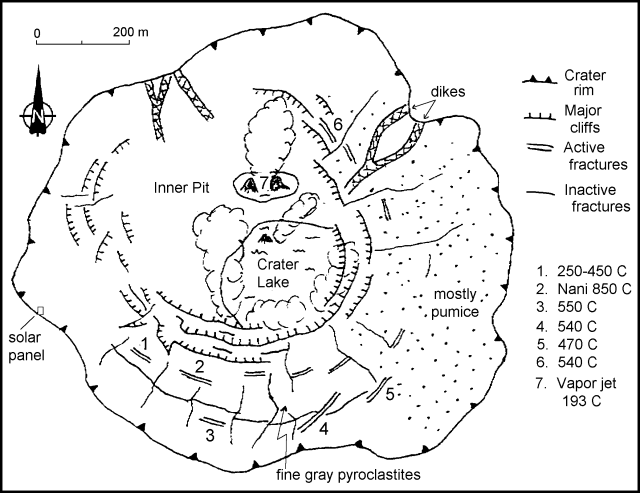 |
Figure 1. Sketch of Kelut's crater showing main sites of gas emission, August-September 1990. Courtesy of Patrick Allard. |
"Thick tephra layers from the February eruption have accumulated in the remaining parts of the crater, dipping with a gentle slope toward the inner pit. These layers are cut by arcuate fractures, more or less concentric to the pit walls, as well as by smaller radial fissures, which probably result from both compaction and sliding of the recent deposits. Some arcuate fractures are >1 m wide and 20 m deep. During our August visit it was discovered that high-temperature gases (>500°C, and up to 850°C at 1 m depth) escape from many of these, red glow being visible in the daylight at some sites. Gas plumes, varying in color from white to blue, mark the active vents, and the fractures and rims are blanketed with abundant sublimates. While some fractures are extinct, others are very recent, since their opening projected blocks and lapilli above the upper mud layer that formed during the rainy season (February-June). The release of high-temperature gases through these fractures may reflect either late (passive) degassing of cooling pyroclastic deposits from the February eruption or active degassing of a shallow magma body (residual intrusion?). Analysis of both stable and radioactive components in gas and aerosol samples collected at different sites may provide some geochemical insight into this question, as well as into the possibility of further phreatic or even phreato-magmatic events.
"Huge devastation in the Kelut area attests to the power of the February eruption. VSI estimated the total volume of erupted tephra at 120 x 106 m3 and that of lahar deposits at 24 x 106 m3. Given this volume and other parameters such as the maximum eruptive column height (~12 km) and the duration of the magmatic phase (~8 hours as a whole; 15:01), a VEI of 3 (high) to 4 (low) can be attributed to this eruption.*
"Rainfall over the volcano averages 5-7 x 10⁶ m3/year, so the crater lake could re-form during the next year or more, depending on the rate of heat output. The explosive blast of the crater lake and consequent lahar formation were responsible for most casualties from the past Kelut eruptions in 1919 (5,160 casualties), 1951 (7), and 1966 (210), even though this hazard was successfully mitigated by VSI during the 1990 eruption."
*Both VSI's estimate of tephra volume (>100 x 106 m3) and measurements of eruption cloud height meet the criteria of Newhall and Self (1982) for a VEI of 4. Preliminary temperature analysis from satellite images suggested that the top of the dense portion of the plume was at ~12 km altitude (15:01), but lidar data from the RV Akademik Korolev detected layers above 20 km altitude, well into the stratosphere, in the central and western Pacific shortly after the eruption [and the SAGE II instrument detected aerosols to 25 km] (see Atmospheric Effects, GVNB 15:08 and 15:12]).
Reference. Newhall, C.G., and Self, S., 1982, The Volcanic Explosivity Index (VEI): an estimate of explosive magnitude for historical volcanism: JGR (Oceans and Atmospheres), v. 87, no. C2, p. 1231-1238.
Information Contacts: VSI; P. Allard, G. Polian, and J-C. Sabroux, CNRS, France; A. Jambon and B. Marty, Univ Paris, France.
Continued fumarolic activity; 1991 pyroclastic-flow deposits to 400°C; small rain-induced lahars
The press reported on 26 November that four people had recently been killed by lahars that overflowed a river channel in the Blitar region (~30 km S of the summit).
During March fieldwork, gas was emitted from numerous fissures within and around the small light-green pool in the SE part of the former crater lake (15:09). The small hummocky area in the center of the former lake bed expelled hot gases (temperatures between 200 and 240°C, up from ~190°C in late 1990) under high pressure with a jet aircraft sound and very strong sulfurous odor.
Workers continued to quarry the still-hot (90-400°C) pyroclastic-flow deposits (~25 m thick) that buried the mouth of the Ampera Tunnel, in the SW side of the crater.
The average daily rainfall in March was 46 mm, and lahars were reported in the Ngobo (WNW flank) and Sumberagung (W flank) rivers. The latter river overflowed in the town of the same name (7 km W of the crater), but no victims or significant damages were reported. An average of two tectonic earthquakes (but no volcanic earthquakes) were recorded daily.
Information Contacts: W. Modjo, VSI; AP.
Crater lake temperature about 4°C above normal
Around September it was noted that the water temperature in this stratovolcano's crater lake increased from 45.6 to 47.0°C. This is several degrees warmer than the typical water temperature of 43.0°C. Thin white plumes escaped from several areas around the lake in association with the temperature increase. Volcanic earthquakes were absent in September.
Although relatively small and infrequently reported on . . . Kelut has produced some of Indonesia's most deadly eruptions. Multiple historical eruptions have had Volcano Explosivity Index values of 3 to 4. A 1586 eruption may have had a VEI of 5; an estimated 10,000 people died in lahars. There have been 10 fatal crater lake eruptions. Drainage tunnels to control the lake level have greatly reduced the destructive impact of recent eruptions. Kelut's 1000 AD eruption is the oldest historically recorded in Indonesia.
Information Contacts: Wimpy S. Tjetjep, Volcanological Survey of Indonesia, Jalan Diponegoro No. 57, Bandung 40122, Indonesia.
Inflation and increase in crater lake's temperature and surface height
Increasing crater lake temperature, water level, and inflation have been observed since 19 January 2001. Water temperature in the crater lake rose to 47.5-49.1°C. On 21 January water level rose 5 cm. Leveling measurement showed 5.5-6 mm of inflation. During 16-22 January, seismographs recorded 20 tectonic earthquake events. These observations prompted the VSI to increase Kelut's hazard status from 1 to 2 (on a scale of 1-4).
Information Contacts: Dali Ahmad, Volcanological Survey of Indonesia (VSI), Jalan Diponegoro No. 57, Bandung 40122, Indonesia (URL: http://www.vsi.esdm.go.id/).
Changes in water temperature, surface level, and pH detected in crater lake
Monitoring of Kelut's crater lake indicated a relative increase of water temperature, a rise in surface level, and a decrease in pH into late February 2001. The Volcanological Survey of Indonesia (VSI) released new information revealing that temperatures actually began to rise as of 8 January 2001, rather than on 19 February as disclosed in a previous report (BGVN 25:12). The lake reached a maximum temperature of 51.2°C on 30 January (table 1).
Table 1. Crater lake temperatures during 8 January-26 February 2001 and pH during November 2000-February 2001. The maximum temperature increase was 12.7°C, while the overall increase for the period was 9.3°C. In contrast, pH decreased. Courtesy of VSI.
| Date | Water Temperature (°C) | pH |
| Nov 2000 | -- | 6.9 |
| Jan 2001 | -- | 6.3 |
| 08 Jan 2001 | 38.5 | -- |
| 18 Jan 2001 | 47.5 | -- |
| 19 Jan 2001 | 49.1 | -- |
| 29 Jan 2001 | 50.1 | -- |
| 30 Jan 2001 | 51.2 | -- |
| 02 Feb 2001 | 50.1 | -- |
| 07 Feb 2001 | 51.0 | 5.0 |
| 13-19 Feb 2001 | 47.5 | 5.3 |
| 20-26 Feb 2001 | 47.8 | 5.3 |
A 60-cm increase in lake water level was observed as of 19 January relative to the height at an undisclosed earlier date. Workers measured pH values of the crater lake water and detected a significant overall decrease in pH, or an increase in acidity (table 1). VSI maintained a hazard status of 2 (on a scale of 1-4) since 19 January 2001.
Information Contacts: Dali Ahmad, Volcanological Survey of Indonesia (VSI), Jalan Diponegoro No. 57, Bandung 40122, Indonesia (URL: http://www.vsi.esdm.go.id/).
Crater lake temperature drops in early 2001; no activity reported
During 6 March-9 April 2001 at Kelut, the temperature of the crater lake decreased from 50 to 48°C. Tectonic earthquakes were recorded during mid-March 2001, with two occurring per week during 12-23 March. Visual and instrumental observations showed no significant changes. Kelut remained at Alert Level 2 (on a scale of 1-4). No further reports were issued through at least May 2003.
Information Contacts: Dali Ahmad, Volcanological Survey of Indonesia (VSI), Jalan Diponegoro No. 57, Bandung 40122, Indonesia (URL: http://www.vsi.esdm.go.id/).
Comparatively passive 2007 lava-dome emplacement in a crater lake
The extrusion of a substantial dome into the center of the active crater lake at Kelut (also spelled Kelud) started in early November 2007. The volcano and lake are among the most historically active and dangerous in Indonesia (Thouret and others, 1998). They were studied by members of the Volcanological Survey of Indonesia (VSI), Alain Bernard, and colleagues. During about 15 years prior to the eruption, the crater lake showed considerable hydrothermal influence, with temperatures several degrees above the ambient air temperature of 19°C, but with near-neutral pH. Prior to this eruption, the lake was ~ 34 m deep, ~ 350 m in diameter, and it held ~ 2.1 x 10⁶ m3 of water (Bernard and Mazot, 2004).
Lava was clearly seen emerging from the center of the lake on 4 November 2007. The activity was passive, even at the contact between the dome and lake. Neither water nor substantial ash were thrown forcefully out of the lake and onto the flanks. The dome rose rapidly above the lake, building a steep construct surrounded by a placid but dwindling lake. A well-defined depression crossed the dome's center, dividing its top surface in two. A few undated photos showed a mildly explosive phase. During 29-30 November the still-erupting dome was stable. As of early May 2008, tentative reports suggested that dome extrusion had ceased or paused. A lake still existed at that point.
Setting, historical lahars, and morphology. The volcano resides in a densely populated part of Java (1,800 people/km2) and could threaten over 3 million residents (Bernard, 2000). Bernard (2000) also noted that Kelut's approximately 30 historical eruptions have caused over 15,000 deaths since 1500 AD. Kelut's last eruption occurred in 1990 (BGVN 15:01). One of the most detailed VSI reports on Kelud's pre-eruptive behavior was issued 30 October 2007 (Surono, 2007).
Although lahars were absent during the 2007 eruption, lahars were associated with eruptions in 1919 and 1966; post-1996 lahars came in response to rainfall (figure 2). To control lahars and related problems, decades before engineers had driven a complex series of drainage tunnels through the edifice's walls, draining much of the lake.
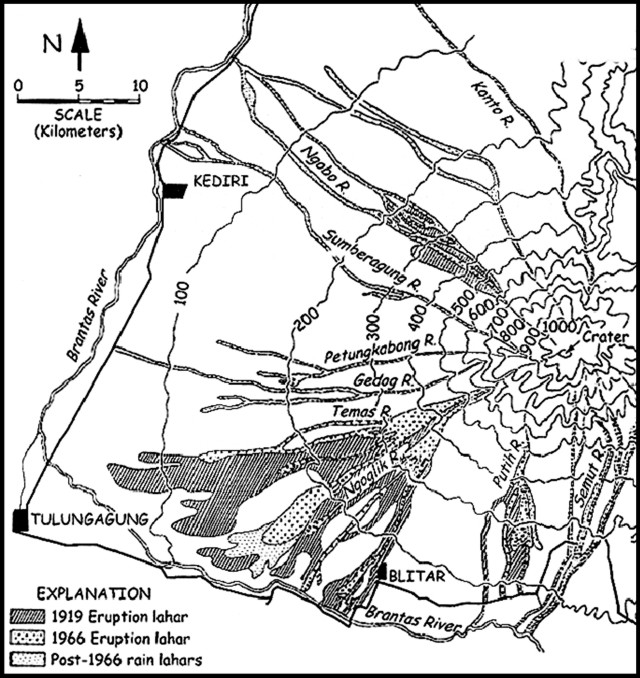 |
Figure 2. Map of Kelut showing prominent drainages on the W side and key settlements such as Kediri, Tulungagung, and Blitar (respective populations, 252,000, 970,000 and 1,200,000), and three sets of lahars. Heavy (often straight) lines indicate some local political boundaries. The 2007 eruption did not trigger lahars. After Rodolfo (1999). |
Lake chemistry. Active crater lakes such as Kelut's trap some fraction of the heat and fluids escaping the magmatic and hydrothermal system (Delmelle and Bernard, 1999), and their study has led to breakthroughs in eruption prediction. One example of this kind of study (figure 3) presents various heat and mass-balance factors in a model of Kelut's lake (Bernard and Mazot, 2004). Heat is derived from the enthalpy (E) of hydrothermal fluids (Ebrine + steam) and from solar and atmospheric radiation (Erad). Heat is lost by evaporation (Eevap), conduction (Econd), radiation (Erad), and by the overflow (Eover) of hot waters through the drainage tunnel.
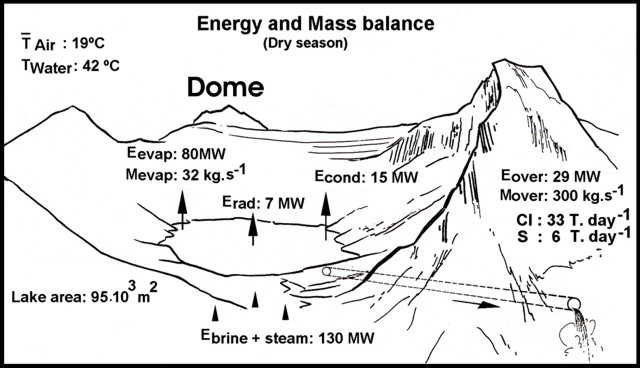 |
Figure 3. A sketch of Kelut's summit crater made prior to the 2007 eruption, looking E. The 2007 eruption built a dome in the lake's center. The irregular high area on the far wall of the crater (labeled "dome") is called Gunung Kelut, and is but one of many domes at the complex. The arrows are explained in the text. The dashed 'drainage tunnel' through the edifice walls is schematic, the actual tunnels consist of a network built in successive stages. Diagram after Bernard and Mazot (2004). |
Monitoring instrumentation is in place on and around the lake (figure 4). Fieldwork is also performed to measure the flux of CO2 emitted at the lake surface (figure 5). Numerous CO2-bearing gas bubbles rising to the surface were seen in July 2006. Bubbles were also widespread on bathymetric soundings (eg. detected at 50 and 200 kHz) in July 2007, and in some cases observers witnessed frequent discontinuous gas releases (puffing) from bottom fumaroles.
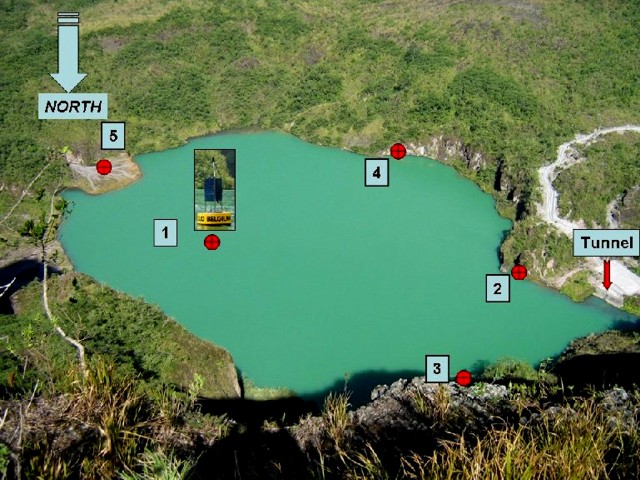 |
Figure 4. A pre-eruption photo showing Kelut's lake from a high point on the rim. Numbered sites are monitoring stations, as follows: 1) temperature and conductivity at 15 m depth and meteorological conditions (air temperature, relative humidity, and wind velocity), 2-4) lake level sensors, where the pressure difference between stations 3 and 4 functions as a N-S tilt meter), and 5) a radon sensor. Instrumentation also monitors the runoff volume in the drainage tunnel. A buoy (at 1) was one of three ultimately installed in the lake. A service road down the crater wall leads to the lake end of a drainage tunnel. Courtesy of A. Bernard. |
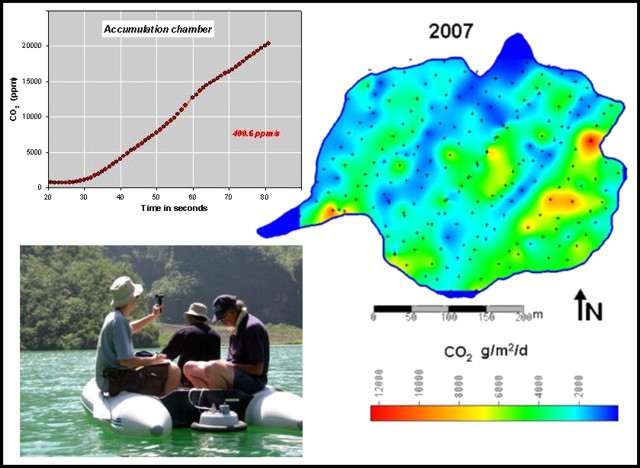 |
Figure 5. (bottom left) A July 2006 photo at Kelut of the team taking a CO2 flux measurement at a sample site. The team consisted of (left to right) Loic Peiffer, Khirul Huda from VSI, and Alain Bernard. The team used a floating accumulation chamber connected by tubing to a dedicated spectrometer residing in the boat. (top left) A graph of 2007 spectrometer data from a sampling cycle with the accumulation chamber. After a lag time of ~ 30 seconds, the accumulation rate was stable at a slope of ~ 400 ppm/s. (right) Resulting map of lake surface showing CO2 flux per unit area (in the units of grams per square meter per day, g/(m2/d)). The map resulted from 230 spot measurements taken between 30 July and 2 August 2007. Courtesy of Alain Bernard. |
The CO2 flux from the lake's surface was measured by IR spectrophotometry using a Dr?ger Polytron instrument. Bernard's team modified a technique initially developed for monitoring the flux of gases in soil (Chiodini and others, 1996), applying this method by means of the floating accumulation chamber at multiple sites.
According to the VSI report, carbon dioxide (CO2) concentrations measured during 30 July to 2 August 2007 ranged from below 500 g/m2/d to hotspots of 12,000 g/m2/d, especially in the E portion of the lake. The overall flux of CO2 from the lake reached more than 500 tons/day on 11 September 2007, about ten times greater than measurements made in 2005 and 2006 (figure 6).
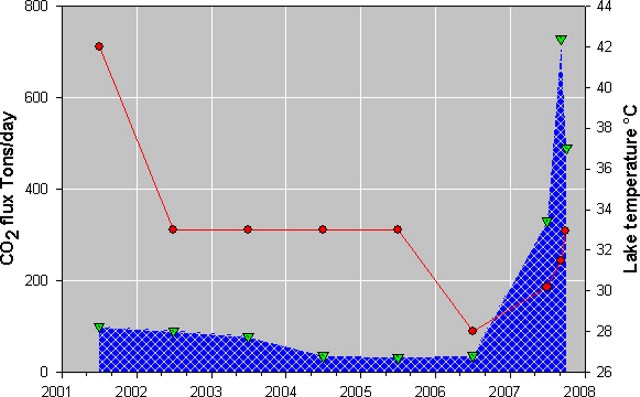 |
Figure 6. A plot for Kelut from 2001 through 2 August 2007 showing water temperature and total CO2 flux from the lake. The total CO2 flux was estimated by normalizing the data to the relevant lake area at Kelut, 103,600 m2). The latest CO2 field measurements were made during 30 July to 2 August 2007. The line shows lake temperature readings (taken at uncertain depth and location, but presumably more consistently measured than temperature data shown on table 2. Unfortunately, these plotted temperature data do not extend into late 2007 when table 2 suggests lake temperatures rose more than 50°C higher, to ~ 78°C). |
Data on lake chemistry (table 2) was compiled by Surono (2007) and Bernard (2000). The water chemistry of the active crater lake showed both stable and variable parameters. Comparatively stable ones included pH and during various time periods (including 2007), some chemical species. Among the largest perturbations were a sudden, almost two-fold rise in SO2 during September-October 2007; and a rapid increase in lake water temperature during November 2007. Soluble Cl stood over 1,000 ppm during 1993 and dropped sharply reaching a low of 67 ppm on 20 August 2007. It climbed after that, reaching 354 ppm in the last (11 November) measurement, a value taken about a week after the dome broke the lake surface.
Table 2. A compilation for Kelut's lake water showing temperature, pH, and chemical concentration data from VSI for 2007 (Surono, 2007) and Alain Bernard (2000) during 1993 to 2005. Some of the data presented here were rounded and the number of significant figures reduced. The 23 October 2007 Cl value was variously reported. Some of the original data were presumably collected at different locations and depths; and some of the original data included additional parameters such as total dissolved solids (see cited publications). Eruptions began on 3 November 2007, and the dome emerged above the lake surface on 4 November.
| Date | Temp (°C) | pH | Na | K | Ca | Mg | HCO3 | Cl | SO4 | B |
| 18 Dec 1993 | 42.8 | 5.9 | 700 | 92 | 105 | 55 | 238 | 1,297 | 631 | 11 |
| 01 Aug 1994 | 42.1 | 6.3 | 1,024 | 102 | 130 | 67 | 207 | 1,289 | 692 | 14 |
| 24 Sep 2002 | 33.2 | 6.5 | 342 | 39 | 135 | 80 | 435 | 289 | 670 | 4 |
| 04 Sep 2003 | 30.7 | 6.5 | 271 | 30 | 147 | 78 | 472 | 202 | 679 | 2.5 |
| 27 Apr 2005 | 32.2 | 6.6 | 198 | 23 | 121 | 71 | 330 | 139 | 571 | 2 |
| 20 Aug 2007 | 31.5 | 6.9 | 104 | 14 | 166 | 48 | 221 | 66.5 | 538 | 0.8 |
| 16 Sep 2007 | 33.2 | 6.4 | 106 | 16 | 184 | 52 | 294 | 120 | 1,083 | 1.1 |
| 25 Sep 2007 | 33.4 | 5.9 | 109 | 17 | 178 | 51 | 279 | 133 | 1,121 | 1.3 |
| 29 Sep 2007 | 36.1 | 5.9 | 109 | 17 | 179 | 45 | 279 | 137 | 1,121 | 1.5 |
| 23 Oct 2007 | 38.4 | 5.8 | 257 | 22 | 186 | 56 | 297 | 210 (173) | 1,119 | 1.3 |
| 28 Oct 2007 | 39.2 | 5.6 | 117 | 20 | 190 | 48 | 303 | 179 | 1,151 | 1.4 |
| 02 Nov 2007 | ~50 | -- | -- | -- | -- | -- | -- | -- | -- | -- |
| 06 Nov 2007 | 77.5 | 6.7 | 124 | 21 | 200 | 48 | 170 | 294 | 542 | 1.7 |
| 11 Nov 2007 | 77.8 | 6.2 | 130 | 21 | 223 | 45 | 26.3 | 354 | 615 | 2.1 |
Monitoring, hazards status, and dome extrusion. Visual monitoring was carried out by means of a closed-circuit video monitor installed on Mount Lirang, as well as from photographs taken in or near the crater. During 15-28 September, gas emissions from the crater lake increased and spread over a zone within a radius of ~ 5 m.
According to Surono (2007), pre-eruption CO2 fluxes from the lake were typically 50 metric tons/day. During August 2007 they rose to 333 tons/day; during late August to early September they reached 500 tons/day.
During 2006, the Darwin Volcanic Ash Advisory Center (VAAC) reported a pilot observation. An ash plume on 18 May 2006 allegedly reached an altitude of 5.5 km.
On 17 October 2007 Kelut was the subject of further VAAC reports, first noting the elevation of the hazard status to 4 (the highest level, indicating an eruption imminent). On 23 October there was a brief noting evidence from a satellite of a eruption (to ~ 6 km altitude) but ground observers suggested that it was a meteorological cloud. A VAAC report on 4 November noted "ash not identifiable on satellite imagery." On 8 November an advisory noted the continued absence of identifiable ash.
Seismicity rose suddenly on 10 September 2007 (figure 7). It peaked on 16 October at all four seismic stations on or adjacent the volcano, at 510 events. The next day, the number of earthquakes still stood quite high, 151.
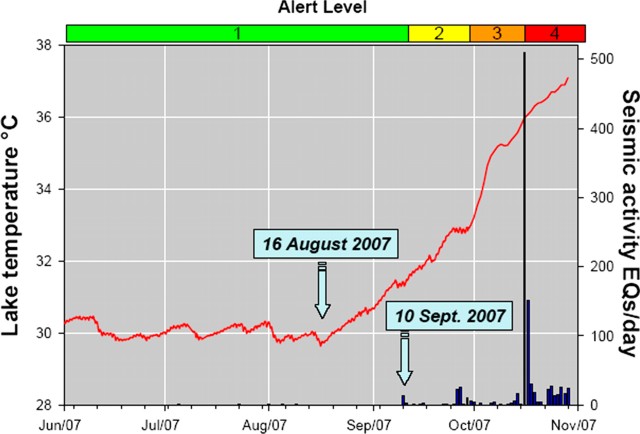 |
Figure 7. Kelut seismicity, lake-water temperature, and Alert Levels registered during June to early November October 2007. After plots by Surono (2007) and Bernard. |
Cross sections showing hypocenters for 10-11 and 26-29 September 2007 depicted them broadly centered below the edifice but distributed around 2.5 km depth; they were initially absent in a zone about 2-3 km below the summit . During mid-October the hypocenters became more closely packed along a narrow vertical band beneath the edifice. They then filled a zone 0.7-1.2 km beneath the summit, with a few other hypocenters centered ~ 2 km below the summit. During 24-29 October, many hypocenters clustered ~ 6 km below the summit, but others strung out on or about a vertical line intersecting near the summit. The shallowest events plotted were then ~ 1 km below the summit. Reports also noted tremor was common during 24 October through 4 November.
VSI issued a series of increases in Kelut's hazard status (a scale of 1-4, figure 7). On 11 September 2007, VSI raised the status from 1 to 2. This corresponded to the CO2 flux mentioned above, a sudden jump in seismicity on 10 September (figure 7), and changes in both lake temperature and color, which shifted from its usual green, becoming yellow in some areas and blue-white in others. On 29 September, the status went from 2 to 3 based on visual observations, increased seismicity, deformation measurements, and further changes of crater lake water chemistry and temperature.
VSI brought the status to 4 on 16 October (figure 7). Factors included the sudden rise in seismicity, and the summit's inflation during 13-16 October. Before the crisis of 16 October the lake water was whitish green; after the crisis, dominantly green. VSI to recommend that villagers within a 10-km radius evacuate. According to a United Nations report, local authorities evacuated ~ 117,000 people within this radius. The UN report cited Indonesian media as stating that an eruption could affect as many as ~ 290,000 people (figure 8).
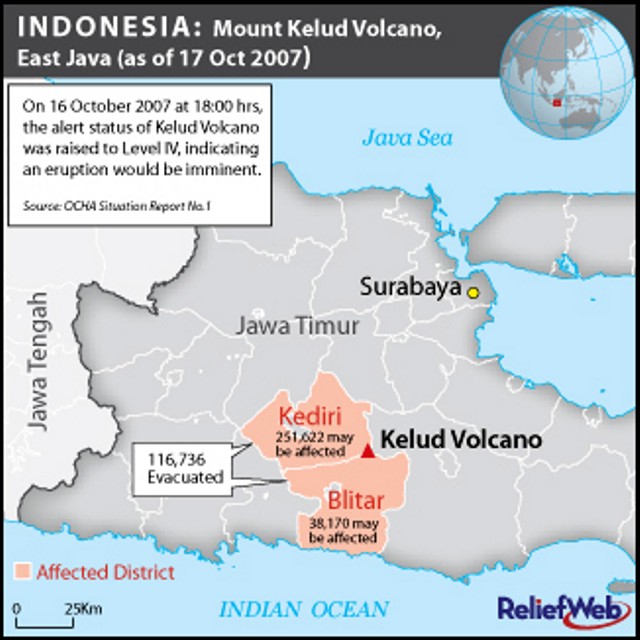 |
Figure 8. A map of a portion of E Java that indicates the location of Kelut (sometimes written as "Kelud," as is the case here) and the major city Surabaya (~ 85 km NE; population, ~ 4 million). The map was issued after the alert status was raised to the highest level ("4"; at 1800 on 16 October) and indicates the number of people in two adjacent jurisdictions that could be affected by its eruption. Courtesy of Relief Web (United Nations); boundaries and names shown and the designations used on this map do not imply official endorsement or acceptance by the United Nations. |
According to a news article, thousands returned to their homes on 17 October to tend to crops and animals, and to retrieve food. On 8 November the status fell to 3 and residents were allowed to return home. On 29 November the status fell from 3 to 2 following both decreased seismicity and a lack of deformation. At this stage, people were advised to remain at least 1.5 km from the lake.
During 24-31 October, a series of regional earthquakes occurred, dominated by shallow events and tremor. Seismicity intensified during 2-3 November, but then decreased on 4 November.
Dome emerges during 3-4 November 2007. On 3 November, VSI and news media mentioned plumes, and possibly some evidence of erupted solids entering the lake. Also, their buoy ceased functioning. On 4 November, white plumes rose to an altitude of 2.2 km and drifted N.
Plumes on the 4th came from a fresh black lava dome, protruding from the then turbid green lake. Monitoring cameras showed copious steam obscuring the dome. The exposed mass grew quickly. Although steaming continued, relative calm usually prevailed at both the dome and the lake. Although the dome steadily displaced the lake, the water did not undergo violent broad-scale boiling.
According to VSI, the temperature at the surface of the crater lake on 6 November had climbed to over 75°C. The newly exposed dome surface was 150-210°C. Plumes generally inhibited clear views.
On 8 November, VSI reported a decrease in seismicity, and deformation-monitoring suggested greater stability. An infrared camera (FLIR) captured images of the dome on 9 November as it emerged from the lake. The images revealed considerable radiant heat in the FLIR-sensitive wavelengths (figure 9).
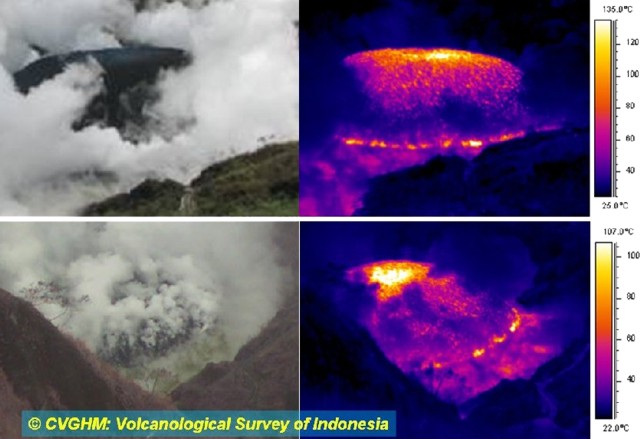 |
Figure 9. On 9 November 2007, scientists looking at Kelut's new dome took these two photos, and at right, coinciding infrared (FLIR) images. The scale bars on the FLIR images indicate that the highest temperatures were on the order of 135°C. The hottest zones occurred both over a large area at the dome's top and along a band following the dome near the lake surface. Courtesy of VSI and taken from Bernard (2007). |
According to a news article by Agence France Presse on 12 November, a volcanologist reported that the lava dome had reached 250 m in diameter and was 120 m above the lake surface.
November photos and videos. On 11 November, a plume rose to an altitude of 3.7 km and ashfall was reported in several areas. News accounts indicated that tremors continued and that Kelut was spewing ash and lava. More photos of the dome, particularly during 10-29 November, would be useful for understanding activity in this period.
An undated video provides views of a short-lived avalanche down from the new dome's upper walls. Based on the size of the dome then, the scene was probably captured in mid- to late November (it was posted on 7 December; Masdjawa, 2007). The avalanche initially contained on the order of 5-20 m3 of loose material, much of it incandescent in daylight. A large portion of this material bounced downslope into the steaming lake. When sufficient fragmental material entered the lake an intense phreatic eruption took place. The clouds rose vertically; they were initially jet black, but within tens of seconds became dominantly white steam, hiding the dome for ~ 1-2 minutes.
Daniel Brazilier visited during 25-26 November and saw mildly to moderately explosive activity; his photos appeared in Societe de Volcanologie Geneve reports (SVG, 2007). Many of his photos were taken during daylight from ~ 1.5 km away; they showed several explosions with billowing white-to-tan clouds. The foreground, the W crater wall, contained small amounts of tephra and some bombs. The billowing clouds appeared to contain minor ash; they vented from the dome upper area or side, and accompanied numerous steaming bombs, which from their arcing trails, seemed destined to land within the crater. Night photos disclosed large areas of incandescence on the W side.
Tom Pfeiffer took a series of remarkable photos on 29-30 November 2007, documenting a surprisingly large and clearly fast-growing dome. He posted over 60 photos on the Volcano Discovery website and elsewhere, and several of them appear here (figures 10, 11, and 12).
 |
Figure 10. Kelut's dome seen in low-light conditions on 29 or 30 November 2007 in a view looking towards the E. Myriad incandescent fragments detached from the dome, leaving incandescent scars in the middle to upper dome area. The dome's summit area and much of its lower skirt are chiefly dark, except in the latter case for the trails of material bouncing and falling past. The much reduced lake was calm and wrapping around the dome's left (N) side. The segment of the crater rim towering above the new dome's right side is the older dome mentioned in figure 3. Copyrighted photo by Tom Pfeiffer (Volcano Discovery). |
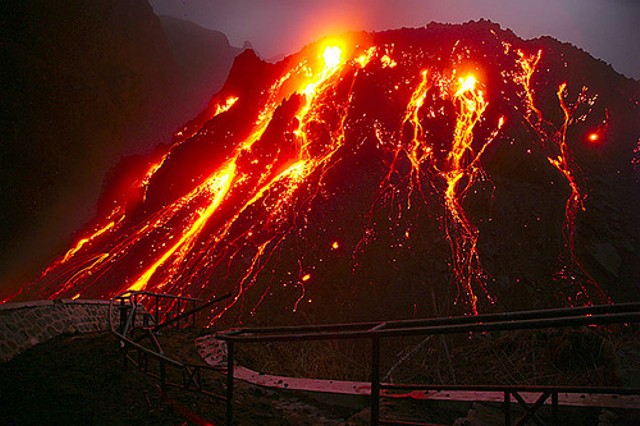 |
Figure 11. A NE view under dark conditions of Kelut's growing dome at a time on 29 or 30 November when dome incandescence was particularly high. In the foreground is the pathway leading to the lake. Comparatively few bombs littered the curbing along the pathway, but pelting from bombs had apparently damaged the steel hand-rail in a few places. Copyrighted photo by Tom Pfeiffer (Volcano Discovery). |
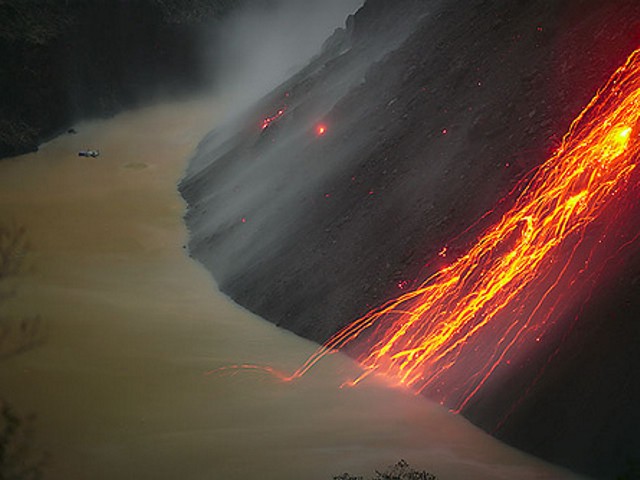 |
Figure 12. Kelut's new lava dome had reduced the crater lake to a narrow band by 29-30 November 2007. This low-light photo looking NE captured the shrinking lake and its contact with the new dome. At right is a prominent avalanche chute choked with the incandescent trails of bouncing blocks. Upon entry into the lake some of the trails made a second bounce. Copyrighted photo by Tom Pfeiffer (Volcano Discovery). |
Note that Pfeiffer's photos are night-time shots with long exposures and thus the impression of large glowing areas implies more activity than really occurred at any one time. The dome had clearly crowded out the then green or brownish lake, which in the field of view had been reduced to an arcuate sliver. The extent of the lake on the dome's W and SW sides was unclear from his perspective.
Particularly on figures 10 and 11, the dome was rife with abundant glowing zones and numerous red traces due to incandescent dome rocks bouncing downslope. Abundant were glowing avalanche trails, and large rockfall scars. The photos also suggest possible lava seeps and narrow lava flows, although Tom Pfeiffer attributed most of the incandescence to mobile and solidified material, rather than narrow zones occupied by fluid moving lava.
A few of the glowing traces in the photos terminate upon entering the crater lake (figure 12). After their first contact with the water, some of those descending traces also seemingly shattered and bounced, producing one or more secondary arcs (akin to a skipping stone).
Pfeiffer described the scene as "filled with the noises of cracking lava, falling debris, and chilled lava blocks that splashed into the lake." He went on to note the lack of "explosions, or major ash emissions attached to the activity. The lava dome was simply growing quietly and not doing anything else than what is visible on the photos." He was struck by the observation "that the lake was simply there and NOT boiling. A sign how well rock insulates. Also, the upper 10 meters of the dome, its very top, were rather inactive, like the top of a mushroom being lifted up. The most active zones were just underneath that upper crust . . .."
References. Bernard A., and Mazot A., 2004, Geochemical evolution of the young crater lake of Kelud volcano in Indonesia: Proceedings of the Eleventh International Symposium on Water-Rock Interaction, Saratoga Springs, New York, USA, v. 1, p. 87-90.
Bernard, A., 2000, Geochemistry of the crater lake of Kelut volcano, Indonesia: Essay labeled "in preparation" on the http://www.ulb.ac.be/ website.
Bourdier, J. L., Pratomo, I., Thouret, J.C., Boudon, G. and Vincent, P.M., 1997. Observations, stratigraphy and eruptive processes of the 1990 eruption of Kelut volcano, Indonesia: J. Volcanol. Geotherm. Res., v. 79, p. 181-203.
Delmelle, P., and Bernard, A., 1999, Volcanic lakes, in Encyclopedia of volcanoes, H. Sigurdsson (ed.): Academic Press, p. 877-895.
Masdjawa, 2007, Kelud-Kubah Lava: Kelud_03.mpg (23.2 Mb), 2 min 20 sec; http://masdjawa.multiply.com/video/item/4
Rodolfo, K. S., 1999, The hazard from lahars and Jökulhaups, in Encyclopedia of volcanoes, H. Sigurdsson (ed.): Academic Press, p. 973-995.
Surono, 2007, Pusat Vulkanologi Dan Mitigasi Bencana Geologi, Pos Pengamatan Gunungapi Kelut (Hasil evaluasi tingkat kegiatan G. Kelut): Departemen Energi Dan Sumber Daya Mineral, Republik Indonesia, Badan Geologi, Nomor, 112/GK/X/2007, 30 Oktober 2007.
Thouret, J. C., Abdurachman, K. E., and Bourdier, J. L., 1998, Origin, characteristics, and behavior of lahars following the 1990 eruption of Kelud volcano, eastern Java (Indonesia): Bull. Volcanol., v. 59, p. 460-480.
Information Contacts: Volcanological Survey of Indonesia, Center of Volcanology and Geological Hazard Mitigation, Saut Simatupang, 57, Bandung 40122, Indonesia (URL: http://vsi.esdm.go.id/); Alain Bernard, Free University of Brussels, CP 160/02, 50, avenue F, Roosevelt, 1050 Brussels, Belgium (URL: http://www.ulb.ac.be/sciences/cvl/); Relief Web, United Nations Office for the Coordination of Humanitarian Affairs, Resident Coordinator's Office, Jakarta, Indonesia (URL: https://reliefweb.int/, http://www.unocha.org/); Darwin Volcanic Ash Advisory Center, Bureau of Meteorology, Northern Territory Regional Office, PO Box 40050, Casuarina, Northern Territory 0811, Australia (URL: http://www.bom.gov.au/info/vaac/); Tom Pfeiffer, Volcano Discovery (URL: http://www.VolcanoDiscovery.com/); Daniel Brazilier, France.
Lava dome reached 35 million cubic meters; eruptions ceased in mid-May
According to Alain Bernard, the lava dome that extruded in late 2007 (BGVN 33:03) continued to increase in size until it covered much of the crater lake and it rose to overwhelm the drainage inlets. Bernard noted that dome growth had seemingly ceased by April 2008. Around that time (but at unstated date), VSI made initial estimates of the dome's dimensions as 200 m high, 400 m wide, with a volume of 35 x 106 m3.
The lake was almost gone by the middle of May 2008. The temperature of flow of waters at the end of the drainage tunnel (~ 960 m away from the dome) has been reported to be higher than in the crater lake, 66.7°C. Both phreatic and magmatic degassing was very minor. A very small amount of ash was emitted, and there were no lahars
On 12 May 2008, the eruption status was downgraded to Green, a level indicating that either no significant eruption is expected or that fewer than 100,000 people within 100 km of the volcano would be affected by activity.
Information Contacts: Alain Bernard, Free University of Brussels, CP 160/02, 50, avenue F, Roosevelt, 1050 Brussels, Belgium (URL: http://www.ulb.ac.be/sciences/cvl/); Volcanological Survey of Indonesia, Center of Volcanology and Geological Hazard Mitigation, Saut Simatupang, 57, Bandung 40122, Indonesia (URL: http://vsi.esdm.go.id/).
Amid quiet, a look back at aspects of the 2007 eruption
A memorable eruption at Kelut began in August 2007 injecting what became a substantial lava dome in the midst of a crater lake. The process was devoid of large violent steam explosions of the kind often associated with molten lava extruding into a lake. The passively emplaced lava dome evaporated and displaced most or all of the crater lake. Dome extrusion had clearly stopped by April 2008 (BGVN 33:07) or perhaps by May 2008 (De Bélizal and others, 2012). Since then and as late as April 2012, the Center of Volcanology and Geological Hazard Mitigation (CVGHM), has noted ongoing quiet, at times broken by the emergence of diffuse white plumes. Those plume were seen in June 2009 rising 50-150 m above the crater and the new dome was still emitting steam in February 2012. As of 30 March 2012, the Alert Level remained Green, although CVGHM recommended that people not approach the lava dome due to instability of the area and the presence of potentially high temperatures and poisonous gases.
Three short subsections follow. The first discusses uplift at Kelut during 2007-2008 as part of a larger survey of volcanic deformation on Java (Philibosian and Simons, 2011). The next subsection discusses a paper that provides an overview on the unexpectedly tranquil eruption, which, though of substantial size, was one of Kelut's few substantial yet passive eruptions in the historic record (De Bélizal and others, 2012). The authors surveyed residents to assess how they felt about how authorities had managed the crisis. The third subsection below discusses the dome's declining thermal output in early 2008, and presents a photo taken in February 2011 showing the steaming dome's spiny upper surface.
2007-2008 deformation. Philibosian and Simons (2011) discussed satellite-borne (Japanese ALOS) L-band synthetic aperture radar used to conduct a comprehensive survey of volcanic deformation on Java during 2007-2008. For Kelut, the authors found a possible 15 cm line-of-sight change in late 2008, an uplift. The area of uplift was limited to the very top of Kelut and was only a few hundred meters wide. However, the authors state that, given there were only two radar acquisitions after this late 2008 uplift, it was "difficult to judge whether this was permanent, real deformation rather than a short-term atmospheric effect." According to the authors, "the volcano did not exhibit a significant deformation before or during the dome extrusion in our time series" (figure 13).
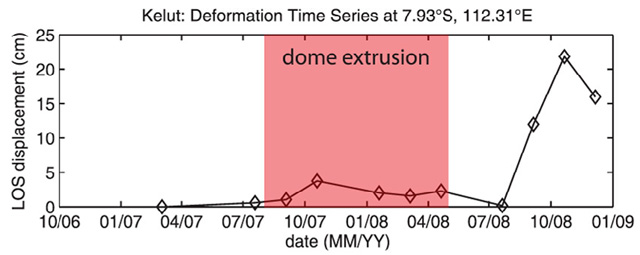 |
Figure 13. Time series of Kelut's deformation during October 2006-January 2009 (summing all the time steps and for satellite track 428). The plot shows the 15-cm line-of-sight change consistent with an uplift peaking during late 2008. The period of observed lava dome extrusion (shown in red) corresponded with a minor uplift (under 5 cm along the line of sight). Taken from Philibosian and Simons (2011). |
2007 eruption and crisis management revisited. De Bélizal and others (2012) discuss a survey conducted shortly after the end of an evacuation process triggered by Kelut's eruption that started in 2007.
The authors summarized Kelut's unrest that started prior to the extrusions first seen in August by noting that earlier, on 1 November 2007, CVGHM recorded a new peak of seismicity with signals having reached shallow depths beneath the crater floor. The crater lake temperature recorded by a thermal camera increased significantly by 6 November. A steam plume developed, reaching 550 m above the crater lake. A new lava dome extruded through the ~350 m diameter crater lake (BGVN 33:03). Progressively, nearly all the lake water vaporized as the lava dome grew to a diameter of 400 m and a height of 260 m representing a volume of ~35 x 106 m3.
According to De Bélizal and others (2012), "recorded volcanic seismicity decreased shortly after the onset of dome growth. Tiltmeter records also showed the absence of any significant deformation on the flanks of the volcano. These data suggested that the magmatic pressure decreased within the volcano therefore greatly reducing the likelihood of a violent explosion. Thus, on 8 November 2007, Indonesian authorities decided to end the emergency phase. The volcano Alert Level was lowered to Level 3 'Siaga' until 30 November, when it was then lowered to Level 2 'Waspada' until August 2008."
The passively extrusive and unexpectedly non-explosive eruption was the first here in recent historical times. This called for careful monitoring of both the eruptive behavior of the volcano and the stability of a lake-bound dome plugging the vent. Tourism and agriculture ceased on its flanks for many months in anticipation of potential sudden signs of renewed activity.
The article stated that the crisis management team ordered an evacuation, which followed the rise to Alert Level 4 on 16 October 2007 (BGVN 33:03), but it noted that many residents disregarded the order because they did not consider that an eruption was imminent. The authors conducted interviews with members of the crisis management team, and undertook a questionnaire-based survey in the settlement nearest to the crater to determine how residents reacted to the crisis and how they thought authorities managed the crisis. The survey was carried out while Kelut was still under surveillance for fear of an explosive phase. According to the authors, the crisis management team "was well organized and strategic"; however, the results "showed that crisis management was not fully integrated with the way of life of the local communities at risk, and that information, communication and trust were lacking."
Decreasing thermal alerts in 2008 and an early 2011 photo. During November and December 2007, there were numerous days with MODVOLC thermal alerts. This number decreased in January 2008 to only six days that month. After January 2008, thermal alerts had been absent as late as 27 April 2012. The probable cause was the cooling of the dome to the point where the levels of thermal radiation emitted dropped below the threshold values needed to create MODVOLC alerts.
A photo of Kelut taken by Daniel Quinn in early 2011 shows the steaming, rough-surfaced lava dome in the crater (figure 14). The photo only showed a small portion of the entire crater floor, but on the N side of the dome, the crater floor contained a dark brown, muddy-colored patch of water the photographer considered a large puddle. Some 2010 photos on the Picassa website showed a small body of water on the crater floor at that time.
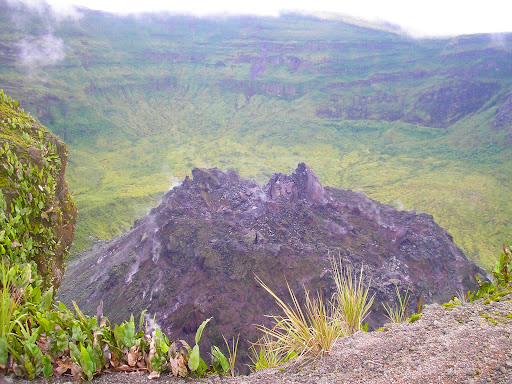 |
Figure 14. A late January or early February 2011 photo taken of Kelut's new dome from a high spot on the NNW rim. Apparent are both the dome's spiny upper surface, and many areas of the dome still emitting small amounts of steam. The photo appeared on the Picassa website and is used with the permission of the photographer, Daniel Quinn. |
According to Daniel Quinn, the photo in figure 14 was taken on the rim at a spot accessed via a small pavilion he passed walking from the car parking area. He took the photo having walked clockwise about as far around the rim as he could travel before reaching vertical cliffs. Pungent odors were absent during his visit.
References. De Bélizal, É., Lavigne, F., Gaillard, J., Grancher, D., Pratomo, I., and Komorowski, J. , 2012. The 2007 eruption of Kelut volcano (East Java, Indonesia): Phenomenology, crisis management and social response, Geomorphology, v. 136, issue 1, p. 165-175.
Philibosian, B., and Simons, M., 2011. A survey of volcanic deformation on Java using ALOS PALSAR interferometric time series, Geochemistry Geophysics Geosystems, v. 12, no. 11, 8 November 2011, Q11004, 20 pp. (DOI:10.1029/2011GC003775).
Information Contacts: Center of Volcanology and Geological Hazard Mitigation (CVGHM), Jalan Diponegoro 57, Bandung 40122, Indonesia (URL: http://vsi.esdm.go.id/); Daniel P. Quinn (URL: http://bubbingtondump.com/).
Eruption with plume top over 26 km altitude; ~7 deaths and over 100,000 refugees
On 13 February 2014, the Indonesian National Board for Disaster Management (Badan Nasional Penanggulangan Bencana-BNPB) reported that a major eruption occurred at Kelut (also known as Kelud) volcano in East Java, Indonesia. Ground-based observers had little insight about the ash plume height, but a number of satellite observations helped to constrain the height and other eruption parameters such the direction of plume movement. CALIPSO satellite data revealed that a rapidly rising portion of the plume ejected material up to an altitude exceeding ~26 km, well into the tropical stratosphere. Most of the less rapidly rising portions of the plume remained lower, at 19-20 km altitude. The 2014 eruption destroyed a dome emplaced in the volcano's caldera during the previous eruption in 2007 (BGVN 33:03 and 33:07). According to BNPB in a report issued on 18 February 2014, ~7 people were killed and ~100,000 evacuated. At least one commercial aircraft flew into the plume, later landing successfully but incurring costly engine damage.
This report discusses the pre- and syn-eruption observations from the early January through 25 February 2014. Much of the detailed reporting used here came from the Indonesian Centre for Volcanology and Geological Hazard Mitigation (CVGHM; also known as Pusat Vulkanologi dan Mitigasi Bencana Geologi, PVMBG). Kelut is located just S of Surabaya (Surabaja), Indonesia's second largest city (see figure 8 in BGVN 33:03).
Pre-eruption. According to CVGHM, the lake-water temperature in the crater increased 5.5°C during 10 September 2013 to 2 February 2014. During 1 January-2 February 2014 the number of shallow volcanic earthquakes at Kelut volcano increased. During 3-10 February 2014, seismic activity at Kelut was dominated by both shallow and deep volcanic earthquakes; some hypocenters were 3 km below the summit. Real-time Seismic-Amplitude Measurement (RSAM, a gauge of volcanic seismicity) values increased on 6 and 9 February 2014. Inflation was detected at one station.
Peaks of pre-eruptive seismicity occurred during 15-16 and 28 January, and 2-13 February. Table 3 also portrays the available early 2014 seismic data from CVGHM, but it can be hard to see the aforementioned detail because the various entries on table's rows generally summarize multiple days and some of the time intervals differ. The number of deep volcanic earthquakes fluctuated but generally increased overall. Earthquakes often occurred at 2-8 km depth. Based on these observations, on 2 February the Alert Level was raised to from 1 to 2 (on a scale with increasing severity in the range 1-4). Tiltmeter data on 10 February indicated inflation.
Table 3. Seismicity at Kelut volcano during January and into 13 February 2014. Note that the data stream changed abruptly on 13 February when four of Kelut's 5 seismic stations were destroyed by eruptive material. Courtesy of CVGHM.
| Time period 2014 (no. of days) | Shallow/deep volcanic earthquakes (VB / VA) | Deep/local tectonic earthquakes (TJ) (nr-none reported) | Low frequency earthquakes (LF) |
| 1-7 Jan (7) | 14 / 1 | 44 / -- | 4 |
| 8-14 Jan (7) | 18 / 4 | 32 / -- | 2 |
| 15-21 Jan (7) | 38 / 34 | 27 / -- | 0 |
| 22-31 Jan (10) | 234 / 74 | 79 / 2 | 1 |
| 1-3 Feb (3) | 111 / 30 | 3 / -- | 0 |
| 3-10 Feb (8) | 693 / 297 | 50 / -- | 0 |
| 13 Feb (1) | 440 / 1,135 | 1 / 3 | 198 |
Crater lake water temperatures continued to increase after September 2013, particularly during 23 January-9 February. Temperatures decreased slightly when measured on 10 February. On 10 February, based on the factors noted above, CVGHM increased the Alert Level to 3. This excluded visitors and residents from within a 5-km radius of the crater.
Eruption on 13 February. At 2115 on 13 February the Alert Level for Kelut was raised to 4, extending the exclusionary zone to a 10-km radius. As noted above, BNPB reported that a major eruption occurred less than two hours later at 2250, followed by another large explosion at 2330. NASA reported that satellite images showed the Kelut eruption about 2 hours later on 13 February 2014 at ~2315 local time (1615 UTC).
According to a Darwin VAAC (2014) weekly activity report, the eruption was seen on the hourly MTSAT-2 IR satellite for 1632 UTC (2332 local time) on 13 February, where it appeared as a rapidly expanding cloud. More details came from 10-minute IR data being used on a special basis in the High Ice Project in Darwin, which captured the eruption clearly as a small cluster of cold pixels on a 1610 UTC (2310 local time) IR image. Later analysis found a small low altitude plume as early as 1540 UTC (2240 local time) at Kelut on the MTSAT-1R satellite; this is the earliest reported start time for the eruption.
According to CVGHM, ash plumes rose to an altitude of 17 km and caused ashfall in areas NE, NW, W, and elsewhere as far as Pacitan (133 km WSW), Kulon Progo (236 km W), Temanggung (240 km WNW), and Banyuwangi (228 km E). As ash began to blanket parts of the region, 40 airline flights were cancelled; impacted airports included Juanda (81 km NE), Adi Sucipto Yogya (208 km W), and Adi Sumarmo Solo (175 km WNW). News articles reported that flights in and out of seven airports were cancelled or rerouted.
Figures 15 and 16 show satellite images of the plume taken on 13 February 2014. The image at the top of figure 15 portrays the scene at 0030 local time and the trace of the path across it taken by the satellite. At ~1813 UTC on 13 February. CALIPSO (Cloud-Aerosol Lidar and Infrared Pathfinder Satellite Observation). CALIPSO flew over the plume deploying CALIOP (a lidar instrument, essentially a laser range finder that creates a profile of clouds and particles in the atmosphere). This is one of the favored instruments for cloud height measurement. It is part of the A-Train, a constellation of multiple satellites and instruments that follow the same track on polar orbits and cross the equator within seconds to minutes of each other. This allows near-simultaneous observations. CALIOP data revealed that the Kelut ash cloud was generally at an altitude of 18-19 km, with some cloud/ash material reaching a maximum height of ~26 km. This is sufficiently high, and the A-Train data capabilities are sufficiently large to cause great interest, and more refined estimates of height and other parameters are likely to follow.
|
Figure 15. Figure 15 (top and bottom). At 0030 local time (1730 UTC 13 February) on 14 February, the Visible Infrared Imaging Radiometer Suite (VIIRS) on the Suomi NPP satellite acquired the top image as the gray circular ash plume over Kelut reached above a lighter-colored weather-cloud deck. Forty minutes later, at 0110 local time (1810 UTC 13 February), the Cloud-Aerosol Lidar and Infrared Pathfinder Satellite Observation (CALIPSO) satellite flew over the plume with its lidar instrument. The instrument recorded the ash cloud at nearly 20 km altitude, with sections of the plume reaching to nearly 26 km. Courtesy of NASA Earth Observatory; image by Jesse Allen, using data provided by the CALIPSO team; caption by Holli Riebeek. |
|
Figure 16. A cross-section through the Kelut volcanic plume from data acquired on 14 February 2014. The image zooms in on CALIPSO data for the tallest parts of the volcanic cloud (using the CALIOP data). The white line shows the approximate troposphere-stratosphere boundary. Some wave structure (small white oscillations) is apparent in the umbrella region. The vertical scale on the left shows computed altitude, and on the lower right shows the color scale for intensity of the 532 nm wavelength backscatter. The horizontal scale and labels at the bottom of the figure shows the latitude, longitude, and time in UTC for the vertical sounding across the transect. The red trace across the bottom of the figure shows land topography, with the volcano at the center. The AIRS (atmospheric infrared sounder) determined SO2 brightness temperature differences (BTD-scale at upper right) referring to features such as the red stars, where AIRS detected SO2 towards the edge of the cloud. Courtesy of Carn and Telling (2014). |
Figure 17 shows a view of an eruption at 0030 local time on 14 February. In Figure 18, a plane, service vehicle, and boarding area are shown covered by ash at Yogyakarta airport, 215 km E of Kelut. Closer to the volcano, ashfall and tephra blocks 5-8 cm in diameter caused structures to collapse, including schools, homes, and businesses.
|
Figure 17. A photo of the eruption of Kelut at 0030 on 14 February 2014, with lightning being generated in the ash plume. Courtesy of Volcano Discovery web site (URL: http:pic.twitter.com/ypy7kx9615 / @hilmi_dzi). |
|
Figure 18. Image of a tan-colored ash blanket covering the landscape, including a parked jet liner and service vehicle, at Yogyakarta airport, 215 km W of Kelut, taken 14 February 2014. Image from NBC News web site (BIMO SATRIO / EPA). |
As a result of this eruption, four of the five Kelut seismic stations were destroyed, after which, volcanic and low-frequency earthquakes were not recorded. Subsequently, available seismicity recorded at the one remaining station, 5 km away, was dominated by continuous tremor with amplitudes ranging from 0.5 to 15 mm. That station later recorded declining seismicity during 14-20 February. Two more seismic stations were installed on 16 February, 2-3 km from the crater.
On 14 February, gray-to-black plumes rose 400-600 m above the crater, and on 15 February grayish white plumes rose as high as 3 km (figure 19).
|
Figure 19. The eruption of Kelut (labeled just to the right of the image's center) on 13 February 2014 sent a large plume of ash drifting W across Java and over the Indian Ocean. This satellite image, acquired 14 February, shows widespread tan atmospheric discoloration from the ash plume. According to an advisory issued by the Australian Bureau of Meteorology, ash had reached 13 km in altitude, prompting the closure of several airports. Three people were killed, and Indonesian authorities have evacuated more than 75,000 people from their homes. NASA Earth Observatory, image by Jesse Allen and caption by Adam Voiland, using data from the Land Atmosphere Near real-time Capability for EOS (LANCE). |
On 14 February BNPB reported that the eruption had killed four people (but later estimates were higher): one died due to a collapsing wall, one from ash inhalation, and two from "shortness of breath." All four victims lived within 7 km of Kelut in the regency of Malang, an area that received ashfall up to 20 cm thick.
By 0600 on 14 February, BNPB reported that the number of displaced people reached 100,248, but the report also noted that volcanic activity had declined. Later that day BNPB noted that 76,388 people remained evacuated. Seismicity continued to decline and was at moderate levels during 15-17 February. During 16-20 February white plumes rose as high as 1 km and drifted N, NE, and E. Data from satellite instruments provided a 14 February 2014 image on sulfur dioxide (SO2) from Kelut (figure 20). The plume had spread primarily W of the volcano.
|
Figure 20. Sulfur dioxide burdens measured from Kelut (red triangle) over the Indonesian island of Java and Indian Ocean in the early morning of 14 February 2014 following the Kelut eruption. This image is based on data from the IASI instrument on the MetOp mission. Courtesy of European Space Agency (2014). |
Heavy rain on 18 February caused lahars in Ngobo, Mangli (Kediri, 35 km WNW), Bladak (Blitar, 20 km SW), and Konto (Malang, 35 km E). BNPB noted that the lahars flooded five houses and one mosque, and destroyed two homes and one bridge. An 18 February BNPB report noted that a total of 7 people in Malang regency had died, and that the ashfall had affected farms, including cattle health and dairy production, and the water supply. Damage to infrastructure in Malang included 3,782 houses, 20 government buildings, 251 schools, 9 hospitals, and 36 churches.
The Alert Level was lowered from 4 to 3 on 20 February and to 2 on 28 February based on decreased amplitude of tremors and thick clouds of white smoke continuously emitted from the crater instead of dark grey. At this point, visitors and residents were prohibited from approaching the crater within a radius of 5 km, but residents outside of this zone were permitted to return home.
Only a single pixel MODVOLC satellite thermal alert was measured during the interval from 13 February through March 2014. The alert occurred at 1515 hours UTC on 20 February 2014, the first alert measured since nearly daily alerts from Kelut's last eruption, 18 November 2007-23 January 2008. During the February 2014 eruption, cloudy weather over Kelut was a major factor that precluded some alerts from being measured, but those visualized suggest that the recent Kelut eruption continued until at least 20 February 2014.
A satellite image made available thanks to the International Charter Space and Major Disasters (2014) was acquired on 18 February and interpreted by the U.S. Geological Survey. The image reveals the impact of the eruption on the summit area and regions peripheral to it (figure 21).
|
Figure 21. Satellite image of the crater area of Kelud, acquired on 18 February 2014. The former dome was destroyed during the 14 February eruption and significant ash and debris were deposited on the volcano slopes and in the river channels from lahars and pyroclastic flows around the volcano. Steam can be seen rising from the central crater. Courtesy of International Charter Space and Major Disasters (2014); source was WorldView, acquired 18/02/2014 by DigitalGlobe Inc.; map produced by USGS, and found online at Klemetti (2014c). |
Later visits disclosed that the 2014 eruption had left a large crater 400 m in diameter and destroyed the 2007 dome, parking area, and access stairs in the crater (see figures 22 and 23).
|
Figure 22. Photograph of the inner dome in Kelut volcano taken in 2010, showing the then- existing lava dome from the 2007 eruption and the access stairs to the crater, both of which were destroyed by the February 2014 eruption. Image courtesy of Zahidayat / Flickr, from Klemetti (2014b). |
|
Figure 23. (Left) The Kelut lava dome that grew in the crater in 2007, photographed 30 October 2011 by Andersen (2011). In front of the dome was the small portion of what was left of the volcanic lake that used to fill the crater. (Right) The crater of Kelut seen on the morning of 18 February 2014 (photo by Suwarno, a local photographer, via Andersen), showing that the 2014 eruption forcefully removed the dome. Comparison figure came from Andersen (2014). |
A group of photographs taken by Oystein Lund Andersen (2014) during a visit from 22 to 23 February show after-eruption images, including steam rising from the crater area, ash and volcanic bombs deposited 2-5 km from Kelut's crater, and damage to trees and other vegetation by pyroclastic flows (for example, Figures 24 and 25). In addition, photographs showed that steam continued to rise from the crater through 25 February 2014. Andersen observed that activity at the volcano has decreased, but it was still unknown what exactly the situation at the vent is, whether or not a new lava dome is forming there.
|
Figure 24. Steaming pyroclastic flow deposits in one of the valleys below the crater, a once forested area ~1 km SW of the crater .Photo taken at 1157 on 22 February 2014. Courtesy of Andersen (2014). |
|
Figure 25. A lush green forest once stood here, now covered by deposits from a pyroclastic flow and scattered remains of large felled trees. Photo taken at 1205 on 22 February 2014. Courtesy of Andersen (2014). |
Airliner encounters plume. A commercial A320 airliner carrying passengers from Perth, Australia, to Jakarta, Indonesia, encountered an ash plume from Kelut near Indonesia on 14 February 2014. The incident was reported by the West Australian (Perth) newspaper and the Sydney Morning Herald (14 February). The reports noted that the airliner left Perth on 14 February 2014 at 0225 local time and flew through the ash cloud before arriving safely in Jakarta at 0550 local time. The estimated cost to replace the two engines of the Airbus aircraft was reported to be $20 million (US dollars). The A320 was grounded after the flight.
Morning Herald reporter Amanda Hoh (2014) reported that a "flight from Perth to Jakarta on Friday morning was filled with smoke after the plane flew into Indonesia's volcanic ash cloud…Richard Craig, from Perth, was on a flight to Jakarta at about 5am on Friday [14 February] when he said the plane suddenly flew into the ash cloud about 30 minutes before landing" Passenger Craig was quoted to have said "It was just starting to get light then it suddenly went quite dark and what I thought was smoke appeared in the cabin out the front, started coming out of the air vent and alarm went off and beeped a few times," he said. "There was an unusual smell. It wasn't like smoke, a slightly sweet smell. More like a very fine smoke…" The smoke cleared within a few minutes and Craig noted that the pilot announced that "it was a volcanic ash cloud and that 'no one was aware of it in the area.'" The plane landed safely.
Summary of damage. According to the International Federation of Red Cross and Red Crescent Societies (IFRC) (2014), "over the first few days the eruption affected 201,228 people (58,341 families) from 35 villages in three districts: Blitar, Kediri, and Malang... As of 14 February 2014, there had been seven fatalities and 70 people in hospitals in serious condition suffering from ash inhalation. Around this time the number of internally displaced persons (IDPs) had reduced to 100,248 people who had evacuated and camped across the province in 172 IDP camps set up to cater for their basic needs... In addition to the volcanic ash, heavy rain fell and produced cold lahar flooding in Malang, Kediri and Blitar districts. This caused further damage to buildings, farm lands, and roads."
Table 4 gives data on damage to structures in the 3 affected districts surrounding Kelut through February 2014. The figures are expected to increase once a more thorough assessment is made.
Table 4. An initial assessment of the damage to housing and other buildings as a result of Kelut eruption volcanic ash. Courtesy of IFRC (2014).
| District | Totally damaged | Moderately damaged | Minor damaged |
| Kediri | 8,622 | 5,426 | 5,088 |
| Malang | 1,514 | 1,066 | 1,378 |
| Bitar | 957 | 878 | 1,578 |
| Totals | 11,093 | 7,370 | 8,044 |
As reported on 24 February 2014 in the Jakarta Globe (Pitaloka, 2014), "torrential rain in East Java on 23 February 2014 prompted local officials to impose a safety curfew over some areas affected by the eruption of Mount Kelud for fear that rainwater could mix with volcanic dust, triggering mud flows." The Head of the Malang Disaster Mitigation Agency, Hafi Lutfi, said rain had triggered landslides that damaged several sections of mountain road. "A mud flow in Padansari village on Thursday [13 February] washed away two houses and two bridges, although no casualties were reported... Volcanic mud was carried down the mountain's slopes by the river, which flows through Kasembon, Ngantang and Pujon subdistricts" (figure 26).
|
Figure 26. Villagers stand on the remains of a bridge washed out in Malang district near Pandansari village. The bridge succumbed to water mixed with volcanic material from Mount Kelut's eruption on 19 February 2014. From Pitaloka (2014); EPA photo by Fully Handoko. |
Lutfi was reported to have stated further that the "impact of Mount Kelud's eruption will extend far beyond the initial cleanup efforts. Fruit farmers reportedly lost more than Rp 24 billion ($2 million) in revenue as ash and debris destroyed whole fields of apples, durian and rambutan that were ready for harvest. The trees, covered in a thick coating of ash, had withered from lack of sunlight."
Background. The CVGHM reported that activity at Kelut last occurred in 2007, beginning with an increase in seismic activity and an eruption in October 2007. The activity ended with an effusive eruption on 3-4 November 2007 resulting with a crater lake surrounding a central lava dome (BGVN 33:03, 33:07, and 37:03).
References. Andersen, O.L., 2014 (22 February), Kelud Volcano, East-Java, Indonesia (URL: http://www.oysteinlundandersen.com/Volcanoes/Kelud/Kelud-Volcano-Indonesia-February-2014.html)
Andersen, O.L., 2011 (30 October), Mt. Kelud Volcano, Indonesia, 30 October 2011(URL: http://www.oysteinlundandersen.com/Volcanoes/Kelud/Kelud-Volcano-Indonesia-October-2011.html).
Carn, S., and Telling, J., 2014, Kelut 2014, IAVCEI (International Association of Volcanology and Chemistry of the Earth's Interior) Remote Sensing Commission (RSC) (URL: https://sites.google.com/site/iavceirscweb/eruptions/kelut-2014)
CIMSS Satellite Blog, 2014 (13 February), Eruption of the Kelut volcano in Java, Indonesia (URL: http://cimss.ssec.wisc.edu/goes/blog/archives/14910 ).
European Space Agency (ESA), 2014 (14 February), Kelut volcano grounds air travel, ESA Observing the Earth web site (URL: http://www.esa.int/Our_Activities/Observing_the_Earth/Kelut_volcano_grounds_air_travel).
Hoh, A., 2014 (14 February), Volcano eruption cancels Bali, Phuket flights and closes Indonesian airports, The Sydney Morning Herald (URL: 14http://www.smh.com.au/travel/travel-incidents/volcano-eruption-cancels-bali-phuket-flights-and-closes-indonesian-airports-20140214-32qd8.html)
International Charter Space and Major Disasters, (2014), Mount Kelud volcanic eruption in Indonesia (URL: http://www.disasterscharter.org/web/charter/activation_details?p_r_p_1415474252_assetId=ACT-481)
International Federation of Red Cross and Red Crescent Societies, 2014 (3 March), Emergency plans of action (EPofA), Indonesia: Volcanic eruption - Mt. Kelud (URL: http://reliefweb.int/sites/reliefweb.int/files/resources/MDRID009dref.pdf).
Klemetti, E., 2014a (11 February), Indonesian Eruption Update for February 11, 2014: Kelut and Sinabung (URL: http://www.wired.com/wiredscience/2014/02/indonesias-kelut-placed-highest-alert/)
Klemetti, E., 2014b (13 February), Significant Eruption Started at Indonesia's Kelut (URL: http://www.wired.com/wiredscience/2014/02/significant-eruption-started-indonesias-kelut/).
Klemetti, E., 2014c (24 February), Kelud, Before and After the Eruption (URL: http://www.wired.com/wiredscience/2014/02/kelud-eruption/).
National Aeronautics and Space Administration (NASA) Goddard Space Flight Center, 2014 (13 February), Kelut (Kelud) Eruption- February 13, 2014 (URL: http://so2.gsfc.nasa.gov/pix/special/2014/kelut/Kelut_summary_Feb14_2014.html)
Pitaloka, D.A., 2014 (24 February), Torrential Rain Worsens Kelud Misery, Jakarta Globe (URL: http://www.thejakartaglobe.com/news/torrential-rain-worsens-kelud-misery).
Volcano Discovery, 2014 (2 March), Kelut volcano news (URL: http://www.volcanodiscovery.Kelut volcano news & eruption updates _ 27 Sep 2007 - 2 Mar 2014.htm).
Information Contacts: Indonesian Centre for Volcanology and Geological Hazard Mitigation – CVGHM (also known as Pusat Vulkanologi dan Mitigasi Bencana Geologi (PVMBG)), Jalan Diponegoro 57, Bandung 40122, Indonesia (URL: http://www.vsi.esdm.go.id/); Darwin Volcanic Ash Advisory Centre (VAAC), Australian Bureau of Meteorology, Northern Territory Regional Office, PO Box 40050, Casuarina NT 0811, Australia (URL: http://www.bom.gov.au/info/vaac); MODVOLC, Hawai'i Institute of Geophysics and Planetology (HIGP) Thermal Alerts System, School of Ocean and Earth Science and Technology (SOEST), Univ. of Hawai'i, 2525 Correa Road, Honolulu, HI 96822, USA (URL: http://modis.higp.hawaii.edu/); Badan Nasional Penanggulangan Bencana (BNPB – Indonesian National Board for Disaster Management), Jl. Ir.H.Juanda No. 36 Jakarta Pusat, Indonesia (URL: http://www.bnpb.go.id); CIMSS (NOAA's Cooperative Institute for Meteorological Satellite Studies), University of Wisconsin – Madison's Space Science and Engineering Center (SSEC) (URL: http://cimss.ssec.wisc.edu/goes/blog/about); NOAA Satellite and Information Service, Automated OMI SO2 Alert System, High SO2 Concentration Areas (URL: http://satepsanone.nesdis.noaa.gov/pub/OMI/OMISO2/Alert/alert.html); National Aeronautics and Space Administration (NASA) Goddard Space Flight Center (URL: http://so2.gsfc.nasa.gov); European Space Agency (URL: http://www.esa.int); West Australian (Perth) news (URL: http://au.news.yahoo.com/a/21467336/); Sydney Morning Herald (URL: http://www.smh.com.au); Andersen, Oystein Lund (URL: http://www.oysteinlundandersen.com/); IAVCEI Remote Sensing Commission website (URL: https://sites.google.com/site/iavceirscweb/eruptions/kelut-2014); and Simon Carn, Department of Geological and Mining Engineering and Sciences, Michigan Technical University, Houghton, MI.
This compilation of synonyms and subsidiary features may not be comprehensive. Features are organized into four major categories: Cones, Craters, Domes, and Thermal Features. Synonyms of features appear indented below the primary name. In some cases additional feature type, elevation, or location details are provided.
Synonyms |
||||
| Kloet | Keloet | Coloot | Kelut | Keluit | Keloed | Klut | ||||
Craters |
||||
| Feature Name | Feature Type | Elevation | Latitude | Longitude |
| Badak | Crater | |||
| Dargo | Crater | |||
| Gupit | Crater | |||
| Tumpak | Crater | |||
Domes |
||||
| Feature Name | Feature Type | Elevation | Latitude | Longitude |
|
Gajamungkur
Gadjahmoengkoer |
Dome | 1455 m | ||
| Kombang | Dome | 1514 m | ||
| Kramosan | Dome | 996 m | ||
| Lirang | Dome | 1414 m | ||
| Pisang | Dome | 955 m | ||
| Sumbing | Dome | 1530 m | ||
|
|
||||||||||||||||||||||||
There is data available for 37 confirmed Holocene eruptive periods.
2014 Feb 13 - 2014 Feb 15 Confirmed Eruption Max VEI: 4
| Episode 1 | Precursory Episode | Below the summit crater lake | |||||||||||||||||||||||||||||
|---|---|---|---|---|---|---|---|---|---|---|---|---|---|---|---|---|---|---|---|---|---|---|---|---|---|---|---|---|---|---|
| 2013 Sep 10 - 2014 Feb 13 | Evidence from Observations: Reported | |||||||||||||||||||||||||||||
|
List of 4 Events for Episode 1 at Below the summit crater lake
| ||||||||||||||||||||||||||||||
| Episode 2 | Eruption Episode | Summit crater lake | |||||||||||||||||||||||||||||||||||||||||||||||||||||||||||||||||||||||||||||||||||||||||||||||||||
|---|---|---|---|---|---|---|---|---|---|---|---|---|---|---|---|---|---|---|---|---|---|---|---|---|---|---|---|---|---|---|---|---|---|---|---|---|---|---|---|---|---|---|---|---|---|---|---|---|---|---|---|---|---|---|---|---|---|---|---|---|---|---|---|---|---|---|---|---|---|---|---|---|---|---|---|---|---|---|---|---|---|---|---|---|---|---|---|---|---|---|---|---|---|---|---|---|---|---|---|---|
| 2014 Feb 13 - 2014 Feb 15 | Evidence from Observations: Reported | |||||||||||||||||||||||||||||||||||||||||||||||||||||||||||||||||||||||||||||||||||||||||||||||||||
|
List of 18 Events for Episode 2 at Summit crater lake
| ||||||||||||||||||||||||||||||||||||||||||||||||||||||||||||||||||||||||||||||||||||||||||||||||||||
2007 Oct 16 (?) ± 15 days - 2008 Apr 16 (in or before) ± 15 days Confirmed Eruption Max VEI: 2
| Episode 1 | Eruption Episode | |||||||||||||||||||||||||||||||||||||||||||||
|---|---|---|---|---|---|---|---|---|---|---|---|---|---|---|---|---|---|---|---|---|---|---|---|---|---|---|---|---|---|---|---|---|---|---|---|---|---|---|---|---|---|---|---|---|---|
| 2007 Oct 16 (?) ± 15 days - 2008 Apr 16 (in or before) ± 15 days | Evidence from Observations: Reported | ||||||||||||||||||||||||||||||||||||||||||||
|
List of 7 Events for Episode 1
| |||||||||||||||||||||||||||||||||||||||||||||
1990 Feb 10 - 1990 Mar 13 ± 45 days Confirmed Eruption Max VEI: 4
| Episode 1 | Eruption Episode | |||||||||||||||||||||||||||||||||||||||||||||||||||||||||||||||||||||||||||||||||||||
|---|---|---|---|---|---|---|---|---|---|---|---|---|---|---|---|---|---|---|---|---|---|---|---|---|---|---|---|---|---|---|---|---|---|---|---|---|---|---|---|---|---|---|---|---|---|---|---|---|---|---|---|---|---|---|---|---|---|---|---|---|---|---|---|---|---|---|---|---|---|---|---|---|---|---|---|---|---|---|---|---|---|---|---|---|---|
| 1990 Feb 10 - 1990 Mar 13 ± 45 days | Evidence from Observations: Reported | ||||||||||||||||||||||||||||||||||||||||||||||||||||||||||||||||||||||||||||||||||||
|
List of 15 Events for Episode 1
| |||||||||||||||||||||||||||||||||||||||||||||||||||||||||||||||||||||||||||||||||||||
1967 Dec 11 - 1967 Dec 11 Confirmed Eruption Max VEI: 1
| Episode 1 | Eruption Episode | Crater floor at foot of Kelut Peak | |||||||||||||||||||
|---|---|---|---|---|---|---|---|---|---|---|---|---|---|---|---|---|---|---|---|---|
| 1967 Dec 11 - 1967 Dec 11 | Evidence from Observations: Reported | |||||||||||||||||||
|
List of 2 Events for Episode 1 at Crater floor at foot of Kelut Peak
| ||||||||||||||||||||
1967 Feb 18 - 1967 Feb 18 Confirmed Eruption Max VEI: 1
| Episode 1 | Eruption Episode | ||||||||||||||||||||
|---|---|---|---|---|---|---|---|---|---|---|---|---|---|---|---|---|---|---|---|---|
| 1967 Feb 18 - 1967 Feb 18 | Evidence from Observations: Reported | |||||||||||||||||||
|
List of 2 Events for Episode 1
| ||||||||||||||||||||
1966 Apr 26 - 1966 Apr 27 Confirmed Eruption Max VEI: 4
| Episode 1 | Eruption Episode | |||||||||||||||||||||||||||||||||||||||||||||||||||||||||||||||||
|---|---|---|---|---|---|---|---|---|---|---|---|---|---|---|---|---|---|---|---|---|---|---|---|---|---|---|---|---|---|---|---|---|---|---|---|---|---|---|---|---|---|---|---|---|---|---|---|---|---|---|---|---|---|---|---|---|---|---|---|---|---|---|---|---|---|
| 1966 Apr 26 - 1966 Apr 27 | Evidence from Observations: Reported | ||||||||||||||||||||||||||||||||||||||||||||||||||||||||||||||||
|
List of 11 Events for Episode 1
| |||||||||||||||||||||||||||||||||||||||||||||||||||||||||||||||||
1951 Aug 31 - 1951 Aug 31 Confirmed Eruption Max VEI: 4
| Episode 1 | Eruption Episode | |||||||||||||||||||||||||||||||||||||||||||||||||||||||||||||||||
|---|---|---|---|---|---|---|---|---|---|---|---|---|---|---|---|---|---|---|---|---|---|---|---|---|---|---|---|---|---|---|---|---|---|---|---|---|---|---|---|---|---|---|---|---|---|---|---|---|---|---|---|---|---|---|---|---|---|---|---|---|---|---|---|---|---|
| 1951 Aug 31 - 1951 Aug 31 | Evidence from Observations: Reported | ||||||||||||||||||||||||||||||||||||||||||||||||||||||||||||||||
|
List of 11 Events for Episode 1
| |||||||||||||||||||||||||||||||||||||||||||||||||||||||||||||||||
1920 Dec 6 - 1920 Dec 12 Confirmed Eruption Max VEI: 2
| Episode 1 | Eruption Episode | |||||||||||||||||||||||||
|---|---|---|---|---|---|---|---|---|---|---|---|---|---|---|---|---|---|---|---|---|---|---|---|---|---|
| 1920 Dec 6 - 1920 Dec 12 | Evidence from Observations: Reported | ||||||||||||||||||||||||
|
List of 3 Events for Episode 1
| |||||||||||||||||||||||||
1919 May 19 - 1919 May 20 Confirmed Eruption Max VEI: 4
| Episode 1 | Eruption Episode | ||||||||||||||||||||||||||||||||||||||||||||||||||
|---|---|---|---|---|---|---|---|---|---|---|---|---|---|---|---|---|---|---|---|---|---|---|---|---|---|---|---|---|---|---|---|---|---|---|---|---|---|---|---|---|---|---|---|---|---|---|---|---|---|---|
| 1919 May 19 - 1919 May 20 | Evidence from Observations: Reported | |||||||||||||||||||||||||||||||||||||||||||||||||
|
List of 8 Events for Episode 1
| ||||||||||||||||||||||||||||||||||||||||||||||||||
1901 May 22 - 1901 May 23 Confirmed Eruption Max VEI: 3
| Episode 1 | Eruption Episode | ||||||||||||||||||||||||||||||||||||||||
|---|---|---|---|---|---|---|---|---|---|---|---|---|---|---|---|---|---|---|---|---|---|---|---|---|---|---|---|---|---|---|---|---|---|---|---|---|---|---|---|---|
| 1901 May 22 - 1901 May 23 | Evidence from Observations: Reported | |||||||||||||||||||||||||||||||||||||||
|
List of 6 Events for Episode 1
| ||||||||||||||||||||||||||||||||||||||||
[ 1875 Jan 29 ] Discredited Eruption
The catastrophe of 29 January 1875 was not caused by an eruption. A lahar was produced as the western crater wall was pushed away by pressure of the crater lake (Neumann Van Padang 1983).
1864 Jan 4 (?) - 1864 Jan 4 (?) Confirmed Eruption Max VEI: 2
| Episode 1 | Eruption Episode | ||||||||||||||||||||||||||||||||||||||||||||||||||
|---|---|---|---|---|---|---|---|---|---|---|---|---|---|---|---|---|---|---|---|---|---|---|---|---|---|---|---|---|---|---|---|---|---|---|---|---|---|---|---|---|---|---|---|---|---|---|---|---|---|---|
| 1864 Jan 4 (?) - 1864 Jan 4 (?) | Evidence from Observations: Reported | |||||||||||||||||||||||||||||||||||||||||||||||||
|
List of 8 Events for Episode 1
| ||||||||||||||||||||||||||||||||||||||||||||||||||
1851 Jan 24 Confirmed Eruption Max VEI: 2
| Episode 1 | Eruption Episode | ||||||||||||||||||||||||||||||
|---|---|---|---|---|---|---|---|---|---|---|---|---|---|---|---|---|---|---|---|---|---|---|---|---|---|---|---|---|---|---|
| 1851 Jan 24 - Unknown | Evidence from Observations: Reported | |||||||||||||||||||||||||||||
|
List of 4 Events for Episode 1
| ||||||||||||||||||||||||||||||
[ 1849 ] Uncertain Eruption
| Episode 1 | Eruption Episode | ||||
|---|---|---|---|---|
| 1849 - Unknown | Evidence from Unknown | |||
1848 May 16 - 1848 May 17 Confirmed Eruption Max VEI: 3
| Episode 1 | Eruption Episode | ||||||||||||||||||||||||||||||||||||||||||||||||||
|---|---|---|---|---|---|---|---|---|---|---|---|---|---|---|---|---|---|---|---|---|---|---|---|---|---|---|---|---|---|---|---|---|---|---|---|---|---|---|---|---|---|---|---|---|---|---|---|---|---|---|
| 1848 May 16 - 1848 May 17 | Evidence from Observations: Reported | |||||||||||||||||||||||||||||||||||||||||||||||||
|
List of 8 Events for Episode 1
| ||||||||||||||||||||||||||||||||||||||||||||||||||
1835 Confirmed Eruption Max VEI: 2
| Episode 1 | Eruption Episode | ||||||||||||||||||||||||||||||
|---|---|---|---|---|---|---|---|---|---|---|---|---|---|---|---|---|---|---|---|---|---|---|---|---|---|---|---|---|---|---|
| 1835 - Unknown | Evidence from Observations: Reported | |||||||||||||||||||||||||||||
|
List of 4 Events for Episode 1
| ||||||||||||||||||||||||||||||
1826 Oct 11 - 1826 Oct 25 Confirmed Eruption Max VEI: 4 (?)
| Episode 1 | Eruption Episode | |||||||||||||||||||||||||||||||||||||||||||||
|---|---|---|---|---|---|---|---|---|---|---|---|---|---|---|---|---|---|---|---|---|---|---|---|---|---|---|---|---|---|---|---|---|---|---|---|---|---|---|---|---|---|---|---|---|---|
| 1826 Oct 11 - 1826 Oct 25 | Evidence from Observations: Reported | ||||||||||||||||||||||||||||||||||||||||||||
|
List of 7 Events for Episode 1
| |||||||||||||||||||||||||||||||||||||||||||||
1825 Confirmed Eruption Max VEI: 2
| Episode 1 | Eruption Episode | |||||||||||||||||||||||||||||||||||
|---|---|---|---|---|---|---|---|---|---|---|---|---|---|---|---|---|---|---|---|---|---|---|---|---|---|---|---|---|---|---|---|---|---|---|---|
| 1825 - Unknown | Evidence from Observations: Reported | ||||||||||||||||||||||||||||||||||
|
List of 5 Events for Episode 1
| |||||||||||||||||||||||||||||||||||
1811 Jun 5 Confirmed Eruption Max VEI: 2
| Episode 1 | Eruption Episode | ||||||||||||||||||||||||||||||
|---|---|---|---|---|---|---|---|---|---|---|---|---|---|---|---|---|---|---|---|---|---|---|---|---|---|---|---|---|---|---|
| 1811 Jun 5 - Unknown | Evidence from Observations: Reported | |||||||||||||||||||||||||||||
|
List of 4 Events for Episode 1
| ||||||||||||||||||||||||||||||
1785 Confirmed Eruption Max VEI: 2
| Episode 1 | Eruption Episode | ||||||||||||||||||||||||||||||
|---|---|---|---|---|---|---|---|---|---|---|---|---|---|---|---|---|---|---|---|---|---|---|---|---|---|---|---|---|---|---|
| 1785 - Unknown | Evidence from Observations: Reported | |||||||||||||||||||||||||||||
|
List of 4 Events for Episode 1
| ||||||||||||||||||||||||||||||
1776 Confirmed Eruption Max VEI: 2
| Episode 1 | Eruption Episode | ||||||||||||||||||||||||||||||
|---|---|---|---|---|---|---|---|---|---|---|---|---|---|---|---|---|---|---|---|---|---|---|---|---|---|---|---|---|---|---|
| 1776 - Unknown | Evidence from Observations: Reported | |||||||||||||||||||||||||||||
|
List of 4 Events for Episode 1
| ||||||||||||||||||||||||||||||
1771 Jan 10 Confirmed Eruption Max VEI: 2
| Episode 1 | Eruption Episode | ||||||||||||||||||||||||||||||
|---|---|---|---|---|---|---|---|---|---|---|---|---|---|---|---|---|---|---|---|---|---|---|---|---|---|---|---|---|---|---|
| 1771 Jan 10 - Unknown | Evidence from Observations: Reported | |||||||||||||||||||||||||||||
|
List of 4 Events for Episode 1
| ||||||||||||||||||||||||||||||
[ 1756 ] Uncertain Eruption
| Episode 1 | Eruption Episode | ||||
|---|---|---|---|---|
| 1756 - Unknown | Evidence from Unknown | |||
1752 May 1 Confirmed Eruption Max VEI: 2
| Episode 1 | Eruption Episode | ||||||||||||||||||||||||||||||
|---|---|---|---|---|---|---|---|---|---|---|---|---|---|---|---|---|---|---|---|---|---|---|---|---|---|---|---|---|---|---|
| 1752 May 1 - Unknown | Evidence from Observations: Reported | |||||||||||||||||||||||||||||
|
List of 4 Events for Episode 1
| ||||||||||||||||||||||||||||||
1716 Jul 20 Confirmed Eruption Max VEI: 2
| Episode 1 | Eruption Episode | |||||||||||||||||||||||||||||||||||
|---|---|---|---|---|---|---|---|---|---|---|---|---|---|---|---|---|---|---|---|---|---|---|---|---|---|---|---|---|---|---|---|---|---|---|---|
| 1716 Jul 20 - Unknown | Evidence from Observations: Reported | ||||||||||||||||||||||||||||||||||
|
List of 5 Events for Episode 1
| |||||||||||||||||||||||||||||||||||
1641 Confirmed Eruption Max VEI: 4 (?)
| Episode 1 | Eruption Episode | ||||||||||||||||||||||||||||||
|---|---|---|---|---|---|---|---|---|---|---|---|---|---|---|---|---|---|---|---|---|---|---|---|---|---|---|---|---|---|---|
| 1641 - Unknown | Evidence from Observations: Reported | |||||||||||||||||||||||||||||
|
List of 4 Events for Episode 1
| ||||||||||||||||||||||||||||||
1586 Confirmed Eruption Max VEI: 5 (?)
| Episode 1 | Eruption Episode | ||||||||||||||||||||||||||||||||||||||||
|---|---|---|---|---|---|---|---|---|---|---|---|---|---|---|---|---|---|---|---|---|---|---|---|---|---|---|---|---|---|---|---|---|---|---|---|---|---|---|---|---|
| 1586 - Unknown | Evidence from Observations: Reported | |||||||||||||||||||||||||||||||||||||||
|
List of 6 Events for Episode 1
| ||||||||||||||||||||||||||||||||||||||||
1548 Confirmed Eruption Max VEI: 3
| Episode 1 | Eruption Episode | ||||||||||||||||||||||||||||||
|---|---|---|---|---|---|---|---|---|---|---|---|---|---|---|---|---|---|---|---|---|---|---|---|---|---|---|---|---|---|---|
| 1548 - Unknown | Evidence from Observations: Reported | |||||||||||||||||||||||||||||
|
List of 4 Events for Episode 1
| ||||||||||||||||||||||||||||||
[ 1500 (?) ] Uncertain Eruption
| Episode 1 | Eruption Episode | ||||
|---|---|---|---|---|
| 1500 (?) - Unknown | Evidence from Unknown | |||
1481 Confirmed Eruption Max VEI: 3
| Episode 1 | Eruption Episode | ||||||||||||||||||||||||||||||
|---|---|---|---|---|---|---|---|---|---|---|---|---|---|---|---|---|---|---|---|---|---|---|---|---|---|---|---|---|---|---|
| 1481 - Unknown | Evidence from Observations: Reported | |||||||||||||||||||||||||||||
|
List of 4 Events for Episode 1
| ||||||||||||||||||||||||||||||
1462 Confirmed Eruption Max VEI: 3
| Episode 1 | Eruption Episode | ||||||||||||||||||||||||||||||
|---|---|---|---|---|---|---|---|---|---|---|---|---|---|---|---|---|---|---|---|---|---|---|---|---|---|---|---|---|---|---|
| 1462 - Unknown | Evidence from Observations: Reported | |||||||||||||||||||||||||||||
|
List of 4 Events for Episode 1
| ||||||||||||||||||||||||||||||
1451 Confirmed Eruption Max VEI: 3
| Episode 1 | Eruption Episode | ||||||||||||||||||||||||||||||
|---|---|---|---|---|---|---|---|---|---|---|---|---|---|---|---|---|---|---|---|---|---|---|---|---|---|---|---|---|---|---|
| 1451 - Unknown | Evidence from Observations: Reported | |||||||||||||||||||||||||||||
|
List of 4 Events for Episode 1
| ||||||||||||||||||||||||||||||
1450 Confirmed Eruption Max VEI: 3
| Episode 1 | Eruption Episode | |||||||||||||||
|---|---|---|---|---|---|---|---|---|---|---|---|---|---|---|---|
| 1450 - Unknown | Evidence from Observations: Reported | ||||||||||||||
|
List of 1 Events for Episode 1
| |||||||||||||||
1411 Confirmed Eruption Max VEI: 3
| Episode 1 | Eruption Episode | ||||||||||||||||||||||||||||||
|---|---|---|---|---|---|---|---|---|---|---|---|---|---|---|---|---|---|---|---|---|---|---|---|---|---|---|---|---|---|---|
| 1411 - Unknown | Evidence from Observations: Reported | |||||||||||||||||||||||||||||
|
List of 4 Events for Episode 1
| ||||||||||||||||||||||||||||||
1395 Confirmed Eruption Max VEI: 3
| Episode 1 | Eruption Episode | ||||||||||||||||||||||||||||||
|---|---|---|---|---|---|---|---|---|---|---|---|---|---|---|---|---|---|---|---|---|---|---|---|---|---|---|---|---|---|---|
| 1395 - Unknown | Evidence from Observations: Reported | |||||||||||||||||||||||||||||
|
List of 4 Events for Episode 1
| ||||||||||||||||||||||||||||||
1385 Confirmed Eruption Max VEI: 3
| Episode 1 | Eruption Episode | |||||||||||||||||||||||||||||||||||
|---|---|---|---|---|---|---|---|---|---|---|---|---|---|---|---|---|---|---|---|---|---|---|---|---|---|---|---|---|---|---|---|---|---|---|---|
| 1385 - Unknown | Evidence from Observations: Reported | ||||||||||||||||||||||||||||||||||
|
List of 5 Events for Episode 1
| |||||||||||||||||||||||||||||||||||
1376 Confirmed Eruption Max VEI: 3
| Episode 1 | Eruption Episode | ||||||||||||||||||||||||||||||
|---|---|---|---|---|---|---|---|---|---|---|---|---|---|---|---|---|---|---|---|---|---|---|---|---|---|---|---|---|---|---|
| 1376 - Unknown | Evidence from Observations: Reported | |||||||||||||||||||||||||||||
|
List of 4 Events for Episode 1
| ||||||||||||||||||||||||||||||
1334 Confirmed Eruption Max VEI: 3
| Episode 1 | Eruption Episode | |||||||||||||||||||||||||||||||||||
|---|---|---|---|---|---|---|---|---|---|---|---|---|---|---|---|---|---|---|---|---|---|---|---|---|---|---|---|---|---|---|---|---|---|---|---|
| 1334 - Unknown | Evidence from Observations: Reported | ||||||||||||||||||||||||||||||||||
|
List of 5 Events for Episode 1
| |||||||||||||||||||||||||||||||||||
1311 Confirmed Eruption Max VEI: 3
| Episode 1 | Eruption Episode | |||||||||||||||||||||||||||||||||||
|---|---|---|---|---|---|---|---|---|---|---|---|---|---|---|---|---|---|---|---|---|---|---|---|---|---|---|---|---|---|---|---|---|---|---|---|
| 1311 - Unknown | Evidence from Observations: Reported | ||||||||||||||||||||||||||||||||||
|
List of 5 Events for Episode 1
| |||||||||||||||||||||||||||||||||||
1000 Confirmed Eruption Max VEI: 3
| Episode 1 | Eruption Episode | ||||||||||||||||||||||||||||||
|---|---|---|---|---|---|---|---|---|---|---|---|---|---|---|---|---|---|---|---|---|---|---|---|---|---|---|---|---|---|---|
| 1000 - Unknown | Evidence from Observations: Reported | |||||||||||||||||||||||||||||
|
List of 4 Events for Episode 1
| ||||||||||||||||||||||||||||||
0230 BCE ± 300 years Confirmed Eruption
| Episode 1 | Eruption Episode | |||||||||||||||
|---|---|---|---|---|---|---|---|---|---|---|---|---|---|---|---|
| 0230 BCE ± 300 years - Unknown | Evidence from Isotopic: 14C (uncalibrated) | ||||||||||||||
|
List of 1 Events for Episode 1
| |||||||||||||||
There is no Deformation History data available for Kelud.
There is data available for 2 emission periods. Expand each entry for additional details.
| Start Date: 2014 Feb 13 | Stop Date: 2014 Feb 13 | Method: Satellite (Aura OMI) |
| SO2 Altitude Min: 19 km | SO2 Altitude Max: 19 km | Total SO2 Mass: 200 kt |
Data Details
| Date Start | Date End | Assumed SO2 Altitude | SO2 Algorithm | SO2 Mass |
| 20140213 | 19.0 | 200.000 |
| Start Date: 1990 Feb 11 | Stop Date: 1990 Feb 11 | Method: Satellite (Nimbus-7 TOMS) |
| SO2 Altitude Min: 12 km | SO2 Altitude Max: 12 km | Total SO2 Mass: 150 kt |
Data Details
| Date Start | Date End | Assumed SO2 Altitude | SO2 Algorithm | SO2 Mass |
| 19900211 | 12.0 | 150.000 |
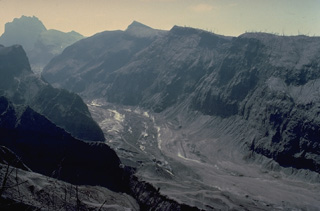 The upper flanks of Kelud volcano were swept by pyroclastic flows during the February 1990 eruption, completely devegetating the slopes of the volcano. Steam rises from still-hot pyroclastic-flow deposits on the valley floor.
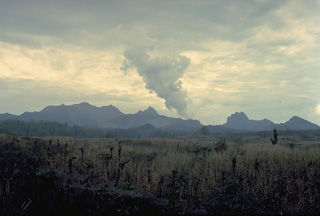 One of the least conspicuous, but deadliest of Java's volcanoes, Kelud rises to only 1731 m. Migration of craters from east to west and emplacement of several lava domes have given the summit a broad, irregular profile. The summit contains a crater lake that has been the source of some of Indonesia's most catastrophic eruptions, producing brief, but violent explosions accompanied by devastating pyroclastic flows and lahars (volcanic mudflows).
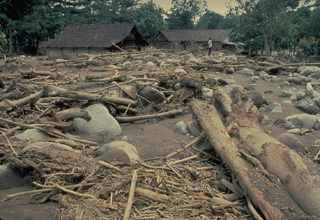 Rainfall during the February 1990 eruptions of Kelud volcano triggered lahars (volcanic mudflows) that devastated villages and agricultural land.
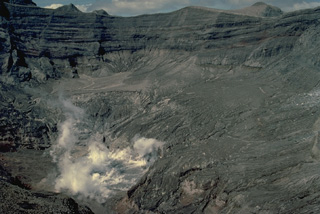 Fumaroles rise above the crater following the 1990 eruption, which removed much of the crater lake of Kelud volcano, leaving a small 150-m-wide pit crater partially filled by a small lake.
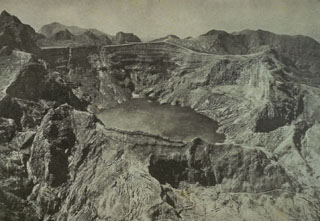 This August 1922 photo from the NW shows the still vegetation-free summit of Kelud volcano following the powerful May 1919 eruption and the relatively mild December 1920 eruption. The 1919 eruption produced devastating pyroclastic flows and lahars that killed over 5,110 people. This prompted an engineering project to construct tunnels to lower the level of the crater lake, which was completed in 1926. A milder explosive eruption in 1920 was accompanied by extrusion of a small lava dome beneath the crater lake.
 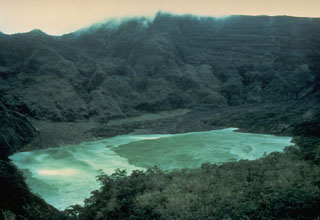 Kelud volcano has been notorious for the repeated ejection of crater lake water during eruptions, producing devastating lahars. A series of tunnels and shafts were constructed in the 1920s to lower the lake level and reduce the hazards of eruptions. The initial tunnels lowered the lake level 50 m, but the 1951 eruption deepened the crater by 70 m, leaving 50 million m3 of water. Following another devastating eruption in 1966, lower outlet tunnels were constructed, and prior to the 1990 eruption the lake contained only 1 million m3 of water.
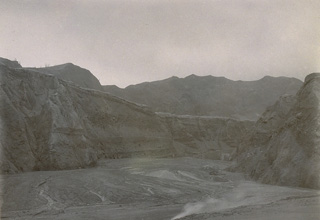 The upper flanks of Kelud volcano were swept by pyroclastic flows during the 1919 eruption. The brief eruption the night of August 19-20 produced pyroclastic flows and devastating lahars that totally destroyed 104 villages and killed 5110 people. This view of the upper Sumber Petung valley shows the completely devegetated upper slopes of the volcano.
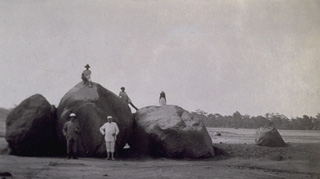 Three months after the eruption, large boulders at Kemloko carried by the devastating lahars of the May 19-20, 1919, eruption capture the attention of visitors.
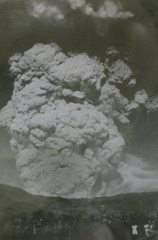 A powerful eruption column rises above Kelud volcano on 31 August 1951. Construction of a tunnel system lowered the level of the crater lake at the summit following the devastating eruption in 1919 that killed 5110 people. As a result, only seven people lost their lives in the 1951 eruption.
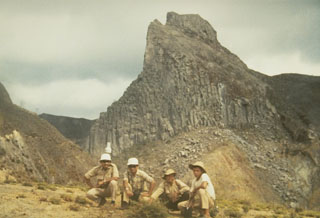 Sumbing is one of several prominent lava domes at the summit of Kelud volcano in central Java that give the volcano an irregular profile.
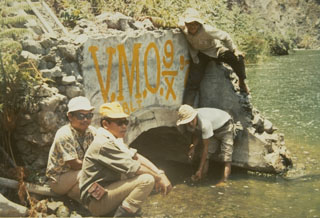 Volcanological Survey of Indonesia scientists measure water levels at a drainage tunnel of Kelud crater lake in 1973. A series of drainage tunnels and shafts were constructed following the devastating 1919 eruption that killed 5,110 people to decrease the amount of water in the summit crater lake. Loss of life from devastating lahars produced by the explosive ejection of crater lake water has been significantly reduced in subsequent eruptions, although a new tunnel needed to be installed after a 1951 eruption deepened the crater by 70 m.
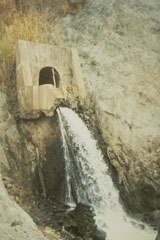 The outlet tunnel of the Kelud crater lake drainage system in 1973. A series of drainage tunnels and shafts were constructed following the devastating 1919 eruption that killed 5,110 people to decrease the amount of water in the summit crater lake. Loss of life from devastating lahars produced by the explosive ejection of crater lake water has been significantly reduced in subsequent eruptions. The original outlet was lowered to this level following the deepening of the crater by an eruption in 1951.
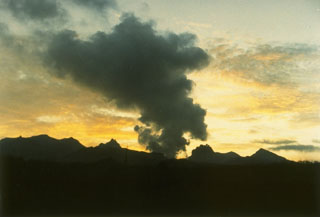 Explosive eruption of Kelud in February 1990 seen from the Volcanological Survey of Indonesia observation post on the west side of the volcano. This eruption emptied the crater lake and produced pyroclastic flows that traveled 7-8 km. A series of lava domes gives the summit of Kelud a broad, irregular profile.
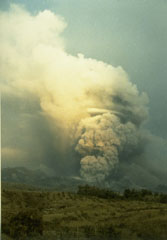 An ash plume rises above a pyroclastic flow descending a west side valley of Kelud volcano in February 1990. During the 10 to 16-17 February eruption pyroclastic flows traveled 7-8 km from the volcano and lahars destroyed nearby agricultural land.
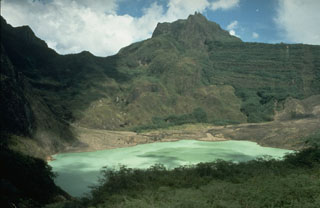 The broad, irregular summit of Kelud volcano contains several lava domes and a crater lake that has been the source of frequent violent and sometimes devastating eruptions. Construction of outlet tunnels following an eruption in 1919 that killed 5,110 people has reduced the number of fatalities from pyroclastic flows and lahars during subsequent eruptions.
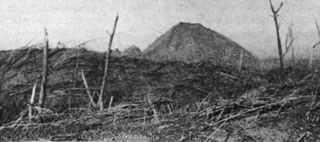 During the devastating April 1966 eruption, pyroclastic flows reached 9 km from the summit crater. These trees were blown down parallel to the travel direction of the pyroclastic flows near Bambingan, 5 km west of the crater. This 18 May 1966 photo shows Umbuk hill in the background and was taken about three weeks after the brief 26-27 April eruption that lasted about 7 hours.
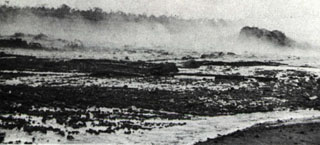 Steam rises from the surface of a hot secondary lahar in the Temas river on 19 May 1966, three weeks after a devastating eruption on 26-27 April. During the eruption lahars reached 31 km down the Temas river to the SW. The Temas river lahars were part of the main flow that originated in the Badak river channel below the southwestern low point of the crater rim. Primary lahars caused most of the more than 200 fatalities from the eruption, but three people were also killed by secondary lahars such as the one seen in this photo.
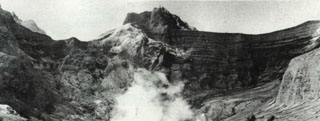 The empty, vegetation-free crater of Kelud volcano is seen here from the SW-side overflow on 20 May 1966, less than a month after a devastating eruption. A brief but powerful explosive eruption 26-27 April produced pyroclastic flows that swept 9 km from the summit and deadly lahars that reached up to about 30 km along river drainages on the south-NW sides. As with many other Kelud eruptions, it occurred without warning. No signs of an impending eruption were noted during a visit to the summit crater only two days earlier.
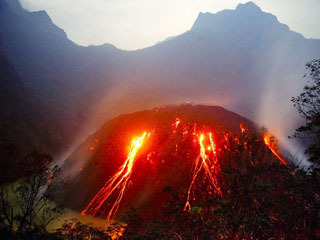 Incandescent blocks from the growing lava dome at Kelud volcano in November 2007 form traces extending into the crater lake (lower left) in this view from the west. Increases in water temperature and color were noted beginning on 11 September 2007. On 4 November a lava dome was seen rising above the lake surface and reached a visible radius of 250 m and a height of 120 m by 8 November. Dome growth had apparently ceased by April 2008, by which time it had filled much of the crater lake.
The maps shown below have been scanned from the GVP map archives and include the volcano on this page. Clicking on the small images will load the full 300 dpi map. Very small-scale maps (such as world maps) are not included. The maps database originated over 30 years ago, but was only recently updated and connected to our main database. We welcome users to tell us if they see incorrect information or other problems with the maps; please use the Contact GVP link at the bottom of the page to send us email.
There are no samples for Kelud in the Smithsonian's NMNH Department of Mineral Sciences Rock and Ore collection.
| Copernicus Browser | The Copernicus Browser replaced the Sentinel Hub Playground browser in 2023, to provide access to Earth observation archives from the Copernicus Data Space Ecosystem, the main distribution platform for data from the EU Copernicus missions. |
| MIROVA | Middle InfraRed Observation of Volcanic Activity (MIROVA) is a near real time volcanic hot-spot detection system based on the analysis of MODIS (Moderate Resolution Imaging Spectroradiometer) data. In particular, MIROVA uses the Middle InfraRed Radiation (MIR), measured over target volcanoes, in order to detect, locate and measure the heat radiation sourced from volcanic activity. |
| MODVOLC Thermal Alerts | Using infrared satellite Moderate Resolution Imaging Spectroradiometer (MODIS) data, scientists at the Hawai'i Institute of Geophysics and Planetology, University of Hawai'i, developed an automated system called MODVOLC to map thermal hot-spots in near real time. For each MODIS image, the algorithm automatically scans each 1 km pixel within it to check for high-temperature hot-spots. When one is found the date, time, location, and intensity are recorded. MODIS looks at every square km of the Earth every 48 hours, once during the day and once during the night, and the presence of two MODIS sensors in space allows at least four hot-spot observations every two days. Each day updated global maps are compiled to display the locations of all hot spots detected in the previous 24 hours. There is a drop-down list with volcano names which allow users to 'zoom-in' and examine the distribution of hot-spots at a variety of spatial scales. |
|
WOVOdat
Single Volcano View Temporal Evolution of Unrest Side by Side Volcanoes |
WOVOdat is a database of volcanic unrest; instrumentally and visually recorded changes in seismicity, ground deformation, gas emission, and other parameters from their normal baselines. It is sponsored by the World Organization of Volcano Observatories (WOVO) and presently hosted at the Earth Observatory of Singapore.
GVMID Data on Volcano Monitoring Infrastructure The Global Volcano Monitoring Infrastructure Database GVMID, is aimed at documenting and improving capabilities of volcano monitoring from the ground and space. GVMID should provide a snapshot and baseline view of the techniques and instrumentation that are in place at various volcanoes, which can be use by volcano observatories as reference to setup new monitoring system or improving networks at a specific volcano. These data will allow identification of what monitoring gaps exist, which can be then targeted by remote sensing infrastructure and future instrument deployments. |
| Volcanic Hazard Maps | The IAVCEI Commission on Volcanic Hazards and Risk has a Volcanic Hazard Maps database designed to serve as a resource for hazard mappers (or other interested parties) to explore how common issues in hazard map development have been addressed at different volcanoes, in different countries, for different hazards, and for different intended audiences. In addition to the comprehensive, searchable Volcanic Hazard Maps Database, this website contains information about diversity of volcanic hazard maps, illustrated using examples from the database. This site is for educational purposes related to volcanic hazard maps. Hazard maps found on this website should not be used for emergency purposes. For the most recent, official hazard map for a particular volcano, please seek out the proper institutional authorities on the matter. |
| IRIS seismic stations/networks | Incorporated Research Institutions for Seismology (IRIS) Data Services map showing the location of seismic stations from all available networks (permanent or temporary) within a radius of 0.18° (about 20 km at mid-latitudes) from the given location of Kelud. Users can customize a variety of filters and options in the left panel. Note that if there are no stations are known the map will default to show the entire world with a "No data matched request" error notice. |
| UNAVCO GPS/GNSS stations | Geodetic Data Services map from UNAVCO showing the location of GPS/GNSS stations from all available networks (permanent or temporary) within a radius of 20 km from the given location of Kelud. Users can customize the data search based on station or network names, location, and time window. Requires Adobe Flash Player. |
| DECADE Data | The DECADE portal, still in the developmental stage, serves as an example of the proposed interoperability between The Smithsonian Institution's Global Volcanism Program, the Mapping Gas Emissions (MaGa) Database, and the EarthChem Geochemical Portal. The Deep Earth Carbon Degassing (DECADE) initiative seeks to use new and established technologies to determine accurate global fluxes of volcanic CO2 to the atmosphere, but installing CO2 monitoring networks on 20 of the world's 150 most actively degassing volcanoes. The group uses related laboratory-based studies (direct gas sampling and analysis, melt inclusions) to provide new data for direct degassing of deep earth carbon to the atmosphere. |
| Large Eruptions of Kelud | Information about large Quaternary eruptions (VEI >= 4) is cataloged in the Large Magnitude Explosive Volcanic Eruptions (LaMEVE) database of the Volcano Global Risk Identification and Analysis Project (VOGRIPA). |
| EarthChem | EarthChem develops and maintains databases, software, and services that support the preservation, discovery, access and analysis of geochemical data, and facilitate their integration with the broad array of other available earth science parameters. EarthChem is operated by a joint team of disciplinary scientists, data scientists, data managers and information technology developers who are part of the NSF-funded data facility Integrated Earth Data Applications (IEDA). IEDA is a collaborative effort of EarthChem and the Marine Geoscience Data System (MGDS). |

