
A small eruption at Nishinoshima’s central crater was observed during an overflight conducted by the Japan Coast Guard on 4 October. Gray ash-and-gas plumes rose to 1.5 km (4,900 ft) a.s.l. Gas emissions from the central crater were at similar levels to those seen on 20 September, though gas emissions had increased at the fumaroles widely distributed along the E and N parts of the island. Dark reddish-brown-to-green discolored water was visible around most of the island.
Source: Japan Coast Guard
Small ash plumes and fumarolic activity during November 2022 through April 2023
Nishinoshima is a small island located about 1,000 km S of Tokyo in the Ogasawara Arc in Japan. The island is the summit of a massive submarine volcano that has prominent peaks to the S, W, and NE. Eruptions date back to 1973; the most recent eruption period began in October 2022 and was characterized by ash plumes and fumarolic activity (BGVN 47:12). This report describes ash plumes and fumarolic activity during November 2022 through April 2023 based on monthly reports from the Japan Meteorological Agency (JMA) monthly reports and satellite data.
The most recent eruptive activity prior to the reporting internal occurred on 12 October 2022, when an ash plume rose 3.5 km above the crater rim. An aerial observation conducted by the Japan Coast Guard (JCG) on 25 November reported that white fumaroles rose approximately 200 m above the central crater of a pyroclastic cone (figure 119), and multiple plumes were observed on the ESE flank of the cone. Discolored water ranging from reddish-brown to brown and yellowish-green were visible around the perimeter of the island (figure 119). No significant activity was reported in December.
 |
Figure 119. Aerial photo of gas-and-steam plumes rising 200 m above Nishinoshima on 25 November 2022. Reddish brown to brown and yellowish-green discolored water was visible around the perimeter of the island. Courtesy of JCG via JMA (monthly reports of activity at Nishinoshima, November 2022). |
During an overflight conducted by JCG on 25 January 2023 intermittent activity and small, blackish-gray plumes rose 900 m above the central part of the crater were observed (figure 120). The fumarolic zone of the E flank and base of the cone had expanded and emissions had intensified. Dark brown discolored water was visible around the perimeter of the island.
 |
Figure 120. Aerial photo of a black-gray ash plume rising approximately 900 m above the crater rim of Nishinoshima on 25 January 2023. White fumaroles were visible on the E slope of the pyroclastic cone. Dense brown to brown discolored water was observed surrounding the island. Photo has been color corrected. Courtesy of JCG via JMA (monthly reports of activity at Nishinoshima, January, 2023). |
No significant activity was reported during February through March. Ash plumes at 1050 and 1420 on 11 April rose 1.9 km above the crater rim and drifted NW and N. These were the first ash plumes observed since 12 October 2022. On 14 April JCG carried out an overflight and reported that no further eruptive activity was visible, although white gas-and-steam plumes were visible from the central crater and rose 900 m high (figure 121). Brownish and yellow-green discolored water surrounded the island.
 |
Figure 121. Aerial photo of white gas-and-steam plumes rising 900 m above Nishinoshima on 14 April 2023. Brown and yellow-green discolored water is visible around the perimeter of the island. Photo has been color corrected. Courtesy of JCG via JMA (monthly reports of activity at Nishinoshima, April, 2023). |
Intermittent low-to-moderate power thermal anomalies were recorded in the MIROVA graph (Middle InfraRed Observation of Volcanic Activity) during November 2022 through April 2023 (figure 123). A cluster of six to eight anomalies were detected during November while a smaller number were detected during the following months: two to three during December, one during mid-January 2023, one during February, five during March, and two during April. Thermal activity was also reflected in infrared satellite data at the summit crater, accompanied by occasional gas-and-steam plumes (figure 124).
 |
Figure 123. Intermittent low-to-moderate thermal anomalies were detected at Nishinoshima during November 2022 through April 2023, according to this MIROVA graph (Log Radiative Power). A cluster of anomalies occurred throughout November, while fewer anomalies were detected during the following months. Courtesy of MIROVA. |
 |
Figure 124. Infrared (bands B12, B11, B4) satellite images show a small thermal anomaly at the summit crater of Nishinoshima on 9 January 2023 (left) and 8 February 2023 (right). Gas-and-steam plumes accompanied this activity and extended S and SE, respectively. Courtesy of Copernicus Browser. |
Information Contacts: Japan Meteorological Agency (JMA), 1-3-4 Otemachi, Chiyoda-ku, Tokyo 100-8122, Japan (URL: http://www.jma.go.jp/jma/indexe.html); MIROVA (Middle InfraRed Observation of Volcanic Activity), a collaborative project between the Universities of Turin and Florence (Italy) supported by the Centre for Volcanic Risk of the Italian Civil Protection Department (URL: http://www.mirovaweb.it/); Copernicus Browser, Copernicus Data Space Ecosystem, European Space Agency (URL: https://dataspace.copernicus.eu/browser/).
2023: January
| April
| July
| October
2022: September
| October
2021: August
2020: January
| February
| March
| June
| July
| August
| November
| December
2019: December
2018: June
| July
2017: April
| May
| June
| July
| August
2016: August
2015: February
| June
| November
2014: January
| April
| June
| July
| September
2013: November
| December
A small eruption at Nishinoshima’s central crater was observed during an overflight conducted by the Japan Coast Guard on 4 October. Gray ash-and-gas plumes rose to 1.5 km (4,900 ft) a.s.l. Gas emissions from the central crater were at similar levels to those seen on 20 September, though gas emissions had increased at the fumaroles widely distributed along the E and N parts of the island. Dark reddish-brown-to-green discolored water was visible around most of the island.
Source: Japan Coast Guard
The Tokyo VAAC reported that an ash plume from Nishinoshima was seen by a pilot and identified in a satellite image at 0630 on 21 July drifting S at an altitude of 3 km (10,000 ft) a.s.l.
Source: Tokyo Volcanic Ash Advisory Center (VAAC)
JMA reported that at around 1300 on 9 July an eruption plume from Nishinoshima rose 1.6 km above the crater and drifted N. Satellite images acquired at 1420 and 2020 on 9 July and 0220 on 10 July showed continuing emissions rising 1.3-1.6 km and drifting NE and N.
Source: Japan Meteorological Agency (JMA)
JMA reported that at 1050 and 1420 on 11 April ash plumes from Nishinoshima rose 1.9 km above the crater rim and drifted NW and W [Correction: NW and N.]
Source: Japan Meteorological Agency (JMA)
The Japan Coast Guard reported that during an overflight of Nishinoshima on 25 January scientists observed intermittent activity and small, blackish-gray plumes rising 900 m from the central part of the crater. The fumarolic zone on the E flank and base of the cone had expanded and emissions had intensified. Dark brown discolored water was visible all around the volcanic island.
Source: Japan Coast Guard
JMA reported that on 12 October ash plumes from Nishinoshima rose 2.2-3.5 km (7,200-11,500 ft) a.s.l. and drifted NW and W.
Source: Japan Meteorological Agency (JMA)
JMA reported that the eruption at Nishinoshima continued during 5-11 October. Ash plumes rose 2.2-3.5 km (7,200-11,500 ft) a.s.l. and drifted in multiple directions.
Sources: Japan Meteorological Agency (JMA); Tokyo Volcanic Ash Advisory Center (VAAC)
According to JMA and the Tokyo VAAC an eruption at Nishinoshima produced ash plumes that rose to 1.8-2.6 km (6,000-8,500 ft) a.s.l. and drifted E and W during 1-4 October.
Sources: Japan Meteorological Agency (JMA); Tokyo Volcanic Ash Advisory Center (VAAC)
JMA reported that ash plumes from Nishinoshima were visible in satellite images on 14 August rising about 1.9 km and drifting N. The Japan Coast Guard conducted an overflight the next day and did not observe eruptive activity or new deposits from the day before. The Tokyo VAAC noted that a period of continuous ash emissions was visible in satellite data on 15 August.
Sources: Japan Coast Guard; Japan Meteorological Agency (JMA); Tokyo Volcanic Ash Advisory Center (VAAC)
JMA reduced the exclusion zone for Nishinoshima from a radius of 2.5 to 1.5 km around the summit crater on 18 December; eruptive activity ended in August. Fumarolic and high-temperature areas remained visible.
Source: Japan Meteorological Agency (JMA)
The Japan Coast Guard reported that during an overflight of Nishinoshima on 24 November scientists observed white fumarolic plumes rising from multiple locations on the inner crater wall and the rim. The inner crater wall continued to be hot. The ocean water was brown around the W, S, and E parts of the island.
Source: Japan Coast Guard
Japan Coast Guard reported that during an overflight of Nishinoshima on 19 August scientists observed a white plume comprised of volcanic gases rising 3 km from the crater. No lava effusion was visible, though the inner crater was hot. The entire island was covered with ash.
Source: Japan Coast Guard
Based on satellite data, the Tokyo VAAC reported that during 12-18 August ash plumes from Nishinoshima rose to 2.4-5.5 km (8,000-18,000 ft) a.s.l. and drifted NE, NW, W, and SW.
Source: Tokyo Volcanic Ash Advisory Center (VAAC)
Based on satellite data, the Tokyo VAAC reported that during 5-11 August ash plumes from Nishinoshima rose to 4-4.9 km (13,000-16,000 ft) a.s.l. and drifted in multiple directions.
Source: Tokyo Volcanic Ash Advisory Center (VAAC)
Based on satellite data, the Tokyo VAAC reported that during 29 July-3 August ash plumes from Nishinoshima rose to 3.4-5.8 km (11,000-19,000 ft) a.s.l. and drifted in multiple directions. Strong sulfur dioxide signatures continued to be detected in satellite data.
Sources: Tokyo Volcanic Ash Advisory Center (VAAC); Simon Carn
Based on satellite data, the Tokyo VAAC reported that during 22-28 July ash plumes from Nishinoshima rose to 2.4-5.2 km (8,000-17,000 ft) a.s.l. and drifted in multiple directions.
Source: Tokyo Volcanic Ash Advisory Center (VAAC)
JMA scientists observed Nishinoshima from a ship on 11 July. They reported that a large amount of ash was emitted from the summit crater; plumes rose about 1.7 km and drifted W, dropping ash into the sea. Deposits of large blocks at the foot of the cone were visible. Lava fountains that rose 200 m above the crater were observable at night, along with lightning in the ash plumes. The cone had grown to about 200 m, about 40 m higher than an estimate on 1 December 2019. The report stated that ships should stay at least 2.5 km away from the cone.
Based on satellite data and pilot observations, the Tokyo VAAC reported that during 16-21 July ash plumes rose to 3.7-6.4 km (12,000-21,000 ft) a.s.l. and drifted N, NE, and E. Satellite data showed a sulfur dioxide plume reaching the western USA on 18 July, after traveling over 9,000 km from Nishinoshima.
Sources: Japan Meteorological Agency (JMA); Tokyo Volcanic Ash Advisory Center (VAAC); Simon Carn
Based on satellite data and pilot observations (on 8 July), the Tokyo VAAC reported that during 8-14 July ash plumes from Nishinoshima rose to 3.7-6.1 km (12,000-20,000 ft) a.s.l. and drifted NW, N, NE, and E.
Source: Tokyo Volcanic Ash Advisory Center (VAAC)
JMA reported that the eruption at Nishinoshima had been particularly vigorous since mid-June, producing a large amount of ash. Based on satellite data, the Tokyo VAAC reported that during 1-3 and 5-7 July ash plumes rose to 2.7-4.9 km (9,000-16,000 ft) a.s.l. and drifted N and NW, and sometimes SW. On 4 July, ash plumes rose to 8.3 km above the summit (or to 24,000-28,000 ft. a.s.l.), the highest recorded plume since the volcano became active in 2013.
Sources: Japan Meteorological Agency (JMA); Tokyo Volcanic Ash Advisory Center (VAAC)
During an overflight of Nishinoshima on 29 June Japan Coast Guard observers noted black ash plumes vigorously rising from the central crater to more than 3.4 km (11,200 ft) a.s.l. A possible collapse of the SW part of the main crater was evident in photographs taken during the overflight. Strombolian explosions ejected lava above the cone and lava traveled SW, reaching the ocean and producing steam plumes. Discolored yellow-green water was visible as far as 1 km offshore. The marine exclusion zone was defined as a radius of about 2.6 km from the island.
Source: Japan Coast Guard
The Tokyo VAAC reported that ash plumes from Nishinoshima rose to 2.1-2.4 km (7,000-8,000 ft) a.s.l. and drifted NE and E. The marine exclusion zone was defined as a radius of about 2.6 km from the island.
Sources: Tokyo Volcanic Ash Advisory Center (VAAC); Japan Coast Guard
The Tokyo VAAC reported that ash plumes from Nishinoshima rose to 2.1-2.7 km (7,000-9,000 ft) a.s.l. and drifted NE and E. During an overflight on 15 June the Japan Coast Guard noted continuous activity from the central vent, including a gray-brown to black-brown ash plume rising as high as 2 km. Ejected material landed near the cone’s base. Lava from the NE side of the central vent flowed E. Steam plumes rose along the E coast where lava entered the sea, causing discolored brownish water offshore. The marine exclusion zone was defined as a radius of about 2.6 km from the island.
Sources: Japan Coast Guard; Tokyo Volcanic Ash Advisory Center (VAAC)
During an overflight on 9 March the Japan Coast Guard (JCG) noted continuous activity from the central vent at Nishinoshima, including an ash plume rising as high as 1 km. Ejected material landed near the cone’s base. Lava from the NE side of the central vent flowed 1 km N and into the sea. Steam plumes rose along the E coast where lava entered the sea. Lava also effused from a vent on the SW flank of the cone. Discolored yellow-green water was visible offshore to the W, N, and E. Sulfur dioxide emissions had increased since 17 February measurements. The marine exclusion zone was defined as a radius of about 2.6 km from the island.
Source: Japan Coast Guard
The Japan Coast Guard (JCG) presented InSAR results from 17 November 2019 to 28 February 2020 showing growth of Nishinoshima’s central cone alomg with changes to the island’s surface and expansion of the coastline from lava flows. During an overflight on 17 February observers noted continuous activity from the central vent, including a diffuse ash plume rising about 600 m. Ejected material landed near the cone’s base. Lava flowed into the sea at the N and E coasts, causing a rising steam plume. Discolored water had been seen on 4 February in an area 9 km S of the island but was not apparent during the overflight possibly due to weather conditions. The marine exclusion zone was defined as a radius of about 2.6 km from the island.
Source: Japan Coast Guard
Based on satellite images and a pilot observation, the Tokyo VAAC reported that on 15 February an ash plume from Nishinoshima rose to 3 km (10,000 ft) a.s.l. and drifted E.
Source: Tokyo Volcanic Ash Advisory Center (VAAC)
Based on satellite images, the Tokyo VAAC reported that during 25-26 January ash plumes from Nishinoshima rose 1.5 km (5,000 ft) a.s.l. and drifted SW, W, and NW.
Source: Tokyo Volcanic Ash Advisory Center (VAAC)
The Japan Coast Guard (JCG) reported that during an overflight of Nishinoshima conducted from 1335 to 1412 on 17 January surveyors observed continuous gray emissions rising from the central crater of the pyroclastic cone to 1.8 km (5,900 ft) a.s.l. and drifting E and NE. The central crater was open to the ENE; lava flows traveled NE and entered the ocean, producing steam plumes at the coastline.
Source: Japan Coast Guard
The Japan Coast Guard (JCG) reported that during an overflight of Nishinoshima on 15 December surveyors observed that explosions were occurring from the main crater of the pyroclastic cone every second to several seconds. Blocks were ejected as high as 300 m above the crater rim; red hot blocks were scattered at the base of the cone. Gray plumes rose from the crater, and lava continued flowing E into the sea. A new crater had opened on the N flank of the cone and effused lava that flowed NW down to the sea. JMA expanded the marine exclusion zone around the island to 2.5 km the next day.
Sources: Japan Meteorological Agency (JMA); Japan Coast Guard
A thermal anomaly at Nishinoshima was identified in satellite images on 5 December, prompting JMA to expand the marine exclusion zone around the island to 1.5 km. The Japan Coast Guard (JCG) conducted an overflight the next day and observed Strombolian explosions ejecting blocks as high as 200 m above a crater on the E side of the central pyroclastic cone. Lava flows had traveled to within 200 m of the coastline. Light gray eruption plumes drifted E. During an overflight on 7 December observers confirmed continuing Strombolian activity and saw lava entering the sea.
Sources: Japan Meteorological Agency (JMA); Japan Coast Guard
Based on Japan Coast Guard (JCG) observations, JMA reported that a very small eruption at Nishinoshima occurred at 1124 on 12 July, producing a brownish plume that rose from near the crater. During an aerial survey, JCG noted deposits 400 m from the vent. No thermal anomalies were detected. The report warned people to stay at least 500 m away from the crater.
Source: Japan Meteorological Agency (JMA)
JMA reported that seismic, thermal, RADAR, and sulfur dioxide data all showed no eruptive activity at Nishinoshima since mid-August 2017. During an overflight on 14 June the Japan Coast Guard noted white fumarolic plumes rising about 20 m from the E side of main cone’s inner wall and from the center of the crater. Ocean water all around the island was discolored, especially in the N-to-NW quadrant where the yellowish brown water extended 200-300 m from the shore. On 20 June the JMA reduced the warning level for the island, specifying hazards were less severe “around the crater” (encompassing areas within 500 m).
Source: Japan Meteorological Agency (JMA)
The Japan Coast Guard reported that visual observations of Nishinoshima from an aircraft during the afternoon of 11 August suggested that the eruption was continuing; a high temperature area at the ocean entry on the W flank and a steam plume indicated flowing lava. Lava in the central crater could not be confirmed; a small fumarolic emission rose from the crater’s edge. Observations on the afternoon of 24 August suggested no lava flowing into the ocean.
Source: Japan Coast Guard
The Japan Coast Guard reported that visual observations of Nishinoshima from an aircraft during the afternoon of 11 July confirmed that the eruption was ongoing. Emissions from the center of the cone were grayish white and tephra was ejected. The lava flow on the W flank continued to enter the ocean. Based on a pilot observation the Tokyo VAAC reported that on 18 July an ash plume rose to 3 km (10,000 ft) a.s.l.
Sources: Japan Coast Guard; Tokyo Volcanic Ash Advisory Center (VAAC)
Based on satellite images and pilot observations the Tokyo VAAC reported that on 5 July an ash plume from Nishinoshima drifted E.
Source: Tokyo Volcanic Ash Advisory Center (VAAC)
Based on satellite images, pilot observations, and information from JMA, the Tokyo VAAC reported that during 30 June-2 July ash plumes from Nishinoshima rose 1.5-3 km (5,000-10,000 ft) a.s.l. and drifted W and E.
Source: Tokyo Volcanic Ash Advisory Center (VAAC)
The Japan Coast Guard reported that during an overflight of Nishinoshima during 1300-1345 on 2 May observers noted frequent (every 40-60 seconds) Strombolian explosions at a new pyroclastic cone in the crater. Ash plumes rose 500 m. Two lava flows originating from the N part of the cone traveled 180 m SW and 170 m W, and entered the ocean. The island continued to grow and was estimated to be 2 km E to W and about 1.9 km N to S, with an area of 2.75 square kilometers (it was 2.68 square kilometers on 15 September 2016).
Source: Japan Coast Guard
Satellite images of Nishinoshima acquired on 19 April and processed by NASA's Earth Observatory showed an area of hot lava in the crater. According to a news article, observers aboard a plane passing the volcano on 21 April noted intense activity in the crater. Bombs were ejected as high as 100 m above the crater and incandescent rocks rolled down the flanks, reaching the sea. The report noted brown plumes rising from the crater and lava effusing from an area near the top of the vent.
Sources: NASA Earth Observatory; Asahi
JMA reported that no additional activity was observed after the 17 November 2015 eruption at Nishinoshima, which ejected bombs a few meters in diameter as far as 1 km from the vent, suggesting the eruption had stopped sometime in late November. Gas emissions decreased in June 2016. High-temperature areas around the crater continued to be detected. JMA reduced the warning statement for the island, specifying hazards were less severe “around the crater” (encompassing areas within 500 m), rather than more broadly “near the crater”.
Source: Japan Meteorological Agency (JMA)
According to a news article from 22 November, recent footage (from the previous week) of Nishinoshima showed that the eruption was ongoing with explosion from the central crater and lava flows. The new island was 1.9 km E to W, 1.95 km N to S, and 100 m high, based on Coast Guard reports.
Source: Japan Today
According to NASA's Earth Observatory, a satellite image of Nishinoshima acquired on 21 June showed a sulfur dioxide-and-steam plume rising from the 2.45-square-kilometer island and drifting NE. Hot spots from lava that had emerged from lava tubes were visible on a lava delta at the SE part of the island.
Source: NASA Earth Observatory
According to news articles, the eruption at Nishinoshima continued at least through 27 February. The Japan Coast Guard noted that the island had grown to about 2.46 square kilometers and the active cone was about 100 m tall. Explosions occurred several times per minute and ash-and-gas plumes rose 1.2 km. Steam plumes rose from areas where lava flows contacted sea water.
Sources: The Japan Times; The Japan News
The Tokyo VAAC reported an ash plume from Nishinoshima that rose to an altitude of about 3 km (10,000 ft) a.s.l. and drifted S on 16 September.
The University of Hawaii reported that satellite data from the Moderate Resolution Imaging Spectroradiometer (MODIS) resulted in frequent MODVOLC alerts for Nishinoshima, as recently as 11 September.
Sources: Hawai'i Institute of Geophysics and Planetology (HIGP) Thermal Alerts Team; Tokyo Volcanic Ash Advisory Center (VAAC)
Tokyo VAAC reported volcanic ash from Nishinoshima at 3 km (10,000 ft) a.s.l. at 2203 on 30 June; the plume extended NE. However, ash was not visible in satellite images. The University of Hawaii reported that Moderate Resolution Imaging Spectroradiometer (MODIS) satellite data detected thermal anomalies and issued MODVOLC alerts during 25 June-13 July with the exceptions of 8, 11, and 12 July.
Sources: Hawai'i Institute of Geophysics and Planetology (HIGP) Thermal Alerts Team; Tokyo Volcanic Ash Advisory Center (VAAC)
Photographs and video taken from a Japanese Coast Guard helicopter on 11 and 13 June revealed continuing eruptive activity at Nishinoshima. Steaming along the shoreline indicated at least two locations with active, or recently active, lava ocean entries, possibly tube-fed since no surface incandescence was visible. Night video clearly showed an active lava flow and ocean entry being supplied from lava fountaining out of a cinder cone. A significant steam plume was rising from the center of the lava shield from hot tephra deposits over a broad area rather than a crater. However, pulsating tephra ejections and distinctly brown ash plumes were rising from two smaller craters. An incandescent lava lake was visible in one of the small craters on both days.
Similar Coast Guard photos taken on 21 May showed a large ash-bearing plume and Strombolian activity from a larger cinder cone in the center of the island. Minor steaming from two central cinder cones was photographed on 15 April, and incandescent lava could be seen in the crater of one.
Source: Japan Coast Guard
Based on satellite images, the Tokyo VAAC reported that on 18 April a possible eruption from Nishinoshima produced a plume that rose 2.1 km (7,000 ft) a.s.l. and drifted E.
Source: Tokyo Volcanic Ash Advisory Center (VAAC)
A photo and video posted by the Japan Coast Guard showed that on 20 January the Niijima portion of Nishino-shima was larger than the original island; the two islands had merged on 24 December 2013. White and brown plumes rose from Niijima and the water to the SW was discolored.
Source: Japan Coast Guard
Based on satellite analysis, the Tokyo VAAC reported that on 21 January a possible ash plume from Nishino-shima rose 0.9 km (3,000 ft) a.s.l. and drifted E. An image acquired a few hours later showed that ash had dissipated.
Source: Tokyo Volcanic Ash Advisory Center (VAAC)
According to a news article, since mid-December lava flows from the newly formed Niijima island expanded NE towards Nishino-shima, and on 24 December the two islands joined. The Niijima area was about 500 m long and 450 m wide.
Source: The Japan News
The Japan Coast Guard reported that the eruption at Nishimo-shima, that generated a new island called Niijima continued on 1 December. The crater remained very hot and lava flows continued to expand.
Source: Japan Coast Guard
The Japanese Coast Guard reported that a Surtseyan eruption 500 m SE from the coast of Nishimo-shima generated a new island called Niijima on 20 November. The island was about 300 x 200 m, and developed a crater 150m wide. Discolored water surrounded the island. Based on satellite images, as well as accounts from the Japanese Coast Guard and JMA, the Tokyo VAAC reported that a plume rose 600 m. On 22 November the eruption continued and incandescence within the crater was observed. An ash plume rose 900 m and drifted SE. On 24 November lava flows from the crater extended to the coastline of the island, and bombs continued to be ejected.
Sources: Japan Coast Guard; Tokyo Volcanic Ash Advisory Center (VAAC)
Reports are organized chronologically and indexed below by Month/Year (Publication Volume:Number), and include a one-line summary. Click on the index link or scroll down to read the reports.
Submarine eruption breaks the ocean surface starting in late-May
Card 1678 (18 July 1973) White plume, discolored seawater, and floating pumice
A small submarine volcanic eruption near Nishino-shima Island was reported to have occurred at about 1100 on 30 May 1973. The crew of the fishing boat Daini-Ebisumara reported white smoke reaching a maximum height of 100 m. The smoke was rising from the surface of the sea east of the island at intervals of a few minutes. During an aerial inspection by the Japan Maritime Safety Agency on 31 May, the point of eruption was determined to be about 400 m E of Nishino-shima. A whirlpool was noticed around the site, and yellowish-green sea water and floating pumice were seen about 5 km N of the site. According to Tokiko Tiba, The National Science Museum, Tokyo, the crew of the Tokai-Daigaku-Maru 2 of Tokai University observed two black rocks protruding 1-1.5 m above the sea surface 600 m S of Nishino-shima at 1830 on 1 July 1973. A fan-shaped yellow belt of water about 3 km long was moving at a rate of 3 knots.
Card 1687 (30 July 1973) Active bubbling under the surface; water discoloration caused by ash and pumice
The submarine volcanic eruption near Nishino-shima is rather small, but the activity is continuing. The eruption site is located about 550 m E of Nishino-shima Island. According to aerial observation on 5 July by the Maritime Safety Agency, active bubbling under the sea surface (about 30m across) was seen, and sea water above and around the eruption site was discolored yellow by ashes and pumice. According to an aerial observation by the Asahi Press on 17 July, white volcanic smoke rose 100 m high, and water plumes several meters high were seen at intervals of two to three minutes. About ten reefs in a 30 m area were observed.
Information Contacts:
Card 1678 (18 July 1973) Seismological Division, Japan Meteorological Agency, Tokyo, Japan.
Card 1687 (30 July 1973) Seismological Division, Japan Meteorological Agency, Tokyo, Japan.
Eruption builds new island; vigorous eruptive activity
Card 1712 (25 September 1973) Eruption builds new island; vigorous eruptive activity
During an aerial observation made by the Japan Maritime Safety Agency and the Japan Meteorological Agency on 14 September 1973 from 1250 to 1400 Japan Standard Time, a new insular volcano was observed to have formed above the sea surface at the submarine eruption site, about 500 m SW of Nishino-shima Island. The new island is a cinder cone about 40 m high and 120 m across, with a 70-m-diameter crater which vigorously and frequently ejects black rock fragments to maximum height of 300 m, accompanied by dense smoke and vapor. Explosions are taking place at intervals of several tens of seconds. White smoke reached a height of 1,500 m, and the water around the eruption site is discolored reddish-brown. The JMA believes that this submarine volcanic activity started in April 1973.
Information Contacts: Seismological Division, JMA.
Fissure eruption has formed a chain of cinder cones above the sea surface
Card 1737 (01 November 1973) Fissure eruption has formed a chain of cinder cones above the sea surface
The Nishino-shima submarine eruption has formed a chain of cinder cones above the sea surface, which indicates that this activity is a fissure eruption.
Eruption review. 11 September: Small rocks were seen above the sea surface with 300-m-high volcanic smoke. 12 September: Successive eruptions with cinders and water plumes. 14 September: A new insular volcano appeared above the sea surface, at a point 600 m SE of Nishino-shima. The island was a cinder cone 120 m in diameter with a 70-m-diameter crater. Lava blocks were ejected to a height of 300 m, and volcanic smoke to 1,500 m. 9-10 October: A team of investigators, headed by Joyo Ossaka, Tokyo Institute of Technology, tried to get essential ejecta from the new volcano between 9 and 10 October, but they could not bring the boat to the new island because of rough weather. They collected only 0.3 grams of fallen ash which is now being analyzed by J. Ossaka. Another team will be organized in the near future.
Current activity. The new Nishino-shima volcano is now composed of a chain of cinder cones running from SW to NE, about 600 m above the sea surface. The most recent eruption is taking place at the tip of this chain. The distance between this recent eruption site and the discolored seawater area detected in April is about 1 km. The primary cones are now being destroyed by waves. The eruption is occurring at intervals of 1-2 minutes, or 5-10 minutes, with water plumes, volcanic blocks and ashes. The maximum height of the volcanic smoke was 500 m and the cinder column (max. 10 m across) reached a height of 300 m. At night, red-hot cinders were seen.
Information Contacts: Seismological Division, JMA.
Eruption continuing in mid-December; island was 700 m long
Card 1782 (23 January 1974) Eruption continuing in mid-December; island was 700 m long
The eruption near Nishino-shima is now correctly termed supermarine rather than submarine. The eruptive crater is now located on the sea surface. According to observations made by a research vessel, Tokaidaigaku-II, and airplanes of the Japan Maritime Safety Agency on 11, 12, and 21 December, it was confirmed that the new insular volcano has grown to an island larger than the "old" Nishino-shima. The island was 700 m long and 250 m wide, and about 40 m above sea level. Its eruptive activities are still continuing, ejecting cinders and white smoke to a height of 100 m. Small lava flows out of the craterlet were also observed. This volcano was named "Nishino-shima-Shinto" which means a new Nishino-shima island, on 20 December 1973.
Information Contacts: Seismological Division, JMA.
Aerial observations in mid-January show continued lava flows and explosions
Card 1793 (11 February 1974) Aerial observations in mid-January show continued lava flows and explosions
It was confirmed by aerial observations on 3 January by the Asahi Press, on 11-14 January by the Nishino-shima Research Group, and on 17 January by Maritime Self Defence Force, that volcanic activities at Nishino-shima-Shinto were continuing as follows: 1) Two cinder cones have been formed at the eastern and the western parts of this smaller volcano. 2) Volcanic activities were limited to the eastern cinder cone. 3) It was observed that erosion by waves has been in progress on this new volcano.
According to an aerial observation made on 11 January, red-hot lava was seen in the 10-m-diameter crater of the eastern cinder cone and lave was flowing outside. Small explosions with 50-m-high cinder ejections and 150-m-high white volcanic smoke occurred at intervals of one to two minutes.
Information Contacts: Seismological Division, JMA.
Island has five cinder cones; lava flows entering the ocean
Card 1833 (29 March 1974) Island has five cinder cones; lava flows entering the ocean
"According to an aerial observation made on 13 February, rather active smoke emissions were observed originating from the eastern part of the Nishino-shima-Shinto, and eruptive activities seemed to be still continuing.
"Special research was carried out from 6-11 March, 1974 by the research vessel, Tokaidaigaku-maru No. 2. According to the interim report by the research group, the external form of this new volcano and the location of the eruptive crater have changed compared with the previous state. Nishino-shima-Shinto is now an insular volcano with five peaks (cinder cones). Red-hot lava fragments were frequently hurled up out of the crater, which had been filled with red-hot lava, located at the eastern part of this island. Lava flows were also observed flowing out onto and/or under the slopes to the shore of the island, where white vapour was rising."
Information Contacts: Seismological Division, JMA.
Large lava flow on 1 May stretched to the W side of the new island
Card 1866 (30 May 1974) Large lava flow on 1 May stretched to the W side of the new island
On 1 May 1974, an aircraft of the Maritime Safety Agency confirmed that a large lava flow stretched to the western side of the "new" island volcano, Nishino-shima-Shinto, and that sea water inside the bay surrounded by the "new" and "old" islands was discolored brown. There was no activity on the summit craters, but the "new" island is still developing. Preliminary estimates showed that the "new" island was three times as large as the "old" island, Nishino-shima.
Information Contacts: Seismological Division, JMA.
Water discoloration seen on 15 November 1978
On 15 November 1978, discolored water was visible at 27.25°N, 140.88°E, 6.5 km NW of Nishino-shima, the first activity there since the explosions of May 1973-summer 1974.
Reference. Ehara, S., Yuhara, K., and Ossaka, J., 1977, Rapid cooling of volcano Nishinoshima-shinto, the Ogasawara Islands: Bulletin of the Volcanological Society of Japan, v. 22, p. 75-84 (SEAN Part I-Observational Results) and p. 123-131 (Part II-Interpretations).
Information Contacts: JMSA, Tokyo; JMA, Tokyo.
Discolored water observed in April 1982 and December 1985
[Aerial observations (on 2 December 1985) of a pale green water discoloration zone, extending 0.6 km SW from the island, were reported by JMSA (JMA, 1988). Water discoloration had last been observed in April 1982.]
Reference. Japan Meteorological Agency, 1988, Bulletin of Volcanic Eruptions, no. 25.
Information Contacts:
November 2013 submarine flank eruption spurs island growth
A new island emerged on 20 November 2013 out of the ocean as the result of a Surtseyan eruption on the S flank of Nishinoshima, a small volcanic island in the Izu-Bonin arc, ~940 km S of Tokyo (figure 1). The new island, originally called Niijima ('new island') by the Japan Coast Guard (JCG), eventually merged with Nishinoshima on 24 December 2013. We continue to describe the now merged islands under the name 'Nishinoshima.'
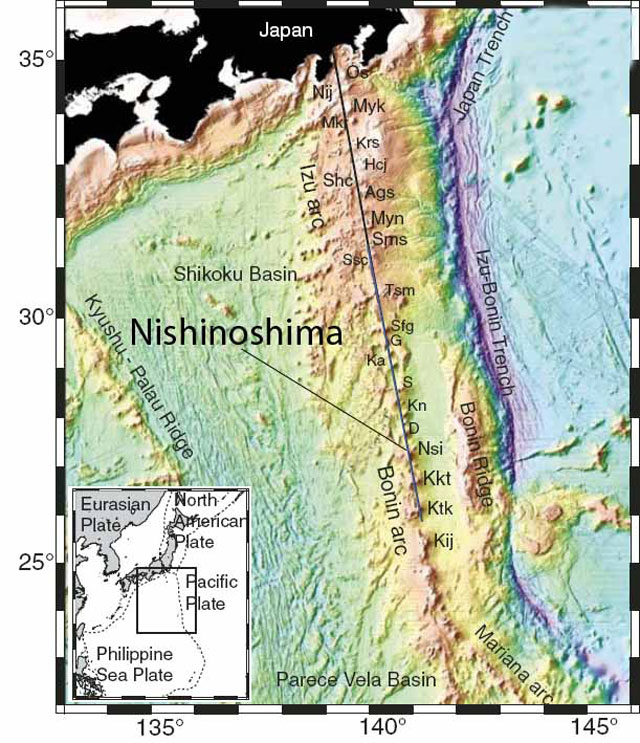 |
Figure 1. Location of Nishinoshima island shown on an annotated topographic map of the Izu-Bonin arc; the insert shows the area of the main map and the larger regional geography. The map highlights the location of Nishinoshima (Nsi). Other features located respectively from N to S are: Os–Oh–shima; Nij–Nii–jima; Myk–Miyake–jima; Mkr–Mikura–jima; Krs–Kurose hole; Hcj–Hachijo–jima; Shc–outh Hachijo caldera; Ags–Aoga–shima; Myn–Myojin knoll; Sms–South Sumisu; Ssc–South Sumisu caldera; Tsm–Torishima; Sfg–Sofugan; G–Getsuyo seamount; Ka–Kayo seamount; S–Suiyo seamount; Kn–Kinyo seamount; D–Doyo seamount; Nsi–Nishinoshima; Kkt–Kaikata seamount; Ktk–Kaitoku seamount; and Kij–Kita Iou-jima. After Kodaira and others (2007). |
Niijima emerges. Niijima emerged by 20 November 2013 from the ocean surface at an area ~0.5 km SSE off the coast of Nishinoshima. The latter is a small (700 m2), uninhabited volcanic island that last erupted and expanded in during 1973-74. Additional background information is included at the end of this report.
Based on satellite images, the Tokyo Volcanic Ash Advisory Center (VAAC) reported that at 0717 UTC on 20 November 2013 a plume rose 600 m over a new island which emerged ~500 m S of Nishinoshima (figure 2). At 0630 UTC on 22 November, a plume rose 900 m. MODVOLC satellite thermal alerts were measured almost daily from 1635 UTC on 23 November and continued through the latest alert noted at 0120 UTC on 7 April 2014.
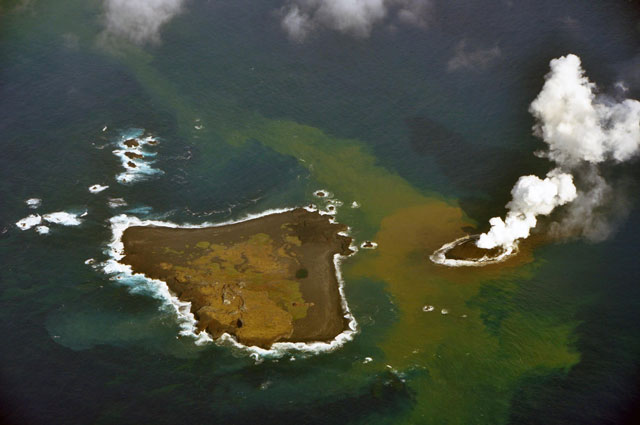 |
Figure 2. Niijima produces a plume as it emerges from the ocean to form a new island off the coast of Nishinoshima on 20 November 2013. Courtesy of Kurtenbach (2013); image from the JCG. |
On 21 November JCG and the Japan Meteorological Agency (JMA) noted that the island formed was by then ~200 m in diameter. A warning of dense black emissions from the eruption was issued by JCG on 20 November, and television footage (Frisk, 2013) showed on 21 November ash and rocks exploding from the crater as steam billowed out of the crater (figure 3). On 24 November, JCG reported lava flows coming from the newly-formed crater. They extended to the coastline of the island, and bombs continued to be ejected.
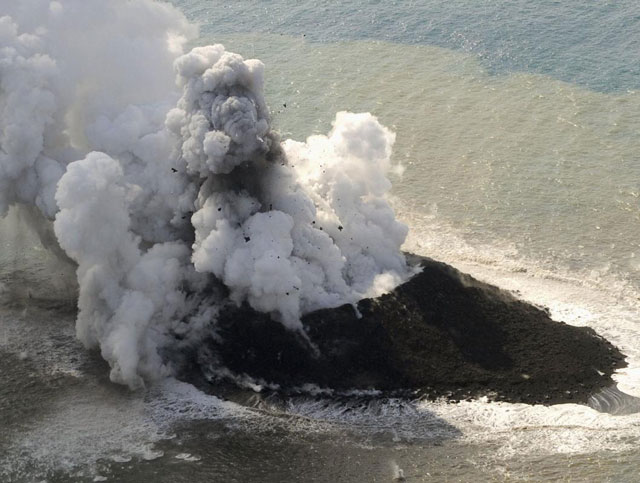 |
Figure 3. A photograph of Niijima from 21 November 2013 shortly after it emerged from the ocean . Note the large airborne rock erupting from the crater. Courtesy of Kurtenbach (2013); picture provided by JCG. |
The Advanced Land Imager (ALI) on NASA's Earth Observing-1 (EO-1) satellite captured a natural-color image on 8 December 2013 (figure 4). JMA reported that by early December the area of the new island had grown to 56,000 m2, about three times its initial size, and was 20 to 25 m above sea level.
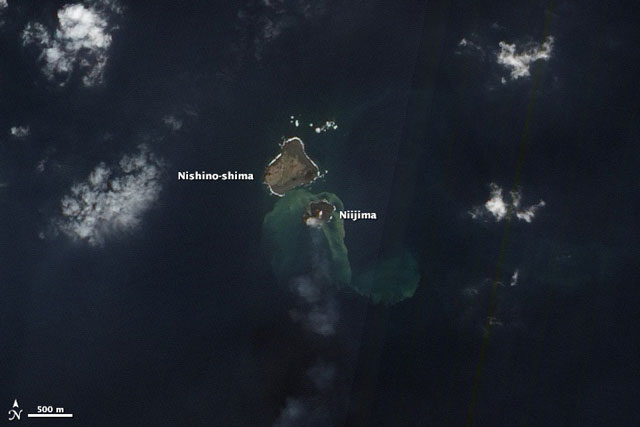 |
Figure 4. NASA Earth Observatory satellite image acquired on 8 December 2013 from the EO-1 ALI sensor. The discolored water around the island was attributed to material included volcanic minerals, gases, and seafloor sediment stirred up by the ongoing volcanic eruption. The faint white puffs above the center and SW portion of the island are likely steam and other volcanic gases associated with the eruption. Courtesy of NASA Earth Observatory web site. |
Niijima merges with Nishinoshima. NASA's EO-1 ALI satellite again captured a natural-color image of Nishinoshima and Niijima islands on 24 December 2013 and shows only a narrow channel of water appearing to separate the two (figure 5). The water around the islands continued to be discolored by volcanic minerals and gases, as well as by seafloor sediment stirred up by the ongoing eruption. A faint plume, likely steam and other volcanic gases associated with the eruption, drifted SE. Infrared imagery from the same satellite on the same date showed intense heat from the fresh lava, which continued to build the new island. A strip of isolated, discolored (orange) seawater appeared at the junction of the two islands (figure 6).
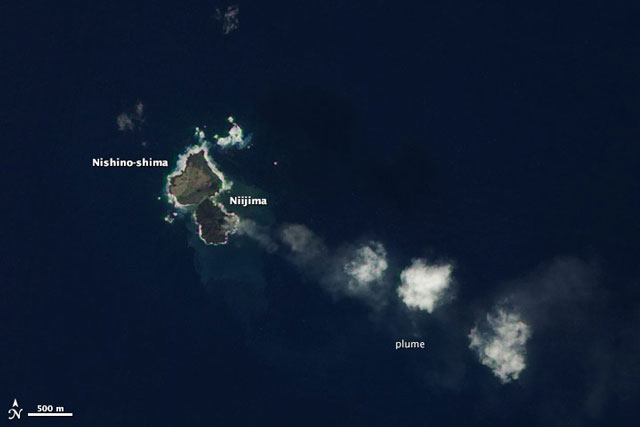 |
Figure 5. NASA Earth Observatory satellite image acquired 24 December 2013. Courtesy of NASA Earth Observatory; satellite image by Jesse Allen using EO-1 ALI data from the NASA EO-1 team. |
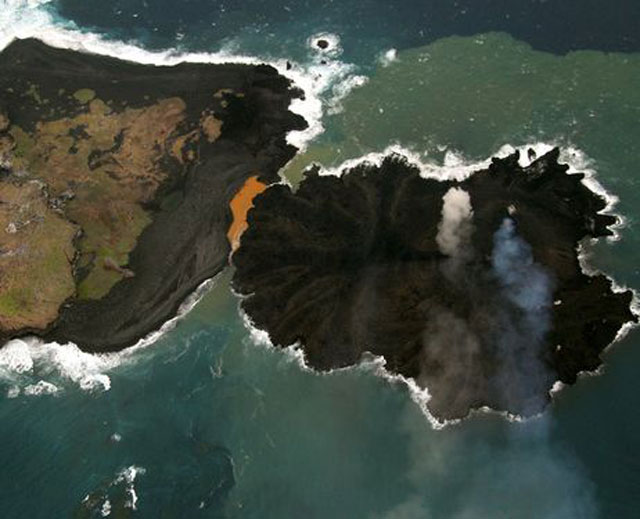 |
Figure 6. An aerial photograph just prior to the merger of the two islands, taken on 24 December 2013, with Niijima on the right and Nishinoshima on the left. Seawater trapped at the junction has been discolored to orange, attributed to the presence of particulate matter and biochemical activity of organisms in the water. Courtesy of the JCG. |
Figure 7 is a drawing by the Japanese Coast Guard (JCG) showing the location of the coastline and the growth of the new island (Niijima) from 20 November 2013 to 26 December 2013. It is striking how much of the island expanded during 13-24 December 2013.
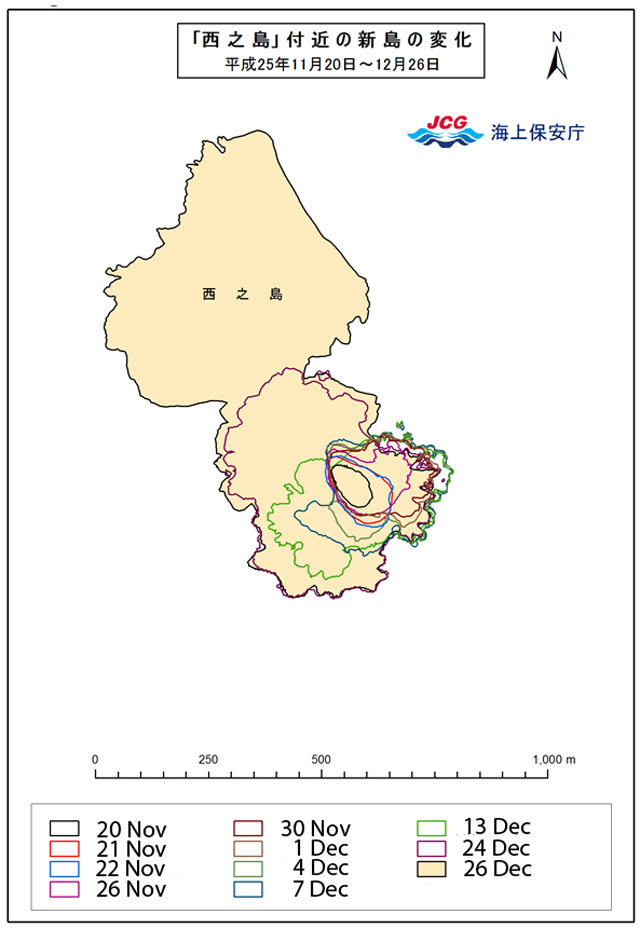 |
Figure 7. Scale drawing of the merged islands showing the changing coastlines as the new island grew. Colored enclosing lines during the current eruption of Nishinoshima as shown for the following dates: 20, 21, 22, 26, and 30 November 2013, and 1, 4, 7, 13, 24, and 26 December 2013 (note legend translated from Japanese for dates and color of mapped shorelines). Image and interpretation courtesy of JCG. |
According to JCG's aerial observation on 20 January 2014, the new part of Nishinoshima island had an area of 0.3 km2 (750 m E to W, and 600 m N to S) (figure 8).
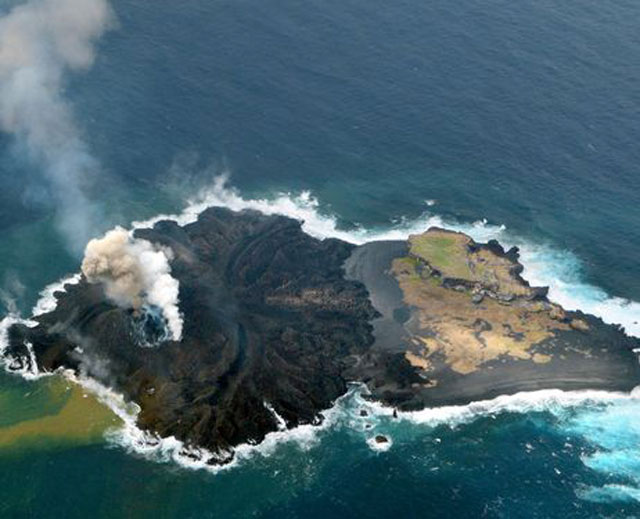 |
Figure 8. An aerial photograph, looking W, of Nishinoshima island taken on 20 January 2014. The newly merged island, Niijima, on the left, continued to expand NW. White and brown plumes rose from vents on the new land, and the water around the SW portion was discolored. Photo courtesy of the JCG. |
New images from an overflight on 3 February (figure 9) confirmed that the activity on the former new island continued steadily. Over the past weeks, the vent fed several active lava flow fronts that enlarged the land in more or less all directions. In particular, there are two active flows relatively close to the vent which had been traveling E and formed a small, almost closed bay with green-orange discolored water inside. The previous shorelines for 20 January 2014 (yellow enclosing line) and 21 November 2013 (white enclosing line) are superimposed over the image to show the growth of the island.
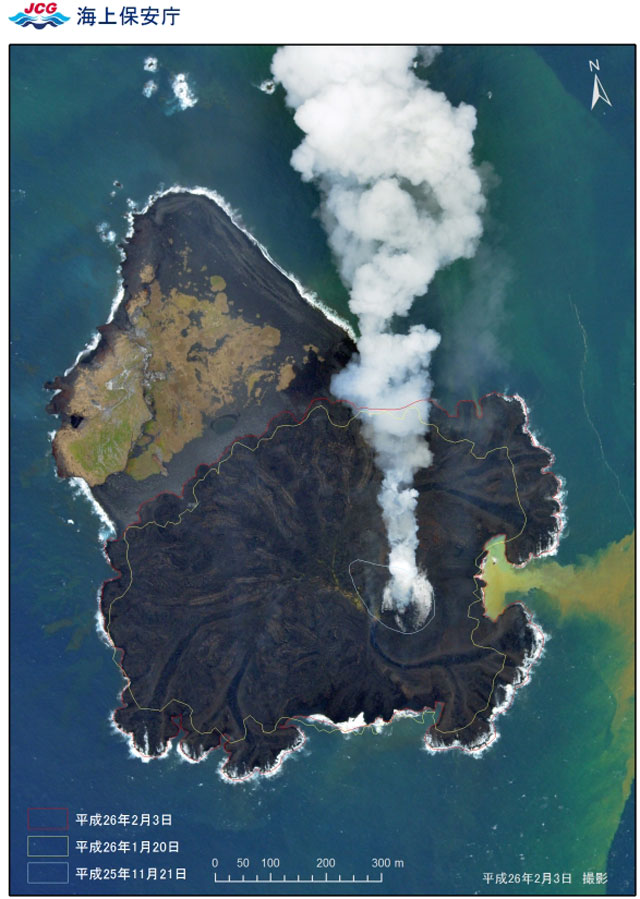 |
Figure 9. Aerial photography of the island on 3 February 2014. For comparison, the previous shorelines on 20 January 2014 (yellow enclosing line) and 21 November 2013 (white enclosing line). Image courtesy of JCG. |
According to Pfeiffer (2014), the island continued growing with lava flows traveling in several directions (figure 10). Its highest peak, formed by the most western of the two active vents, was measured at 66 m. The new addition has more than doubled the size of the island by 16 February. A black-sand beach formed on the NE shore of the old part of the island, as a result of lava fragments washed up by currents and waves.
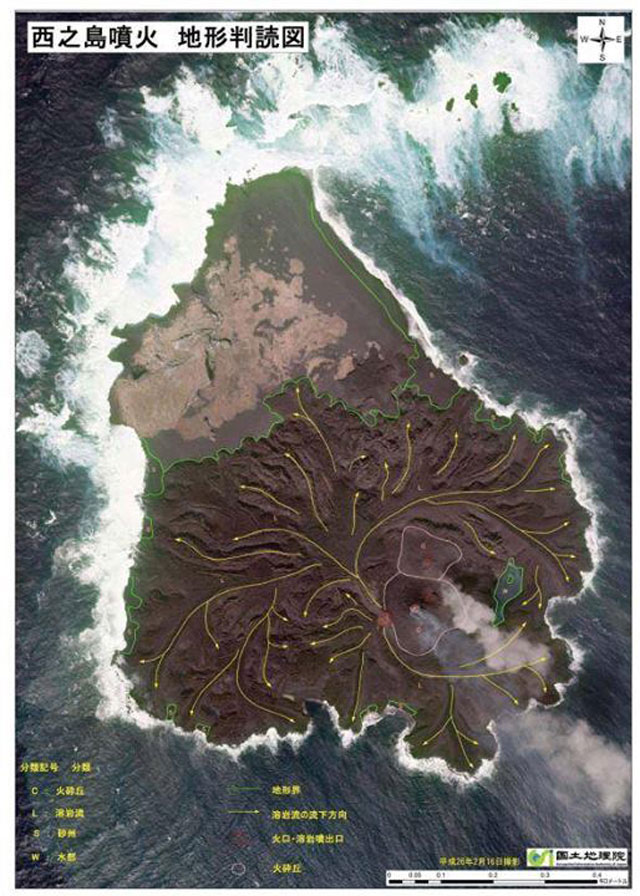 |
Figure 10. Direction of lava flow from the western side of two active vents is show by vectors superimposed on the image of the island. North is to the top of the photo. The flow arrows were drawn by JCG over an aerial photograph of the island taken 16 February 2014. Courtesy of JCG. |
In summary, the new addition to Nishinoshima grew ~500 m SSE of the island's S flank, beginning ~20 November 2013, from a depth of ~50 m to a height of ~65 m from an originating time no earlier than 1974, the time of the latest addition to the island. Based on continued emissions and satellite-based thermal alerts, it is apparent as of 13 March 2014 that Niijima was still expanding outward in all directions from the vents, and that Nishinoshima had grown to over three times its original size.
Further background. The new island was located in the Volcano Islands, a group of three Japanese active volcanic islands that lie atop the Izo-Bonin-Mariana arc system (Stern and Bloomer, 1992) that stretches S of Japan and N of the Marianas (figure 1).
According to the Geological Survey of Japan, Nishinoshima was an emerged submarine volcano in 1974 with a height of ~3,000 m from the surrounding ocean floor and ~30 km wide at its base.
For further details on earlier Nishinoshima activity refer to our earlier reports in predecessor publications, CSLP 93-73 (eight cards issued during 1973-1974), SEAN 04:07, and BVE 25. The latter (BVE 25) is a 1985 Smithsonian report called the Bulletin of Volcanic Eruptions noting that aerial observations on 2 December 1985 disclosed pale green water SW from the island.
The Geological Survey of Japan reported that Nishinoshima is of andesite to basaltic-andesite composition; Aoki and others (1983) classified the volcano's rocks as high-alkali tholeiite. Nishinoshima is surrounded on all sides by cones, vents, pillars, and parasitic seamounts, and its local bathymetry from surveys in 1911 and 1992 are shown in figure 11.
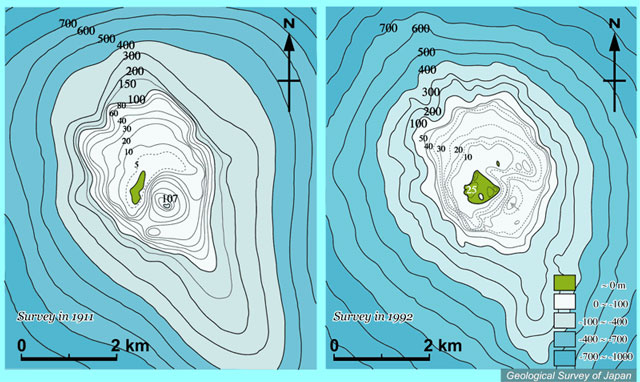 |
Figure 11. Comparison of bathymetric maps (depths in meters) around Nishinoshima before and after 1973 eruption. The emerged island is shown in green. Depths of 0-100 m are in white, 100-400 m in light blue, 400-700 m in medium blue, and 700-1,000 m in darker blue. The map on the right shows a survey conducted in 1992, after the eruption, based on 1:50,000 basic map of "Nishino-shima" by the Japan Coast Guard (1993). The map on the left shows a survey conducted prior to the eruption, based on mapping in 1911 (Ossaka, 1973). The new island of Niijima first appeared above the sea surface ~500 m SSE of the S coast of Nishinoshima island shown in the 1992 map. Courtesy of the Geological Survey of Japan (2013). |
From the 1992 bathymetric map seen at right on figure 11, it is apparent that the ocean depth from which Niijima erupted in 2013, was ~50 m. A sketch of the setting showing a cross sectional view (roughly NNW-SSE) appears in figure 12.
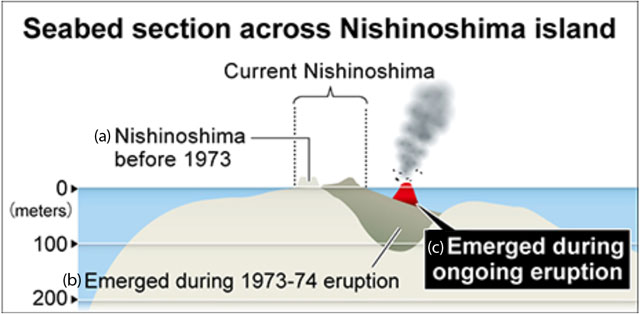 |
Figure 12. A sketch depicting an approximately NNW (to the left) to SSE (to the right) cross-section across Nishinoshima (blue indicates sea water) portraying some historical stages of growth. The label "Current Nishinoshima" refers to the pre-existing island prior to and in the early stages of the 2013 eruption. Other labels indicate (a) "Nishinoshima before 1973" (also see 1911 bathymetric map in figure 11), (b) flanking material added to Nishinoshima as it "Emerged during the 1973-74 eruption" (also see 1992 bathymetric map in figure 11), and (c) Niijima "Emerging during ongoing eruption" (red area emerging from the sea early in the 2013 eruption). Original drawing courtesy of The Asahi Shimbun (2013). |
References. Aoki, H., and Tokai University Research Group for Marine Volcano, 1983, Petrochemistry of the Nishinoshima Islands, La mer, v. 22, pp. 248-256.
Earth of Fire: Actualité volcanique, Article de fond sur étude de volcan, tectonique, récits et photos de voyage [Volcano News, Feature Article on study of volcanos, tectonics, travel stories and photos], 2013, Evolution of Nishino-shima's eruption, Earth-of-Fire web site (URL: http://www.earth-of-fire.com/page-8837676.html).
Frisk, A., 2013 (21 November), WATCH: Incredible video, photos show new island forming off Japan after volcanic eruption, Global News (URL: http://globalnews.ca/news/981245/watch-incredible-video-photos-show-new-island-forming-off-japan-after-volcanic-eruption/ ).
Geological Survey of Japan, 2013, Nishinoshima (URL: https://gbank.gsj.jp/volcano/Quat_Vol/volcano_data/G22.html).
Japan Coast Guard, 1993, 1:50,000 basic map of "Nishino-shima."
Kodaira, S., Sato, T., Takahashi, N., Miura, S., Tamura, Y., Tatsumi, Y., and Kaneda, Y., 2007, New seismological constraints on growth of continental crust in the Izu-Bonin intra-oceanic arc, Geology, v. 35, no. 11, pp. 1031-1034 (doi: 10.1130/G23901A.1).
Kurtenbach, E., 2013 (21 November), Volcano raises new island far south of Japan, AP (Associated Press) (URL: http://news.yahoo.com/volcano-raises-island-far-south-japan-054228644.html).
Ossaka, J., 1973, On the submarine eruption of Nishinoshima, Bulletin of the Volcanological Society of Japan, v. 18, no. 2, p. 97-98, 173-174.
Pfeiffer, T., 2014 (21 February), Nishinoshima volcano (Izu Islands, Japan): island has doubled in elevation, Volcano Discovery web site (URL: http://www.volcanodiscovery.com/nishino-shima/news/42781/Nishino-Shima-volcano-Izu-Islands-Japan-island-has-doubled-in-elevation.html).
Shun, N., 2014, Kaitei chikei (bottom topography), Nishinoshima Kazan (in Japanese), Geological Survey of Japan web site (URL: https://gbank.gsj.jp/volcano/Act_Vol/nishinoshima/page3.html).
The Asahi Shimbun, 2013 (22 November), Japan counts on survival of new island to expand territorial waters (URL: https://ajw.asahi.com/article/behind_news/social_affairs/AJ201311220084).
Information Contacts: Japan Coast Guard (JCG) (URL: http://www.kaiho.mlit.go.jp/); MODVOLC, Hawai'i Institute of Geophysics and Planetology (HIGP), MODVOLC Thermal Alerts System, School of Ocean and Earth Science and Technology (SOEST), Univ. of Hawai'i, 2525 Correa Road, Honolulu, HI 96822, USA (URL: http://modis.higp.hawaii.edu/); NASA Earth Observatory (URL: http://earthobservatory.nasa.gov); ANN (All Nippon News Network) (URL: https://www.youtube.com/user/ANNnewsCH); VolcanoCafe web site (URL: http://volcanocafe.wordpress.com); Earth of Fire web site (URL: http://www.earth-of-fire.com/); Demis web site (URL: http://www.demis.nl/home/pages/Gallery/examples.htm.).
New eruption covers and enlarges 1973 island with lava flows and Strombolian eruptions
Nishinoshima volcano continued its dramatic above-sea-level growth with lava flows, Strombolian eruptions, discolored water, and ash plumes in 2014. The Hydrographic and Oceanographic Department of the Japan Coast Guard (JCG) and the Japan Maritime Self Defense Force (JMSDF) provided monthly photographic and video documentation and measurements of the growth of the island, which is located approximately 940 km S of Tokyo along the Izu-Bonin trench. The Japan Meteorological Agency (JMA) has also provided monthly reports of the eruption.
New subaerial activity began on 20 November 2013, almost 40 years after the last recorded island-building event in 1973-74. During the interval between these eruptions, a number of submarine events are suspected based on discolored water and volcanic debris reported, but no lava had breached the ocean surface. The emergence of the volcanic center and its merging with the adjacent island between November 2013 and February 2014 were described in a previous Bulletin (BGVN 38:11).
After lava flows from the new vent flowed north and reached the older island in late December 2013, the lava flows continued in all directions away from the central crater (Crater 1) and a second smaller crater (Crater 2) that formed adjacent to crater 1. By early January 2014 many active lava flows from the two craters were simultaneously entering the ocean (figure 13).
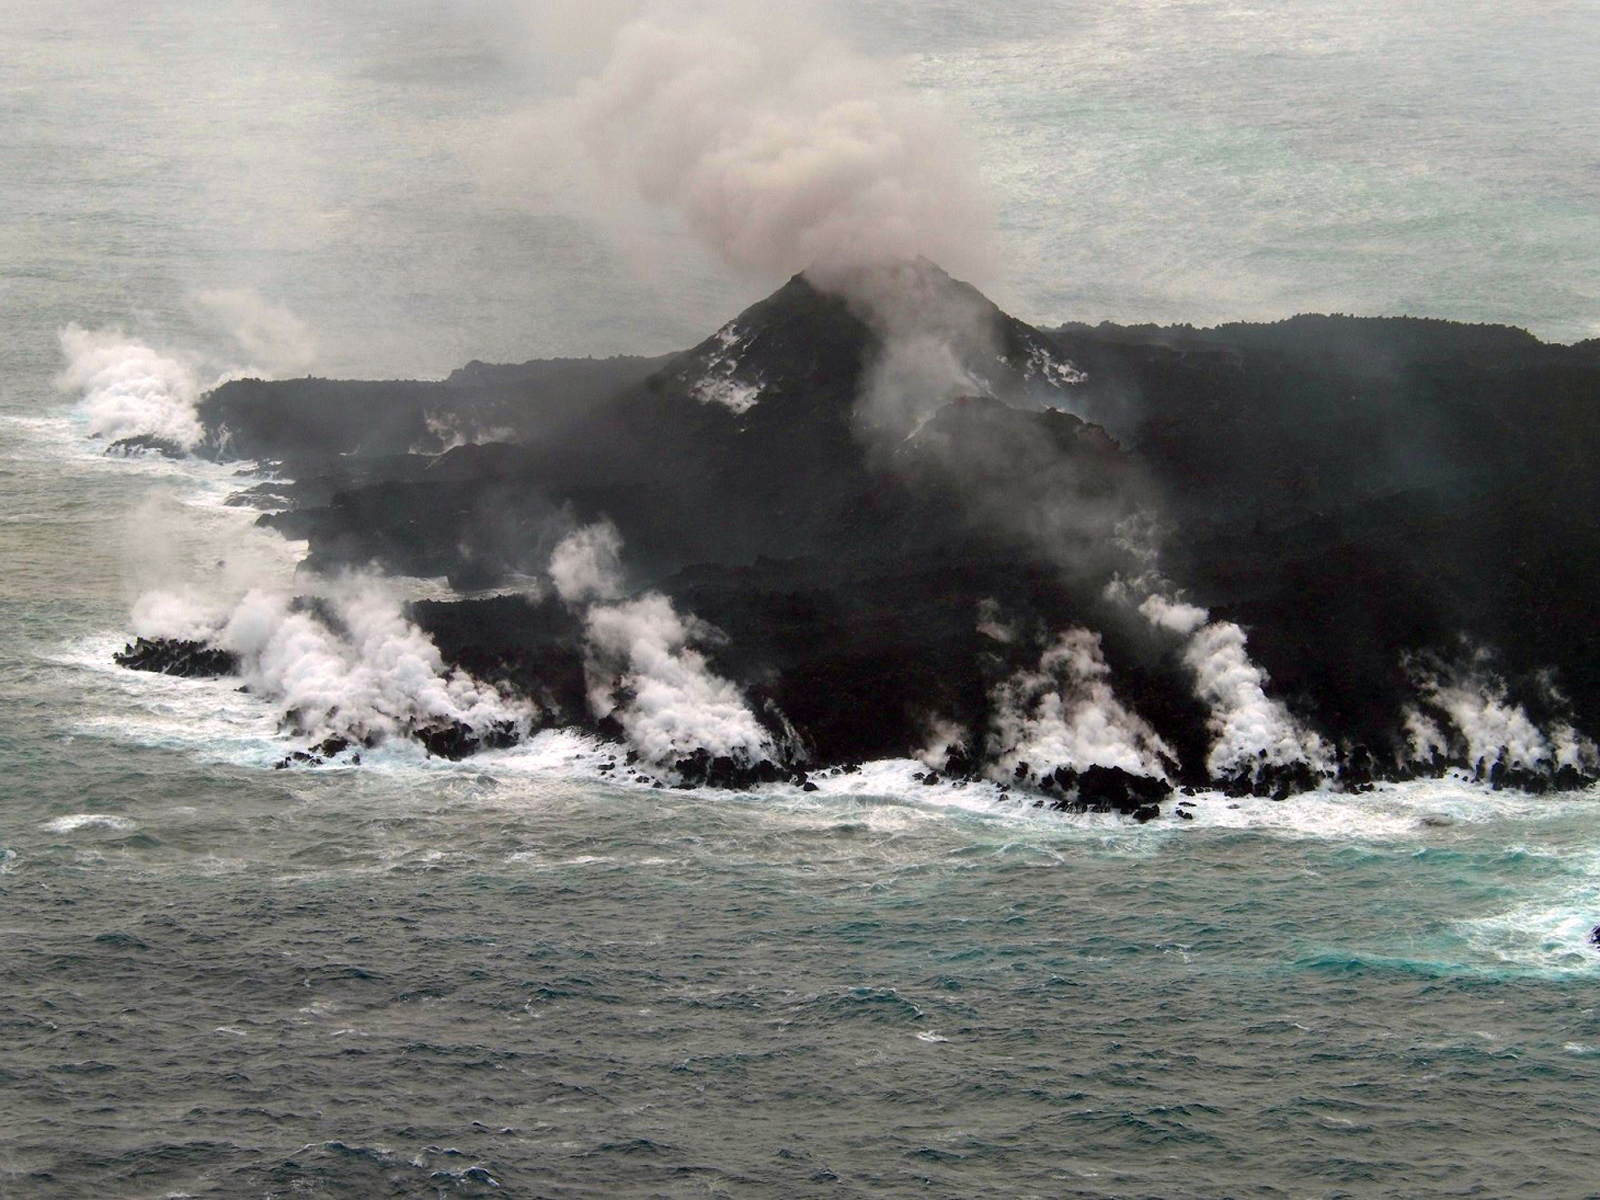 |
Figure 13. At least seven steam plumes at Nishinoshima indicating lava reaching the ocean are visible in this 16 January 2014 photograph. Plumes of steam and ash are also visible coming from the two central craters. Courtesy of JMSDF. |
Based on satellite analysis, Tokyo VAAC reported ash plumes on 21 and 26 January 2014. The 21 January plume rose to 900 m and drifted E. The 26 January plume rose to 1,200 m and drifted NE. Crater 2, a short distance north of Crater 1, first opened on 24 December 2013 and was actively emitting steam by the end of January 2014 (figure 14). Incandescent material was observed by JMSDF inside Crater 2 on 29 January; light grayish-white plumes intermittently rose to 800 m at intervals of approximately one minute, and ejecta were scattered several tens of meters into the air above the crater. Bluish-white plumes also continuously rose to approximately 500 m above Crater 1.
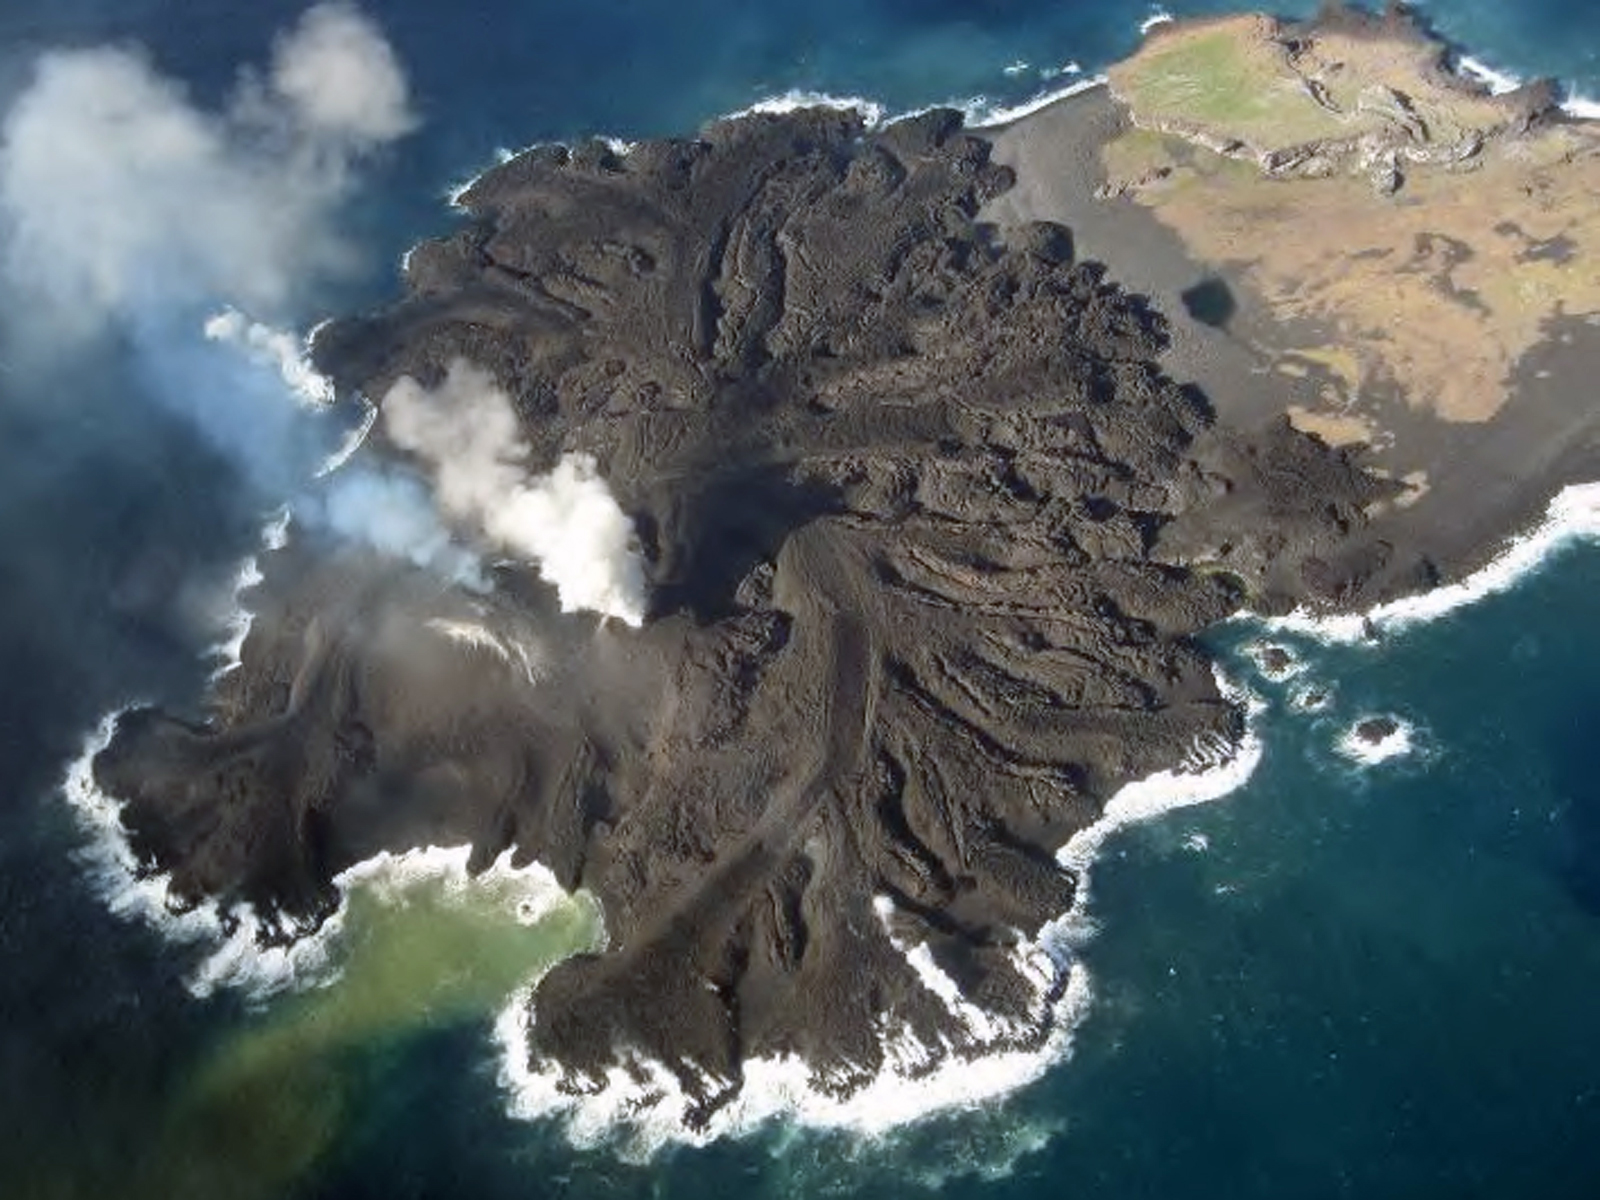 |
Figure 14. Two active craters on the new volcanic edifice at Nishinoshima are visible in this 29 January 2014 photograph. Note the bluish-white plumes rising from the southern crater (Crater 1) and the white steam plumes issuing from the northern crater (Crater 2). A yellow-orange plume drifts easterly in the water at the base of the active vents. Courtesy of JMSDF and the JMA. |
Plumes rose as high as 1,500 m in February 2014 according to JCG. By 11 February, the Japan Coast Guard reported the new land area from lava flows was 920 m E-W and 750 m N-S. Incandescence was photographed at Crater 2 along with a rapidly changing landscape from the active lava flows (figure 15). In just three weeks, the lagoon on the eastern side of the island went from open (figure 14), to closed off by lava flows and volcanic debris (figure 16).
 |
Figure 15. Crater 2 (left) at Nishinoshima issues gray and white plumes on 11 February 2014 from an incandescent center, while cooling flows around the cone of Crater 1 (right) emit steam, along with a smaller brown ash plume. Note the lagoon (upper right) has been almost closed off from lava flows since 29 January (figure 14). Courtesy of JCG. |
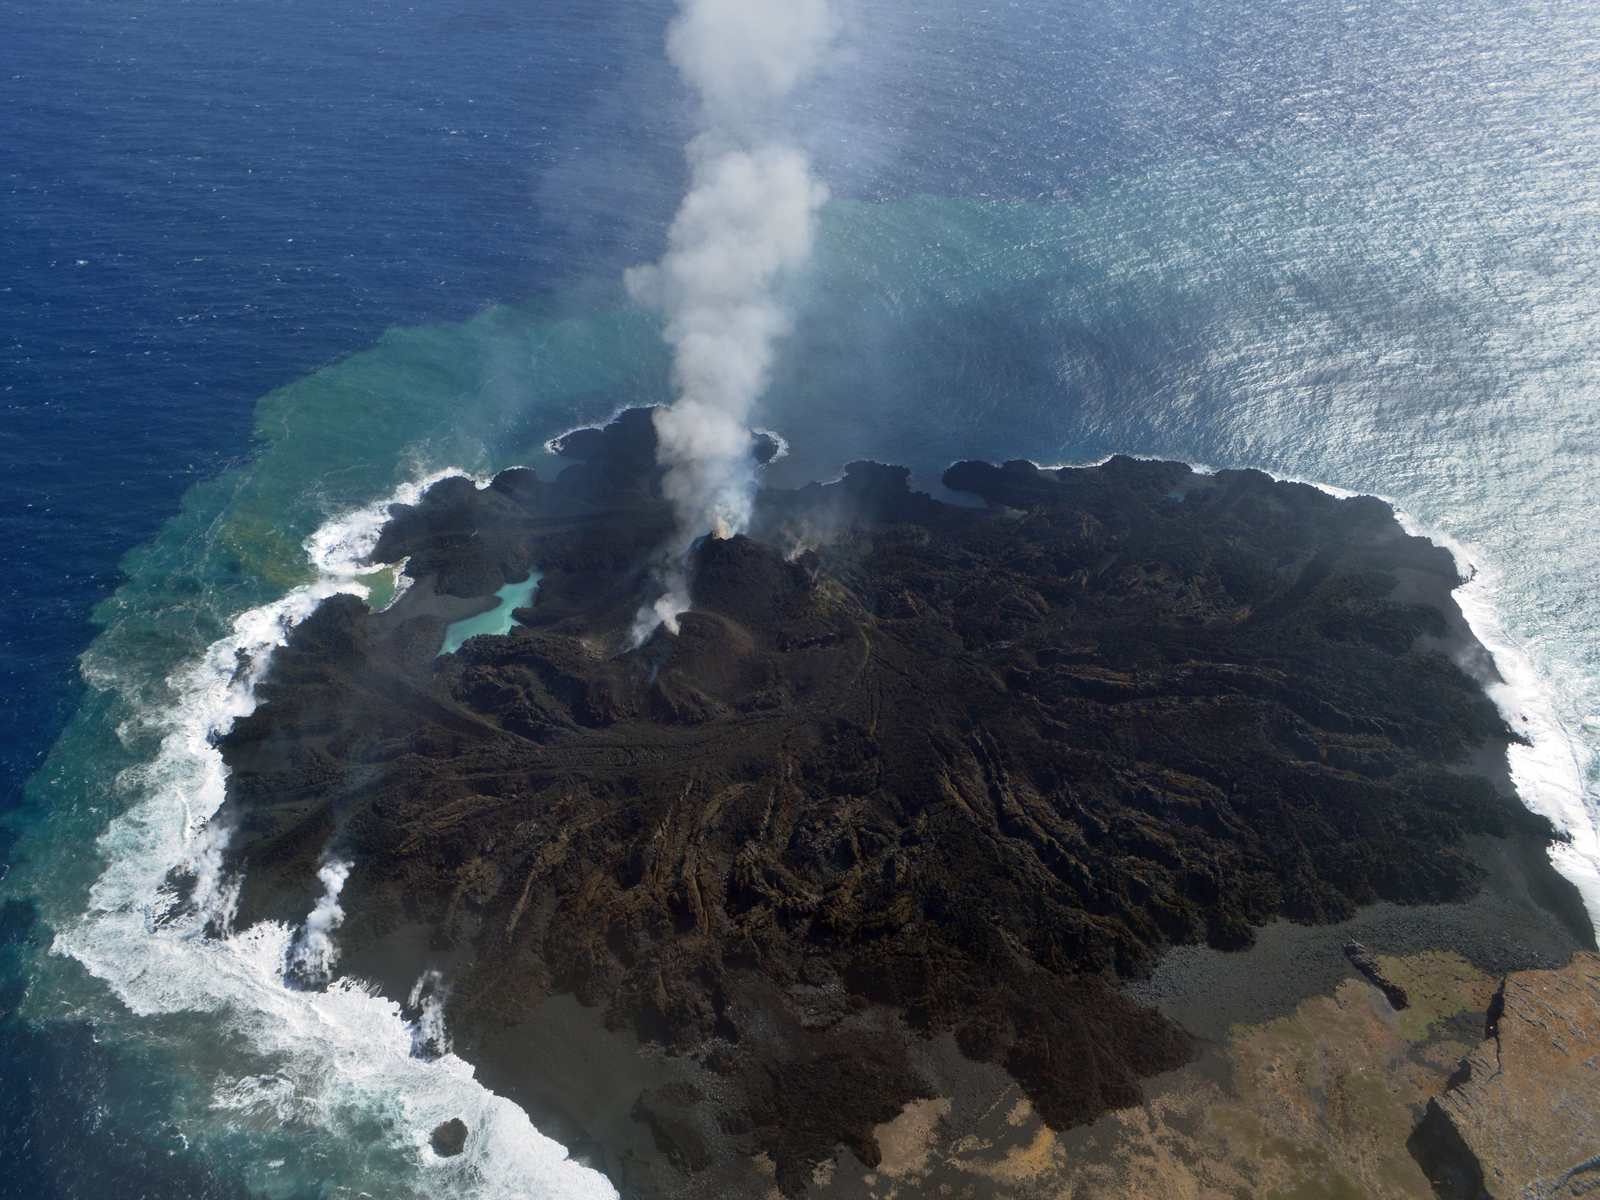 |
Figure 16. Photograph of Nishinoshima on 21 February 2014 showing that the lagoon at the base of the cones is completely cut off by lava flows, and active plumes rising from both craters. Courtesy of JCG. |
Based on satellite images, Tokyo VAAC reported a plume on 18 April 2015 rising to just over 2,100 m and drifting E. On 15 April, the land area was reported by JCG as 1,190 x 1,000 m, with an elevation of 72 m at the highest point. A new cone (Crater 3) that emerged in between the first two was first observed on 21 May 2015 with incandescent spatter reaching tens of meters into the air (figure 17).
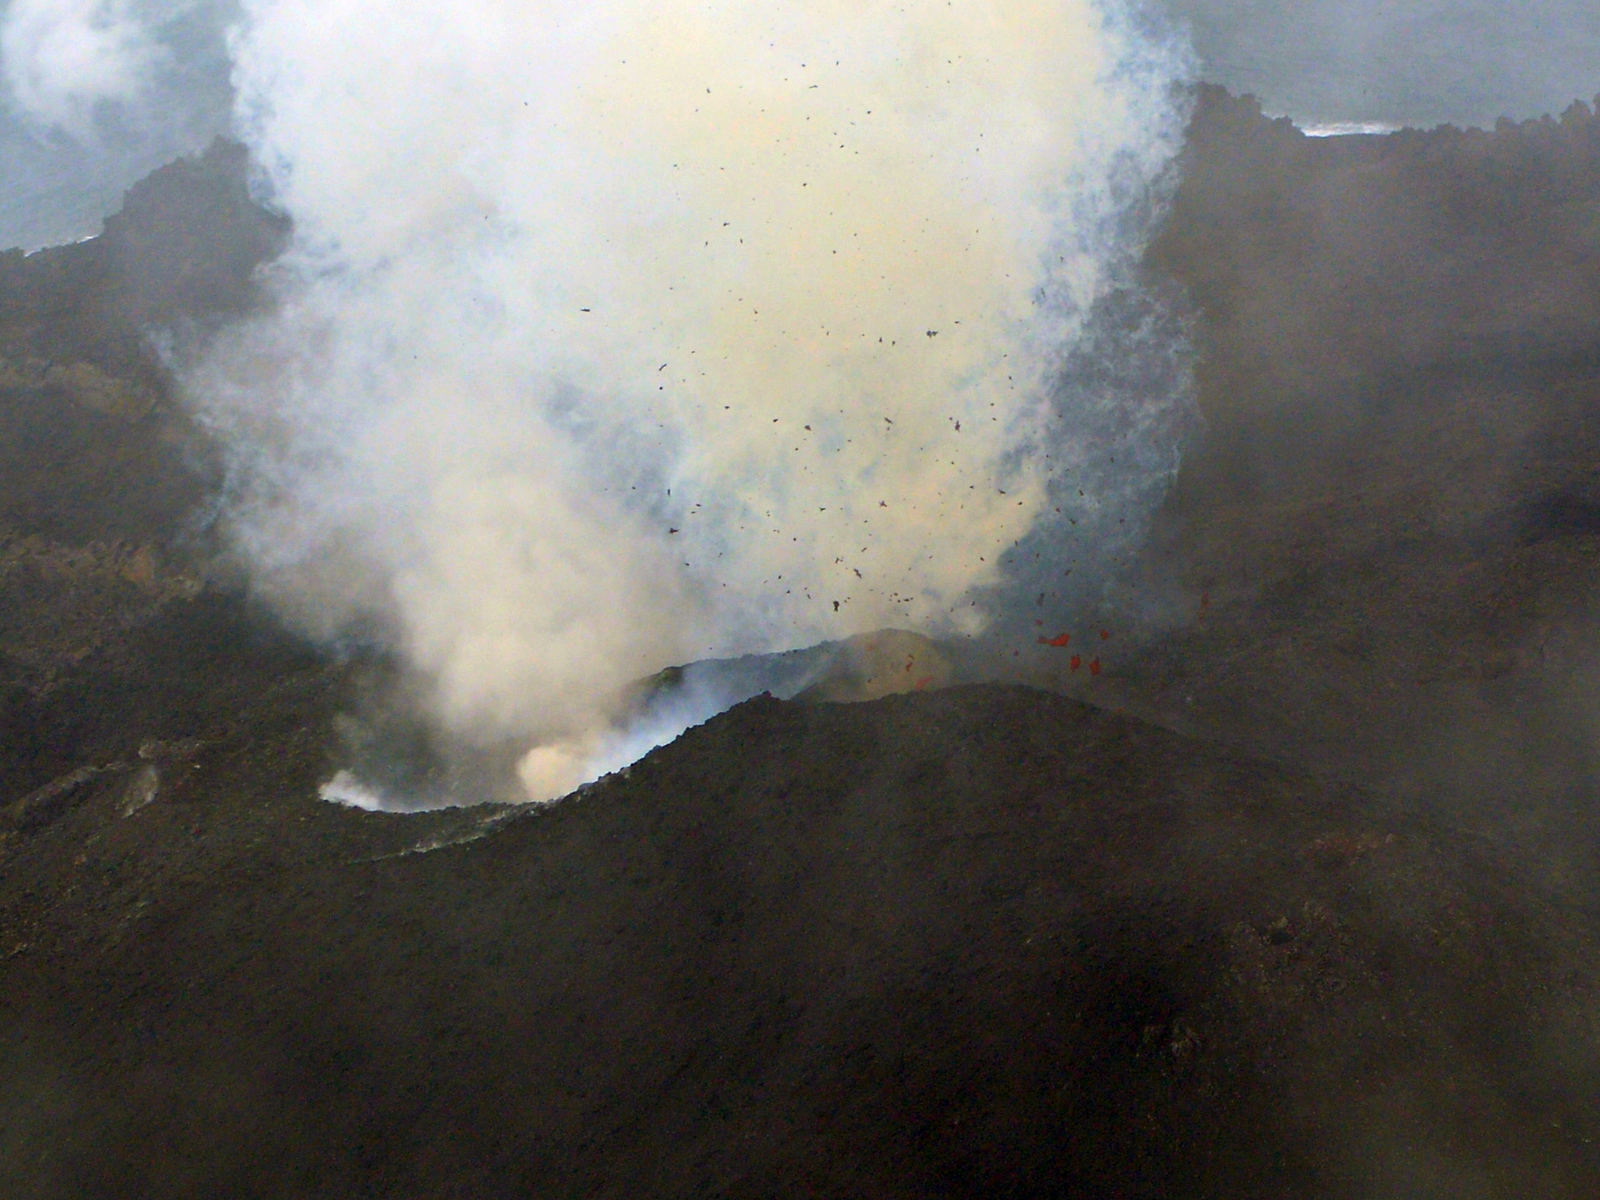 |
Figure 17. Incandescent spatter from the newly formed Crater 3 at Nishinoshima on 21 May 2014, located between craters 1 and 2. Courtesy of JCG. |
New land area was rapidly forming from lava flows from three active craters and sedimentation of pyroclastic materials around the island in May and June, especially eastward (figure 18).
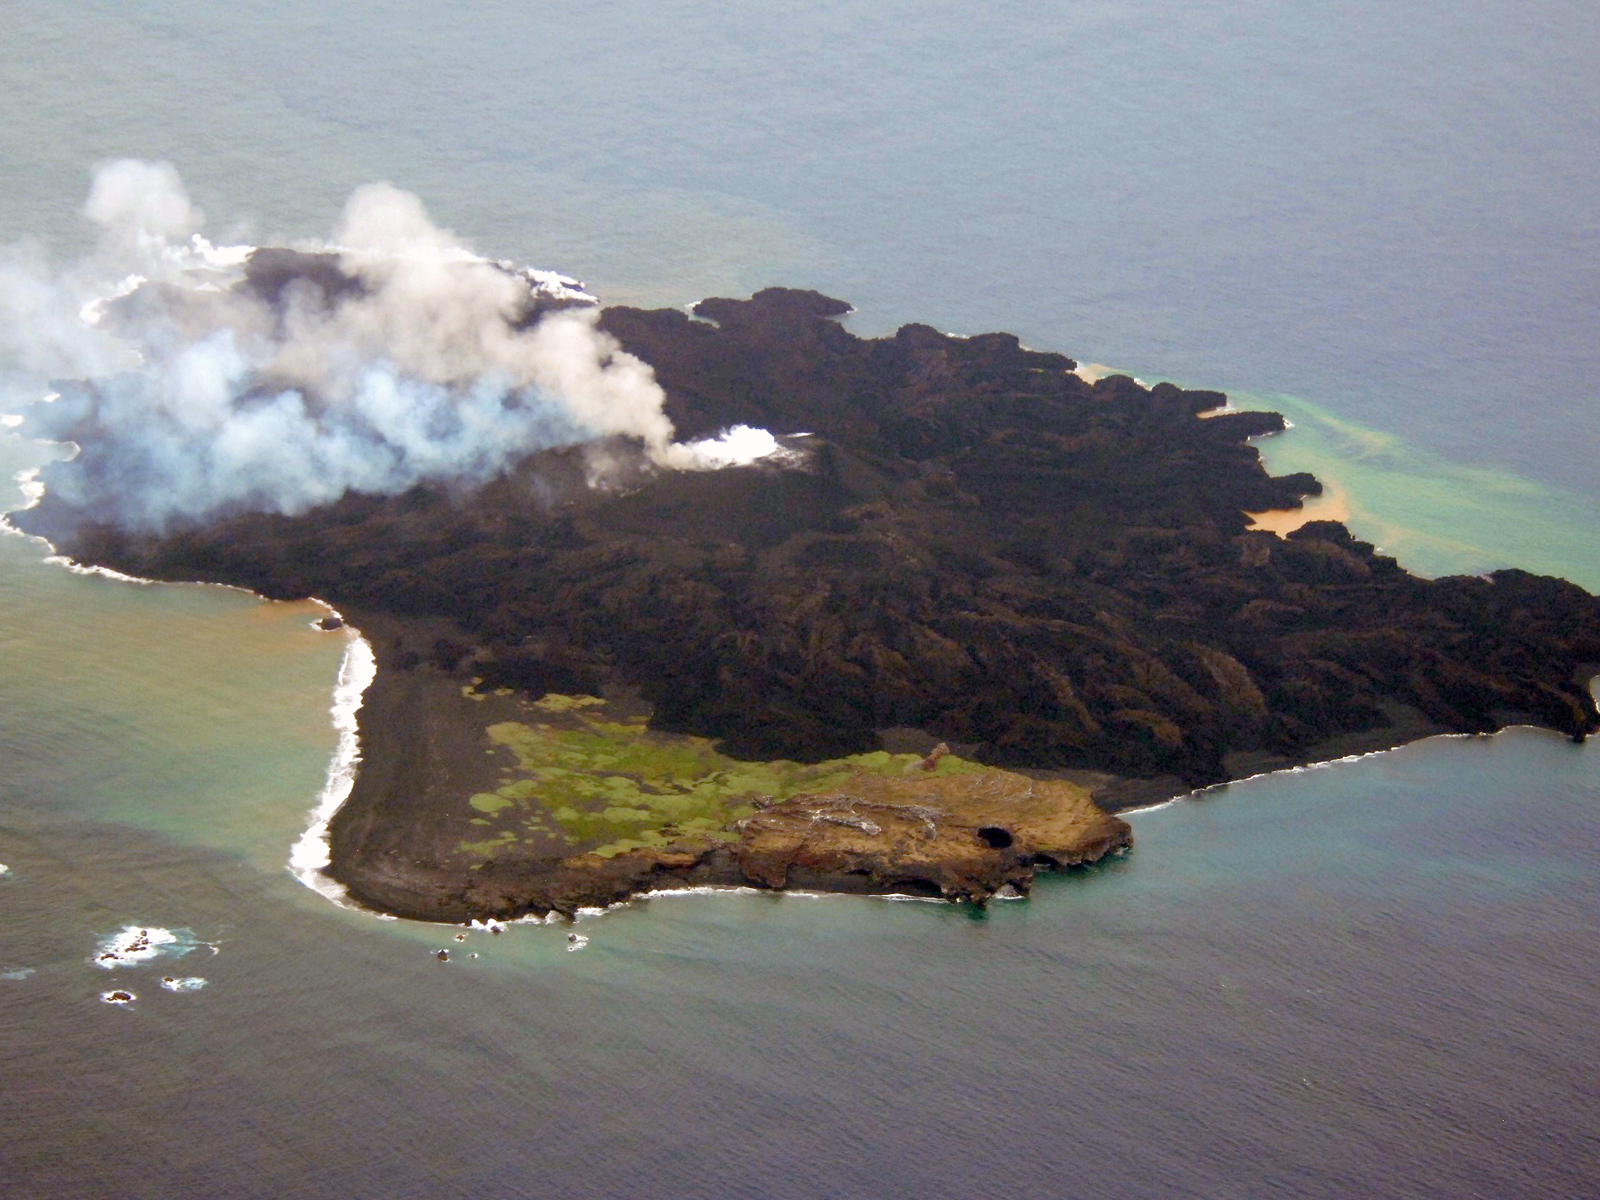 |
Figure 18. The extensive growth of Nishinoshima island is apparent in this 11 June 2014 photo. Note extensive lava flows to the east (upper left). View looking south. All three craters in the center are active. Courtesy of JMSDF. |
On 13 June 2014 a fourth crater was seen emitting brown ash plumes (figures 19, 20). The Japan Meteorological Agency (JMA) increased warning levels to a 6 mile radius around the island in case of submarine eruptions on 11 June.
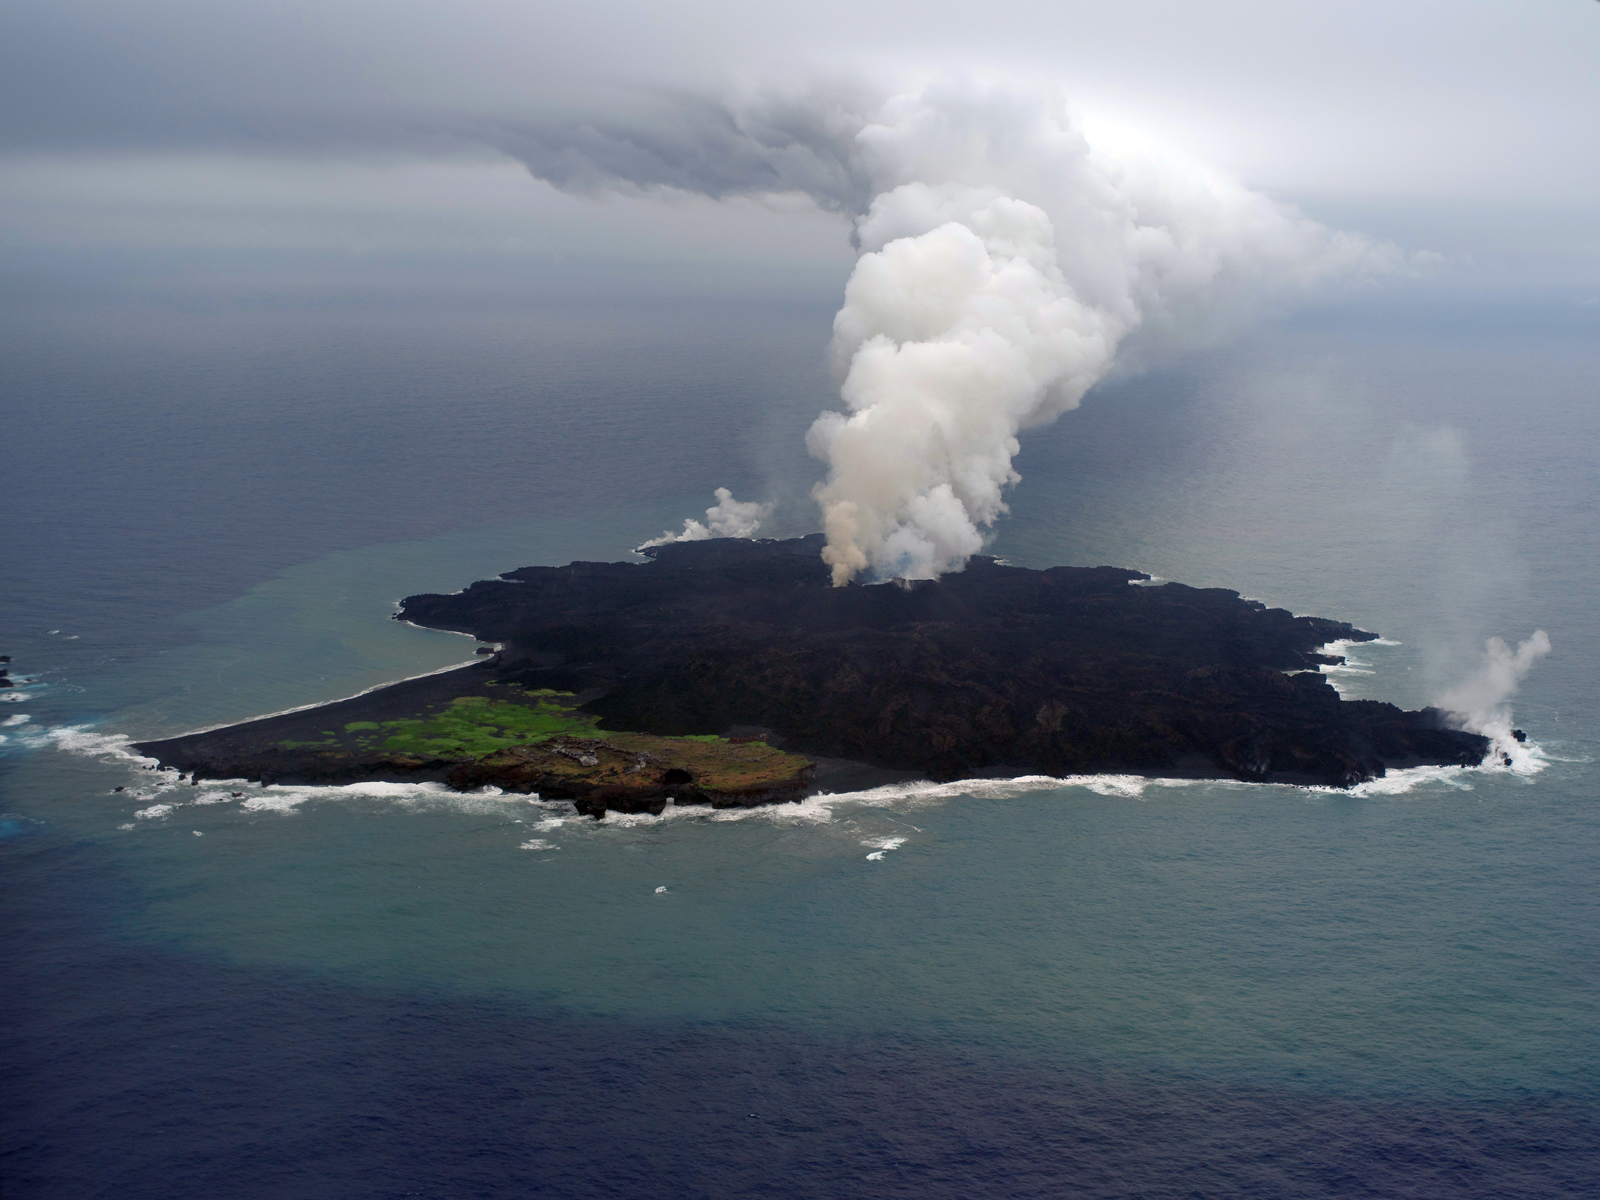 |
Figure 19. New Crater 4 at Nishinoshima emitted a small brown ash plume on 13 June 2014. Much larger steam plumes are rising from the older craters. Steam is also visible in at least two places from multiple lava ocean entry sites. Courtesy of JCG. |
 |
Figure 20. Closeup of Crater 4 (left) at Nishinoshima emitting a brown ash plume, and craters 2 and 3 (right) emitting steam and ash plumes on 13 June 2014. Courtesy JCG. |
Tokyo VAAC reported an ash plume rising to 3,000 m and drifting NW on 30 June 2014. JCG observed another new crater (Crater 5) on the east side of the island generating a continuous steam-and-ash plume on 23 July 2014 (figures 21, 22).
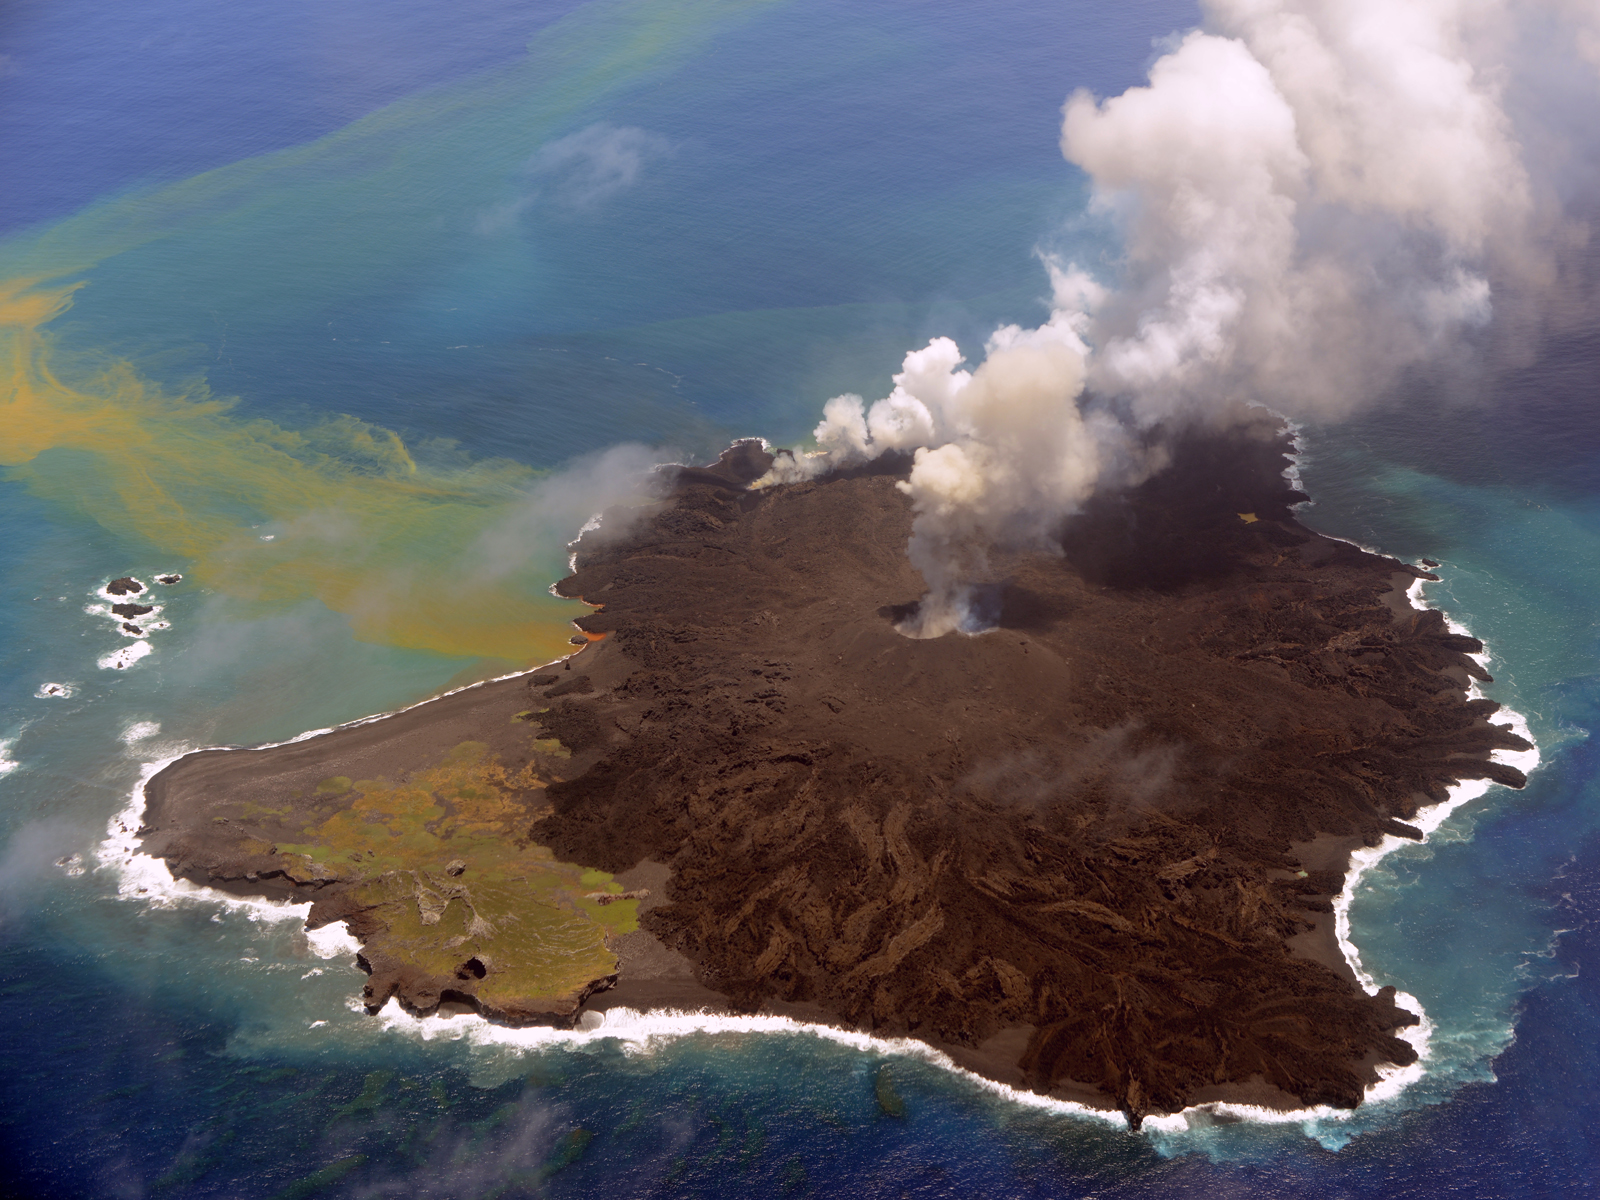 |
Figure 21. A new crater (crater 5) on Nishinoshima emits ash and steam on 23 July 2014 on the far E side of the island. The large central crater area (craters 1-3) remained incandescent, and emitted continuous ash plumes. Note the large orange plume of volcanic material in the ocean drifting east and south away from the island. Courtesy of JCG. |
 |
Figure 22. A close up view of Nishinoshima on 23 July 2014 showing Crater 5 emitting ash and steam. Courtesy of JCG. |
Crater 6 was first observed to the E of the main crater complex on 26 August 2014 (figure 23). Lava flowing from the central crater complex had enlarged Crater 2 and created an oval lava mound with dimensions of 90 x 60 m. The overall dimensions of newly formed land were around 1,550 m E-W and 1,250 m N-S, and the highest elevation was 87 m.
 |
Figure 23. Crater 6 is visible in the distance in this view of Nishinoshima on 26 August 2014, behind the main crater complex. Lava flows have covered over much of the original land to the north (towards the left). Note the large ocean plume of yellow volcanic debris drifting E and S from the island, and smaller yellow and green plume drifting south from the west side. Courtesy of JCG. |
Tokyo VAAC reported an ash plume that rose to 3,000 m and drifted S on 16 September. Aerial observation conducted by JCG on 17 September 2014 found that most of the lava mound identified on 26 August had become buried in a new pyroclastic cone that had formed to the north of it. A new row of three craters (vent 7) was found to the north of this new cone. Lava was flowing northward from the new row of craters and covering much of the original island (figures 24, 25), and discolored water in hues from brown to light brown was observed around the island. The change in the amount of lava since 26 August is easily recognized (compare figures 23 and 25). Most of the old part of the island was covered by 17 September 2014.
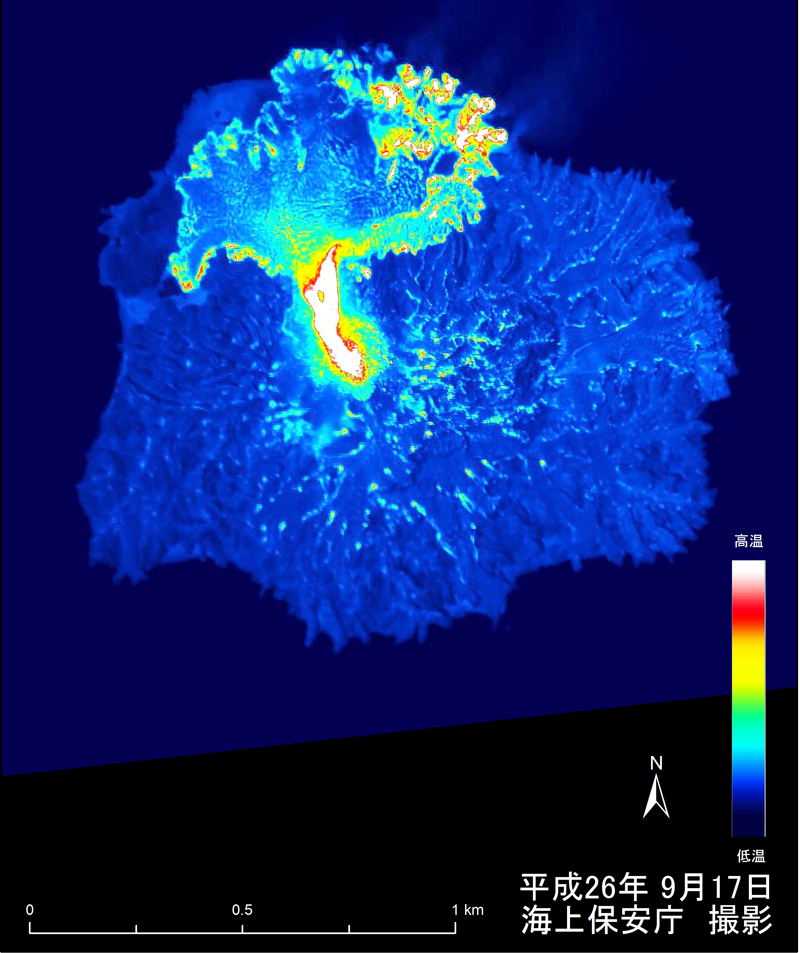 |
Figure 24. A thermal image taken of Nishinoshima on 17 September 2014 reveals the extent of new lava flowing northward from Crater 7, covering the older part of the island. Courtesy of JCG. |
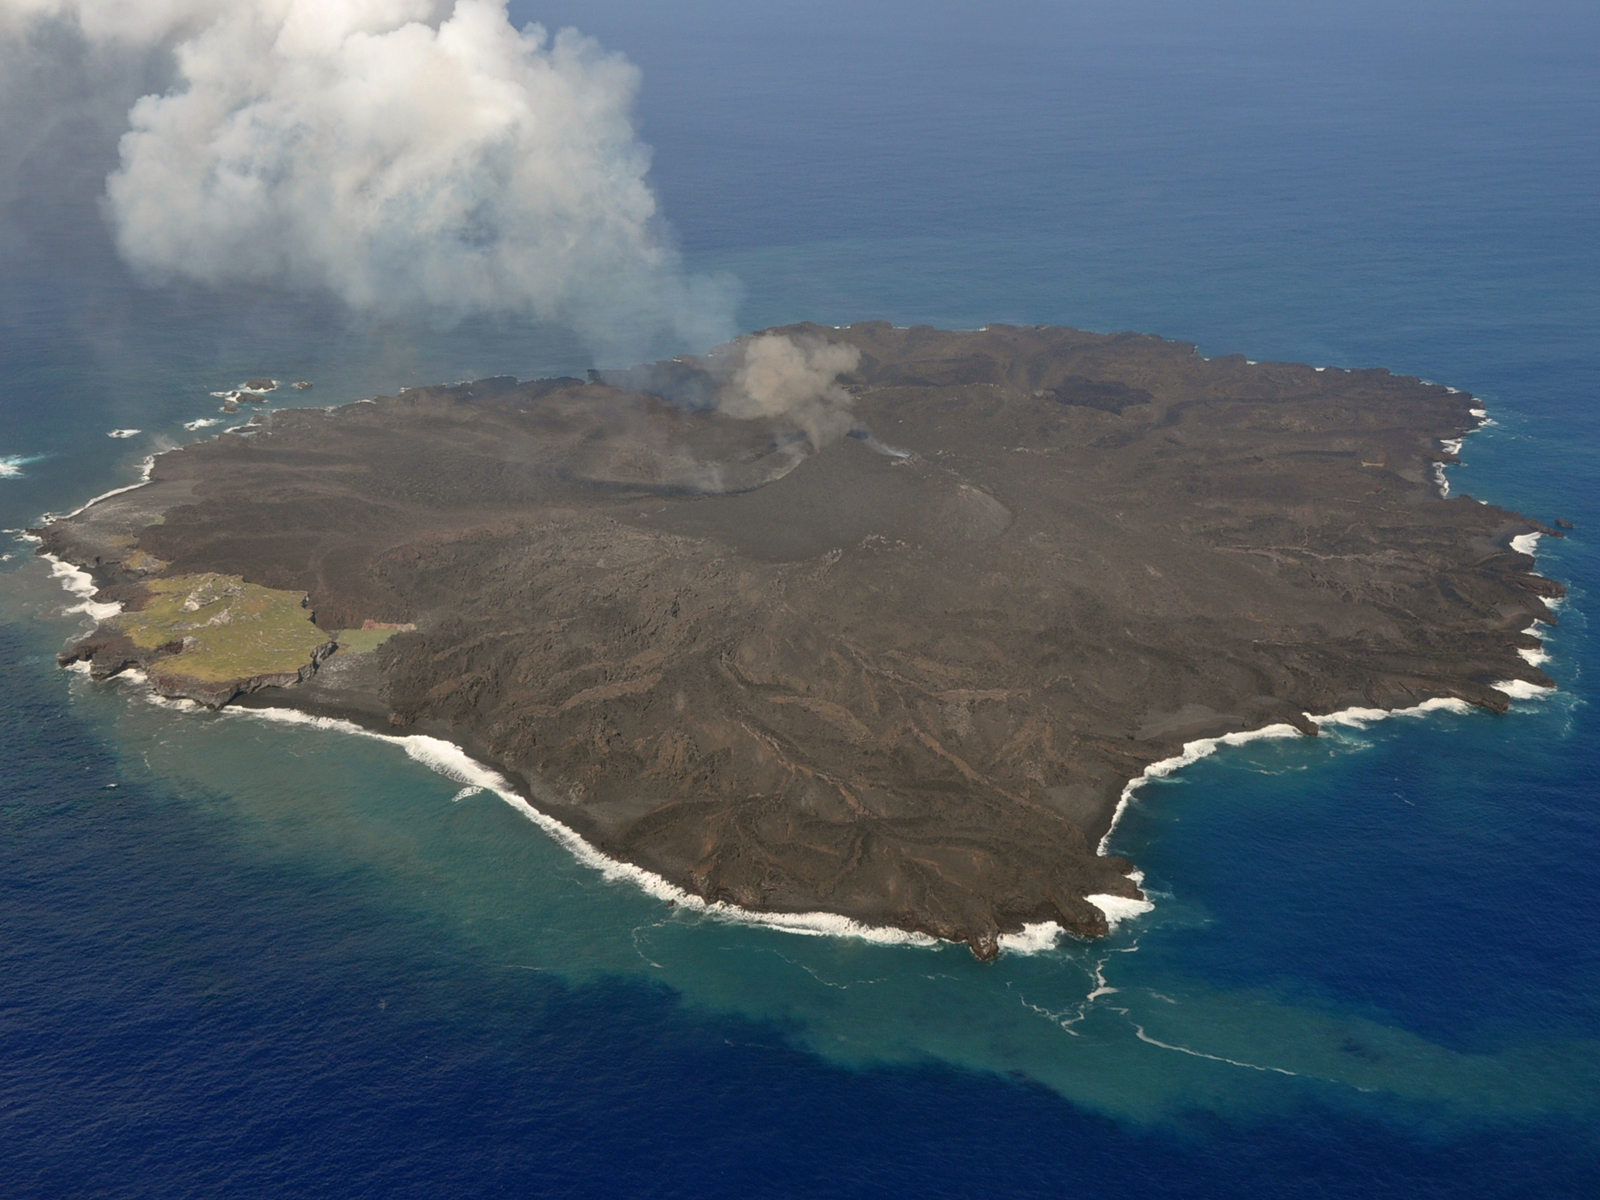 |
Figure 25. Photograph of Nishinoshima on 17 September 2014 which reveals the extent of new lava formed since 26 August image (figure 23). The flows are coming from a string of three vents inside Crater 7, located in the region of the original crater. Courtesy of JCG. |
A detailed series of sketches provided by the Japan Coast Guard shows the growth of the island from 21 November 2013 through 17 September 2014, highlighting the different cones, craters, and lava flows throughout this time (figure 26). Photographs of many of these stages are shown in the previous images.
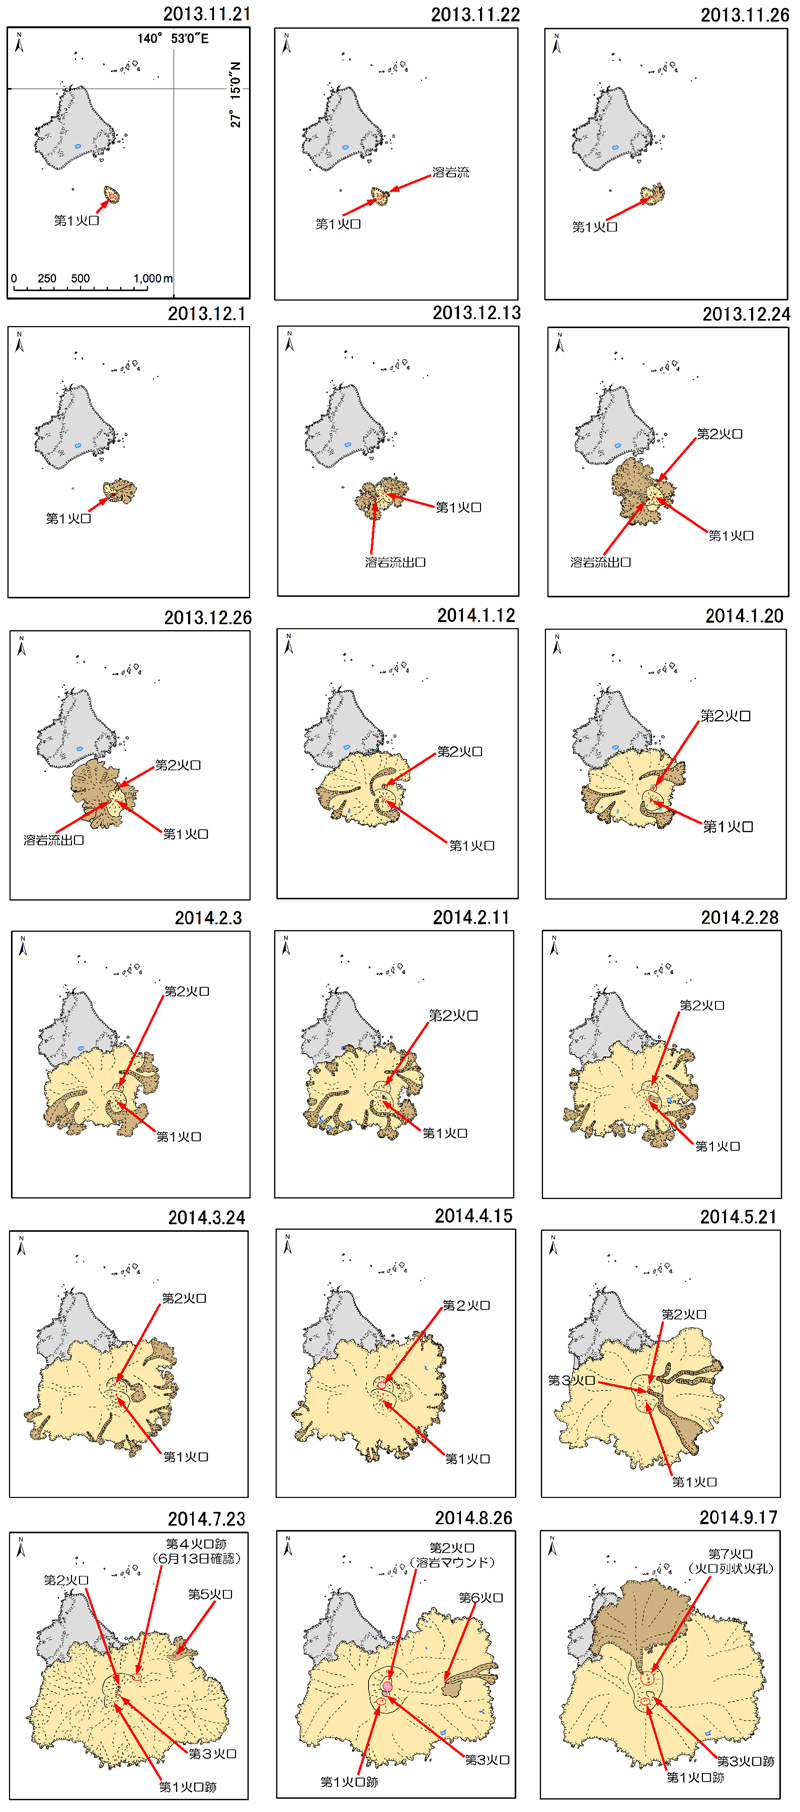 |
Figure 26. A series of sketches highlighting the growth of Nishinoshima from 21 November 2013 to 17 September 2014. Lava flows are shown in pale yellow and brown. The original pre-eruption island is shown in gray. The images chronical the growth of seven different craters that contributed lava flows and pyroclastic debris to the growing island, and are shown in red. Numbered red arrows identify each crater. Courtesy of JCG. |
By the middle of October a large new area of lava flows had extended to the north and east well beyond the older part of the island, and lava flows were entering the sea over the entire northeastern quadrant of the island at many locations (figure 27). Strombolian eruptions with ejecta and ash plumes were observed coming from Crater 7 on the pyroclastic cone at the center of the island by JCG on 16 October 2014. The height of the cone was measured at 96 m above sea level.
 |
Figure 27. The large area of new lava flows on northeastern side of Nishinoshima on 16 October 2014 are visible in the foreground of this photograph. Note the numerous steam plumes where lava flows are entering the sea. The remnant of the old island is visible as the light brown area on the right side of image. Strombolian eruptions with ash plumes and ejecta are coming from the crater at the center of the pyroclastic cone. Courtesy of JCG. |
Aerial observations by the National Institute of Advanced Industrial Science and Technology (AIST) on 14 November 2014 found a pyroclastic cone with a single clear conical crater at the summit (Crater 7). At the crater, Strombolian eruptions were observed which produced a grayish-brown plume containing volcanic ash and ejecta. Lava was observed flowing northward from the crater and then splitting into two directions that covered both the NW and NE coasts; white-vapor spouts formed where it entered the ocean.
Data from infrasound monitoring on Chichijima Island (134 km E) facilitated by the University of Tokyo's Earthquake Research Institute (ERI) showed an air shock starting on 13 November 2014, indicating high volcanic activity at Nishinoshima along with a series of eruptions. According to Ogasawara Village Office, rumbling was heard on the island and a shock wave was also reported. Very strong thermal anomalies were seen in MODIS data using MODVOLC throughout 2014.
Aerial observation conducted by JCG on 25 December revealed periodic eruptions at Crater 7, which was producing gray plumes and emitting ejecta; lava was flowing to the NW and NE to the ocean. The extent of the island was about 1,710 m E-W and 1,830 m N-S, creating an area of around 2.29 km2 (figure 28). Plumes were also seen in aerial observation conducted by JCG on 31 December, and the last remnant of the 1973 island was barely discernable north of the pyroclastic cone (figure 29).
 |
Figure 28. View of Nishinoshima on 25 December 2014 looking SW at the central pyroclastic cone with steam plume coming from Crater 7. Note the extent of lava flows to the NE (lower left). The only remnant of the old northern part of the island is the lighter brown area in the center foreground in front of the pyroclastic cone. Courtesy of JCG. |
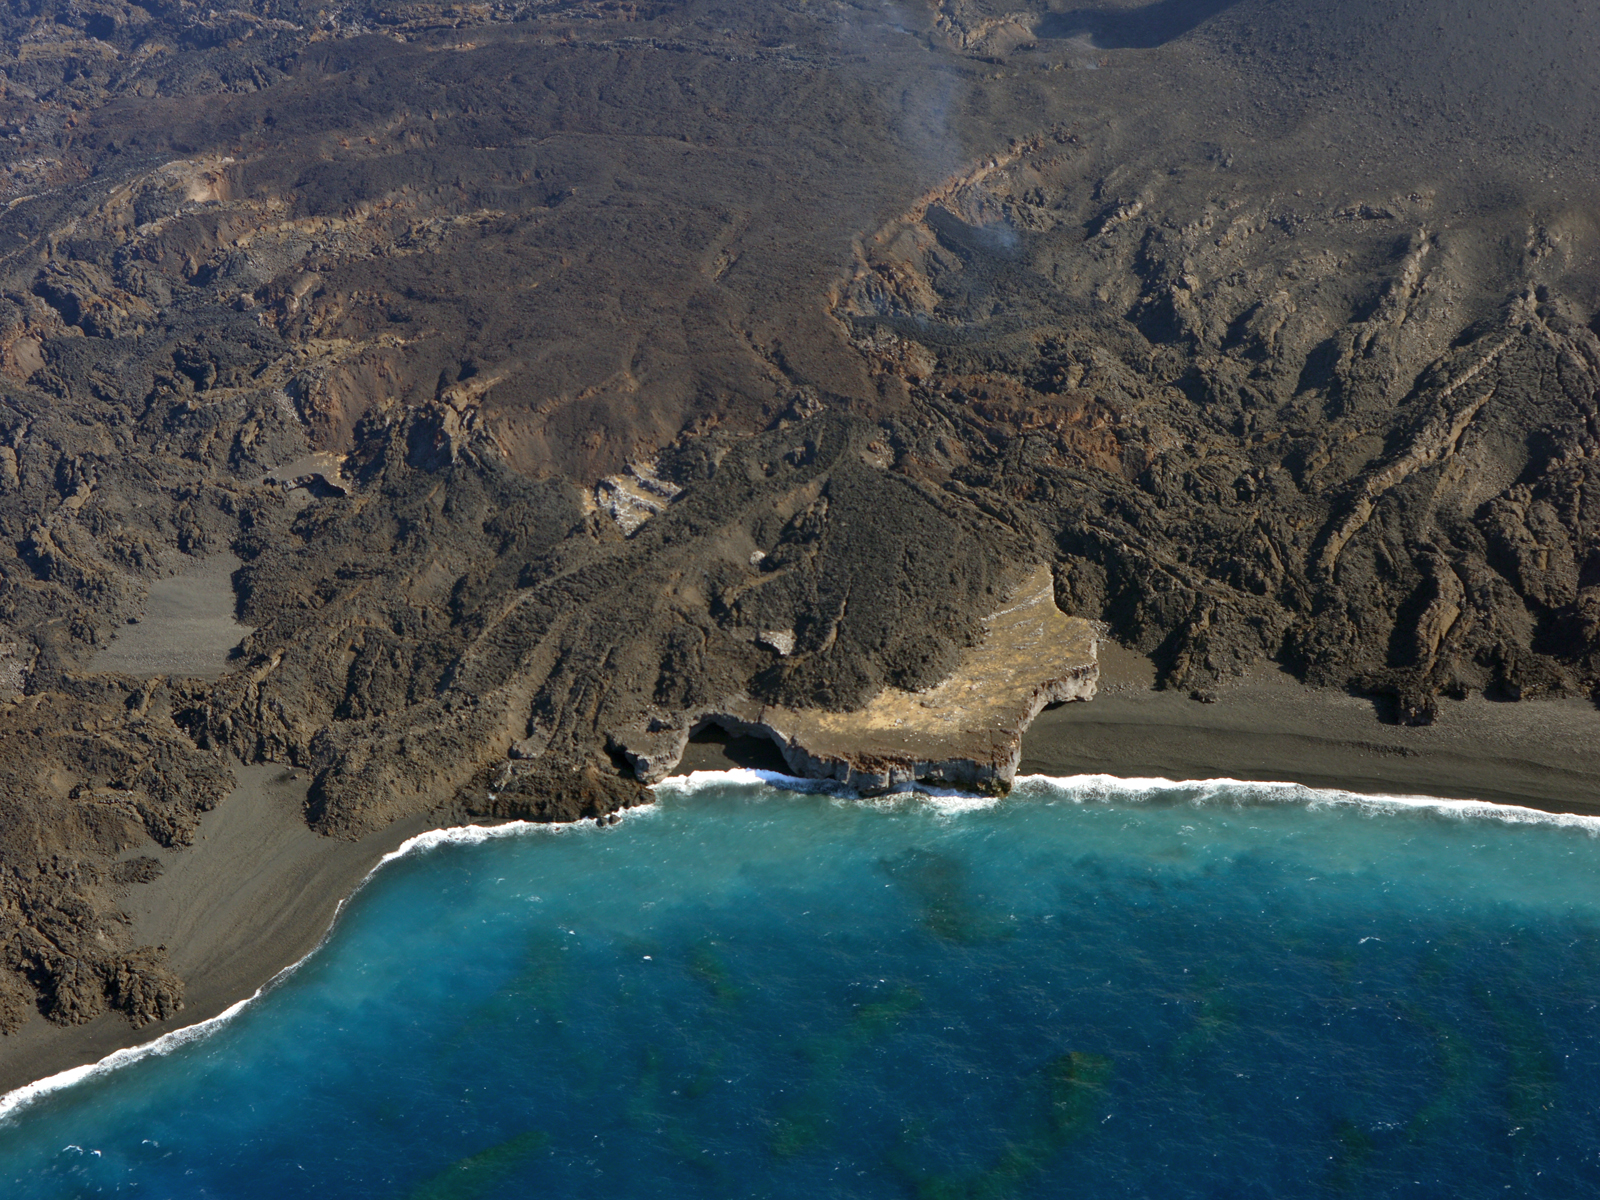 |
Figure 29. Closeup of Nishinoshima on 25 December 2014 showing the remaining fragment of the 1973 island surrounded by new lava flows and volcanic sand beaches. Courtesy of JCG. |
Information Contacts: Japan Coast Guard (JCG), Policy Evaluation and Public Relations Office, 100-8918, 2-1-3 Kasumigaseki, Chiyoda-ku, Tokyo, Telephone, 03-3591-6361 (URL: http://www.kaiho.mlit.go.jp/e/index_e.htm); JCG Nishinoshima Data Site: http://www1.kaiho.mlit.go.jp/GIJUTSUKOKUSAI/kaiikiDB/kaiyo18-e1.htm); Japan Meteorological Agency (JMA), Otemachi, 1-3-4, Chiyoda-ku Tokyo 100-8122, Japan (URL: http://www.jma.go.jp/)
Continued ash plumes and lava flows from vent on E side of cone through mid-November 2015
Japan's Nishinoshima volcano erupted above sea level in November 2013 for the first time in 40 years, and grew dramatically outward from a central pyroclastic cone and other vents with extensive lava flows, Strombolian eruptions, and ash plumes that rose as high as 1.2 km in 2014. The area of the island grew from approximately 0.29 to 2.29 km2 during 2014, reaching an elevation of around 100 m according to the Japan Coast Guard (JCG). Information about Nishinoshima comes primarily from monthly reports provided by the Japan Meteorological Agency (JMA) and photographs taken by the Japan Coast Guard (JCG), which monitors the volcano due to its remote location in the Pacific Ocean, approximately 940 km S of Tokyo along the Izu-Bonin arc.
Active growth due to lava flows erupting from vents around the central pyroclastic cone continued through mid-November 2015 when the eruption ended. Observations by the JCG showed that lava flows stopped sometime between visits on 12 and 17 November; the last MODVOLC thermal alert was on 14 November, and MIROVA data showed a drop in energy output a few days later. Ash plumes from explosions were still occurring on 17 November, but no eruptive activity was seen during a 22 December visit. Monthly overflights by the JCG documented the growth of the island, which ended the year with an area of approximately 2.63 km2.
The first 2015 aerial observation conducted by the JCG on 21 January revealed that eruptions at Crater 7 (atop the central pyroclastic cone) continued with a gray ash plume rising to 500 m and drifting W. Lava was flowing to the E side of the island and spreading outward like a fan flowing into the sea over a large area (figure 30). Lava was also observed flowing from a vent at the base of the eastern side of the pyroclastic cone, which was emitting blueish-white gas (figure 31). Discolored water along the coastline of the island drifted from E to N and from the W coast near the original island to the S.
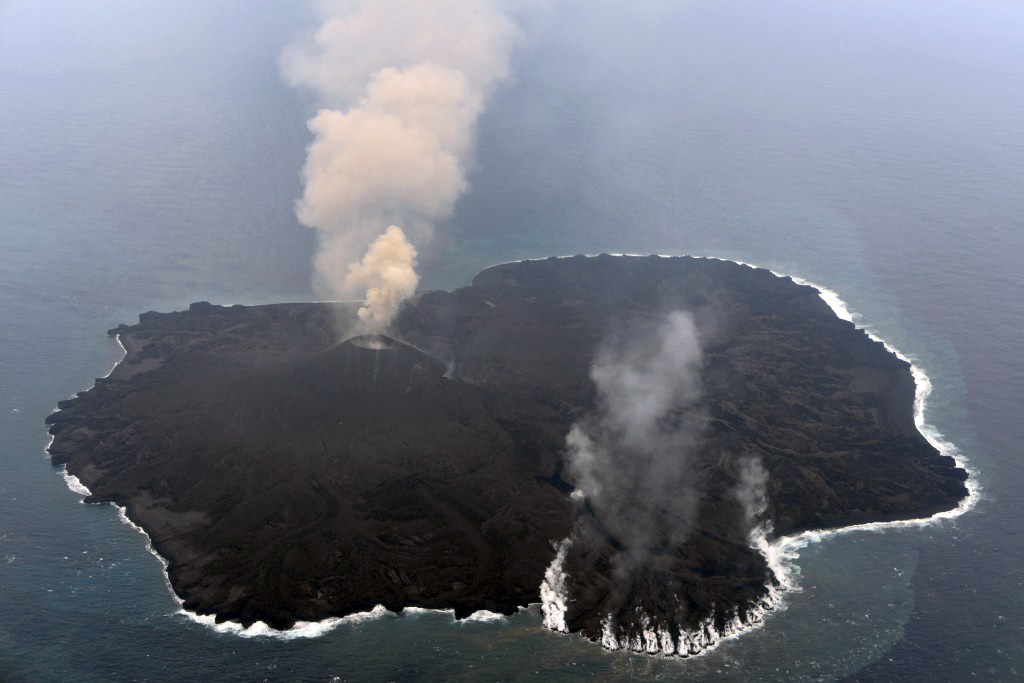 |
Figure 30. Lava spread east like a fan from the central cone on Nishinoshima on 21 January 2015, flowing into the sea and generating steam plumes across a broad area. Brown ash plumes from the cone rose 500 m and drifted W. Courtesy of Japan Coast Guard. |
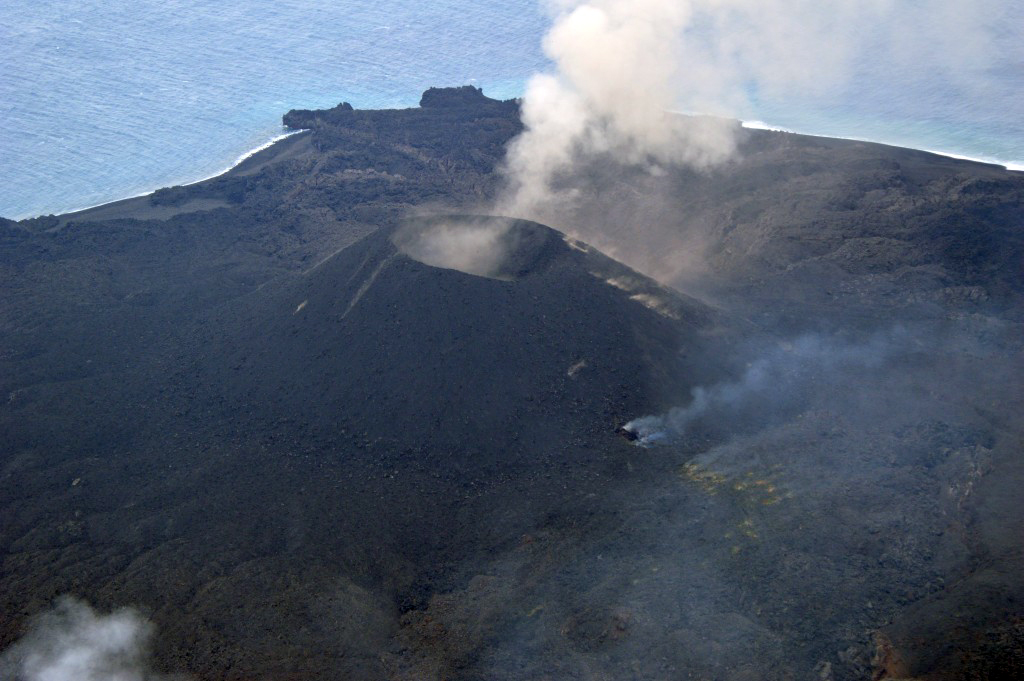 |
Figure 31. Bluish-white gas emitting from a vent at the base of the pyroclastic cone on Nishinoshima on 21 January 2015. Much of the lava that erupted in 2015 came from this vent. Courtesy of Japan Coast Guard. |
The area of newly formed land continued to expand in February 2015. Aerial observation on 23 February revealed ongoing Strombolian eruptions at Crater 7 that produced brown plumes and emitted lava. White to gray plumes rose as high as 1,200 m. Lava was flowing to the E side of the island and yellowish-green and brown discolored water was observed around the whole coastline except for the southern part (figure 32). The discolored area extended around 1,000 m to the NE with a width of 700 m, and around 1,500 m to the SE with a width of 1,000 m.
 |
Figure 32. View of Nishinoshima volcano on 23 February 2015. Brownish-gray ash plumes rose to 1,200 m from the central crater. Note yellow-green discolored water surrounding the island. Courtesy of Japan Coast Guard. |
In March, the lava flowed to the N and W from the pyroclastic cone, and ash plumes rose to 1,300 m and drifted generally S. Observations in late April revealed lava flowing from the vent on the NE side of the cone, forming a new lava field to the north of the cone (figure 33). The lava stream then flowed NE through a lava tube to the coast. By May the lava from the vent was flowing SE to the ocean and forming vapor spouts at the entry point. On 20 May the yellowish-green plume in the water was observed 10 km to the SW of the island (figure 34). Bluish-white emissions continued from the vent on the eastern side of the cone in June (figure 35) as lava from the vent flowed SE to the ocean.
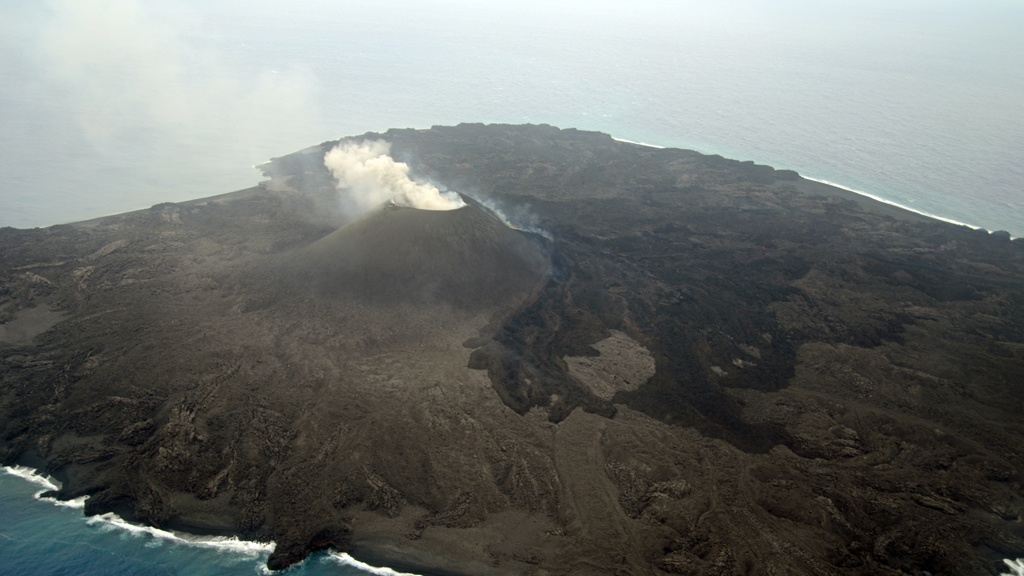 |
Figure 33. New lava field flowing N and E from the side vent on the cone of Nishinoshima on 27 April 2015. Courtesy of Japan Coast Guard. |
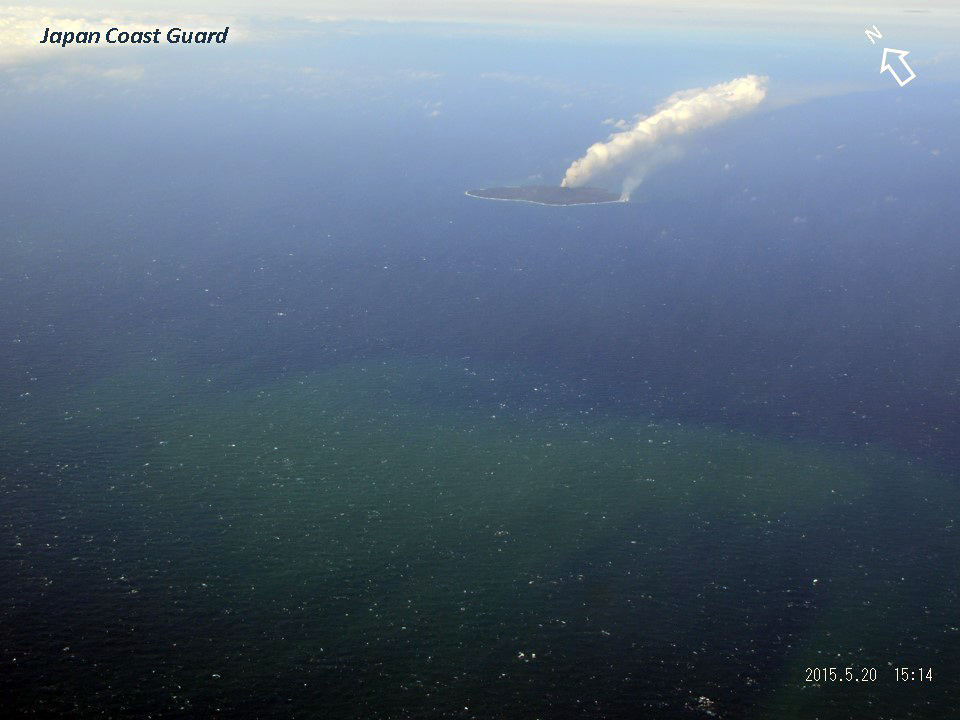 |
Figure 34. The yellowish-green plume from Nishinoshima is visible 10 km SW of the island. Both the ash-and-steam plume from the pyroclastic cone and the vapor spouts from the lava flows entering the sea are also visible in this image from 20 May 2015. The dimensions of the discolored water are 4,000 m from east to west and around 2,000 m from north to south. Courtesy of Japan Coast Guard. |
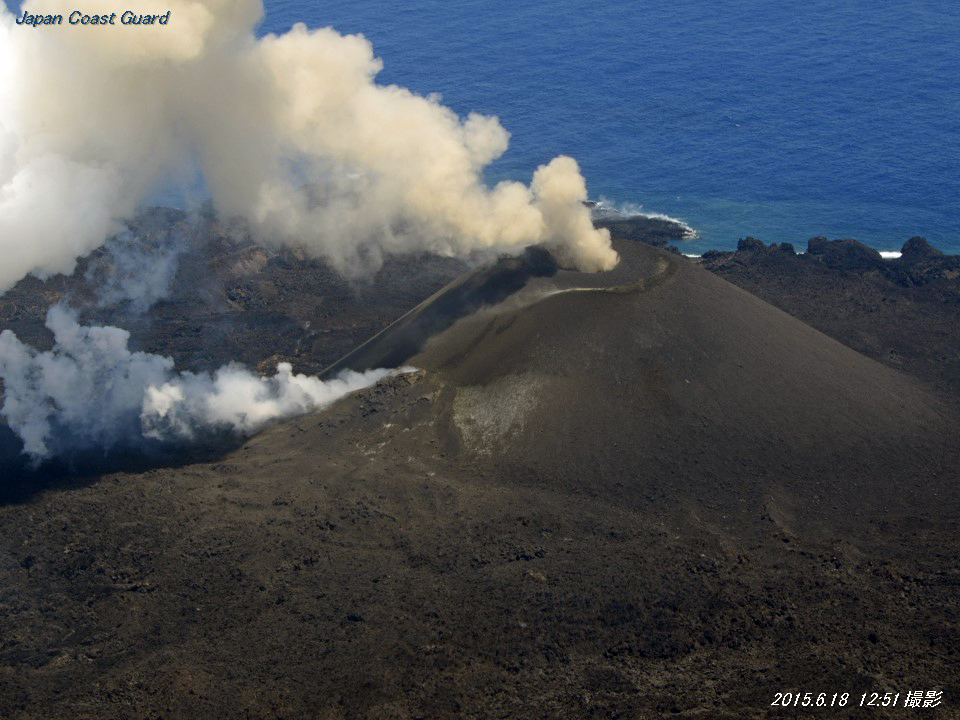 |
Figure 35. Blue-white gas and steam emissions from the vent on the eastern side of Nishinoshima's Crater 7 cone on 18 June 2015 are distinct from the brownish ash plume coming from the crater at the top of the cone. Courtesy of Japan Coast Guard. |
Fewer explosive eruptions were observed in July 2015. Areal observation on 31 July revealed a new crater in the vent on the north side of Crater 7. Lava flowed N and ENE from the NE slope of the pyroclastic cone in August as well as E and S through a lava tube. Some of the lava continued to reach the coast. The land expanded to the ESE due to lava flows, but coastline recession was observed in several places, especially on the southern side as a result of wave erosion. Aerial observation conducted on 23 August revealed the continued emission of blueish-white to white volcanic gas at the rim of the crater and fumaroles on the W, SE, and NE slope of the pyroclastic cone where white-to-yellow volcanic sublimate was widely distributed (figure 36).
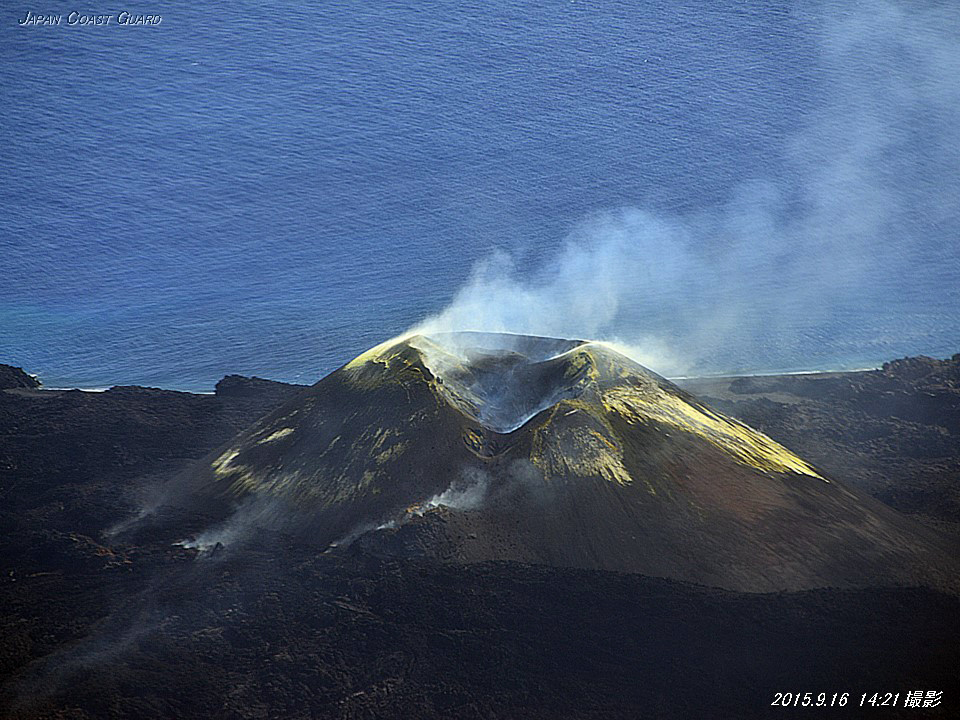 |
Figure 36. White and yellow sublimate from outgassing at Nishinoshima was first observed in August, but continued to expand in this image from 16 September 2015. Lava flows continued to emerge from vents on the NE side of the cone. Courtesy of Japan Coast Guard. |
Aerial observation on 16 September revealed lava from the NE side of the pyroclastic cone flowing W, NW, and SE. On 13 October the JCG observed small eruptions at Crater 7 occurring every three to five minutes. The lava field on the lower side of the NE slope of the cone had thickened, and lava flowed to the N and W. No lava flow was observed reaching the sea, and no significant changes were observed along the coast of the island. No eruptions at the crater were seen during a brief aerial observation conducted on 29 October, but weak fumes were observed rising around the crater. Yellowish-green discolored water was seen along the coast of the island with a width of around 50 to 200 m.
On 12 November JCG observed intermittent emissions of gray plumes from Crater 7. Lava flowed around 200 m SW from a newly formed outlet on the SW side of the cone. Aerial observation conducted on 17 November by JCG and the Earthquake Research Institute of the University of Tokyo revealed that the lava flow from the SW side of the pyroclastic cone had become slightly thicker and larger. It was also observed that a lava flow from the N side of the cone, which had been active since 17 September 2014, had stopped flowing. Eruptions occurred once or twice an hour from Crater 7 during the 17 November visit, and grayish-brown plumes rose to heights of 300 to 500 m. The eruptions sent volcanic projectiles with diameters of several meters to distances of 500 to 1,000 m from the crater and as far as the ocean on the SW side of the island (figure 37).
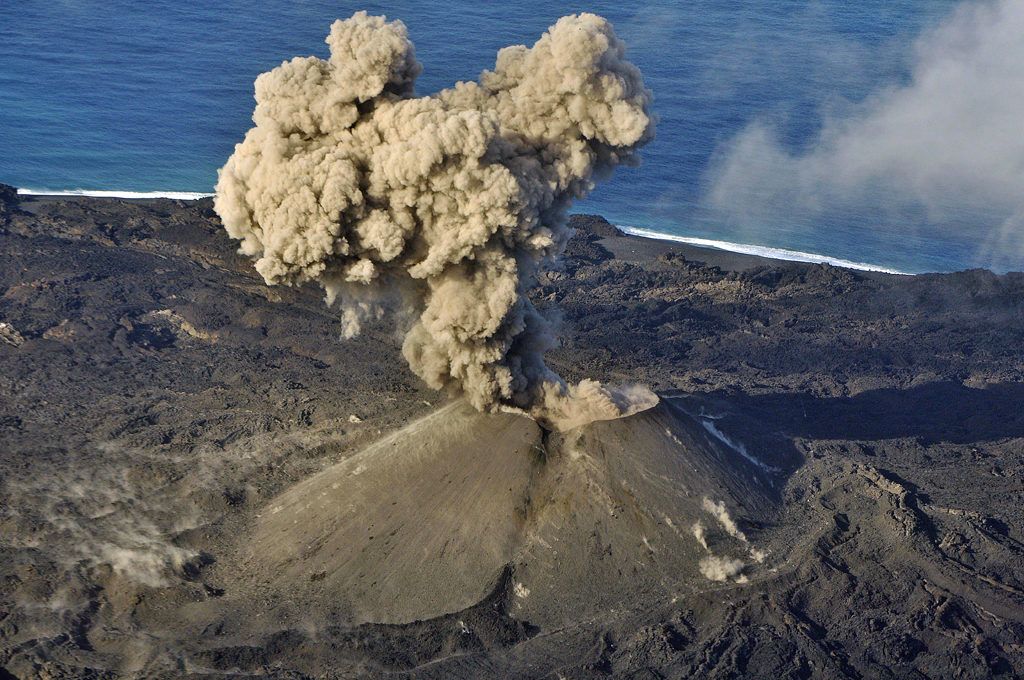 |
Figure 37. Eruption plumes observed at Nishinoshima on 17 November 2015. Projectiles were observed to distances of 1,000 m from the crater. Note the dark, fresh lava from the vent in the lower foreground, and wisps of steam rising from many small projectiles around the cone. Courtesy of Japan Coast Guard. |
No indication of eruptive activity was observed at Crater 7 or other parts of the island during aerial observation on 22 December by the JCG. Very weak white plumes were seen coming from the inner wall of the crater and the southern foot of the pyroclastic cone. No new lava flows were observed. Thermal measurements revealed no high-temperature areas on the island (including the crater or around new lava flows), and showed a remarkable decline in temperature compared with that observed on 17 November. The newly formed land covered around 1,900 m east-west and 1,920 m north-south. Its total area was around 2.62 km2, very similar to the previous measurement in November.
Moderate Resolution Imaging Spectroradiometer (MODIS) infrared satellite data revealed the impressive extent of thermal anomalies produced through mid-November 2015. Over 1,000 pixels of thermal anomalies were mapped by the MODVOLC system during 2015. Most days had 3-5-pixel anomalies; some days had as many as ten or more, indicating extensive output of lava. The MIROVA (Middle InfraRed Observation of Volcanic Activity) system's analysis of the 'Log Radiative Power' from MODIS data (figure 38) confirms the high amount of heat energy coming from the volcano during this time, and also corroborates a mid-November cessation of activity. The last MODVOLC thermal anomaly pixel is from 14 November, and the MIROVA data shows an abrupt decline of heat flow a few days later.
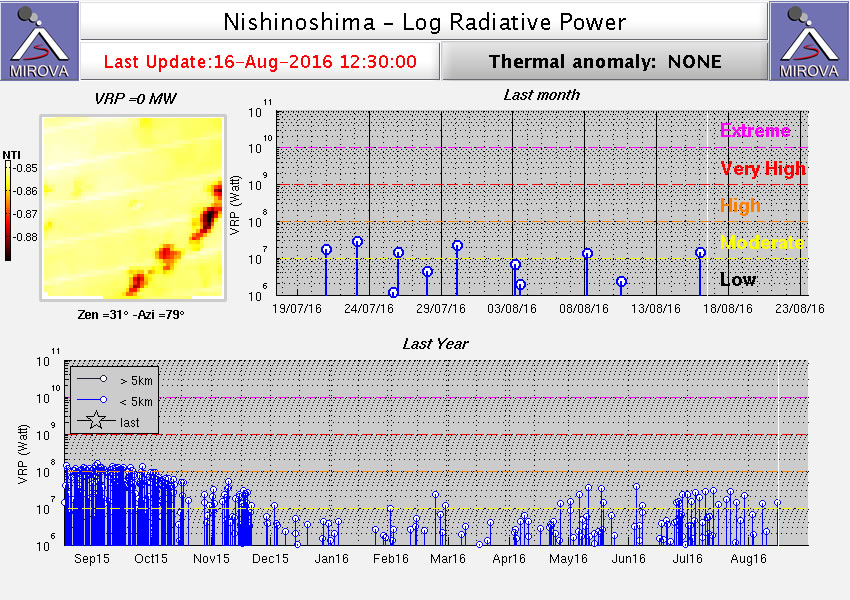 |
Figure 38. Log Radiative Power of MIROVA system analysis of MODIS data for Nishinoshima from the year ending 15 August 2016. Note the abrupt decline of energy after 15 November 2015, agreeing with the observations of JCG in December that there was little evidence of active eruption or heat flow at that time. Image courtesy MIROVA. |
Information Contacts: Japan Meteorological Agency (JMA), Otemachi, 1-3-4, Chiyoda-ku Tokyo 100-8122, Japan (URL: http://www.jma.go.jp/); Japan Coast Guard (JCG), Policy Evaluation and Public Relations Office, 100-8918, 2-1-3 Kasumigaseki, Chiyoda-ku, Tokyo (URL: http://www.kaiho.mlit.go.jp/e/index_e.htm, JCG Nishinoshima Data Site: http://www1.kaiho.mlit.go.jp/GIJUTSUKOKUSAI/kaiikiDB/kaiyo18-e1.htm); Hawai'i Institute of Geophysics and Planetology (HIGP), MODVOLC Thermal Alerts System, School of Ocean and Earth Science and Technology (SOEST), Univ. of Hawai'i, 2525 Correa Road, Honolulu, HI 96822, USA (URL: http://modis.higp.hawaii.edu/); MIROVA, a collaborative project between the Universities of Turin and Florence (Italy) supported by the Centre for Volcanic Risk of the Italian Civil Protection Department (URL: http://www.mirovaweb.it/).
April-July 2017 episode creates additional landmass from two lava flows
Japan's Nishinoshima volcano erupted above sea level in November 2013 for the first time in 40 years. Between then and November 2015 the island grew from 0.29 to 2.63 km2 as a result of numerous lava flows erupting from vents around a central pyroclastic cone (BGVN 41:09). Eruptive activity ended in November 2015, and no additional activity was observed during 2016. A new eruption that included ash emissions and lava flows began in April 2017, and continued until mid-August 2017. Two major lobes of lava emerged from the central crater of the pyroclastic cone and flowed SW and W, expanding the size of the island to about 2.2 km in the E-W dimension and 1.9 km in the N-S dimension, a total area of about 3 km2.
Information comes primarily from monthly reports provided by the Japan Meteorological Agency (JMA) and reports and photographs taken by the Japan Coast Guard (JCG), which monitors the volcano due to its remote location in the Pacific Ocean, approximately 940 km S of Tokyo along the Izu-Bonin arc. Satellite thermal data (MODIS) also provides valuable information about the active heat flow at the volcano.
Changes during November 2013-October 2015. Nishinoshima grew about twelve times in area between 6 November 2013 and 11 October 2015, after nearly two years of constant eruptive activity (figure 39). JCG presented a map in November 2015 showing the areas added to Nishinoshima between November 2013 and November 2015 (figure 40). The Ocean Information Division of JMA conducted a seabed topographic survey in a 4-km radius around the island between 22 June and 9 July 2015 that revealed the new submarine topography (figure 41).
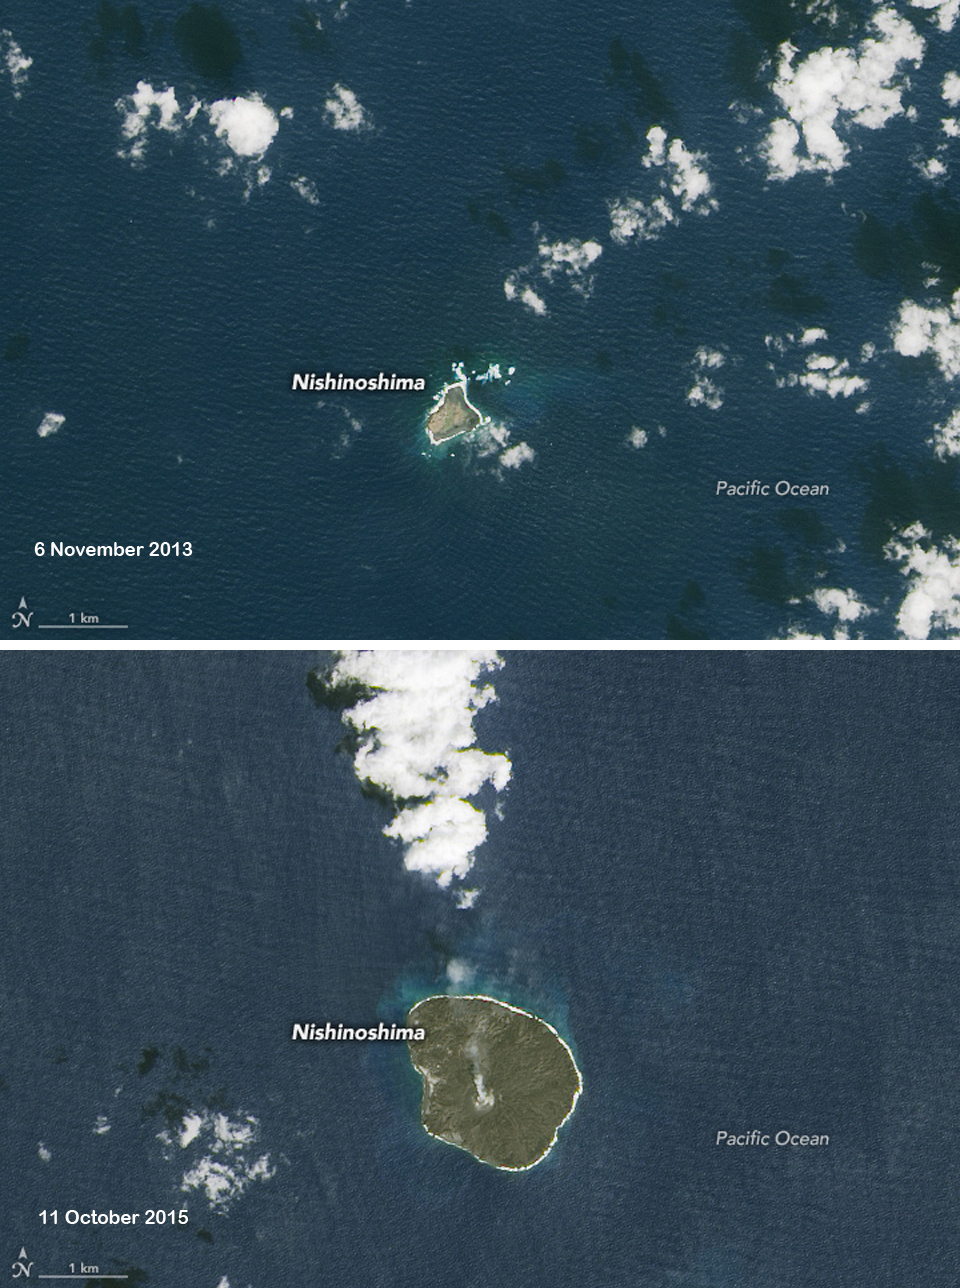 |
Figure 39. Nishinoshima grew about twelve times in area between 6 November 2013 and 11 October 2015. The Operational Land Imager (OLI) on Landsat 8 captured these images of the old and new island on those two dates. The top image shows the area on 6 November 2013, two weeks before the eruption started. The second image was acquired on 11 October 2015, after nearly two years of constant eruptive activity. In both images, pale areas just offshore likely reveal volcanic gases bubbling up from submerged vents or sediments disturbed by the eruption. Courtesy of NASA Earth Observatory. |
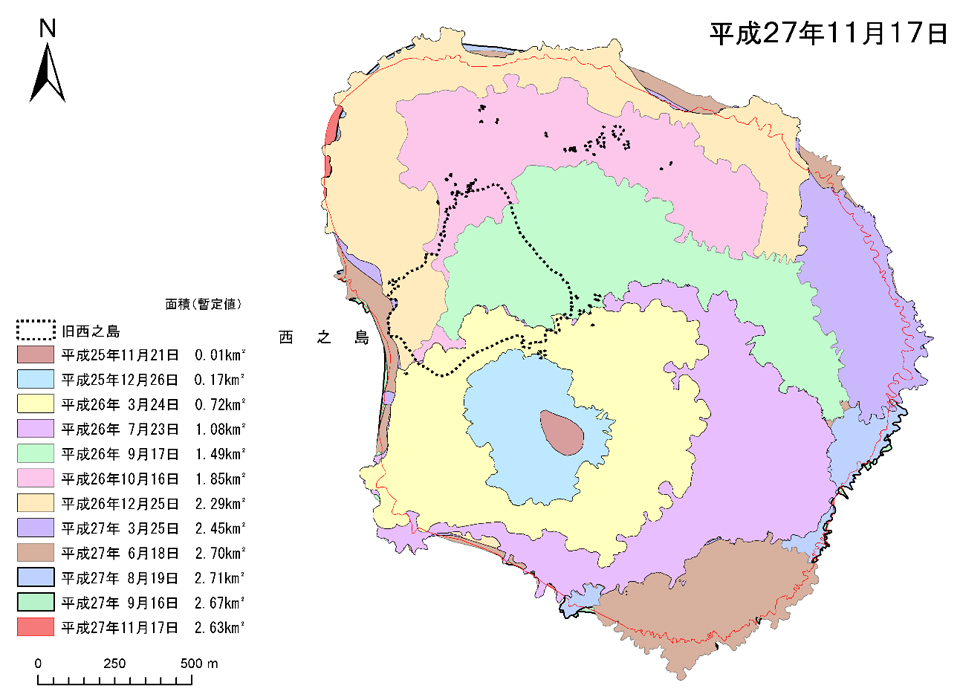 |
Figure 40. Changes in the shape and size of Nishinoshima between 21 November 2013 and 17 November 2015. Black dots outline areas above sea level prior to 21 November 2013. The sets of three numbers in the legend represent dates as follows '25' is 2013, '26' is 2014 and '27' is 2015. These numbers are followed by month and day. For example 26..12..25 is 25 December 2014. The total area of the island is shown after each date. The red outline shows the outer edge of land as of 17 November 2015. Courtesy of Japan Coast Guard (Status of volcanic activity at Nishinoshima, 20 November 2015). |
 |
Figure 41. The Ocean Information Division of JMA conducted a seabed bathymetric survey in a 4-km radius around Nishinoshima between 22 June and 9 July 2015 that revealed the new submarine topography after almost two years of eruption. The dashed blue line shows the area above sea level prior to November 2013. Courtesy of Japan Coast Guard (Status of volcanic activity at Nishinoshima, 20 October 2015). |
Activity during October-December 2015. The JCG visited Nishinoshima on 13 October, 17 November, and 22 December 2015 (BGVN 41:09). Explosions with ash plumes (figures 42 and 43) and active lava flows from a hornito on the flank (figures 44 and 45) were observed on 13 October. On 17 November they observed crater-like depressions on the N flank of the pyroclastic cone (figure 46).
 |
Figure 42. Ash explosion from the pyroclastic cone at Nishinoshima on 13 October 2015. Japanese text means "crater". Courtesy of Japan Coast Guard (Status of volcanic activity at Nishinoshima, 16 October 2015). |
 |
Figure 43. Plumes of discolored water surround Nishinoshima while an explosion emits ash from the pyroclastic cone on 13 October 2015. Japanese text means "discolored water area". Courtesy of Japan Coast Guard (Status of volcanic activity at Nishinoshima, 16 October 2015). |
 |
Figure 44. Lava flowed from a hornito on the NE flank of the pyroclastic cone (arrow at left, "lava flow outlet") at Nishinoshima on 13 October 2015. Courtesy of Japan Coast Guard (Status of volcanic activity at Nishinoshima, 16 October 2015). |
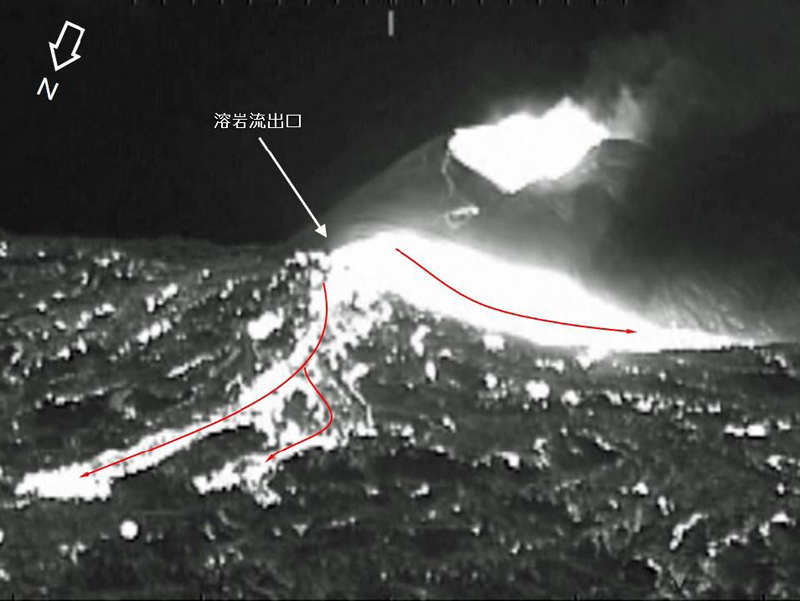 |
Figure 45. Thermal imagery revealed lava flowing N and W from the hornito on the NE side of the pyroclastic cone at Nishinoshima on 13 October 2015. Courtesy of Japan Coast Guard (Status of volcanic activity at Nishinoshima, 16 October 2015). |
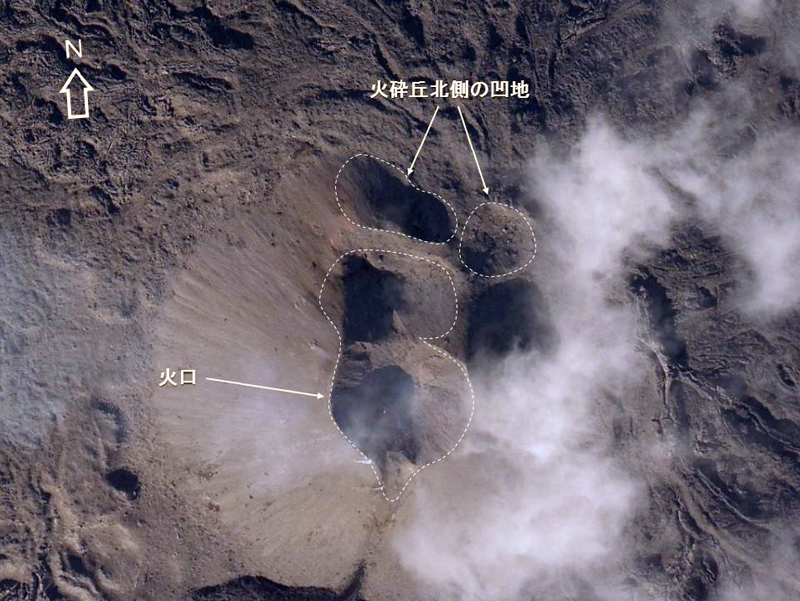 |
Figure 46. Crater depressions appeared on the N side of the pyroclastic cone at Nishinoshima on 17 November 2015. Courtesy of Japan Coast Guard (Status of volcanic activity at Nishinoshima, 20 November 2015). |
By the time of their visit on 22 December, there were no further signs of activity from the pyroclastic cone (figure 47), and a comparison of thermal imagery between 17 November and 22 December (figure 48) showed a dramatic decline in heat flow. Aerial photography of the island that day revealed the extent of the new island compared with the pre-November 2013 landmass (figure 49).
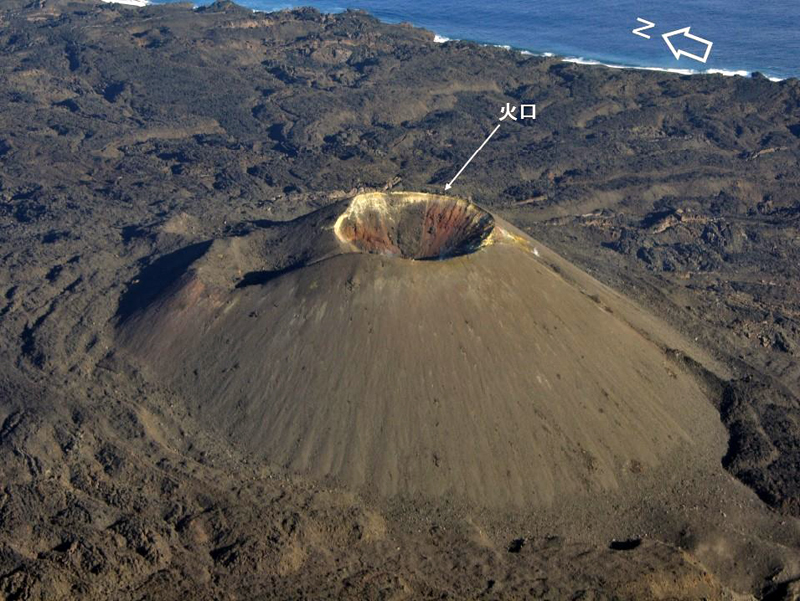 |
Figure 47. The pyroclastic cone and summit crater at Nishinoshima were quiet when observed by the JCG on 22 December 2015. Courtesy of Japan Coast Guard (Status of volcanic activity at Nishinoshima, 25 December 2015). |
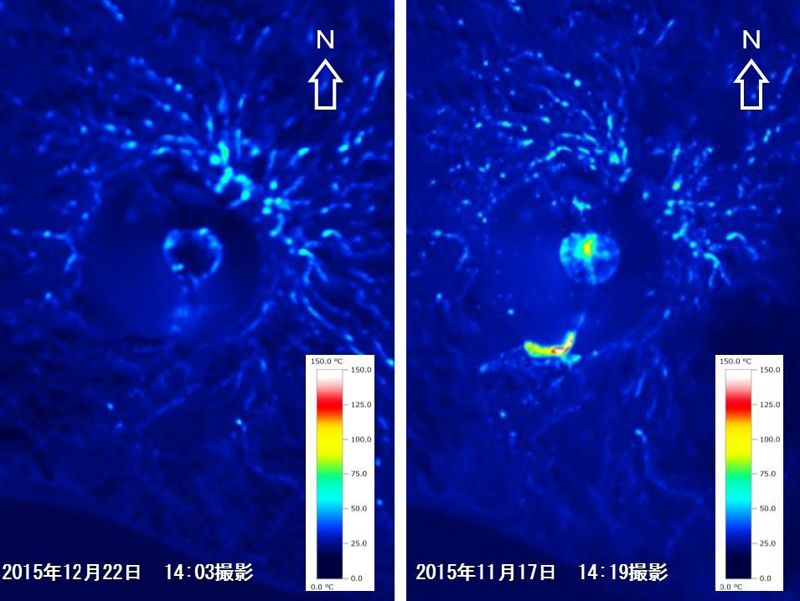 |
Figure 48. A comparison of thermal imagery from 22 December 2015 (left) and 17 November 2015 (right) reveals a decrease in heat flow at Nishinoshima from both the summit crater and the hornito on the SW flank. Courtesy of Japan Coast Guard (Status of volcanic activity at Nishinoshima, 25 December 2015). |
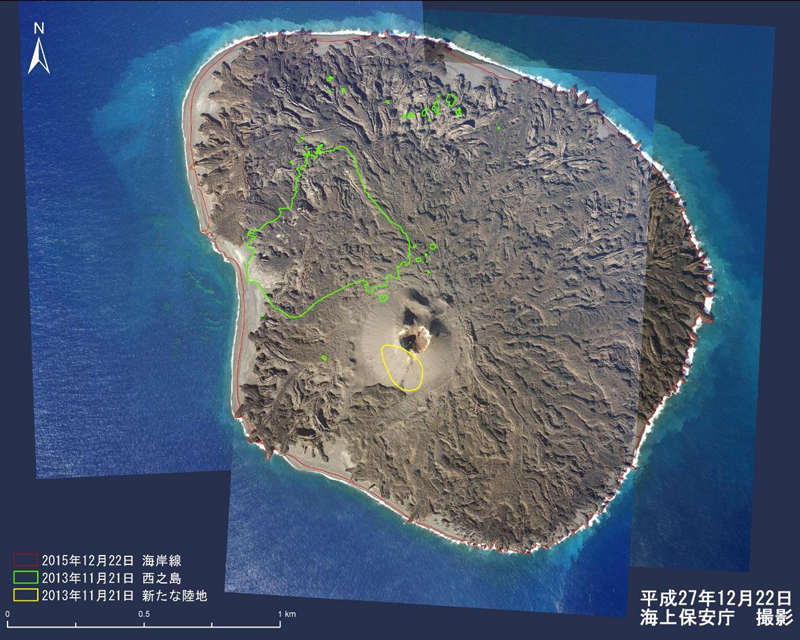 |
Figure 49. Composite of aerial photographs of Nishinoshima on 22 December 2015. Green and yellow outlines show areas that were above sea level on 21 November 2013 for comparison. Courtesy of Japan Coast Guard (Status of volcanic activity at Nishinoshima, 25 December 2015). |
Activity during 2016. The Japan Coast Guard continued with monthly observations during 2016, with visits on 19 January, 3 February, 5 March, 14 April, 20 May, 7 June, 19 July, 18 August, 15 September, and 6 October 2016. Only weak fumarolic activity was observed during the February visit (figure 50). Thermal measurements consistently remained at or below 100°C during the year; plumes of light brown to yellowish-green discolored water generally extended 200-400 m away from the coastline, suggesting continued submarine hydrothermal activity. The discolored water extended 1,000 m off the N coast during the 5 March visit. Dense steam filled the summit crater of the pyroclastic cone on 14 April (figure 51). During their 20 May visit, JCG noted a slight increase in size of the beach areas around the shoreline; this increase continued for several months, likely a result of fresh lava flows breaking down into sand from the wave action. During May and June, small amounts of magmatic gas were visible rising a few tens of meters above the summit crater.
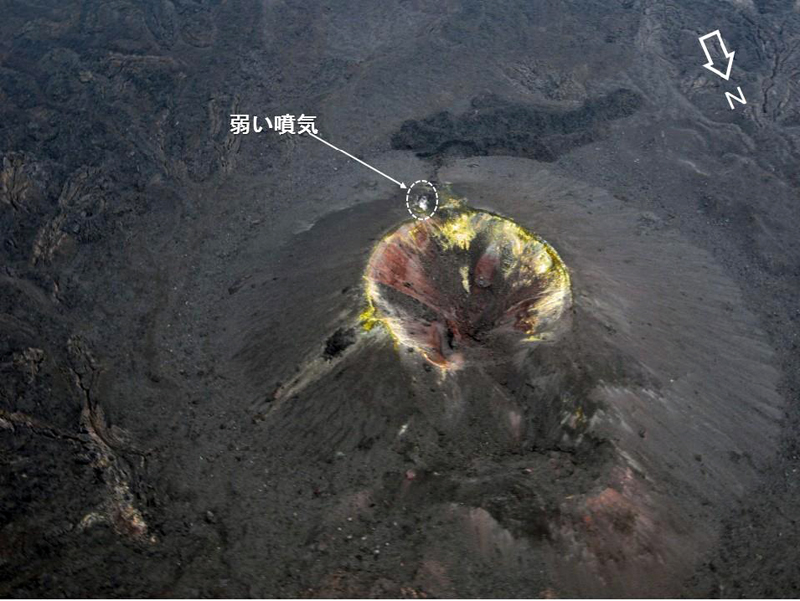 |
Figure 50. Weak fumarolic activity from the S side of the crater rim was the only notable activity observed at Nishinoshima during a visit by JCG on 3 February 2016. Courtesy of Japan Coast Guard (Status of volcanic activity at Nishinoshima, 5 February 2016). |
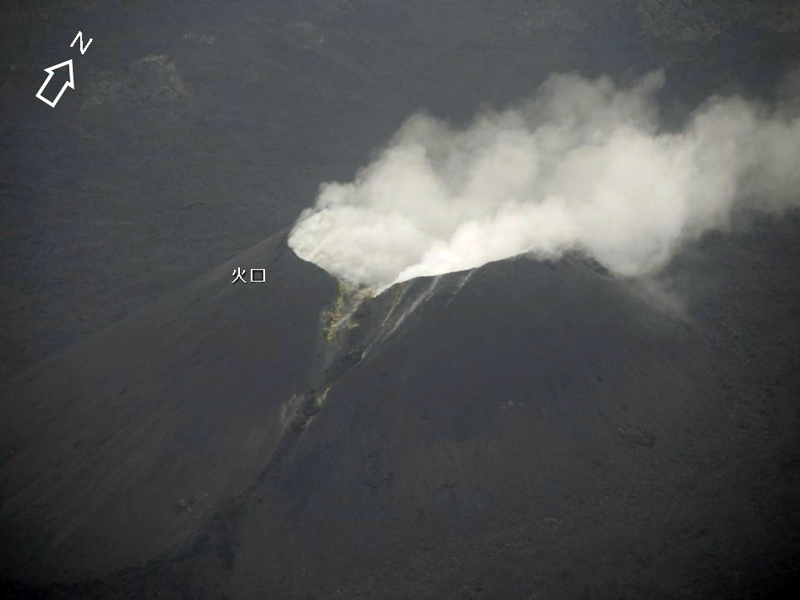 |
Figure 51. Steam emanated from the summit crater of the pyroclastic cone at Nishinoshima during a visit by the Japan Coast Guard on 14 April 2016. Courtesy of Japan Coast Guard (Status of volcanic activity at Nishinoshima, 19 April 2016). |
On 17 August, JMA cancelled the maritime volcano warning (preventing vessels from approaching within 1.5 km), as a result of the decreased activity. Professor Kenji Nogami of the Tokyo Institute of Volcanic Fluid Research Center noted an increase in the discolored water area, extending about 1,000 m on the S side of the island during the JCG overflight on 15 September. JCG conducted a new submarine survey of the area during 22 October-10 November 2016 to provide data for new maritime charts. No additional reports were issued until a new eruptive episode was observed on 20 April 2017.
While the Japan Coast Guard did not observe volcanic activity during 2016, the MIROVA data suggests that low levels of heat flow were intermittent throughout the year, with slight increases during May-June, July-August, and September-October 2016 (figure 52). The heat flow recorded by MIROVA during 2016 was about an order of magnitude less that that during the period with active lava flows in September-November 2015.
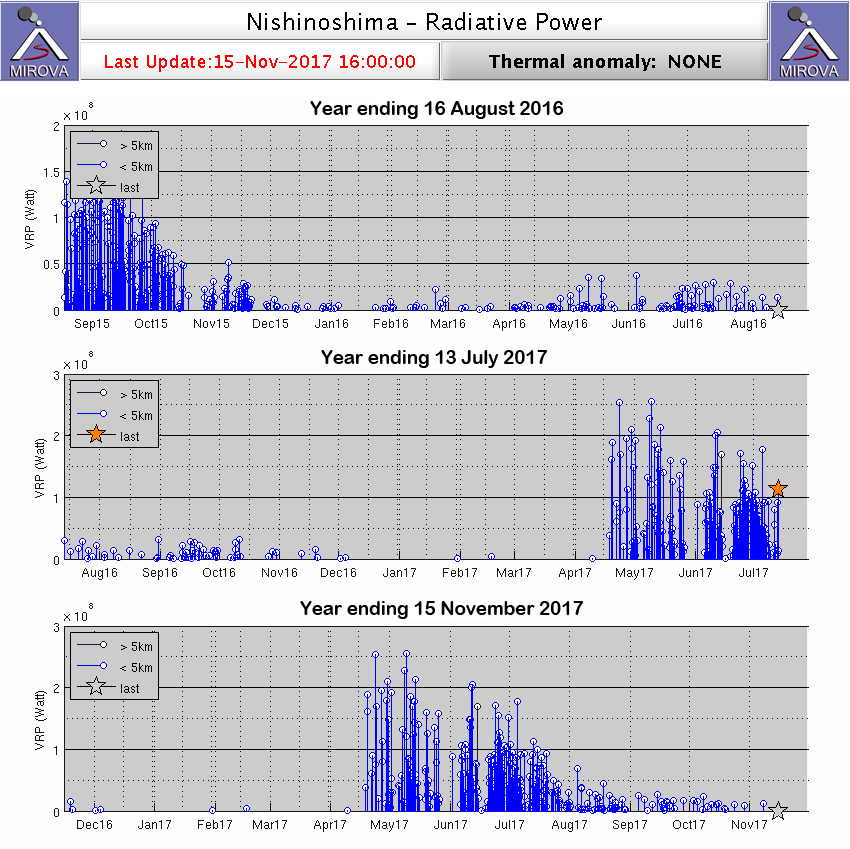 |
Figure 52. MIROVA Radiative Power thermal anomaly graph for Nishinoshima from 16 August 2015 through 15 November 2017. Data is from the MODIS satellite instrument. Active lava flows were observed by the JCG through mid-November 2015 (top graph). Only minor fumarolic activity was intermittently observed during 2016. Renewed lava flows and Strombolian activity were again observed beginning on 21 April 2017 (bottom graph). Courtesy of MIROVA. |
Activity during April-October 2017. The JCG observed renewed eruptive activity when they visited Nishinoshima on 20 April 2017. They confirmed the existence of a new lava flow from the summit crater of the pyroclastic cone on 21 April. They also observed a gray ash plume 500 m wide rising 1,000 m above the crater, Strombolian explosions at intervals of tens of seconds, and molten lava within the crater. A new lava flow appeared on the N side of the cone, although it had not yet reached the ocean. By the time of the next overflight on 27 April, JCG confirmed that the lava flow had reach the ocean on the W and SW coast of the island (figure 53), and a new pyroclastic cone had formed within the summit crater. Strong MODVOLC multi-pixel thermal alerts first appeared on 18 April, and persisted with no more than a few day's break until early August 2017. The Tokyo VAAC reported an ash plume on 20 April at 2.4 km altitude drifting W, but it was not identifiable in satellite data.
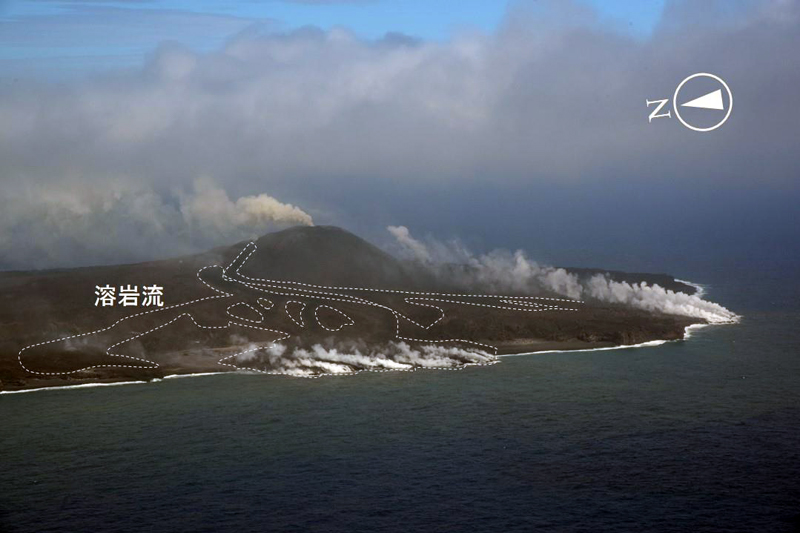 |
Figure 53. New lava flows (outlined in white) reach the ocean on the W and SW coast of Nishinoshima on 27 April 2017. Ash emissions rose from the summit crater, and steam plumes emerged from the numerous places where the lava entered the sea. Courtesy of Japan Coast Guard (Status of volcanic activity at Nishinoshima, 28 April 2017). |
Strombolian explosions were observed every 40-60 seconds during an overflight on 2 May 2017. They emerged from the new pyroclastic cone at the center of the summit crater. Ash plumes rose 500 m and drifted SW. Two vents on the N side of the crater produced lava that flowed to the ocean on the SW coast of the island (figure 54). Areas of new lava extended about 170 m W and 180 m SW into the ocean. Continued ash emissions were drifting N from the island on 24 May, and lava continued flowing into the sea along the SW shore.
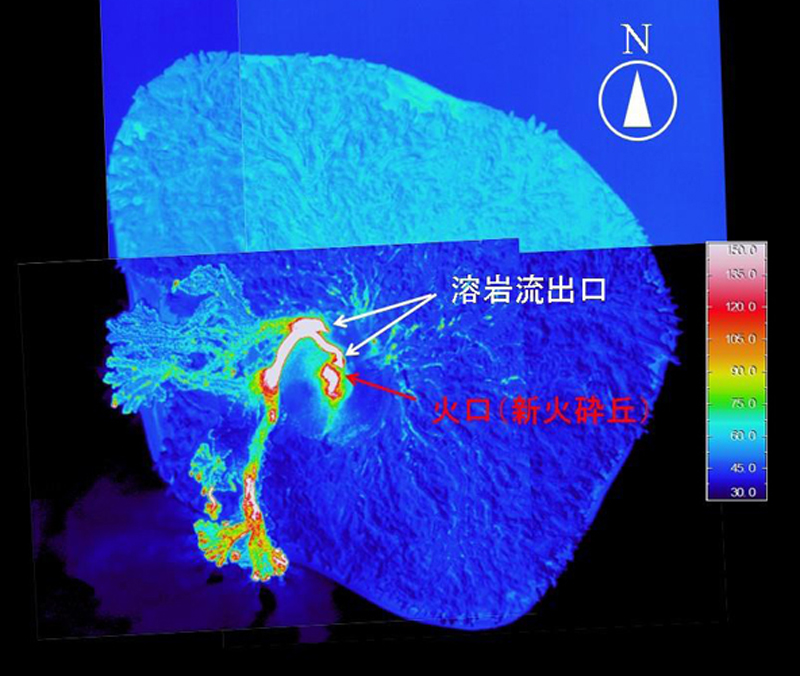 |
Figure 54. A thermal image of Nishinoshima taken on 2 May 2017 reveals an active lava flow emerging from the N flank of the crater and flowing SW into the ocean. Two vents are identified with the white arrows. The red arrow identifies the pyroclastic cone within the summit crater. The new areas of lava extended about 170 m W and 180 m SW into the ocean. Courtesy of Japan Coast Guard (Status of volcanic activity at Nishinoshima, 10 May 2017). |
During the next overflight on 6 June, JCG confirmed a new lava flow emerging from the W flank of the pyroclastic cone and flowing to the sea (figure 55). In late June 2017, JMA published a new bathymetric map of Nishinoshima and surrounding waters as of October 2016. JCG noted that explosions continued at 30-second intervals during their 29 June overflight. Ash plumes rose to about 200 m above the crater rim, and lava was entering the sea on the W side of the island (figure 56). The new lava flows now extended into the sea about 330 m to the W and 310 m to the SW (figure 57).
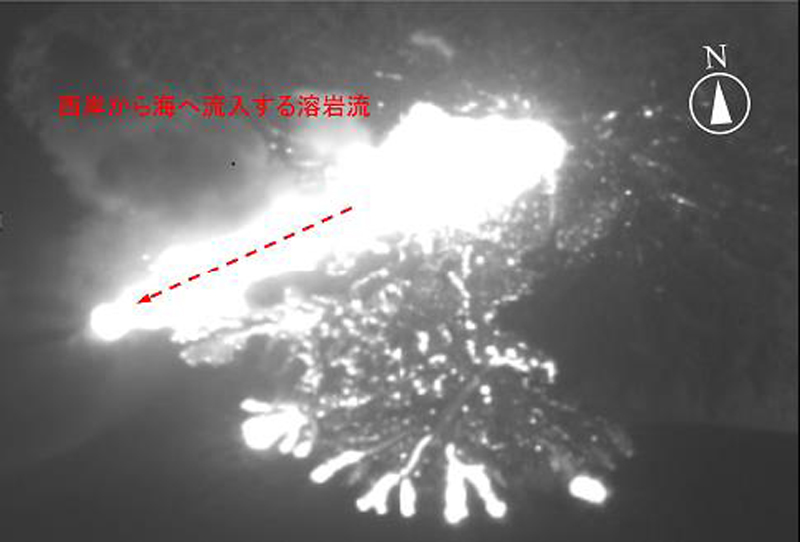 |
Figure 55. A thermal image of lava flowing into the ocean on the W side of Nishinoshima captured during a JCG overflight on 6 June 2017. A new lava flow (red arrow) flows W from the crater to the sea while the lobes of the existing flow continue to extend into the ocean. Courtesy of Japan Coast Guard (Status of volcanic activity at Nishinoshima, 9 June 2017). |
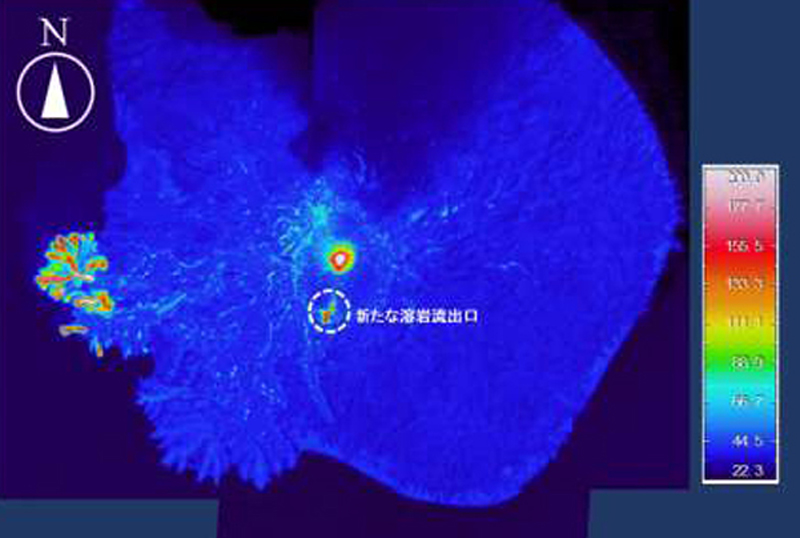 |
Figure 56. A thermal image of Nishinoshima taken on 29 June 2017 reveals lava entering the sea on the W side of the island, and a new vent with fresh lava on the S side of the pyroclastic cone (white circle). Courtesy of Japan Coast Guard (Status of volcanic activity at Nishinoshima, 5 July 2017). |
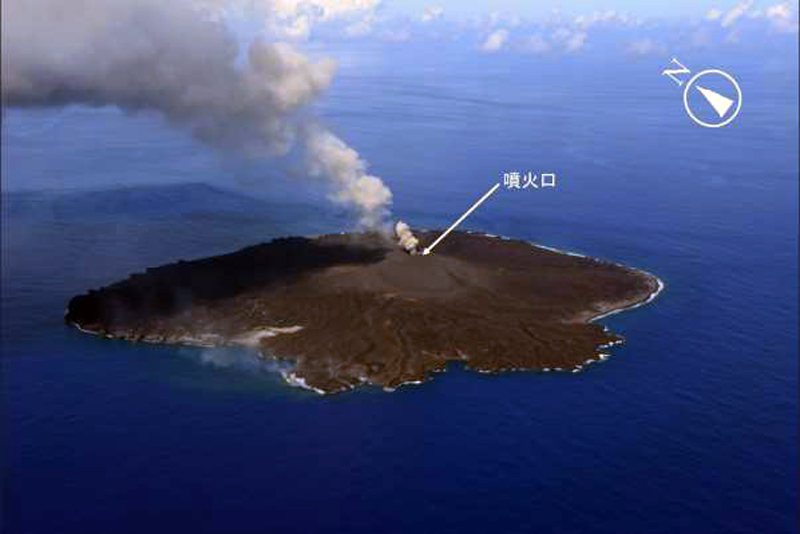 |
Figure 57. Two lobes of fresh lava flows extend S and SW from Nishinoshima on 29 June 2017 as ash emissions rise from the central crater. Lava is actively flowing into the sea on the W side of the W lobe, but is no longer active on the SW lobe. Courtesy of Japan Coast Guard (Status of volcanic activity at Nishinoshima, 5 July 2017). |
The Tokyo VAAC reported multiple ash emissions during June. An eruption generated an ash plume on 8 June that rose to 1.2 km altitude and drifted SW. Emissions were observed in satellite imagery for the next 24 hours before dissipating. Another ash plume on 26 June was reported drifting NE at 3 km altitude. Ash seen on 30 June was reported drifting W at 2.1 km altitude for most of the day before dissipating. The Tokyo VAAC reported a possible eruption on 2 July that sent an E-drifting ash plume to 1.5 km altitude. It was later reported at 3 km altitude before dissipating. Ash and bombs were observed exploding from the central crater during the 11 July 2017 JCG overflight. Lava was also still entering the sea on the W side of the island (figure 58).
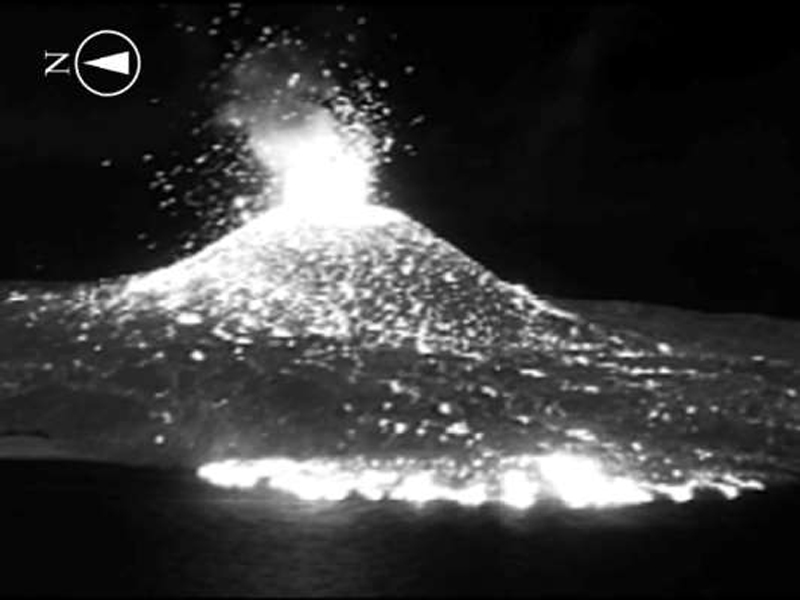 |
Figure 58. Strombolian explosions and lava entering the sea were captured in this thermal image taken from the W side of Nishinoshima on 11 July 2017. Courtesy of Japan Coast Guard (Status of volcanic activity at Nishinoshima, 14 July 2017). |
The JCG visited the island on 11 and 24 August 2017. They did not witness any eruptive activity, but diffuse steam plumes were seen rising from the crater rim. They also noted steam plumes from lava that was still entering the sea on the W side of the island on 11 August, but not during the 24 August flyover. Aerial photos taken that day showed the extent of new land formed since late April (figure 59). Additional flyovers by JCG on 15 September and 7 October confirmed a lack of active lava flows, and only minor steam plumes were reported rising from the crater rim. The last MODVOLC thermal alert appeared on 5 August. The MIROVA thermal anomaly signals that had abruptly reappeared in late April gradually tapered off throughout August, confirming a decrease in the heat flow as the lava flows cooled (figure 52).
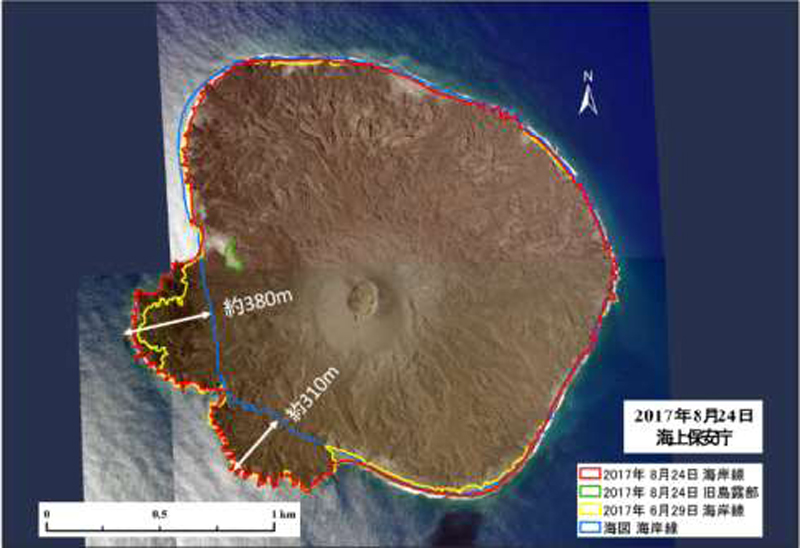 |
Figure 59. Composite of aerial photos taken on 24 August 2017 showing the increased landmass at Nishinoshima from the new lava flows that erupted between 18 April and 11 August. The green outline shows the area of the old (pre-Nov 2013) Nishinoshima still visible on 24 August. The blue outline represents the shoreline prior to the eruption of 18 April. The yellow outline shows the shoreline as of 29 June 2017, and the red outline shows the area outline as of 24 August 2017. Courtesy of Japan Coast Guard (Status of volcanic activity at Nishinoshima, 29 August 2017). |
Information Contacts: Japan Meteorological Agency (JMA), Otemachi, 1-3-4, Chiyoda-ku Tokyo 100-8122, Japan (URL: http://www.jma.go.jp/jma/indexe.html); Japan Coast Guard (JCG), Policy Evaluation and Public Relations Office, 100-8918, 2-1-3 Kasumigaseki, Chiyoda-ku, Tokyo, Telephone, 03-3591-6361 (URL: http://www.kaiho.mlit.go.jp/info/kouhou/h29/index.html); NASA Earth Observatory, EOS Project Science Office, NASA Goddard Space Flight Center, Goddard, Maryland, USA (URL: http://earthobservatory.nasa.gov/); Hawai'i Institute of Geophysics and Planetology (HIGP) - MODVOLC Thermal Alerts System, School of Ocean and Earth Science and Technology (SOEST), Univ. of Hawai'i, 2525 Correa Road, Honolulu, HI 96822, USA (URL: http://modis.higp.hawaii.edu/); MIROVA (Middle InfraRed Observation of Volcanic Activity), a collaborative project between the Universities of Turin and Florence (Italy) supported by the Centre for Volcanic Risk of the Italian Civil Protection Department (URL: http://www.mirovaweb.it/).
Quiescence interrupted by brief lava flow emission and small explosions in July 2018
Nishinoshima is an active volcano in the Ogasawara Arc, about 1,000 km S of Tokyo, Japan. After 40 years of dormancy, activity increased in November 2013 and has since formed an island. The eruption has continued with subaerial activity that largely consists of lava flows and small gas-and-ash plumes. This report covers November 2017 through July 2018, and summarizes activity noted in reports issued by the Japan Meteorological Agency, and images and footage taken by the Japan Coast Guard (JCG).
No eruptive activity at Nishinoshima had been noted since mid-August 2017, when lava was last entering the ocean. Activity recommenced on 12 July and a 200-m-long lava flow was confirmed on 13 July. The lava flow was accompanied by explosive activity that ejected blocks and bombs out to 500 m from the vent, plumes and water discoloration (figures 60, 61, and 62). An aerial survey by the JCG on 30 July showed that activity had ceased and the lava flow had reached 700 m in length, terminating 100 m from the ocean.
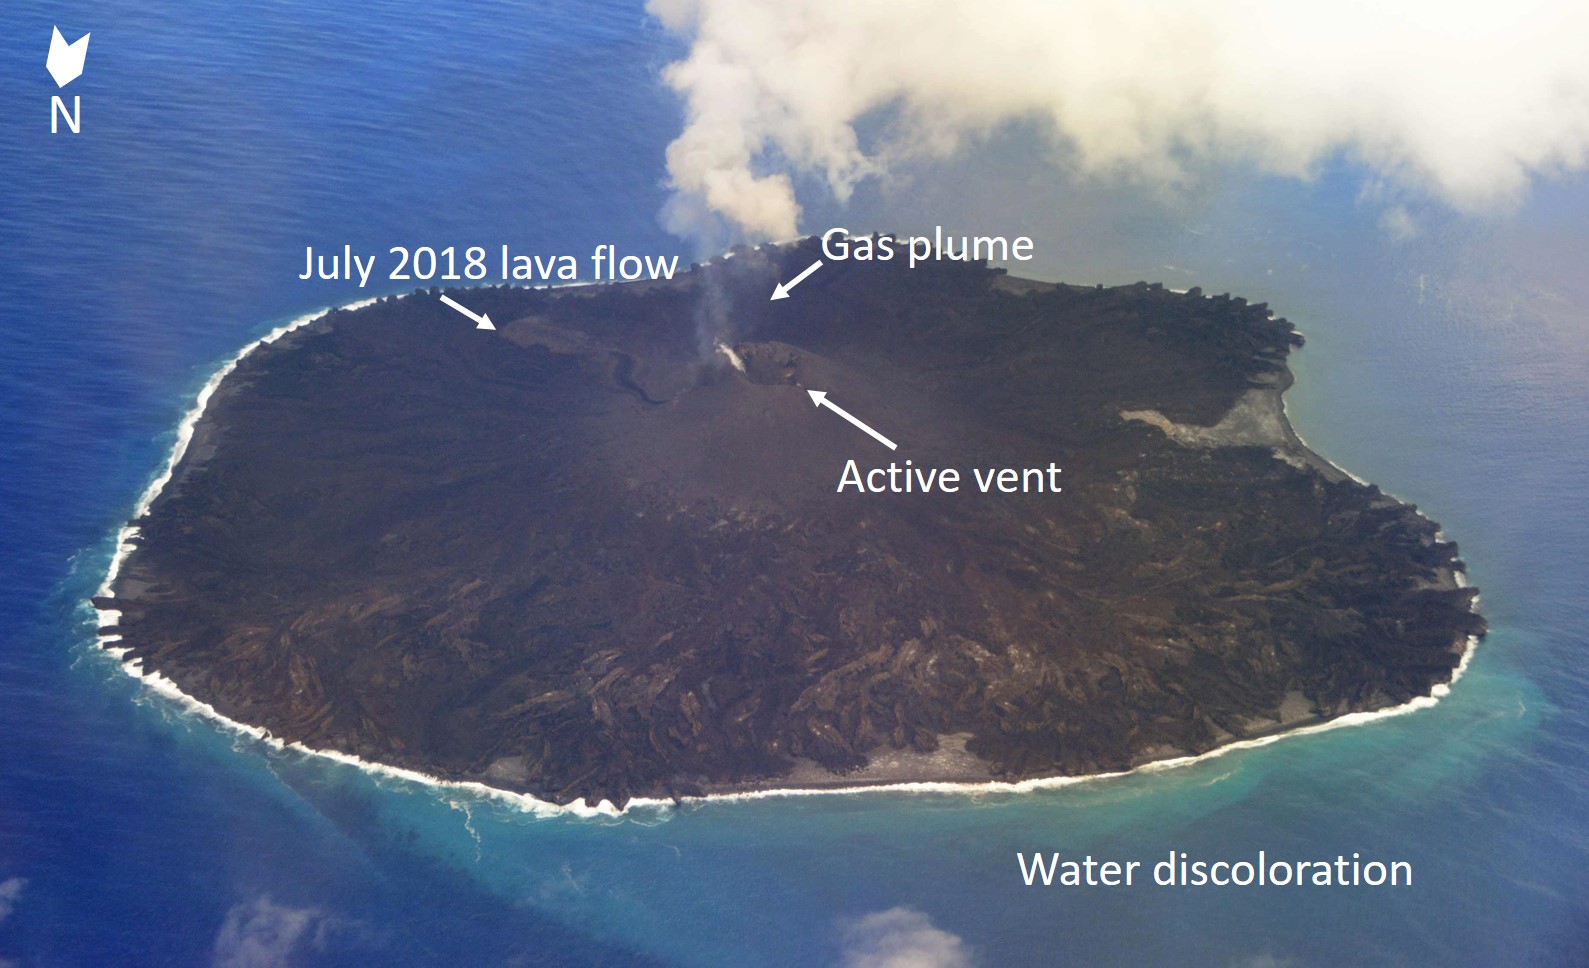 |
Figure 60. Aerial photo of Nishinoshima taken on 18 July 2018. The photo shows the active lava flow emanating from the vent along with a gas plume, and water discoloration. A closer view of the lava flow is given in figure 61. The island is approximately 1.9 x 1.9 km in size. Courtesy of the Japan Coast Guard. |
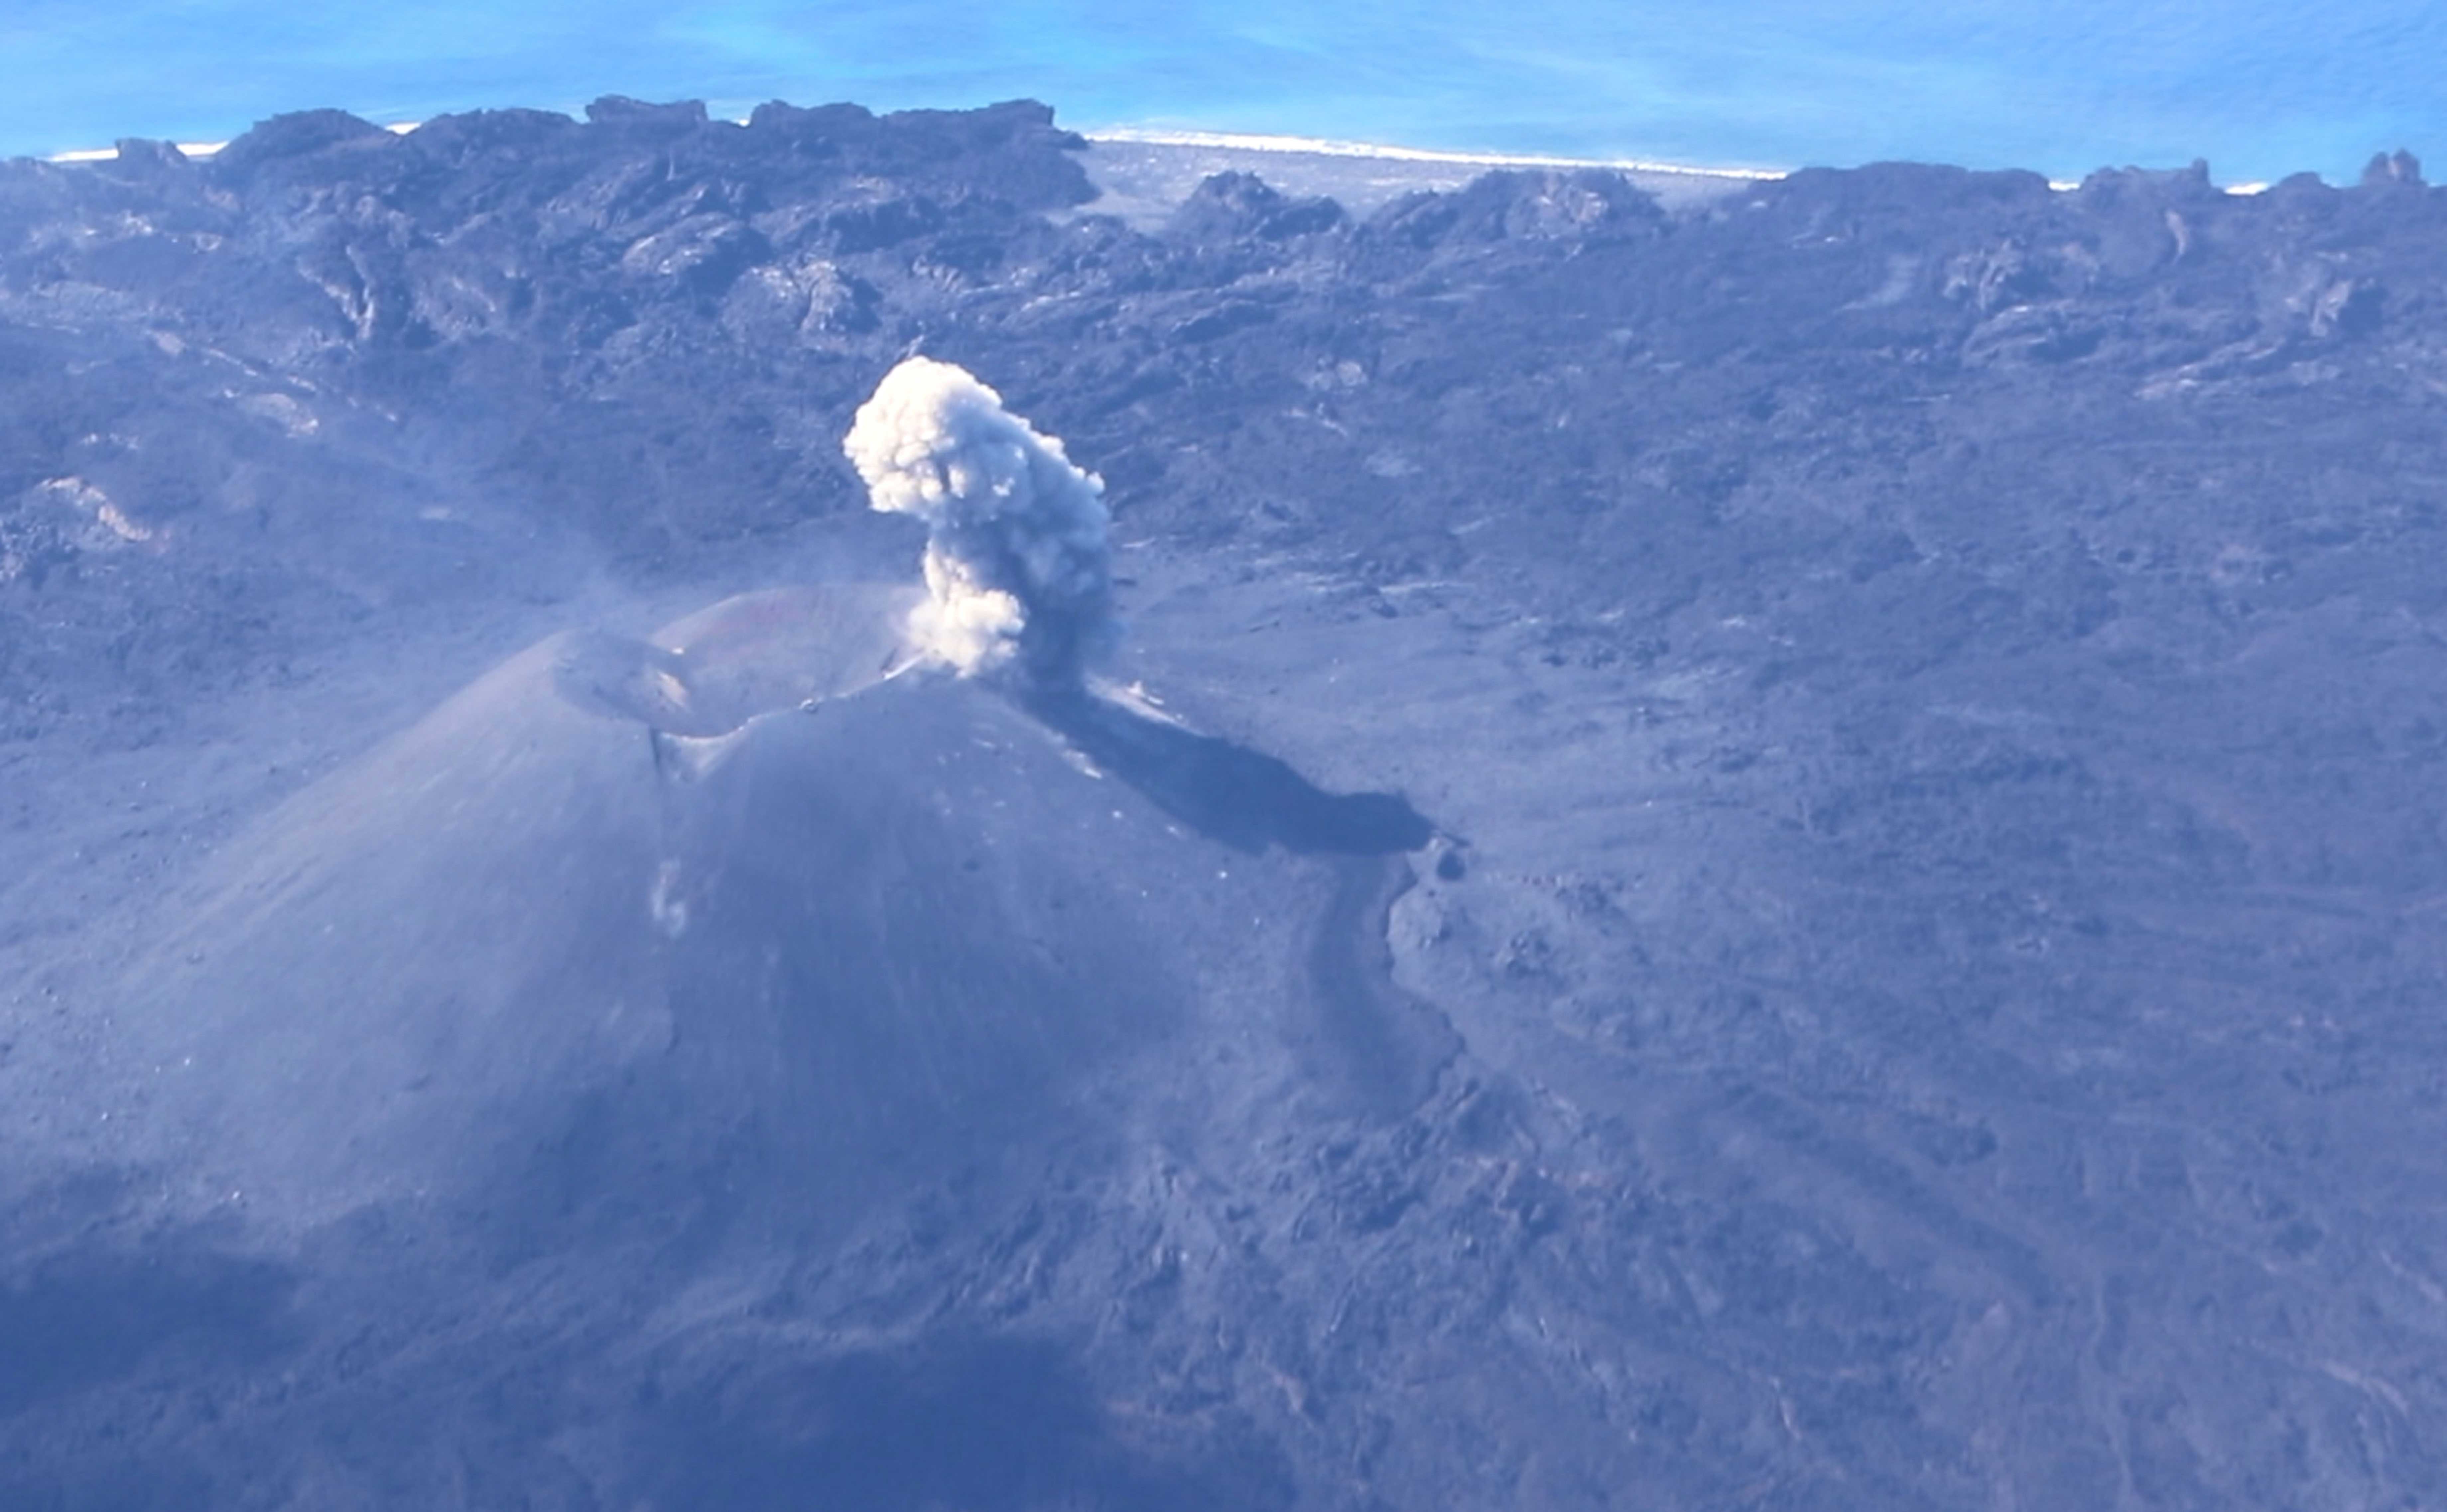 |
Figure 61. A view of the active Nishinoshima vent and 200-m-long lava flow on 13 July 2018. The vent is also producing a dilute ash plume from the eastern side of the cone. Courtesy of the Japan Coast Guard. |
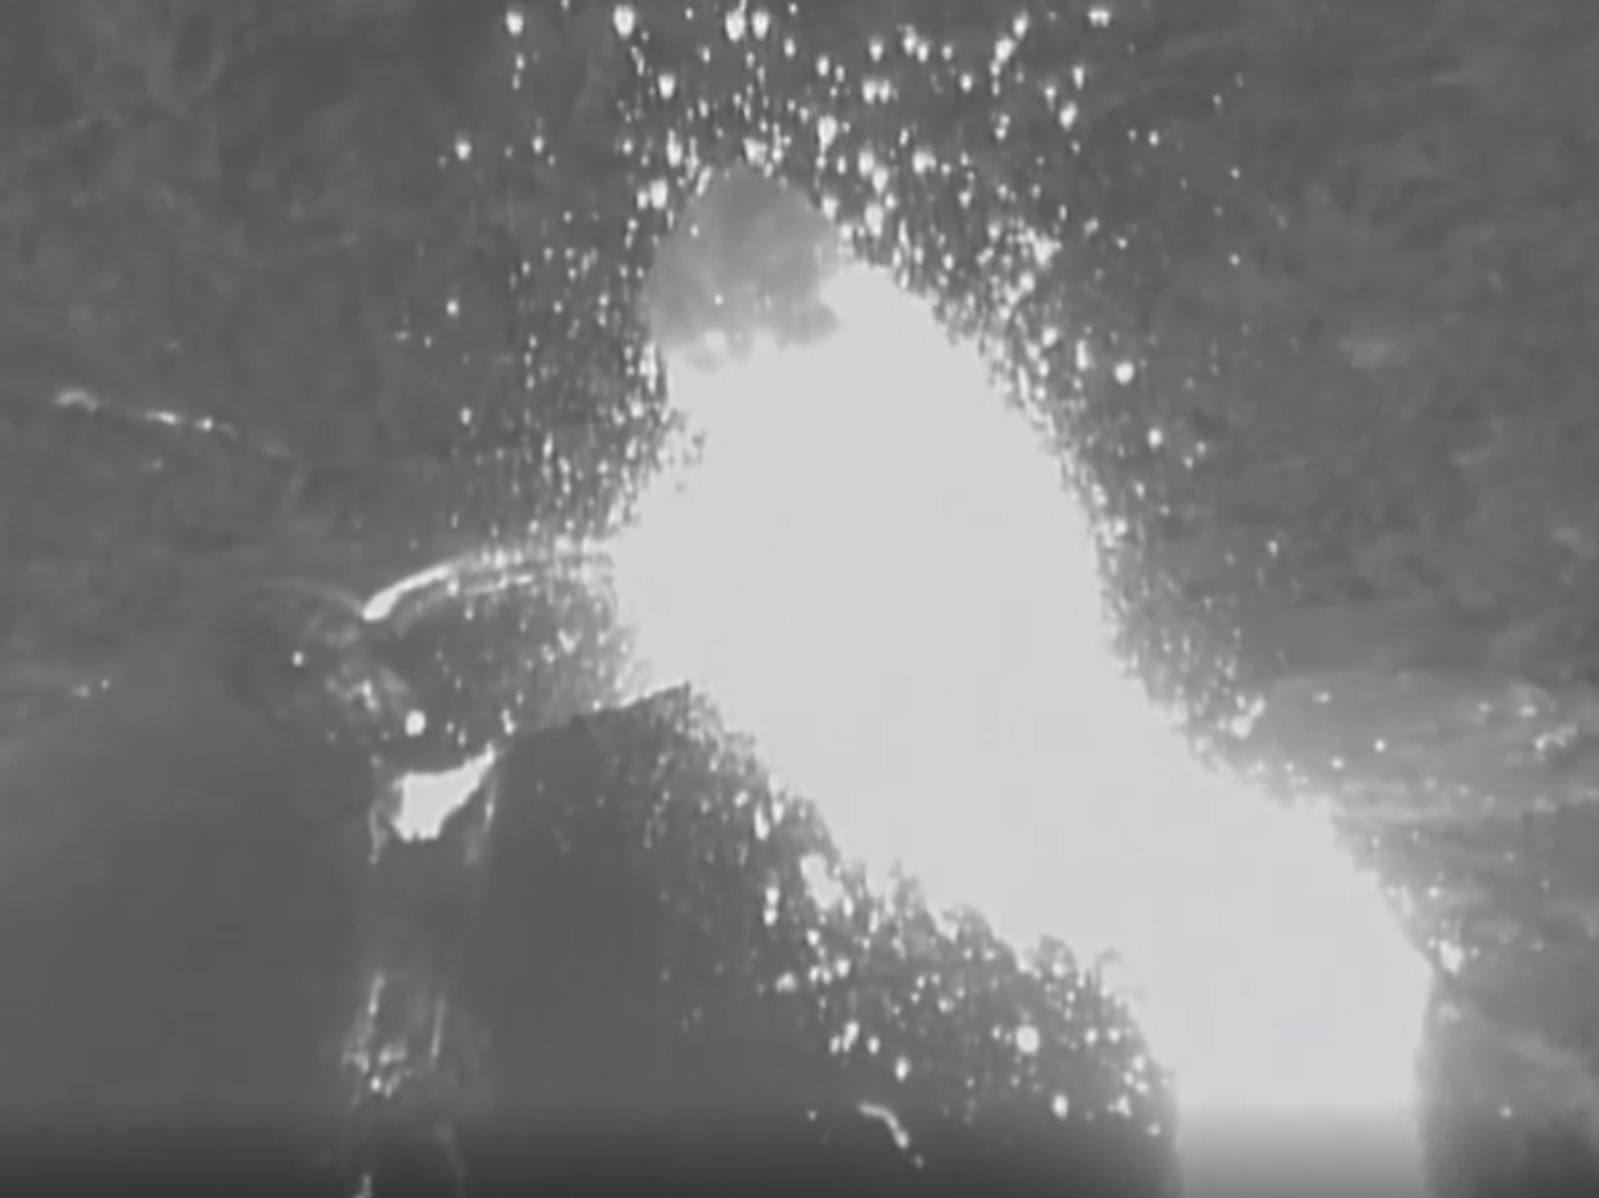 |
Figure 62. Screenshot from a thermal infrared video of the active Nishinoshima vent taken on 13 July 2018. The video shows explosions ejecting incandescent material onto the flanks of the cone and the active lava flow. Courtesy of the Japan Coast Guard. |
After the July activity, Nishinoshima again entered a phase of quiescence with activity limited to fumaroles around the vent. Himawari-8 satellite observations noted no increased thermal output following the July 2018 eruption. Thermal anomalies detected by satellite-based MODIS instruments were identified by the MODVOLC system from during 12-21 July 2018.
Information Contacts: Japan Coast Guard (JCG) Volcano Database, Hydrographic and Oceanographic Department, 3-1-1, Kasumigaseki, Chiyoda-ku, Tokyo 100-8932, Japan (URL: http://www.kaiho.mlit.go.jp/info/kouhou/h29/index.html, http://www1.kaiho.mlit.go.jp/GIJUTSUKOKUSAI/kaiikiDB/kaiyo18-e1.htm); Japan Meteorological Agency (JMA), Otemachi, 1-3-4, Chiyoda-ku Tokyo 100-8122, Japan (URL: http://www.jma.go.jp/jma/indexe.html); Hawai'i Institute of Geophysics and Planetology (HIGP) - MODVOLC Thermal Alerts System, School of Ocean and Earth Science and Technology (SOEST), Univ. of Hawai'i, 2525 Correa Road, Honolulu, HI 96822, USA (URL: http://modis.higp.hawaii.edu/).
Ongoing activity enlarges island with lava flows, ash plumes, and incandescent ejecta, December 2019-February 2020
After 40 years of dormancy, Japan’s Nishinoshima volcano, located about 1,000 km S of Tokyo in the Ogasawara Arc, erupted above sea level in November 2013. Lava flows were active through November 2015, emerging from a central pyroclastic cone. A new eruption in mid-2017 continued the growth of the island with ash plumes, ejecta, and lava flows. A short eruptive event in July 2018 produced a new lava flow and vent on the side of the pyroclastic cone. The next eruption of ash plumes, incandescent ejecta, and lava flows, covered in this report, began in early December 2019 and was ongoing through February 2020. Information is provided primarily from the Japan Meteorological Agency (JMA) monthly reports.
Nishinoshima remained quiet after a short eruptive event in July 2018 until MODVOLC thermal alerts appeared on 5 December 2019. Multiple near-daily alerts continued through February 2020. The intermittent low-level thermal anomalies seen in the MIROVA data beginning in May and June 2019 may reflect areas with increased temperatures and fumarolic activity reported by the Japan Coast Guard during overflights in June and July. The significant increase in thermal anomalies in the MIROVA data on 5 December correlates with the beginning of extrusive and explosive activity (figure 63). Eruptive activity included ash emissions, incandescent ejecta, and numerous lava flows from multiple vents that flowed into the sea down several flanks, significantly enlarging the island.
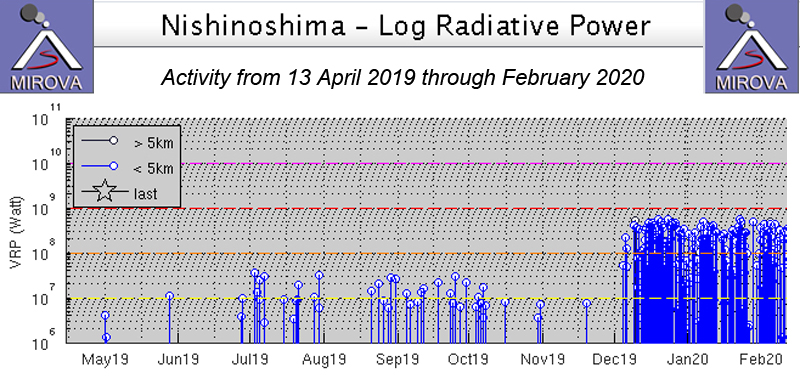 |
Figure 63. The MIROVA graph of thermal energy from Nishinoshima from 13 April 2019 through February 2020 shows low-level thermal activity beginning in mid-2019; there were reports of increased temperatures and fumarolic activity during that time. Eruptive activity including ash emissions, incandescent ejecta, and numerous lava flows began on 5 December 2019 and was ongoing through February 2020. Courtesy of MIROVA. |
A brief period of activity during 12-21 July 2018 produced explosive activity with blocks and bombs ejected 500 m from a new vent on the E flank of the pyroclastic cone, and a 700-m-long lava flow that stopped about 100 m before reaching the ocean (BGVN 43:09). No further activity was reported during 2018. During overflights on 29 and 31 January, and 7 February 2019, white steam plumes drifted from the E crater margin and inner wall of the pyroclastic cone and discolored waters were present around the island, but no other signs of activity were reported. A survey carried out by the Japan Coast Guard during 7-8 June 2019 reported minor fumarolic activity from the summit crater, and high-temperature areas were noted on the hillsides, measured by infrared thermal imaging equipment. Sulfur dioxide emissions were below the detection limit. In an overflight on 12 July 2019, Coast Guard personnel noted a small white plume rising from the E edge of the summit crater of the pyroclastic cone (figure 64).
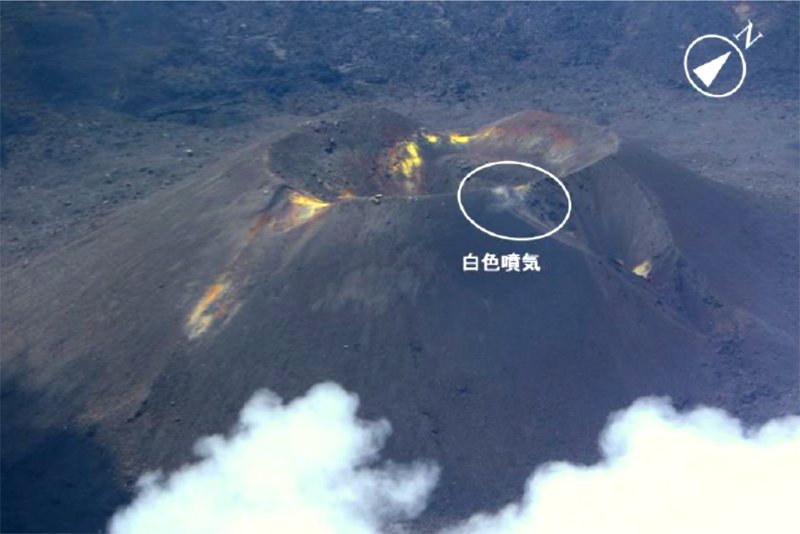 |
Figure 64. The Japan Coast Guard noted a small white plume at the summit of Nishinoshima during an overflight on 12 July 2019, but no other signs of activity. Courtesy of JMA (Volcanic activity monthly report, July 2019). |
The white plume was still present during an overflight on 14 August 2019. Greenish yellow areas of water about 500 m wide were distributed around the island, and a plume of green water extended 1.8 km from the NW coast. Similar conditions were observed on 15 October 2019; pale yellow-green discolored water was about 100 m wide and concentrated on the N shore of Nishinoshima. No steam plume from the summit was present during a visit on 19 November 2019, but yellow-white discolored water on the N shore was about 100 m wide and 700 m long. Along the NE and SE coasts, yellow-white water was 100-200 m wide and about 1,000 m long.
A MODVOLC thermal alert appeared at Nishinoshima on 5 December 2019. An eruption was observed by the Japan Coast Guard the following day. A pulsating light gray ash plume rose from the summit crater accompanied by tephra ejected 200 m above the crater rim every few minutes (figure 65). In addition, ash and tephra rose intermittently from a crater on the E flank of the pyroclastic cone, from which lava also flowed down towards the E coast (figure 66). By 1300 on 7 December the lava was flowing into the sea (figure 67).
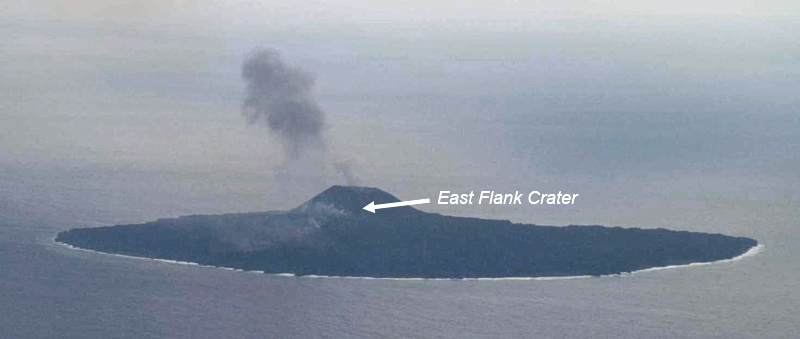 |
Figure 65. The eruption observed at Nishinoshima on 6 December 2019 included ash and tephra emissions from the summit vent, and ash, tephra, and a lava flow from the vent on the E flank of the pyroclastic cone. Courtesy of JMA (Volcanic activity monthly report, November 2019). |
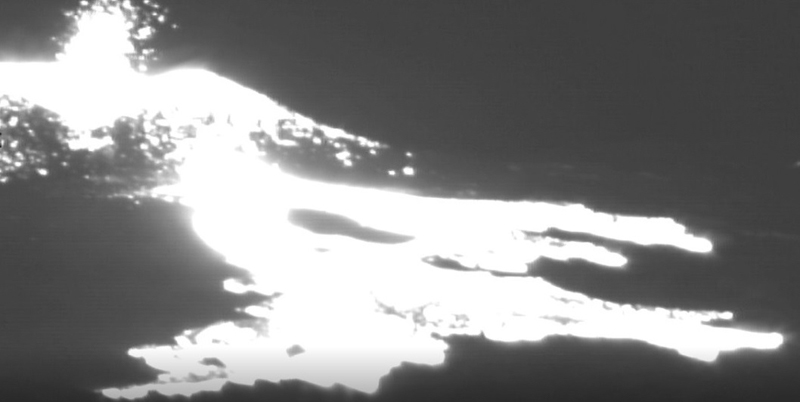 |
Figure 66. Thermal infrared imagery revealed incandescent ejecta from the summit crater and lava flowing from the E flank vent at Nishinoshima on 6 December 2019. Courtesy of JMA (Volcanic activity monthly report, November 2019). |
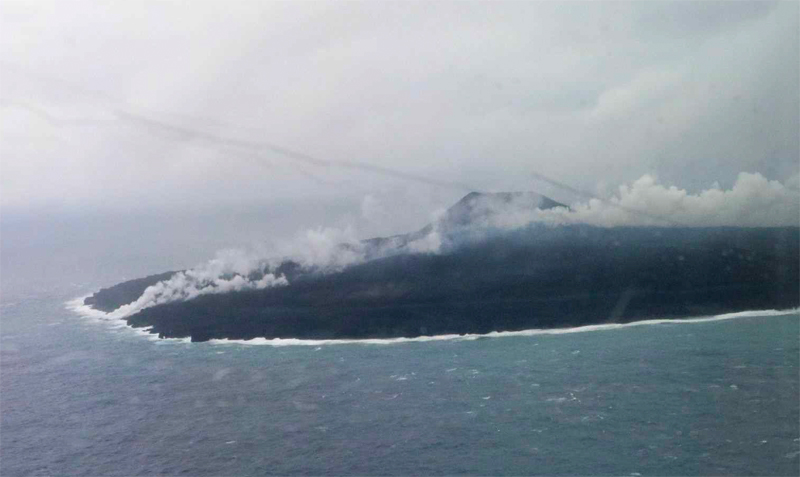 |
Figure 67. By 1300 on 7 December 2019 lava from the E-flank vent at Nishinoshima was flowing into the sea. Courtesy of JMA (Volcanic activity monthly report, November 2019). |
Observations by the Japan Coast Guard on 15 December 2019 confirmed that vigorous eruptive activity was ongoing; incandescent ejecta and ash plumes rose 300 m above the summit crater rim (figure 68). A new vent had opened on the N flank of the cone from which lava flowed NW to the sea (figure 69). The lava flow from the E-flank crater also remained active and continued flowing into the sea. The Tokyo VAAC reported an ash emission on 24 December that rose to 1,000 m altitude and drifted S. On 31 December, explosions at the summit continued every few seconds with ash and ejecta rising 300 m high. In addition, lava from the NE flank of the pyroclastic cone flowed NE to the sea (figure 70).
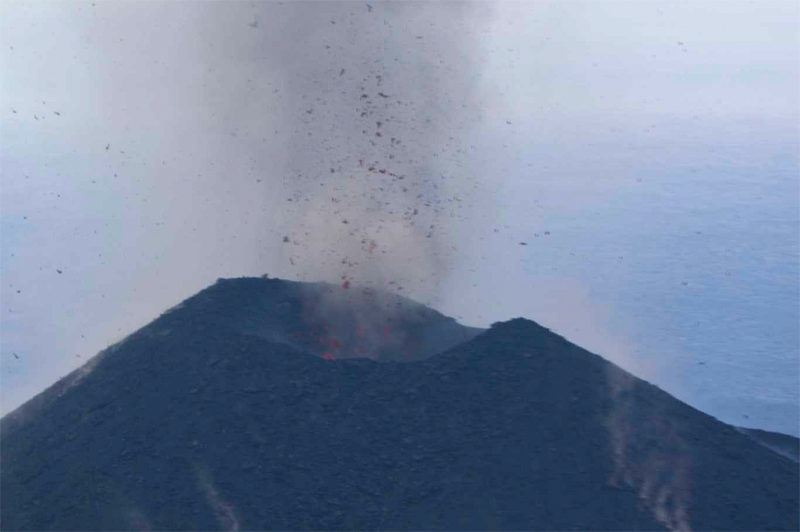 |
Figure 68. Incandescent ejecta and ash rose 300 m above the summit crater rim at Nishinoshima on 15 December 2019. Courtesy of JMA (Volcanic activity monthly report, December 2019). |
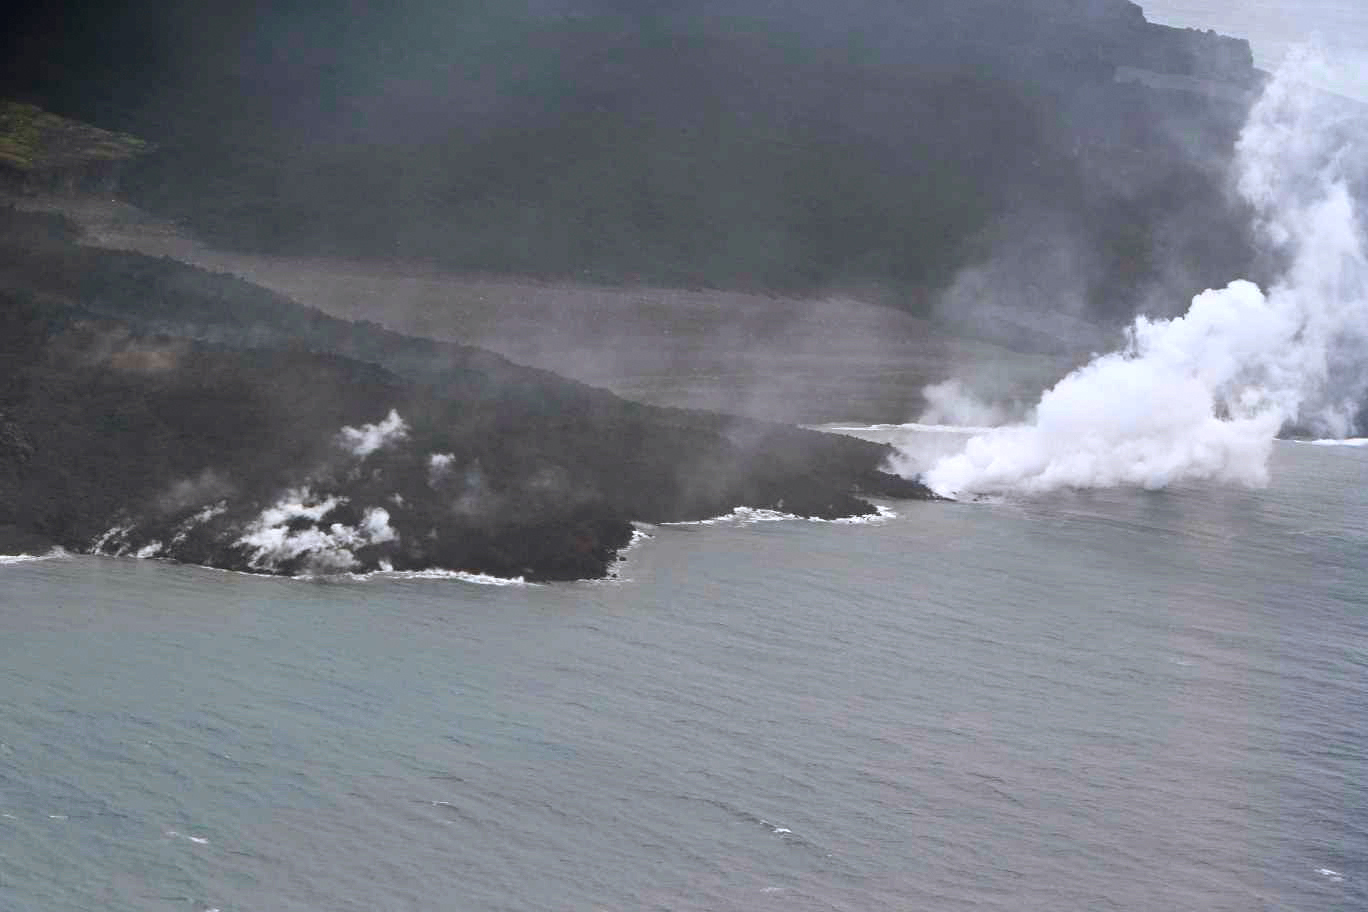 |
Figure 69. Lava from a new vent on the NW flank of Nishinoshima was entering the sea on 15 December 2019, producing vigorous steam plumes. Courtesy of JMA (Volcanic activity monthly report, December 2019). |
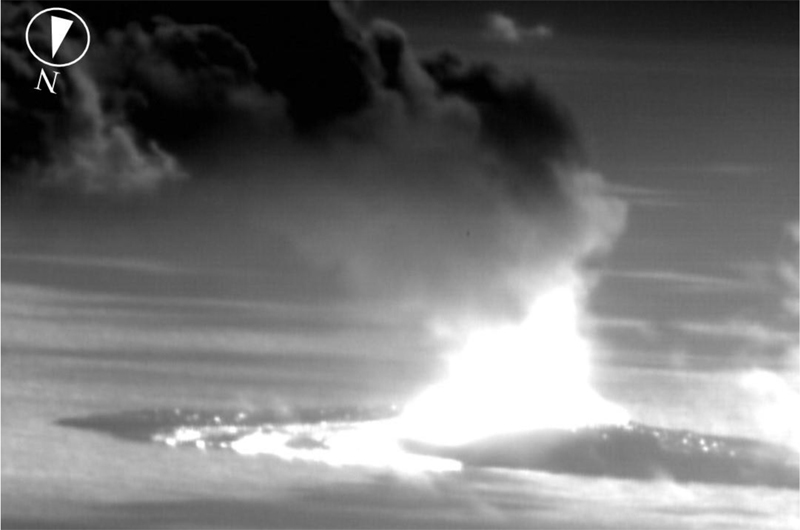 |
Figure 70. At Nishinoshima on 31 December 2019 lava flowed down the NE flank of the pyroclastic cone into the sea, and incandescent ejecta rose 300 m above summit. Courtesy of JMA and the Japan Coast Guard (Volcanic activity monthly report, December 2019). |
Satellite data from JAXA (Japan Aerospace Exploration Agency) made it possible for JMA to produce maps showing the rapid changes in topography at Nishinoshima resulting from the new lava flows. The new E-flank lava flow was readily seen when comparing imagery from 22 November with 6 December 2019 (figure 71a). An image from 6 December compared with 20 December 2019 shows the flow on the E flank splitting and entering the sea at two locations (figure 71b), the flow on the NW flank traveling briefly N before turning W and forming a large fan into the ocean on the W flank, and a new flow heading NE from the summit area of the pyroclastic cone.
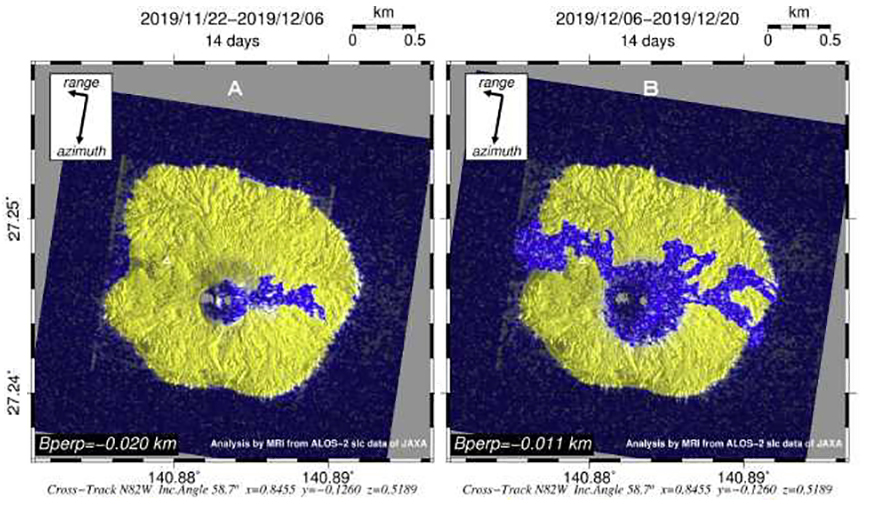 |
Figure 71. Satellite data from JAXA (Japan Aerospace Exploration Agency) made it possible to produce maps showing the changes in topography at Nishinoshima resulting from the new lava flows (shown in blue). In comparing 22 November with 6 December 2019 (A, left), the new lava flow on the E flank was visible. A new image from 20 December compared with 6 December (B, right) showed the flow on the E flank splitting and entering the sea at two locations, the NW-flank flow building a large fan into the ocean on the W flank, and a new flow heading NE from the summit area of the pyroclastic cone. Courtesy of JMA and the Japan Coast Guard (Volcanic activity monthly report, December 2019). |
The Tokyo VAAC reported an ash plume visible in satellite imagery on 15 January 2020 that rose to 1.8 km altitude and drifted SE. The Japan Coast Guard conducted an overflight on 17 January that confirmed the continued eruptions of ash, incandescent ejecta, and lava. Dark gray ash plumes were observed at 1.8 km altitude, with ashfall and tephra concentrated around the pyroclastic cone (figure 72). Plumes of steam were visible where the NE lava flow entered the ocean; the E and NW lava entry areas did not appear active but were still hot. Satellite data from ALOS-2 prepared by JAXA confirmed ongoing activity around the summit vent and on the NE flank, while activity on the W flank had ceased (figure 73). An ash plume was reported by the Tokyo VAAC on 25 January; it rose to 1.5 km altitude and drifted SW for most of the day.
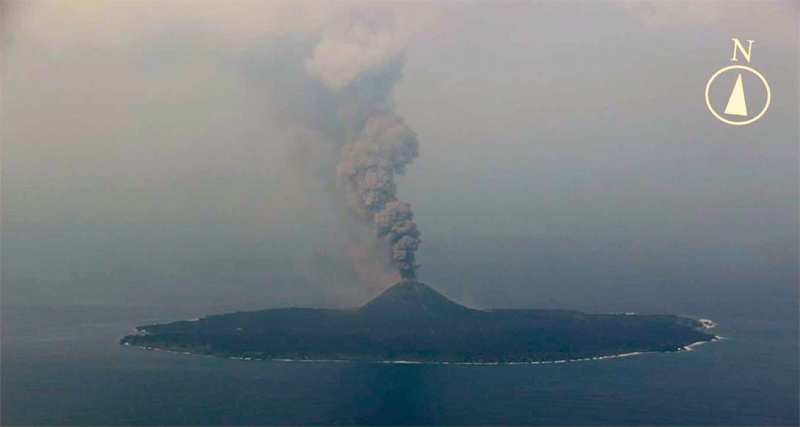 |
Figure 72. Dense, dark gray ash plumes rose from the summit of Nishinoshima on 17 January 2020. Small plumes of steam from lava-seawater interactions were visible on the NE shore of the island as well (far right). Courtesy of JMA and the Japan Coast Guard (Volcanic activity monthly report, January 2020). |
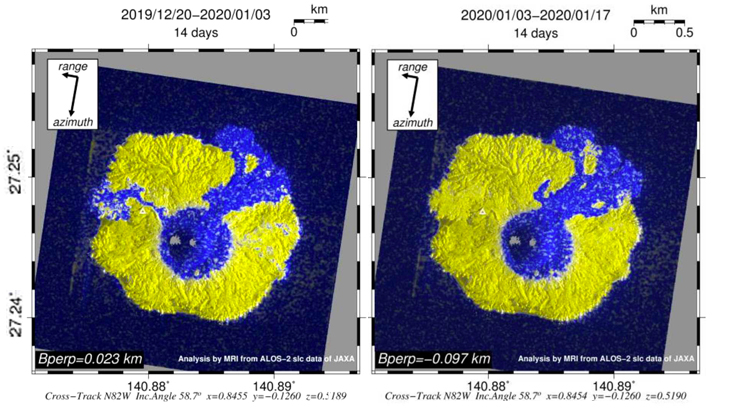 |
Figure 73. JAXA satellite data from 3 January 2020 (left) showed the growth of a new lava delta on the NE flank of Nishinoshima and minor activity occuring on the W flank compared with the previous image from 20 December 2019. By 17 January 2020 (right), the lava flow activity was concentrated on the NE flank with multiple deltas extending out into the sea. The ‘low correlation areas’ shown in blue represent changes in topography caused by new material from lava flows and ejecta added between the dates shown above the images. Courtesy of JMA (Volcanic activity monthly report, January 2020). |
On 3 Feburary 2020 the Tokyo VAAC reported an ash plume visible in satellite imagery that rose to 2.1 km altitude and drifted E. The following day the Japan Coast Guard observed eruptions from the summit crater at five minute intervals that produced grayish white plumes. The plumes rose to 2.7 km altitude (figure 74). Large bombs were scattered around the pyroclastic cone, and the summit crater appeared filled with lava except for the active vent. The lava deltas on the NE flank were only active at the tips of the flows producing a few steam jets where lava entered the sea. The active flows were on the SE flank, and a new 200-m-long lava flow was flowing down the N flank of the pyroclastic cone (figure 75). The lava flowing from the E flank of the pyroclastic cone to the SE into the sea, produced larger jets of steam (figure 76). Yellow-brown discolored water appeared around the island in several places.
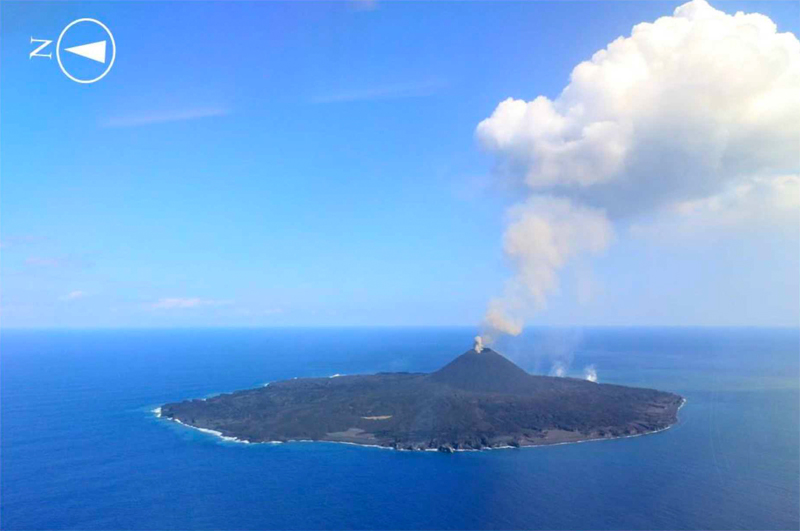 |
Figure 74. Ash emissions at Nishinoshima rose to 2.7 km altitude on 4 February 2020; steam jets from lava entering the ocean were active on the SE flank (far side of the island, right). Courtesy of JMA (Volcanic activity monthly report, February 2020). |
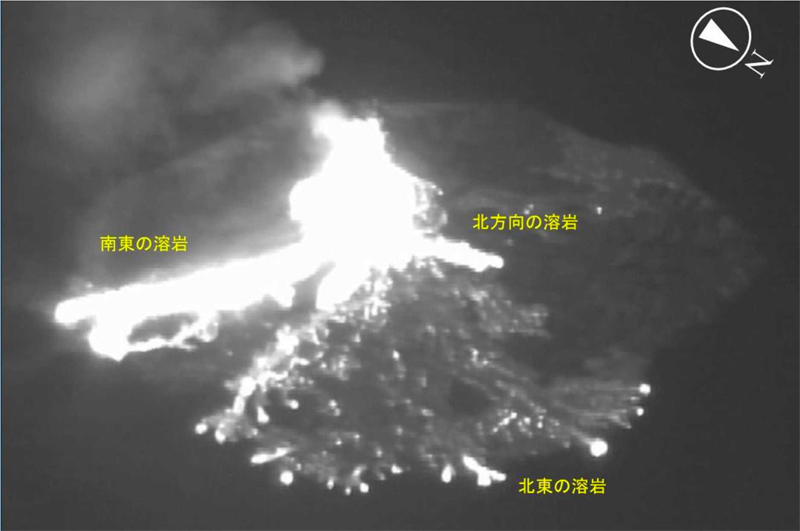 |
Figure 75. The lava deltas on the NE flank of Nishinoshima (bottom center) were much less active on 4 February 2020 than the lava flow and growing delta on the SE flank (left). The newest flow headed N from the summit and was 200 m long (right of center). Courtesy of JMA and the Japan Coast Guard (Volcanic activity monthly report, February 2020). |
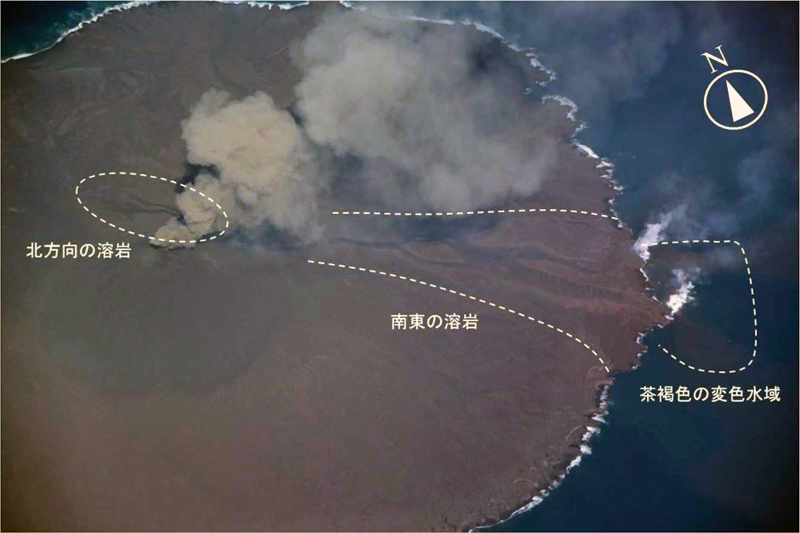 |
Figure 76. The most active lava flows at Nishinoshima on 4 February 2020 were on the E flank; significant steam plumes rose in multiple locations along the coast where they entered the sea. Intermittent ash plumes also rose from the summit crater. Courtesy of JMA and Japan Coast Guard (Volcanic activity monthly report, February 2020). |
JAXA satellite data confirmed that the flow activity was concentrated on the NE flank and shore during the second half of January 2020, but also recorded the new flow down the SE flank that was observed by the Coast Guard in early February. By mid-February the satellite topographic data indicated the decrease in activity in the NE flank flows, the increased activity on the SE and E flank, and the extension of the flow moving due N to the coast (figure 77). Observations on 17 February 2020 by the Japan Coast Guard revealed eruptions from the summit crater every few seconds, and steam-and-ash plumes rising about 600 m. Vigorous white emissions rose from fractures near the top of the W flank of the pyroclastic cone, but thermal data indicated the area was no hotter than the surrounding area (figure 78). The lava flow on the SE coast still had steam emissions rising from the ocean entry point, but activity was weaker than on 4 February. The newest flow moving due N from the summit produced steam emissions where the flow front entered the ocean.
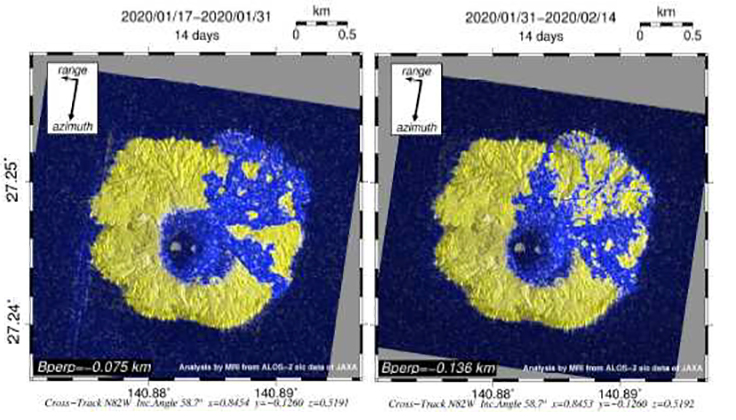 |
Figure 77. Constantly changing lava flows at Nishinoshima reshaped the island during late January and February 2020. During the second half of January, flows were active on the NE flank, creating deltas into the sea off the NE coast and also on the SE flank into the sea at the SE coast (left). The ‘low correlation areas’ shown in blue represent changes in topography caused by new material from lava flows and ejecta added between the dates shown above the images. By 14 February (right) activity had slowed on the NE flank and expanded on the SE flank and N flank. Data is from the Land Observing Satellite-2 "Daichi-2" (ALOS-2). Courtesy of JMA and JAXA (Volcanic activity monthly report, February 2020). |
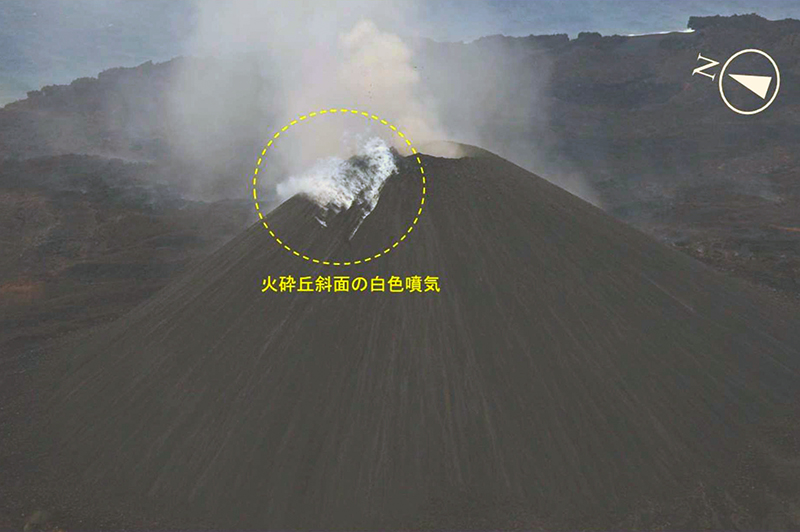 |
Figure 78. Vigorous white emissions rose from fractures near the top of the W flank of the pyroclastic cone at Nishinoshima on 17 February 2020, but thermal data indicated the area was no hotter than the surrounding area. Courtesy of JMA and Japan Coast Guard (Volcanic activity monthly report, February 2020). |
Sulfur dioxide plumes from Nishinoshima have been small and infrequent in recent years, but the renewed and increased eruptive activity beginning in December 2019 produced several small SO2 plumes that were recorded in daily satellite data (figure 79).
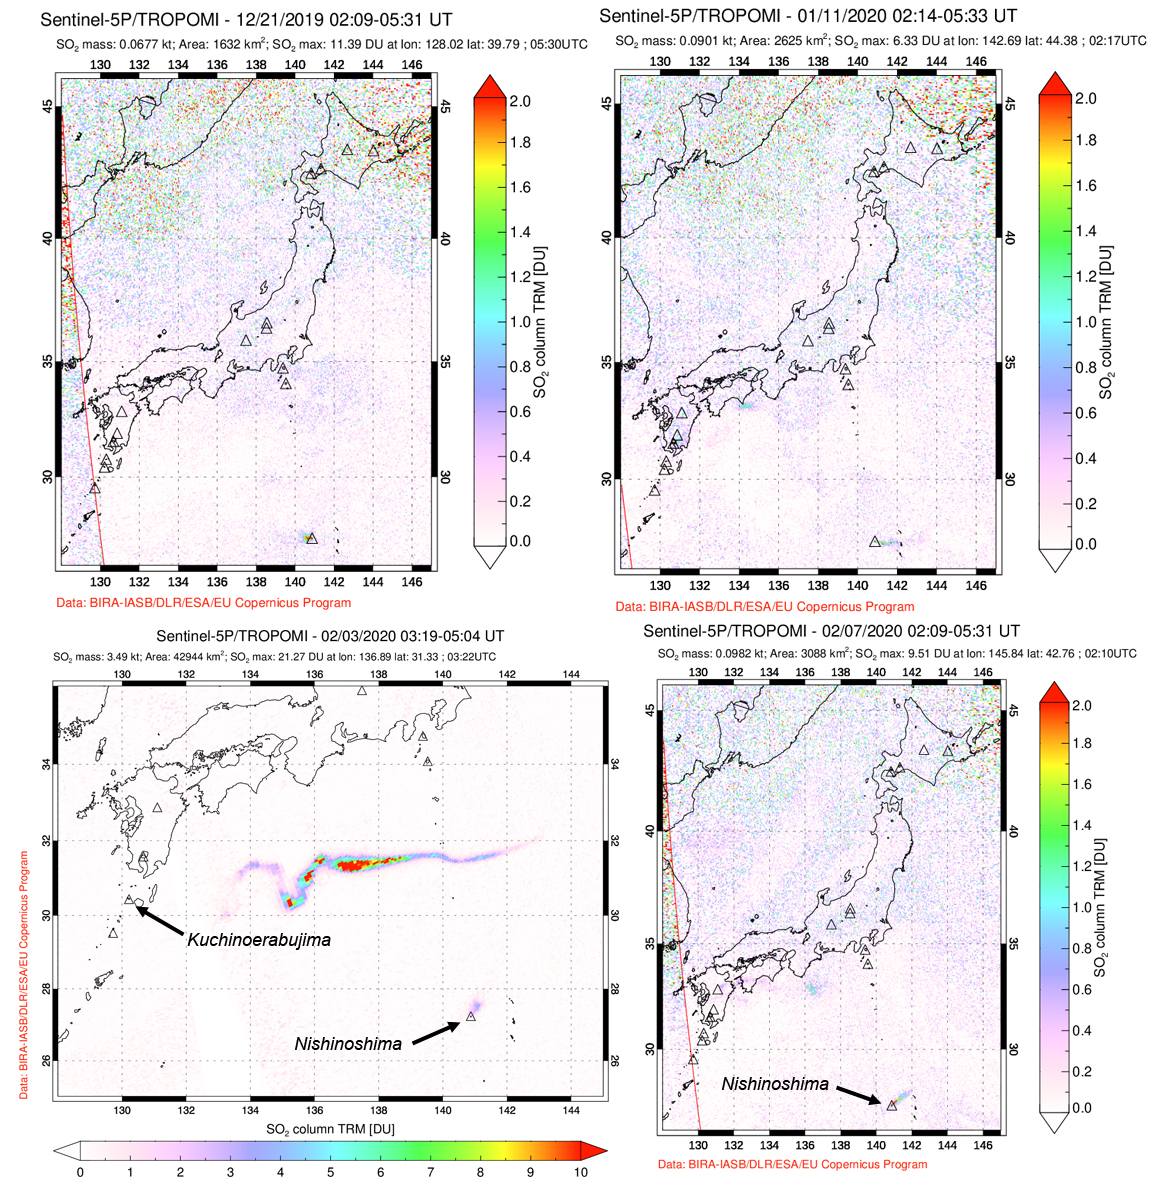 |
Figure 79. Small sulfur dioxide plumes from Nishinoshima were captured by the TROPOMI instrument on the Sentinel 5P satellite a few times during December 2019-February 2020 as the eruptive activity increased. The large red streak in the 3 February 2020 image is SO2 from an eruption of Kuchinoerabujima volcano (Ryukyu Islands) on the same day. Courtesy of NASA Goddard Space Flight Center and Simon Carn. |
Information Contacts: Japan Meteorological Agency (JMA), Otemachi, 1-3-4, Chiyoda-ku Tokyo 100-8122, Japan (URL: http://www.jma.go.jp/jma/indexe.html); Japan Aerospace Exploration Agency-Earth Observation Research Center (JAXA-EORC), 7-44-1 Jindaiji Higashi-machi, Chofu-shi, Tokyo 182-8522, Japan (URL: http://www.eorc.jaxa.jp/); Japan Coast Guard (JCG) Volcano Database, Hydrographic and Oceanographic Department, 3-1-1, Kasumigaseki, Chiyoda-ku, Tokyo 100-8932, Japan (URL: http://www.kaiho.mlit.go.jp/info/kouhou/h29/index.html, http://www1.kaiho.mlit.go.jp/GIJUTSUKOKUSAI/kaiikiDB/kaiyo18-e1.htm); MIROVA (Middle InfraRed Observation of Volcanic Activity), a collaborative project between the Universities of Turin and Florence (Italy) supported by the Centre for Volcanic Risk of the Italian Civil Protection Department (URL: http://www.mirovaweb.it/); Tokyo Volcanic Ash Advisory Center (VAAC), 1-3-4 Otemachi, Chiyoda-ku, Tokyo, Japan (URL: http://ds.data.jma.go.jp/svd/vaac/data/); Global Sulfur Dioxide Monitoring Page, Atmospheric Chemistry and Dynamics Laboratory, NASA Goddard Space Flight Center (NASA/GSFC), 8800 Greenbelt Road, Goddard, Maryland, USA (URL: https://so2.gsfc.nasa.gov/); Simon Carn, Geological and Mining Engineering and Sciences, Michigan Technological University, 1400 Townsend Drive, Houghton, MI 49931, USA (URL: http://www.volcarno.com/, Twitter: @simoncarn).
Major June-July eruption of lava, ash, and sulfur dioxide; activity declines in August 2020
Japan’s Nishinoshima volcano, located about 1,000 km S of Tokyo in the Ogasawara Arc, erupted above sea level in November 2013 after 40 years of dormancy. Activity lasted through November 2015 and returned during mid-2017, continuing the growth of the island with ash plumes, ejecta, and lava flows. A short eruptive event in July 2018 produced a small lava flow and vent on the side of the pyroclastic cone. The next eruption of ash plumes, incandescent ejecta, and lava flows began in early December 2019, resulting in significant growth of the island. This report covers the ongoing activity from March-August 2020 when activity decreased. Information is provided primarily from Japan Meteorological Agency (JMA) monthly reports and the Japan Coast Guard (JCG), which makes regular overflights to make observations.
Renewed eruptive activity that began on 5 December 2019 continued during March-August 2020 but appeared to wane by the end of August. Major lava flows covered all sides of the island, with higher levels of activity during late June and early July. Ash emissions increased significantly during June and produced dense black ash plumes that rose up to 6 km altitude in early July. Explosive activity produced lightning and incandescent jets that rose 200 m and large bombs that fell to the base of the pyroclastic cone. Lava flow activity diminished at the end of July. Ash emissions decreased throughout August and appeared to cease after 27 August 2020. The MIROVA plot clearly reflects the high levels of thermal activity between December 2019 and August 2020 (figure 80); this event was reported by JMA as the largest eruption recorded to date. Sulfur dioxide emissions were very high during late June through early August, producing emissions that drifted across much of the western Pacific region.
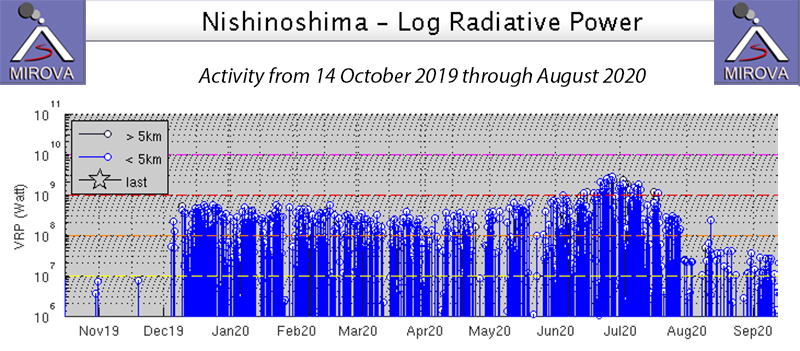 |
Figure 80. The MIROVA plot of thermal activity at Nishinoshima from 14 October 2019 through August 2020 indicates the high levels between early December 2019 and late July 2020 that resulted from the eruption of numerous lava flows on all flanks of the pyroclastic cone, significantly enlarging the island. Courtesy of MIROVA. |
The Japan Coast Guard (JCG) conducted overflights of Nishinoshima on 9 and 15 March 2020 (figure 81). During both visits they observed eruptive activity from the summit crater, including ash emissions that rose to an altitude of approximately 1,000 m and lava flowing down the N and SE flanks (figure 82). Large ejecta was scattered around the base of the pyroclastic cone. The lava flowing north had reached the coast and was producing vigorous steam as it entered the water on 9 March; whitish gas emissions were visible on the N flank of the cone at the source of the lava flow (figure 83). On 9 March yellow-green discolored water was noted off the NE shore. The lava flow on the SE coast produced a small amount of steam at the ocean entry point and a strong signal in thermal imagery on 15 March (figure 84). Multiple daily MODVOLC thermal alerts were issued during 1-10, 17-24, and 27-30 March. Landsat-8 visual and thermal imagery on 30 March 2020 confirmed that thermal anomalies on the N and SE flanks of the volcano continued.
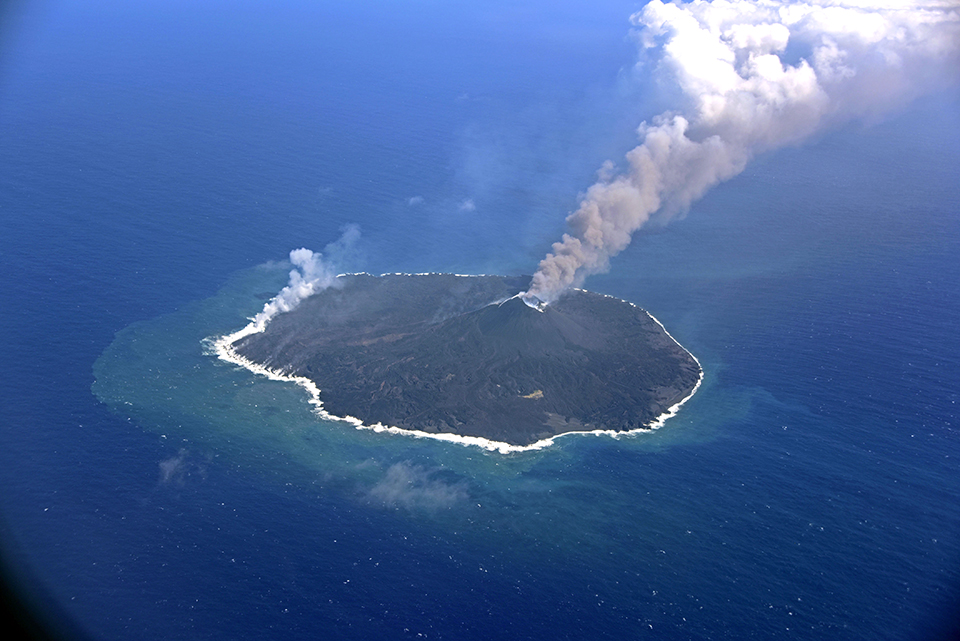 |
Figure 81. The Japan Coast Guard conducted an overflight of Nishinoshima on 9 March 2020 and observed ash emissions rising 1,000 m above the summit and lava flowing into the ocean off the N flank of the island. Courtesy of Japan Coast Guard (JCG) and JMA. |
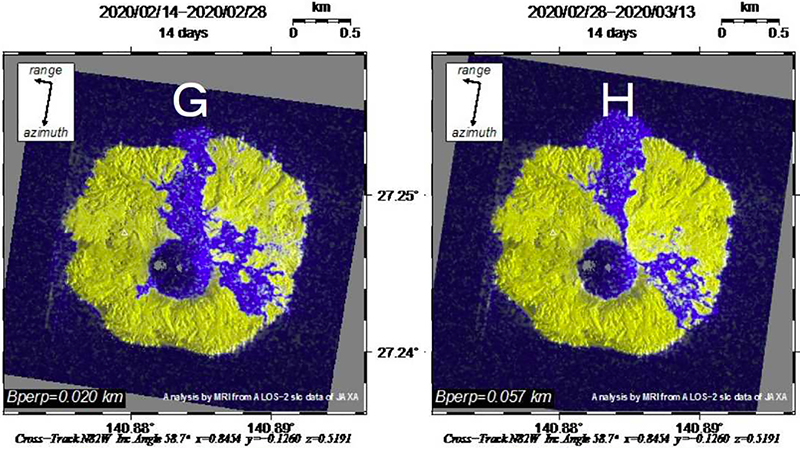 |
Figure 82. Lava flows at Nishinoshima during February and March 2020 were concentrated on the N and SE flanks. The areas in blue indicate topographical changes due to lava flows and pyroclastic deposits from the previous measurement. The growth of the SE-flank flow decreased during March while the N-flank flow rate increased significantly. Left image shows changes between 14 and 28 February and right image shows the differences between 28 February and 13 March. The correlated image analysis uses ALOS-2 / PALSAR-2 and is carried out with the cooperation of JAXA through the activities of the Satellite Analysis Group of the Volcano Eruption Prediction Liaison Committee. The software was developed by the Japan National Research Institute for Earth Science and Disaster Prevention and uses the technical data C1-No 478 of the Geospatial Information Authority of Japan. Courtesy of JAXA and JMA (Volcanic activity commentary material on Nishinoshima, March 2020). |
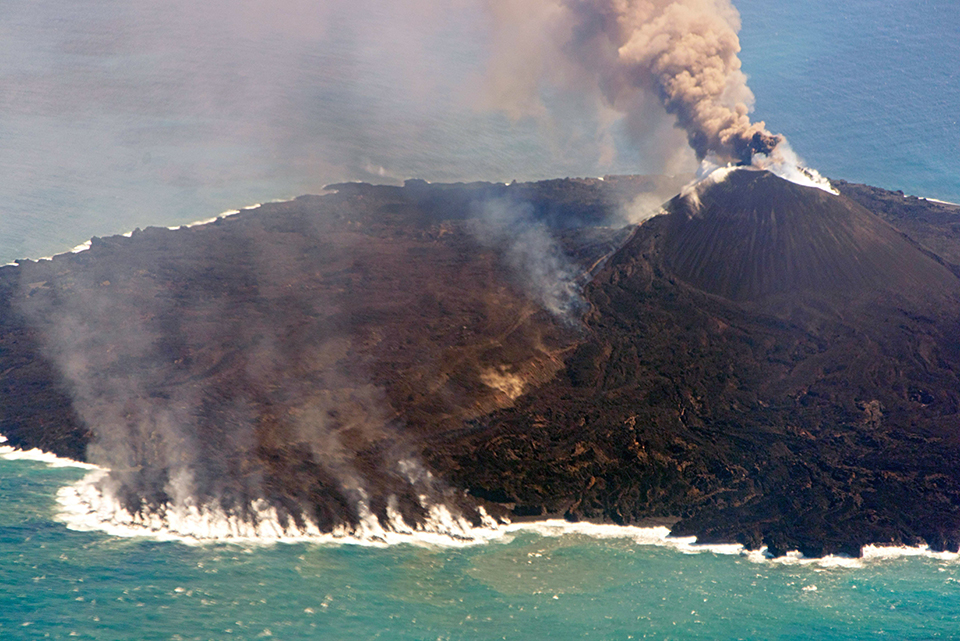 |
Figure 83. Vigorous steam emissions on the N flank of Nishinoshima on 9 March 2020 were caused by the active flow on the N flank. Whitish steam and gas midway up the flank indicated the outlet of the flow. Ash emissions rose from the summit crater and drifted E. Courtesy of Japan Coast Guard and JMA. |
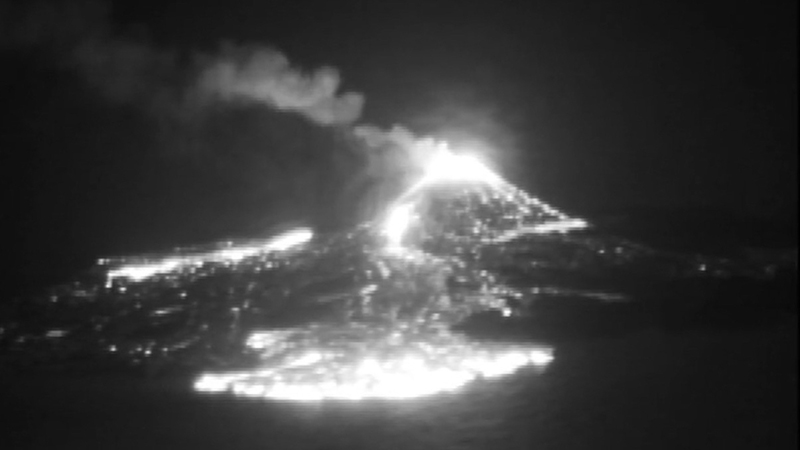 |
Figure 84. Infrared imagery from 15 March 2020 at Nishinoshima showed the incandescent lava flow on the SE flank (foreground), blocks of ejecta scattered around the summit and flanks of the pyroclastic cone, and the active N-flank flow (left). Courtesy of Japan Coast Guard and JMA. |
Ash emissions were not observed at Nishinoshima during JCG overflights on 6, 16, and 19 April 2020, but gas-and-steam emissions were noted from the summit crater, and a yellow discoloration interpreted by JMA to be sulfur precipitation was observed near the top of the pyroclastic cone. The summit crater was larger than during previous visits. Steam plumes seen each of those days on the N and NE coasts suggested active ocean entry of lava flows (figure 85). A lava flow was observed emerging from the E flank of the cone and entering the ocean on the E coast on 19 and 29 April (figure 86). During the overflight on 29 April observers noted lava flowing southward from a vent on the E flank of the pyroclastic cone. A narrow, brown, ash plume was visible on 29 April at the summit crater rising to an altitude of about 1,500 m. Thermal observations indicated continued flow activity throughout the month. Multiple daily MODVOLC thermal alerts were recorded during 2-6, 10-11, 17-23, and 28-30 April. Significant growth of the pyroclastic cone occurred between early February and late April 2020 (figure 87).
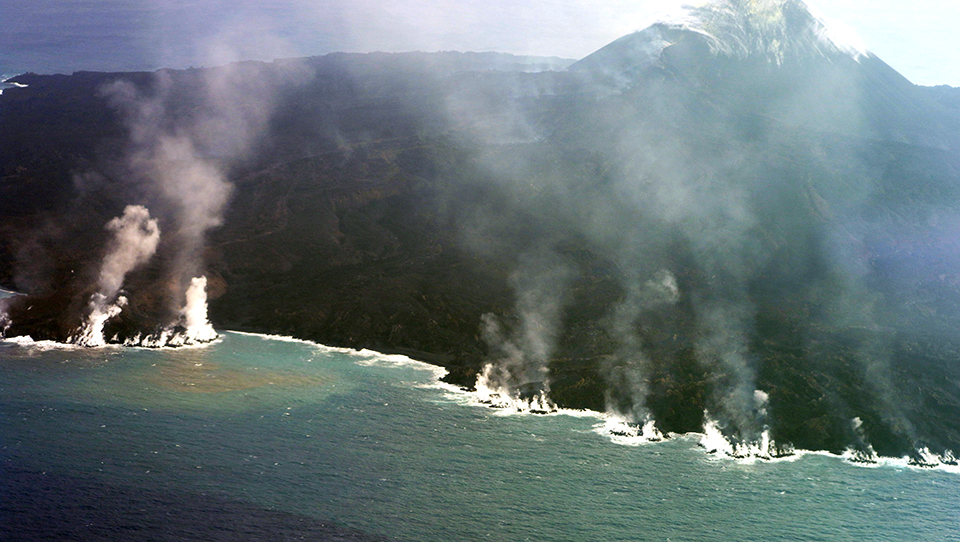 |
Figure 85. Multiple entry points of lava flowed into the ocean producing jets of steam along the N flank of Nishinoshima on 6 April 2020. Courtesy of JCG and JMA. |
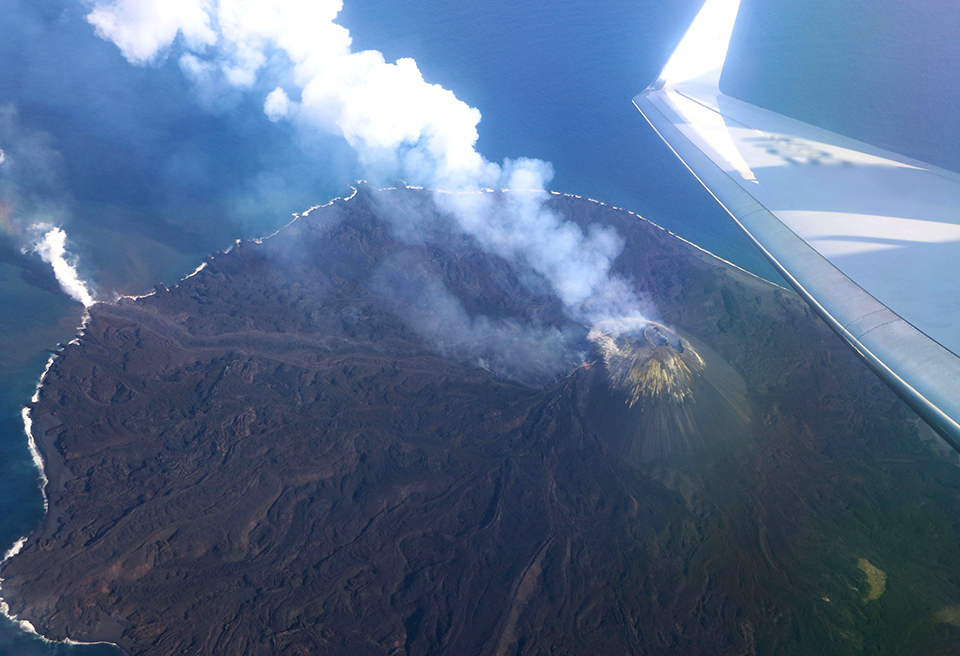 |
Figure 86. Lava flowed down the E flank of Nishinoshima from a vent below the summit on 19 April 2020. The ocean entry produced a vigorous steam plume (left). Courtesy of JCG. |
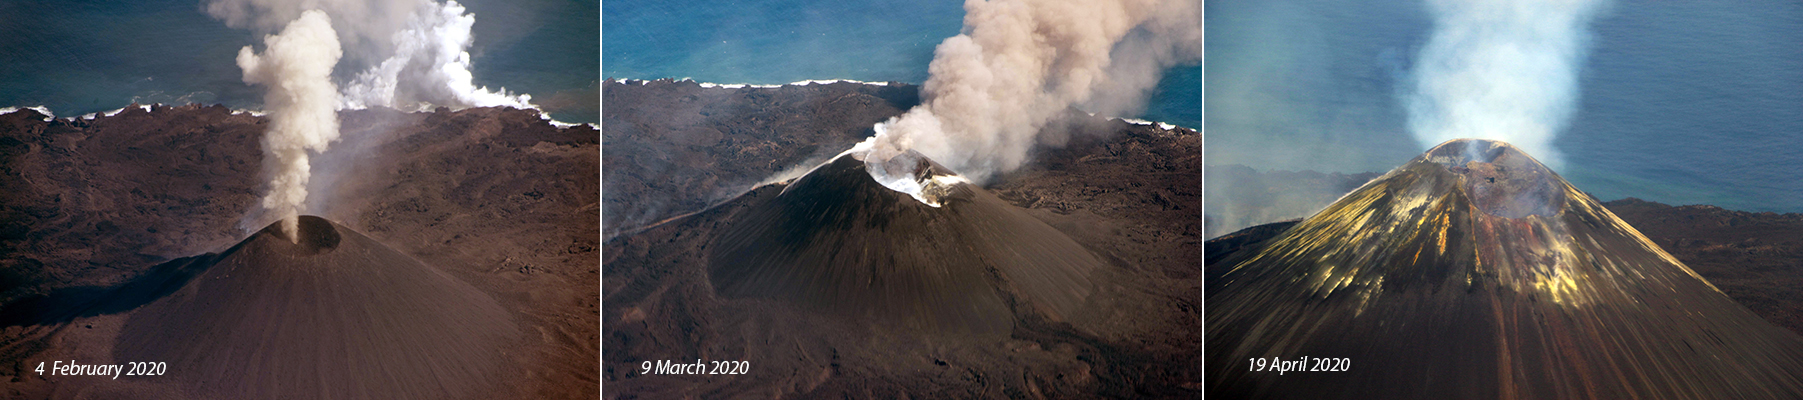 |
Figure 87. The pyroclastic cone at Nishinoshima grew significantly in size between 4 February (left), 9 March (middle), and 19 April 2020 (right). View is to the E. Courtesy of JMA and JCG. |
Infrared satellite imagery from 17 May 2020 showed a strong thermal anomaly at the summit and hot spots on the NW flank indicative of flows. Visible imagery confirmed emissions at the summit and steam plumes on the NW flank (figure 88). Gray ash plumes rose to about 1,800 m altitude on 18 May during the only overflight of the month made by the Japan Coast Guard. In addition, white gas emissions rose from around the summit area and large blocks of ejecta were scattered around the base of the pyroclastic cone (figure 89). Steam from ocean-entry lava on the N flank was reduced from previous months, but a new flow moving NW into the ocean was generating a steam plume and a strong thermal signature. Multi-pixel thermal alerts were measured by the MODVOLC system on 1-3, 9-10, 13-15, 18, and 26-30 May. Sulfur dioxide emissions had been weak and intermittent from March through early May 2020 but became more persistent during the second half of May. Although modest in size, the plumes were detectible hundreds of kilometers away from the volcano (figure 90).
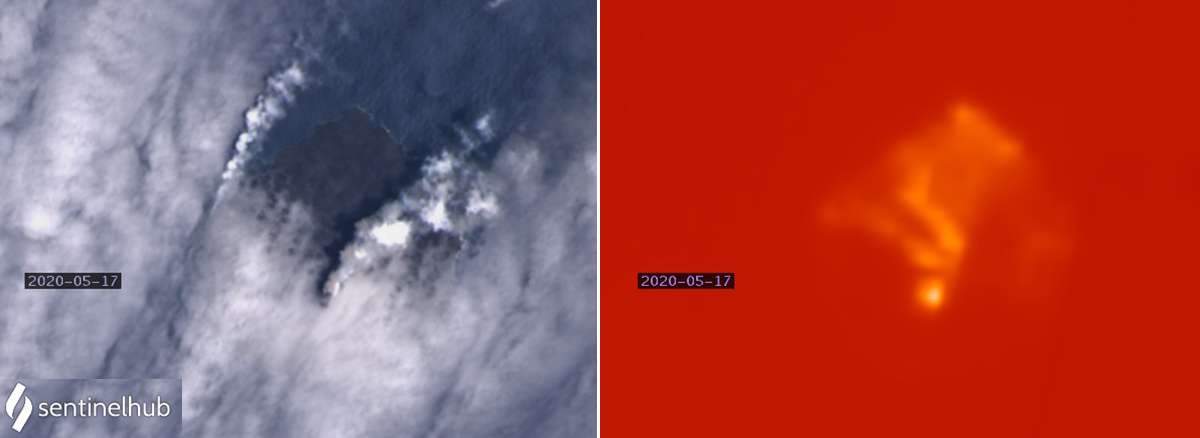 |
Figure 88. Landsat-8 satellite imagery of Nishinoshima from 17 May 2020 confirmed continued eruptive activity. Visible imagery showed emissions at the summit and steam plumes on the NW flank (left) and infrared imagery showed a strong thermal anomaly at the summit and anomalies on the NW flank indicative of lava flows (right). Courtesy of Sentinel Hub Playground. |
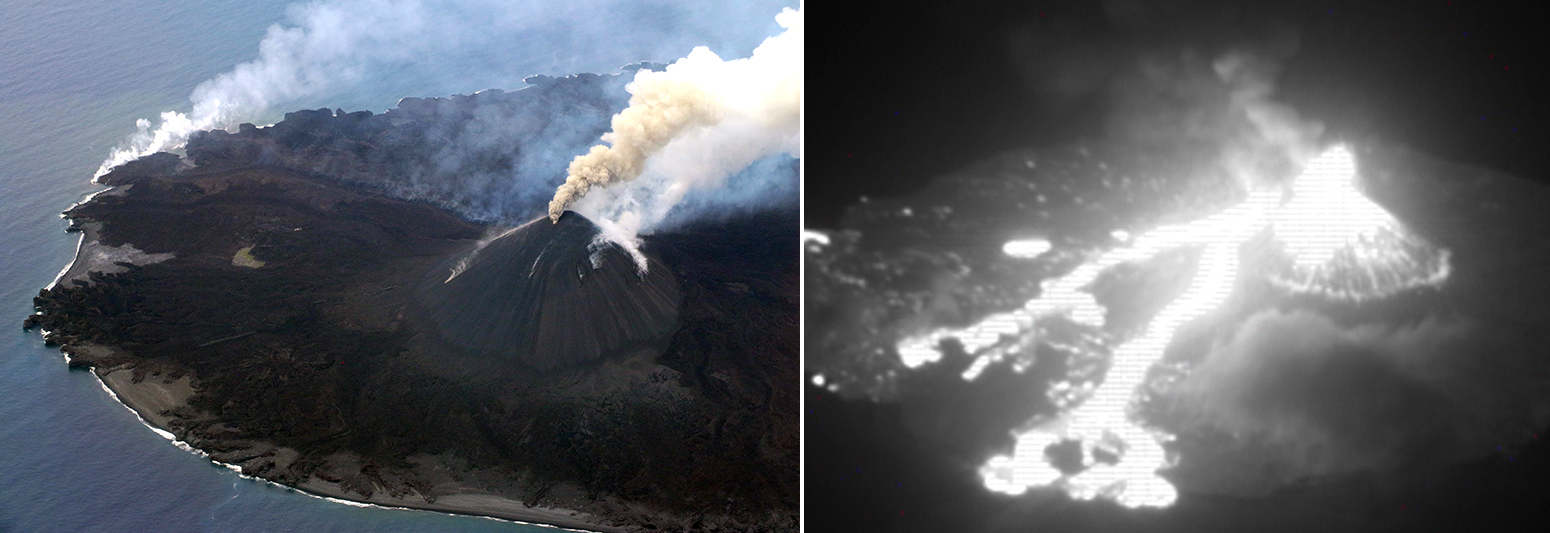 |
Figure 89. Lava continued to enter the ocean at Nishinoshima during May 2020. A new lava flow on the NW flank produced a strong steam plume at an ocean entry (left) on 18 May 2020. In addition to a light gray plume of gas and ash, steaming blocks of ejecta were visible on the flanks of the pyroclastic cone. The strong thermal signature of the NW-flank flow in infrared imagery that same day showed multiple new lobes flowing to the ocean (right). Courtesy of JCG and JMA. |
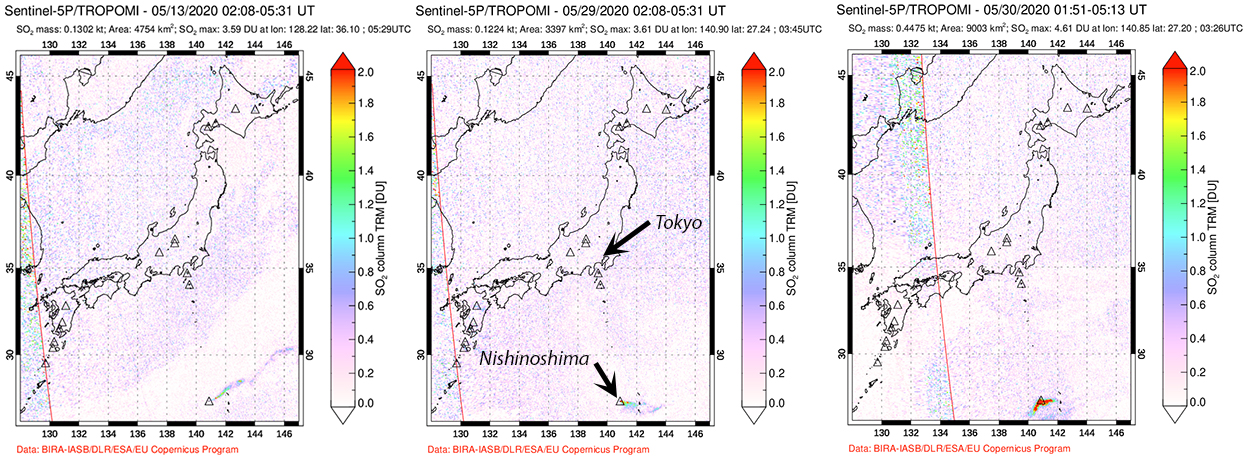 |
Figure 90. Small but distinct SO2 emissions from Nishinoshima were recorded by the TROPOMI instrument on the Sentinel-5P satellite during the second half of May 2020. The plumes drifted tens to hundreds of kilometers away from the volcano in multiple directions as the wind directions changed. Nishinoshima is about 1,000 kilometers S of Tokyo. Courtesy of NASA Global Sulfur Dioxide Monitoring Page. |
Activity increased significantly during June 2020. Satellite imagery from 2 June revealed two intense thermal anomalies at the summit indicating a new crater, and lava flows active on the NW and NE flanks, all showing gas or steam emissions (figure 91). Dense brown and gray ash emissions were observed rising from the summit crater during JCG overflights on 7 and 15 June (figure 92). Plumes reached at least 1,500 m altitude, and ejecta reached the base of the pyroclastic cone. Between 5 and 19 June the lava flow on the WNW coast slowed significantly, while the flows to the N and E became significantly more active (figure 93). The Tokyo VAAC reported the first ash plume since mid-February on 12 June rose to 2.1 km and drifted NE. On 14 June they reported an ash plume extending E at 2.7 km altitude. Dense emissions continued to drift N and E at 2.1-2.7 km altitude until the last week of the month. The JCG overflight on 19 June observed darker ash emissions than two weeks earlier that drifted at least 180 km NE (figure 94) and incandescent tephra that exploded from the enlarged summit area where three overlapping craters trending E-W had formed.
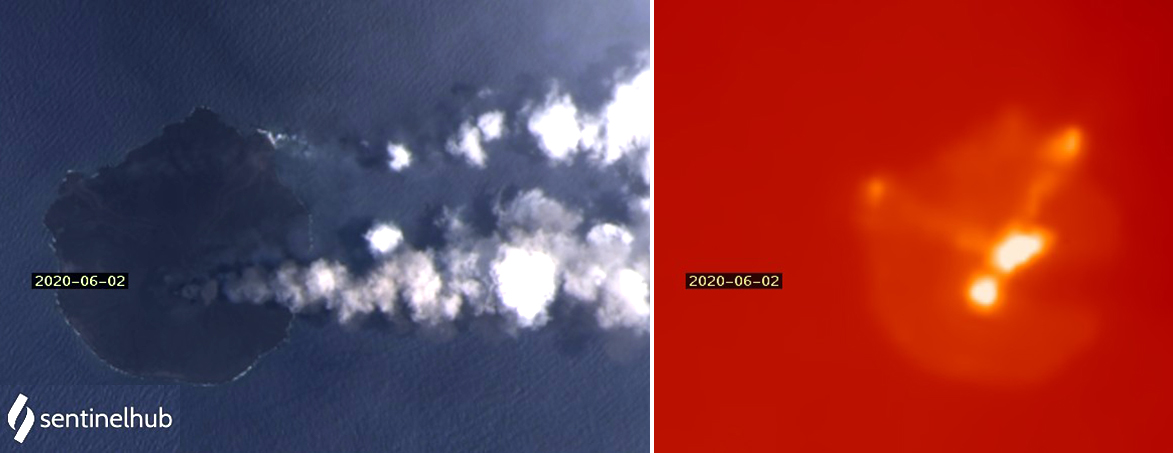 |
Figure 91. Landsat-8 satellite imagery on 2 June 2020 confirmed ongoing activity at Nishinoshima. Lava produced ocean-entry steam on the NE coast; a weak plume on the NW coast suggested reduced activity in that area (left). In addition, a dense steam plume drifted E from the summit, while a fainter plume adjacent to it also drifted E. The infrared image (right) indicated two intense anomalies at the summit, and weaker anomalies from lava flows on the NW and NE flanks. Courtesy of Sentinel Hub Playground. |
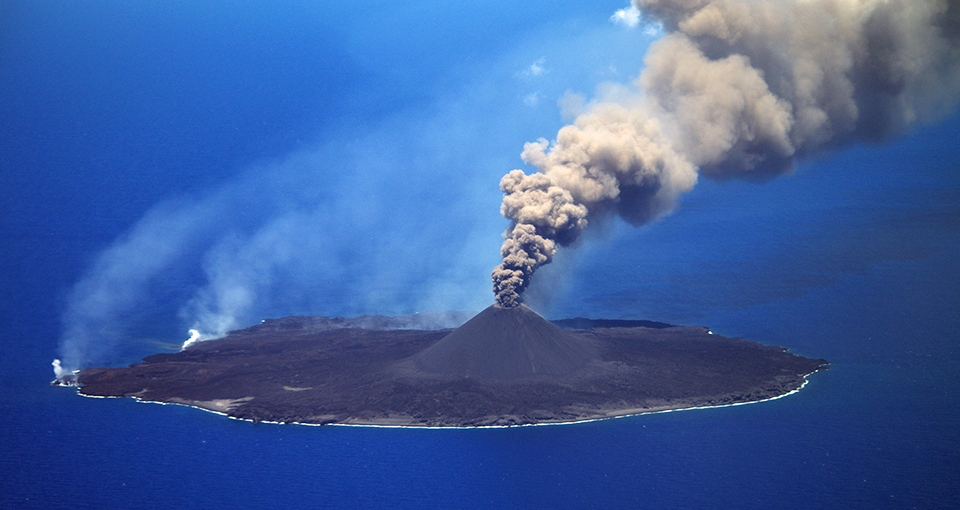 |
Figure 92. Lava flows at Nishinoshima entered the ocean on the N and NE coasts (left) on 7 June 2020, and dense, gray ash emissions rose to at least 1,500 m altitude. Courtesy of JCG. |
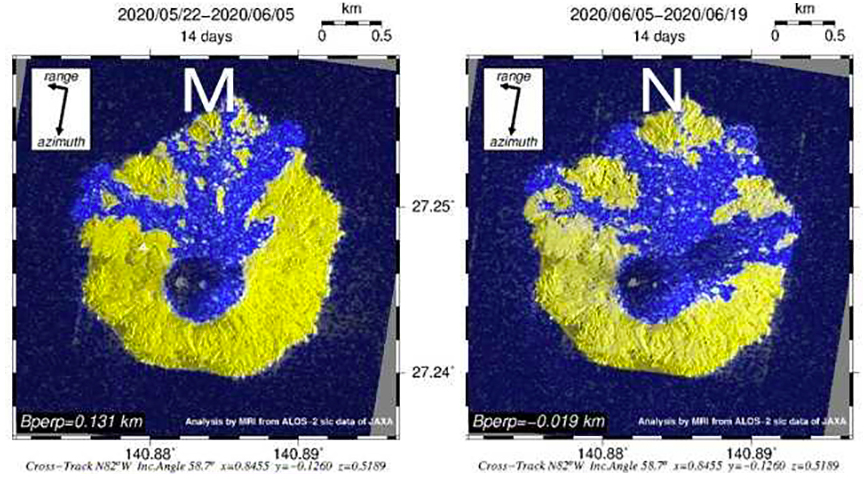 |
Figure 93. The lava flow on the WNW coast of Nishinoshima slowed significantly in early June 2020, while the flows to the N and E covered large areas of those flanks between 5 and 19 June. The areas in blue indicate topographical changes due to lava flows and pyroclastic deposits from the previous measurement. Left image shows the differences between 22 May and 5 June and right image shows changes between 5 and 19 June. The correlated image analysis uses ALOS-2 / PALSAR-2 and is carried out with the cooperation of JAXA through the activities of the Satellite Analysis Group of the Volcano Eruption Prediction Liaison Committee. The software was developed by the National Research Institute for Earth Science and Disaster Prevention and uses the technical data C1-No 478 of the Geospatial Information Authority of Japan. Courtesy of JAXA and JMA (Volcanic activity commentary material on Nishinoshima, June 2020). |
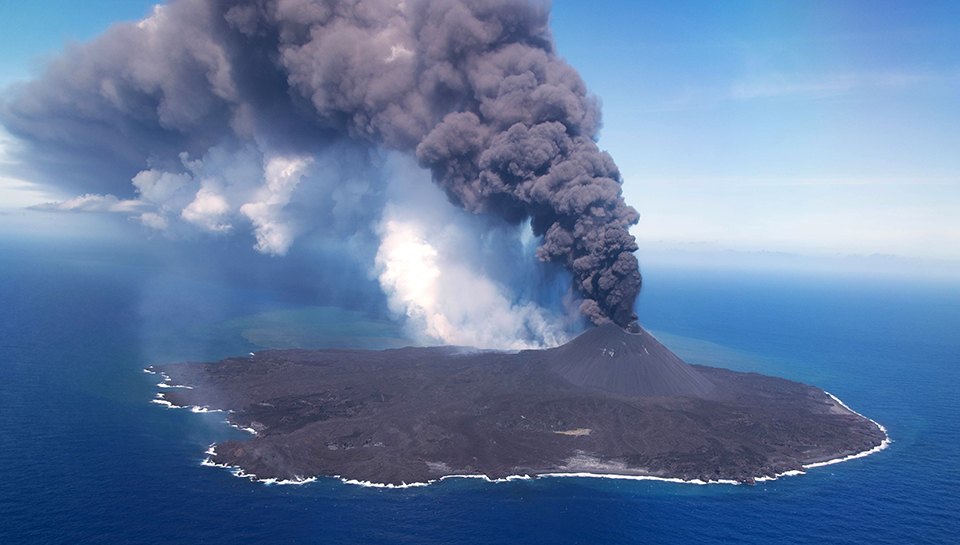 |
Figure 94. Ash emissions and explosive activity at Nishinoshima increased significantly during the second half of June. Dense black ash rose to 2.4 km altitude and drifted at least 180 km to the NE on 19 June 2020. Vigorous white steam plumes rose from the ocean on the E flank where a lava flow entered the ocean. Courtesy of JCG. |
The Tokyo VAAC reported ash emissions that rose to 4.6 km altitude and drifted NE on 25 June. For the remainder of the month they rose to 2.7-3.9 km altitude and drifted N and NE. By the time of the JCG overflight on 29 June, the new crater that had opened on the SW flank had merged with the summit crater (figure 95). Dense black ash emissions rose to 3.4 km altitude and drifted NE, lava flowed down the SW flank into the ocean producing violent steam explosions, and incandescent tephra was scattered at least 200 m from the base of the pyroclastic cone from ongoing explosive activity (figure 96). Multiple layers of recent flow activity were visible along the SW coast (figure 97). Yellow-green discolored water encircled the entire island with a width of 1,000 m.
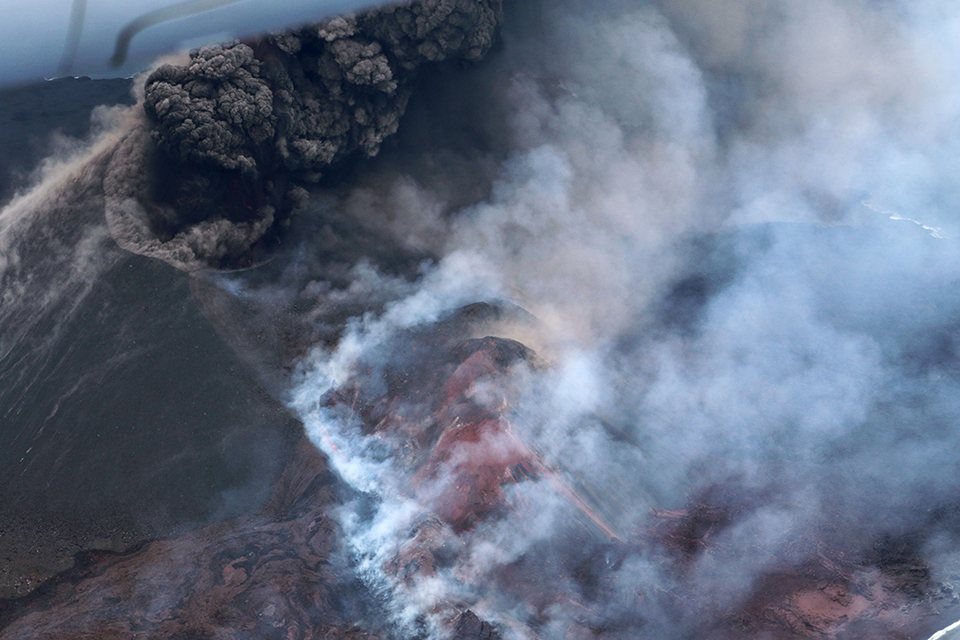 |
Figure 95. The new crater on the SW flank of Nishinoshima had merged with the summit crater by 29 June 2020. Courtesy of JCG and JMA. |
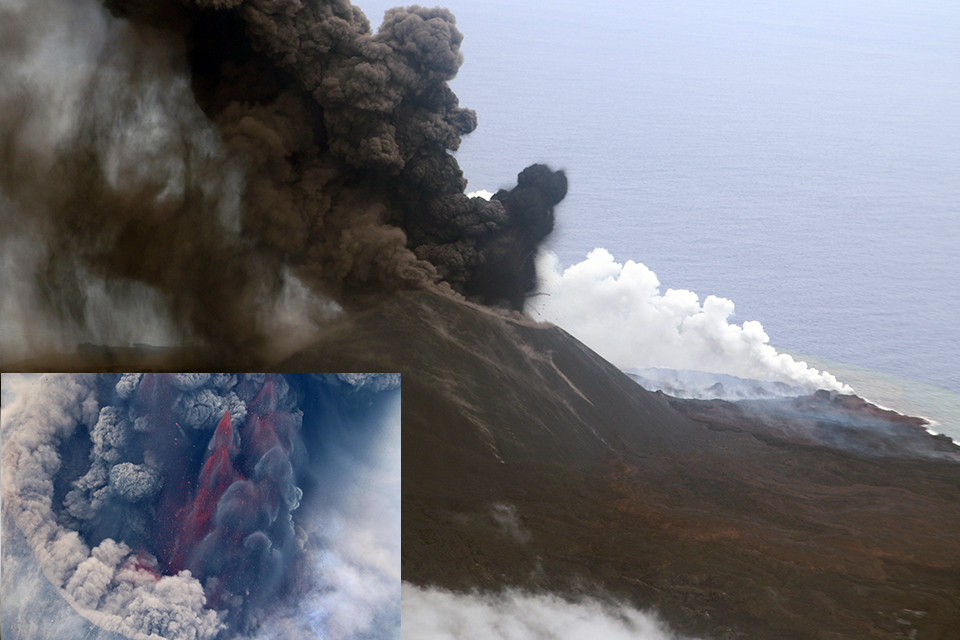 |
Figure 96. Dense black ash emissions rose to 3.4 km altitude and drifted NE from the summit of Nishinoshima on 29 June 2020. Lava flowed down the SW flank into the ocean producing steam explosions, and incandescent tephra was scattered at least 200 m from the base of the pyroclastic cone from ongoing explosive activity at the summit (inset). Courtesy of JCG. |
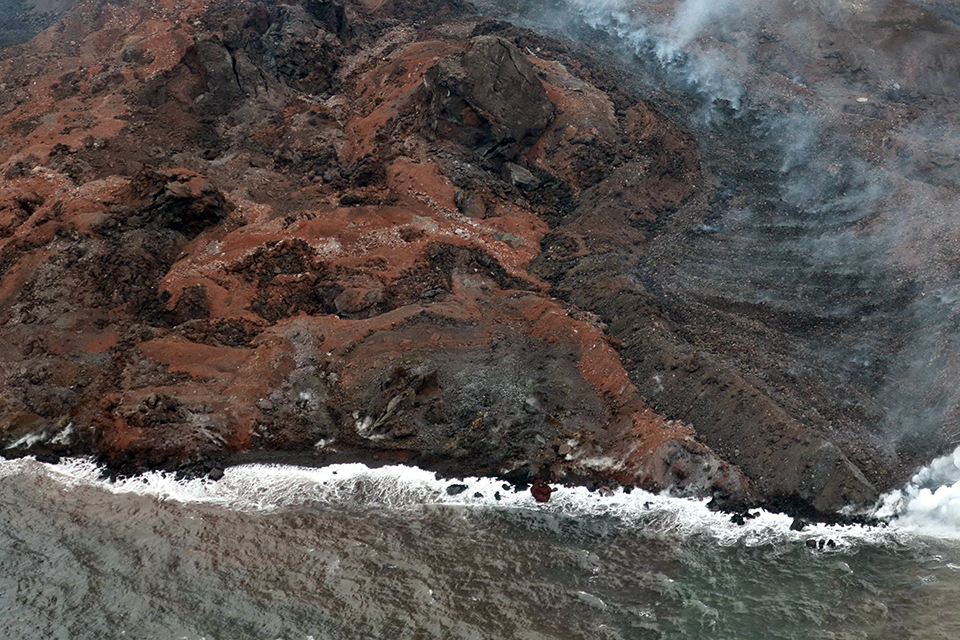 |
Figure 97. Different textures of lava flows were visible along the SW flank of Nishinoshima on 29 June 2020. The active flow appeared dark brown and blocky, and produced steam explosions at the ocean entry site (right). Slightly older, brownish-red lava (center) still produced steam along the coastline. Courtesy of JCG. |
MODVOLC thermal alerts reached their highest levels of the period during June 2020 with multi-pixel alerts recorded on most days of the month. Sulfur dioxide emissions increased steadily throughout June to the highest levels recorded for Nishinoshima; by the end of the month plumes of SO2 were drifting thousands of kilometers across the Pacific Ocean and being captured in complex atmospheric circulation currents (figure 98).
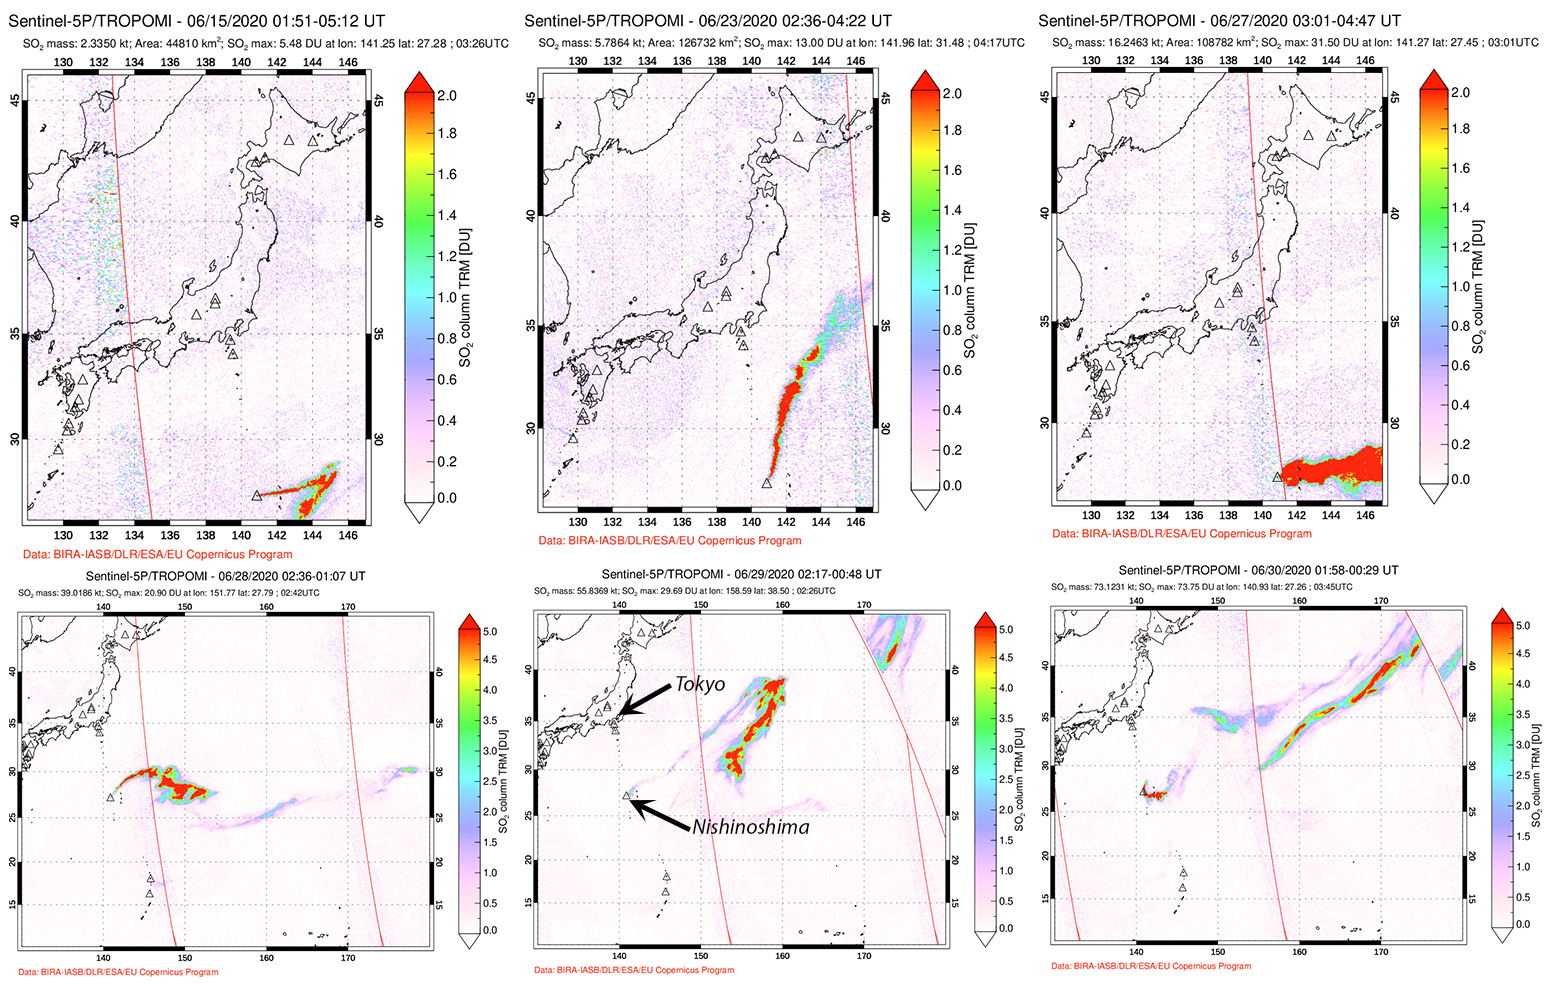 |
Figure 98. Sulfur dioxide emissions at Nishinoshima increased noticeably during the second half of June 2020 as measured by the TROPOMI instrument on the Sentinel-5P satellite. Atmospheric circulation currents produced long-lived plumes that drifted thousands of kilometers from the volcano. Nishinoshima is 1,000 km S of Tokyo. Courtesy of NASA Sulfur Dioxide Monitoring Page. |
By early July 2020, satellite data indicated that the NE quadrant of the island was covered with ash, and a large amount of new lava had flowed down the SW flank, creating fans extending into the ocean (figure 99). The Tokyo VAAC reported ash emissions that rose to 3.7-4.9 km altitude and drifted N during 1-6 July. The altitude increased to 6.1 km during 8 and 9 July, and ranged from 4.6-6.1 km during 10-14 July while the drift direction changed to NE. The marine meteorological observation ship "Ryofu Maru" reported on 11 July that dense black ash was continuously erupting from the summit crater and drifting W at 1,700 m altitude or higher. They observed large volcanic blocks scattered around the base of the pyroclastic cone, and ash falling from the drifting plume. During the night of 11 July incandescent lava and volcanic lightning rose to about 200 m above the crater rim (figure 100).
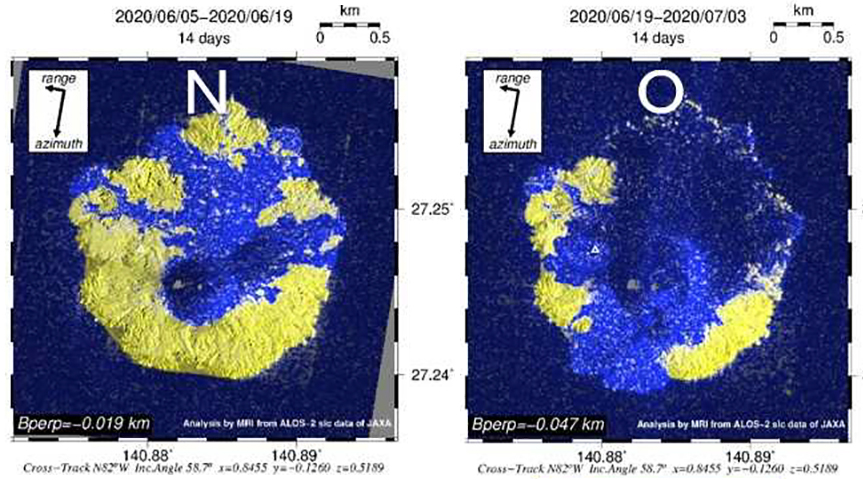 |
Figure 99. By early July 2020, satellite data from Nishinoshima indicated that the NE quadrant of the island was covered with ash, and a large amount of new lava had flowed down the SW flank creating fans extending into the ocean. The areas in blue indicate topographical changes due to lava flows and pyroclastic deposits from the previous measurement. Left image shows differences between 5 and 19 June and the right image shows changes between 19 June and 3 July that included abundant ashfall on the NE flank. The correlated image analysis uses ALOS-2 / PALSAR-2 and is carried out with the cooperation of JAXA through the activities of the Satellite Analysis Group of the Volcano Eruption Prediction Liaison Committee. The software was developed by the National Research Institute for Earth Science and Disaster Prevention and uses the technical data C1-No 478 of the Geospatial Information Authority of Japan. Courtesy of JAXA and JMA (Volcanic activity commentary material on Nishinoshima, June 2020). |
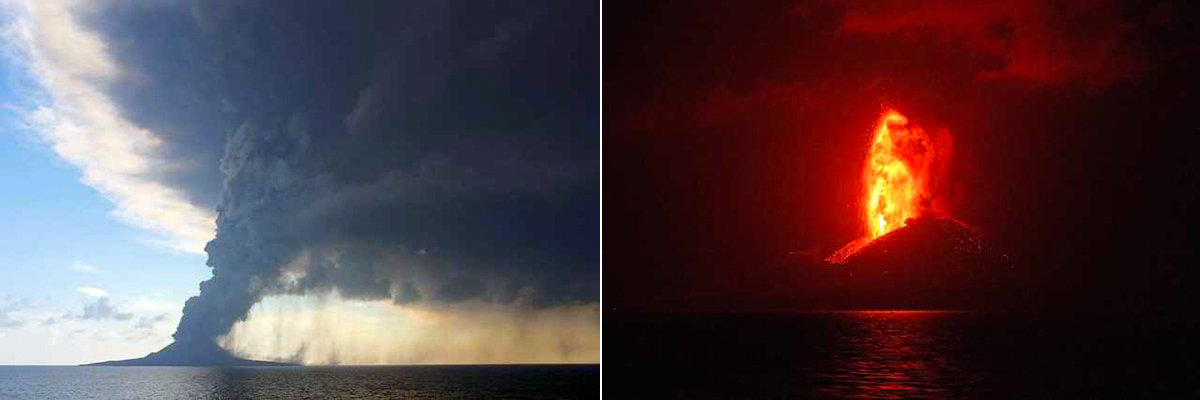 |
Figure 100. High levels of activity were observed at Nishinoshima by crew members aboard the marine meteorological observation ship "Ryofu Maru” on 11 July 2020. Abundant ash emissions filled the sky and tephra fell out of the ash cloud for several kilometers downwind (left, seen from 6 km NE). Incandescent explosions rose as much as 200 m into the night sky (right, seen from 4 km E). Courtesy of JMA. |
During 16-26 July 2020 the Tokyo VAAC reported ash emissions at 3.7-5.2 km altitude that drifted primarily N and NE. The vessel "Keifu Maru" passed Nishinoshima on 20 July and crewmembers observed continuing emissions from the summit of dense, black ash. JCG observed an ash plume rising to at least 2.7 km altitude during their overflight of 20 July. A large dome of fresh lava was visible on the SW flank of the island (figure 101). Lower ash emissions from 2.4-3.7 km altitude were reported by the Tokyo VAAC during 27-29 July, but the altitude increased to 5.5-5.8 km during the last two days of the month. During an overflight on 30 July by the National Research Institute for Earth Science and Disaster Prevention, dark and light gray ash emissions rose to 3.0 km altitude, but no flowing lava or large bombs were observed. They also noted thick deposits of brownish-gray ash on the N side of the island (figure 102).
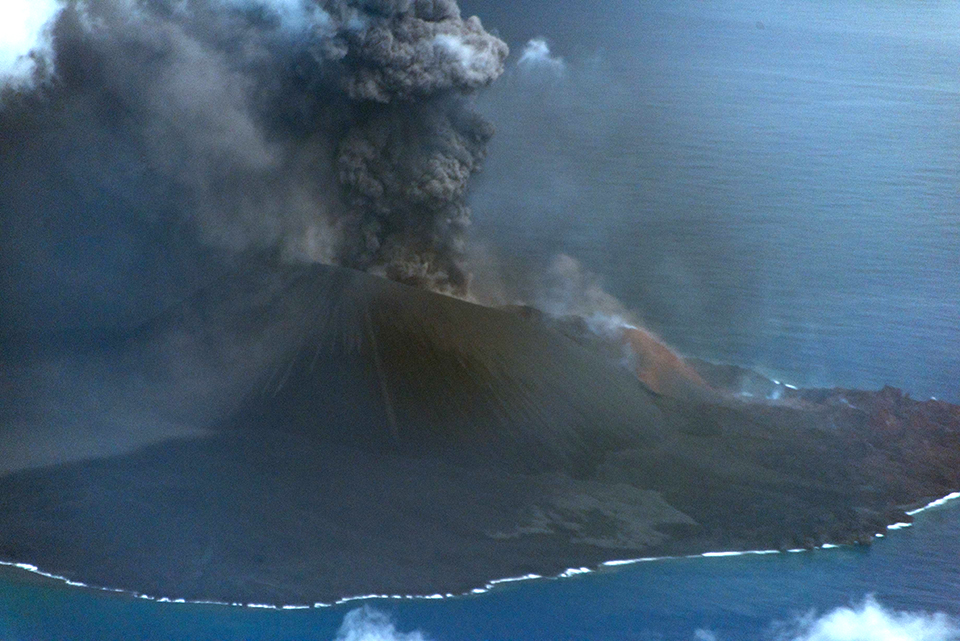 |
Figure 101. JCG observed an ash plume at Nishinoshima rising to at least 2.7 km altitude during their overflight of 20 July 2020. A large dome of fresh lava was visible on the SW flank of the island. Courtesy of JCG. |
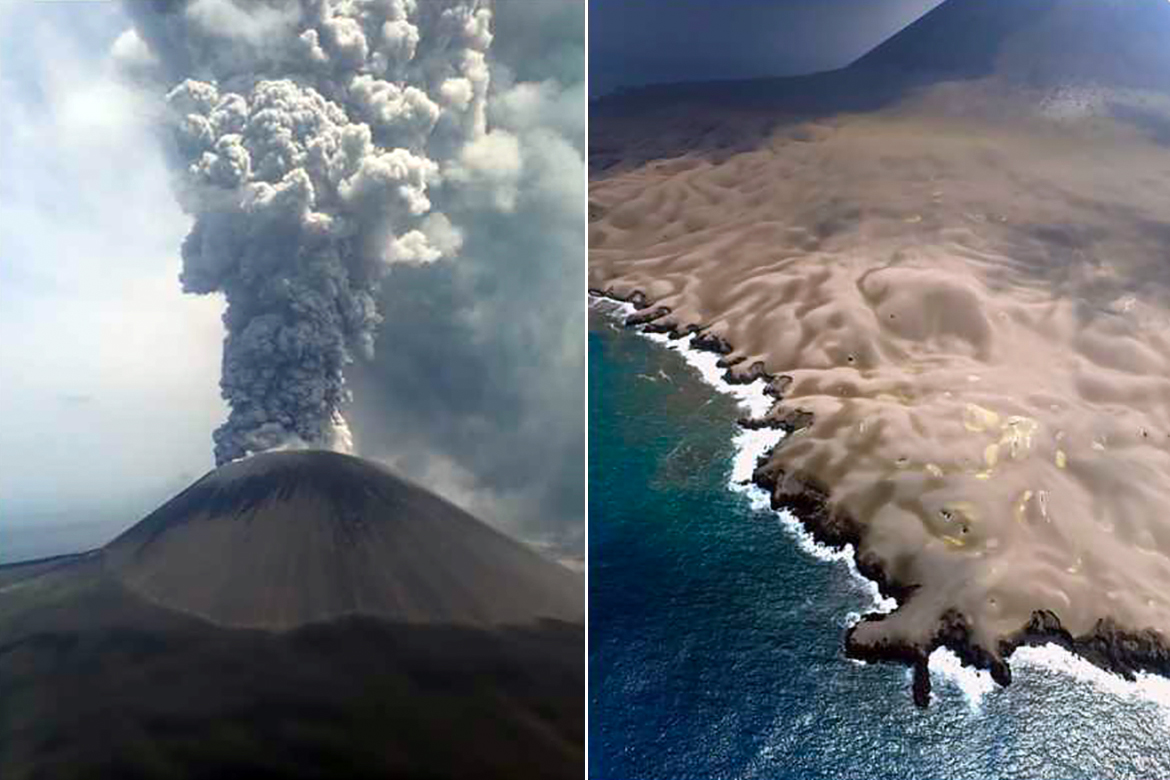 |
Figure 102. Ash emissions changed from dark to light gray on 30 July 2020 at Nishinoshima as seen during an overflight by the National Research Institute for Earth Science and Disaster Prevention. Thick brownish-gray ash was deposited over the lava on the N side of the island. Courtesy of JMA (Information on volcanic activity in Nishinoshima, July 2020). |
JMA reported a sharp decrease in the lava eruption rate during July with thermal anomalies decreasing significantly mid-month. Multiple daily MODVOLC thermal alerts were recorded during the first half of the month but were reduced to two or three per day during the last third of July. Throughout July, SO2 emissions were the highest recorded in modern times for Nishinoshima. High levels of emissions were measured daily, producing streams with high concentrations of SO2 that were caught up in rotating wind currents and drifted thousands of kilometers across the Pacific Ocean (figure 103).
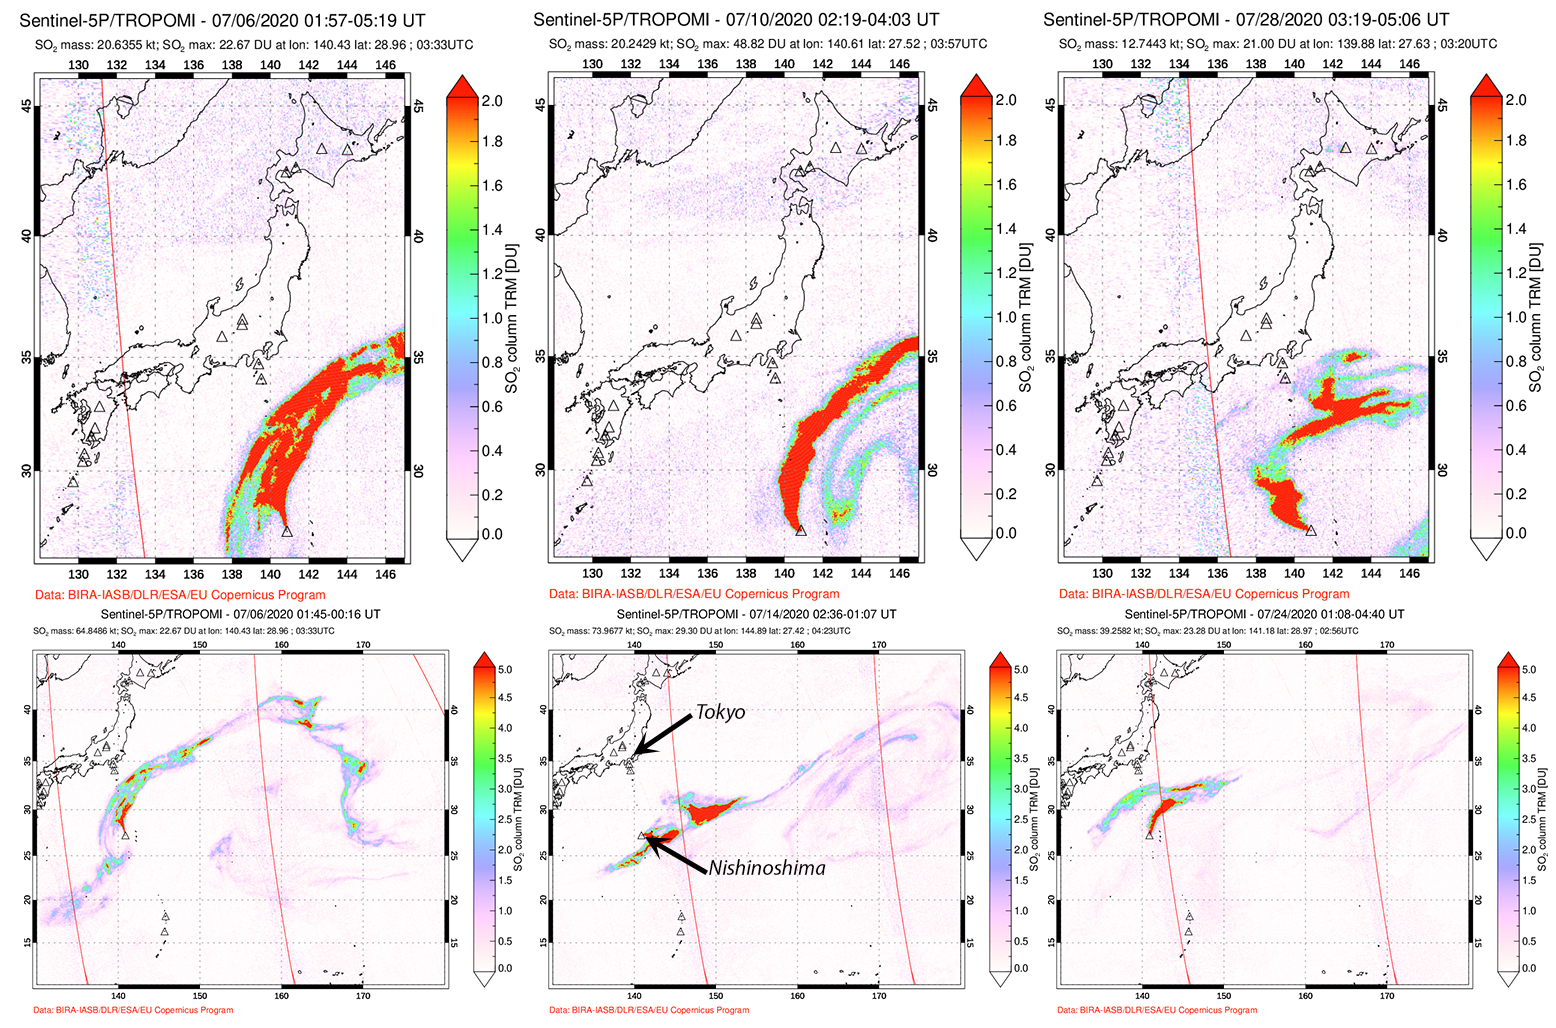 |
Figure 103. Complex atmospheric wind patterns carried the largest SO2 plumes recorded from Nishinoshima thousands of kilometers around the western Pacific Ocean during July 2020. Nishinoshima is about 1,000 km S of Tokyo. Top and bottom left images both show 6 July but at different scales. Courtesy of NASA Sulfur Dioxide Monitoring Page. |
Thermal activity was greatly reduced during August 2020. Only one or two MODVOLC alerts were issued on 11, 18, 20, 21, 29, and 30 August, and no fresh lava flows were observed. The Tokyo VAAC reported ash emissions daily from 1-20 August. Plume heights were 4.9-5.8 km altitude during 1-4 August after which they dropped to 3.9 km altitude through 15 August. A brief pulse to 4.6 km altitude was recorded on 16 August, but then they dropped to 3.0 km or lower through the end of the month and became intermittent. The last ash emission was reported at 2.7 km altitude drifting W on 27 August.
No eruptive activity was observed during the Japan Coast Guard overflights on 19 and 23 August. High temperatures were measured on the inner wall of the summit crater on 19 August (figure 104). Steam plumes rose from the summit crater to about 2.5 km altitude during both visits (figure 105). Yellow-green discolored water was present on 23 August around the NW and SW coasts. No lava flows were observed, and infrared cameras did not measure any surface thermal anomalies outside of the crater. Very high levels of SO2 emissions were measured through 12 August when they began to noticeably decrease (figure 106). By the end of the month, only small amounts of SO2 were measured in satellite data.
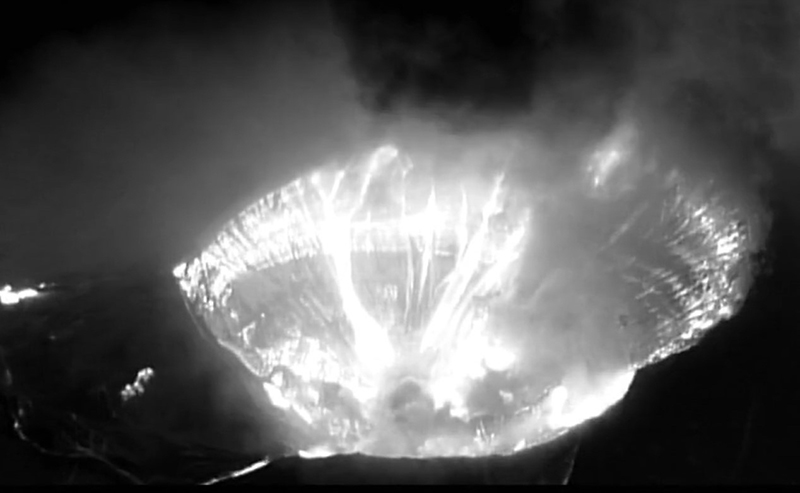 |
Figure 104. A strong thermal anomaly was still present inside the newly enlarged summit crater at Nishinoshima on 19 August 2020. Courtesy of JCG. |
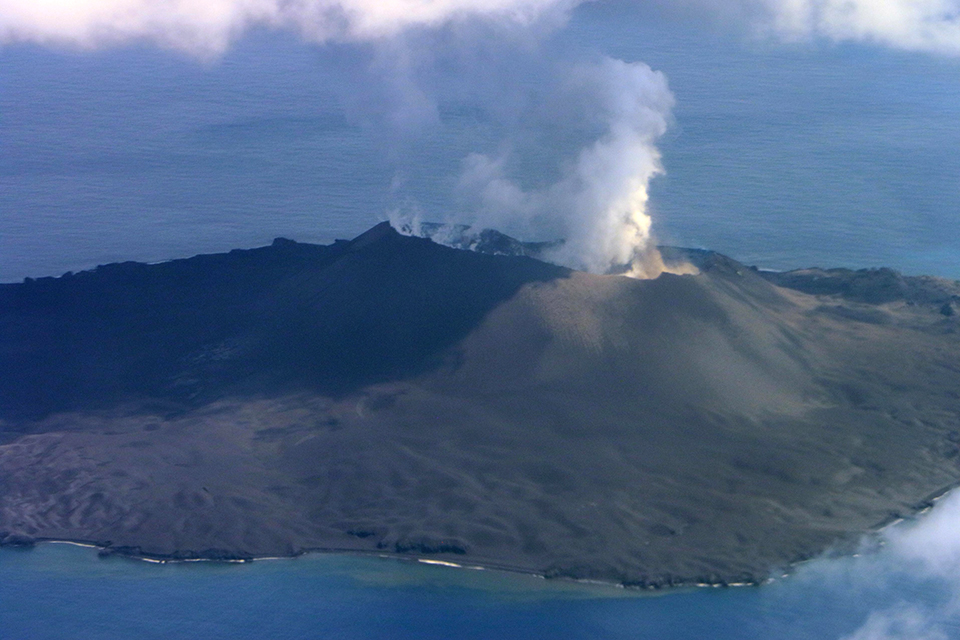 |
Figure 105. Only steam plumes were observed rising from the summit crater of Nishinoshima during the 23 August 2020 overflight by the Japan Coast Guard. Courtesy of JCG. |
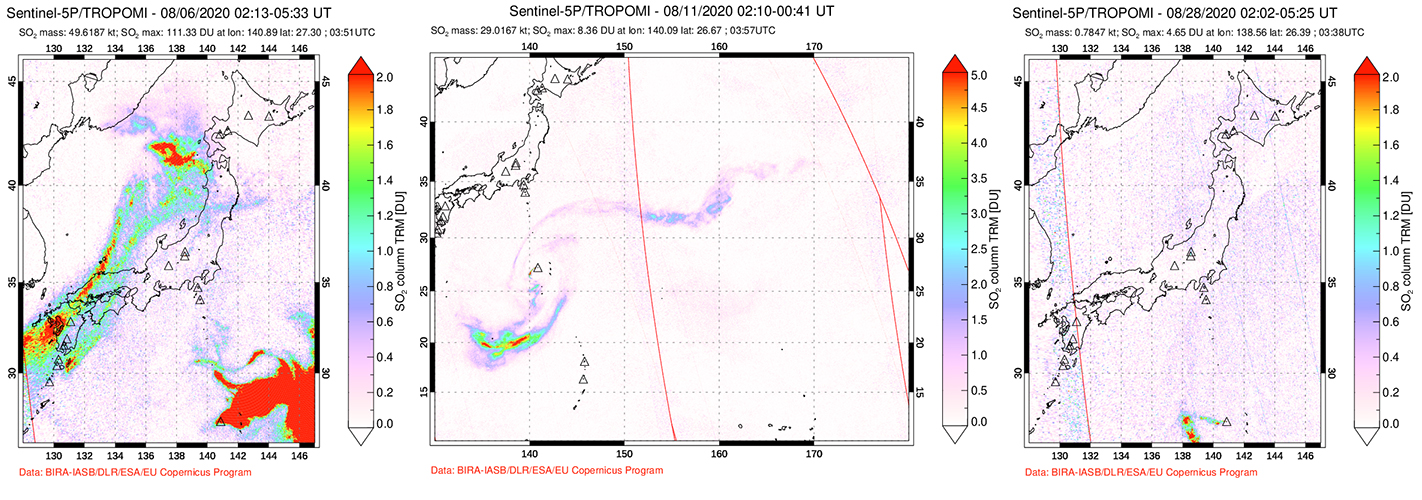 |
Figure 106. Sulfur dioxide emissions remained very high at Nishinoshima until 12 August 2020 when they declined sharply. Circulating air currents carried SO2 thousands of kilometers around the western Pacific region. Courtesy of NASA Global Sulfur Dioxide Monitoring Page. |
Information Contacts: Japan Meteorological Agency (JMA), 1-3-4 Otemachi, Chiyoda-ku, Tokyo 100-8122, Japan (URL: http://www.jma.go.jp/jma/indexe.html); Japan Coast Guard (JCG), Hydrographic and Oceanographic Department, 3-1-1, Kasumigaseki, Chiyoda-ku, Tokyo 100-8932, Japan (URL: https://www1.kaiho.mlit.go.jp/GIJUTSUKOKUSAI/kaiikiDB/kaiyo18-e1.htm); MIROVA (Middle InfraRed Observation of Volcanic Activity), a collaborative project between the Universities of Turin and Florence (Italy) supported by the Centre for Volcanic Risk of the Italian Civil Protection Department (URL: http://www.mirovaweb.it/); Hawai'i Institute of Geophysics and Planetology (HIGP) - MODVOLC Thermal Alerts System, School of Ocean and Earth Science and Technology (SOEST), Univ. of Hawai'i, 2525 Correa Road, Honolulu, HI 96822, USA (URL: http://modis.higp.hawaii.edu/); Tokyo Volcanic Ash Advisory Center (VAAC), 1-3-4 Otemachi, Chiyoda-ku, Tokyo 100-8122, Japan (URL: http://ds.data.jma.go.jp/svd/vaac/data/); Japan Aerospace Exploration Agency-Earth Observation Research Center (JAXA-EORC), 7-44-1 Jindaiji Higashi-machi, Chofu-shi, Tokyo 182-8522, Japan (URL: http://www.eorc.jaxa.jp/); Sentinel Hub Playground (URL: https://www.sentinel-hub.com/explore/sentinel-playground); Global Sulfur Dioxide Monitoring Page, Atmospheric Chemistry and Dynamics Laboratory, NASA Goddard Space Flight Center (NASA/GSFC), 8800 Greenbelt Road, Goddard, Maryland, USA (URL: https://so2.gsfc.nasa.gov/).
Eruption ends in late August 2020; lengthy cooling from extensive lava flows and large crater
Japan’s Nishinoshima volcano, located about 1,000 km S of Tokyo in the Ogasawara Arc, erupted above sea level in November 2013 after 40 years of dormancy. Activity lasted for two years followed by two brief eruptions in 2017 and 2018. The next eruption, from early December 2019 through August 2020, included ash plumes, incandescent ejecta, and lava flows; it produced a large pyroclastic cone with a wide summit crater and extensive lava flows that significantly enlarged the island. This report covers the end of the eruption and cooling during September 2020-January 2021. Information is provided primarily from Japan Meteorological Agency (JMA) monthly reports and the Japan Coast Guard (JCG), which makes regular observation overflights.
Ash emissions were last reported on 27 August 2020. The very high levels of thermal energy from numerous lava flows, ash, and incandescent tephra that peaked during early July decreased significantly during August and September. Continued cooling of the fresh lava and the summit crater lasted into early January 2021 (figure 107). Monthly overflights and observations by scientists confirmed areas of steam emissions at the summit and on the flanks and discolored water around the island, but no eruptive activity.
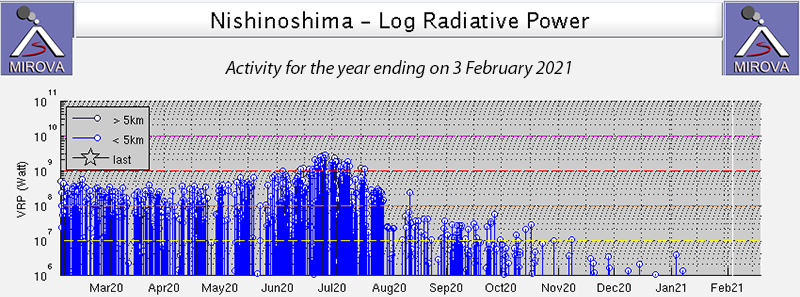 |
Figure 107. High levels of thermal activity at Nishinoshima during June and July 2020 resulted from extensive lava flows and explosions of incandescent tephra. Although the last ash emission was reported on 27 August 2020, cooling of new material lasted into early January 2021. The MIROVA log radiative power graph of thermal activity covers the year ending on 3 February 2021. Courtesy of MIROVA. |
Thermal activity declined significantly at Nishinoshima during August 2020 (BGVN 45:09). Only two days had two MODVOLC alerts (11 and 30), and four other days (18, 20, 21, 29) had single alerts. During JCG overflights on 19 and 23 August there were no ash emissions or lava flows observed, although steam plumes rose over 2 km above the summit crater during both visits. The last ash emission was reported by the Tokyo VAAC on 27 August 2020. No eruptive activity was observed by JMA during an overflight on 5 September, but steam plumes were rising from the summit crater (figure 108). No significant changes were observed in the shape of the pyroclastic cone or the coastline. Yellowish brown discolored water appeared around the western half of the island, and high temperature was still measured on the inner wall of the crater. Faint traces of SO2 plumes were present in satellite images in early September; the last plume identified was on 18 September. Six days with single MODVOLC alerts were recorded during 3-19 September, and the final thermal alert appeared on 1 October 2020.
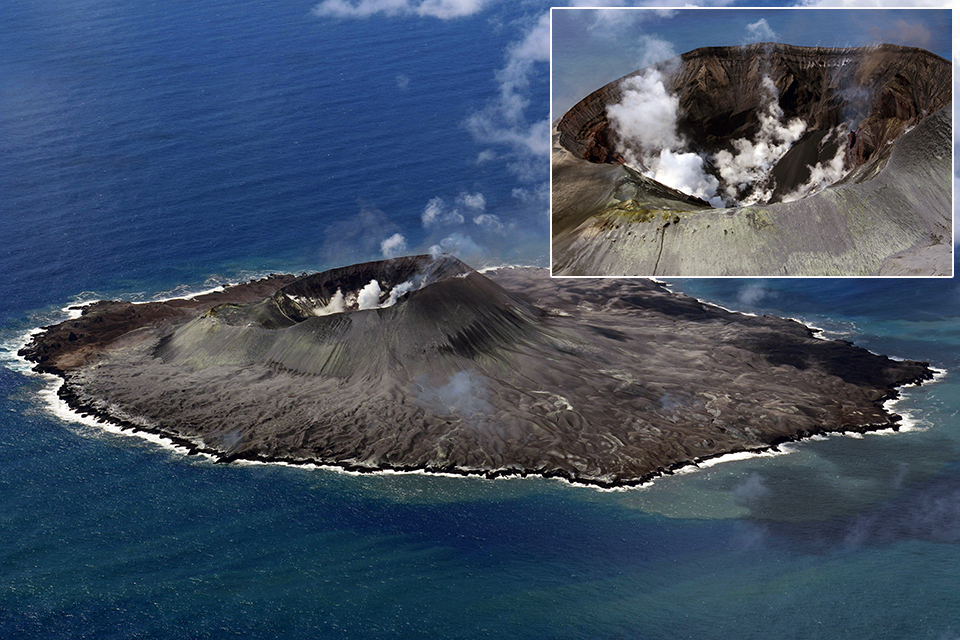 |
Figure 108. No eruptive activity was observed during a JMA overflight of Nishinoshima on 5 September 2020, but steam rose from numerous places within the enlarged summit crater (inset). Courtesy of JMA and JCG (Monthly report of activity at Nishinoshima, September 2020). |
Steam plumes and high temperatures were noted at the summit crater on 28 October, and brown discolored water was present around the S coast of the island (figure 109), but there were no other signs of volcanic activity. Observations from the sea conducted on 2 November 2020 by researchers aboard the Maritime Meteorological Observatory marine weather observation ship "Ryofu Maru" confirmed there was no ongoing eruptive activity. In addition to steam plumes at the summit, they also noted steam rising from multiple cracks on the cooling surface of the lava flow area on the N side of the pyroclastic cone (figure 110). Only steam plumes from inside the summit crater were observed during an overflight on 24 November.
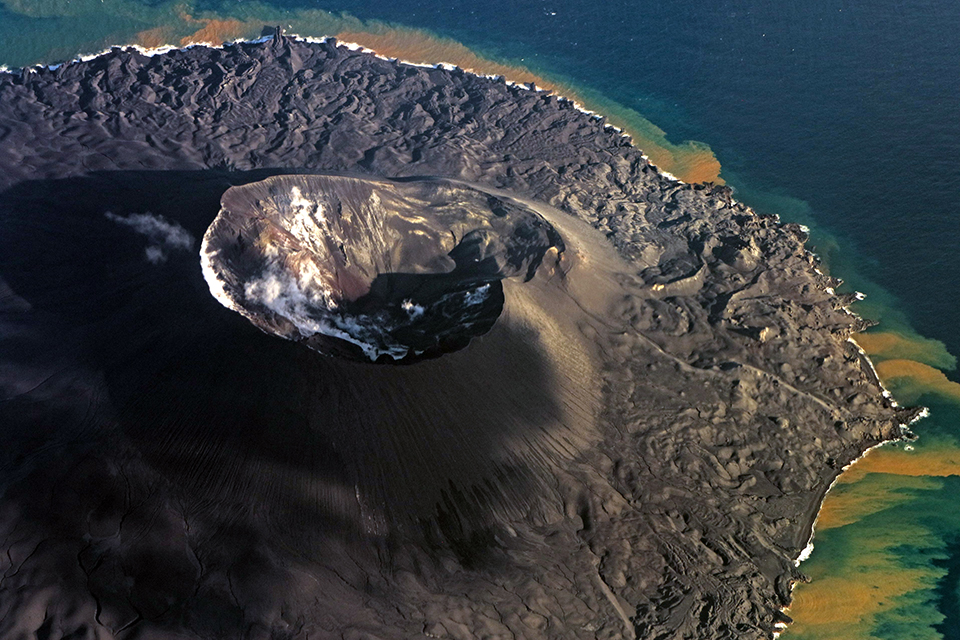 |
Figure 109. On a JCG overflight above Nishinoshima on 28 October 2020 there were no signs of eruptive activity; steam plumes were present in the summit crater and brown discolored water was visible around the S coast of the island. Courtesy of JMA and JCG (Monthly report of activity at Nishinoshima, October 2020). |
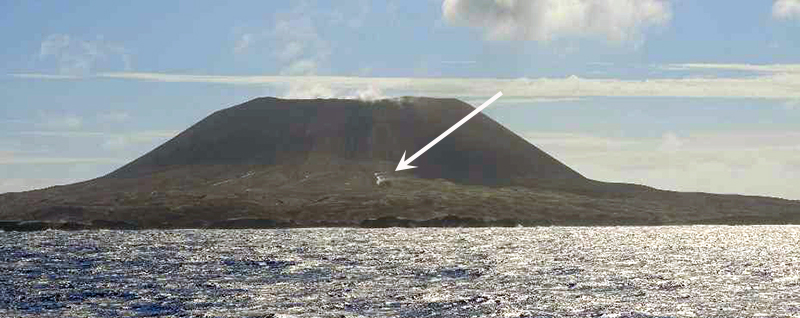 |
Figure 110. Observations of Nishinoshima by staff aboard the Maritime Meteorological Observatory ship "Ryofu Maru" on 2 November 2020 showed a steam plume rising from the lava flow area on the N side of the pyroclastic cone (arrow) and minor steam above the cone. Courtesy of JMA (Monthly report of activity at Nishinoshima, November 2020). |
JMA reduced the warning area around the crater on 18 December 2020 from 2.5 to 1.5 km due to decreased activity. On 7 December a steam plume rose from the inner wall of the summit crater and thermal imaging indicated the area was still hot. Brown discolored water was observed on the SE and SW coasts. Researchers aboard a ship from the Earthquake Research Institute at the University of Tokyo and the Marine Research and Development Organization reported continued steam plumes in the summit crater, around the lava flows on the N flank, and along the S coast during 15-29 December (figure 111). Steam plumes and elevated temperatures were still measured inside the summit crater during an overflight by the Japan Coast Guard on 25 January 2021, and discolored water persisted on the SE and SW coasts; there was no evidence of eruptive activity.
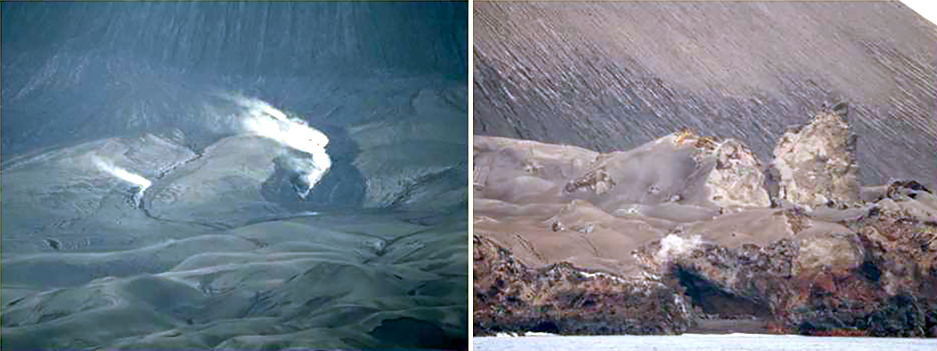 |
Figure 111. Observations of Nishinoshima from the sea by researchers from the Earthquake Research Institute (University of Tokyo) and the Marine Research and Development Organization, which took place from 15-29 December 2020, showed fumarolic acitivity not only inside the summit crater, but also in the lava flow area on the N side of the pyroclastic cone (left, 20 December) and in places along the southern coast (right, 23 December). (Monthly report of activity at Nishinoshima, December 2020). |
Information Contacts: Japan Meteorological Agency (JMA), 1-3-4 Otemachi, Chiyoda-ku, Tokyo 100-8122, Japan (URL: http://www.jma.go.jp/jma/indexe.html); Japan Coast Guard (JCG) Volcano Database, Hydrographic and Oceanographic Department, 3-1-1, Kasumigaseki, Chiyoda-ku, Tokyo 100-8932, Japan (URL: http://www.kaiho.mlit.go.jp/info/kouhou/h29/index.html); Volcano Research Center (VRC-ERI), Earthquake Research Institute, University of Tokyo, Yayoi 1-1-1, Bunkyo-ku, Tokyo 113, Japan (URL: http://www.eri.u-tokyo.ac.jp/topics/ASAMA2004/index-e.html); Hawai'i Institute of Geophysics and Planetology (HIGP) - MODVOLC Thermal Alerts System, School of Ocean and Earth Science and Technology (SOEST), Univ. of Hawai'i, 2525 Correa Road, Honolulu, HI 96822, USA (URL: http://modis.higp.hawaii.edu/); MIROVA (Middle InfraRed Observation of Volcanic Activity), a collaborative project between the Universities of Turin and Florence (Italy) supported by the Centre for Volcanic Risk of the Italian Civil Protection Department (URL: http://www.mirovaweb.it/); NASA Global Sulfur Dioxide Monitoring Page, Atmospheric Chemistry and Dynamics Laboratory, NASA Goddard Space Flight Center (NASA/GSFC), 8800 Greenbelt Road, Goddard, Maryland, USA (URL: https://so2.gsfc.nasa.gov/).
Ash eruptions during 14-15 August 2021
Nishinoshima is a small island located about 1,000 km S of Tokyo in the Ogasawara Arc in Japan. Historical eruptions date back to 1973, with more recent activity including brief eruptions in 2017 and 2018, ash plumes, incandescent ejecta, and lava flows during December 2019 through August 2020 (BGVN 45:09 and BGVN 46:02). This report covers activity during February through September 2021, including ash emissions during 14-15 August, using information from the Japan Meteorological Agency (JMA) monthly reports, the Japan Coast Guard (JCG), which makes regular observation overflights, the Tokyo Volcano Ash Advisory Center, and satellite data.
The last reported activity at the volcano occurred during August 2020, when ash emissions were observed but lava flows had stopped and were cooling (BGVN 46:02). Since then, JMA has reported that gas-and-steam emissions, and high temperatures, have persisted in the summit crater. Occasional brownish to yellowish discoloration has been visible in the water along the coasts of the island, as shown on 23 February 2021 (figure 112). Intermittent gas-and-steam emissions and high temperatures persisted in the summit crater during the reporting period (figure 113). The Japan Coast Guard conducted an overflight on 9 July during which gas-and-steam emissions and yellowish-brown discolored water were observed within about 2 km from the SW to the W side of the island.
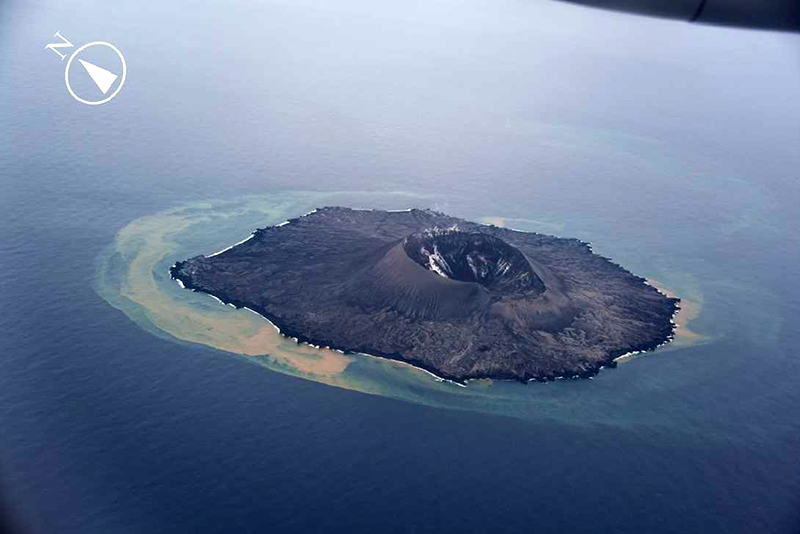 |
Figure 112. Aerial photo from the Japan Coast Guard showing brownish and yellowish discolored water around Nishinoshima on 23 February 2021. Courtesy of JMA (monthly report of activity at Nishinoshima, February 2021). |
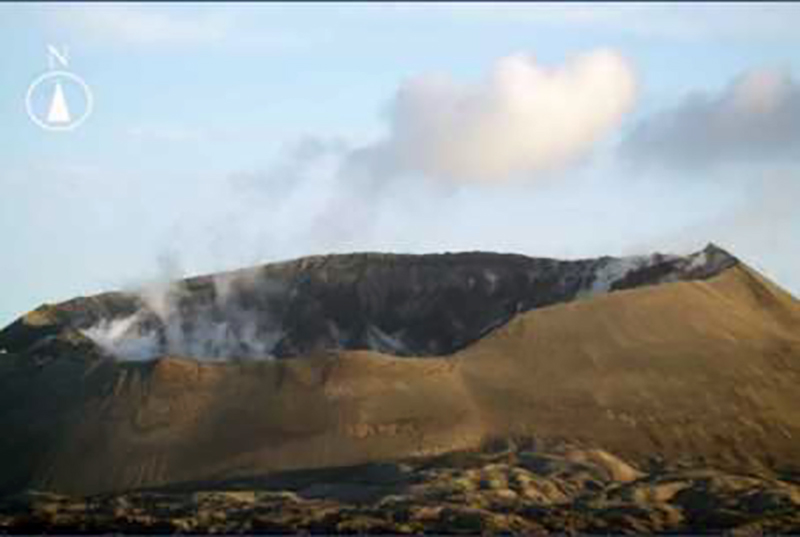 |
Figure 113. Photo from the Japan Coast Guard showing white gas-and-steam emissions rising from the inner wall of the Nishinoshima summit crater and the northern crater rim on 28 May 2021. Courtesy of JMA (monthly report of activity at Nishinoshima, June 2021). |
Ash plumes were detected in HIMAWARI satellite images on 14 August at 0600 rising to 1.9 km altitude and drifted N. Overflights by the Japan Coast Guard on 5, 15, and 16 August did not reveal additional eruptive activity or new deposits, though gas-and-steam emissions and high temperatures were still recorded in the central crater floor, inner wall, and crater rim. They also reported that the central crater floor and N part of the pyroclastic cone had sunk significantly on the 16th compared to observations made on the 5th. Yellowish-green discolored water was observed around the island, as well as brownish water on the S, SE, and SW coasts. The Tokyo VAAC issued a notice that described a period of continuous ash emissions on 15 August, based on satellite data. On 26 August the Japan Coast Guard conducted another overflight and detected gray and white gas-and-steam plumes, in addition to discolored water on the E, W, S, and SW coasts (figure 114). Persistent brown and white gas-and-steam emissions and high temperatures continued to be detected during September.
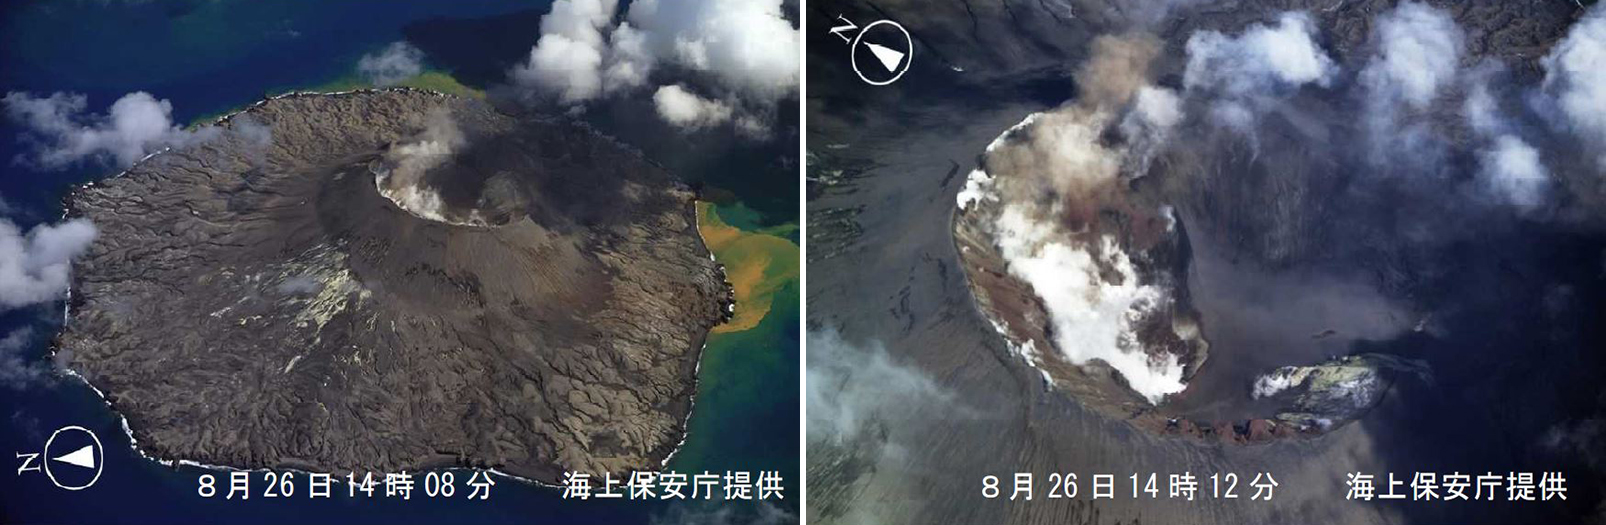 |
Figure 114. Aerial photos of the summit crater of Nishinoshima showing brown and white gas-and-steam emissions accompanied by discolored water on 26 August 2021 at 1408 (left) and 1412 (right). Taken by the Japan Coast Guard. Courtesy of JMA (monthly report of activity at Nishinoshima, September 2021). |
According to the MIROVA plot (Log Radiative Power), low-power thermal anomalies were detected infrequently during February through June, with some higher signatures during May. By early July, thermal activity increased in both frequency and strength and persisted through September, with a brief break during early August (figure 115). A single MODVOLC thermal alert was detected on 4 September.
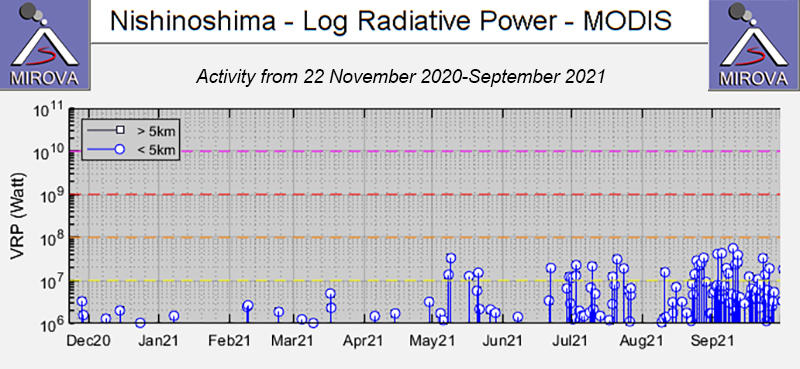 |
Figure 115. MIROVA (Log Radiative Power) graph shows infrequent thermal anomalies during February-June 2021; the thermal anomalies increased in frequency and strength in July and mid-August through September. Courtesy of MIROVA. |
Information Contacts: Japan Meteorological Agency (JMA), 1-3-4 Otemachi, Chiyoda-ku, Tokyo 100-8122, Japan (URL: http://www.jma.go.jp/jma/indexe.html); Japan Coast Guard (JCG) Volcano Database, Hydrographic and Oceanographic Department, 3-1-1, Kasumigaseki, Chiyoda-ku, Tokyo 100-8932, Japan (URL: https://www1.kaiho.mlit.go.jp/GIJUTSUKOKUSAI/kaiikiDB/kaiyo18-e1.htm); Tokyo Volcanic Ash Advisory Center (VAAC), 1-3-4 Otemachi, Chiyoda-ku, Tokyo 100-8122, Japan (URL: http://ds.data.jma.go.jp/svd/vaac/data/); MIROVA (Middle InfraRed Observation of Volcanic Activity), a collaborative project between the Universities of Turin and Florence (Italy) supported by the Centre for Volcanic Risk of the Italian Civil Protection Department (URL: http://www.mirovaweb.it/); Hawai'i Institute of Geophysics and Planetology (HIGP) - MODVOLC Thermal Alerts System, School of Ocean and Earth Science and Technology (SOEST), Univ. of Hawai'i, 2525 Correa Road, Honolulu, HI 96822, USA (URL: http://modis.higp.hawaii.edu/).
New eruption with ash plumes and fumarolic activity during October 2022
Nishinoshima is a small island located about 1,000 km S of Tokyo in the Ogasawara Arc in Japan. The island is a summit of a massive submarine volcano that has prominent satellite peaks to the S, W, and NE. Eruptions date back to 1973; the most recent eruption period occurred during August 2021 and was characterized by ash eruptions (BGVN 46:10). This report covers a new eruption during October 2022 that consisted of ash plumes, thermal activity, and fumarolic activity based on reports from the Japan Meteorological Agency (JMA) monthly reports, the Japan Coast Guard (JCG), which makes regular observation overflights, the Tokyo Volcano Ash Advisory Center (VAAC), and satellite data.
Activity since August 2021 has been relatively quiet. White gas-and-steam emissions were reported intermittently during January and March-September 2022 from multiple locations, including within the central crater of the pyroclastic cone, the central crater, and the crater rim. Yellow-brown and yellow-green discolored water were also visible on clear weather days along the coasts of the island. No visual activity was reported during February 2022. On 15 March a band of yellow-green discolored water was observed extending 10 km NNW. In addition, a white plume from fumaroles was reported by JMA on 15 March that rose from the central crater of the pyroclastic cone as high as 6 km and drifted 6 km NNW. On 29 March and 18 April fumaroles generated a white plume that rose 1 km above the pyroclastic cone (figure 116); compared to the activity on 15 March, fumarolic activity increased and the volume of discolored water decreased. On 16 May white gas-and-steam emissions rose 200 m above the crater. On 17 June and 11 July, fumaroles generated a white plume that rose 1.5 km above the crater.
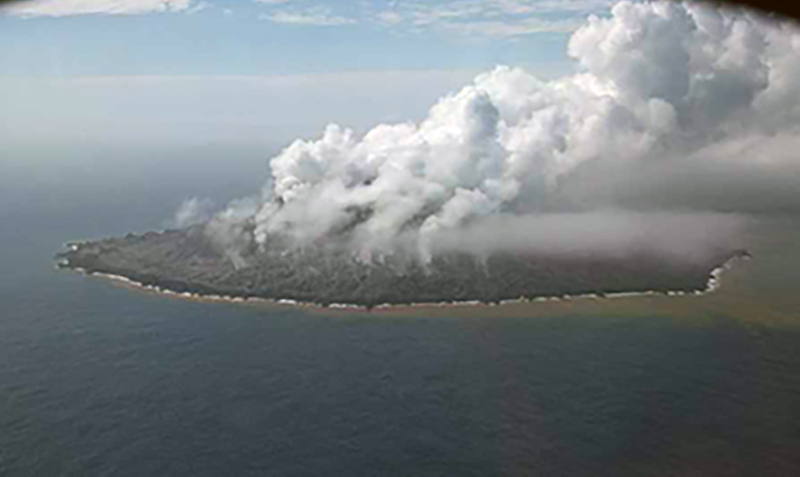 |
Figure 116. Overflight photo of Nishinoshima showing strong white plumes from fumaroles rising 1 km above the pyroclastic cone on 29 March 2022. Photo has been color corrected. Courtesy of JCG via JMA (monthly report of activity at Nishinoshima, March 2022). |
Eruptive activity began on 1 October, according to JMA; on 1 October a volcanic plume rose 1.6 km above the crater rim at 1040. JMA reported that ash plumes rose as high as 3.5 km above the crater and drifted in different directions during 1-12 October, based on HIMAWARI satellite images. According to Tokyo VAAC notices, ash plumes during 1-12 October rose to 1.8-3.7 km altitude and drifted in different directions. An overflight by the Japan Coast Guard (JCG) made on 12 October at 1300 showed that the eruptive activity had stopped; a white plume from a fumarole rose from the central crater to 3.6 km above the crater, as well as on the SE side of the pyroclastic cone. Ash deposits from the eruptive activity were observed on the W side of the island. Discolored brown and yellow-green water were visible around the coasts of the island.
Intermittent low-to-moderate thermal anomalies were recorded in the MIROVA graph (Middle InfraRed Observation of Volcanic Activity) during late June through mid-October 2022 (figure 117). Three thermal signatures were detected on 9 October, according to data from the MODVOLC thermal algorithm, which indicated days of stronger thermal activity. This was also reflected in Sentinel-2 infrared satellite imagery, which showed a persistent thermal anomaly at the crater during the eruption period in October, many of which were accompanied by ash plumes that drifted E, SW, W, and NW (figure 118).
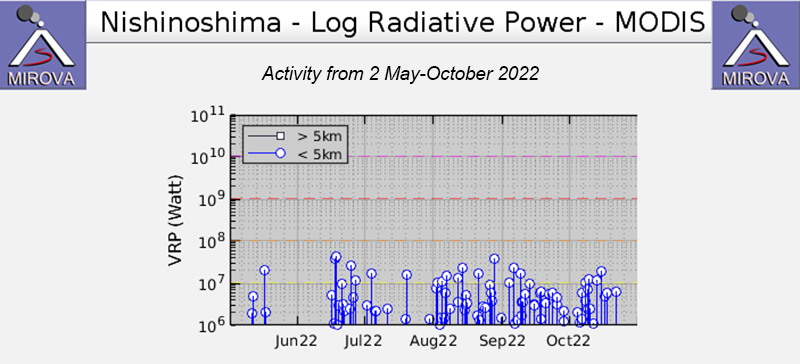 |
Figure 117. The MIROVA graph showed intermittent low-to-moderate thermal anomalies at Nishinoshima during mid-June through mid-October 2022. Courtesy of MIROVA. |
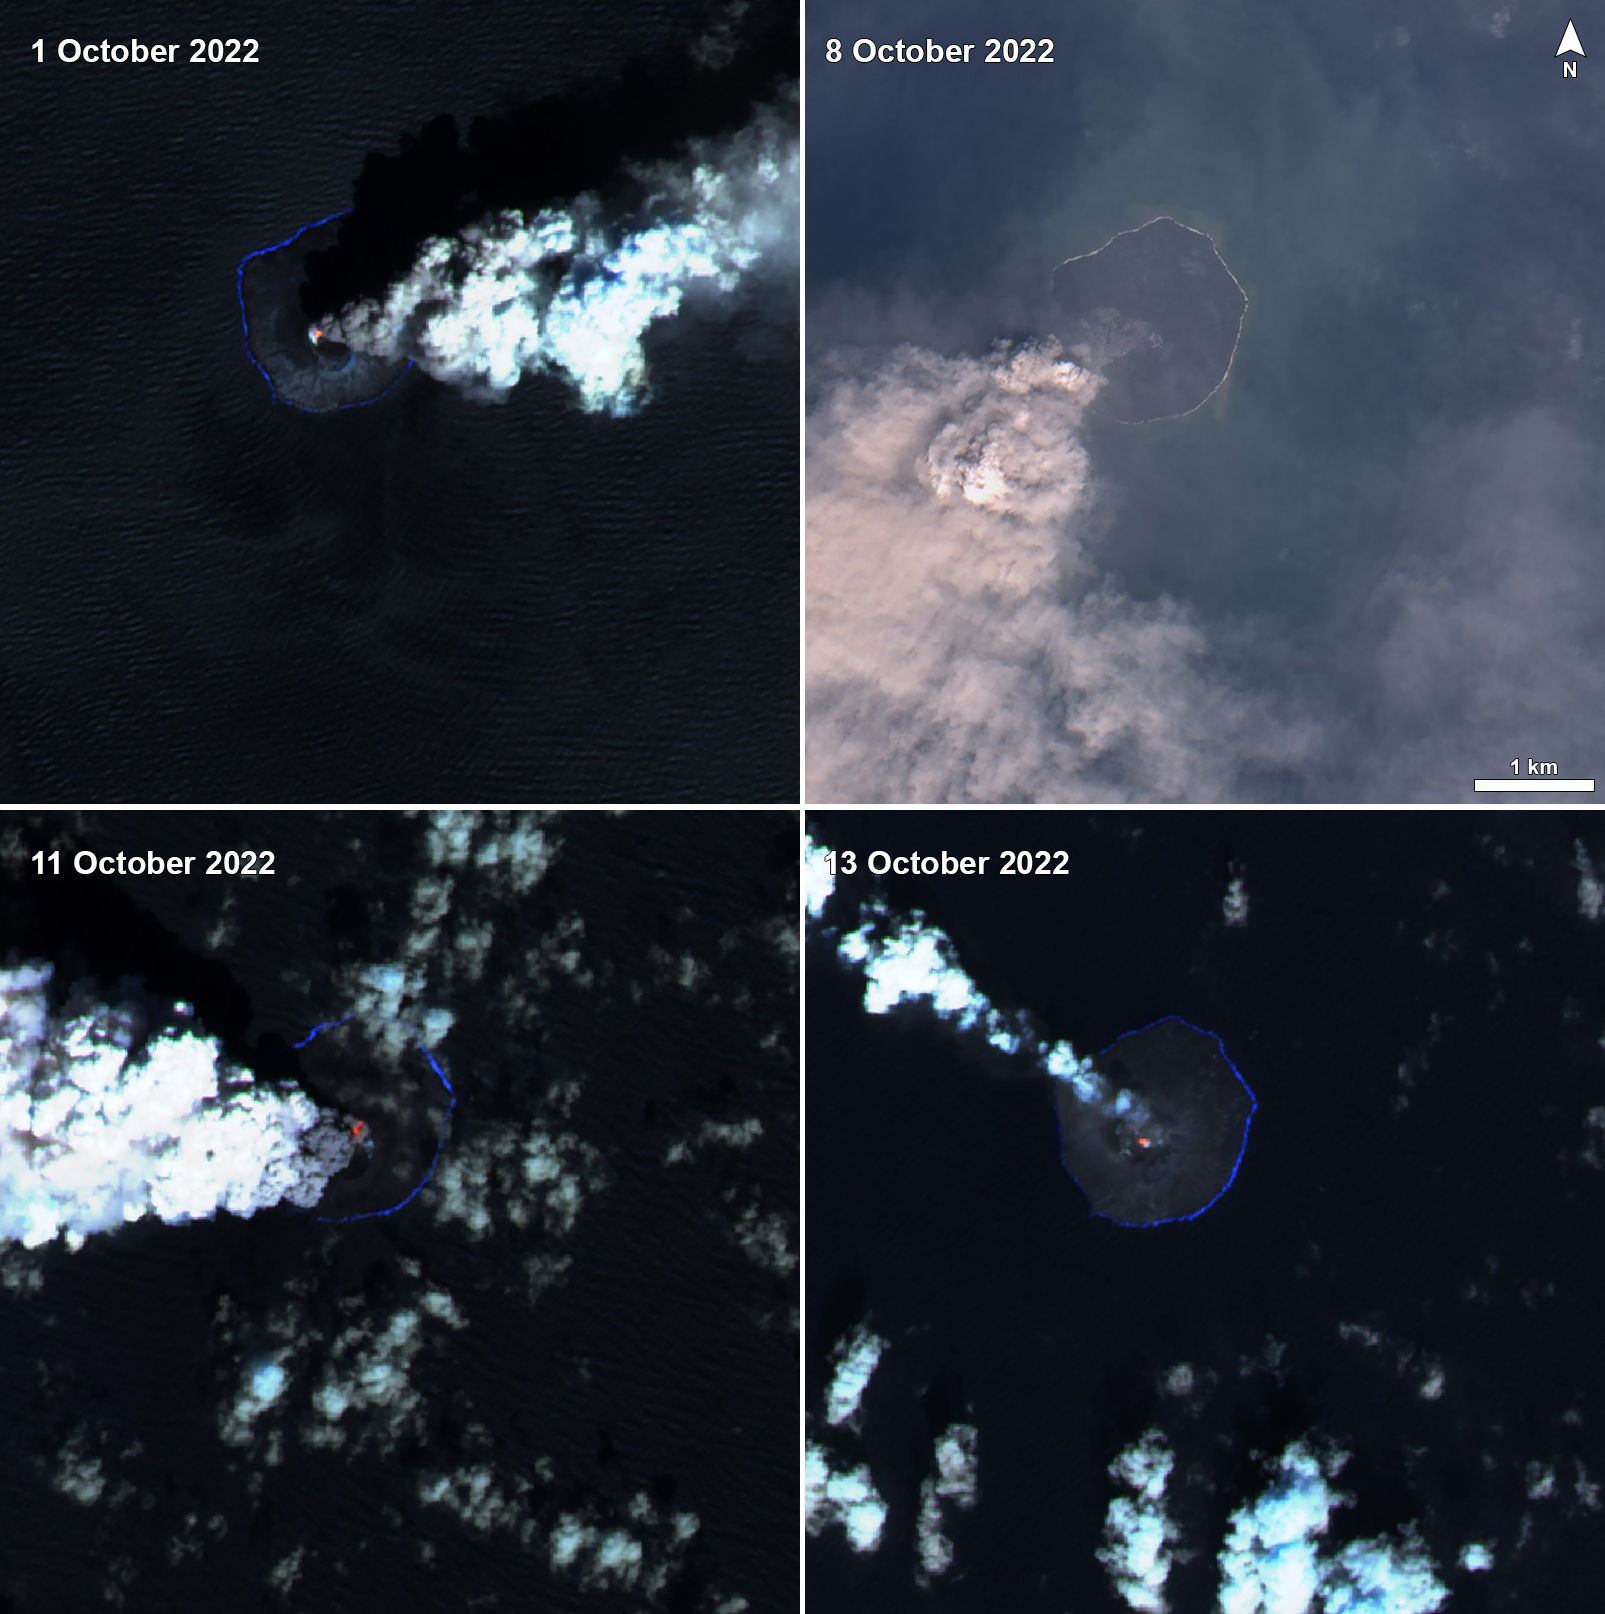 |
Figure 118. Sentinel-2 infrared satellite imagery showing a persistent thermal anomaly in the crater of Nishinoshima accompanied by ash plumes that drifted E, SW, W, and NW on 1 October 2022 (top left), 8 October 2022 (top right), 11 October 2022 (bottom left), and 13 October 2022 (bottom right). A strong brown ash plume was captured in “Natural color” satellite imagery on 8 October. Images using “Atmospheric penetration” rendering (bands 12, 22, 8A) and “Natural Color” (top right) rendering (bands 4, 3, 2). Courtesy of Sentinel Hub Playground. |
Information Contacts: Japan Meteorological Agency (JMA), 1-3-4 Otemachi, Chiyoda-ku, Tokyo 100-8122, Japan (URL: http://www.jma.go.jp/jma/indexe.html); Japan Coast Guard (JCG) Volcano Database, Hydrographic and Oceanographic Department, 3-1-1, Kasumigaseki, Chiyoda-ku, Tokyo 100-8932, Japan (URL: https://www1.kaiho.mlit.go.jp/GIJUTSUKOKUSAI/kaiikiDB/kaiyo18-e1.htm); Tokyo Volcanic Ash Advisory Center (VAAC), 1-3-4 Otemachi, Chiyoda-ku, Tokyo 100-8122, Japan (URL: http://ds.data.jma.go.jp/svd/vaac/data/); MIROVA (Middle InfraRed Observation of Volcanic Activity), a collaborative project between the Universities of Turin and Florence (Italy) supported by the Centre for Volcanic Risk of the Italian Civil Protection Department (URL: http://www.mirovaweb.it/); Hawai'i Institute of Geophysics and Planetology (HIGP) - MODVOLC Thermal Alerts System, School of Ocean and Earth Science and Technology (SOEST), Univ. of Hawai'i, 2525 Correa Road, Honolulu, HI 96822, USA (URL: http://modis.higp.hawaii.edu/).
Small ash plumes and fumarolic activity during November 2022 through April 2023
Nishinoshima is a small island located about 1,000 km S of Tokyo in the Ogasawara Arc in Japan. The island is the summit of a massive submarine volcano that has prominent peaks to the S, W, and NE. Eruptions date back to 1973; the most recent eruption period began in October 2022 and was characterized by ash plumes and fumarolic activity (BGVN 47:12). This report describes ash plumes and fumarolic activity during November 2022 through April 2023 based on monthly reports from the Japan Meteorological Agency (JMA) monthly reports and satellite data.
The most recent eruptive activity prior to the reporting internal occurred on 12 October 2022, when an ash plume rose 3.5 km above the crater rim. An aerial observation conducted by the Japan Coast Guard (JCG) on 25 November reported that white fumaroles rose approximately 200 m above the central crater of a pyroclastic cone (figure 119), and multiple plumes were observed on the ESE flank of the cone. Discolored water ranging from reddish-brown to brown and yellowish-green were visible around the perimeter of the island (figure 119). No significant activity was reported in December.
|
Figure 119. Aerial photo of gas-and-steam plumes rising 200 m above Nishinoshima on 25 November 2022. Reddish brown to brown and yellowish-green discolored water was visible around the perimeter of the island. Courtesy of JCG via JMA (monthly reports of activity at Nishinoshima, November 2022). |
During an overflight conducted by JCG on 25 January 2023 intermittent activity and small, blackish-gray plumes rose 900 m above the central part of the crater were observed (figure 120). The fumarolic zone of the E flank and base of the cone had expanded and emissions had intensified. Dark brown discolored water was visible around the perimeter of the island.
|
Figure 120. Aerial photo of a black-gray ash plume rising approximately 900 m above the crater rim of Nishinoshima on 25 January 2023. White fumaroles were visible on the E slope of the pyroclastic cone. Dense brown to brown discolored water was observed surrounding the island. Photo has been color corrected. Courtesy of JCG via JMA (monthly reports of activity at Nishinoshima, January, 2023). |
No significant activity was reported during February through March. Ash plumes at 1050 and 1420 on 11 April rose 1.9 km above the crater rim and drifted NW and N. These were the first ash plumes observed since 12 October 2022. On 14 April JCG carried out an overflight and reported that no further eruptive activity was visible, although white gas-and-steam plumes were visible from the central crater and rose 900 m high (figure 121). Brownish and yellow-green discolored water surrounded the island.
|
Figure 121. Aerial photo of white gas-and-steam plumes rising 900 m above Nishinoshima on 14 April 2023. Brown and yellow-green discolored water is visible around the perimeter of the island. Photo has been color corrected. Courtesy of JCG via JMA (monthly reports of activity at Nishinoshima, April, 2023). |
Intermittent low-to-moderate power thermal anomalies were recorded in the MIROVA graph (Middle InfraRed Observation of Volcanic Activity) during November 2022 through April 2023 (figure 123). A cluster of six to eight anomalies were detected during November while a smaller number were detected during the following months: two to three during December, one during mid-January 2023, one during February, five during March, and two during April. Thermal activity was also reflected in infrared satellite data at the summit crater, accompanied by occasional gas-and-steam plumes (figure 124).
|
Figure 123. Intermittent low-to-moderate thermal anomalies were detected at Nishinoshima during November 2022 through April 2023, according to this MIROVA graph (Log Radiative Power). A cluster of anomalies occurred throughout November, while fewer anomalies were detected during the following months. Courtesy of MIROVA. |
|
Figure 124. Infrared (bands B12, B11, B4) satellite images show a small thermal anomaly at the summit crater of Nishinoshima on 9 January 2023 (left) and 8 February 2023 (right). Gas-and-steam plumes accompanied this activity and extended S and SE, respectively. Courtesy of Copernicus Browser. |
Information Contacts: Japan Meteorological Agency (JMA), 1-3-4 Otemachi, Chiyoda-ku, Tokyo 100-8122, Japan (URL: http://www.jma.go.jp/jma/indexe.html); MIROVA (Middle InfraRed Observation of Volcanic Activity), a collaborative project between the Universities of Turin and Florence (Italy) supported by the Centre for Volcanic Risk of the Italian Civil Protection Department (URL: http://www.mirovaweb.it/); Copernicus Browser, Copernicus Data Space Ecosystem, European Space Agency (URL: https://dataspace.copernicus.eu/browser/).
This compilation of synonyms and subsidiary features may not be comprehensive. Features are organized into four major categories: Cones, Craters, Domes, and Thermal Features. Synonyms of features appear indented below the primary name. In some cases additional feature type, elevation, or location details are provided.
Synonyms |
| Nisino-sima | Nishino-shima |
|
|
||||||||||||||||||||||||
There is data available for 7 confirmed Holocene eruptive periods.
2022 Oct 1 - 2023 Oct 13 Confirmed Eruption Max VEI: 2
| Episode 1 | Eruption Episode | Central cone of 2013 island | ||||||||||||||||||||||||
|---|---|---|---|---|---|---|---|---|---|---|---|---|---|---|---|---|---|---|---|---|---|---|---|---|---|
| 2022 Oct 1 - 2023 Oct 13 | Evidence from Observations: Reported | ||||||||||||||||||||||||
|
List of 3 Events for Episode 1 at Central cone of 2013 island
| |||||||||||||||||||||||||
2021 Aug 14 - 2021 Aug 15 Confirmed Eruption Max VEI: 2
| Episode 1 | Eruption Episode | Central cone of 2013 island | ||||||||||||||||||||||||
|---|---|---|---|---|---|---|---|---|---|---|---|---|---|---|---|---|---|---|---|---|---|---|---|---|---|
| 2021 Aug 14 - 2021 Aug 15 | Evidence from Observations: Reported | ||||||||||||||||||||||||
| JMA reported that ash plumes were visible in satellite images on 14 August 2021 rising to about 1.9 km altitude and drifting N. | |||||||||||||||||||||||||
|
List of 3 Events for Episode 1 at Central cone of 2013 island
| |||||||||||||||||||||||||
2019 Dec 5 - 2020 Aug 27 Confirmed Eruption Max VEI: 1
| Episode 1 | Eruption Episode | Central cone of 2013 island | ||||||||||||||
|---|---|---|---|---|---|---|---|---|---|---|---|---|---|---|---|
| 2019 Dec 5 - 2020 Aug 27 | Evidence from Observations: Reported | ||||||||||||||
|
List of 1 Events for Episode 1 at Central cone of 2013 island
| |||||||||||||||
2018 Jul 12 - 2018 Jul 21 Confirmed Eruption Max VEI: 1
| Episode 1 | Eruption Episode | Central cone of 2013 island | ||||||||||||||||||||||||
|---|---|---|---|---|---|---|---|---|---|---|---|---|---|---|---|---|---|---|---|---|---|---|---|---|---|
| 2018 Jul 12 - 2018 Jul 21 | Evidence from Observations: Reported | ||||||||||||||||||||||||
|
List of 3 Events for Episode 1 at Central cone of 2013 island
| |||||||||||||||||||||||||
2017 Apr 18 ± 1 days - 2017 Aug 17 ± 6 days Confirmed Eruption Max VEI: 2
| Episode 1 | Eruption Episode | Central cone of 2013 island | ||||||||||||||||||||||||||||||||||||||||||||||||||||||||||||||||||||||||||||||||||||||||||||||||||||||||||||||||||||||||||||||||||||||||||||||||||||||||||||||||||||||||||||||||||||||||||||||||||||||||||||||||||||||
|---|---|---|---|---|---|---|---|---|---|---|---|---|---|---|---|---|---|---|---|---|---|---|---|---|---|---|---|---|---|---|---|---|---|---|---|---|---|---|---|---|---|---|---|---|---|---|---|---|---|---|---|---|---|---|---|---|---|---|---|---|---|---|---|---|---|---|---|---|---|---|---|---|---|---|---|---|---|---|---|---|---|---|---|---|---|---|---|---|---|---|---|---|---|---|---|---|---|---|---|---|---|---|---|---|---|---|---|---|---|---|---|---|---|---|---|---|---|---|---|---|---|---|---|---|---|---|---|---|---|---|---|---|---|---|---|---|---|---|---|---|---|---|---|---|---|---|---|---|---|---|---|---|---|---|---|---|---|---|---|---|---|---|---|---|---|---|---|---|---|---|---|---|---|---|---|---|---|---|---|---|---|---|---|---|---|---|---|---|---|---|---|---|---|---|---|---|---|---|---|---|---|---|---|---|---|---|---|---|---|---|---|---|---|---|---|
| 2017 Apr 18 ± 1 days - 2017 Aug 17 ± 6 days | Evidence from Observations: Reported | ||||||||||||||||||||||||||||||||||||||||||||||||||||||||||||||||||||||||||||||||||||||||||||||||||||||||||||||||||||||||||||||||||||||||||||||||||||||||||||||||||||||||||||||||||||||||||||||||||||||||||||||||||||||
|
List of 41 Events for Episode 1 at Central cone of 2013 island
| |||||||||||||||||||||||||||||||||||||||||||||||||||||||||||||||||||||||||||||||||||||||||||||||||||||||||||||||||||||||||||||||||||||||||||||||||||||||||||||||||||||||||||||||||||||||||||||||||||||||||||||||||||||||
2013 Nov 20 - 2015 Nov 17 (?) Confirmed Eruption Max VEI: 2
| Episode 1 | Submarine Episode | Vent SSE of existing Nishinoshima | |||||||||||||||||||||||||||||||||||||||||||||||||||||||||||||||||||||||||||||||||||||||||||||||||||||||||||||||||||||||||||||||||||||||||||||||||||||||||||||||||||||||||||||||||||||||||||||||||||||||||||||||||||||||||||||||||||||||||||||||||||||||||||||||||||||||||||||||||||||||||||||||||||||||||||||||||||||||||||||||||||||||||||||||||||||||||||||||||||||||||||||||||||||||||||||||||||||||||||||||||||||||||||||||||||||||||||||||||||||||||||||||||||||||||||||||||||||||||||||||||||||||||||||||||||||||||||||||||||||||||||||||||||||||||||||||||||||||||||||||||||||||||||||||||||||||||||||||||||||||||||||||||||||||||||||||||||||||||||||||||||||||||||||||||||
|---|---|---|---|---|---|---|---|---|---|---|---|---|---|---|---|---|---|---|---|---|---|---|---|---|---|---|---|---|---|---|---|---|---|---|---|---|---|---|---|---|---|---|---|---|---|---|---|---|---|---|---|---|---|---|---|---|---|---|---|---|---|---|---|---|---|---|---|---|---|---|---|---|---|---|---|---|---|---|---|---|---|---|---|---|---|---|---|---|---|---|---|---|---|---|---|---|---|---|---|---|---|---|---|---|---|---|---|---|---|---|---|---|---|---|---|---|---|---|---|---|---|---|---|---|---|---|---|---|---|---|---|---|---|---|---|---|---|---|---|---|---|---|---|---|---|---|---|---|---|---|---|---|---|---|---|---|---|---|---|---|---|---|---|---|---|---|---|---|---|---|---|---|---|---|---|---|---|---|---|---|---|---|---|---|---|---|---|---|---|---|---|---|---|---|---|---|---|---|---|---|---|---|---|---|---|---|---|---|---|---|---|---|---|---|---|---|---|---|---|---|---|---|---|---|---|---|---|---|---|---|---|---|---|---|---|---|---|---|---|---|---|---|---|---|---|---|---|---|---|---|---|---|---|---|---|---|---|---|---|---|---|---|---|---|---|---|---|---|---|---|---|---|---|---|---|---|---|---|---|---|---|---|---|---|---|---|---|---|---|---|---|---|---|---|---|---|---|---|---|---|---|---|---|---|---|---|---|---|---|---|---|---|---|---|---|---|---|---|---|---|---|---|---|---|---|---|---|---|---|---|---|---|---|---|---|---|---|---|---|---|---|---|---|---|---|---|---|---|---|---|---|---|---|---|---|---|---|---|---|---|---|---|---|---|---|---|---|---|---|---|---|---|---|---|---|---|---|---|---|---|---|---|---|---|---|---|---|---|---|---|---|---|---|---|---|---|---|---|---|---|---|---|---|---|---|---|---|---|---|---|---|---|---|---|---|---|---|---|---|---|---|---|---|---|---|---|---|---|---|---|---|---|---|---|---|---|---|---|---|---|---|---|---|---|---|---|---|---|---|---|---|---|---|---|---|---|---|---|---|---|---|---|---|---|---|---|---|---|---|---|---|---|---|---|---|---|---|---|---|---|---|---|---|---|---|---|---|---|---|---|---|---|---|---|---|---|---|---|---|---|---|---|---|---|---|---|---|---|---|---|---|---|---|---|---|---|---|---|---|---|---|---|---|---|---|---|---|---|---|---|---|---|---|---|---|---|---|---|---|---|---|---|---|---|---|---|---|---|---|---|---|---|---|---|---|---|---|---|---|---|---|---|---|---|---|---|---|---|---|---|---|---|---|---|---|---|---|---|---|---|---|---|---|---|---|---|---|---|---|---|---|---|---|---|---|---|---|---|---|---|---|---|---|---|---|---|---|---|---|---|---|---|---|---|---|---|---|---|---|---|---|---|---|---|---|---|---|---|---|---|---|---|---|---|---|---|---|---|---|---|---|---|---|---|---|---|---|---|---|---|---|---|---|---|---|---|---|---|---|---|
| 2013 Nov 20 - 2015 Nov 17 (?) | Evidence from Observations: Reported | |||||||||||||||||||||||||||||||||||||||||||||||||||||||||||||||||||||||||||||||||||||||||||||||||||||||||||||||||||||||||||||||||||||||||||||||||||||||||||||||||||||||||||||||||||||||||||||||||||||||||||||||||||||||||||||||||||||||||||||||||||||||||||||||||||||||||||||||||||||||||||||||||||||||||||||||||||||||||||||||||||||||||||||||||||||||||||||||||||||||||||||||||||||||||||||||||||||||||||||||||||||||||||||||||||||||||||||||||||||||||||||||||||||||||||||||||||||||||||||||||||||||||||||||||||||||||||||||||||||||||||||||||||||||||||||||||||||||||||||||||||||||||||||||||||||||||||||||||||||||||||||||||||||||||||||||||||||||||||||||||||||||||||||||||||
|
List of 130 Events for Episode 1 at Vent SSE of existing Nishinoshima
| ||||||||||||||||||||||||||||||||||||||||||||||||||||||||||||||||||||||||||||||||||||||||||||||||||||||||||||||||||||||||||||||||||||||||||||||||||||||||||||||||||||||||||||||||||||||||||||||||||||||||||||||||||||||||||||||||||||||||||||||||||||||||||||||||||||||||||||||||||||||||||||||||||||||||||||||||||||||||||||||||||||||||||||||||||||||||||||||||||||||||||||||||||||||||||||||||||||||||||||||||||||||||||||||||||||||||||||||||||||||||||||||||||||||||||||||||||||||||||||||||||||||||||||||||||||||||||||||||||||||||||||||||||||||||||||||||||||||||||||||||||||||||||||||||||||||||||||||||||||||||||||||||||||||||||||||||||||||||||||||||||||||||||||||||||||
[ 2001 Jan 16 ± 15 days ] Uncertain Eruption
| Episode 1 | Eruption Episode | |||||||||||||||
|---|---|---|---|---|---|---|---|---|---|---|---|---|---|---|---|
| 2001 Jan 16 ± 15 days - Unknown | Evidence from Unknown | ||||||||||||||
|
List of 1 Events for Episode 1
| |||||||||||||||
[ 1986 Jul 2 ± 182 days - 1990 Jul 2 ± 182 days ] Uncertain Eruption
| Episode 1 | Eruption Episode | |||||||||||||||
|---|---|---|---|---|---|---|---|---|---|---|---|---|---|---|---|
| 1986 Jul 2 ± 182 days - 1990 Jul 2 ± 182 days | Evidence from Unknown | ||||||||||||||
|
List of 1 Events for Episode 1
| |||||||||||||||
[ 1985 Dec 2 - 1985 Dec 2 ] Uncertain Eruption
| Episode 1 | Eruption Episode | |||||||||||||||
|---|---|---|---|---|---|---|---|---|---|---|---|---|---|---|---|
| 1985 Dec 2 - 1985 Dec 2 | Evidence from Unknown | ||||||||||||||
|
List of 1 Events for Episode 1
| |||||||||||||||
[ 1983 Jul 2 ± 182 days - 1984 Jul 2 ± 182 days ] Uncertain Eruption
| Episode 1 | Eruption Episode | |||||||||||||||
|---|---|---|---|---|---|---|---|---|---|---|---|---|---|---|---|
| 1983 Jul 2 ± 182 days - 1984 Jul 2 ± 182 days | Evidence from Unknown | ||||||||||||||
|
List of 1 Events for Episode 1
| |||||||||||||||
[ 1982 Apr 16 ± 15 days - 1982 Apr 16 ± 15 days ] Uncertain Eruption
| Episode 1 | Eruption Episode | |||||||||||||||
|---|---|---|---|---|---|---|---|---|---|---|---|---|---|---|---|
| 1982 Apr 16 ± 15 days - 1982 Apr 16 ± 15 days | Evidence from Unknown | ||||||||||||||
|
List of 1 Events for Episode 1
| |||||||||||||||
[ 1980 Jul 7 - 1981 Jul 2 (?) ± 182 days ] Uncertain Eruption
| Episode 1 | Eruption Episode | South, east, and west sides | ||||||||||||||
|---|---|---|---|---|---|---|---|---|---|---|---|---|---|---|---|
| 1980 Jul 7 - 1981 Jul 2 (?) ± 182 days | Evidence from Unknown | ||||||||||||||
|
List of 1 Events for Episode 1 at South, east, and west sides
| |||||||||||||||
[ 1978 Nov 16 - 1979 Jul 2 (?) ± 182 days ] Uncertain Eruption
| Episode 1 | Eruption Episode | 6.5 km NW of Nishino-shima | ||||||||||||||
|---|---|---|---|---|---|---|---|---|---|---|---|---|---|---|---|
| 1978 Nov 16 - 1979 Jul 2 (?) ± 182 days | Evidence from Unknown | ||||||||||||||
|
List of 1 Events for Episode 1 at 6.5 km NW of Nishino-shima
| |||||||||||||||
[ 1975 Jul 2 ± 182 days - 1977 Jul 2 ± 182 days ] Uncertain Eruption
| Episode 1 | Eruption Episode | |||||||||||||||
|---|---|---|---|---|---|---|---|---|---|---|---|---|---|---|---|
| 1975 Jul 2 ± 182 days - 1977 Jul 2 ± 182 days | Evidence from Unknown | ||||||||||||||
|
List of 1 Events for Episode 1
| |||||||||||||||
1973 Apr 12 - 1974 May 5 ± 4 days Confirmed Eruption Max VEI: 2
| Episode 1 | Eruption Episode | Vent SE of existing Nishinoshima | ||||||||||||||||||||||||||||||||||||||||||||||||||||||
|---|---|---|---|---|---|---|---|---|---|---|---|---|---|---|---|---|---|---|---|---|---|---|---|---|---|---|---|---|---|---|---|---|---|---|---|---|---|---|---|---|---|---|---|---|---|---|---|---|---|---|---|---|---|---|---|
| 1973 Apr 12 - 1974 May 5 ± 4 days | Evidence from Observations: Reported | ||||||||||||||||||||||||||||||||||||||||||||||||||||||
| Submarine eruptions began on 12 April 1973 and on 11 September a new island was first seen centered about 400 m SE of the existing island. Lava flows that began in September formed three new islands, which joined together during October-November 1973 forming Nishinoshima-shinto, which was itself connected to the pre-existing island after the eruption ended. | |||||||||||||||||||||||||||||||||||||||||||||||||||||||
|
List of 9 Events for Episode 1 at Vent SE of existing Nishinoshima
| |||||||||||||||||||||||||||||||||||||||||||||||||||||||
There is no Deformation History data available for Nishinoshima.
There is no Emissions History data available for Nishinoshima.
The maps shown below have been scanned from the GVP map archives and include the volcano on this page. Clicking on the small images will load the full 300 dpi map. Very small-scale maps (such as world maps) are not included. The maps database originated over 30 years ago, but was only recently updated and connected to our main database. We welcome users to tell us if they see incorrect information or other problems with the maps; please use the Contact GVP link at the bottom of the page to send us email.
There are no samples for Nishinoshima in the Smithsonian's NMNH Department of Mineral Sciences Rock and Ore collection.
| Copernicus Browser | The Copernicus Browser replaced the Sentinel Hub Playground browser in 2023, to provide access to Earth observation archives from the Copernicus Data Space Ecosystem, the main distribution platform for data from the EU Copernicus missions. |
| MIROVA | Middle InfraRed Observation of Volcanic Activity (MIROVA) is a near real time volcanic hot-spot detection system based on the analysis of MODIS (Moderate Resolution Imaging Spectroradiometer) data. In particular, MIROVA uses the Middle InfraRed Radiation (MIR), measured over target volcanoes, in order to detect, locate and measure the heat radiation sourced from volcanic activity. |
| MODVOLC Thermal Alerts | Using infrared satellite Moderate Resolution Imaging Spectroradiometer (MODIS) data, scientists at the Hawai'i Institute of Geophysics and Planetology, University of Hawai'i, developed an automated system called MODVOLC to map thermal hot-spots in near real time. For each MODIS image, the algorithm automatically scans each 1 km pixel within it to check for high-temperature hot-spots. When one is found the date, time, location, and intensity are recorded. MODIS looks at every square km of the Earth every 48 hours, once during the day and once during the night, and the presence of two MODIS sensors in space allows at least four hot-spot observations every two days. Each day updated global maps are compiled to display the locations of all hot spots detected in the previous 24 hours. There is a drop-down list with volcano names which allow users to 'zoom-in' and examine the distribution of hot-spots at a variety of spatial scales. |
|
WOVOdat
Single Volcano View Temporal Evolution of Unrest Side by Side Volcanoes |
WOVOdat is a database of volcanic unrest; instrumentally and visually recorded changes in seismicity, ground deformation, gas emission, and other parameters from their normal baselines. It is sponsored by the World Organization of Volcano Observatories (WOVO) and presently hosted at the Earth Observatory of Singapore.
GVMID Data on Volcano Monitoring Infrastructure The Global Volcano Monitoring Infrastructure Database GVMID, is aimed at documenting and improving capabilities of volcano monitoring from the ground and space. GVMID should provide a snapshot and baseline view of the techniques and instrumentation that are in place at various volcanoes, which can be use by volcano observatories as reference to setup new monitoring system or improving networks at a specific volcano. These data will allow identification of what monitoring gaps exist, which can be then targeted by remote sensing infrastructure and future instrument deployments. |
| Volcanic Hazard Maps | The IAVCEI Commission on Volcanic Hazards and Risk has a Volcanic Hazard Maps database designed to serve as a resource for hazard mappers (or other interested parties) to explore how common issues in hazard map development have been addressed at different volcanoes, in different countries, for different hazards, and for different intended audiences. In addition to the comprehensive, searchable Volcanic Hazard Maps Database, this website contains information about diversity of volcanic hazard maps, illustrated using examples from the database. This site is for educational purposes related to volcanic hazard maps. Hazard maps found on this website should not be used for emergency purposes. For the most recent, official hazard map for a particular volcano, please seek out the proper institutional authorities on the matter. |
| IRIS seismic stations/networks | Incorporated Research Institutions for Seismology (IRIS) Data Services map showing the location of seismic stations from all available networks (permanent or temporary) within a radius of 0.18° (about 20 km at mid-latitudes) from the given location of Nishinoshima. Users can customize a variety of filters and options in the left panel. Note that if there are no stations are known the map will default to show the entire world with a "No data matched request" error notice. |
| UNAVCO GPS/GNSS stations | Geodetic Data Services map from UNAVCO showing the location of GPS/GNSS stations from all available networks (permanent or temporary) within a radius of 20 km from the given location of Nishinoshima. Users can customize the data search based on station or network names, location, and time window. Requires Adobe Flash Player. |
| DECADE Data | The DECADE portal, still in the developmental stage, serves as an example of the proposed interoperability between The Smithsonian Institution's Global Volcanism Program, the Mapping Gas Emissions (MaGa) Database, and the EarthChem Geochemical Portal. The Deep Earth Carbon Degassing (DECADE) initiative seeks to use new and established technologies to determine accurate global fluxes of volcanic CO2 to the atmosphere, but installing CO2 monitoring networks on 20 of the world's 150 most actively degassing volcanoes. The group uses related laboratory-based studies (direct gas sampling and analysis, melt inclusions) to provide new data for direct degassing of deep earth carbon to the atmosphere. |
| Large Eruptions of Nishinoshima | Information about large Quaternary eruptions (VEI >= 4) is cataloged in the Large Magnitude Explosive Volcanic Eruptions (LaMEVE) database of the Volcano Global Risk Identification and Analysis Project (VOGRIPA). |
| EarthChem | EarthChem develops and maintains databases, software, and services that support the preservation, discovery, access and analysis of geochemical data, and facilitate their integration with the broad array of other available earth science parameters. EarthChem is operated by a joint team of disciplinary scientists, data scientists, data managers and information technology developers who are part of the NSF-funded data facility Integrated Earth Data Applications (IEDA). IEDA is a collaborative effort of EarthChem and the Marine Geoscience Data System (MGDS). |


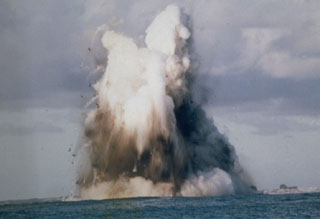 A submarine explosion from Nishinoshima breaches the surface on 9 October 1973. Steam trails behind ejected hot blocks at the margin of the plume. Submarine eruptions began on 12 April 1973 and the new island was first observed on 11 September. Lava flows began in September and three new islands were formed, which joined together during October-November 1973.