An eruption at Axial Seamount, inferred to have started at 2230 on 23 April with an earthquake swarm, was confirmed during 14-29 August by bathymetric data and observations made during a ROV Jason dive. Two large lava flows from the N rift zone (8-16 km N of the summit caldera) were at most 127 m thick; some of the thicker areas had drained collapse features indicating they had molten interiors when emplaced. The ROV traversed the flows for about 2 km. New, thinner lava flows were also identified in the NE summit caldera and on the NE rim.
Source: Oregon State University's Marine Science Center and NOAA/PMEL EOI Program
Research cruise and new bathymetry reveals lava flows from the 2015 eruption
The submarine Axial Seamount volcano is located about 470 km offshore of the Oregon coast. An eruption inferred to have started at 2230 on 23 April 2015 with an earthquake swarm (BGVN 40:03) was confirmed during a 14-29 August 2015 research cruise by the R/V Thompson. According to a personal communication on 23 June 2015 from Bill Chadwick (Oregon State University and NOAA), the length of the eruption is unknown, but it was "very likely days to weeks since the deflation lasted for about 10 days and the temperature signals lasted about a month."
The research cruise revealed new lava flows observed from bathymetric data and observations made during a remotely operated underwater vehicle ROV Jason dive. This eruption "produced the largest volume of erupted lava since monitoring and mapping began in the mid-1980's" (Chadwick and others, 2016). Two large lava flows from the N rift zone (8-16 km N of the summit caldera) were at most 127 m thick; some of the thicker areas had drained collapse features indicating molten interiors when emplaced. The ROV traversed the flows for about 2 km. New, thinner lava flows (figure 13) were also identified in the NE summit caldera and on the NE rim.
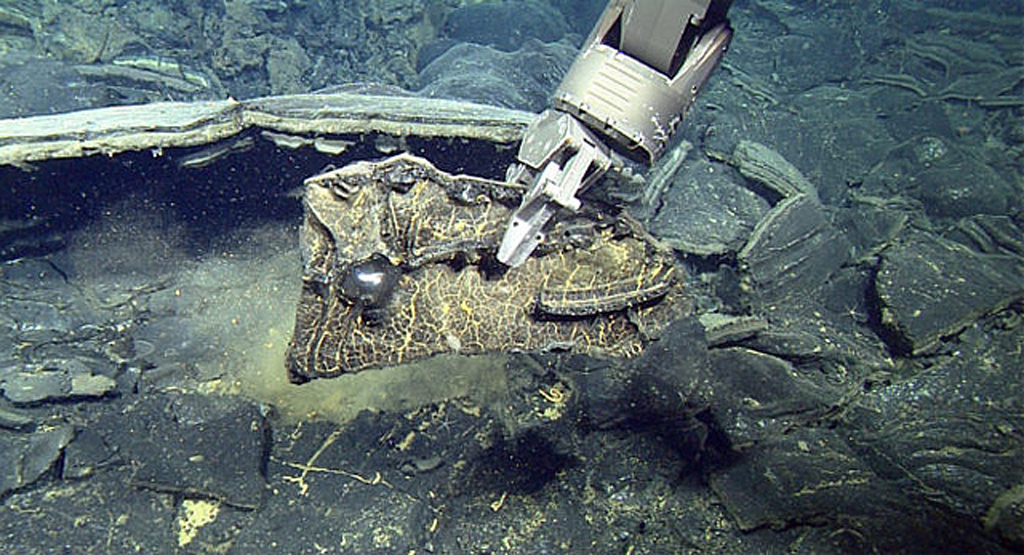 |
Figure 13. Collecting a fragment of lava from the 2015 eruption of Axial Seamount with an arm of the AUV. Credit: Monterey Bay Aquarium Research Institute (MBARI); from Phys.org (2016). |
Three recently published papers, Chadwick and others (2016), Nooner and Chadwick (2016), and Wilcock and others (2016), detail the results of eruptive activity in 1998, 2011, and 2015, based on new data from a research cruise conducted after the 2015 eruption (figures 14 and 15). Scientists from the Monterey Bay Aquarium Research Institute (MBARI) issued a new seafloor map (figure 16) of the area of Axial north of the one shown in figure 14, based on underwater surveys conducted in August 2016, uncovering a number of previously undocumented flows from the 2015 eruption (Phys.org, 2016). MBARI ran identical sets of autonomous underwater vehicles (AUV) survey lines across the entire Axial caldera in 2011, 2014, 2015, and 2016, and during the 2016 survey the AUV collected seafloor samples (figure 13).
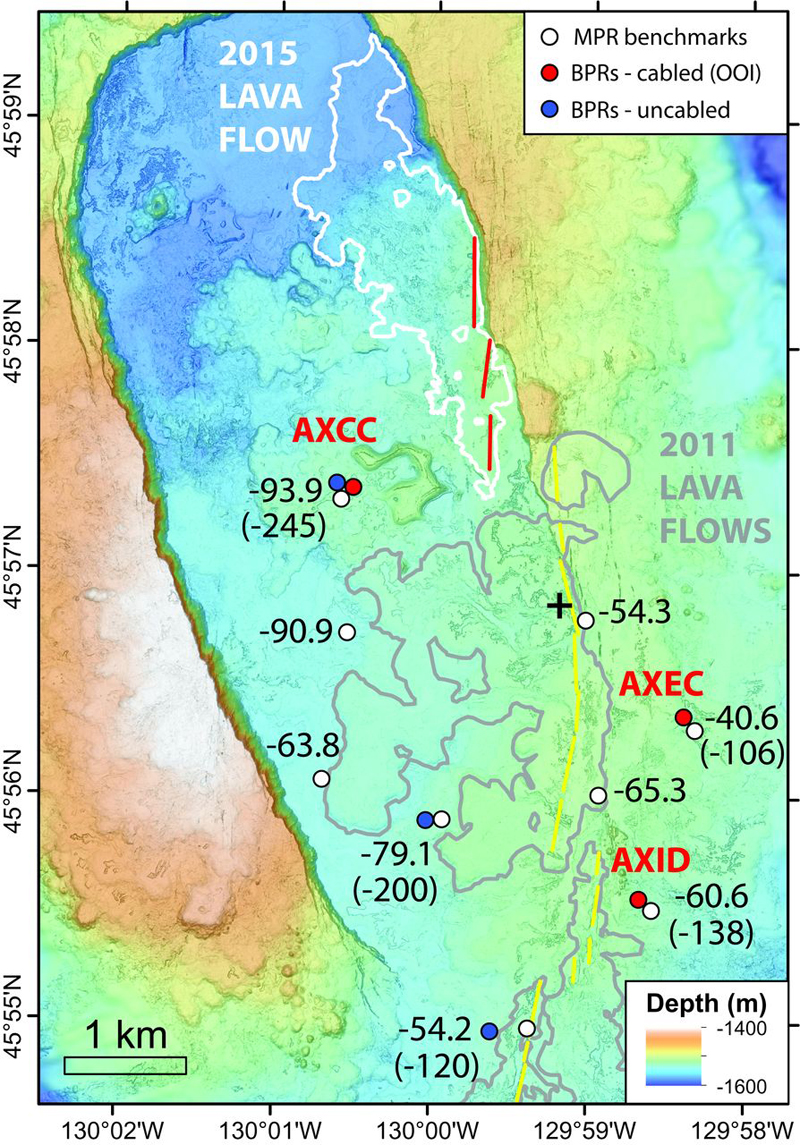 |
Figure 14. Map of the summit caldera of Axial Seamount. Locations of mobile pressure recorders (MPR) benchmarks (white circles) and bottom pressure recorders (BPR) instruments (red and blue circles) are indicated. Numbers show vertical displacements in centimeters at each of the MPR benchmarks between 14 September 2013 and 25 August 2015, a period that included pre-eruption inflation, co-eruption deflation, and post-eruption inflation. Numbers in parentheses show subsidence in centimeters during deflation only, as measured by the BPRs. BPRs on the Ocean Observatories Initiative (OOI) Cabled Array (red dots) include tiltmeters. The map also shows locations of 2015 lava flows and eruptive fissures (white outlines and red lines, respectively) and 2011 lava flows and eruptive fissures (gray outlines and yellow lines, respectively). From Nooner and Chadwick (2016). |
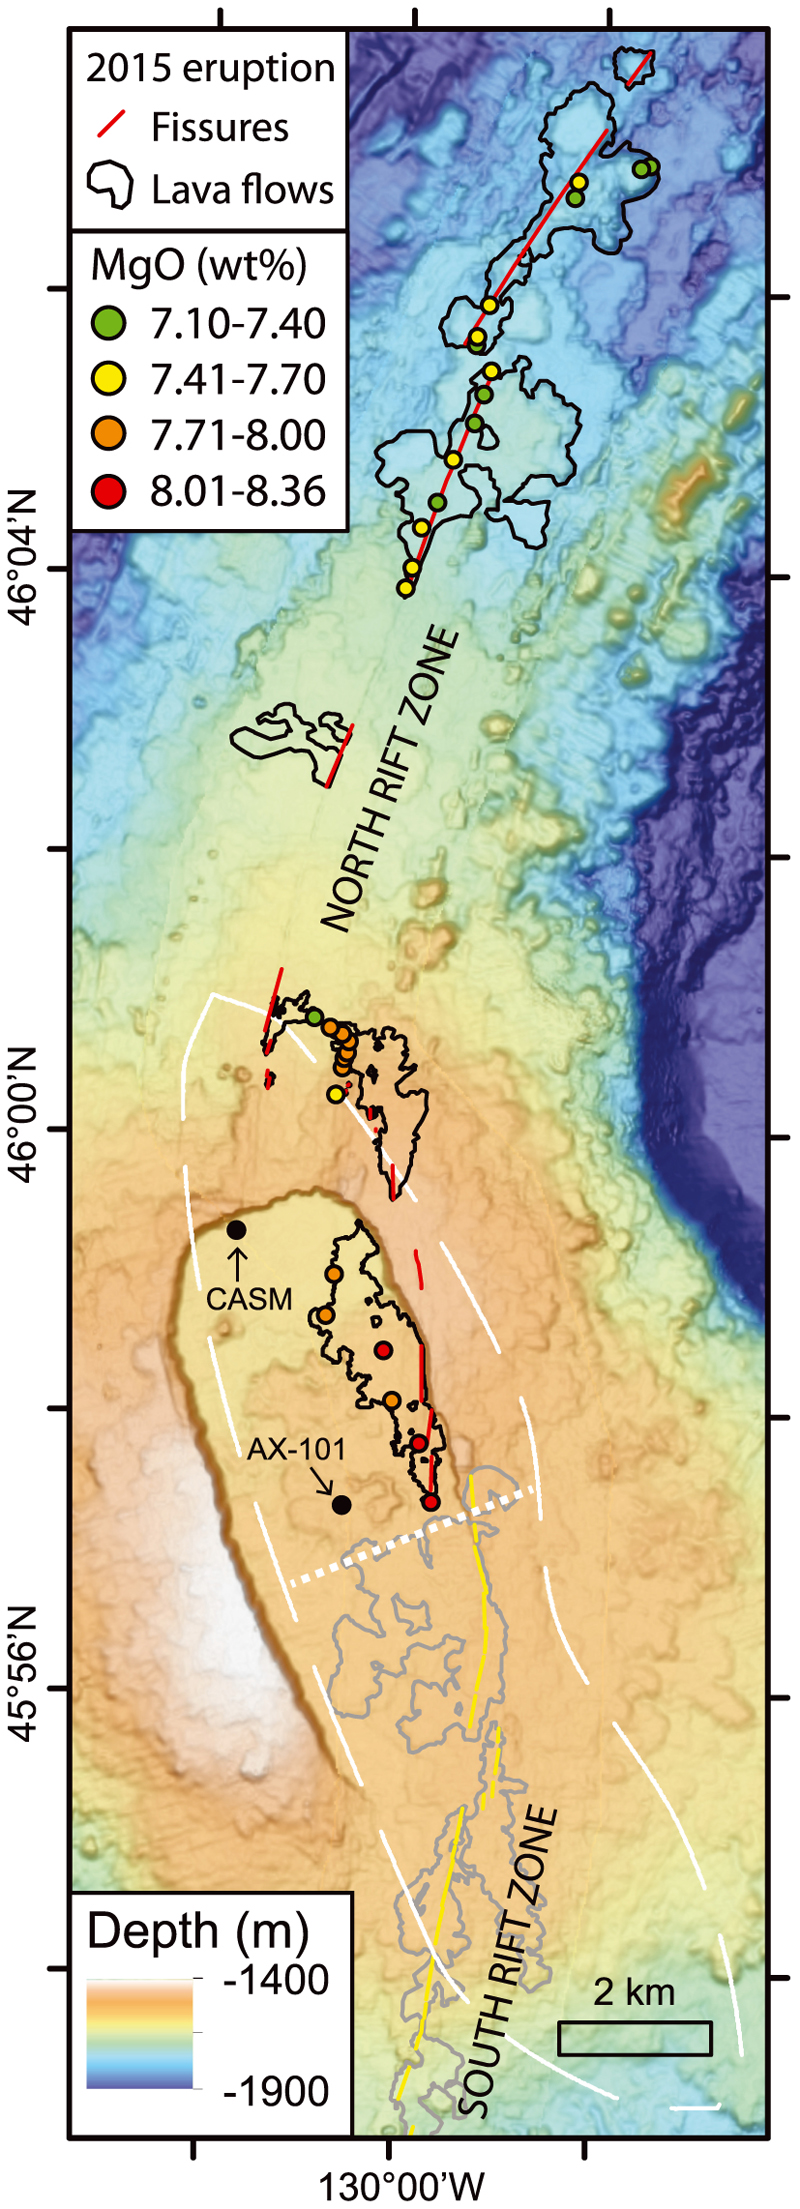 |
Figure 15. Map of 2015 lava flows (black outlines) and new fissures (red lines) in the summit caldera of Axila Seamount and on the north rift zone. Also shown are 2011 lava flows (gray outlines) and eruptive fissures (yellow lines) on the south rift zone. Lava samples collected by ROV are shown by dots, colored according to their MgO content. Dashed white outline indicates a magma reservoir from multichannel seismic results, with a dotted white line separating zones of high melt (south) from crystal mush (north). Canadian American Seamount (CASM) vent field and implanted benchmark AX-101 are labeled. From Chadwick and others (2016). |
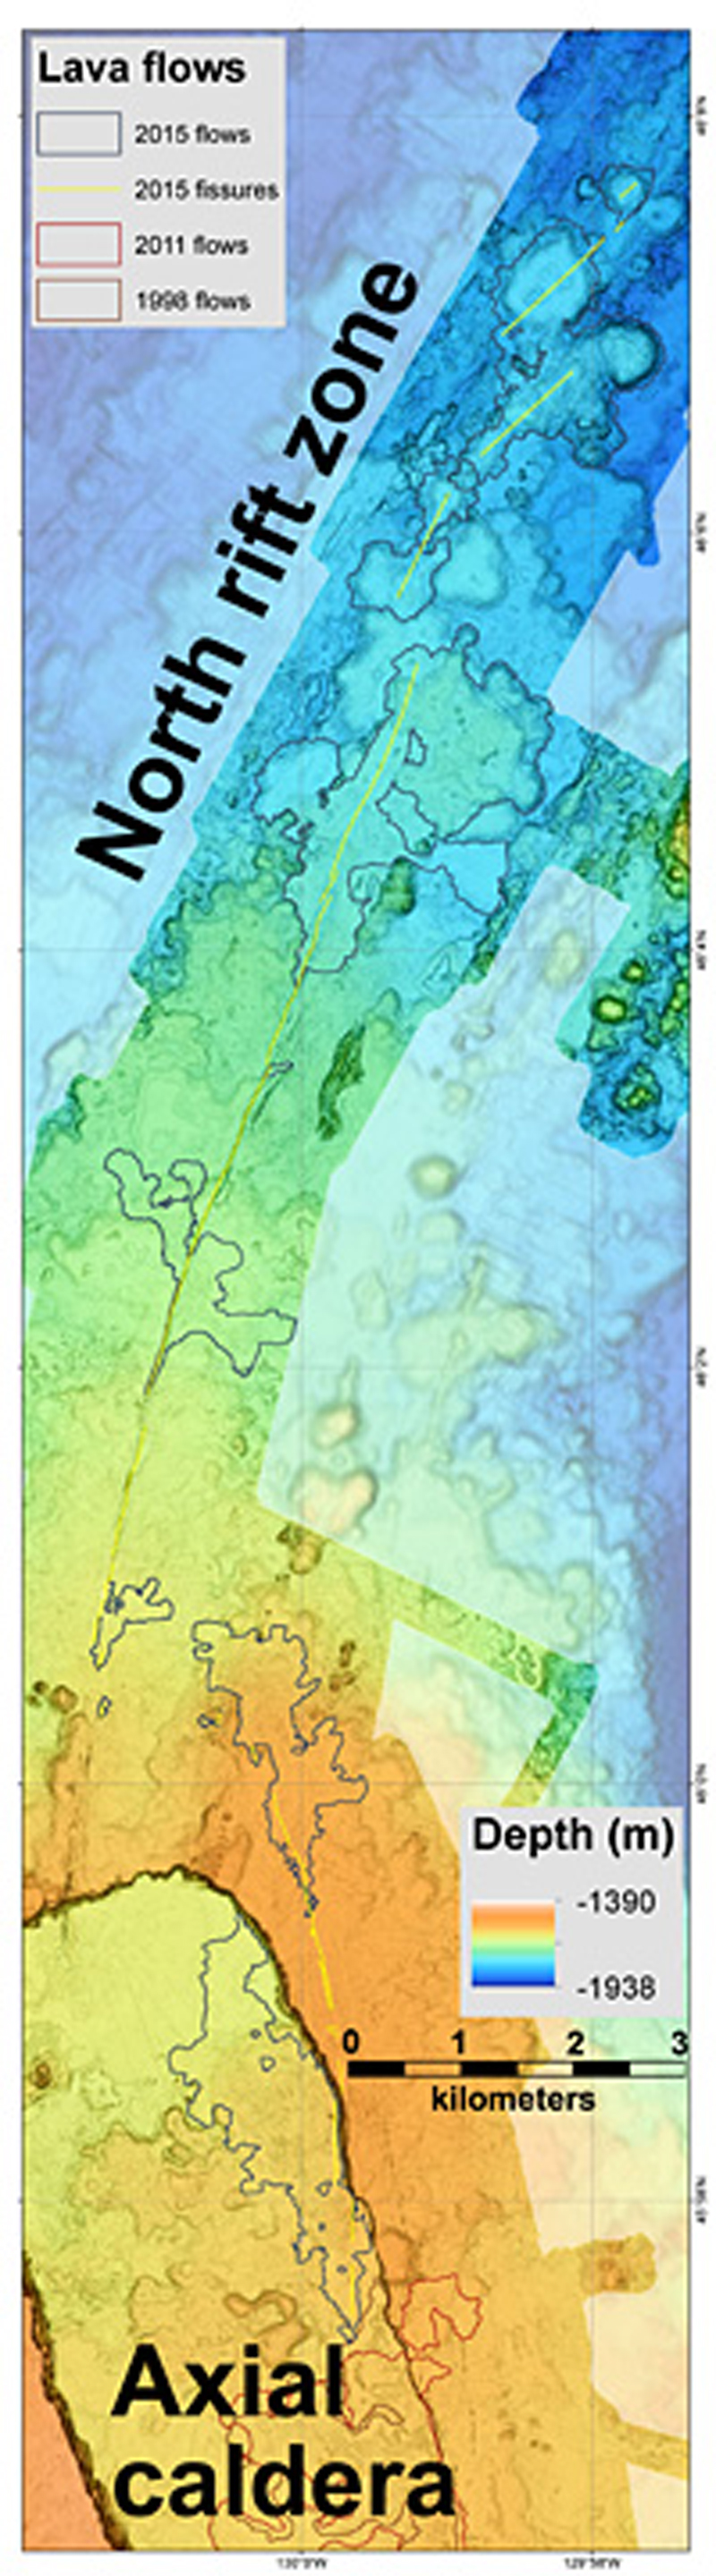 |
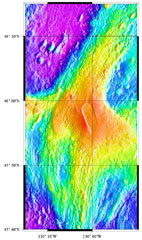
Figure 16. Part of the new map of Axial Seamount produced by MBARI researchers. Black outlines show lava flows from 2015 eruption. From Phys.org (2016). |
According to Wilcock and others (2016), the earthquake rates increases from less than 500 per day to as many as about 2000 per day prior to the eruption on 24 April 2015, then decreased rapidly over the next month following the seismic crisis to a background level of 20 per day. During the eruption there were 600 earthquakes measured every hour, and the seafloor at Axial dropped suddenly by about 2.4 m.
Precise pressure sensors measure vertical movements of the seafloor that take place as the volcano gradually inflates (see figure 14). Deformation of the Axial volcano seafloor as measured by pressure sensors (figure 17) indicated gradual inflation followed by rapid deflation during the three most recent eruptions in 1998, 2011, and 2015.
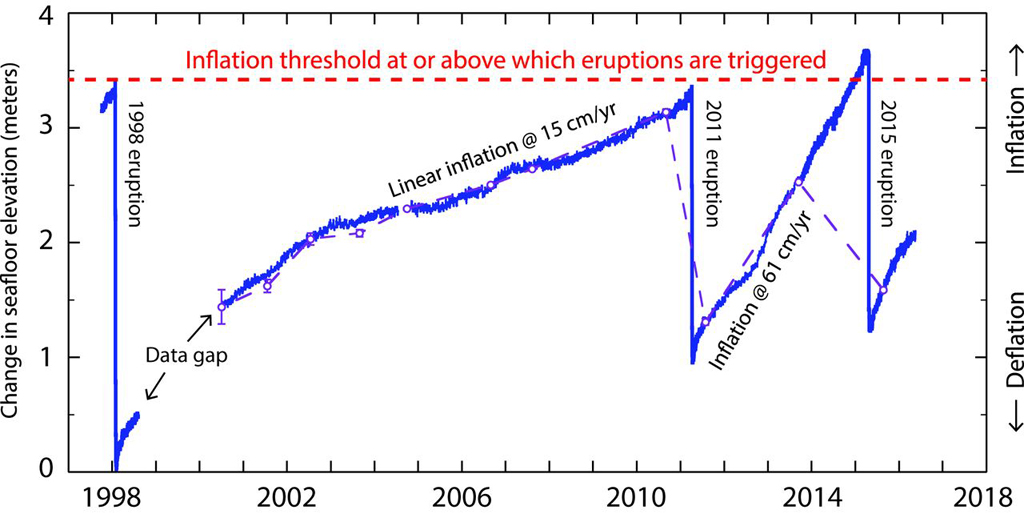 |
Figure 17. Deformation time series at the Axial Seamount caldera center, showing change in seafloor elevation as a function of time from 1998 to about May 2016. Long-term time series of inflation and deflation at the center of the caldera to 19 May 2016. Purple open dots represent mobile pressure recorder measurements (error bars indicate 1 SD); blue curves show bottom pressure recorder data (drift-corrected after 2000). The relative depth of data before and after the 1998–2000 gap in measurements is unknown. From Nooner and Chadwick (2016). |
References: Chadwick, W.W., Jr., Paduan, J.B., Clague, D.A., Dreyer, B.M., Merle, S.G., Bobbitt, A.M., Caress, D.W., Philip, B.T., Kelley, D.S., and Nooner, S.L., 2016 (15 December), Voluminous eruption from a zoned magma body after an increase in supply rate at Axial Seamount, Geophysical Research Letters, v. 43, issue 23, pp. 12,063-12,070; DOI: 10.1002/2016GL071327.
Nooner, S.L., and Chadwick, W.W., Jr., 2016 (16 December), Inflation-predictable behavior and co-eruption deformation at Axial Seamount, Science, v. 354, issue 6318, pp. 1399-1403; DOI: 10.1126/science.aah4666.
Phys.org, 2016 (15 Dec), MBARI's seafloor maps provide new information about 2015 eruption at Axial Seamount (URL: https://phys.org/news/2016-12-mbari-seafloor-eruption-axial-seamount.html).
Wilcock, W.S.D., Tolstoy, M., Waldhauser, F., Garcia, C., Tan, Y.J., Bohnenstiehl, D.R., Caplan-Auerbach, J., Dziak, R.P., Arnulf, A.F., and Mann, M.E., 2016 (16 Dec), Seismic constraints on caldera dynamics from the 2015 Axial Seamount eruption, Science, v. 354, issue 6318, pp. 1395-1399; DOI: 10.1126/science.aah5563.
Information Contacts: William Chadwick, Cooperative Institute for Marine Resources Studies (CIMRS), Oregon State University, and NOAA/PMEL Earth-Ocean Interactions Program, Hatfield Marine Science Center, 2115 S.E. OSU Dr., Newport, OR 97365, USA (URL: http://www.pmel.noaa.gov/eoi/).
An eruption at Axial Seamount, inferred to have started at 2230 on 23 April with an earthquake swarm, was confirmed during 14-29 August by bathymetric data and observations made during a ROV Jason dive. Two large lava flows from the N rift zone (8-16 km N of the summit caldera) were at most 127 m thick; some of the thicker areas had drained collapse features indicating they had molten interiors when emplaced. The ROV traversed the flows for about 2 km. New, thinner lava flows were also identified in the NE summit caldera and on the NE rim.
Source: Oregon State University's Marine Science Center and NOAA/PMEL EOI Program
Geologists reported that starting at 2230 on 23 April thousands of small earthquakes were detected at the Axial Seamount, and then the seafloor dropped by 2.4 m over a three-day period. It was unclear if the earthquakes and deflation meant an eruption or a large intrusion of magma that did not reach the surface.
Source: Oregon State University's Marine Science Center and NOAA/PMEL EOI Program
Reports are organized chronologically and indexed below by Month/Year (Publication Volume:Number), and include a one-line summary. Click on the index link or scroll down to read the reports.
Seismicity indicates eruption in late January
Beginning at 0400 on 25 January 1998, the most intense seismicity yet observed by the NOAA/PMEL T-phase Monitoring System was detected in the NE Pacific. The system uses acoustic information from the U.S. Navy Sound Surveillance System (SOSUS). Three small earthquakes preceded the activity on 24 January during 1900-2100; within hours, ~100 events/hour were occurring. The high rate of seismicity sustained for 2.5 days.
Although the initial level of activity was higher at Axial, the character of the seismicity was very similar to that observed in 1993 at CoAxial Segment (BGVN 18:07) and in 1996 at the N end of the Gorda Ridge (BGVN 21:02 and 21:06); both episodes were later confirmed to be eruptive events.
Initial seismic activity was located on the summit and S flank of Axial Seamount (figures 1, 2, and 3) on the central Juan de Fuca Ridge at 45.92°N, 130.00°W (~480 km W of Cannon Beach, Oregon). After ~10 hours of activity, earthquake epicenters began to migrate S along the rift zone (figure 2). The gap in epicenter activity between 45.80°N and 45.87°N could not be explained.
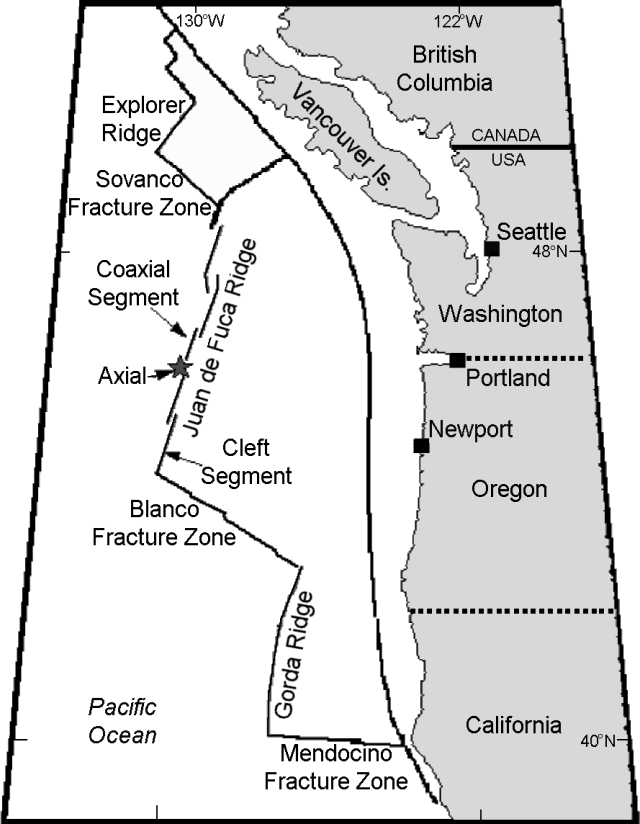 |
Figure 1. Map of plate boundaries and other features associated with the Juan de Fuca Ridge in the NE Pacific. Courtesy of NOAA/PMEL. |
 |
Figure 2. Latitude of earthquake epicenters at Axial Seamount during 25-27 January 1998. In this interval, epicenters migrated onto the seamount's S flanks. The migration rate was similar that observed during earlier episodes at both CoAxial and Gorda Ridge sites. Activity focused at 45.725 N on the first half of 26 January and at 45.64 N late on 26 January may represent secondary eruptive centers. Courtesy of NOAA/PMEL. |
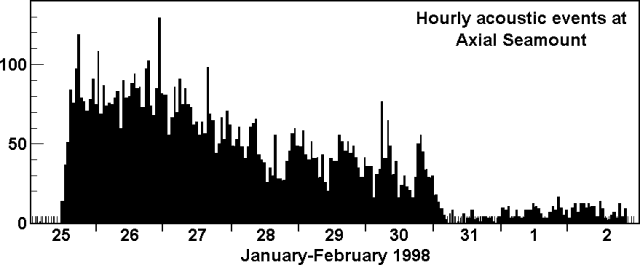 |
Figure 3. Number of events per hour at Axial Seamount during 25 January-2 February 1998. On 31 January the closest SOSUS arrays failed to operate. Courtesy of NOAA/PMEL. |
The onset of activity and migration of epicenters seen during this event were characteristic of shield volcano eruptions and prior sea floor eruptive episodes detected by SOSUS. The initiation of high levels of seismic activity without a large seismic main shock is considered typical of volcanic activity. In addition, the relatively slow migration of epicenters down-rift was judged to be characteristic of a lateral dike injection and possibly of a flank eruption.
Associated with this seismicity, on 25 January at 1707 and on 26 January at 1128, two M 4.5 earthquakes were recorded by seismic networks in the Pacific Northwest of the US. The high-angle normal faulting with NW strike was consistent with movement along the faults bounding the summit caldera of Axial Seamount. The faulting was judged to be associated with readjustment of the caldera in response to the removal of magma beneath the summit.
On 28 January activity continued at a rate of 30-40 events/hour and epicenters continued migrating S. Epicenters were located as far S as 45.47°N, compared to 45.92°N during the initial activity (figure 2). In addition, on 28 January a M 4.7 earthquake was recorded.
During the night of 28-29 January, seismicity dropped to 25 events/hour but increased in the morning to 50 events/hour. As of 29 January, the epicenters had stopped migrating, going no farther S than 45.47°N and focusing at 45.50°N. By 0830 on 29 January the total number of earthquakes detected had reached 6,000. On 30 January, seismic activity continued with 20-30 events/hour.
Although on 31 January three SOSUS arrays were disabled, two returned to service by 1 February. The disabled equipment affected the number of apparent events and limited the ability to locate events accurately. Still, activity decreased steadily in early February; on 1 February, there were 8-10 events/hour, on 2 February, 5-10 events/hour, and on 3 February, 3-5 events/hour. By 5 February, the seismicity had ceased; nearly 8,200 earthquakes were detected during the episode.
Instrumentation at the site currently includes two volcanic systems monitors that measure tilt, pressure, harmonic tremor, ocean current velocity, and water temperature, as well as an acoustic extensometer array. A field response using the Oregon State University research vessel Wecoma was tentatively scheduled for mid-February. In addition, a full Ocean Bottom Seismometer array will be deployed in summer 1998.
Axial rises 700 m above the mean level of the ridge crest and is the most magmatically robust and seismically active site on the Juan de Fuca Ridge between the Blanco Fracture Zone and the Cobb offset (figure 1). The summit is marked by an unusual rectangular-shaped caldera (3 x 8 km) that lies between the two rift zones. The caldera is defined on three sides by a boundary fault of up to 150 m relief. Hydrothermal vents colonized with biological communities are located near the caldera fault or along the rift zones. Following the discovery of hydrothermal venting N of the caldera in 1983, a concentrated mapping and sampling effort was made in the mid-late 1980s.
Reference. Results from a broad range of studies at Axial Seamount were published in a special issue of the Journal of Geophysical Research (vol. 95, no. B8, August 10, 1990).
Information Contacts: Chris Fox, Bob Dziak, and Bob Embley, NOAA Pacific Marine Environmental Laboratory (PMEL), 2115 SE Osu Drive, Newport, OR 97365 USA (URL: https://www.pmel.noaa.gov/).
Hydrothermal plumes detected on research cruise suggest lava extrusion
An episode of intense seismicity occurred at Axial Seamount during 25 January-early February (see map, BGVN 23:01). In response, a team of scientists sailed aboard Oregon State University's research vessel Wecoma during 9-16 February. The following report summarizes the preliminary findings of the Axial Response Team (ART). Although the team found evidence of extensive new venting at Axial Volcano, vigorous event plumes were absent.
Despite wind gusts and high seas, the team deployed 8 ocean bottom hydrophones on 10 February around the intersection of Axial's S rift zone and summit caldera. In addition, the team made measurements of water conductivity, temperature, depth, and light attenuation at 16 sites (figure 4). The light- attenuation measurements were used to estimate particle loading in the hydrothermal plumes.
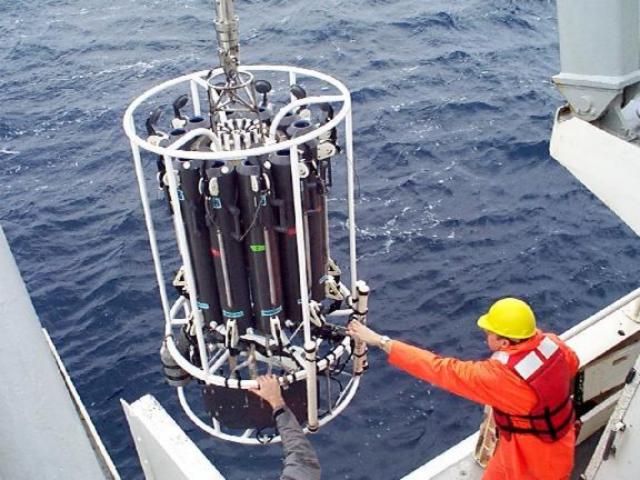 |
Figure 4. Deployment of a water-sampling instrument package during the ART cruise. Ron Greene of Oregon State University is on the right. Courtesy of R. Embley. |
Some instruments had been previously deployed and were in place on the sea floor before and during the event, including two volcanic system monitors and an array of three temperature sensor/current-meter moorings along the rectangular caldera's SE corner at the center of the summit epicenter locations. Earlier pre-event data on plume distribution and chemistry were gathered during a research cruise in the summer of 1997, a time when very weak plumes were present close to the sea floor.
Hydrothermal discharge from Axial seamount's summit was roughly an order of magnitude greater than before the eruption. The caldera's S end was filled with plumes that had temperature anomalies approaching 0.2°C and intense light-attenuation coefficients (~0.2/m); these plumes rose at least 200 m above the ocean bottom. The temperature anomalies were about twice as great as those seen after the 1993 CoAxial eruption (BGVN18:07). The plume was tracked ~20 km SW, where it remained as strong as in the caldera. The areal pattern of integrated relative light-attenuation (figure 5) indicated that the plume drifted steadily SW, in agreement with past current-meter readings. Both methane and hydrogen gas concentrations were higher during the cruise than in previous measurements, reaching concentrations as high as 600 nM and 200 nM, respectively. Background concentrations for methane are typically <1 nM.
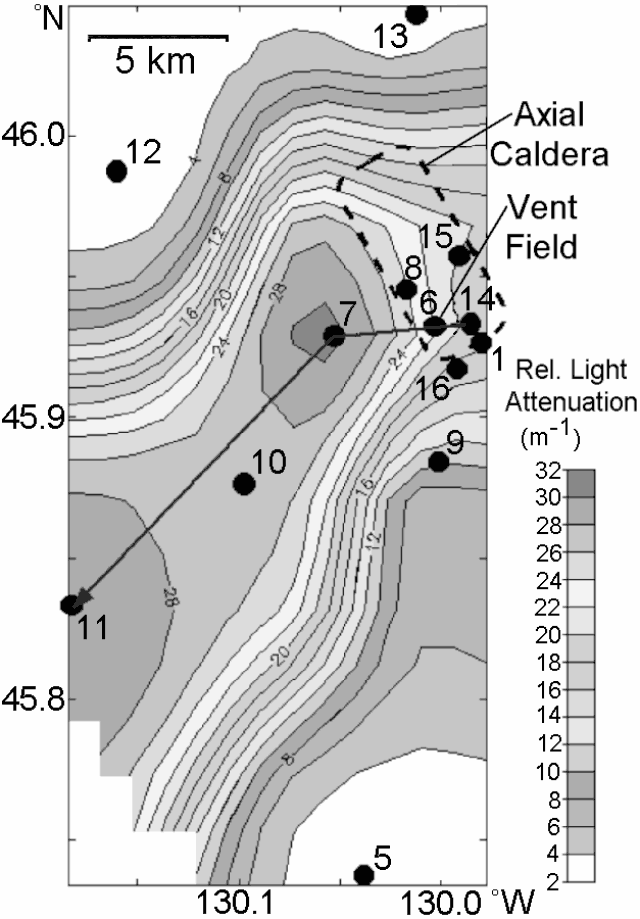 |
Figure 5. Plan view showing contours of relative light-attenuation that has been integrated over depths of 1.1-1.5 km. Dots indicate water sampling stations; the heavy line indicates the transect shown in figure 6. Increased suspended particles cause greater light-attenuation. Courtesy of NOAA/PMEL. |
Vertical profiles gathered at the water sampling stations revealed hydrothermal signal maxima occurring at shallow (1.2-1.4 km) and/or deep (1.4-1.5 km) locations. A very strong plume at the S end of the caldera at a depth of ~1.4-1.5 km was detected on 12 February. The plume's peak (~1.47 km depth) had a light- attenuation coefficient >0.440/m, a value significantly greater and found at shallower water depths than previously detected over Axial Caldera. Increased mass concentration of particles suspended in the water column causes greater light-attenuation values. Water samples collected from the plume had very high levels of methane (~600 nM); hydrogen gas concentration measured ~4 nM. The profile taken over the vent field (at station 6) revealed a very strong plume with considerable vertical structure that extended ~1.2 km to the sea floor. The plume showed light attenuation (figure 6) and temperature anomalies with maxima occurring at both 1375- and 1425-m depth.
No event plumes were detected directly above the caldera. The team may have arrived after any event plumes had drifted away from the site. The few wispy plumes ~50-80 m thick found almost 600 m above the caldera were possible event plume remnants. No sign of venting was detected along the length of the S rift zone; a dike intrusion was thought to have occurred there during the seismic swarm of late January 1998. The lack of plumes differed from the 1993 CoAxial eruption, where the intrusion was associated with long plumes.
A small but distinct hydrothermal signal at 1.2-1.3 km depth was detected on 15 February ~18 km S of the caldera, within the central seismic cluster. The signal was interpreted as a plume remnant. Water sampling revealed methane concentrations of 5-20 nM but no elevated H2 concentrations. This indicated either that the original hydrothermal source was low in H2 or that the H2 had been lost to microbial oxidation.
A NE-SW transect of relative light attenuation (figure 6) suggested that the plume thickened and shallowed downstream from the caldera. The changes in intensity along the transect may have arisen from one or more causes, including fluctuations in water speed, temporal changes in the intensity of venting, and initial venting of more buoyant fluids.
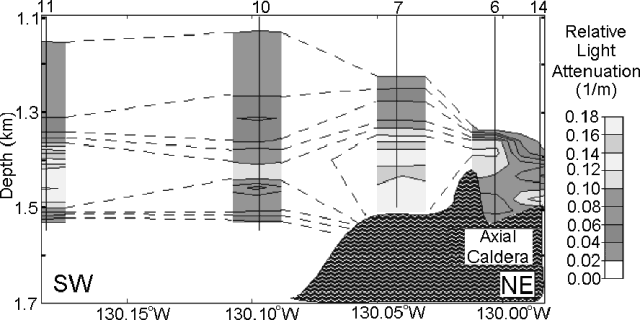 |
Figure 6. Cross-section showing relative light attenuation in and adjacent to Axial's caldera. Water-sampling sites (eg., 10, 11, etc.) are labeled along the top axis. The line of the cross section appears on figure 5. Courtesy of NOAA/PMEL. |
Particles in water samples from stations 11 and 1 (figure 5) were studied by scanning electron microscope (SEM). Samples from station 11 contained many angular glass shards up to 95 micrometers in diameter. Many of the shards had precipitated halite particles attached to them; precipitation of halite coatings on altered glass surfaces was consistent with heating seawater to >400°C at 1.5 km depth. Similar coatings were found on basaltic particles from the 1993 CoAxial eruption.
Many small particles with high iron concentrations were also observed. Although these particles were of similar size to iron oxides from past eruptive sites, their shapes were more angular than the typically rounded, globular shapes seen in the past. Chemical analysis showed that these particles also contained halides and a higher than usual ratio of phosphorus to iron. Analysis of particles from station 1 showed abundant elemental sulfur. These observations were taken to suggest a lava eruption on the SE caldera floor.
Axial Volcano rises 700 m above the mean level of the ridge crest and is the most magmatically robust and seismically active site on the Juan de Fuca Ridge between the Blanco Fracture Zone and the Cobb offset. The summit is marked by an unusual rectangular-shaped caldera (3 x 8 km, figure 5) that lies between the two rift zones. The caldera is defined on three sides by a boundary fault of up to 150 m relief. Organisms have colonized the hydrothermal vents near the caldera faults and the rift zones. Following the initial discovery of venting N of the caldera in 1983, a concentrated mapping and sampling effort was made in the mid-late 1980s.
Information Contacts: Jim Cowen, Department of Oceanography, School of Ocean and Earth Science and Technology, University of Hawai'i at Manoa, 1000 Pope Road, Honolulu, HI USA 96822; Ed Baker, NOAA Pacific Marine Environmental Laboratory (PMEL), 7600 Sand Point Way N.E., Seattle, WA USA 98115; Bob Embley, NOAA Pacific Marine Environmental Laboratory (PMEL), 2115 SE OSU Drive, Newport, OR 97365 USA (URL: http://www.pmel.noaa.gov/).
April 2011 eruption follows deformation-based forecast issued in 2006
According to a press release from Oregon State University on 9 August 2011, a team of scientists recently discovered a recent eruption of Axial Seamount, an undersea volcano located about 400 km off the Oregon coast (figure 7). Both fresh lava that disturbed and covered in-situ instruments and a small earthquake swarm detected by ocean-bottom hydrophones and land-based seismometers helped fix the eruption date at around 6 April 2011. The scientists had forecast this eruption about 5 years ago-touted as the first successful forecast of an undersea volcano erupting.
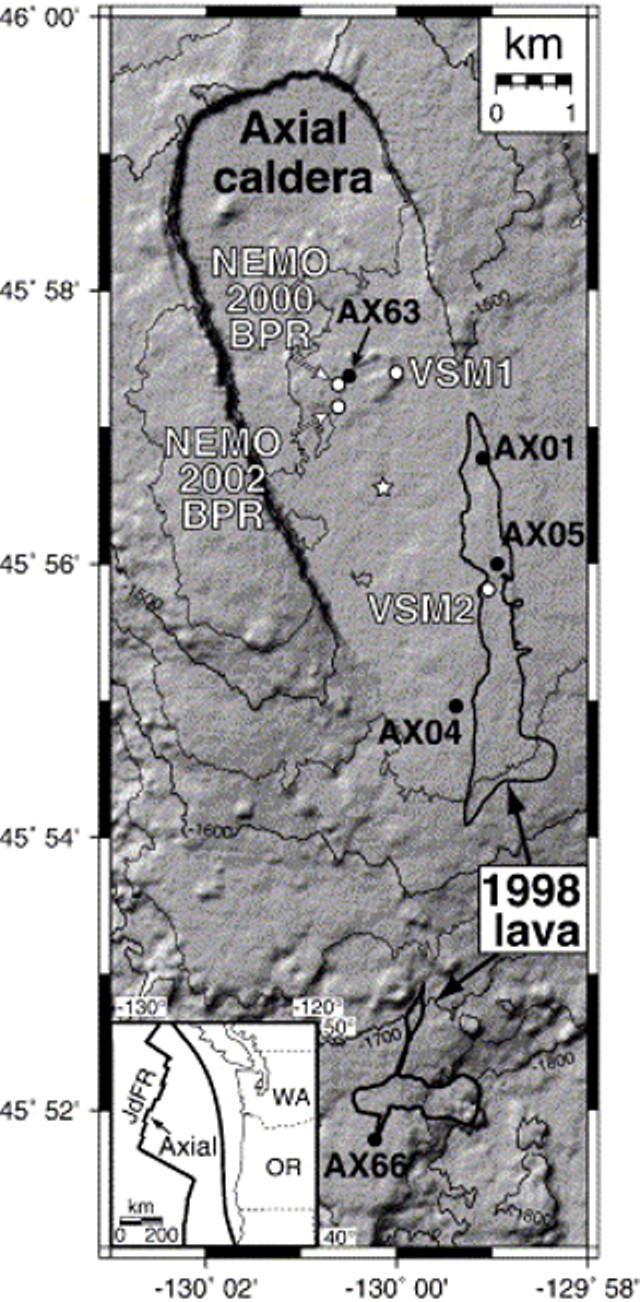 |
Figure 7. Map of Axial submarine caldera showing the 1998 lava flows (black outline), which omits the exact area of the April 2011 lava (which is not yet released publically). Dots indicate locations of bottom pressure recorders (BPR; white dots) and seafloor benchmarks for mobile pressure recorders (MPR; black dots), which were collected via a remotely operated vehicle. Inset shows location of Axial Seamount in relation to the Juan de Fuca Ridge off the Washington-Oregon coast. As discussed briefly in text, the white star indicates the location of the best fit (Mogi, 1958) inflation source for MPR measurements between 2000 and 2004 (Chadwick and others, 1999). From Chadwick and others, 2006. |
The Mogi (1958) model predicts deformation due to a small spherical zone of expansion at depth, thus modeling magma intrusion. For ease of computation, the zone is assumed to be embedded in a homogeneous, isotropic, elastic half-space. The modeling technique is widely used to reconcile surface deformation at active volcanoes with plausible intrusions at depth. In this case it modeled the deformation of the ocean floor (figure 7, see caption).
Bill Chadwick (National Oceanic and Atmospheric Administration (NOAA) and Oregon State University (OSU)), and Scott Nooner (Lamont-Doherty Earth Observatory (LDEO)) have been monitoring Axial Seamount for more than a decade. In Chadwick and others (2006) they forecast that Axial would erupt before the year 2014. Their forecast was based on a series of seafloor pressure measurements that indicated the volcano was inflating.
Axial last erupted in 1998 (BGVN 23:01 and 23:02) and Chadwick, Nooner, and colleagues have monitored it ever since. They used precise bottom pressure sensors to measure vertical movements of the floor of the caldera. They discovered that the volcano was gradually inflating at the rate of 15 cm/yr, indicating that magma was rising and accumulating under the volcano summit.When Axial erupted in 1998, the floor of the caldera suddenly subsided or deflated 3.2 m as magma was removed from underground to erupt at the surface. The scientists estimated that the volcano would be ready to erupt again when re-inflation pushed the caldera floor back up to its 1998 level.
As noted in Chadwick and others (2006), "If inflation continues at the current rate of 19 cm/yr at the caldera center, it will take another 9 years (16 years total) for the caldera to fully re-inflate to its January 1998 level (or in about 2014). If one assumes that Axial (seamount) would then be poised to erupt again, such a recurrence interval (~ 16 years), although admittedly speculative, would not be unreasonable since it is also the time necessary to accumulate ~ 1 m of extensional strain (the mean thickness of dikes seen in ophiolites (Kidd, 1977) and tectonic windows (Karson, 2002)) at the Juan de Fuca Ridge's spreading rate of 6 cm/yr (Riddihough, 1984)."
Nooner was reported to state that "We now have evidence, however, that Axial Seamount behaves in a more predictable way than many other volcanoes-likely due to its robust magma supply coupled with its thin crust, and its location on a mid-ocean ridge spreading center. It is now the only volcano on the seafloor whose surface deformation has been continuously monitored throughout an entire eruption cycle."
The discovery of the new eruption came on 28 July 2011 when Chadwick and Nooner, along with University of Washington colleagues Dave Butterfield and Marvin Lilley, led an expedition to Axial aboard the RV Atlantis (operated by the Woods Hole Oceanographic Institution). Using Jason, a remotely operated robotic vehicle (ROV), they discovered a new lava flow on the seafloor that was not present a year ago (figure 8).
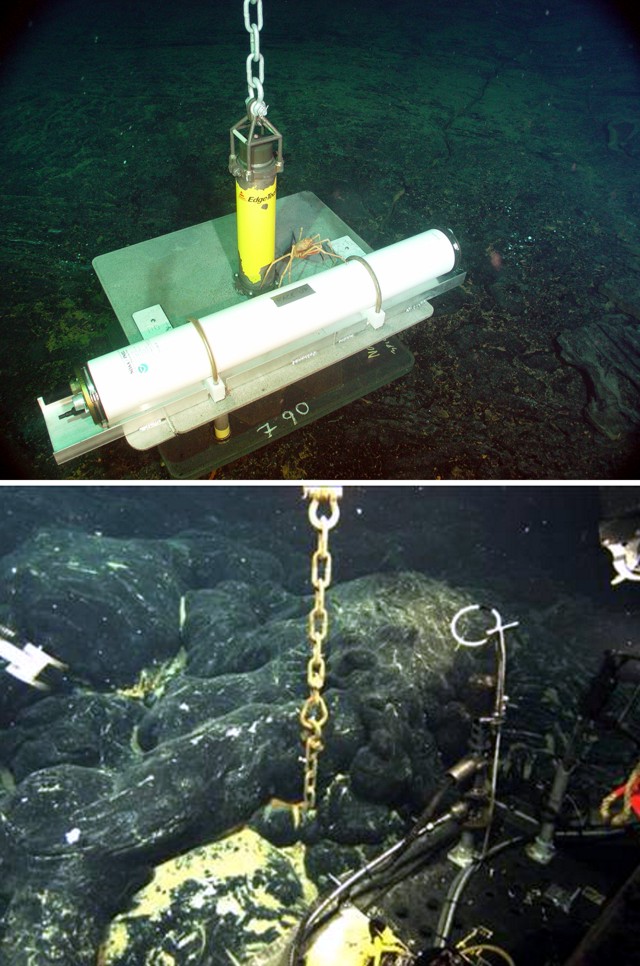 |
Figure 8. (top) A spider crab inspects an ocean-bottom hydrophone mooring at Axial seamount before its 2011 eruption. The hydrophone, in the white pressure case, is designed to detect undersea earthquakes. The chain extending above the pedestal for the hydrophone appears in the photo below. Photo taken 31 August 2003, courtesy of Bill Chadwick and Bob Dziak, Oregon State University (9 August 2011). (bottom) On 28 July 2011, the chain is all that is visible of this ocean-bottom hydrophone buried in about 1.8 m of new lava from an April 2011 eruption of Axial Seamount. Photo courtesy of Bill Chadwick and Bob Dziak, Oregon State University (9 August 2011). |
Chadwick commented that "When we first arrived on the seafloor, we thought we were in the wrong place because it looked so completely different. We couldn't find our markers or monitoring instruments or other distinctive features on the bottom. When eruptions like this occur, a huge amount of heat comes out of the seafloor, the chemistry of seafloor hot springs is changed, and pre-existing vent biological communities are destroyed and new ones form. Some species are only found right after eruptions, so it is a unique opportunity to study them."
The first Jason ROV dive of the July 2011 expedition targeted a field of black smokers (dark, mineral laden hot springs) on the caldera's W side, an area beyond the reach of the new lava flows. Butterfield had been tracking the chemistry and microbiology of hot springs around the caldera since the 1998 eruption.
He noted that "The hot springs on the W side did not appear to be significantly disturbed, but the seawater within the caldera was much murkier than usual, and that meant something unusual was happening. When we saw the 'Snowblower' vents blasting out huge volumes of white floc and cloudy water on the next ROV dive, it was clear that the after-effects of the eruption were still going strong. This increased output seems to be associated with cooling of the lava flows and may last for a few months or up to a year."
The crew recovered seafloor instruments, including two bottom-pressure recorders and two ocean-bottom hydrophones, which showed that the eruption took place on 6 April 2011.
A third hydrophone was found buried in the new lava flows. According to Chadwick, "So far, it is hard to tell the full scope of the eruption because we discovered it near the end of the expedition. But it looks like it might be at least three times bigger than the 1998 eruption." The lava flow from the 6 April 2011 eruption was at least 2 km wide, the scientists noted.
The bottom-anchored instruments documented hundreds of tiny earthquakes during the volcanic eruption, but land-based seismic monitors and the Sound Surveillance System (SOSUS) hydrophone array operated by the U.S. Navy only detected a handful of them on the day of the eruption because many components of the hydrophone system were offline.
"Because the earthquakes detected back in April at a distance from the volcano were so few and relatively small, we did not believe there was an eruption," said Bob Dziak, an OSU marine geologist who monitors the SOSUS array. "That is why discovering the eruption at sea last week was such a surprise."
This latest Axial eruption caused the caldera floor to subside by more than 2 m. The scientists will be measuring the rate of magma inflation over the next few years to see if they can successfully forecast the next event.
References. Chadwick, W.W., Jr., Embley, R.W., Milburn, H.B., Meinig, C., and Stapp, M., 1999, Evidence for deformation associated with the 1998 eruption of Axial Volcano, Juan de Fuca Ridge, from acoustic extensometer measurements, Geophysical Research Letters, v. 26, no. 23, pp. 3441-3444 (doi:10.1029/1999GL900498).
Chadwick, W.W., Jr., Nooner, S.L., Zumberge, M.A., Embley, R.W., and Fox, C.G., 2006, Vertical deformation monitoring at Axial Seamount since its 1998 eruption using deep-sea pressure sensors, Journal of Volcanology and Geothermal Research, v. 150, issue 1-3, p. 313-327 (doi:10.1016/j.jvolgeores.2005.07.006).
Karson, J.A., 2002, Geologic structure of the uppermost oceanic crust created at fast- to intermediate-rate spreading centers, Annual Review of Earth and Planetary Science, v. 30, p. 347-384.
Kidd, R.G.W., 1977, A model for the process of formation of the upper oceanic crust, Geophysical Journal of the Royal Astronomical Society, v. 50, issue 1, p. 149-183.
Mogi, K., 1958, Relations between the eruptions of various volcanoes and the deformation of the ground surfaces around them. Bulletin of the Earthquake Research Institute, University of Tokyo, v. 36, p. 99-134.
Riddihough, R., 1984, Recent movements of the Juan de Fuca plate system, Journal of Geophysical Research, v. 89, p. 6980-6994.
Information Contacts: Oregon State University, News and Research Communications, Corvalis, OR (URL: http://oregonstate.edu/ua/ncs/); Bill Chadwick and Bob Dziak, National Oceanic and Atmospheric Administration (NOAA) and Oregon State University (OSU); Scott Nooner.
New reports on April 2011 eruption
William Chadwick recently notified Bulletin editors of three new papers concerning the April 2011 eruption of Axial Seamount: Caress and others, 2012; Chadwick and others, 2012; and Dziak and others, 2012. This eruption, recorded by in situ monitoring instruments (ocean bottom pressure recorders and hydrophones), took place during 6-12 April 2011 (BGVN 36:07) and resulted in an erupted volume of lava calculated by bathymetric remapping of 99 x 106 m3 (Chadwick and others, 2012). The activity took place at the S end of the caldera and the S rift zone (figure 9).
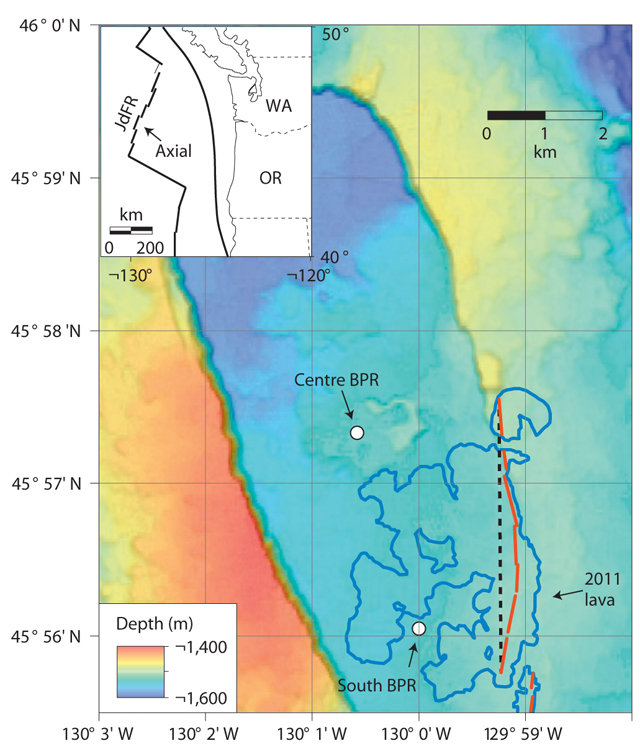 |
Figure 9. Bathymetric map of the summit caldera of Axial Seamount, its rim forming an oval feature elongated NNW-SSE. The insert shows the location of the seamount relative to the W coast of the United States (JdFR, Juan de Fuca Ridge; WA, Washington state; OR, Oregon state). The locations of the two bottom pressure recorders (BPRs) that measured vertical movements of the sea floor during the 2011 eruption are shown, along with the lava flows that were erupted in April 2011 (heavy blue outlines) and their eruptive vents (red lines) (from Caress and others, 2012). The black dashed line shows the location of the model dyke (3.3 km x 2.0 km x 1.0 m) that can reproduce the pre-eruption uplift observed at the BPRs. Courtesy of Chadwick and others, 2012. |
The first recorded eruption of Axial Seamount occurred during 25-31 January 1998 (BGVN 23:01, 23:02) with a lava volume estimated by Chadwick to be 29 x 106 m3. Chadwick noted that he was currently preparing a paper detailing the 1998 eruption that may result in a revision of the lava volume from that event.
References. Caress, D.W., Clague, D.A., Paduan, J.B., Martin, J.F., Dreyer, B.M., Chadwick Jr., W.W., Denny, A., and Kelley, D.S., 2012, Repeat bathymetric surveys at 1-metre resolution of lava flows erupted at Axial Seamount in April 2011, Nature Geoscience, v. 5, p.483-488 (DOI: 10.1038/NGEO1496).
Chadwick Jr., W.W., Nooner, S.L., Butterfield, D.A., and Lilley, M.D., 2012, Seafloor deformation and forecasts of the April 2011 eruption at Axial Seamount, Nature Geoscience, v. 5, p.474-477 (DOI: 10.1038/NGEO1464).
Dziak, R.P., Haxel1, J.H., Bohnenstiehl, D.R., Chadwick Jr., W.W., Nooner, S.L., Fowler, M.J., Matsumoto, H., and Butterfield, D.A., 2012, Seismic precursors and magma ascent before the April 2011 eruption at Axial Seamount, Nature Geoscience, v. 5, p.478-482 (DOI: 10.1038/NGEO1490).
Information Contacts: William W. Chadwick, NOAA and Oregon State University.
Cabled array provides data for suspected underwater eruption in April 2015
Axial Seamount appears to have undergone an eruption starting 23-24 April 2015 Pacific Time (local time= UTC-08 hours, or Day Light Saving time, 8 March to 1 November = UTC-07 hours on the US west coast). At this time, evidence of the eruption stems from increases in seismicity, deformation, and seawater temperature around Axial, recorded in the weeks after 23 April UTC. The length of the eruption is currently unknown; however, it likely lasted days to weeks (William Chadwick, personal communication). Two expeditions to Axial are planned for this coming July and August on R/V Thompson, during which further investigation regarding the 2015 eruption will be completed (personal communication).
Axial Seamount sits along the Juan de Fuca ridge ~480 km off the coasts of Oregon and Washington (figure 1 in BGVN 23:01). Eruptions were detected seismically and geodetically in 1998 and 2011 and confirmed shortly after each eruption during submersible dives. Since about 410 AD, the volcano produced over 50 lava flows (Clague and others, 2013). On this basis, Axial is described as the NE Pacific's most active submarine volcano.
In this Bulletin report, we present information on the April 2015 eruption taken from several sources referred to in the text and provided in the Reference list near the end of this report. The sources include (a) an Oregon State University (OSU) online press release (OSU, 2015); (b) blog posts on the website of NOAA's Pacific Marine Environmental Laboratory's (PMEL) Earth-Ocean Interactions Program (EOI) (Chadwick and Nooner, 2015); (c) a post on the Networked Observations and Visualization of the Axial Environment (NOVAE) website (Delaney, 2015); and (d) seismic data posted on William Wilcock's website (Wilcock, 2015).
The last two Bulletin reports (BGVN 36:07 and 37:10) detailed Axial's previous eruption, which occurred during 6-12 April 2011 and erupted 99 x 106 m3 of lava.
Instrumentation. Since September 2014, Axial Seamount has been a part of the Ocean Observatories Initiative's (OOI) Cabled Array, which is operated by the University of Washington. As explained in their online literature (OOI, posting date uncertain1), OOI is funded by the National Science Foundation and is "an integrated infrastructure project composed of science-driven platforms and sensor systems to measure physical, chemical, geological and biological properties and processes from the seafloor to the air-sea interface." The Cabled Array, which straddles the Juan de Fuca and North American plates, is one of OOI's seven arrays worldwide (OOI, posting date uncertain1). Within the Cabled Array, there are seven primary nodes (PN) that are connected to a shore station in Pacific City, Oregon, through ~ 900 km of modified telecommunications cable (OOI, posting data uncertain2). This cable provides the PNs with high power and bandwidth that allows for near real-time interactive and adaptive investigation (OOI, posting date uncertain1). Each PN then delivers power and communication to a range of scientific instructions connected to it, such as those connected to the Axial Seamount PN3B (figure 10).
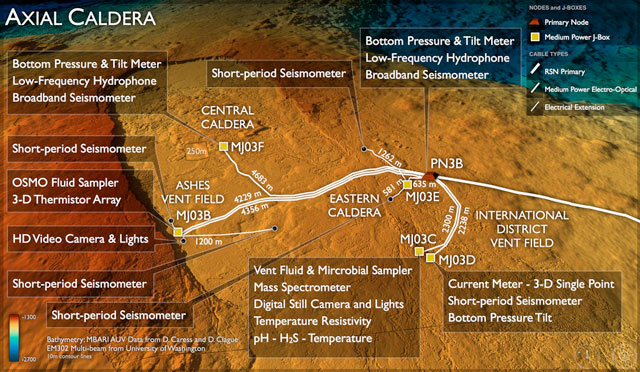 |
Figure 10. Bathymetry map highlighting the various instruments connected to the Axial Seamount Primary Node (PN) 3B. PN3B is one of the seven PNs that comprise OOI's Cabled Array. The white cable (RSN Primary) that goes to the right of the image, connects PN3B and two other PNs (not shown) to the shore station in Pacific City, Oregon. For scale, there is a 250 m square on the map, located next to MJ03F. Image courtesy of Networked Observations and Visualization of the Axial Environment (NOVAE). |
April 2015 eruption. Based on personal communication with Chadwick, around 0530 UTC on 24 April 2015 (2230 Pacific Time on 23 April), increased seismicity was recorded by the instruments in Axial's caldera.
This increased seismicity was the first indication of activity. On 24 April UTC, the daily earthquake count reached nearly 8,000 events/day (figure 11). Before the eruption, the daily earthquake count was generally less than 1,000 events/day (Delaney, 2015). From Wilcock (2015), Bulletin editors obtained a histogram of the daily earthquake count from 16 November 2014 to 14 June 2015; on the histogram, the daily earthquake count from 24 April UTC is represented by the largest bar (figure 11). Wilcock (2015) also provides animations of the preliminary locations of the earthquakes' epicenters at Axial from 23-24 April. The majority of the epicenters were largely clustered on the E side of the caldera, not far from the location of the 2011 eruption (Wilcock, 2015; Delaney, 2015).
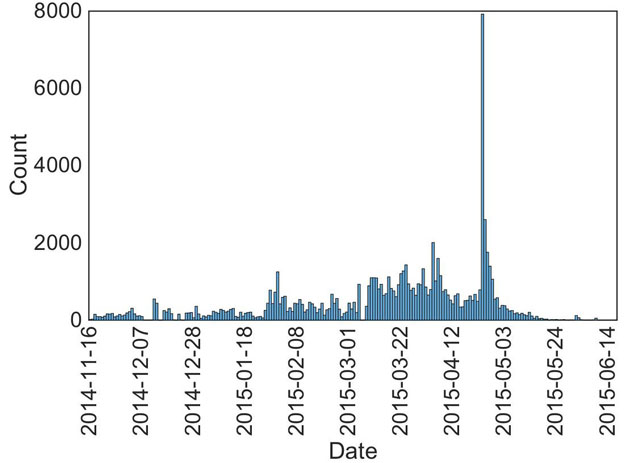 |
Figure 11. Preliminary earthquake histogram showing the daily earthquake counts at Axial Seamount from 16 November 2014 to 14 June 2015. On 24 April UTC, nearly 8,000 earthquakes were recorded (largest bar on the histogram). Dates on the histogram are in UTC. Taken from Wilcock (2015). |
Around 0630 UTC on 24 April 2015 (2330 Pacific Time on 23 April), deformation at Axial Seamount increased considerably (Delaney, 2015). According to Delaney (2015), the instrument that measures bottom pressure and tilt on the seafloor at the Central Caldera site (figure 10) began to indicate deflation (subsidence). This deflationary event was reported to have lasted approximately 12 hours with the seafloor dropping as much as 2.4 m (Delaney, 2015; OSU, 2015). Bulletin editors learned from personal communication with Chadwick that the duration of subsidence at Axial may actually be on the order of ~10 days with the greatest amount of subsidence occurring within the first 24 hours of activity.
Although there was initial uncertainty regarding whether the observed deflation and earthquakes were associated with an eruption (or merely an intrusion), Chadwick and Nooner (2015) cited increases in seawater temperature data that occurred in the days and weeks following 24 April UTC. The observed increases suggested that lava erupted somewhere nearby on the seafloor (Chadwick and Nooner, 2015). The temperature data was collected by the three bottom pressure/tilt instruments, located in Central and Eastern Caldera and the International District Vent District (figure 10). The graph in figure 12 displays the increases documented in the temperature data (PMEL/EOI, 2015).
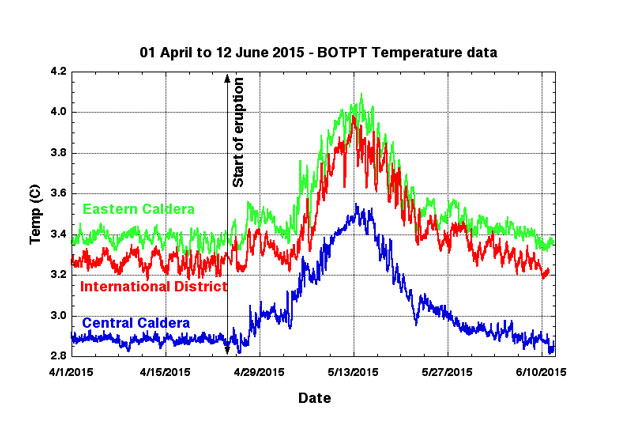 |
Figure 12. Graph presenting seawater temperature data versus date (UTC, 1 April 2015 to 10 June 2015) collected by the bottom pressure and tilt instruments that are part of the OOI Cabled Array. These instruments detected increases in temperature that started on 24 April (indicated on graph) and peaked on 13 May 2015. By 10 June, the temperatures appear to have decreased to levels similar to before the eruption. The increases in temperature appear to be on the order of ~0.6-0.8 °C. Courtesy of PMEL/EOI, 2015 |
For reference, the 2.4 m deflation that occurred is similar to the amount detected in 2011 (BGVN 36:07). Delaney (2015) quoted Chadwick as saying that the amount of deflationary subsidence suggested that a similar amount of magma erupted in 2015 and during Axial's 2011 eruption.
References. Chadwick W and Nooner S, 2015, Successful forecast of the 24 April 2015 eruption at Axial Seamount, NOAA's Pacific Marine Environmental Laboratory's (PMEL) Earth-Ocean Interactions Program (EOI), URL: http://www.pmel.noaa.gov/eoi/axial_blog.html, accessed on 15 June 2015
Clague D A, Breyer B M, Paduan J B, Martin J F, Chadwick W W, Caress D W, Portner R A, Guilderson T P, McGann M L, Thomas H, Butterfield D A, Embley R W, 2013, Geologic history of the summit of Axial Seamount, Juan de Fuca Ridge. Geochem Geophys Geosystems, 14: 4403-4443
Delaney, J, 2015, Axial Activity Intensifies, URL: http://novae.ocean.washington.edu/file/Axial_Activity_Intensifies, accessed on 16 June 2015
NOVAE (Networked Observations and Visualization of the Axial Environment), 2015 http://novae.ocean.washington.edu/story/Latest_News, accessed on 15 June 2015
OSU (Oregon State University), 2015, Researchers think Axial Seamount off Northwest coast is erupting – right on schedule, URL: http://oregonstate.edu/ua/ncs/archives/2015/apr/researchers-think-axial-seamount-northwest-coast-erupting-–-right-schedule, accessed on 15 June 2015
OOI (Ocean Observatories Initiative), posting date uncertain1, OOI Frequently Asked Questions, URL: http://oceanobservatories.org/about/frequently-asked-questions/#01, accessed on 22 June 2015
Ocean Observatories Initiative (OOI), Cabled Array (URL: http://oceanobservatories.org/, accessed on 17 June 2015).
PMEL/EOI (NOAA's Pacific Marine Environmental Laboratory's Earth-Ocean Interactions Program), 2015, Data from the 24 April 2015 eruption at Axial Seamount, URL: http://www.pmel.noaa.gov/eoi/rsn/24April2015_event.html, accessed on 15-22 June 2015
Wilcock, W, 2015, Welcome to William Wilcock's desktop computer, URL: http://alben.ocean.washington.edu/, accessed on 16 June 2015.
Information Contacts: William Chadwick, NOAA and Oregon State University, Hatfield Marine Science Center, 2115 S.E. Oregon State University Drive, Newport, OR 97365, USA; Scott Nooner, Department of Geography and Geology, University of North Carolina Wilmington, 601 South College Road, Wilmington, NC 28403-5944, USA (URL: http://people.uncw.edu/nooners/Nooner/); Oregon State University, News and Research Communications, Corvalis, OR (URL: http://oregonstate.edu/ua/ncs/); William Wilcock, School of Oceanography, University of Washington, Marine Sciences Building, 1501 NE Boat Street, Seattle, WA 98195, USA (URL: http://faculty.washington.edu/wilcock/).
Research cruise and new bathymetry reveals lava flows from the 2015 eruption
The submarine Axial Seamount volcano is located about 470 km offshore of the Oregon coast. An eruption inferred to have started at 2230 on 23 April 2015 with an earthquake swarm (BGVN 40:03) was confirmed during a 14-29 August 2015 research cruise by the R/V Thompson. According to a personal communication on 23 June 2015 from Bill Chadwick (Oregon State University and NOAA), the length of the eruption is unknown, but it was "very likely days to weeks since the deflation lasted for about 10 days and the temperature signals lasted about a month."
The research cruise revealed new lava flows observed from bathymetric data and observations made during a remotely operated underwater vehicle ROV Jason dive. This eruption "produced the largest volume of erupted lava since monitoring and mapping began in the mid-1980's" (Chadwick and others, 2016). Two large lava flows from the N rift zone (8-16 km N of the summit caldera) were at most 127 m thick; some of the thicker areas had drained collapse features indicating molten interiors when emplaced. The ROV traversed the flows for about 2 km. New, thinner lava flows (figure 13) were also identified in the NE summit caldera and on the NE rim.
|
Figure 13. Collecting a fragment of lava from the 2015 eruption of Axial Seamount with an arm of the AUV. Credit: Monterey Bay Aquarium Research Institute (MBARI); from Phys.org (2016). |
Three recently published papers, Chadwick and others (2016), Nooner and Chadwick (2016), and Wilcock and others (2016), detail the results of eruptive activity in 1998, 2011, and 2015, based on new data from a research cruise conducted after the 2015 eruption (figures 14 and 15). Scientists from the Monterey Bay Aquarium Research Institute (MBARI) issued a new seafloor map (figure 16) of the area of Axial north of the one shown in figure 14, based on underwater surveys conducted in August 2016, uncovering a number of previously undocumented flows from the 2015 eruption (Phys.org, 2016). MBARI ran identical sets of autonomous underwater vehicles (AUV) survey lines across the entire Axial caldera in 2011, 2014, 2015, and 2016, and during the 2016 survey the AUV collected seafloor samples (figure 13).
|
Figure 14. Map of the summit caldera of Axial Seamount. Locations of mobile pressure recorders (MPR) benchmarks (white circles) and bottom pressure recorders (BPR) instruments (red and blue circles) are indicated. Numbers show vertical displacements in centimeters at each of the MPR benchmarks between 14 September 2013 and 25 August 2015, a period that included pre-eruption inflation, co-eruption deflation, and post-eruption inflation. Numbers in parentheses show subsidence in centimeters during deflation only, as measured by the BPRs. BPRs on the Ocean Observatories Initiative (OOI) Cabled Array (red dots) include tiltmeters. The map also shows locations of 2015 lava flows and eruptive fissures (white outlines and red lines, respectively) and 2011 lava flows and eruptive fissures (gray outlines and yellow lines, respectively). From Nooner and Chadwick (2016). |
|
Figure 15. Map of 2015 lava flows (black outlines) and new fissures (red lines) in the summit caldera of Axila Seamount and on the north rift zone. Also shown are 2011 lava flows (gray outlines) and eruptive fissures (yellow lines) on the south rift zone. Lava samples collected by ROV are shown by dots, colored according to their MgO content. Dashed white outline indicates a magma reservoir from multichannel seismic results, with a dotted white line separating zones of high melt (south) from crystal mush (north). Canadian American Seamount (CASM) vent field and implanted benchmark AX-101 are labeled. From Chadwick and others (2016). |
|
Figure 16. Part of the new map of Axial Seamount produced by MBARI researchers. Black outlines show lava flows from 2015 eruption. From Phys.org (2016). |
According to Wilcock and others (2016), the earthquake rates increases from less than 500 per day to as many as about 2000 per day prior to the eruption on 24 April 2015, then decreased rapidly over the next month following the seismic crisis to a background level of 20 per day. During the eruption there were 600 earthquakes measured every hour, and the seafloor at Axial dropped suddenly by about 2.4 m.
Precise pressure sensors measure vertical movements of the seafloor that take place as the volcano gradually inflates (see figure 14). Deformation of the Axial volcano seafloor as measured by pressure sensors (figure 17) indicated gradual inflation followed by rapid deflation during the three most recent eruptions in 1998, 2011, and 2015.
|
Figure 17. Deformation time series at the Axial Seamount caldera center, showing change in seafloor elevation as a function of time from 1998 to about May 2016. Long-term time series of inflation and deflation at the center of the caldera to 19 May 2016. Purple open dots represent mobile pressure recorder measurements (error bars indicate 1 SD); blue curves show bottom pressure recorder data (drift-corrected after 2000). The relative depth of data before and after the 1998–2000 gap in measurements is unknown. From Nooner and Chadwick (2016). |
References: Chadwick, W.W., Jr., Paduan, J.B., Clague, D.A., Dreyer, B.M., Merle, S.G., Bobbitt, A.M., Caress, D.W., Philip, B.T., Kelley, D.S., and Nooner, S.L., 2016 (15 December), Voluminous eruption from a zoned magma body after an increase in supply rate at Axial Seamount, Geophysical Research Letters, v. 43, issue 23, pp. 12,063-12,070; DOI: 10.1002/2016GL071327.
Nooner, S.L., and Chadwick, W.W., Jr., 2016 (16 December), Inflation-predictable behavior and co-eruption deformation at Axial Seamount, Science, v. 354, issue 6318, pp. 1399-1403; DOI: 10.1126/science.aah4666.
Phys.org, 2016 (15 Dec), MBARI's seafloor maps provide new information about 2015 eruption at Axial Seamount (URL: https://phys.org/news/2016-12-mbari-seafloor-eruption-axial-seamount.html).
Wilcock, W.S.D., Tolstoy, M., Waldhauser, F., Garcia, C., Tan, Y.J., Bohnenstiehl, D.R., Caplan-Auerbach, J., Dziak, R.P., Arnulf, A.F., and Mann, M.E., 2016 (16 Dec), Seismic constraints on caldera dynamics from the 2015 Axial Seamount eruption, Science, v. 354, issue 6318, pp. 1395-1399; DOI: 10.1126/science.aah5563.
Information Contacts: William Chadwick, Cooperative Institute for Marine Resources Studies (CIMRS), Oregon State University, and NOAA/PMEL Earth-Ocean Interactions Program, Hatfield Marine Science Center, 2115 S.E. OSU Dr., Newport, OR 97365, USA (URL: http://www.pmel.noaa.gov/eoi/).
This compilation of synonyms and subsidiary features may not be comprehensive. Features are organized into four major categories: Cones, Craters, Domes, and Thermal Features. Synonyms of features appear indented below the primary name. In some cases additional feature type, elevation, or location details are provided.
Cones |
||||
| Feature Name | Feature Type | Elevation | Latitude | Longitude |
| D.D. Cone | Lava cone | -1500 m | 46° 0' 32" N | 130° 4' 23" W |
| Fissure Cone | Lava cone | -1560 m | 45° 58' 48" N | 130° 1' 50" W |
Craters |
||||
| Feature Name | Feature Type | Elevation | Latitude | Longitude |
| North Rift Zone | Fissure vent | -1600 m | 46° 2' 0" N | 130° 1' 0" W |
| South Rift Zone | Fissure vent | -1790 m | 45° 52' 0" N | 130° 0' 0" W |
| Southwest Rift Zone | Fissure vent | -2000 m | 45° 50' 0" N | 130° 10' 0" W |
Thermal |
||||
| Feature Name | Feature Type | Elevation | Latitude | Longitude |
| Ashes Vent Field | Thermal | -1560 m | 45° 55' 15" N | 130° 0' 35" W |
| Axial Gardens Vent Field | Thermal | -1540 m | 45° 55' 15" N | 129° 59' 12" W |
| CASM Vent Field | Thermal | -1595 m | 45° 59' 20" N | 130° 1' 40" W |
| International District | Thermal | |||
| South Rift Vent Field | Thermal | -1530 m | 45° 55' 30" N | 129° 58' 50" W |
|
|
||||||||||||||||||||||||
There is data available for 12 confirmed Holocene eruptive periods.
2015 Apr 23 - 2015 May 24 ± 1 days Confirmed Eruption Max VEI: 0
| Episode 1 | Submarine Episode | NE flank | ||||||||||||||||||||||||||||||||||||||||||||
|---|---|---|---|---|---|---|---|---|---|---|---|---|---|---|---|---|---|---|---|---|---|---|---|---|---|---|---|---|---|---|---|---|---|---|---|---|---|---|---|---|---|---|---|---|---|
| 2015 Apr 23 - 2015 May 24 ± 1 days | Evidence from Observations: Seismicity | ||||||||||||||||||||||||||||||||||||||||||||
|
List of 7 Events for Episode 1 at NE flank
| |||||||||||||||||||||||||||||||||||||||||||||
2011 Apr 6 - 2011 Apr 12 Confirmed Eruption Max VEI: 0
| Episode 1 | Submarine Episode | E caldera rim to 10 km S | ||||||||||||||||||||||||||||||||||
|---|---|---|---|---|---|---|---|---|---|---|---|---|---|---|---|---|---|---|---|---|---|---|---|---|---|---|---|---|---|---|---|---|---|---|---|
| 2011 Apr 6 - 2011 Apr 12 | Evidence from Observations: Reported | ||||||||||||||||||||||||||||||||||
|
List of 5 Events for Episode 1 at E caldera rim to 10 km S
| |||||||||||||||||||||||||||||||||||
1998 Jan 25 - 1998 Feb 5 (?) Confirmed Eruption Max VEI: 0
| Episode 1 | Eruption Episode | South end of Axial caldera | ||||||||||||||||||||||||
|---|---|---|---|---|---|---|---|---|---|---|---|---|---|---|---|---|---|---|---|---|---|---|---|---|---|
| 1998 Jan 25 - 1998 Feb 5 (?) | Evidence from Observations: Reported | ||||||||||||||||||||||||
|
List of 3 Events for Episode 1 at South end of Axial caldera
| |||||||||||||||||||||||||
1976 Jan 1 ± 6 years - 1982 (in or before) Confirmed Eruption Max VEI: 0
| Episode 1 | Eruption Episode | Lava flow Sa | |||||||||||||||||||
|---|---|---|---|---|---|---|---|---|---|---|---|---|---|---|---|---|---|---|---|---|
| 1976 Jan 1 ± 6 years - 1982 (in or before) | Evidence from Observations: Reported | |||||||||||||||||||
|
List of 2 Events for Episode 1 at Lava flow Sa
| ||||||||||||||||||||
1650 ± 117 years Confirmed Eruption Max VEI: 0
| Episode 1 | Eruption Episode | East-central caldera floor, Lava flow Ne | |||||||||||||||||||
|---|---|---|---|---|---|---|---|---|---|---|---|---|---|---|---|---|---|---|---|---|
| 1650 ± 117 years - Unknown | Evidence from Isotopic: 14C (calibrated) | |||||||||||||||||||
|
List of 2 Events for Episode 1 at East-central caldera floor, Lava flow Ne
| ||||||||||||||||||||
1400 ± 71 years Confirmed Eruption Max VEI: 0
| Episode 1 | Eruption Episode | East caldera rim, Lava flow Ed | |||||||||||||||||||
|---|---|---|---|---|---|---|---|---|---|---|---|---|---|---|---|---|---|---|---|---|
| 1400 ± 71 years - Unknown | Evidence from Isotopic: 14C (calibrated) | |||||||||||||||||||
|
List of 2 Events for Episode 1 at East caldera rim, Lava flow Ed
| ||||||||||||||||||||
1300 ± 91 years Confirmed Eruption Max VEI: 0
| Episode 1 | Eruption Episode | NW caldera floor, Lava flows Nh2 and Ng | |||||||||||||||||||
|---|---|---|---|---|---|---|---|---|---|---|---|---|---|---|---|---|---|---|---|---|
| 1300 ± 91 years - Unknown | Evidence from Isotopic: 14C (calibrated) | |||||||||||||||||||
|
List of 2 Events for Episode 1 at NW caldera floor, Lava flows Nh2 and Ng
| ||||||||||||||||||||
1260 ± 72 years Confirmed Eruption Max VEI: 0
| Episode 1 | Eruption Episode | NE caldera floor and rim, Lava flows Nj and Eg | |||||||||||||||||||
|---|---|---|---|---|---|---|---|---|---|---|---|---|---|---|---|---|---|---|---|---|
| 1260 ± 72 years - Unknown | Evidence from Isotopic: 14C (calibrated) | |||||||||||||||||||
|
List of 2 Events for Episode 1 at NE caldera floor and rim, Lava flows Nj and Eg
| ||||||||||||||||||||
1230 ± 76 years Confirmed Eruption Max VEI: 0
| Episode 1 | Eruption Episode | South caldera floor, Lava flows Sg1 and Si1 | |||||||||||||||||||
|---|---|---|---|---|---|---|---|---|---|---|---|---|---|---|---|---|---|---|---|---|
| 1230 ± 76 years - Unknown | Evidence from Isotopic: 14C (calibrated) | |||||||||||||||||||
|
List of 2 Events for Episode 1 at South caldera floor, Lava flows Sg1 and Si1
| ||||||||||||||||||||
1000 ± 98 years Confirmed Eruption Max VEI: 0
| Episode 1 | Eruption Episode | West caldera rim, Lava flow Wc | |||||||||||||||||||
|---|---|---|---|---|---|---|---|---|---|---|---|---|---|---|---|---|---|---|---|---|
| 1000 ± 98 years - Unknown | Evidence from Isotopic: 14C (calibrated) | |||||||||||||||||||
|
List of 2 Events for Episode 1 at West caldera rim, Lava flow Wc
| ||||||||||||||||||||
0800 ± 107 years Confirmed Eruption Max VEI: 0
| Episode 1 | Eruption Episode | West caldera rim, Lava flow Wd | |||||||||||||||||||
|---|---|---|---|---|---|---|---|---|---|---|---|---|---|---|---|---|---|---|---|---|
| 0800 ± 107 years - Unknown | Evidence from Isotopic: 14C (calibrated) | |||||||||||||||||||
|
List of 2 Events for Episode 1 at West caldera rim, Lava flow Wd
| ||||||||||||||||||||
0410 ± 123 years Confirmed Eruption Max VEI: 0
| Episode 1 | Eruption Episode | East caldera rim, Lava flow Eh | |||||||||||||||||||
|---|---|---|---|---|---|---|---|---|---|---|---|---|---|---|---|---|---|---|---|---|
| 0410 ± 123 years - Unknown | Evidence from Isotopic: 14C (calibrated) | |||||||||||||||||||
|
List of 2 Events for Episode 1 at East caldera rim, Lava flow Eh
| ||||||||||||||||||||
There is data available for 4 deformation periods. Expand each entry for additional details.
| Start Date: 2004 | Stop Date: 2007 | Direction: Uplift | Method: BPR, MBR |
| Magnitude: Unknown | Spatial Extent: Unknown | Latitude: Unknown | Longitude: Unknown |
Reference List: Nooner and Chadwick 2009.
Full References:
Nooner, S. L., and Chadwick, W. W. , 2009. Volcanic inflation measured in the caldera of Axial Seamount: Implications for magma supply and future eruptions.. Geochemistry Geophysics Geosystems, 10: Q02002. https://doi.org/10.1029/2008GC002315
| Start Date: 2002 Jul | Stop Date: 2004 Jul | Direction: Uplift | Method: BPR |
| Magnitude: Unknown | Spatial Extent: Unknown | Latitude: Unknown | Longitude: Unknown |
Reference List: Chadwick et al. 2006.
Full References:
Chadwick, W. W., D. Geist, S. Jónsson, M. Poland, D. Johnson, and C. Meertens, 2006. A volcano bursting at the seams: Inflation, faulting, and eruption at Sierra Negra volcano, Galápagos. Geology, 34, 1025-1028. https://doi.org/10.1130/G22826A.1
| Start Date: 1998 Jan 30 | Stop Date: 1998 Aug 07 | Direction: Uplift | Method: BPR |
| Magnitude: Unknown | Spatial Extent: Unknown | Latitude: Unknown | Longitude: Unknown |
Remarks: locus of maximum uplift near center of caldera, other pressure sensor located 3.5 km from caldera center recorded 1.4 m of subsidence with eruption and then recorded 22 cm/yr of uplift until it was removed in May 1999 | |||
Reference List: Chadwick et al. 2006.
Full References:
Chadwick, W. W., D. Geist, S. Jónsson, M. Poland, D. Johnson, and C. Meertens, 2006. A volcano bursting at the seams: Inflation, faulting, and eruption at Sierra Negra volcano, Galápagos. Geology, 34, 1025-1028. https://doi.org/10.1130/G22826A.1
| Start Date: 1998 Jan 25 | Stop Date: 1998 Jan 28 | Direction: Subsidence | Method: BPR |
| Magnitude: Unknown | Spatial Extent: Unknown | Latitude: Unknown | Longitude: Unknown |
Remarks: deflation from erupted magma | |||
Reference List: Fox 1993; Fox 1999; Chadwick et al. 1999.
Full References:
Chadwick W W Jr, Embley R W, Milburn H B, Meinig C, Stapp M, 1999. Evidence for deformation associated with the 1998 eruption of Axial Volcano, Juan de Fuca Ridge, from acoustic extensometer measurements. Geophysical Research Letters, 26. https://doi.org/10.1029/1999GL900498
Fox, C. G., 1993. Five years of ground deformation monitoring on Axial Seamount using a bottom pressure recorder. Geophysical Research Letters, 20(17), 1859-1862.
Fox, C. G., 1999. In situ ground deformation measurements from the summit of Axial Volcano during the 1998 volcanic episode. Geophysical Research Letters, 26(23), 3437-3440.
There is no Emissions History data available for Axial Seamount.
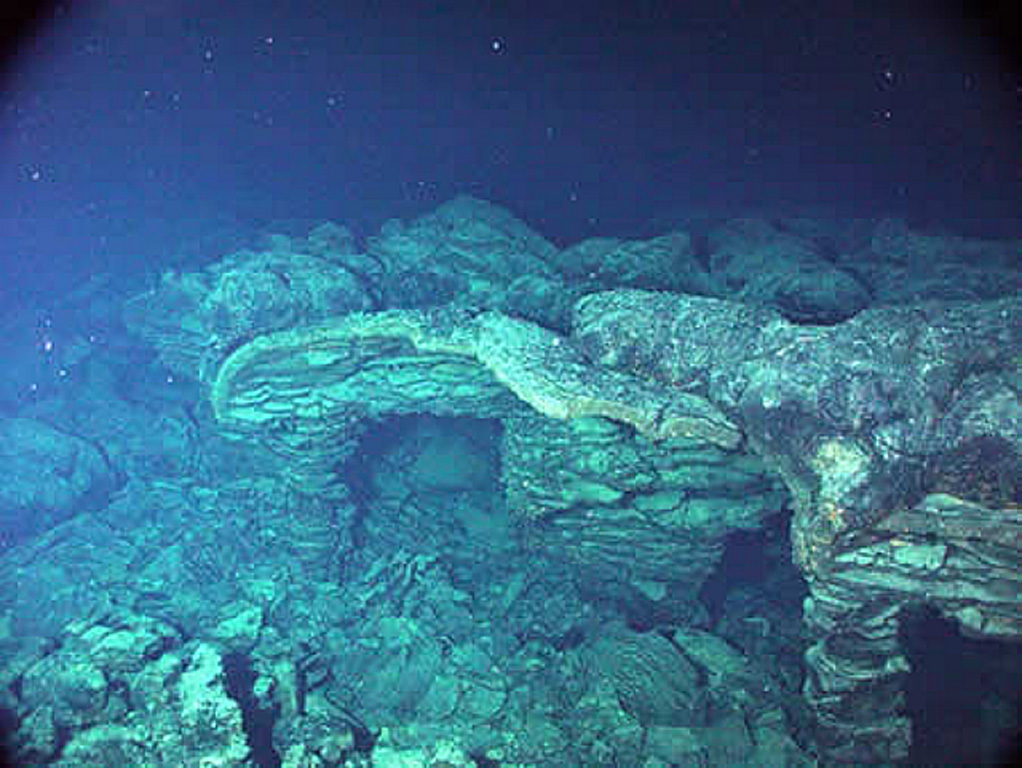
 Axial volcano lies along the central Juan de Fuca Ridge crest about 480 km W of the Oregon coast. The summit reaches about 1.4 km below the ocean surface and is marked by a 3 x 8 km caldera (center). The caldera opens to the SE and has caldera walls up to 150 m high. Hydrothermal vents colonized with biological communities are located near the caldera boundary or along rift zones to the NE and S. In 1998 a lava flow was erupted from a fissure at the southern end of the caldera.
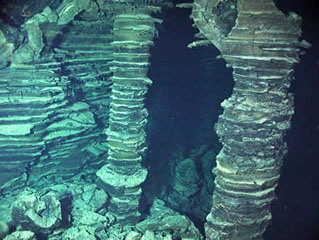 Lava pillars supporting the upper crust remain after collapse of a lava flow that erupted from Axial volcano in 1998. The layers within the lava formed when ponded lava drained away. A seismic swarm was detected at Axial Seamount beginning on 25 January 1998. An oceanographic cruise during 9-16 February detected elevated hydrothermal plumes, and later mapping indicated that a submarine lava flow had extruded from a 9-km-long fissure system.
 An eruption from the southern end of Axial caldera in 1998 produced this submarine lava flow that had undergone collapse, shown in this photo. Axial Seamount rises 700 m above the mean level of the central Juan de Fuca Ridge crest about 480 km W of Cannon Beach, Oregon, to within about 1.4 km of the ocean surface. The 3 x 8 km Axial caldera opens to the SE and is defined on three sides by caldera walls up to 150 m high. Hydrothermal vents colonized with biological communities are located near the caldera boundary or along the rift zones.
The Global Volcanism Program has no maps available for Axial Seamount.
There are no samples for Axial Seamount in the Smithsonian's NMNH Department of Mineral Sciences Rock and Ore collection.
| Copernicus Browser | The Copernicus Browser replaced the Sentinel Hub Playground browser in 2023, to provide access to Earth observation archives from the Copernicus Data Space Ecosystem, the main distribution platform for data from the EU Copernicus missions. |
| MIROVA | Middle InfraRed Observation of Volcanic Activity (MIROVA) is a near real time volcanic hot-spot detection system based on the analysis of MODIS (Moderate Resolution Imaging Spectroradiometer) data. In particular, MIROVA uses the Middle InfraRed Radiation (MIR), measured over target volcanoes, in order to detect, locate and measure the heat radiation sourced from volcanic activity. |
| MODVOLC Thermal Alerts | Using infrared satellite Moderate Resolution Imaging Spectroradiometer (MODIS) data, scientists at the Hawai'i Institute of Geophysics and Planetology, University of Hawai'i, developed an automated system called MODVOLC to map thermal hot-spots in near real time. For each MODIS image, the algorithm automatically scans each 1 km pixel within it to check for high-temperature hot-spots. When one is found the date, time, location, and intensity are recorded. MODIS looks at every square km of the Earth every 48 hours, once during the day and once during the night, and the presence of two MODIS sensors in space allows at least four hot-spot observations every two days. Each day updated global maps are compiled to display the locations of all hot spots detected in the previous 24 hours. There is a drop-down list with volcano names which allow users to 'zoom-in' and examine the distribution of hot-spots at a variety of spatial scales. |
|
WOVOdat
Single Volcano View Temporal Evolution of Unrest Side by Side Volcanoes |
WOVOdat is a database of volcanic unrest; instrumentally and visually recorded changes in seismicity, ground deformation, gas emission, and other parameters from their normal baselines. It is sponsored by the World Organization of Volcano Observatories (WOVO) and presently hosted at the Earth Observatory of Singapore.
GVMID Data on Volcano Monitoring Infrastructure The Global Volcano Monitoring Infrastructure Database GVMID, is aimed at documenting and improving capabilities of volcano monitoring from the ground and space. GVMID should provide a snapshot and baseline view of the techniques and instrumentation that are in place at various volcanoes, which can be use by volcano observatories as reference to setup new monitoring system or improving networks at a specific volcano. These data will allow identification of what monitoring gaps exist, which can be then targeted by remote sensing infrastructure and future instrument deployments. |
| Volcanic Hazard Maps | The IAVCEI Commission on Volcanic Hazards and Risk has a Volcanic Hazard Maps database designed to serve as a resource for hazard mappers (or other interested parties) to explore how common issues in hazard map development have been addressed at different volcanoes, in different countries, for different hazards, and for different intended audiences. In addition to the comprehensive, searchable Volcanic Hazard Maps Database, this website contains information about diversity of volcanic hazard maps, illustrated using examples from the database. This site is for educational purposes related to volcanic hazard maps. Hazard maps found on this website should not be used for emergency purposes. For the most recent, official hazard map for a particular volcano, please seek out the proper institutional authorities on the matter. |
| IRIS seismic stations/networks | Incorporated Research Institutions for Seismology (IRIS) Data Services map showing the location of seismic stations from all available networks (permanent or temporary) within a radius of 0.18° (about 20 km at mid-latitudes) from the given location of Axial Seamount. Users can customize a variety of filters and options in the left panel. Note that if there are no stations are known the map will default to show the entire world with a "No data matched request" error notice. |
| UNAVCO GPS/GNSS stations | Geodetic Data Services map from UNAVCO showing the location of GPS/GNSS stations from all available networks (permanent or temporary) within a radius of 20 km from the given location of Axial Seamount. Users can customize the data search based on station or network names, location, and time window. Requires Adobe Flash Player. |
| DECADE Data | The DECADE portal, still in the developmental stage, serves as an example of the proposed interoperability between The Smithsonian Institution's Global Volcanism Program, the Mapping Gas Emissions (MaGa) Database, and the EarthChem Geochemical Portal. The Deep Earth Carbon Degassing (DECADE) initiative seeks to use new and established technologies to determine accurate global fluxes of volcanic CO2 to the atmosphere, but installing CO2 monitoring networks on 20 of the world's 150 most actively degassing volcanoes. The group uses related laboratory-based studies (direct gas sampling and analysis, melt inclusions) to provide new data for direct degassing of deep earth carbon to the atmosphere. |
| Large Eruptions of Axial Seamount | Information about large Quaternary eruptions (VEI >= 4) is cataloged in the Large Magnitude Explosive Volcanic Eruptions (LaMEVE) database of the Volcano Global Risk Identification and Analysis Project (VOGRIPA). |
| EarthChem | EarthChem develops and maintains databases, software, and services that support the preservation, discovery, access and analysis of geochemical data, and facilitate their integration with the broad array of other available earth science parameters. EarthChem is operated by a joint team of disciplinary scientists, data scientists, data managers and information technology developers who are part of the NSF-funded data facility Integrated Earth Data Applications (IEDA). IEDA is a collaborative effort of EarthChem and the Marine Geoscience Data System (MGDS). |

