

IMO lowered the Aviation Color Code for Grímsvötn to Green (the lowest level on a four-color scale) in a Volcano Observatory Notice for Aviation (VONA) issued at 1537 on 22 January. They noted that the jökulhlaup that had begun around 10 January had ended, and that there were no measurable signs of elevated activity.
Source: Icelandic Meteorological Office (IMO)
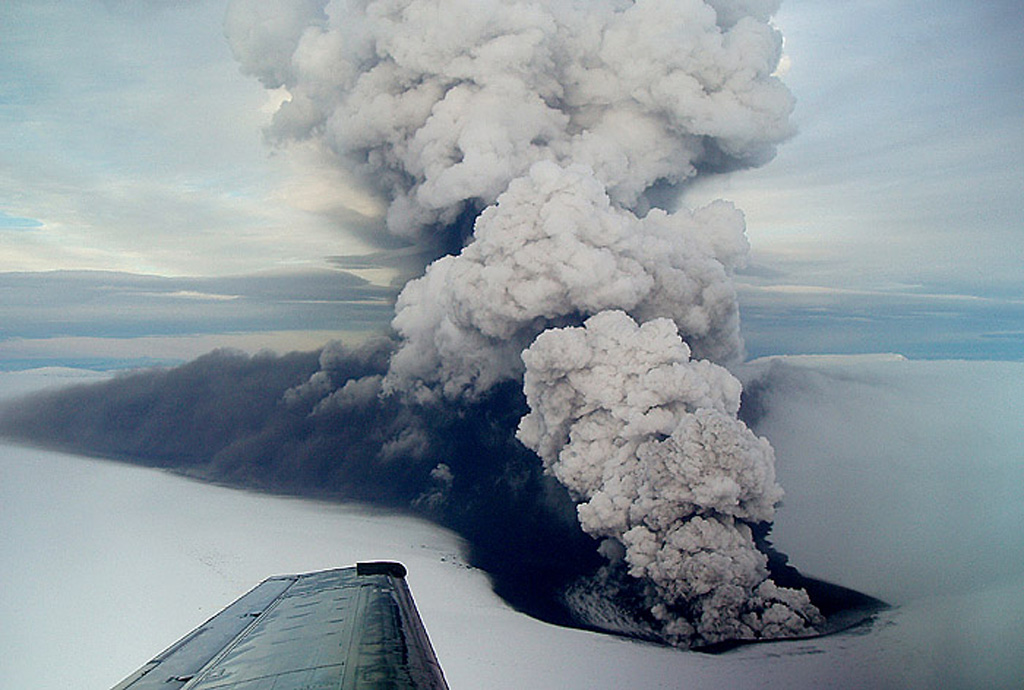
November-December 2021 jökulhlaup is not followed by Grímsvötn eruption
Grímsvötn is a volcano located under the Vatnajökull glacier in the southeastern quadrant of Iceland (figure 19). Its most recent eruption in 2011 included explosions with multiple 15-20 km altitude ash plumes that produced ashfall tens of kilometers away (BGVN 36:06). Periodic jökulhlaups (glacial outburst floods) from Vatnajökull have been recognized for centuries (Einarsson, 2009), and have occurred regularly since the end of the last ice age when a lake fed by glacial meltwater breaches its dam and drains. The best known jökulhlaups from Vatnajökull occur from three separate places: Grímsvötn volcano, the Skaftá cauldrons, and glacial lake Grænalón. The most dangerous jökulhlaups in Iceland have been associated with subglacial volcanic activity due to the greater volume of meltwater produced (Einarsson, 2009). This report summarizes past eruptions, jökulhlaups, and possible co-occurrences of the two with respect to Grímsvötn, and then describes in more detail events since the last eruption in 2011. Since then, jökulhlaups have been reported on the Skeiðarársandur outwash plain in 2014, 2015, 2016, and most recently during November-December 2021. Information is primarily from the Icelandic Met Office (IMO).
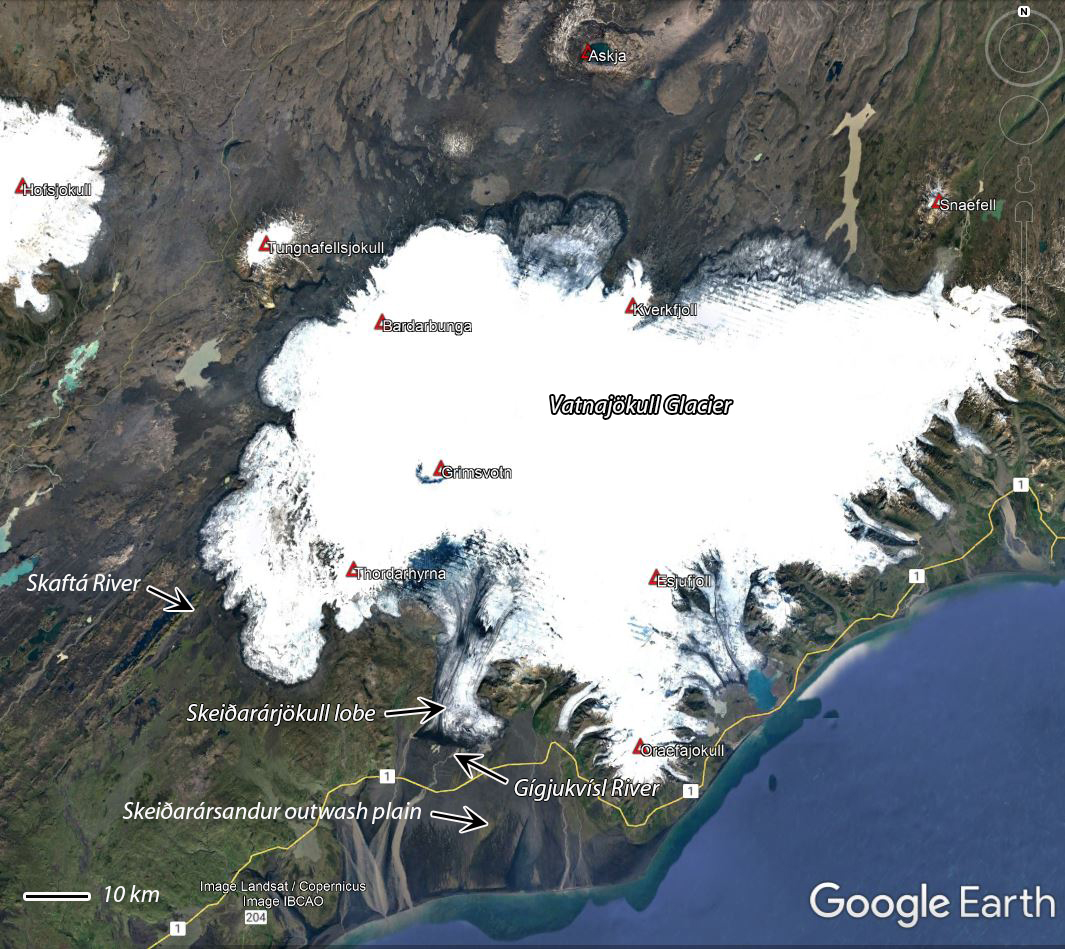 |
Figure 19. Grímsvötn volcano is located under the western half of the Vatnajökull glacier in southeastern Iceland. Jökulhlaups originating from the caldera lake travel 50 km S, emerge from the S tip of the Skeiðarárjökull lobe of the Vatnajökull glacier, enter the Gígjukvísl river, and travel S across the Skeiðarársandur outwash plain. The most recent jökulhlaup from Grímsvötn occurred during November-December 2021. Base map courtesy of Google Earth. |
Jökulhlaups from Grímsvötn have been known since at least the fourteenth century (Þórarinsson, 1939 and 1974, in Einarsson, 2009), but the relationship between eruptions and floods from the subglacial crater lake is not well understood. In 1953, Sigurður Þórarinsson suggested a correlation between jökulhlaups and Grímsvötn eruptions. He proposed that if a large volume of water was stored in the lake, that the pressure release following the sudden removal of water during a flood could facilitate magma movement and trigger an eruption. This type of scenario was proposed to explain coincident eruptions and jökulhlaups in 1922 and 1938. Records preserved since 1922 have indicated a few eruptions that were coincident with jökulhlaups, several eruptions with no evidence of jökulhlaups, and a larger number of jökulhlaups with no prior or subsequent documented eruption (table 2). The only recent confirmed event where a jökulhlaup was followed by an eruption took place in 2004.
Table 2. Jökulhlaups and eruptions at Grímsvötn from 1922-2021. For pre-1972 events, only those with possible co-occurring jökulhlaups and eruptions are listed. For 1972 and later both jökulhlaups and eruptions as reported by GVP or IMO are listed. Sources are listed in the table.
| Date | Eruption | Jökulhlaup | Total Discharge Estimate | Max Flux | Ice Subsidence | Source |
| 29 Sep-23 Oct 1922 | Eruption first observed 29 Sep, last observed 23 Oct | Skeiðará river jökulhlaup begins late Sep | -- | -- | -- | IMO, Þórarinsson (1939), Brandsdottir (1984) |
| May 1938 | Eruption 8 km north formed large ice cauldron, minor tephra | Jökulhlaups occurred at Skeiðará and Sula rivers | -- | -- | -- | BGVN 21:09 (Sep 1996), Gudmundsson and Björnsson (1991), BGVN 23:11 (Nov 1998) |
| 7-21 Jul 1954 | Eruption uncertain, possible steam explosions | Jökulhlaup on the Skeiðará river | -- | -- | -- | Þórarinsson S (1974), IMO |
| 15-30 Mar 1972 | No clear eruption evidence | Grímsvötn jökulhlaup | 3.2 km3 | -- | -- | CSLP 20-72 (Mar 1972), SEAN 07:02 (Feb 1982) |
| Sep 1976 | No eruption | Grímsvötn jökulhlaup | 2.4 km3 | -- | -- | SEAN 07:02 (Feb 1982) |
| 28 Jan-11 Feb 1982 | No eruption | Grímsvötn jökulhlaup | 1.3 km3 | 2,000 m3/s | 50 m | SEAN 07:02 (Feb 1982) |
| 28 May-2 Jun 1983 | Eruption within Grímsvötn caldera | No jökulhlaup | -- | -- | Ice cap melted | SEAN 08:05 (May 1983), BGVN 23:11 (Nov 1998) |
| 30 Sep-13 Oct, 4-7 Nov 1996 | Fissure eruption between Bardarbunga and Grímsvötn (Gjálp) fills Grímsvötn caldera with meltwater 30 Sep-13 Oct | Major flood reported five weeks after eruption started, 4-7 Nov, largest jökulhlaup recorded from Grímsvötn | 3.2 km3 | 5,000 m3/s | Subsidence over fissure 8-9 km long, 2 km wide | BGVN 21:09 (Sep 1996), BGVN 23:11 (Nov 1998), Gudmundsson and others (1997), Björnsson (2002) |
| 18-28 Dec 1998 | Eruption within Grímsvötn caldera | No jökulhlaup | -- | -- | -- | BGVN 23:11 (Nov 1998) |
| 26 Oct-5 Nov 2004 | Earthquake swarm and eruption began on 1 Nov at G. caldera following jökulhlaup, 26 Oct-4 Nov | Jökulhlaup water release began on 26 October, reached Skeiðará R on 29 Oct | 0.5 km3 | 3,000-4,000 m3/s | 10-20 m | BGVN 29:10 (Oct 2004) |
| 31 Oct-3 Nov 2010 | No eruption | Jökulhlaup emerged from glacier on 31 Oct and peaked on 3 Nov. Floodwater went W to river Gígjukvísl instead of into Skeiðará due to landform changes in 2009 | 0.45 km3 | 2,600 m3/s | -- | BGVN 36:06 (Jun 2011), IMO |
| 21-28 May 2011 | Eruption from Grímsvötn crater | No jökulhlaup | -- | -- | -- | BGVN 36:06 (Jun 2011) |
| 22 Nov 2012 | No eruption | Small jökulhlaup from subglacial lake Grímsvötn | 0.2-0.3 km3 | -- | -- | IMO (6 May 2015 report) |
| 27 Mar 2014 | No eruption | Small jökulhlaup from subglacial lake Grímsvötn | 0.2-0.3 km3 | ~1,000 m3/s | -- | SI/USGS Weekly (26 Mar-1 Apr 2014), IMO (6 May 2015 report) |
| 6-9 May 2015 | No eruption | Small jökulhlaup from subglacial lake Grímsvötn | 0.2-0.3 km3 | less than 700 m3/s | -- | SI/USGS Weekly (6-12 May 2015), IMO (6 May 2015 report) |
| 18-23 Aug 2016 | No eruption | Small jökulhlaup from subglacial lake Grímsvötn | 0.1-0.15 km3 | -- | 5 m | IMO |
| 24 Nov-6 Dec 2021 | No eruption | Large Jökulhlaup from subglacial lake Grímsvötn | -- | 2,800 m3/s | 77 m | IMO, SI/USGS Weekly (24-30 Nov 2021) |
Until 2009, jökulhlaups from Grímsvötn had emerged from under the S side of the Vatnajökull glacier on the S and E margins of the Skeiðarárjökull lobe of the glacier, draining into the Skeiðará river (figure 20). The Skeiðará river had previously deposited large amounts of sediment on the eastern part of the Skeiðarársandur plains over the centuries. In addition, the glacier had carved a trench during times of advance. In the summer of 2009, water ceased to enter the channel of the Skeiðará; the retreat of the glacier over the previous 15 years led to a shift in the direction of meltwater flow. Beginning in 2010, floodwater that emerged from beneath the eastern part of the Skeiðarárjökull glacier went westwards along the margin and then entered the Gígjukvísl river (figure 21).
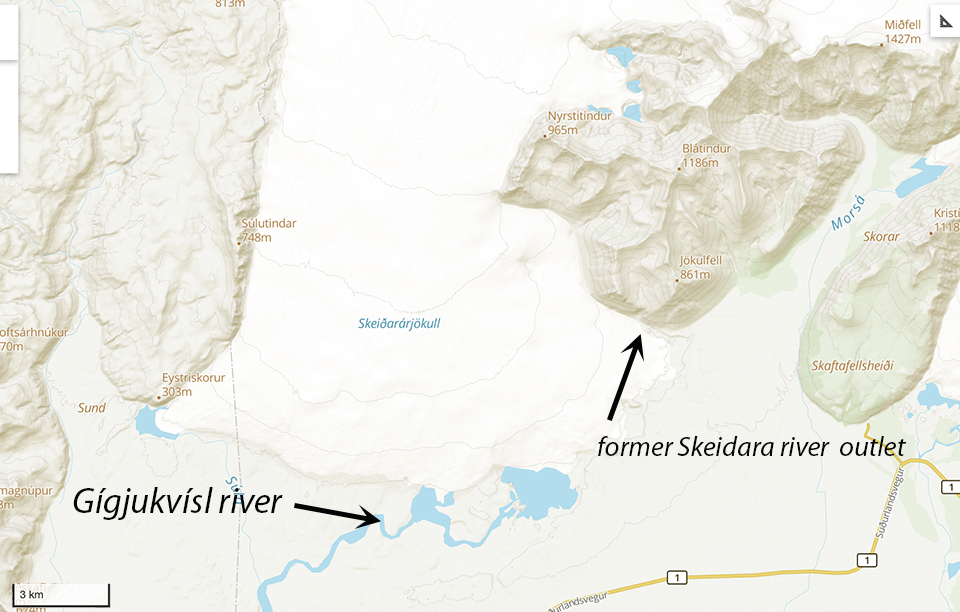 |
Figure 20. Jökulhlaups from Grímsvötn currently emerge from the S margin of the Skeiðarárjökull lobe of Vatnajökull glacier and drain into the Gígjukvísl River. Until 2009 they drained into the Skeiðará river. Courtesy of IMO. |
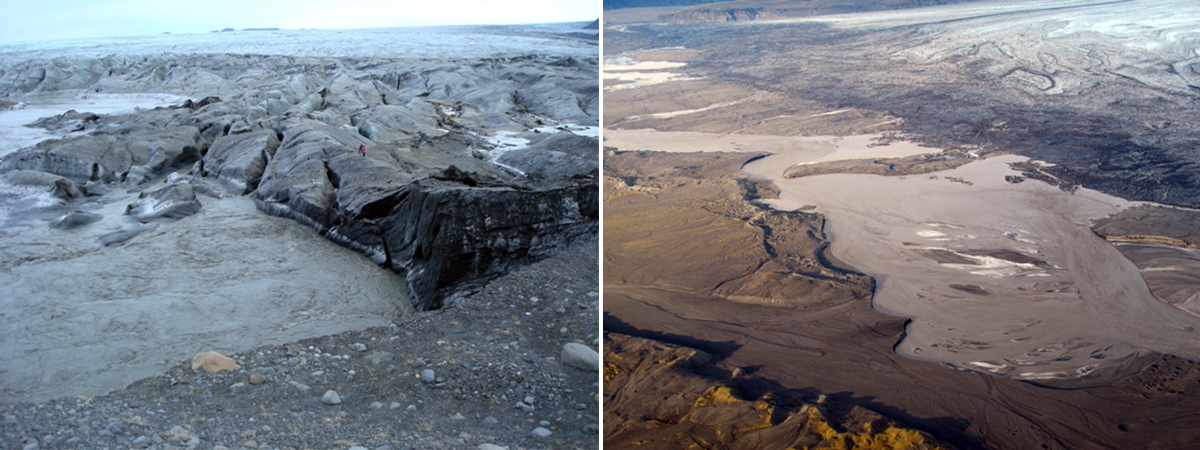 |
Figure 21. Floodwater flows along the terminus of Skeiðarárjökull glacier on 3 November 2010. IMO scientists are measuring water flow and chemistry from the glacier edge (left). The flow traveled west along the margin of the lobe into the Gígjukvísl river (right). Photos taken during scientific flight with the Icelandic Coast Guard (TF-SIF) by Matthew J. Roberts and Egill Axelsson, courtesy of Icelandic Met Office. |
Two subglacial geothermal areas 10-15 km NW of Grímsvötn cause surface depressions to form due to melting of the glacier at its base; they are known as the Eastern and Western Skaftá cauldrons (figure 22), named for the river where the floods discharge. The eastern cauldron is a little less than 3 km in diameter while the western one is about 2 km in diameter. The lows in the glacier surface lead to local minima in the fluid potential at the base of the glacier and therefore lakes are formed under both cauldrons, sealed by the ice overburden pressure at the rim (Björnsson, 2002). For the western cauldron, analyses suggest that the water formed by geothermal melting of ice is the largest (71%) component of inflow to the lake, followed by geothermal fluid (19%) and surface meltwater (10%). Jökulhlaups from underneath the Skaftá cauldrons occur almost every year and 45 jökulhlaups were recorded in the Skaftá river between 1955 and 2009 (Einarsson, 2009). Although the Skaftá cauldrons are located less than 20 km from Grímsvötn, the rivers where their respective jökulhlaups occur are located about 100 km apart; the Skaftá river is off the SW edge of the Vatnajökull glacier, while the Grímsvötn jökulhlaups have only been observed on the Skeidarársandur outwash plain located 50 km S of the volcano. There has not been any coincidence of activity recorded between these areas.
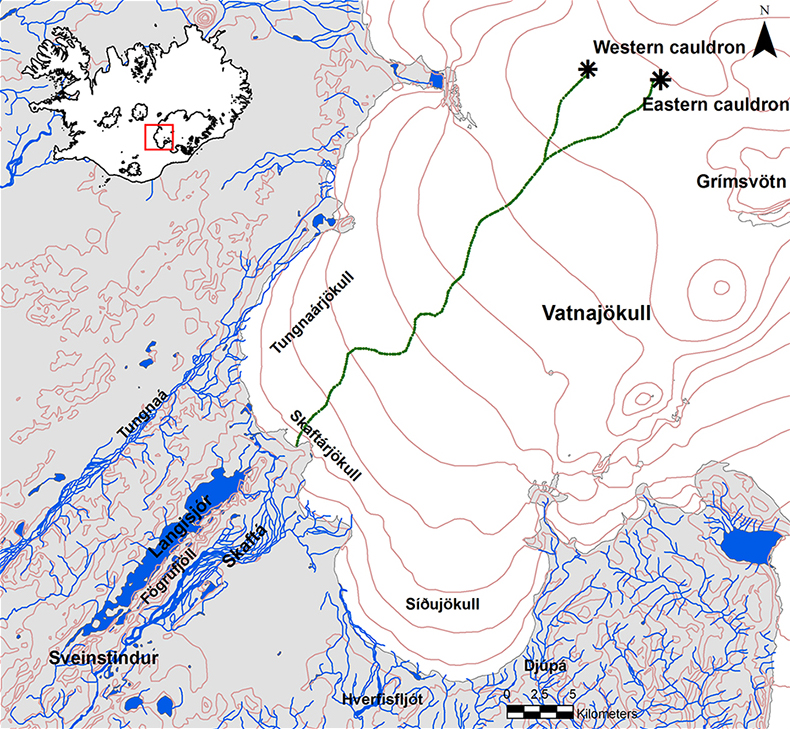 |
Figure 22. The Eastern and Western Skaftá cauldrons discharge water as jökulhlaups almost yearly; the water travels 40 km subglacially and emerges at the SW edge of the Vatnajökull glacier into the Skaftá river. There is no documented connection with Grímsvötn caldera and its associated jökulhlaups which discharge 50 km S of the volcano at the S edge of the Skeiðarárjökull lobe of the Vatnajökull glacier (bottom right of figure) into the Gígjukvísl river. Until 2009 Grímsvötn jökulhlaups drained into the Skeiðará river located farther E. Figure from Einarsson (2009). |
Jökulhlaups and eruptions during 1922-2011. A Skeiðará river jökulhlaup began in late September 1922 and an eruption at Grímsvötn was first reported on 29 September and last observed on 23 October of that year. There were no reports of jökulhlaups during eruptions in 1933 and 1934. Jökulhlaups that occurred on the Skeiðará and Sula rivers in May 1938 have been associated with an eruption that occurred a few kilometers N of Grímsvötn, though very little eruptive activity above the glacier was recorded. Jökulhlaups from Grímsvötn were reported in June 1939, April and May 1941, September 1945, and February 1948, but there were no confirmed reports of eruptions around those times. A Skeiðará river jökulhlaup during 7-21 July 1954 was attributed to a subglacial eruption, but this is uncertain. Jökulhlaups reported in March 1972 (CSLP 20-72), September 1976, and January-February 1982 (SEAN 07:02) had no accompanying reports of eruptions. The May-June 1983 eruption of Grímsvötn (SEAN 08:05) melted the overlying ice and revealed an oval-shaped lake, 300 m in diameter, initially covered by raft ice. Multiple explosions were observed from the lake; no jökulhlaups were reported in the Skeiðará river.
The 30 September-13 October 1996 Gjálp eruption was located on a N-trending fissure between Bardarbunga and Grímsvötn (BGVN 21:09; Björnsson, 2002) about 8 km NW of Grímsvötn. For five weeks the meltwater generated by the eruption went into the Grímsvötn caldera, raising the lake level to the highest ever recorded (Gudmundsson and others, 1997). By 4 November 1996 the lake had risen to 1,510 m, the level needed to float the ice dam, and ice-quakes marked the onset of drainage. About 10.5 hours later water emerged from the margin of Skeiðarárjökull as a flood wave, in the most rapid jökulhlaup ever recorded from Grímsvötn (Björnsson, 2002).
The December 1998 eruptive vents at Grímsvötn were at the foot of Mt. Grímsfjall, which rises about 300 m above the flat ice shelf over the subglacial lake (BGVN 23:11). No major flood occurred in conjunction with this event; only a small amount of the ice shelf near the eruption site melted.
High-frequency tremor on 26 October 2004 indicated the beginning of a flood from the subglacial caldera lake. An eruption began on 1 November 2004, melting through 150-200 m of ice to the surface in about an hour. Observations on 2 November revealed that the eruption was occurring from a circular vent about 1 km in diameter in the SE part of the crater where a surface ice cauldron had been mapped a year earlier (figure 5, BGVN 29:10). The jökulhlaup from the draining caldera reached a maximum discharge rate of 3,000-4,000 m3/s on the afternoon of 2 November in the affected rivers on the coastal plain. Discharge declined quickly after the peak with no damage reported to roads or bridges. The total volume of the jökulhlaup was about 0.5 km3. On 3 November pulses of activity produced ash plumes rising from 8-14 km above the volcano.
On 31 October 2010, a jökulhlaup originating at subglacial lake Grímsvötn emerged from beneath the Skeiðarárjökull glacier, according to IMO. Observations on the bridge over the Gígjukvísl river confirmed a steady water level increase that indicated the onset of a jökulhlaup, with initial discharge rates of about 145 m3/s. Flow reached a maximum of 2,600 m3/s on the Gígja river on 3 November before declining. Seismicity recorded during the event was all attributed to the jökulhlaup, and no evidence was detected either seismically or visually of an eruption (figure 23).
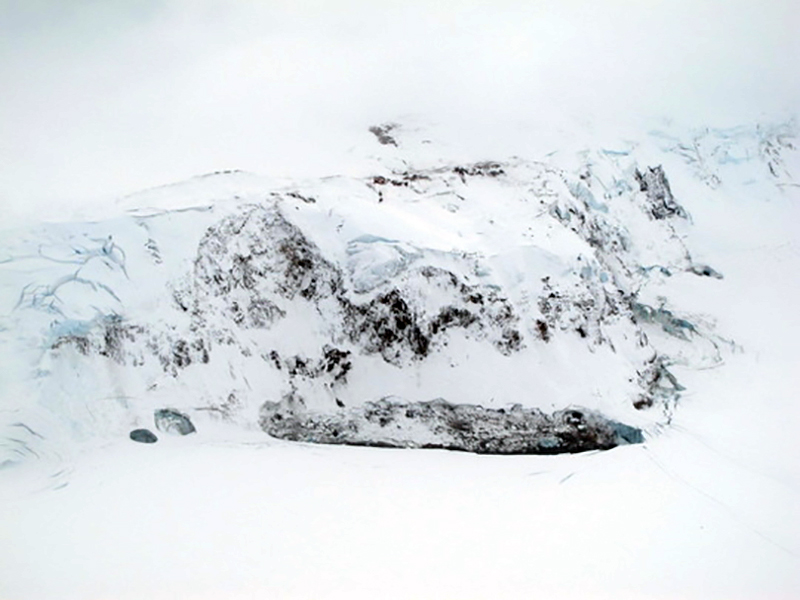 |
Figure 23. An aerial view of the eastern edge of Mt. Grímsfjall on 3 November 2010 revealed fresh crevasses at its base in the ice-cover over the adjacent subglacial lake Grímsvötn. The elongated trench in the ice gives an indication of the lake surface and the extent of the subsidence after the jökulhlaup. Water presumably drained from this region around the eastern edge of Grímsfjall. Photo taken during scientific flight with the Icelandic Coast Guard (TF-SIF) by Matthew J. Roberts and Egill Axelsson, courtesy of Icelandic Met Office (IMO). |
An eruption from Grímsvötn began on 21 May 2011 following about an hour of tremor (BGVN 36:06). Ash plumes from the eruption rose to 15-20 km altitude, disrupted airline traffic, and drifted toward northern Europe. Ashfall was reported from the Reykjavík area in the SW to Tröllaskagi Peninsula in the N. Explosions lasted for approximately a week; on 28 May tremor rapidly decreased then disappeared. No changes in the water levels were recorded in either the Gígja (Gígjukvísl) or Núpsvötn rivers. IMO noted that the eruption occurred from the same site in the SW part of the Grímsvötn caldera as the 2004 eruption, and ice-melt was not expected to be great. Visual observation on 26 May indicated that little ice had melted during the eruption, and no jökulhlaup occurred.
Jökulhlaups during 2012-2021. The water level rose slightly in the Gígjukvísl river on 22 November 2012 and was attributed by IMO to a small flood releasing from Grímsvötn's subglacial lake; no eruption was reported. Another small jökulhlaup with a maximum discharge rate of about 1,000 m3/s was reported on 27 March 2014, causing a rise in the water level in the Gígjukvísl River (figure 24). Electrical conductivity measurements indicated a considerable increase of a geothermal contribution to the river water, confirming its source at Grímsvötn's subglacial lake. Seismic tremor had increased due to the flood and not volcanic activity.
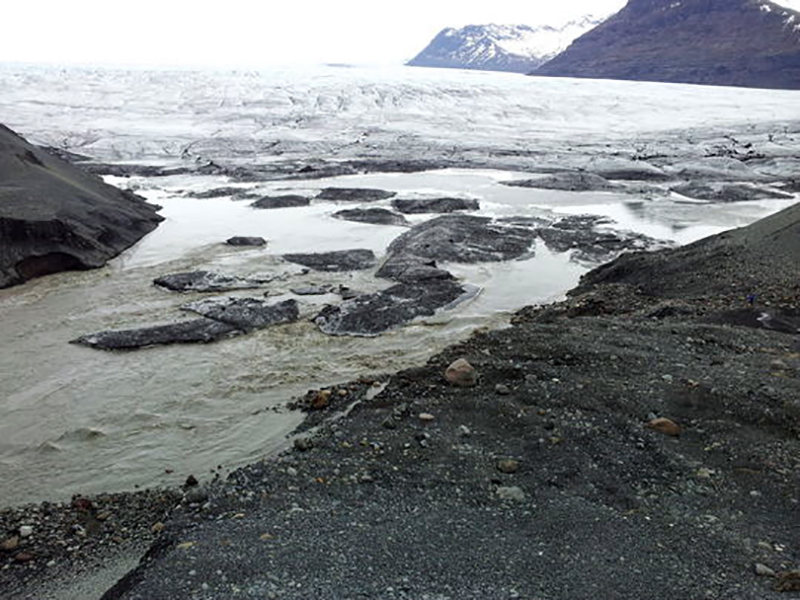 |
Figure 24. Water at the Skeiðará river outlet at the Skeiðarárjökull ice margin on 27 March 2014 indicated a small jökulhlaup from Grímsvötn's subglacial lake. The photo is taken at the E margin of Skeiðarárjökull and the mountains in the background are Krossgilstindur (near) and Færnes (distant). Photo copyright by Njáll Fannar Reynisson, courtesy of IMO. |
A small jökulhlaup from Grímsvötn's subglacial lake occurred on 6 May 2015, increasing the water level in the Gígjukvísl River. Electrical conductivity measurements indicated a considerable increase of a geothermal contribution to the river water. Based on information from the Institute of Earth Sciences, the water available for drainage was estimated at 0.2-0.3 km3, similar to floods in November 2012 and March 2014. Seismic tremor had increased due to the flood and not volcanic activity, and no eruption was reported. The IMO reported another small jökulhlaup originating from Grímsvötn in the Gígjukvísl river on the Skeiðarársandur outwash plain on 23 August 2016. Seismicity had been first observed at Mt. Grímsfjall on 19 August and lasted for about 24 hours (figure 25). On 22 August, data indicated that the ice shelf over the subglacial lake had subsided by about 5 m since 18 August. It was estimated that only 0.1-0.15 km3 of water was present in the lake. No eruption occurred.
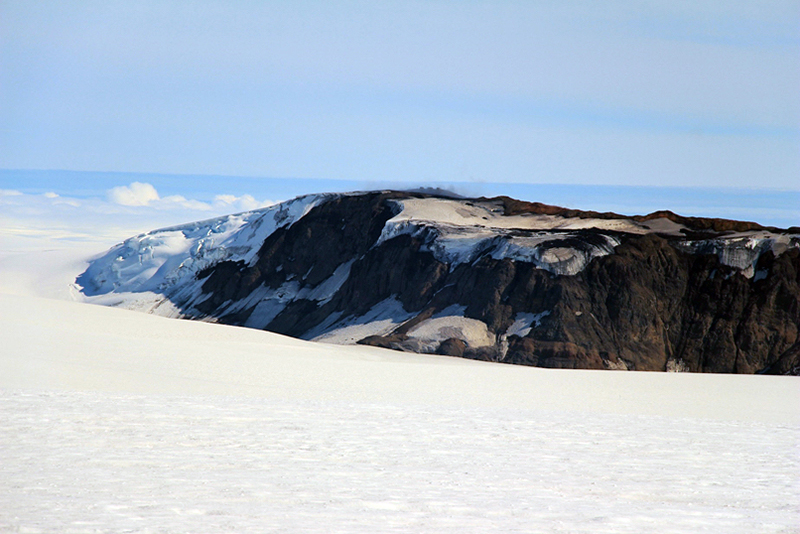 |
Figure 25. Mt. Grímsfjall was visible from the Grímsvötn's ice shelf during an IMO expedition 5-7 August 2016. The ice shelf subsided by about 5 m during the August 2016 jökulhlaup. The buildings of the Glacier Research Society at Eystri Svíahnúk are visible as two small dots within the snowfield along the top of Grímsfjall. Courtesy of IMO. |
Between previous eruptions of Grímsvötn, deformation data was interpreted by IMO as indicating gradual accumulation of new magma at depth. In early June 2020 IMO scientists measured high levels of SO2 in the SW part of the caldera, close to the 2004 and 2011 eruption sites (figure 26); they interpreted this as magma degassing at a shallow level. In addition, the area where geothermal activity could be detected at the surface had notably increased. Although seismic activity had been increasing for the previous year, it was still below levels reached prior to the eruptions of 2004 and 2011.
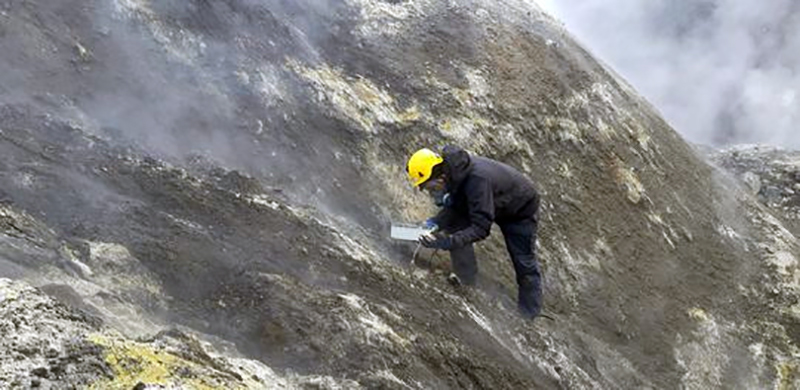 |
Figure 26. A specialist from the Icelandic Meteorological Office performed gas measurements at Grímsvötn during the first half of June 2020, as increasing SO2 levels suggested magma degassing. The location of the photo is near the site of the 2011 eruption. Photograph by Melissa Anne Pfeffer, courtesy of IMO. |
Elevation measurements of the ice shelf over Grímsvötn made by IES showed that it rose 10 m during the first half of 2020 to a level it had not exceeded since October 2010. In response to the increased possibility for a flood or an eruption, IMO installed a continuous GPS measurement station on the ice cap in early June 2020. Webcams were also installed at Hamarinn and Skeiðarársandur looking towards Grímsvötn.
In August 2020 IMO added a webcam to Mt. Grímsfjall, overlooking the Grímsvötn ice field above the lake. The GPS devices showed a potential drop in the ice sheet in early August, but the electrical conductivity and water level in the Gígjukvísl river were both normal. IMO discovered that the instruments on the ice shelf had tilted (figure 27) as a result of high rates of melting of the ice sheet from unusually hot weather. The IMO raised the Aviation Color Code to Yellow on 30 September 2020, noting that seismicity had increased over the past month, ice cauldrons had deepened in several places over the caldera signifying increased geothermal activity, surface deformation surpassed the level prior to the 2011 eruption, and magmatic gases were present in emissions over the summer. Additionally, water levels in the subglacial lake were comparable to levels prior to floods in 2004 and 2010.
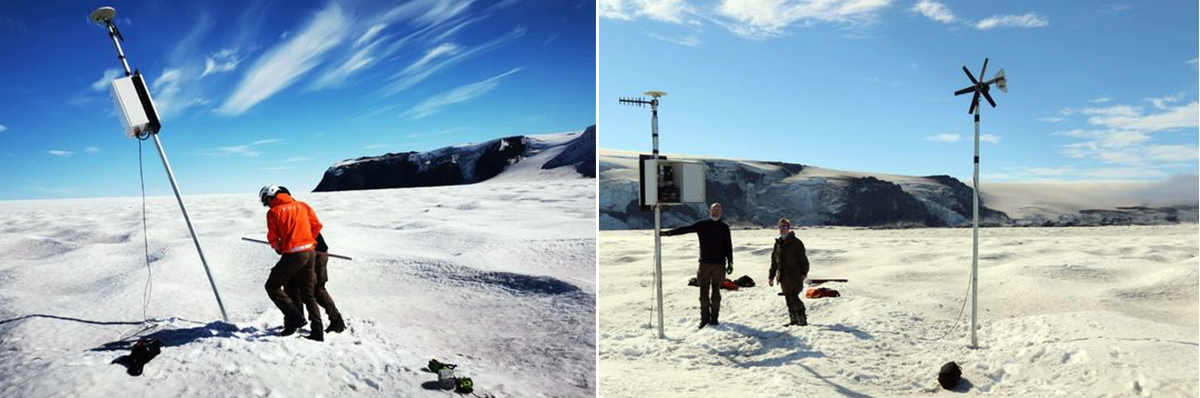 |
Figure 27. IMO scientists repaired tilted GPS monitoring equipment on the Grímsvötn ice sheet over the subglacial lake in mid-August 2020 after unusually hot weather increased the melting rate at the surface and disrupted the equipment. The GPS meter is on the left, and on the right is a wind turbine that powers the measuring device (right). Photograph by Björn Ólafsson, courtesy of IMO. |
On 24 November 2021 IMO reported that the ice sheet over Grímsvötn's caldera had subsided 60 cm in the previous few days and the rate of subsidence had accelerated during the previous 24 hours. These measurements indicated that it was likely that water had started to leave the lake. The flow rate in the river on 29 November was measured at 240 m3/s; water levels in the Gígjukvísl drainage rose overnight during 30 November-1 December (figure 28) and by 2 December the flow rate had reached 930 m3/s, ten times the normal seasonal rate. Water from the lake drained from the E side of Skeiðarárjökull lobe and from a channel in the middle of the lobe into the Gígjukvísl River. Daily measurements showed that the flow rate continued to rise; it peaked at about 2,800 m3/s during the morning of 5 December, and then declined rapidly. While the water was draining from Grímsvötn lake, subsidence of the overlying ice sheet continued; by 2 December it had reached 17 m and continued to fall rapidly. The maximum subsidence of 77 m was measured by IMO during 5-6 December.
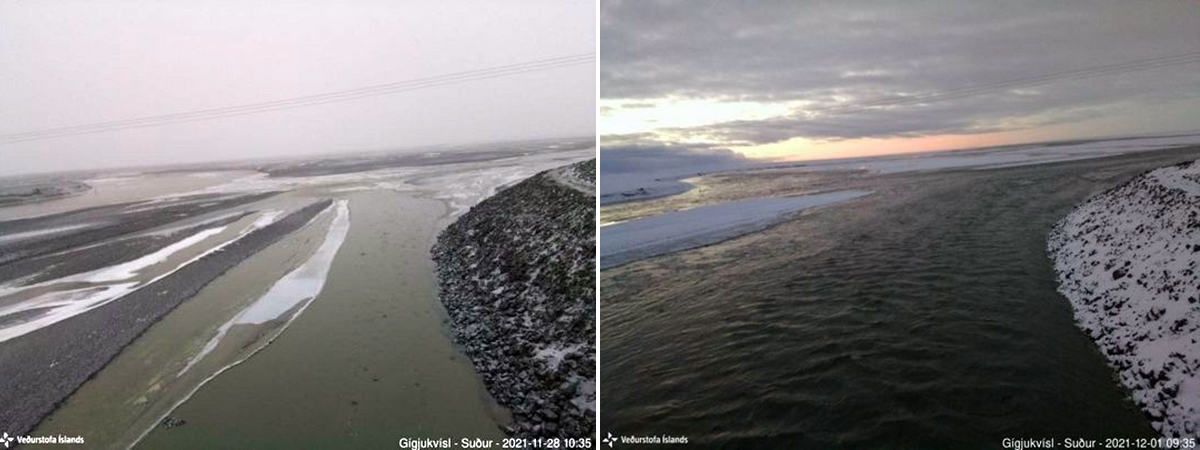 |
Figure 28. The water level rose substantially in the Gígjukvísl river between 28 November (left) and 1 December 2021 (right) from the jökulhlaup that began on 24 November draining the subglacial lake at Grímsvötn. View is to the S from the IMO webcam. Courtesy of IMO. |
Early on 6 December 2021 two earthquakes, M 2.3 and 3.6 were recorded, followed by several M 1 aftershocks. This resulted in the IMO briefly raising the Aviation Color Code to Orange, based on concerns of a possible relationship between the draining lake and increased eruption probability. With no further significant seismic activity, the alert level was lowered to Yellow the next day. IMO lowered the Aviation Color Code further to Green on 12 January 2022, noting that seismicity had returned to normal levels with a few earthquakes detected over the previous few weeks.
References: Björnsson H, 2002, Subglacial lakes and jökulhlaups in Iceland. Global and Planetary Change, 35: 255-271.
Brandsdottir B, 1984, Seismic activity in Vatnajökull in 1900-1982 with special reference to Skeidararhlaups, Skaftarhlaups and Vatnajökull eruptions. Jokull, 34: 141-150.
Einarsson B, 2009, Jökulhlaups in Skaftá: A study of jökulhlaup from the Western Skaftá cauldron in the Vatnajökull ice cap. Iceland, Icelandic Meteorological Office, VÍ 2009-006, ISSN 1670-8261.
Gudmundsson M T, Bjornsson H, 1991, Eruptions in Grímsvötn, Vatnajökull, Iceland, 1934-1991, Jokull, 41: 21-45.
Gudmundsson M T, Sigmundsson F, Björnsson H, 1997, Ice-volcano interaction of the 1996 Gjálp subglacial eruption, Vatnajökull, Iceland. Nature, 389:6654, 954-957. DOI: 10.1038/40122.
Þórarinsson S, 1939, The ice dammed lakes of Iceland with particular reference to their values as indicators of glacier oscillations. Geografiska Annaler, 21 (3-4), 216-242.
Þórarinsson S, 1953, The crater groups in Iceland. Bulletin of Volcanology, 14: 3-44. https://doi.org/10.1007/BF02596003
Þórarinsson S, 1974. Vötnin stríð. Saga Skeiðarárhlaupa og Grímsvatnagosa. Bókaútgáfa, Menningarsjóðs. Reykjavík. [In Icelandic].
Information Contacts: Icelandic Met Office (IMO), Reykjavík, Iceland (URL: http://en.vedur.is/); Google Earth (URL: https://www.google.com/earth/).
2024: January
2022: January
| July
| August
| October
| November
2021: September
| November
| December
2020: September
2016: June
| September
2015: May
| June
| September
2014: January
| March
2011: May
2004: October
IMO lowered the Aviation Color Code for Grímsvötn to Green (the lowest level on a four-color scale) in a Volcano Observatory Notice for Aviation (VONA) issued at 1537 on 22 January. They noted that the jökulhlaup that had begun around 10 January had ended, and that there were no measurable signs of elevated activity.
Source: Icelandic Meteorological Office (IMO)
IMO reported that at 0653 on 11 January a M 4.3 earthquake occurred at Grímsvötn and was the largest earthquake recorded at the volcano since measurements started in 1991. A gradual increase in tremor was recorded at Mt. Grímsfjall, which rises about 300 m above the flat ice shelf over the subglacial lake, since 7 January and the water level in the Gígjukvísl River began to rise on 10 January. IMO noted that a jökulhlaup had likely begun and that the earthquake was in response to pressure release from the flood. The Aviation Color Code was raised to Yellow (the second level on a four-color scale) reflecting the slight increase in the likelihood of an eruption being triggered by the flood. IMO noted that the last eruption was in 2004; since then, 12 jökulhlaups had occurred with no eruptions.
Water levels in the Gígjukvísl River steadily and significantly increased during 11-12 January and the river widened; the river rose 70 cm based on data from a stream gauge at the bridge crossing Highway 1. The water level stabilized during 13-14 January, signifying that it had reached peak flow, and was then expected to subside. Around midnight on 15 January the seismometer at Grímsfjall began recording increased tremor, which was likely due to increased geothermal activity and is commonly observed at the end of a jökulhlaup.
Source: Icelandic Meteorological Office (IMO)
A brief seismic swarm at Grímsvötn was recorded by the seismic network beginning at 1600 on 4 January, prompting Icelandic Meteorological Office (IMO) to raise the Aviation Color Code to Yellow (the second level on a four-color scale). The swarm consisted of seven earthquakes with magnitudes above 1, which was considered unusual. Since the beginning of December there had been evidence of water drainage from the lake; the earthquakes may have been related to the drainage, but it was not confirmed. Activity did not escalate on 5 January and only one M 0.6 earthquake was detected. The Aviation Color Code was lowered to Green. The report noted that seismic activity at the volcano had been above background levels during the previous four months.
Source: Icelandic Meteorological Office (IMO)
On 9 November Icelandic Meteorological Office (IMO) lowered the Aviation Color Code for Grímsvötn to Green (the lowest level on a four-color scale) noting no short-term increases in activity, though long-term trends remained above background levels. Seismicity continued to be characterized as unusual, with an increasing number of earthquakes that were also intensifying over the past months. The levels of deformation had already exceeded the level measured before the last eruption in 2011.
Source: Icelandic Meteorological Office (IMO)
Icelandic Meteorological Office (IMO) reported that the small jökulhlaup at Grímsvötn that began on 10 October had peaked on 16 October and then began to subside. The onset of the jökulhlaup was slower than forecasted, flowing in the Gigjukvisl River at about 300 cubic meters per second by 12 October. The ice sheet had subsided a total of 7 m. A M 2 earthquake was recorded on 13 October just NE of Grímsvötn but did not signal increased seismicity. By 14 October the outflow from the lakes was an estimated 500 cubic meters per second and subsidence has totaled 15 m. Four earthquakes, all under M 2.5, were recorded during 15-16 October. The Aviation Color Code remained at Yellow (the second lowest level on a four-color scale).
Sources: Icelandic Meteorological Office (IMO); Institute of Earth Sciences
Icelandic Meteorological Office (IMO) reported that recent GPS measurements indicated that the ice sheet had subsided about 3 m and the lake beneath the glacier at Grímsvötn had begun to drain, though the water had not reached the glacier’s margins. IMO forecasted a small jökulhlaup and raised the Aviation Color Code to Yellow (the second lowest level on a four-color scale) on 10 October. The report noted that neither seismicity nor gas emissions were elevated, though activity at the volcano had been increasing over time. Notably, a pulse of seismic tremor was recorded for about an hour during the previous week, and magmatic gases were measured in fumarolic plumes in 2020. By 12 October the outflow of water was about 300 cubic meters per second, with the onset of the jökulhlaup occurring slower than initially calculated, and the ice sheet had subsided a total of 7 m. The flooding was likely going to be equal to that seen during the summer and would likely not impact bridges or structures.
Source: Icelandic Meteorological Office (IMO)
The Icelandic Meteorological Office (IMO) reported that seismicity at Grímsvötn had declined to normal levels during the past few days, and no significant variations from background levels were observed in geochemical or deformation data. On 9 August the Aviation Color Code was lowered to Green.
Source: Icelandic Meteorological Office (IMO)
The Icelandic Meteorological Office (IMO) reported that increased seismicity, characterized by several earthquakes with magnitudes over 1, began at Grímsvötn during the afternoon of 2 August and continued through the afternoon of 3 August. The largest event was a M 3.6 detected at 1424. IMO raised the Aviation Color Code to Yellow.
Source: Icelandic Meteorological Office (IMO)
The Icelandic Meteorological Office (IMO) lowered the Aviation Color Code for Grímsvötn to Green on 12 January, noting that seismicity had returned to normal levels with a few earthquakes detected over the previous few weeks. The caldera had deepened during the jökulhlaup (glacial outburst flood) that had occurred during November and December 2021, though IMO noted that it was difficult to characterize the current status of the caldera and the level of the geothermal activity.
Source: Icelandic Meteorological Office (IMO)
The Icelandic Meteorological Office (IMO) reported that the jökulhlaup (glacial outburst flood) due to subsidence of the ice shelf in Grímsvötn’s caldera continued until 6 December. Subsidence of the ice shelf into the underlying lake had begun around 24 November in an area SE of Grímsfjall. Water from the lake drained from the E side of Skeiðarárjökull and from a channel in the middle of a trail into the Gígjukvísl River, causing rising waters first detected in that river overnight during 30 November-1 December. By 2 December the flow rate in the river was 930 meters per second, triple what was detected three days before, and 10 times the normal seasonal rate. Daily measurements showed that the flow rate continued to rise, likely peaking at 2,800 meters per second during the morning of 5 December; a second measurement later that day showed a lower discharge rate of 2,310 meters per second. The ice shelf continued to subside, though more slowly, and water turbulence in the lake had also decreased; the data indicated that the lake was mostly empty of water. A number of detected earthquakes were attributed to subsiding and breaking ice.
By 6 December the ice shelf had subsided a total of about 77 m. At 0615 an M 2.3 earthquake was immediately followed by a M 3.6 one minute later. Five more earthquakes were recorded during 1500-2130, though all were below M 1. IMO raised the Aviation Color Code to Orange (the second highest level on a four-color scale) based on the increased seismicity during the previous few days, the larger events that morning, and considerations such as short run-up times seen before previous eruptions, and those past eruptions occasionally following flood events. Seismic tremor had decreased by the next day, and no signs of eruptive activity were indicated in gas or deformation data. On 7 December the Aviation Color Code was lowered to Yellow.
Source: Icelandic Meteorological Office (IMO)
On 24 November Icelandic Meteorological Office (IMO) reported that the ice sheet in Grímsvötn's caldera had subsided 60 cm in the previous few days and the rate of subsidence had accelerated in the last day. By 29 November the ice had sunk a total of 5 m and by 1 December the subsidence totaled 10 m. Data indicated that water had likely begun exiting the caldera and will result in a jökulhlaup (glacial outburst flood) that will cause flooding conditions in drainages. Water levels in the Gígjukvísl drainage rose overnight during 30 November-1 December.
Source: Icelandic Meteorological Office (IMO)
Icelandic Meteorological Office (IMO) reported that the jökulhlaup from the [eastern and western Skaftá cauldrons, NW of Grímsvötn] that began on 1 September had decreased during 8-10 September. IMO warned of continuing flood conditions in the downstream parts of the Skaftá river.
Source: Icelandic Meteorological Office (IMO)
On 1 September the Icelandic Meteorological Office (IMO) stated that the water level of the Skaftá river at Sveinstindur (the closest gauging station at 28 km downstream from the ice margin) rose, suggesting the beginning of a Skaftárhlaup or glacial outburst flood (also called a jökulhlaup), that originated from [the Western Skaftá cauldron, about 20 km NW of Grímsvötn]. A sulfur odor was also noted in the vicinity of Skaftá and Hverfisfljót. IMO warned that hydrogen sulfide released from the floodwater as it drained from the caldera lake was particularly potent at the river outlet from the ice margin, where concentrations may reach toxic levels. The flow rate in the Skaftá peaked at 520 cubic meters per second downstream near the bridge at Eldvatn on 2 September and then declined to 412 cubic meters per second in the afternoon of 3 September. As a result, the ice shelf began to subside around 2300 on 4 September, dropping 1 m by 1145 the next morning, based on GPS data. On 6 September the discharge rate increased rapidly and peaked at 610 cubic meters per second at 1400, then declined later that day. Data suggested that the peak discharge rate on 6 September was due to a second release of water from the eastern part of the caldera lake. On 7 September the flow rate had increased to 520 cubic meters per second. Based on an overflight IMO concluded that the glacial flooding from both the E and W parts of the lake was smaller in volume and flow rates compared to a similar event in 2018.
Source: Icelandic Meteorological Office (IMO)
The Icelandic Meteorological Office raised the Aviation Color Code for Grímsvötn to Yellow on 30 September, noting that activity had been increasing over time and was above background levels. The report stated that seismicity increased over the past month, cauldrons had deepened in several places around the caldera signifying increased geothermal activity, surface deformation surpassed the level prior to the 2011 eruption, and magmatic gases were present in emissions over the summer. Additionally, water levels in the subglacial lake were comparable to levels prior to floods in 2004 and 2010.
Source: Icelandic Meteorological Office (IMO)
On 8 September the Icelandic Meteorological Office (IMO) stated that the water level of the Skaftá river at Sveinstindur (the closest gauging station at 28 km downstream from the ice margin) rose significantly in the previous 24 hours, suggesting the beginning of a glacial outburst flood (jökulhlaup), originating from [the Western Skaftá ice cauldron, about 20 km NW of Grímsvötn]. The discharge rate of Skaftá at Sveinstindur was 270 m³/s. IMO warned that hydrogen sulfide released from the floodwater as it drains is particularly potent at the river outlet from the ice margin, where concentrations may reach poisonous levels.
Source: Icelandic Meteorological Office (IMO)
On 23 June the Icelandic Meteorological Office (IMO) stated that the water level of the Skaftá river at Sveinstindur (the closest gauging station at 28 km downstream from the ice margin) and electrical conductivity both rose in recent days, indicating the beginning of a glacial outburst flood (jökulhlaup), originating from [the Western Skaftá ice cauldron, abotu 20 km NW of Grímsvötn]. The western ice cauldron last drained in June 2015. The discharge rate of Skaftá at Sveinstindur was 112 m³/s. IMO warned that hydrogen sulfide released from the floodwater as it drains is particularly potent at the river outlet from the ice margin, where concentrations may reach poisonous levels.
Source: Icelandic Meteorological Office (IMO)
According to the Icelandic Meteorological Office, the water level of the Skaftá river at Sveinstindur (the closest gauging station at 28 km downstream from the ice margin) and electrical conductivity both rose on 29 September, indicating the beginning of a glacial outburst flood (jökulhlaup), originating from [the Eastern Skaftá ice cauldron, NW of Grímsvötn]. GPS measurements indicated that the ice surface above the lake began to subside late on 27 September; the rate progressively increased reflecting increased discharge from the lake.
At 0330 on 1 October the discharge rate detected at Sveinstindur was higher than 1,300 m³/s, the highest rate recorded since the station was established in 1971. At around 1000, floodwater was also detected in Skaftárdalur at a discharge rate of ~400 m³/s and was rising quickly. GPS data from the eastern ice cauldron showed over 66 m of subsidence since 1800 on 27 September. IMO warned that hydrogen sulfide released from the floodwater as it drains is particularly potent at the river outlet from the ice margin, where concentrations may reach poisonous levels. The cauldrons drain every two years on average, producing floods of up to 1,500 cubic meters per second. During fieldwork later that day volcanologists observed where the jökulhlaup had burst through the glacier at several locations 1-2 km from the terminus. Ice fragments a few tens of centimeters in diameter were scattered near the terminus; ice blocks 3-5 m high and 10 m long were deposited close to the outflow points.
On 2 October IMO noted that the jökulhlaup was possibly the largest to have occurred from the Skaftá cauldrons. The discharge rate peaked at 0200, just short of 2,100 m³/s, however true discharge rate was thought to have been considerably greater (3,000 m³/s) since water flooded outside of the gauged area. The discharge rate peaked at 1300 at Eldvatn near Ásar at an approximate rate of 2,200 m³/s. According to a news article, the high waters in the Skaftá River damaged the bridge over Eldvatn prompting authorities to close the bridge during 4-5 October.
Sources: Icelandic Meteorological Office (IMO); Iceland Magazine
According to the Icelandic Meteorological Office, the water level of the Skaftá river at Sveinstindur and electrical conductivity both rose during 16-17 June, indicating a glacial outburst flood (jokulhlaup), originating from [the western Skaftá ice cauldron, about 20 km NW of Grímsvötn]. The jokulhlaup was unconfirmed without visual observations, however. The report warned that hydrogen sulfide released from the floodwater as it drains is particularly potent at the river outlet at the ice margin, where concentrations may reach poisonous levels. The cauldrons drain an average every two years, producing floods of up to 1,500 cubic meters per second.
Source: Icelandic Meteorological Office (IMO)
According to the Icelandic Meteorological Office, a small glacial outburst flood (jökulhlaup) from Grímsvötn's subglacial lake was occurring on 6 May, increasing the water level in the Gígjukvísl River. Electrical conductivity measurements indicated a considerable increase of a geothermal contribution to the river water. Based on information from the Institute of Earth Sciences, the water available for drainage was 0.2-0.3 cubic kilometers, therefore the maximum discharge of the flood was expected to be less than 700 cubic meters per second, occurring towards the middle of the week. Seismic tremor had increased due to the flood and not volcanic activity. The report warned that hydrogen sulfide released from the floodwater as it drains is particularly potent at the river outlet at the ice margin, where concentrations may reach poisonous levels.
Source: Icelandic Meteorological Office (IMO)
According to the Icelandic Meteorological Office, a small glacial outburst flood (jokulhlaup) from Grímsvötn's subglacial lake was occurring on 27 March, increasing the water level in the Gígjukvísl River; it was expected to peak by the end of the week and remain small. Electrical conductivity measurements indicated a considerable increase of a geothermal contribution to the river water. Seismic tremor had increased due to the flood and not volcanic activity. The report warned that hydrogen sulfide released from the floodwater as it drains is particularly potent at the river outlet at the ice margin, where concentrations may reach poisonous levels.
Source: Icelandic Meteorological Office (IMO)
According to the Icelandic Meteorological Office, the level of the Skaftá river at Sveinstindur and electrical conductivity both rose during 18-19 January indicating a glacial outburst flood (jokulhlaup), originating from [the western Skaftá ice cauldron, about 20 km NW of Grímsvötn]. The jokulhlaup was unconfirmed without visual observations, however. Flood waters peaked on 20 January and then began to subside on 21 January. The report noted that floods in Skaftá source from two ice cauldrons formed by persistent geothermal activity beneath Vatnajökull. The cauldrons drain an average every two years, producing floods of up to 1,500 cubic meters per second.
Source: Icelandic Meteorological Office (IMO)
According to scientists from the Institute of Earth Sciences at the University of Iceland and the Icelandic Meteorological Office, explosive activity occurred from four tephra cones surrounded by water in Grímsvötn's crater during the evening of 24 May. Pulsating ash plumes rose a few kilometers above the cones, producing only local fallout of material. Seismic tremor decreased. On 25 May, observers noted steam bursts from the crater. Tephra fallout was noted only in the vicinity of the eruption site. Pilots reported widespread ash in layers 5-7 km W of the volcano and also some ash haze below 3 km (9,800 ft) a.s.l. to the SW. Seismic tremor decreased considerably. On 26 May minor steam explosions continued from the crater. According to news articles, air traffic disruption was reduced to parts of Norway and Sweden. On 28 May tremor rapidly decreased then disappeared, and on 30 May participants on the Iceland Glaciological Society's spring expedition confirmed that the eruption had ended. Satellite imagery and visual observations showed that only small amounts of ice melted during the eruption; no signs of flooding had been detected.
Sources: Agence France-Presse (AFP); Institute of Earth Sciences; Icelandic Meteorological Office (IMO)
According to scientists from the Institute of Earth Sciences at the University of Iceland and the Icelandic Meteorological Office, an eruption from the subglacial Grímsvötn volcano began on 21 May following about an hour of tremor. A GPS-station on the rim of the Grímsvötn caldera had revealed continuous inflation and expansion of few centimeters per year since the 2004 eruption, interpreted as inflow of magma to a shallow chamber. Other precursors over the previous few months were increased seismicity, including some bursts of tremor, and increased geothermal activity.
The eruption began at 1630 on 21 May, and at 2000 the eruption plume rose to an altitude over 20 km (65,000 ft) a.s.l. The plume altitude fell to 15 km (49,200 ft) a.s.l. during the night but occasionally still rose to 20 km (65,000 ft) a.s.l. Ash from the lower part of the eruption plume drifted S and at higher altitudes drifted E. A few hours after the onset of the eruption ashfall began over areas S of the Vatnajökull ice cap, more than 50 km from the eruption site. Earthquake locations and limited observations during an initial overflight suggested that the eruption site was in the SW part of the caldera, where the 2004 eruption was located. According to news articles, the road in Skeidarársandur, S of Vatnajökull and part of the ring road around Iceland, closed and remained closed through 24 May.
During the morning of 22 May the plume rose to an altitude of 10-15 km (32,800-49,200 ft) a.s.l. The color of the plume was brown-to-grayish and sometimes black close to the source. Most of the plume drifted S, but lower parts traveled SW. Tephra fall was concentrated to the S and to a lesser extent N and E. In the afternoon lightning strikes ranged from 60-70 per hour (up to 300 during one hour) and were most frequent in the ash plume to the S. News outlets noted that the Keflavík airport closed. Ashfall was reported from the Reykjavík area in the SW to Tröllaskagi Peninsula in the N. An article also stated that, according to a geophysicist, the eruption was the largest for Grímsvötn in 100 years, was similar to the eruption of 1873, and was larger than the Eyjafjallajökull eruption of 2010.
During 22-23 May the ash plume rose to altitudes of 5-10 km (16,400-32,800 ft) a.s.l. and drifted S at lower altitudes and W at altitudes 8 km (26,200 ft) a.s.l. and higher. Ashfall was detected in several areas throughout Iceland except in some areas to the NW. On 24 May the ash plume was estimated to be mostly below 5 km (16,400 ft) a.s.l. because meteorological clouds over the glacier were at 5-7 km (16,400-23,000 ft) a.s.l. and the plume only briefly rose above the cloud deck. Satellite images showed the plume extending over 800 km from the eruption site towards the S and SE. News articles reported that dozens of carriers rerouted or cancelled flights in Norway, Denmark, and Scotland.
Sources: The Local (Sweden); Institute of Earth Sciences; Iceland Review; Icelandic Meteorological Office (IMO); Associated Press
According to scientists from the Institute of Earth Sciences at the University of Iceland and the Icelandic Meteorological Office, an eruption began at the subglacial Grímsvötn volcano on 1 November around 2100. The eruption was preceded by both long-term and short-term precursors, and was triggered by the release of overburden pressure associated with a glacial outburst flood (jokulhlaup), originating from the Grímsvötn subglacial caldera lake.
Seismicity originally increased at the volcano in mid-2003, about the same time uplift exceeded a maximum reached in 1998 [(the last eruption at Grímsvötn was in December 1998)]. Additional uplift and expansion of the volcano [was also detected since mid-2003]. Seismicity further increased in late October 2004, and on 26 October high-frequency tremor indicated increased water flow from the caldera lake and suggested that a glacial outburst flood was about to begin. On 29 October, the amount of discharge increased in the Skeidara River. About 3 hours before the eruption began an intense swarm of volcanic earthquakes started, changing to continuous low-frequency tremor at the onset of the eruption. The release in overburden pressure associated with the outburst flood triggered the eruption. The amount of drop in water level in the Grímsvötn caldera at the onset of the eruption is uncertain, but was probably on the order of 10-20 m, corresponding to a pressure change of 0.1-0.2 MPa at the volcano's surface. This modest pressure change triggered the eruption because internal pressure in the Grímsvötn shallow magma chamber was high after continuous inflow of magma to the volcano since 1998.
The London VAAC reported that the ash plume produced from the eruption reached a height of ~12.2 km a.s.l. According to news articles, the eruption occurred in an unpopulated region so no evacuations were needed, but air traffic was diverted away from the region.
Observations on 2 November revealed that the eruption was occurring from a circular vent ~1 km in diameter in the SE part of the volcano's crater. The ice thickness in this part of the Grímsvötn caldera was ~200 m prior to the eruption. On 3 November, eruptive activity occurred in pulses, resulting in a changing eruption column height from 8-9 km to 13-14 km above the volcano. The ash fall sector extended at least 150 km from the eruption site. The distal ash plume was observed in Norway, Finland, and Sweden.
Sources: Associated Press; Institute of Earth Sciences; Reuters; London Volcanic Ash Advisory Centre (VAAC)
Reports are organized chronologically and indexed below by Month/Year (Publication Volume:Number), and include a one-line summary. Click on the index link or scroll down to read the reports.
Jökulhlaut in late March 1972
Card 1369 (27 March 1972) Jökulhlaut in late March 1972
Professor Thorarinsson reported to Dr. Friedman that "we are now having a jökulhlaut from Grímsvötn and expect it to culminate within a week. It has been decided to build a road over Skeidharársandur and our road engineers are therefore very interested in this jökulhlaut. I myself have observed most of them since 1934. Our annual visit to Grímsvötn and studies of their behavior since 1958 have now suddenly become very important as we can foretell a lot about jökulhlauts, their approximate maximum runoff, etc.; which the road engineers need to know. Unfortunately, the weather is bad these days for conventional photographing; hence, aerial thermal imagery would no doubt prove useful in this case."
Dr. Friedman adds: "The jökulhlauts--glacial outburst floods--from under the Vatnajökull icecap in the recent past have occurred almost every five years, and in most instances have been the results of subglacial volcanic eruptions which do not penetrate through the icecap completely. They melt a large volume of water which in some historical cases has amounted to as much runoff as the Amazon River yields in the course of a few days. We do not know the cause of the present jökulhlaut."
Information Contacts:
Reporting Source: Jules Friedman, U.S. Geological Survey.
Source Contact: S. Thorarinsson, Univ. of Iceland.
Large jökulhlaup from beneath Vatnajökull glacier
"A glacier burst (jökulhlaup) from Grímsvötn caldera in Vatnajökull glacier started 28 January. It increased slowly, with a discharge on 4 February of 420 m3/s. It culminated on 11 February at 2,000 m3/s and ended 21 February. Total discharge is estimated at 1.3 km3 and the lowering of the ice level in the caldera at about 50 m. The volume of the last jökulhlaup from Grímsvötn, in September 1976, was estimated at 2.4 km3 and that of 1972 at 3.2 km3."
[Most of the] documented jökulhlaups from Vatnajökull between 1332 and 1934 were probably caused by eruptions of Grímsvötn, under the glacier. Since then, Icelandic volcanologists believe that steady heat production from Grímsvötn has caused a gradual buildup of meltwater beneath the glacier. Occasional sudden failures have produced large outflows from beneath Vatnajökull.
Information Contacts: S. Thorarinsson and H. Björnsson, Univ. of Iceland; K. Grönvold, NVI; S. Rist, National Energy Authority.
Subglacial activity ejects large vapor plumes; small island in meltwater lake; minor ashfall; no jökulhlaups
"A subglacial volcanic eruption started in Grímsvötn below the W part of the ice cap Vatnajökull on 28 or 29 May. The central part of the Grímsvötn area is a caldera of about 35 km2, one of the most active volcanic and geothermal areas in Iceland.
"Melting of ice due to intense geothermal activity and continuous inflow of ice causes a gradual buildup of meltwater below the 200-m-thick floating ice shelf in the caldera. This buildup culminates in a jökulhlaup (glacier burst) when the level of the lake reaches a certain threshold value. The water drains in a catastrophic flood beneath the ice, 50-60 km into the rivers on the Skeidarársandur outwash plain S of the ice cap. The jökulhlaups last about 3 weeks and occur about once to twice every decade, the last one in January-February 1982.
"The last definite volcanic eruption in the caldera was in 1934 but small eruptions may have occurred since without being noticed due to the remoteness of the area. In most cases known previous eruptions have been accompanied by jökulhlaups. The new eruption was preceded by an intense earthquake swarm that began at about 0400 on 28 May. The largest earthquakes were in the magnitude range 3-3.5. Earthquake activity declined at about 1000 and soon after that bursts of volcanic tremor began to appear on the seismograms. The tremor amplitude increased at about 1500 and intense bursts of tremor were recorded for the rest of that day and the next day. During the following days the tremor gradually decreased in amplitude.
"The first definite observation of the eruption was on 29 May at 1030 from an aircraft, diverted to fly over Grímsvötn by request from seismologists. At that time the eruption had broken through the ice and produced a 5-km-long very thin ash fan downwind on the ice cap S of Grímsvötn. Steam clouds were observed in the direction of Grímsvötn on 28 May at about 2115. Weather satellite images on 29 May show a long narrow cirrus cloud that almost certainly originated at Grímsvötn during the morning of 29 May, at 0300 at the latest.
"When the eruption was observed on 29 May an opening had formed in the ice shelf inside the caldera near the SW wall. This lake was oval-shaped, about 300 m in diameter, and during 29 May covered by raft ice from the overhanging caldera wall. Explosions were observed in the lake at varying time intervals. The highest explosions reached about 50 m but the accompanying steam columns reached 1-2 km. During the next few days, weather conditions prevented direct observations except the height of the steam column. On 30 May, a maximum height of 6,000-7,000 m was observed, on the 31st 7,000-8,000 m, and on 1 June about 5,000 m. The steam column was intermittent, never continuous. After that, no activity has been observed, but on 5 June a small island was observed in the steaming lake.
"No change has been observed in the rivers that drain the glacier. At this time, it is not known whether the eruption has affected the lake level within the Grímsvötn caldera."
Further Reference. Einarsson, P., and Brandsdóttir, B., 1984, Seismic activity preceding and during the 1983 volcanic eruption in Grímsvötn, Iceland: Jökull, v. 34, p. 13-23.
Grönvold, K., and Jóhannesson, H., 1984, Eruption in Grímsvötn 1983; course of events and chemical studies of the tephra: Jökull, v. 34, p. 1-11.
Information Contacts: K. Grönvold, NVI; P. Einarsson and H. Björnsson, Univ. of Iceland.
Abrupt subglacial fissure eruption fills caldera lake with meltwater; glacier burst expected
The Nordic Volcanical Institute reported that from late in the evening of 30 September until 13 October a subglacial eruption occurred along part of the East Rift Zone that traverses beneath the NW side of Vatnajökull, Europe's largest continental glacier (Björnsson and Einarsson, 1991; Björnsson and Gudmundsson, 1993). This part of the Rift Zone includes both Bardarbunga and Grímsvötn fissure systems and their respective central volcanoes, each containing a substantial caldera (figure 1).
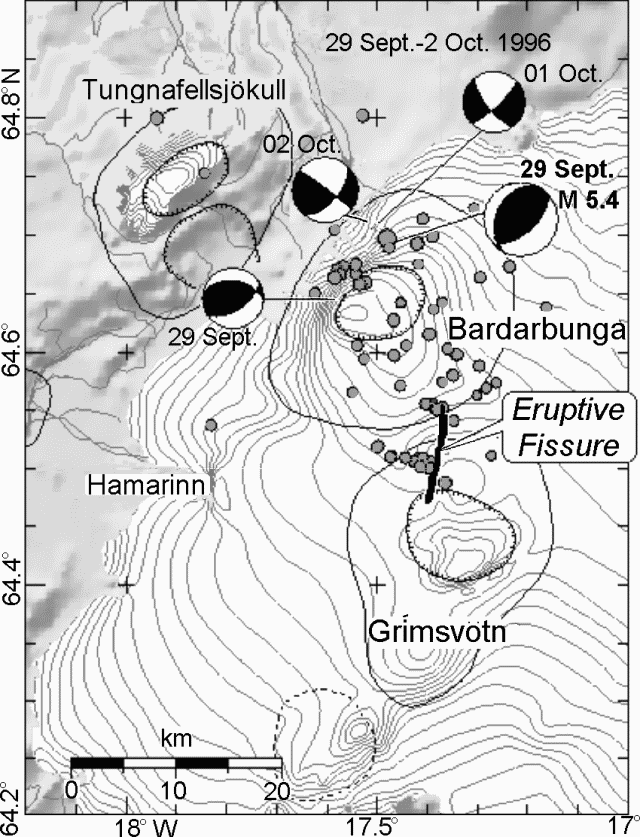 |
Figure 1. Area map showing the erupting fissure and recent seismicity along the East Rift Zone in the Grímsvötn-Bardarbunga region. Shaded regions indicate exposed land surface, unshaded regions indicate glaciers; ice-surface contour values are undisclosed. The solid sub-circular lines depict the larger extents of the named central volcanoes; hachured lines indicate the respective caldera topographic margins. Dots show earthquake epicenters for 29 September-2 October. Balloons depict available earthquake fault plane solutions for some events over M 4. Courtesy of the Icelandic Meteorological Office. |
The eruption was preceded by an unusual sequence of earthquakes. One, at 1048 on 29 September, was Ms 5.4 and centered near Bardarbunga caldera's N rim (figure 1). Similar earthquakes have occurred beneath Bardarbunga many times during the last 22 years. Unlike this event, however, none of the previous large earthquakes had either significant aftershocks or preceded magmatic activity.
In the two hours following the M 5.4 event there were numerous earthquakes, including five larger than M 3. These were recorded at the two analog seismic stations just NW of Bardarbunga and at the S rim of the Grímsvötn caldera. Shortly after 1300 on 30 September, Science Institute seismologists informed Civil Defense authorities and the scientific community about this unusual seismicity and the possibility of impending eruptive activity.
The seismic swarm continued throughout 30 September, with increasing intensity. Hundreds of earthquakes were recorded each day, including over 10 events larger than M 3. The earthquakes were located in the N part of Bardarbunga and migrated towards Grímsvötn. They were accompanied by high-frequency (>3 Hz) continuous tremor of the same type as was frequently observed during intrusive activity within the Krafla volcanic system during 1975-84.
The Civil Defense Council issued a warning of a possible eruption at 1900 on 30 September. Later that evening earthquake activity near Grímsvötn decreased markedly, while that near Bardarbunga continued. At about 2200 the seismograph at Grímsvötn began recording continuous small-amplitude eruption tremor. The sudden decrease in earthquake activity and the onset of tremor may be taken as evidence that an eruption began between 2200 and 2300 on September 30. Tremor amplitude increased very slowly during the next hours, reaching a maximum at about 0600 on 1 October.
The eruption site was spotted from aircraft in the early morning of 1 October. By that time two elongate, 1-2 km wide and N23E-trending subsidence bowls or cauldrons had developed in the ice surface. These bowls were located to Bardarbunga's SSE, along a fissure on Grímsvötn's N flank (figure 1). The bowls (one of which is shown in figures 2 and 3) appeared in the glacial ice above a 4-6-km-long NNE-trending fissure; ice in this location had been considered 400-600 m thick, though some later estimates put the ice thickness more precisely at 450 m. The eruption was most powerful under the northernmost bowl, causing it to subside 50 m over 4 hours.
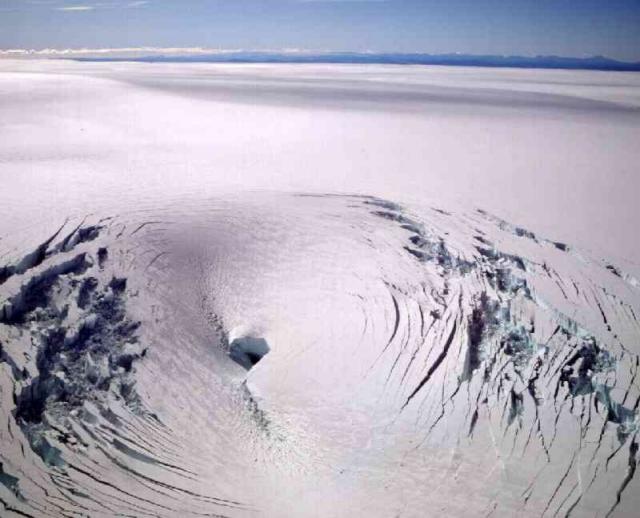 |
Figure 2. A subsidence bowl developed in glacial ice on Grímsvötn's N flank., 1 October 1996. Courtesy of R. Axelsson. |
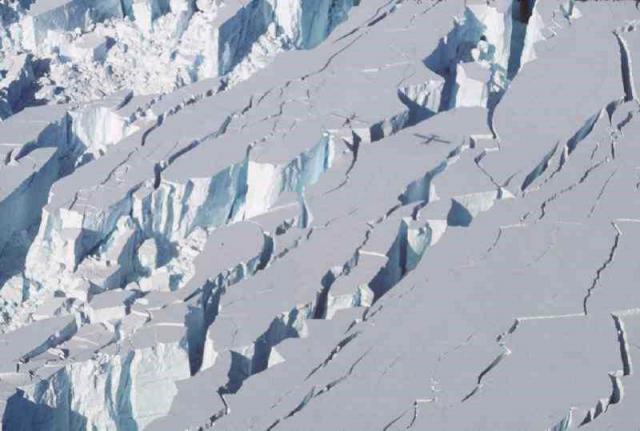 |
Figure 3. A detail from 1 October showing inward stepping crevasses of the subsidence bowl with a fixed-wing airplane and its shadow for scale. Courtesy of R. Axelsson. |
The resulting meltwater drained into Grímsvötn caldera (figure 1) raising the ice shelf above the caldera lake. The lake was covered by 250 m of ice and held in place by an ice dam. Widening and deepening of the bowls during the day added an estimated 0.3 km3 of water to the Grímsvötn lake in less than 24 hours. On 1 October a shallow linear subsidence structure extended from the eruption site to the subglacial Grímsvötn caldera lake, the surface manifestation of the subglacial pathway for water draining into Grímsvötn.
By 1 October the lake's surface had risen 10-15 m (to 1,410 m). During the first week of the eruption meltwater production was thought to be ~5,000 m3/second, but it later slowed. Glacier bursts (jökulhlaups) were thought to be likely, if not imminent. Water from Grímsvötn crater lake was expected to emerge at an outlet at the edge of the glacier ~50 km S. N-directed floods were also expected if the eruptive fissure continued to propagate N.
Helgi Torfason noted that although a previous glacier burst took place last summer (with 3,000 m3/second flow rates), the affected bridges were designed to withstand surges with meltwater fluxes 3x that size. On the other hand, a 1938 eruption, in almost exactly the same place (Gudmundsson and Björnsson, 1991) caused glacier bursts with fluxes ~5 or 6 times as large.
At 0447 on the morning of 2 October a vent on the floor of one bowl broke through the ice and the eruption began a subaerial phase. At 0800 vigorous explosive activity was observed in the crater with the eruption column rising to 4-5 km altitude. One account noted that rhythmic explosions resulted in black ash clouds rising 500 m while the buoyant eruption column rose to 3 km. In the afternoon the opening in the ice was several hundred meters wide. The eruptive fissure apparently extended 3 km farther N, because on the ice surface observers saw a new, elongated, N-trending ice cauldron. Some 2 October reports noted a steam column that rose to ~10 km altitude.
On 3 October the ice bowl over the northernmost part of the fissure had grown ~2 km since the previous day. By this time the glacier had subsided over an area 8-9 km long and 2-3 km wide. Subaerial eruptions pulsated, alternating between quiet periods and explosive activity. Ash mainly dispersed N but also SSW. The opening at the eruption site grew larger. Eruptive intensity began to decline on this day but tremor continued. A TV photographer captured footage of two lightning strikes traveling along the ash cloud that was widely shown on news reports. The water level in the vent was ~50-200 m below the original ice surface. The surface of Grímsvötn lake was at 1,460 m. Ash samples collected on this day had water-soluble fluorine contents of ~130 ppm, ~10% the amount found in Hekla ash, reducing concerns about the immediate danger to grazing animals. Initial electron microprobe analysis of the ash indicated that it was basaltic andesite in composition.
The eruption continued on 4 October. It was noted that the caldera lake was higher than at any point in this century. Poor weather intervened for the next few days, but on 7 and 9 October the eruption continued from the 9-km-long fissure; thin ash covered about half of the 8,100 km2 Vatnajökull glacier. On 9 October J-M. Bardintzeff and a visiting French team saw a 4-km-high plume as well as violent phreatic ash emissions between 1230 and 1415.
On 10 October eruptive intensity appeared similar to the low levels seen since 3 October. Occasional eruptions carried black ash clouds to ~3 km and vapor with finer ash to 4 km. Minor ashfall was limited to the Vatnajökull glacier. An 11 October flight confirmed that emissions continued, but lacked rooster-tail-shaped explosions seen previously and may have declined in intensity. The eruptive crater was still water covered. Grímsvötn ice cover had bulged upward but signs of escaping water were absent. The caldera lake's total volume was estimated at >2 km3.
A Canadian Space Agency satellite radar image from 17 October was processed by Troms Satellite Station. In this image they found increased backscatter compared to earlier in the month; they suggested that this may have been due to cooler ice caused by a return to stability around the crater. In accord with this observation, on 18 October NVI announced that the eruption had apparently stopped on 13 October.
The eruption left material piled up to form a subglacial ridge; the highest part of this ridge supported an eruptive crater that reached a few to tens of meters out of meltwater at the eruptive site. Cooling eruptive materials continued to melt significant volumes of ice.
Increased CO2 and H2S in N-flowing river water suggested some flow of meltwater from the eruptive site. As of 18 October most of the meltwater was still directed towards the Grímsvötn caldera lake, with no signs of the awaited glacier burst. GPS measurements in October documented the lake's rise on the 12th (1,500 m), 15th (1,504 m), and 17th (1,505 m). Glacier bursts from the crater lake have typically occurred at the much lower lake level of ~1,450 m.
The recent eruption was a continuation of geophysical events in the Vatnajökull area that began in 1995 and possibly earlier. In July 1995 and August 1996 there were glacial floods from subglacial geothermal areas NW of Grímsvötn. In both cases, after the water reservoir drained, distinct tremor episodes occurred. Presumably, these pressure releases triggered small eruptions. In February 1996 there was an intense, week-long earthquake swarm centered on Hamarinn volcano (figure 1).
Besides the prospect of glacier bursts, the eruption was watched closely because the 1783-84 Laki (Skaftár Fires) and 1783-85 Grímsvötn eruptions vented on the Rift Zone within ~70 km of the current eruption. The 27-km-long Laki fissures active in 1783-84 start ~40 km SW of Grímsvötn's center. The Laki eruption produced 14.7 ± 0.1 km3 of basaltic lavas (Thordarson and Self, 1993) making it the largest known lava eruption in history. Sulfur and other gases released produced an acid haze (aerosol) that perturbed the weather in Western Eurasia, the North Atlantic, and the Arctic. An estimated 9,350 Icelanders died in the "haze famine" from 1783-86, an interval that included two severe winters, crop failures, livestock and fish deaths, and various illnesses, including fluorine poisoning (Stothers, 1996).
References. Björnsson, H., and Gudmundsson, M.T., 1993, Variations in the thermal output of the subglacial Grímsvötn caldera, Iceland: Geophysical Research Letters, v. 20, p. 2127-2130.
Björnsson, H., and Einarsson, P., 1991, Volcanoes beneath Vatnajökull, Iceland: evidence from radio-echo sounding, earthquakes and jökulhlaups: Jökull, v. 40, p. 147-168.
Gudmundsson, M.T., and Björnsson, H., 1991, Eruptions in Grímsvötn, Vatnajökull, Iceland, 1934-1991: Jökull, v. 41, p. 21-45.
Stothers, R.B., 1996, The great dry fog of 1783: Climatic Change, Kluwer Academic Publishers, v. 32, p.79-89.
Thordarson, T., and Self, S., 1993, The Laki (Skaftár Fires) and Grímsvötn eruptions in 1783-1785: Bulletin of Volcanology, Springer-Verlag, v. 55, p. 233-263.
Further Reference. Worsley, P., 1997, The 1996 volcanically induced glacial mega-flood in Iceland - cause and consequence: Geology Today, Blackwell Science, Ltd., v. 13., no. 6, p. 222-227.
Information Contacts: Nordic Volcanological Institute (NVI), Grensásvegur 50, 108 Reykjavík, Iceland (URL: http://nordvulk.hi.is/); Páll Einarsson, Bryndís Brandsdóttir, Magnús Tumi Gudmundsson, and Helgi Björnsson, Science Institute, Dunhagi 3, 107 Reykjavík, Iceland (URL: https://www.hi.is/); Icelandic Meteorological Office, Geophysics Department, Reykjavík, Iceland (URL: http://en.vedur.is/); J-M. Bardintzeff, Lab. Petrographi-Volcanologie, bat 504, Universite Paris-Sud, 91305 Orsay, France; Helgi Torfason, National Energy Authority, Grensasvegur 9, 108 Reykjavík, Iceland; Tromsø Satellite Station, N-9005, Tromsø, Norway; R. Axelsson, Morgunbladid News (photographer), Reykjavík, Iceland.
Subglacial eruption near site of 1996 outburst flood
On 18 December an eruption occurred within the caldera of the subglacial Grímsvötn volcano, 10 km S of the 1996 eruption that resulted in a catastrophic flood. Scientists quickly investigated; the information that follows is from the Nordic Volcanological Institute (NVI).
Eruptive activity. The eruption began at 0920 on 18 December. Ten minutes later a plume (figure 4) was observed that eventually rose 10 km above the Vatnajökull glacier and persisted throughout the day. The plume could be seen from Reykjavik, 200 km W. Winds deflected the plume, causing tephra fallout onto the glacier up to 50 km SE. The London Volcanic Ash Advisory Center issued aviation notices later that day and throughout the eruption.
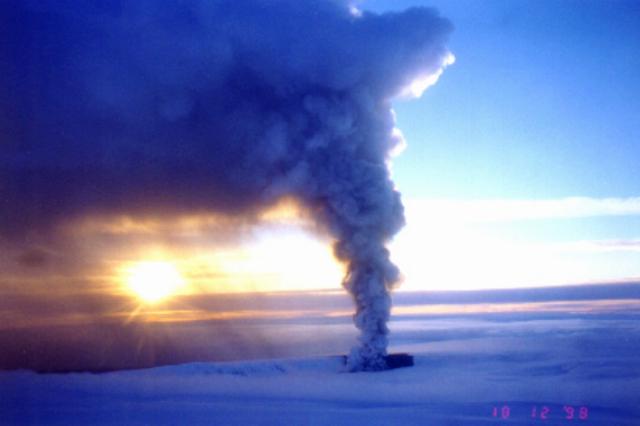 |
Figure 4. Photo of the eruption plume from Grímsvötn as it appeared from an aircraft on 18 December 1998. Courtesy of NVI; photo by Karl Grönvold. |
The eruption was preceded by a mild increase in seismicity for several weeks. A small earthquake swarm began at 2200 on 17 December and a sharp increase in earthquake activity began at 0330 on 18 December. This latter activity was replaced by continuous tremor at 0920, marking the beginning of the eruption. The Icelandic Meteorological Office and the Science Institute monitored seismicity during the eruption.
Vents were located along a 1,300-m-long E-W oriented fissure on the S caldera fault, similar to eruptions in 1934 and 1983, at the foot of Mt. Grímsfjall (which rises ~300 m above the flat ice shelf of the Grímsvötn subglacial lake). The eruption penetrated the caldera lake and its ice shelf, from ice/water depth of ~100 m. Activity was most vigorous at one crater, but several other craters on the short eruptive fissure were also active with less frequent explosions.
The eruption was slightly less vigorous on 19 December. The plume was continuous, but somewhat lower, rising to 7-8 km. Tephra continued to fall SE. A small part of the Grímsvötn ice shelf next to the eruption site had melted without raising the water level of the caldera lake significantly. Activity was mostly limited to one crater.
An overflight on 20 December from 1045 to 1215 revealed variable activity. The eruption plume extended to 7 km altitude. Initially the plume was light-colored, and narrow at its base. Later the ash content of the plume greatly increased, and the plume turned black. It collapsed down to 1-2 km, created a base surge, and Mt. Grímsfjall disappeared into an ash cloud.
Photographs from 27 December showed intermittent eruptive activity between 1124 and 1240. The plume was discontinuous, fed by intermittent crater activity. It rose to a maximum of 4.5 km and distributed ash near the crater; bombs up to 0.5 m in diameter were ejected onto Grímsfjall. The eruption has resulted in the formation of a tephra ring that lies partly on ice, but its inner part is likely to be made completely of ash overlying bedrock.
The eruption ended on 28 December. Continuous tremor recorded at the Grimsfjall seismograph, 3 km from the eruption site, stopped at 1050 on 28 December. Small tremor bursts were recorded for another 3 hours, but activity stopped completely at 1400.
This eruption was located 10 km S of the 1996 eruption in Vatnajökull (Gudmundsson and others, 1997), which caused a catastrophic outburst flood from the glacier. This time no major flood ensued because only a small amount of the Grímsvötn ice shelf near the eruption site melted, and water did not flow towards the Grímsvötn caldera lake.
Chemical analyses of ash. The ash analyzed fell during 1000-1200 on 20 December in Suðursveit, ~60 km SE of Grímsvötn. The ash was well sorted with an average grain size of 0.05 mm and density of ~2.7 g/cm3. The areal density of ash fall was estimated at 93 g/m2. The ash was aphyric; the glass composition (table 1) can be compared with Grímsvötn ash samples from earlier this century. The composition is similar to earlier samples; however, the recent sample is slightly less evolved, with higher MgO/FeO, Al2O3, and CaO, but lower TiO2. The composition was markedly different from more evolved samples from the 1996 eruption or most of the samples available from the neighboring Bárðarbunga volcanic system.
Table 1. Microprobe analyses of the glass phase from the 20 December 1998 Grímsvötn eruptions (standard deviation in parentheses) and two Grímsvötn hyaloclastites. The analyses from the 1983, 1934, 1922, and 1903 eruptions are from Grönvold and Johannesson (1984). The analyses of the hyaloclastites are from Heikki Makipaa (1978). All analyses are in weight percent. Courtesy NVI.
| Eruption / Sample Description | SiO2 | TiO2 | Al2O3 | FeO (total) | MnO | MgO | CaO | Na2O | K2O | P2O5 |
| Dec 1998 | 50.46 (0.55) | 2.55 (0.05) | 13.94 (0.29) | 12.90 (0.13) | 0.23 (0.01) | 5.72 (0.20) | 11.00 (0.28) | 2.71 (0.09) | 0.48 (0.03) | 0.35 (0.12) |
| 1983 G83-2 | 50.30 | 2.98 | 12.80 | 14.00 | 0.20 | 5.00 | 9.71 | 2.58 | 0.45 | 0.32 |
| 1983 G83-1 | 50.50 | 3.02 | 12.60 | 14.40 | 0.26 | 4.96 | 9.55 | 2.62 | 0.51 | 0.36 |
| 1934 G34 | 50.30 | 3.08 | 12.80 | 13.40 | 0.26 | 5.14 | 9.92 | 2.56 | 0.52 | 0.38 |
| 1922 G22 | 50.10 | 3.06 | 12.80 | 13.90 | 0.20 | 5.24 | 10.20 | 2.47 | 0.40 | 0.30 |
| 1903 G03 | 49.80 | 2.92 | 13.10 | 13.60 | 0.20 | 5.45 | 10.30 | 2.53 | 0.38 | 0.27 |
| HM22 Hyaloclastite glass | 49.92 | 2.59 | 14.46 | 12.95 | 0.23 | 5.42 | 10.09 | 2.98 | 0.31 | 0.32 |
| HM23 Hyaloclastite glass | 49.49 | 2.49 | 14.10 | 12.91 | 0.23 | 5.12 | 10.56 | 2.80 | 0.45 | 0.25 |
| HM22, HM23 Whole-rock | 52.00 | 2.57 | 12.85 | 12.99 | 0.22 | 9.90 | 5.56 | 2.93 | 0.51 | 0.32 |
| 1934 G34 Whole-rock | 49.34 | 3.10 | 14.23 | 13.96 | 0.23 | 9.95 | 4.84 | 3.32 | 0.48 | 0.39 |
| Svíahnúkur caldera rim hyaloclastite | 50.65 | 1.96 | 15.31 | 11.40 | 0.16 | 11.34 | 6.73 | 1.50 | 0.43 | 0.39 |
The potential chemical pollution of the fallout ash was tested by leaching a batch of ash with 6.7 times its mass of de-ionized water. The pH of the leachate was 5.12; the water-soluble components were as follows (mg leachate / kg ash): SiO2, 7.2; Na, 315.3; K, 32.7; SO4, 557.8; F, 346.5; Cl, 366.2.
References. Grönvold, K., and Jóhannesson, H., 1984, Eruption in Grímsvötn 1983, course of events and chemical studies of the tephra: Jökull, 34:1-11.
Gudmunsson, M., Sigmundsson, F., and Björnsson, H., 1997, Ice-volcano interaction of the 1996 Gjálp subglacial eruption, Vatnajökull, Iceland: Nature, v. 389, p. 954-957.
Information Contacts: Karl Grönvold and Freysteinn Sigmundsson, Nordic Volcanological Institute (NVI), Grensásvegur 50, 108 Reykjavík, Iceland (URL: http://nordvulk.hi.is/); Pall Einarsson, Science Institute, University of Iceland; Icelandic Meteorological Office, Reykjavík, Iceland (URL: http://en.vedur.is/).
Subglacial eruption penetrates ice cover and sends ash far as Finland
According to scientists from the Institute of Earth Sciences at the University of Iceland and the Icelandic Meteorological Office, an eruption began at the subglacial Grímsvötn volcano in the Vatnajökull ice cap, Iceland, on 1 November 2004 around 2100, and was declining by 5 November. The eruption, preceded by both long- and short-term precursors, was triggered by the release of overburden pressure associated with a glacial-outburst flood (jökulhlaup) originating from the subglacial caldera lake. The jökulhlaup reached a maximum on the afternoon of 2 November. At that time the peak discharge from affected rivers on the coastal plain at Skeidararsandur was 3,000-4,000 m3/s (based on information from the Icelandic Hydrological Service). Discharge declined quickly after the peak. No damage occurred to roads or bridges. The total volume of the jökulhlaup was ~ 0.5 km3.
Seismicity increased at the volcano in mid-2003, about the same time that uplift exceeded a maximum reached in 1998. Tthe last eruption at Grímsvötn occurred within the caldera beginning on 18 December 1998.... Additional uplift and expansion of the volcano since mid-2003 heralded the latest activity. Seismicity further increased in late October 2004, and on 26 October high-frequency tremor indicated increased water flow from the caldera lake and suggested that a glacial outburst flood was about to begin. On 29 October, the amount of discharge increased in the Skeidara River. About 3 hours before the eruption an intense swarm of volcanic earthquakes started, changing to continuous low-frequency tremor at the onset of the eruption.
The release in overburden pressure associated with the outburst flood triggered the eruption. The amount of drop in water level in the caldera at the onset of the eruption was uncertain, but was probably on the order of 10-20 m, corresponding to a pressure change of 0.1-0.2 MPa at the volcano's surface. This modest pressure change triggered the eruption because pressure in the shallow magma chamber was high after continuous inflow of magma since 1998.
Figure 5 shows the epicenters from 18 October to 1 November 2004, along with preliminary locations of the eruption site. In the early morning of 1 November, an earthquake swarm began beneath Grímsvötn. By 1400 there were 12 earthquakes; at 0651 the largest, an event of M 3 occurred. At 2010 on 1 November an eruption warning was sent to the Civil Defense, earthquake magnitudes had increased and around that time the swarm intensified. About 160 earthquakes with magnitudes up to 2.8 were recorded during the next 2 hours.
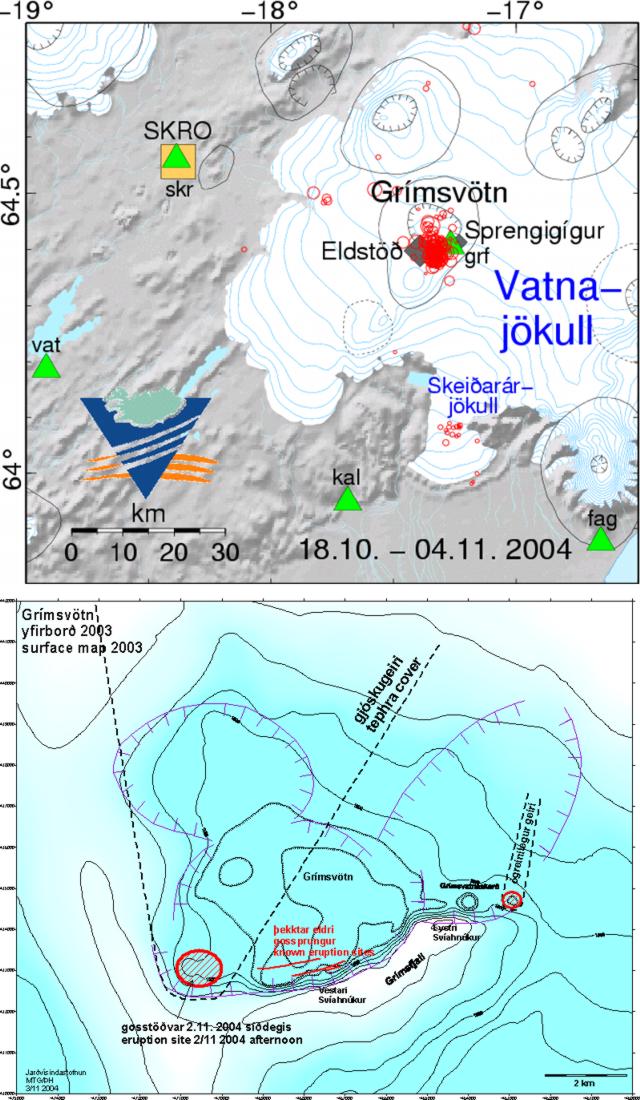 |
Figure 5. A map of the Grímsvötn area (top) showing epicenters registered from 18 October to 1 November 2004 (circles) and approximate locations of vents through the glacier (two diamonds), which lie just inside the caldera's SE margin. Seismic stations are denoted by triangles, and a continuous GPS (Global Positioning System) station by a square. A larger-scale map (bottom, base map by Magnús Tumi Gudmundsson) provides a closer look at the 2004 eruption site, locating the two ice cauldrons and cracks, as well as the margins of the ash dispersal patterns. Contours reflect 2003 ice-surface contours. A separate set of boldly hachured lines indicates the lobate form of the subglacial caldera's topographic margins. Courtesy of the Icelandic Meteorological Office. |
Initially under ice 150-200 m thick, the eruption melted its way through to the surface in about 1 hour. An eruption plume was detected by radar around midnight on 1 November. Radar estimates of plume altitude stood at 12-13 km numerous times during 2-3 November. A plot of altitude versus time showed two cases where plume heights were almost 13 km; each occurred about 0200 on 2 and 3 November. The weather radar used to make the plot was located at Keflavik-Airport, 260 km from Grímsvötn.
Lightning. Early on 2 November and through most of the morning on 3 November, numerous lightning strikes were detected by instruments, and their computed locations largely centered over Grímsvötn. The ash plume was driven to the N by southerly winds during the whole eruption. Accordingly, both the scatter and SE extension of the lightning were judged likely artifacts of imprecision in estimates of lighning locations (figure 6).
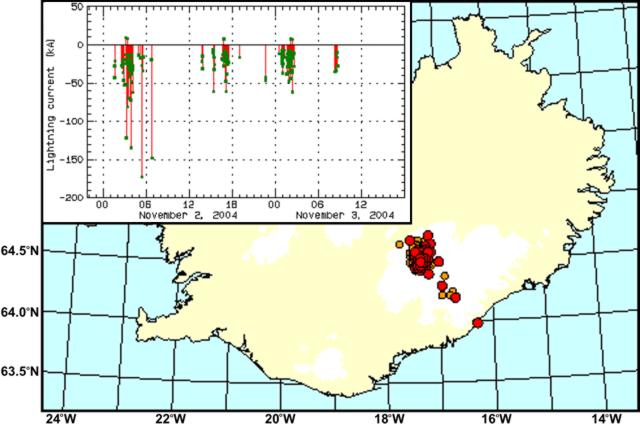 |
Figure 6. Map view of lightning in Iceland located by the UK Met Office's ATD sferics system during the first 36 hours of the Grímsvötn eruption (posted on the website of the Icelandic Meteorological Office). The inset graph shows a time-series of lightning strikes and their currents in kA (thousands of amps) recorded in conjunction with the Grímsvötn eruption during 2-3 November 2004. The plot was produced with data from the Syxri-Neslönd station, an LLP lightning direction-finder. |
Regarding the lightning data, geophysicist Pordur Arason described the three systems used. First, the Icelandic lightning location system consists of three LLP direction finder stations, each measuring time, direction, polarity, intensity and multiplicity. The stations discriminate lightning and record only cloud-to-ground (CG) lightning. The location system is old (produced pre-1980) and unfortunately only one station (Sydri-Neslond) gave useful measurements. By assuming distance from the station to Grímsvötn, Arason calculated the current in the lightning. He noted that almost all of this CG lightning showed negative polarity (lightning polarity is determined by the charge of the cloud compared to Earth).
A second lightning system results from cooperation with the UK Met Office, and one of their ATD sferics stations in Iceland. Arason had access to their data. The locations on figure 2 are those of the ATD system, which gives times and locations but does not discriminate between cloud-to-ground (CG) lightning and cloud-to-cloud (CC) lightning, although it is biased towards CG, since its antennas only measure vertical electric-field variations.
The third system was a one-station recording system of vertical electric field variations (EFMS) in Reykjavik that records the vertical component of the electric field every 200 ns for a period of a 1 ms. During the eruption it recorded the waveforms of about 150 lightning events. About half of these show characteristics of a negative polarity CG and half CC.
Magma-water interactions lead to explosions, emission of ash and steam, and to charge separation. Erupted ash becomes negatively charged and the steam positively charged. Almost all of the CG lightning had negative polarity, indicating its origin in the ash, and not the steam.
Other observations. The initial inspection of the eruption from an airplane took place around 0800 UTC on 2 November. It confirmed that a phreatomagmatic eruption was in progress from a short (less than 1-km-long) eruptive fissure at 64.40°N, 17.23°W. At that time a continuous plume rose to ~ 9 km altitude. Observations throughout the day revealed periods of high explosive activity, with maximum plume heights of 12-14 km. The strength of the eruption correlated with the seismically recorded volcanic tremor. Some explosive activity had occurred in a second ice cauldron near the SE edge of Grímsvötn, 8 km to the E of the main crater. This ice cauldron issued steam when first detected after noon on 2 November.
The London VAAC reported that the ash plume produced from the eruption reached a height of ~ 12.2 km a.s.l. According to news articles, the eruption occurred in an unpopulated region so no evacuations were needed, but air traffic was diverted away from the region.
Observation flights later on 2 November photographed and videoed the vent that had opened through in the ice (figures 7-9). Plumes were sometimes nearly white and steam dominated, at other times black and ash dominated, and in some cases visible portions of the plumes simultaneously reflected both of these extremes (figure 7, 8, and 9). A 2 November view of the jökulhlaup appears as figure 10.
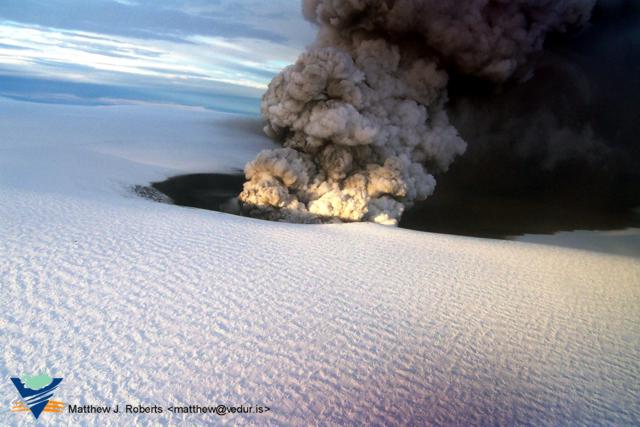 |
Figure 7. A view looking NW at the Grímsvötn eruption across an expanse of the Vatnajökull glacier. This photo was taken between 1530 and 1615 on 2 November 2004. Courtesy of the Icelandic Meteorological Office; photo credit, Matthew J. Roberts. |
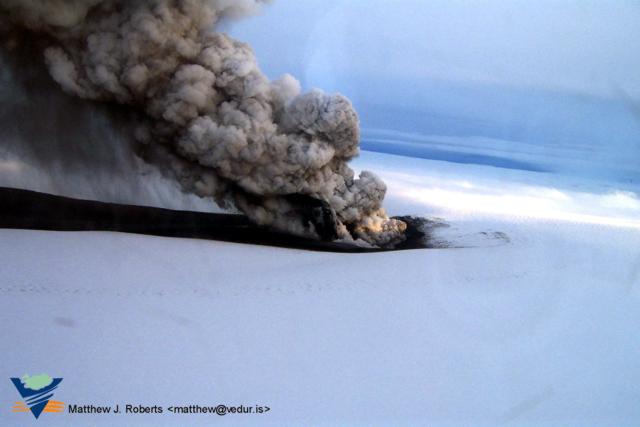 |
Figure 8. An E-looking aerial photograph showing ash falling from the Grímsvötn eruption plume, which at the time was far from vertical. The shot was taken between 1530 and 1615 on 2 November 2004. Courtesy of the Icelandic Meteorological Office; photo credit, Matthew J. Roberts. |
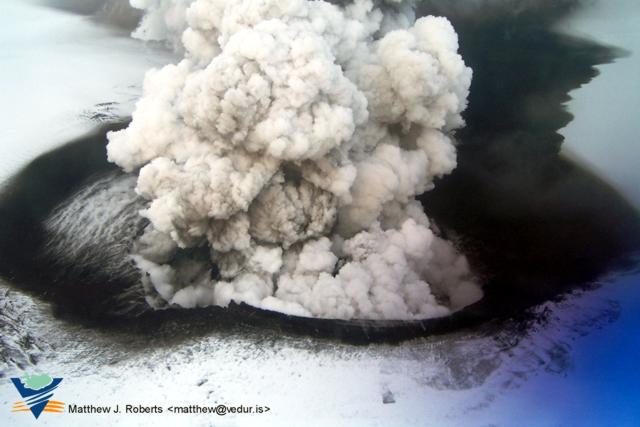 |
Figure 9. Close-up aerial view of the Grímsvötn eruption, taken from the S between 1530 and 1615 on 2 November 2004. Courtesy of the Icelandic Meteorological Office; photo credit, Matthew J. Roberts. |
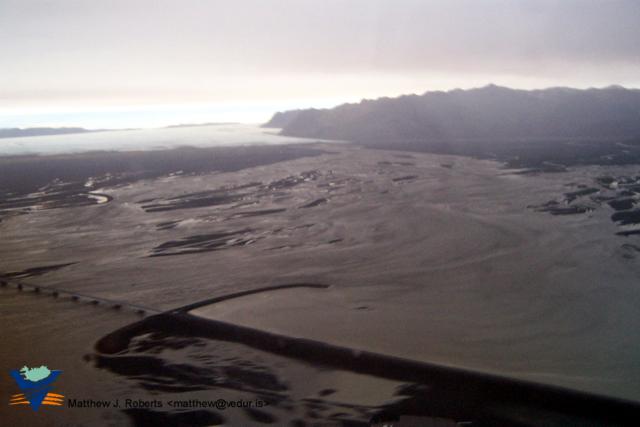 |
Figure 10. An aerial photo of the jökulhlaup from the Grímsvötn eruption, taken at 1630 on 2 November 2004 (at Skeidarar) looking inland towards the glacier (left, mid-background). The swollen, sediment-charged river system has locally inundated the coastal plains and challenged the roadway system engineered to cope with such occurrences. Courtesy of the Icelandic Meteorological Office; photo credit, Matthew J. Roberts. |
On 3 November, eruptive activity occurred in pulses, resulting in changing eruption column heights from 8-9 km to 13-14 km above the volcano. During the course of the eruption, ash plumes and tephra distributions imaged by satellites typically showed trends to the NE; in some cases plumes remained visible at least 150 km from the eruption site. A distal ash plume was observed in Norway, Finland, and Sweden.
On 9 November from 0630 to 1330 a tremor pulse was recorded, and on 11 November, from a little past 0900 and again around 1100, the seismic station at the volcano showed what the Iceland Meteorological Office called "increased jökulhlaup tremor." This tremor decreased after midnight on 12 November, increased from 0500 to 0830, then decreased again. The eruption followed a pattern similar to previous eruptions in 1983 and 1998, with probably less than 0.1 km3 of magma erupted.
According to scientists at the Iceland Meteorological Office and the Institute of Earth Sciences, University of Iceland, these eruptions, together with the 1996 Gjalp eruption N of Grímsvötn reflect much higher activity at Grímsvötn than during the middle part of last century, and may indicate that Grímsvötn is entering into a new period of high volcanism that may last for decades. Such a high activity period had been predicted on the basis of the observed cyclic volcanism in the area in the preceding millennium.
Information Contacts: Freysteinn Sigmundsson, Pall Einarsson, Magnus Tumi Gudmundsson, Thordis Hognadottir, Anette Mortensen, and Fredrik Holm, Institute of Earth Sciences, University of Iceland, Reykjavik, Iceland (URL: http://nordvulk.hi.is/, http://raunvisindastofnun.hi.is/); Steinunn Jakobsdottir, Matthew J. Roberts, Kristin Vogfjord, Ragnar Stefansson, and Pordur Arason, Icelandic Meteorological Office, Reykjavik, Iceland (URL: http://www.vedur.is/); London Volcanic Ash Advisory Center, Met Office, FitzRoy Road, Exeter, Devon EX1 3PB, United Kingdom (URL: http://www.metoffice.com/).
Eruption of 21-28 May 2011; ash plumes affect parts of Europe's air space
Grímsvötn, a subglacial volcano, is located 140 km NE of Eyjafjallajökull volcano (figure 11), within the western region of Vatnajökull glacier, Europe's largest glacier. On 21 May 2011, Grímsvötn erupted and produced ash plumes that drifted toward western Norway, Denmark, and other parts of northern Europe and disrupted flights. This was Grímsvötn's first eruption since 2004, when it sent ash as far as Finland (BGVN 29:10). The eruption continued during 21-28 May 2011.
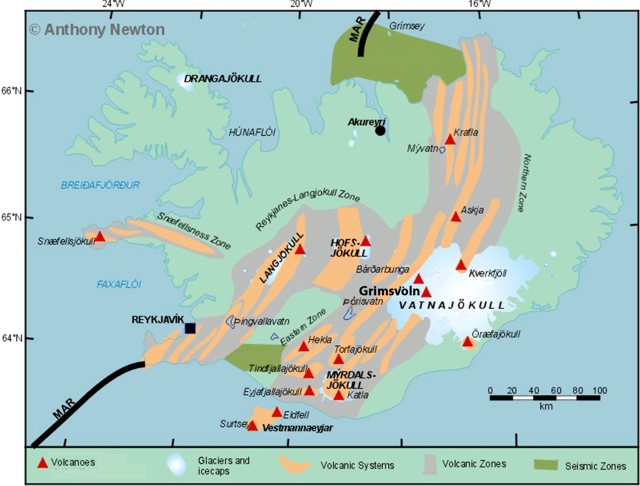 |
Figure 11. A sketch map of Iceland showing geological features including the location of Grímsvötn, Vatnajökull glacier, Eyjafjallajökull, the Mid-Atlantic Ridge [MAR], and selected volcanic, seismic, and cultural features such as Keflavík airport [K. Airport]. The ring road referred to in text follows the SE coast. Revised from a copyrighted map by Anthony Newton. |
According to scientists from the Institute of Earth Sciences at the University of Iceland (IES) and the Icelandic Meteorological Office (IMO), a GPS-station on the rim of the Grímsvötn caldera recorded continuous inflation of several centimeters per year since the 2004 eruption, interpreted as inflow of magma to a shallow chamber. Other precursors over the previous few months included increased seismicity, bursts of tremor, and increased geothermal activity. The eruption was preceded by about an hour of tremor.
The eruption began during the late afternoon of 21 May 2011. According to IMO, the plume was monitored by two weather radars, one located at Keflavík International Airport more than 220 km from the volcano, and a mobile radar ~80 km from the volcano. B early evening on the 21st, the eruption plume rose to over 20 km in altitude. The plume altitude fell to 15 km during the night, although several times it reached 20 km. Ash from the lower part of the eruption plume drifted S and, at higher altitudes, drifted E. A few hours after the eruption began, ashfall covered an area S of the Vatnajökull ice cap, more than 50 km from the eruption site.
According to the Iceland Review, the State Road Authority closed the ring road in the area of the Skeidarársandur flood plain (located S of Grímsvötn) on 21 May. The road remained closed through 24 May due to the threat of eruption-triggered outwash along Iceland's SE coast. The ring road (Iceland Highway 1) follows the Iceland coastline, providing a connection for major towns.
During the morning of 22 May, the plume rose to an altitude of 10-15 km. The plume was brown-to-grayish, changing at times to black near the source. Most of the ash drifted S, but lower parts traveled SW affecting nearby farmers and their livestock (figure 12). Tephra fall was concentrated to the S and to a lesser extent N and E. Earthquake data as well as limited observations recorded during an initial overflight placed the vent location in the SW part Grímsvötn's caldera, the same site as the 2004 eruption (BGVN 29:10).
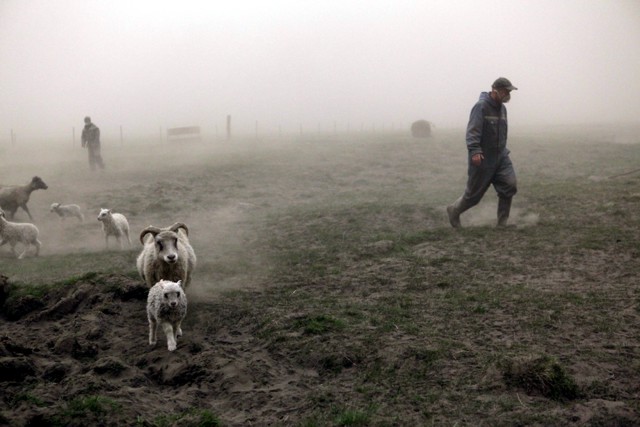 |
Figure 12. Farmers bringing livestock to shelter as ash continued to fall during the eight-day eruption (21-28 May). This photo was taken ~150 km SW of Grímsvötn in the village of Mulakot on 22 May 2011. Local residents wore ash masks for protection and ash smothered buildings and vehicles. Courtesy of The Big Picture, by Vilhelm Gunnarsson, AFP/Getty Images. |
A set of photographs taken in the morning on 22 May by Ragnar Th. Sigurdsson shows the plume's N side with a well-defined E boundary and diffusion beginning high up on the W (figure 13). In an interview for Time: LightBox Sigurdsson explained: "When you have an eruption so big, you [get] a mushroom cloud like a nuclear bomb. The photos I shot are at the bottom of the mushroom—30 km wide and 15 km high. It was huge." Sigurdsson used wide-angle and telephoto lenses for this aerial photography and had to perch in the doorway of the plane to take these photos (Wallace, 2011).
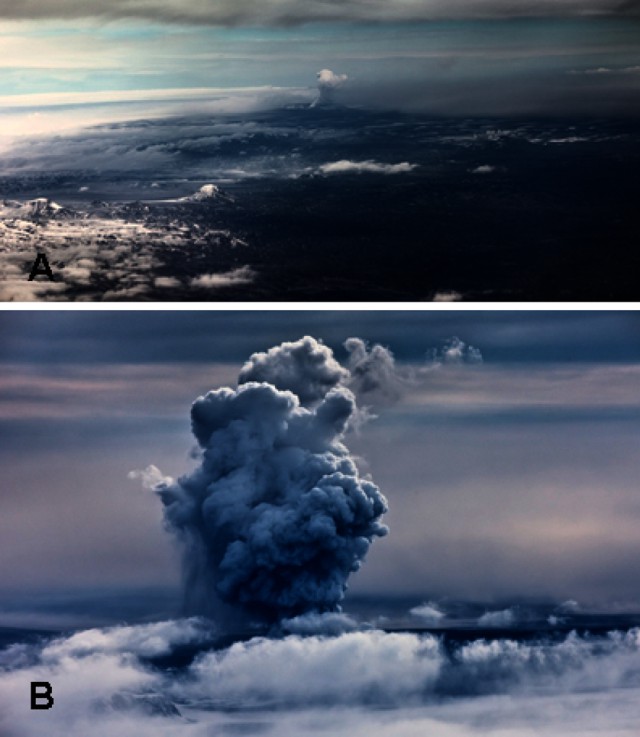 |
Figure 13. (A) Photo of the Grímsvötn eruption plume taken in the morning of 22 May 2011 at an altitude of 4.6 km from a twin engine Cessna aircraft. The compact, white, vertical plume is seen on the horizon. The plane was flying W and the image was shot pointing S through the door opening ~37 km from the volcano. (B) A close-up view of the plume the same morning showing more structural detail, including ash (or precipitation or both) at lower left and the diminishing of the plume's white condensate near the top right. Courtesy of Time: LightBox, by Ragnar Th. Sigurdsson (Arctic-Images.com). |
On 22 May 2011, in the afternoon, lightning strikes ranged from 60-70 per hour (up to 300 during one hour) and were most frequent in portions of the ash plume dispersed S of the vent (figure 14). News sources noted that the Keflavík airport closed. Ash fell to the vent's SW, including the Reykjavík area and to the vent's N on the Tröllaskagi Peninsula.
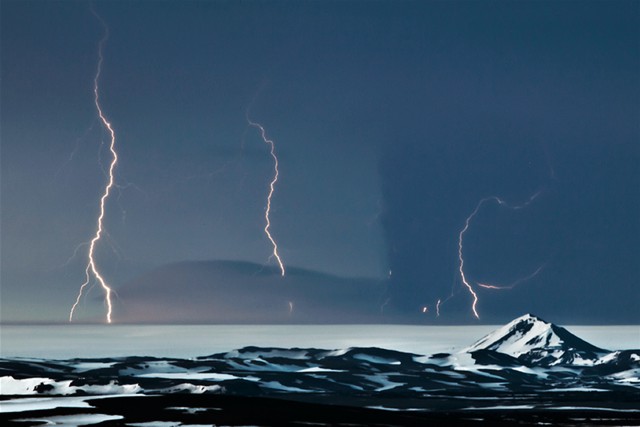 |
Figure 14. Grímsvötn lightning strikes photographed on 22 May 2011. The right-most lightning strike's path to ground traces through dark ashfall, while the two bolts on the left pass through a considerable zone of comparatively clear air. Photo by Gunnar Gestur. |
During 22-23 May, the ash plume rose to an altitude of 5-10 km and drifted S at lower altitudes, and W at altitudes 8 km and higher. Ashfall was detected in several areas throughout Iceland, except in some areas to the NW. On 24 May the ash plume was estimated to be mostly below 5 km because meteorological clouds over the glacier were at 5-7 km altitude and the plume only briefly rose above the cloud deck. Satellite images showed the plume extending more than 800 km from the eruption site towards the S and SE.
Sigurdur Stefnisson, traveling by road on 23 May, took a picture of his car's air filter which had clogged with dark ash after only six hours of use (figure 15). He noted that "A stock of new air filters is a must during an eruption. You can always shake them out every few miles."
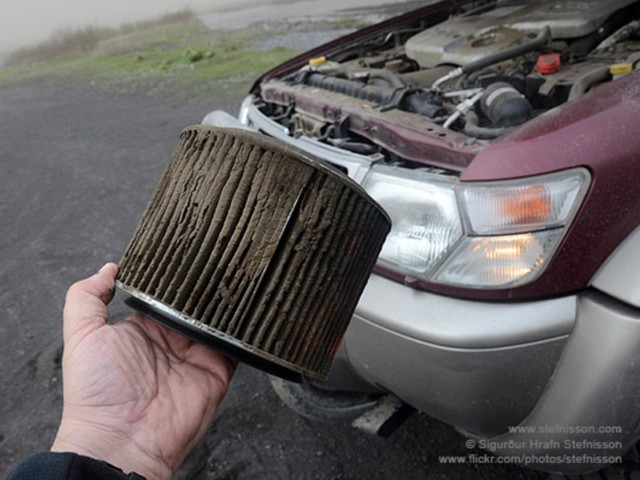 |
Figure 15. A car's engine air filter heavily clogged after six hours of driving during ashfall on 23 May 2011 from Grímsvötn. This photo vividly illustrates a common problem when confronting eruptions with widespread ashfall (Lockwood and Hazlett, 2010). Courtesy of Sigurdur Stefnisson. |
According to the IES and IMO, during the evening of 24 May, explosive activity occurred in Grímsvötn's main crater. (Eruptions along fissures outside of the main crater occurred during the last 200 years in ~7 out of the 20 recorded eruptions (Óladóttir and others, 2011).) Venting came from four tephra cones surrounded by meltwater. Regular bursts of ash plumes rose a few kilometers above the cones, producing only local fallout. Seismic tremor decreased.
Aviation issues. The London Volcanic Ash Advisory Centre (VAAC; also known as the Met Office) issued an ash plume advisory on 24 May, updated 26 May, that identified the location of heavy atmospheric ash and warned pilots to plan accordingly.
The graphic associated with that advisory appears as figure 16, presented here as a representative sample of the modeled ash plume at that time. According an Associated Press on 26 May, the European air traffic agency Eurocontrol, about 900 flights out of a total of 90,000 planned flights in Europe were cancelled between 23-25 May. The Associated Press also reported on 23 May that the extensive ash hazard forced U.S. President Barack Obama to shorten a visit to Ireland. The eruption forced cancellations of flights in Scotland, northern England, Germany and parts of Scandinavia. Iceland's main international airport at Keflavík closed for 36 hours.
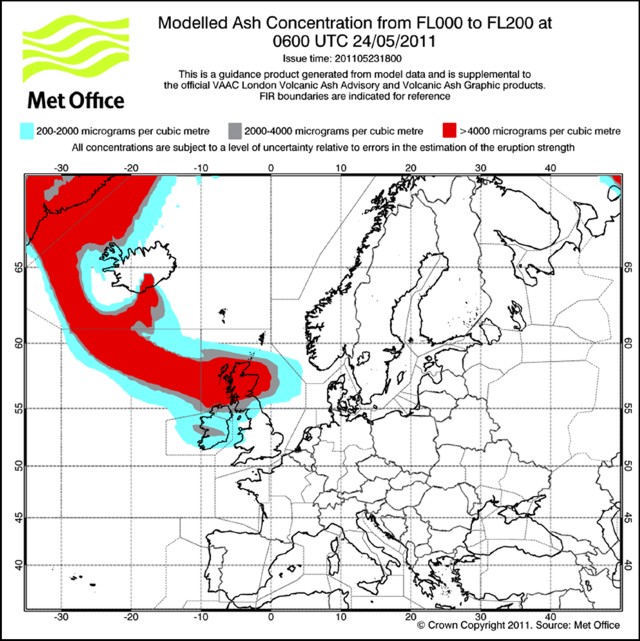 |
Figure 16. On 24 May 2011 the London Volcanic Ash Advisory Centre (VAAC) released this map of modeled ash concentrations for 0600 UTC. Concentrations are reported from 200 to over 4,000 micrograms per cubic meter (IFALPA, 2011). |
Since the costly disruptions in air traffic during the 2010 eruption at Eyjafjallajökull, aviation regulatory authorities took steps to assess current methods of volcanic ash detection, dispersion models, and air traffic management. According to the Executive Summary of Zehner (2010), the impact of the new guidelines for aviation introduced in Europe shifted from "zero tolerance to new ash threshold values [2 mg/m3 concentrations]"; this shift was the center of previous discussions in numerous scientific conferences and workshops worldwide. A sampling of those meetings was summarized in the BGVN 36:04 Eyjafjallajökull report.
During the 2011 Grímsvötn eruption, the London VAAC presented graphics with ash concentrations. (Prior to 21 April 2010, VAACs were not required to report this information (Zehner, 2010)). Within the London VAAC region, no-fly-zones were determined by atmospheric ash concentrations of 2 mg/m3 or greater. The International Volcanic Ash Task Force (IVATF), convened by the International Civil Aviation Organization (ICAO) in 2010, held a workshop in July 2011 to discuss the regulations regarding ash concentrations, but application of a single threshold value for all nine VAAC jurisdictions remained in review.
"The imposition of a limit implies that the dispersion model is capable of providing a contour showing ash concentrations and in particular that a level of 2 mg/m3 can be delineated. In order to be able to do this, accurate information on the volcanic source (e.g. the mass flux, vertical distribution of mass, the column height and the particle size distribution) is needed. Generally this kind of information is not readily available even at the most advanced and well-instrumented volcano observatories (Zehner, 2010)."
Later observations (25-30 May 2011). On 25 May IMO field investigators visited Grímsvötn and found ash plumes had ceased although steam bursts continued from the crater (figure 17). In addition, tremor was greatly reduced, and ground deformation was minor. Observers noted ash thicknesses varying from 10 to 130 cm in the vicinity of the eruption site (figure 18). Pilots reported widespread airborne ash 5-7 km W of the volcano and also some ash haze below 3 km altitude to the SW.
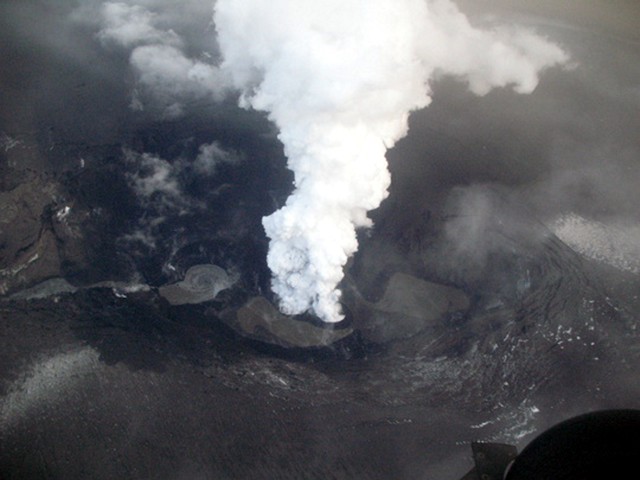 |
Figure 17. White plumes drifted S from Grímsvötn's two small vents (center of photo). Tephra encircles the vents and three pools of water were visible within the fissure on 25 May 2011. Courtesy of IMO. |
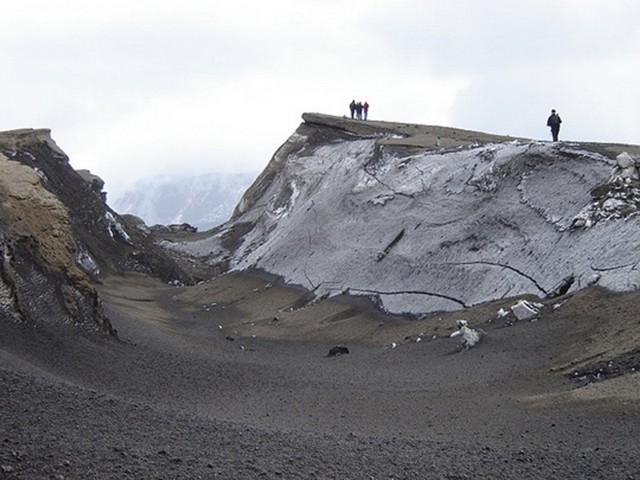 |
Figure 18. Photo taken 25 May 2011 just W and S of Grímsvötn's eruptive site, at a location where the ice was completely tephra covered. Note ash-covered ice on the steep slope below standing figures. Courtesy of Vilhjálmur Kjartansson, IMO. |
On 26 May minor steam explosions continued from the crater. According to news articles, air traffic disruption decreased in parts of Norway and Sweden. In the IESIMO 26 May collective status report, IMO reported that long-term conductivity measurements of the Gígjukvísl river suggested that meltwater was draining freely from Grímsvötn. Monitoring had been continuous since a jökulhlaup (a catastrophic glacier-outburst flood) occurred 31 October 2010. Located 50 km upstream from the glacial edge, Grímsvötn's subglacial lake has overflowed periodically over the past 100 years.
On 28 May tremor rapidly decreased then disappeared, and on 30 May participants on the Iceland Glaciological Society's spring expedition confirmed that the eruption had ended. Satellite imagery and visual observations showed that only small amounts of ice melted during the eruption; no signs of flooding were detected.
References. International Federation of Air Line Pilots' Associations (IFALPA), 2011, Disruption from the eruption of the Grímsvötn volcano: IFALPA Safety Bulletin 12SAB03, 24 May 2011.
Lockwood, J.P., and Hazlett, R.W., 2010, Volcanoes : Global Perspectives: Hoboken, NJ, Wiley-Blackwell, ix, p.539.
Maria, A., Carey, S., Sigurdsson, H., Kincaid, C., and Helgadóttir, G., 2000, Source and dispersal of jökulhlaup sediments discharged to the sea following the 1996 Vatnajökull eruption, GSA Bulletin; v. 112; no. 10; p. 1507–1521.
Óladóttir, B.A., Larsen, G., and Sigmarsson, O., 2011, Holocene volcanic activity at Grímsvötn, Bárdarbunga and Kverkfjöll subglacial centres beneath Vatnajökull, Iceland, Bulletin of Volcanology, 73, 1-22. DOI: 10.1007/s00445-011-0461-4
Wallace, V., 2011, High Above the Glacier, TIME: LightBox, 26 May 2011 (URL: http://lightbox.time.com/2011/05/26/high-above-the-glacier/#6 ).
Zehner, C., Ed. 2010. Monitoring Volcanic Ash from Space. Proceedings of the ESA-EUMETSAT workshop on the 14 April to 23 May 2010 eruption at the Eyjafjoll volcano, South Iceland. Frascati, Italy, 26-27 May 2010. ESA-Publication STM-280. DOI:10.5270/atmch-10-01
Information Contacts: Icelandic Meteorological Office (URL: http://en.vedur.is/); Institute of Earth Sciences (URL: http://earthice.hi.is/); International Federation of Air Line Pilot's Associations (IFALPA) (URL: http://www.ifalpa.org/); International Civil Aviation Organization (ICAO) (URL: http://www.icao.int/); London Volcanic Ash Advisory Centre (VAAC), Met Office, FitzRoy RoadExeter, Devon, EX1 3PB, UK; Agence France-Presse (AFP) (URL: http://www.afp.com/afpcom/en/); Associated Press (AP) (URL: http://www.ap.org/); Eurocontrol (URL: http://www.eurocontrol.in); Iceland Review (URL: http://icelandreview.com/); National Geographic News (URL: http://news.nationalgeographic.com/); Sigurdur Stefnisson (URL: http://www.flickr.com/photos/); Ragnar Th. Sigurdsson, Arctic-Images.com. (URL: http://www.arctic-images.com/); The Big Picture (URL: http://www.boston.com); The Local (URL: http://www.thelocal.se/33970/20110524).
November-December 2021 jökulhlaup is not followed by Grímsvötn eruption
Grímsvötn is a volcano located under the Vatnajökull glacier in the southeastern quadrant of Iceland (figure 19). Its most recent eruption in 2011 included explosions with multiple 15-20 km altitude ash plumes that produced ashfall tens of kilometers away (BGVN 36:06). Periodic jökulhlaups (glacial outburst floods) from Vatnajökull have been recognized for centuries (Einarsson, 2009), and have occurred regularly since the end of the last ice age when a lake fed by glacial meltwater breaches its dam and drains. The best known jökulhlaups from Vatnajökull occur from three separate places: Grímsvötn volcano, the Skaftá cauldrons, and glacial lake Grænalón. The most dangerous jökulhlaups in Iceland have been associated with subglacial volcanic activity due to the greater volume of meltwater produced (Einarsson, 2009). This report summarizes past eruptions, jökulhlaups, and possible co-occurrences of the two with respect to Grímsvötn, and then describes in more detail events since the last eruption in 2011. Since then, jökulhlaups have been reported on the Skeiðarársandur outwash plain in 2014, 2015, 2016, and most recently during November-December 2021. Information is primarily from the Icelandic Met Office (IMO).
|
Figure 19. Grímsvötn volcano is located under the western half of the Vatnajökull glacier in southeastern Iceland. Jökulhlaups originating from the caldera lake travel 50 km S, emerge from the S tip of the Skeiðarárjökull lobe of the Vatnajökull glacier, enter the Gígjukvísl river, and travel S across the Skeiðarársandur outwash plain. The most recent jökulhlaup from Grímsvötn occurred during November-December 2021. Base map courtesy of Google Earth. |
Jökulhlaups from Grímsvötn have been known since at least the fourteenth century (Þórarinsson, 1939 and 1974, in Einarsson, 2009), but the relationship between eruptions and floods from the subglacial crater lake is not well understood. In 1953, Sigurður Þórarinsson suggested a correlation between jökulhlaups and Grímsvötn eruptions. He proposed that if a large volume of water was stored in the lake, that the pressure release following the sudden removal of water during a flood could facilitate magma movement and trigger an eruption. This type of scenario was proposed to explain coincident eruptions and jökulhlaups in 1922 and 1938. Records preserved since 1922 have indicated a few eruptions that were coincident with jökulhlaups, several eruptions with no evidence of jökulhlaups, and a larger number of jökulhlaups with no prior or subsequent documented eruption (table 2). The only recent confirmed event where a jökulhlaup was followed by an eruption took place in 2004.
Table 2. Jökulhlaups and eruptions at Grímsvötn from 1922-2021. For pre-1972 events, only those with possible co-occurring jökulhlaups and eruptions are listed. For 1972 and later both jökulhlaups and eruptions as reported by GVP or IMO are listed. Sources are listed in the table.
| Date | Eruption | Jökulhlaup | Total Discharge Estimate | Max Flux | Ice Subsidence | Source |
| 29 Sep-23 Oct 1922 | Eruption first observed 29 Sep, last observed 23 Oct | Skeiðará river jökulhlaup begins late Sep | -- | -- | -- | IMO, Þórarinsson (1939), Brandsdottir (1984) |
| May 1938 | Eruption 8 km north formed large ice cauldron, minor tephra | Jökulhlaups occurred at Skeiðará and Sula rivers | -- | -- | -- | BGVN 21:09 (Sep 1996), Gudmundsson and Björnsson (1991), BGVN 23:11 (Nov 1998) |
| 7-21 Jul 1954 | Eruption uncertain, possible steam explosions | Jökulhlaup on the Skeiðará river | -- | -- | -- | Þórarinsson S (1974), IMO |
| 15-30 Mar 1972 | No clear eruption evidence | Grímsvötn jökulhlaup | 3.2 km3 | -- | -- | CSLP 20-72 (Mar 1972), SEAN 07:02 (Feb 1982) |
| Sep 1976 | No eruption | Grímsvötn jökulhlaup | 2.4 km3 | -- | -- | SEAN 07:02 (Feb 1982) |
| 28 Jan-11 Feb 1982 | No eruption | Grímsvötn jökulhlaup | 1.3 km3 | 2,000 m3/s | 50 m | SEAN 07:02 (Feb 1982) |
| 28 May-2 Jun 1983 | Eruption within Grímsvötn caldera | No jökulhlaup | -- | -- | Ice cap melted | SEAN 08:05 (May 1983), BGVN 23:11 (Nov 1998) |
| 30 Sep-13 Oct, 4-7 Nov 1996 | Fissure eruption between Bardarbunga and Grímsvötn (Gjálp) fills Grímsvötn caldera with meltwater 30 Sep-13 Oct | Major flood reported five weeks after eruption started, 4-7 Nov, largest jökulhlaup recorded from Grímsvötn | 3.2 km3 | 5,000 m3/s | Subsidence over fissure 8-9 km long, 2 km wide | BGVN 21:09 (Sep 1996), BGVN 23:11 (Nov 1998), Gudmundsson and others (1997), Björnsson (2002) |
| 18-28 Dec 1998 | Eruption within Grímsvötn caldera | No jökulhlaup | -- | -- | -- | BGVN 23:11 (Nov 1998) |
| 26 Oct-5 Nov 2004 | Earthquake swarm and eruption began on 1 Nov at G. caldera following jökulhlaup, 26 Oct-4 Nov | Jökulhlaup water release began on 26 October, reached Skeiðará R on 29 Oct | 0.5 km3 | 3,000-4,000 m3/s | 10-20 m | BGVN 29:10 (Oct 2004) |
| 31 Oct-3 Nov 2010 | No eruption | Jökulhlaup emerged from glacier on 31 Oct and peaked on 3 Nov. Floodwater went W to river Gígjukvísl instead of into Skeiðará due to landform changes in 2009 | 0.45 km3 | 2,600 m3/s | -- | BGVN 36:06 (Jun 2011), IMO |
| 21-28 May 2011 | Eruption from Grímsvötn crater | No jökulhlaup | -- | -- | -- | BGVN 36:06 (Jun 2011) |
| 22 Nov 2012 | No eruption | Small jökulhlaup from subglacial lake Grímsvötn | 0.2-0.3 km3 | -- | -- | IMO (6 May 2015 report) |
| 27 Mar 2014 | No eruption | Small jökulhlaup from subglacial lake Grímsvötn | 0.2-0.3 km3 | ~1,000 m3/s | -- | SI/USGS Weekly (26 Mar-1 Apr 2014), IMO (6 May 2015 report) |
| 6-9 May 2015 | No eruption | Small jökulhlaup from subglacial lake Grímsvötn | 0.2-0.3 km3 | less than 700 m3/s | -- | SI/USGS Weekly (6-12 May 2015), IMO (6 May 2015 report) |
| 18-23 Aug 2016 | No eruption | Small jökulhlaup from subglacial lake Grímsvötn | 0.1-0.15 km3 | -- | 5 m | IMO |
| 24 Nov-6 Dec 2021 | No eruption | Large Jökulhlaup from subglacial lake Grímsvötn | -- | 2,800 m3/s | 77 m | IMO, SI/USGS Weekly (24-30 Nov 2021) |
Until 2009, jökulhlaups from Grímsvötn had emerged from under the S side of the Vatnajökull glacier on the S and E margins of the Skeiðarárjökull lobe of the glacier, draining into the Skeiðará river (figure 20). The Skeiðará river had previously deposited large amounts of sediment on the eastern part of the Skeiðarársandur plains over the centuries. In addition, the glacier had carved a trench during times of advance. In the summer of 2009, water ceased to enter the channel of the Skeiðará; the retreat of the glacier over the previous 15 years led to a shift in the direction of meltwater flow. Beginning in 2010, floodwater that emerged from beneath the eastern part of the Skeiðarárjökull glacier went westwards along the margin and then entered the Gígjukvísl river (figure 21).
|
Figure 20. Jökulhlaups from Grímsvötn currently emerge from the S margin of the Skeiðarárjökull lobe of Vatnajökull glacier and drain into the Gígjukvísl River. Until 2009 they drained into the Skeiðará river. Courtesy of IMO. |
|
Figure 21. Floodwater flows along the terminus of Skeiðarárjökull glacier on 3 November 2010. IMO scientists are measuring water flow and chemistry from the glacier edge (left). The flow traveled west along the margin of the lobe into the Gígjukvísl river (right). Photos taken during scientific flight with the Icelandic Coast Guard (TF-SIF) by Matthew J. Roberts and Egill Axelsson, courtesy of Icelandic Met Office. |
Two subglacial geothermal areas 10-15 km NW of Grímsvötn cause surface depressions to form due to melting of the glacier at its base; they are known as the Eastern and Western Skaftá cauldrons (figure 22), named for the river where the floods discharge. The eastern cauldron is a little less than 3 km in diameter while the western one is about 2 km in diameter. The lows in the glacier surface lead to local minima in the fluid potential at the base of the glacier and therefore lakes are formed under both cauldrons, sealed by the ice overburden pressure at the rim (Björnsson, 2002). For the western cauldron, analyses suggest that the water formed by geothermal melting of ice is the largest (71%) component of inflow to the lake, followed by geothermal fluid (19%) and surface meltwater (10%). Jökulhlaups from underneath the Skaftá cauldrons occur almost every year and 45 jökulhlaups were recorded in the Skaftá river between 1955 and 2009 (Einarsson, 2009). Although the Skaftá cauldrons are located less than 20 km from Grímsvötn, the rivers where their respective jökulhlaups occur are located about 100 km apart; the Skaftá river is off the SW edge of the Vatnajökull glacier, while the Grímsvötn jökulhlaups have only been observed on the Skeidarársandur outwash plain located 50 km S of the volcano. There has not been any coincidence of activity recorded between these areas.
|
Figure 22. The Eastern and Western Skaftá cauldrons discharge water as jökulhlaups almost yearly; the water travels 40 km subglacially and emerges at the SW edge of the Vatnajökull glacier into the Skaftá river. There is no documented connection with Grímsvötn caldera and its associated jökulhlaups which discharge 50 km S of the volcano at the S edge of the Skeiðarárjökull lobe of the Vatnajökull glacier (bottom right of figure) into the Gígjukvísl river. Until 2009 Grímsvötn jökulhlaups drained into the Skeiðará river located farther E. Figure from Einarsson (2009). |
Jökulhlaups and eruptions during 1922-2011. A Skeiðará river jökulhlaup began in late September 1922 and an eruption at Grímsvötn was first reported on 29 September and last observed on 23 October of that year. There were no reports of jökulhlaups during eruptions in 1933 and 1934. Jökulhlaups that occurred on the Skeiðará and Sula rivers in May 1938 have been associated with an eruption that occurred a few kilometers N of Grímsvötn, though very little eruptive activity above the glacier was recorded. Jökulhlaups from Grímsvötn were reported in June 1939, April and May 1941, September 1945, and February 1948, but there were no confirmed reports of eruptions around those times. A Skeiðará river jökulhlaup during 7-21 July 1954 was attributed to a subglacial eruption, but this is uncertain. Jökulhlaups reported in March 1972 (CSLP 20-72), September 1976, and January-February 1982 (SEAN 07:02) had no accompanying reports of eruptions. The May-June 1983 eruption of Grímsvötn (SEAN 08:05) melted the overlying ice and revealed an oval-shaped lake, 300 m in diameter, initially covered by raft ice. Multiple explosions were observed from the lake; no jökulhlaups were reported in the Skeiðará river.
The 30 September-13 October 1996 Gjálp eruption was located on a N-trending fissure between Bardarbunga and Grímsvötn (BGVN 21:09; Björnsson, 2002) about 8 km NW of Grímsvötn. For five weeks the meltwater generated by the eruption went into the Grímsvötn caldera, raising the lake level to the highest ever recorded (Gudmundsson and others, 1997). By 4 November 1996 the lake had risen to 1,510 m, the level needed to float the ice dam, and ice-quakes marked the onset of drainage. About 10.5 hours later water emerged from the margin of Skeiðarárjökull as a flood wave, in the most rapid jökulhlaup ever recorded from Grímsvötn (Björnsson, 2002).
The December 1998 eruptive vents at Grímsvötn were at the foot of Mt. Grímsfjall, which rises about 300 m above the flat ice shelf over the subglacial lake (BGVN 23:11). No major flood occurred in conjunction with this event; only a small amount of the ice shelf near the eruption site melted.
High-frequency tremor on 26 October 2004 indicated the beginning of a flood from the subglacial caldera lake. An eruption began on 1 November 2004, melting through 150-200 m of ice to the surface in about an hour. Observations on 2 November revealed that the eruption was occurring from a circular vent about 1 km in diameter in the SE part of the crater where a surface ice cauldron had been mapped a year earlier (figure 5, BGVN 29:10). The jökulhlaup from the draining caldera reached a maximum discharge rate of 3,000-4,000 m3/s on the afternoon of 2 November in the affected rivers on the coastal plain. Discharge declined quickly after the peak with no damage reported to roads or bridges. The total volume of the jökulhlaup was about 0.5 km3. On 3 November pulses of activity produced ash plumes rising from 8-14 km above the volcano.
On 31 October 2010, a jökulhlaup originating at subglacial lake Grímsvötn emerged from beneath the Skeiðarárjökull glacier, according to IMO. Observations on the bridge over the Gígjukvísl river confirmed a steady water level increase that indicated the onset of a jökulhlaup, with initial discharge rates of about 145 m3/s. Flow reached a maximum of 2,600 m3/s on the Gígja river on 3 November before declining. Seismicity recorded during the event was all attributed to the jökulhlaup, and no evidence was detected either seismically or visually of an eruption (figure 23).
|
Figure 23. An aerial view of the eastern edge of Mt. Grímsfjall on 3 November 2010 revealed fresh crevasses at its base in the ice-cover over the adjacent subglacial lake Grímsvötn. The elongated trench in the ice gives an indication of the lake surface and the extent of the subsidence after the jökulhlaup. Water presumably drained from this region around the eastern edge of Grímsfjall. Photo taken during scientific flight with the Icelandic Coast Guard (TF-SIF) by Matthew J. Roberts and Egill Axelsson, courtesy of Icelandic Met Office (IMO). |
An eruption from Grímsvötn began on 21 May 2011 following about an hour of tremor (BGVN 36:06). Ash plumes from the eruption rose to 15-20 km altitude, disrupted airline traffic, and drifted toward northern Europe. Ashfall was reported from the Reykjavík area in the SW to Tröllaskagi Peninsula in the N. Explosions lasted for approximately a week; on 28 May tremor rapidly decreased then disappeared. No changes in the water levels were recorded in either the Gígja (Gígjukvísl) or Núpsvötn rivers. IMO noted that the eruption occurred from the same site in the SW part of the Grímsvötn caldera as the 2004 eruption, and ice-melt was not expected to be great. Visual observation on 26 May indicated that little ice had melted during the eruption, and no jökulhlaup occurred.
Jökulhlaups during 2012-2021. The water level rose slightly in the Gígjukvísl river on 22 November 2012 and was attributed by IMO to a small flood releasing from Grímsvötn's subglacial lake; no eruption was reported. Another small jökulhlaup with a maximum discharge rate of about 1,000 m3/s was reported on 27 March 2014, causing a rise in the water level in the Gígjukvísl River (figure 24). Electrical conductivity measurements indicated a considerable increase of a geothermal contribution to the river water, confirming its source at Grímsvötn's subglacial lake. Seismic tremor had increased due to the flood and not volcanic activity.
|
Figure 24. Water at the Skeiðará river outlet at the Skeiðarárjökull ice margin on 27 March 2014 indicated a small jökulhlaup from Grímsvötn's subglacial lake. The photo is taken at the E margin of Skeiðarárjökull and the mountains in the background are Krossgilstindur (near) and Færnes (distant). Photo copyright by Njáll Fannar Reynisson, courtesy of IMO. |
A small jökulhlaup from Grímsvötn's subglacial lake occurred on 6 May 2015, increasing the water level in the Gígjukvísl River. Electrical conductivity measurements indicated a considerable increase of a geothermal contribution to the river water. Based on information from the Institute of Earth Sciences, the water available for drainage was estimated at 0.2-0.3 km3, similar to floods in November 2012 and March 2014. Seismic tremor had increased due to the flood and not volcanic activity, and no eruption was reported. The IMO reported another small jökulhlaup originating from Grímsvötn in the Gígjukvísl river on the Skeiðarársandur outwash plain on 23 August 2016. Seismicity had been first observed at Mt. Grímsfjall on 19 August and lasted for about 24 hours (figure 25). On 22 August, data indicated that the ice shelf over the subglacial lake had subsided by about 5 m since 18 August. It was estimated that only 0.1-0.15 km3 of water was present in the lake. No eruption occurred.
|
Figure 25. Mt. Grímsfjall was visible from the Grímsvötn's ice shelf during an IMO expedition 5-7 August 2016. The ice shelf subsided by about 5 m during the August 2016 jökulhlaup. The buildings of the Glacier Research Society at Eystri Svíahnúk are visible as two small dots within the snowfield along the top of Grímsfjall. Courtesy of IMO. |
Between previous eruptions of Grímsvötn, deformation data was interpreted by IMO as indicating gradual accumulation of new magma at depth. In early June 2020 IMO scientists measured high levels of SO2 in the SW part of the caldera, close to the 2004 and 2011 eruption sites (figure 26); they interpreted this as magma degassing at a shallow level. In addition, the area where geothermal activity could be detected at the surface had notably increased. Although seismic activity had been increasing for the previous year, it was still below levels reached prior to the eruptions of 2004 and 2011.
|
Figure 26. A specialist from the Icelandic Meteorological Office performed gas measurements at Grímsvötn during the first half of June 2020, as increasing SO2 levels suggested magma degassing. The location of the photo is near the site of the 2011 eruption. Photograph by Melissa Anne Pfeffer, courtesy of IMO. |
Elevation measurements of the ice shelf over Grímsvötn made by IES showed that it rose 10 m during the first half of 2020 to a level it had not exceeded since October 2010. In response to the increased possibility for a flood or an eruption, IMO installed a continuous GPS measurement station on the ice cap in early June 2020. Webcams were also installed at Hamarinn and Skeiðarársandur looking towards Grímsvötn.
In August 2020 IMO added a webcam to Mt. Grímsfjall, overlooking the Grímsvötn ice field above the lake. The GPS devices showed a potential drop in the ice sheet in early August, but the electrical conductivity and water level in the Gígjukvísl river were both normal. IMO discovered that the instruments on the ice shelf had tilted (figure 27) as a result of high rates of melting of the ice sheet from unusually hot weather. The IMO raised the Aviation Color Code to Yellow on 30 September 2020, noting that seismicity had increased over the past month, ice cauldrons had deepened in several places over the caldera signifying increased geothermal activity, surface deformation surpassed the level prior to the 2011 eruption, and magmatic gases were present in emissions over the summer. Additionally, water levels in the subglacial lake were comparable to levels prior to floods in 2004 and 2010.
|
Figure 27. IMO scientists repaired tilted GPS monitoring equipment on the Grímsvötn ice sheet over the subglacial lake in mid-August 2020 after unusually hot weather increased the melting rate at the surface and disrupted the equipment. The GPS meter is on the left, and on the right is a wind turbine that powers the measuring device (right). Photograph by Björn Ólafsson, courtesy of IMO. |
On 24 November 2021 IMO reported that the ice sheet over Grímsvötn's caldera had subsided 60 cm in the previous few days and the rate of subsidence had accelerated during the previous 24 hours. These measurements indicated that it was likely that water had started to leave the lake. The flow rate in the river on 29 November was measured at 240 m3/s; water levels in the Gígjukvísl drainage rose overnight during 30 November-1 December (figure 28) and by 2 December the flow rate had reached 930 m3/s, ten times the normal seasonal rate. Water from the lake drained from the E side of Skeiðarárjökull lobe and from a channel in the middle of the lobe into the Gígjukvísl River. Daily measurements showed that the flow rate continued to rise; it peaked at about 2,800 m3/s during the morning of 5 December, and then declined rapidly. While the water was draining from Grímsvötn lake, subsidence of the overlying ice sheet continued; by 2 December it had reached 17 m and continued to fall rapidly. The maximum subsidence of 77 m was measured by IMO during 5-6 December.
|
Figure 28. The water level rose substantially in the Gígjukvísl river between 28 November (left) and 1 December 2021 (right) from the jökulhlaup that began on 24 November draining the subglacial lake at Grímsvötn. View is to the S from the IMO webcam. Courtesy of IMO. |
Early on 6 December 2021 two earthquakes, M 2.3 and 3.6 were recorded, followed by several M 1 aftershocks. This resulted in the IMO briefly raising the Aviation Color Code to Orange, based on concerns of a possible relationship between the draining lake and increased eruption probability. With no further significant seismic activity, the alert level was lowered to Yellow the next day. IMO lowered the Aviation Color Code further to Green on 12 January 2022, noting that seismicity had returned to normal levels with a few earthquakes detected over the previous few weeks.
References: Björnsson H, 2002, Subglacial lakes and jökulhlaups in Iceland. Global and Planetary Change, 35: 255-271.
Brandsdottir B, 1984, Seismic activity in Vatnajökull in 1900-1982 with special reference to Skeidararhlaups, Skaftarhlaups and Vatnajökull eruptions. Jokull, 34: 141-150.
Einarsson B, 2009, Jökulhlaups in Skaftá: A study of jökulhlaup from the Western Skaftá cauldron in the Vatnajökull ice cap. Iceland, Icelandic Meteorological Office, VÍ 2009-006, ISSN 1670-8261.
Gudmundsson M T, Bjornsson H, 1991, Eruptions in Grímsvötn, Vatnajökull, Iceland, 1934-1991, Jokull, 41: 21-45.
Gudmundsson M T, Sigmundsson F, Björnsson H, 1997, Ice-volcano interaction of the 1996 Gjálp subglacial eruption, Vatnajökull, Iceland. Nature, 389:6654, 954-957. DOI: 10.1038/40122.
Þórarinsson S, 1939, The ice dammed lakes of Iceland with particular reference to their values as indicators of glacier oscillations. Geografiska Annaler, 21 (3-4), 216-242.
Þórarinsson S, 1953, The crater groups in Iceland. Bulletin of Volcanology, 14: 3-44. https://doi.org/10.1007/BF02596003
Þórarinsson S, 1974. Vötnin stríð. Saga Skeiðarárhlaupa og Grímsvatnagosa. Bókaútgáfa, Menningarsjóðs. Reykjavík. [In Icelandic].
Information Contacts: Icelandic Met Office (IMO), Reykjavík, Iceland (URL: http://en.vedur.is/); Google Earth (URL: https://www.google.com/earth/).
This compilation of synonyms and subsidiary features may not be comprehensive. Features are organized into four major categories: Cones, Craters, Domes, and Thermal Features. Synonyms of features appear indented below the primary name. In some cases additional feature type, elevation, or location details are provided.
Synonyms |
||||
| Sviagigur | ||||
Cones |
||||
| Feature Name | Feature Type | Elevation | Latitude | Longitude |
| Haabunga | Cone | 1700 m | 64° 21' 0" N | 17° 25' 0" W |
Craters |
||||
| Feature Name | Feature Type | Elevation | Latitude | Longitude |
| Bergvatnsarhraun | Crater Row | 64° 10' 0" N | 17° 31' 0" W | |
| Botnahraun | Fissure vent | 40 m | 63° 39' 0" N | 18° 14' 0" W |
| Bunuholar | Fissure vent | |||
| Eldgigur | Fissure vent | 856 m | 64° 10' 0" N | 17° 41' 0" W |
| Fljotsoddahraun | Crater Row | 600 m | 64° 10' 0" N | 18° 6' 0" W |
| Gjalp | Fissure vent | 1551 m | 64° 31' 0" N | 17° 23' 30" W |
| Halsagigir | Fissure vent | 162 m | 63° 44' 0" N | 18° 21' 0" W |
|
Laki
Lakagigar Skaptarjökull Skafta |
Crater Row | 812 m | 64° 4' 0" N | 18° 14' 0" W |
| Lambavatnsgigar | Fissure vent | 660 m | 64° 4' 0" N | 18° 17' 0" W |
| Nupahraun | Fissure vent | |||
| Raudholar | Fissure vent | 780 m | 64° 4' 0" N | 17° 55' 0" W |
| Raudholl | Crater Row | 434 m | 63° 48' 0" N | 18° 19' 0" W |
|
|
||||||||||||||||||||||||
There is data available for 76 confirmed Holocene eruptive periods.
2011 May 21 - 2011 May 25 Confirmed Eruption Max VEI: 4
| Episode 1 | Eruption Episode | SW part of the caldera | |||||||||||||||||||||||||||||||||||||||||||||||||||||||||||||||||||||||||||||||||||||||||||||||||||||||||||||||||||||||||||||||||
|---|---|---|---|---|---|---|---|---|---|---|---|---|---|---|---|---|---|---|---|---|---|---|---|---|---|---|---|---|---|---|---|---|---|---|---|---|---|---|---|---|---|---|---|---|---|---|---|---|---|---|---|---|---|---|---|---|---|---|---|---|---|---|---|---|---|---|---|---|---|---|---|---|---|---|---|---|---|---|---|---|---|---|---|---|---|---|---|---|---|---|---|---|---|---|---|---|---|---|---|---|---|---|---|---|---|---|---|---|---|---|---|---|---|---|---|---|---|---|---|---|---|---|---|---|---|---|---|---|---|---|
| 2011 May 21 - 2011 May 25 | Evidence from Observations: Reported | |||||||||||||||||||||||||||||||||||||||||||||||||||||||||||||||||||||||||||||||||||||||||||||||||||||||||||||||||||||||||||||||||
|
List of 24 Events for Episode 1 at SW part of the caldera
| ||||||||||||||||||||||||||||||||||||||||||||||||||||||||||||||||||||||||||||||||||||||||||||||||||||||||||||||||||||||||||||||||||
2004 Nov 1 - 2004 Nov 4 Confirmed Eruption Max VEI: 3
| Episode 1 | Eruption Episode | SW and east sides of caldera | ||||||||||||||||||||||||||||||||||||||||||||||||||||||||||||||||
|---|---|---|---|---|---|---|---|---|---|---|---|---|---|---|---|---|---|---|---|---|---|---|---|---|---|---|---|---|---|---|---|---|---|---|---|---|---|---|---|---|---|---|---|---|---|---|---|---|---|---|---|---|---|---|---|---|---|---|---|---|---|---|---|---|---|
| 2004 Nov 1 - 2004 Nov 4 | Evidence from Observations: Reported | ||||||||||||||||||||||||||||||||||||||||||||||||||||||||||||||||
|
List of 11 Events for Episode 1 at SW and east sides of caldera
| |||||||||||||||||||||||||||||||||||||||||||||||||||||||||||||||||
1998 Dec 18 - 1998 Dec 28 Confirmed Eruption Max VEI: 3
| Episode 1 | Eruption Episode | South caldera wall | ||||||||||||||||||||||||||||||||||||||||||||
|---|---|---|---|---|---|---|---|---|---|---|---|---|---|---|---|---|---|---|---|---|---|---|---|---|---|---|---|---|---|---|---|---|---|---|---|---|---|---|---|---|---|---|---|---|---|
| 1998 Dec 18 - 1998 Dec 28 | Evidence from Observations: Reported | ||||||||||||||||||||||||||||||||||||||||||||
|
List of 7 Events for Episode 1 at South caldera wall
| |||||||||||||||||||||||||||||||||||||||||||||
1996 Sep 30 - 1996 Nov 6 Confirmed Eruption Max VEI: 3 (?)
| Episode 1 | Eruption Episode | Gjálp (fissure N of caldera rim) | ||||||||||||||||||||||||||||||||||||||||||||||||||||||||||||||||
|---|---|---|---|---|---|---|---|---|---|---|---|---|---|---|---|---|---|---|---|---|---|---|---|---|---|---|---|---|---|---|---|---|---|---|---|---|---|---|---|---|---|---|---|---|---|---|---|---|---|---|---|---|---|---|---|---|---|---|---|---|---|---|---|---|---|
| 1996 Sep 30 - 1996 Nov 6 | Evidence from Observations: Reported | ||||||||||||||||||||||||||||||||||||||||||||||||||||||||||||||||
|
List of 11 Events for Episode 1 at Gjálp (fissure N of caldera rim)
| |||||||||||||||||||||||||||||||||||||||||||||||||||||||||||||||||
[ 1984 Aug 20 (in or before) ] Uncertain Eruption
| Episode 1 | Eruption Episode | ||||||||||||||||||||
|---|---|---|---|---|---|---|---|---|---|---|---|---|---|---|---|---|---|---|---|---|
| 1984 Aug 20 (in or before) - Unknown | Evidence from Unknown | |||||||||||||||||||
|
List of 2 Events for Episode 1
| ||||||||||||||||||||
1983 May 28 - 1983 Jun 2 Confirmed Eruption Max VEI: 2
| Episode 1 | Eruption Episode | Near south caldera wall | |||||||||||||||||||||||||||||||||||||||||||||||||
|---|---|---|---|---|---|---|---|---|---|---|---|---|---|---|---|---|---|---|---|---|---|---|---|---|---|---|---|---|---|---|---|---|---|---|---|---|---|---|---|---|---|---|---|---|---|---|---|---|---|---|
| 1983 May 28 - 1983 Jun 2 | Evidence from Observations: Reported | |||||||||||||||||||||||||||||||||||||||||||||||||
|
List of 8 Events for Episode 1 at Near south caldera wall
| ||||||||||||||||||||||||||||||||||||||||||||||||||
[ 1972 Mar 16 ± 15 days - 1972 Apr 16 ± 15 days ] Uncertain Eruption
| Episode 1 | Eruption Episode | ||||||||||||||||||||
|---|---|---|---|---|---|---|---|---|---|---|---|---|---|---|---|---|---|---|---|---|
| 1972 Mar 16 ± 15 days - 1972 Apr 16 ± 15 days | Evidence from Unknown | |||||||||||||||||||
|
List of 2 Events for Episode 1
| ||||||||||||||||||||
[ 1954 Jul 16 ] Uncertain Eruption
| Episode 1 | Eruption Episode | North and south part of caldera | ||||||||||||||||||||||||
|---|---|---|---|---|---|---|---|---|---|---|---|---|---|---|---|---|---|---|---|---|---|---|---|---|---|
| 1954 Jul 16 - Unknown | Evidence from Unknown | ||||||||||||||||||||||||
|
List of 3 Events for Episode 1 at North and south part of caldera
| |||||||||||||||||||||||||
1954 Jan 15 ± 45 days Confirmed Eruption Max VEI: 1
| Episode 1 | Eruption Episode | |||||||||||||||||||||||||
|---|---|---|---|---|---|---|---|---|---|---|---|---|---|---|---|---|---|---|---|---|---|---|---|---|---|
| 1954 Jan 15 ± 45 days - Unknown | Evidence from Observations: Reported | ||||||||||||||||||||||||
|
List of 3 Events for Episode 1
| |||||||||||||||||||||||||
[ 1948 Feb ] Uncertain Eruption
| Episode 1 | Eruption Episode | ||||||||||||||||||||
|---|---|---|---|---|---|---|---|---|---|---|---|---|---|---|---|---|---|---|---|---|
| 1948 Feb - Unknown | Evidence from Unknown | |||||||||||||||||||
|
List of 2 Events for Episode 1
| ||||||||||||||||||||
[ 1945 Sep 25 (?) ] Uncertain Eruption
| Episode 1 | Eruption Episode | |||||||||||||||||||||||||
|---|---|---|---|---|---|---|---|---|---|---|---|---|---|---|---|---|---|---|---|---|---|---|---|---|---|
| 1945 Sep 25 (?) - Unknown | Evidence from Unknown | ||||||||||||||||||||||||
|
List of 3 Events for Episode 1
| |||||||||||||||||||||||||
[ 1941 Apr - 1941 Aug ] Uncertain Eruption
| Episode 1 | Eruption Episode | ||||||||||||||||||||||||||||||
|---|---|---|---|---|---|---|---|---|---|---|---|---|---|---|---|---|---|---|---|---|---|---|---|---|---|---|---|---|---|---|
| 1941 Apr - 1941 Aug | Evidence from Unknown | |||||||||||||||||||||||||||||
|
List of 4 Events for Episode 1
| ||||||||||||||||||||||||||||||
[ 1939 Jun ] Uncertain Eruption
| Episode 1 | Eruption Episode | ||||||||||||||||||||
|---|---|---|---|---|---|---|---|---|---|---|---|---|---|---|---|---|---|---|---|---|
| 1939 Jun - Unknown | Evidence from Unknown | |||||||||||||||||||
|
List of 2 Events for Episode 1
| ||||||||||||||||||||
1938 May Confirmed Eruption Max VEI: 1
| Episode 1 | Eruption Episode | 8 km N of Svartibunki | ||||||||||||||||||||||||
|---|---|---|---|---|---|---|---|---|---|---|---|---|---|---|---|---|---|---|---|---|---|---|---|---|---|
| 1938 May - Unknown | Evidence from Observations: Reported | ||||||||||||||||||||||||
|
List of 3 Events for Episode 1 at 8 km N of Svartibunki
| |||||||||||||||||||||||||
1934 Dec 21 - 1934 Dec 26 Confirmed Eruption
| Episode 1 | Eruption Episode | Volcano Uncertain: Vatnajökull | ||||||||||||||
|---|---|---|---|---|---|---|---|---|---|---|---|---|---|---|---|
| 1934 Dec 21 - 1934 Dec 26 | Evidence from Unknown | ||||||||||||||
|
List of 1 Events for Episode 1 at Volcano Uncertain: Vatnajökull
| |||||||||||||||
1934 Mar 30 - 1934 Apr 7 Confirmed Eruption Max VEI: 2
| Episode 1 | Eruption Episode | Near south caldera wall | |||||||||||||||||||||||||||||||||||||||
|---|---|---|---|---|---|---|---|---|---|---|---|---|---|---|---|---|---|---|---|---|---|---|---|---|---|---|---|---|---|---|---|---|---|---|---|---|---|---|---|---|
| 1934 Mar 30 - 1934 Apr 7 | Evidence from Observations: Reported | |||||||||||||||||||||||||||||||||||||||
|
List of 6 Events for Episode 1 at Near south caldera wall
| ||||||||||||||||||||||||||||||||||||||||
1933 Nov 29 ± 1 days - 1933 Dec 9 ± 1 days Confirmed Eruption Max VEI: 1
| Episode 1 | Eruption Episode | North of Grímsvötn caldera | ||||||||||||||||||||||||||||||||||
|---|---|---|---|---|---|---|---|---|---|---|---|---|---|---|---|---|---|---|---|---|---|---|---|---|---|---|---|---|---|---|---|---|---|---|---|
| 1933 Nov 29 ± 1 days - 1933 Dec 9 ± 1 days | Evidence from Observations: Reported | ||||||||||||||||||||||||||||||||||
|
List of 5 Events for Episode 1 at North of Grímsvötn caldera
| |||||||||||||||||||||||||||||||||||
1922 Sep 29 - 1922 Oct 23 Confirmed Eruption Max VEI: 2
| Episode 1 | Eruption Episode | ||||||||||||||||||||||||||||||
|---|---|---|---|---|---|---|---|---|---|---|---|---|---|---|---|---|---|---|---|---|---|---|---|---|---|---|---|---|---|---|
| 1922 Sep 29 - 1922 Oct 23 | Evidence from Observations: Reported | |||||||||||||||||||||||||||||
|
List of 4 Events for Episode 1
| ||||||||||||||||||||||||||||||
1919 Confirmed Eruption Max VEI: 2 (?)
| Episode 1 | Eruption Episode | Volcano Uncertain | ||||||||||||||||||||||||
|---|---|---|---|---|---|---|---|---|---|---|---|---|---|---|---|---|---|---|---|---|---|---|---|---|---|
| 1919 - Unknown | Evidence from Unknown | ||||||||||||||||||||||||
|
List of 3 Events for Episode 1 at Volcano Uncertain
| |||||||||||||||||||||||||
1910 Confirmed Eruption
| Episode 1 | Eruption Episode | |||||||||||||||
|---|---|---|---|---|---|---|---|---|---|---|---|---|---|---|---|
| 1910 - Unknown | Evidence from Observations: Reported | ||||||||||||||
|
List of 1 Events for Episode 1
| |||||||||||||||
1897 Confirmed Eruption Max VEI: 2
| Episode 1 | Eruption Episode | Volcano Uncertain | |||||||||||||||||||
|---|---|---|---|---|---|---|---|---|---|---|---|---|---|---|---|---|---|---|---|---|
| 1897 - Unknown | Evidence from Unknown | |||||||||||||||||||
|
List of 2 Events for Episode 1 at Volcano Uncertain
| ||||||||||||||||||||
1891 Nov (?) - 1892 Mar 16 Confirmed Eruption Max VEI: 2
| Episode 1 | Eruption Episode | ||||||||||||||||||||||||||||||
|---|---|---|---|---|---|---|---|---|---|---|---|---|---|---|---|---|---|---|---|---|---|---|---|---|---|---|---|---|---|---|
| 1891 Nov (?) - 1892 Mar 16 | Evidence from Observations: Reported | |||||||||||||||||||||||||||||
|
List of 4 Events for Episode 1
| ||||||||||||||||||||||||||||||
1883 Jan 15 - 1883 Apr 15 ± 5 days Confirmed Eruption Max VEI: 2
| Episode 1 | Eruption Episode | ||||||||||||||||||||||||||||||
|---|---|---|---|---|---|---|---|---|---|---|---|---|---|---|---|---|---|---|---|---|---|---|---|---|---|---|---|---|---|---|
| 1883 Jan 15 - 1883 Apr 15 ± 5 days | Evidence from Observations: Reported | |||||||||||||||||||||||||||||
|
List of 4 Events for Episode 1
| ||||||||||||||||||||||||||||||
1873 Jan 8 - 1873 Aug Confirmed Eruption Max VEI: 4
| Episode 1 | Eruption Episode | |||||||||||||||||||||||||||||||||||
|---|---|---|---|---|---|---|---|---|---|---|---|---|---|---|---|---|---|---|---|---|---|---|---|---|---|---|---|---|---|---|---|---|---|---|---|
| 1873 Jan 8 - 1873 Aug | Evidence from Observations: Reported | ||||||||||||||||||||||||||||||||||
|
List of 5 Events for Episode 1
| |||||||||||||||||||||||||||||||||||
1867 Aug 29 Confirmed Eruption Max VEI: 1
| Episode 1 | Eruption Episode | ||||||||||||||||||||||||||||||
|---|---|---|---|---|---|---|---|---|---|---|---|---|---|---|---|---|---|---|---|---|---|---|---|---|---|---|---|---|---|---|
| 1867 Aug 29 - Unknown | Evidence from Observations: Reported | |||||||||||||||||||||||||||||
|
List of 4 Events for Episode 1
| ||||||||||||||||||||||||||||||
[ 1861 May ] Uncertain Eruption
| Episode 1 | Eruption Episode | ||||||||||||||||||||||||||||||||||||||||
|---|---|---|---|---|---|---|---|---|---|---|---|---|---|---|---|---|---|---|---|---|---|---|---|---|---|---|---|---|---|---|---|---|---|---|---|---|---|---|---|---|
| 1861 May - Unknown | Evidence from Unknown | |||||||||||||||||||||||||||||||||||||||
|
List of 6 Events for Episode 1
| ||||||||||||||||||||||||||||||||||||||||
1854 Confirmed Eruption Max VEI: 2
| Episode 1 | Eruption Episode | |||||||||||||||||||||||||
|---|---|---|---|---|---|---|---|---|---|---|---|---|---|---|---|---|---|---|---|---|---|---|---|---|---|
| 1854 - Unknown | Evidence from Observations: Reported | ||||||||||||||||||||||||
|
List of 3 Events for Episode 1
| |||||||||||||||||||||||||
1838 Jun Confirmed Eruption Max VEI: 2
| Episode 1 | Eruption Episode | ||||||||||||||||||||
|---|---|---|---|---|---|---|---|---|---|---|---|---|---|---|---|---|---|---|---|---|
| 1838 Jun - Unknown | Evidence from Observations: Reported | |||||||||||||||||||
|
List of 2 Events for Episode 1
| ||||||||||||||||||||
1816 May - 1816 Jun (?) Confirmed Eruption Max VEI: 2
| Episode 1 | Eruption Episode | |||||||||||||||||||||||||
|---|---|---|---|---|---|---|---|---|---|---|---|---|---|---|---|---|---|---|---|---|---|---|---|---|---|
| 1816 May - 1816 Jun (?) | Evidence from Observations: Reported | ||||||||||||||||||||||||
|
List of 3 Events for Episode 1
| |||||||||||||||||||||||||
[ 1796 Jun ] Discredited Eruption
[ 1794 Jul 15 ± 45 days ] Uncertain Eruption
| Episode 1 | Eruption Episode | ||||
|---|---|---|---|---|
| 1794 Jul 15 ± 45 days - Unknown | Evidence from Unknown | |||
1783 May (?) - 1785 May 26 (?) Confirmed Eruption Max VEI: 4
| Episode 1 | Eruption Episode | Lakagigar (Skaftar) and Grímsvötn | ||||||||||||||||||||||||||||||||||||||||||||||||||||||||||||||||||||||||||
|---|---|---|---|---|---|---|---|---|---|---|---|---|---|---|---|---|---|---|---|---|---|---|---|---|---|---|---|---|---|---|---|---|---|---|---|---|---|---|---|---|---|---|---|---|---|---|---|---|---|---|---|---|---|---|---|---|---|---|---|---|---|---|---|---|---|---|---|---|---|---|---|---|---|---|---|
| 1783 May (?) - 1785 May 26 (?) | Evidence from Observations: Reported | ||||||||||||||||||||||||||||||||||||||||||||||||||||||||||||||||||||||||||
|
List of 13 Events for Episode 1 at Lakagigar (Skaftar) and Grímsvötn
| |||||||||||||||||||||||||||||||||||||||||||||||||||||||||||||||||||||||||||
1774 Feb Confirmed Eruption Max VEI: 2
| Episode 1 | Eruption Episode | ||||||||||||||||||||||||||||||||||||||||
|---|---|---|---|---|---|---|---|---|---|---|---|---|---|---|---|---|---|---|---|---|---|---|---|---|---|---|---|---|---|---|---|---|---|---|---|---|---|---|---|---|
| 1774 Feb - Unknown | Evidence from Observations: Reported | |||||||||||||||||||||||||||||||||||||||
|
List of 6 Events for Episode 1
| ||||||||||||||||||||||||||||||||||||||||
1768 Confirmed Eruption Max VEI: 2
| Episode 1 | Eruption Episode | Volcano Uncertain: Vatnajökull | ||||||||||||||||||||||||
|---|---|---|---|---|---|---|---|---|---|---|---|---|---|---|---|---|---|---|---|---|---|---|---|---|---|
| 1768 - Unknown | Evidence from Unknown | ||||||||||||||||||||||||
|
List of 3 Events for Episode 1 at Volcano Uncertain: Vatnajökull
| |||||||||||||||||||||||||
1753 Oct 15 ± 45 days Confirmed Eruption Max VEI: 2 (?)
| Episode 1 | Eruption Episode | NE of Palsfjall | ||||||||||||||||||||||||||||||||||
|---|---|---|---|---|---|---|---|---|---|---|---|---|---|---|---|---|---|---|---|---|---|---|---|---|---|---|---|---|---|---|---|---|---|---|---|
| 1753 Oct 15 ± 45 days - Unknown | Evidence from Observations: Reported | ||||||||||||||||||||||||||||||||||
|
List of 5 Events for Episode 1 at NE of Palsfjall
| |||||||||||||||||||||||||||||||||||
1730 Confirmed Eruption
| Episode 1 | Eruption Episode | |||||||||||||||
|---|---|---|---|---|---|---|---|---|---|---|---|---|---|---|---|
| 1730 - Unknown | Evidence from Observations: Reported | ||||||||||||||
|
List of 1 Events for Episode 1
| |||||||||||||||
1725 Feb Confirmed Eruption Max VEI: 2
| Episode 1 | Eruption Episode | ||||||||||||||||||||||||||||||
|---|---|---|---|---|---|---|---|---|---|---|---|---|---|---|---|---|---|---|---|---|---|---|---|---|---|---|---|---|---|---|
| 1725 Feb - Unknown | Evidence from Observations: Reported | |||||||||||||||||||||||||||||
|
List of 4 Events for Episode 1
| ||||||||||||||||||||||||||||||
1716 Oct 6 Confirmed Eruption Max VEI: 2
| Episode 1 | Eruption Episode | ||||||||||||||||||||||||||||||
|---|---|---|---|---|---|---|---|---|---|---|---|---|---|---|---|---|---|---|---|---|---|---|---|---|---|---|---|---|---|---|
| 1716 Oct 6 - Unknown | Evidence from Observations: Reported | |||||||||||||||||||||||||||||
|
List of 4 Events for Episode 1
| ||||||||||||||||||||||||||||||
1706 Oct 15 ± 45 days Confirmed Eruption Max VEI: 2
| Episode 1 | Eruption Episode | ||||||||||||||||||||||||||||||
|---|---|---|---|---|---|---|---|---|---|---|---|---|---|---|---|---|---|---|---|---|---|---|---|---|---|---|---|---|---|---|
| 1706 Oct 15 ± 45 days - Unknown | Evidence from Observations: Reported | |||||||||||||||||||||||||||||
|
List of 4 Events for Episode 1
| ||||||||||||||||||||||||||||||
1697 Confirmed Eruption
| Episode 1 | Eruption Episode | |||||||||||||||
|---|---|---|---|---|---|---|---|---|---|---|---|---|---|---|---|
| 1697 - Unknown | Evidence from Observations: Reported | ||||||||||||||
|
List of 1 Events for Episode 1
| |||||||||||||||
1684 Nov 5 ± 4 days - 1685 Jan Confirmed Eruption Max VEI: 2
| Episode 1 | Eruption Episode | ||||||||||||||||||||||||||||||||||||||||
|---|---|---|---|---|---|---|---|---|---|---|---|---|---|---|---|---|---|---|---|---|---|---|---|---|---|---|---|---|---|---|---|---|---|---|---|---|---|---|---|---|
| 1684 Nov 5 ± 4 days - 1685 Jan | Evidence from Observations: Reported | |||||||||||||||||||||||||||||||||||||||
|
List of 6 Events for Episode 1
| ||||||||||||||||||||||||||||||||||||||||
1681 Apr 10 Confirmed Eruption
| Episode 1 | Eruption Episode | Volcano Uncertain: Vatnajökull | |||
|---|---|---|---|---|
| 1681 Apr 10 - Unknown | Evidence from Observations: Reported | |||
1665 Confirmed Eruption
| Episode 1 | Eruption Episode | |||||||||||||||
|---|---|---|---|---|---|---|---|---|---|---|---|---|---|---|---|
| 1665 - Unknown | Evidence from Observations: Reported | ||||||||||||||
|
List of 1 Events for Episode 1
| |||||||||||||||
1659 Nov Confirmed Eruption Max VEI: 2
| Episode 1 | Eruption Episode | ||||||||||||||||||||||||||||||
|---|---|---|---|---|---|---|---|---|---|---|---|---|---|---|---|---|---|---|---|---|---|---|---|---|---|---|---|---|---|---|
| 1659 Nov - Unknown | Evidence from Observations: Reported | |||||||||||||||||||||||||||||
|
List of 4 Events for Episode 1
| ||||||||||||||||||||||||||||||
1638 Feb 24 ± 4 days Confirmed Eruption Max VEI: 2
| Episode 1 | Eruption Episode | ||||||||||||||||||||||||||||||
|---|---|---|---|---|---|---|---|---|---|---|---|---|---|---|---|---|---|---|---|---|---|---|---|---|---|---|---|---|---|---|
| 1638 Feb 24 ± 4 days - Unknown | Evidence from Observations: Reported | |||||||||||||||||||||||||||||
|
List of 4 Events for Episode 1
| ||||||||||||||||||||||||||||||
1632 (?) Confirmed Eruption
| Episode 1 | Eruption Episode | |||||||||||||||
|---|---|---|---|---|---|---|---|---|---|---|---|---|---|---|---|
| 1632 (?) - Unknown | Evidence from Sidereal: Ice Core | ||||||||||||||
|
List of 1 Events for Episode 1
| |||||||||||||||
1629 Confirmed Eruption Max VEI: 2
| Episode 1 | Eruption Episode | |||||||||||||||||||||||||||||||||||
|---|---|---|---|---|---|---|---|---|---|---|---|---|---|---|---|---|---|---|---|---|---|---|---|---|---|---|---|---|---|---|---|---|---|---|---|
| 1629 - Unknown | Evidence from Observations: Reported | ||||||||||||||||||||||||||||||||||
|
List of 5 Events for Episode 1
| |||||||||||||||||||||||||||||||||||
1622 (?) Confirmed Eruption
| Episode 1 | Eruption Episode | |||||||||||||||
|---|---|---|---|---|---|---|---|---|---|---|---|---|---|---|---|
| 1622 (?) - Unknown | Evidence from Sidereal: Ice Core | ||||||||||||||
|
List of 1 Events for Episode 1
| |||||||||||||||
1619 Jul 29 Confirmed Eruption Max VEI: 2
| Episode 1 | Eruption Episode | ||||||||||||||||||||||||||||||
|---|---|---|---|---|---|---|---|---|---|---|---|---|---|---|---|---|---|---|---|---|---|---|---|---|---|---|---|---|---|---|
| 1619 Jul 29 - Unknown | Evidence from Observations: Reported | |||||||||||||||||||||||||||||
|
List of 4 Events for Episode 1
| ||||||||||||||||||||||||||||||
1610 (?) Confirmed Eruption
| Episode 1 | Eruption Episode | |||||||||||||||
|---|---|---|---|---|---|---|---|---|---|---|---|---|---|---|---|
| 1610 (?) - Unknown | Evidence from Sidereal: Ice Core | ||||||||||||||
|
List of 1 Events for Episode 1
| |||||||||||||||
1603 Oct 31 - 1603 Nov Confirmed Eruption Max VEI: 2
| Episode 1 | Eruption Episode | Volcano Uncertain: Vatnajökull; possibly Grímsvötn | |||||||||||||||||||||||||||||
|---|---|---|---|---|---|---|---|---|---|---|---|---|---|---|---|---|---|---|---|---|---|---|---|---|---|---|---|---|---|---|
| 1603 Oct 31 - 1603 Nov | Evidence from Unknown | |||||||||||||||||||||||||||||
|
List of 4 Events for Episode 1 at Volcano Uncertain: Vatnajökull; possibly Grímsvötn
| ||||||||||||||||||||||||||||||
1598 Nov 7 Confirmed Eruption Max VEI: 3 (?)
| Episode 1 | Eruption Episode | |||||||||||||||||||||||||||||||||||
|---|---|---|---|---|---|---|---|---|---|---|---|---|---|---|---|---|---|---|---|---|---|---|---|---|---|---|---|---|---|---|---|---|---|---|---|
| 1598 Nov 7 - Unknown | Evidence from Observations: Reported | ||||||||||||||||||||||||||||||||||
|
List of 5 Events for Episode 1
| |||||||||||||||||||||||||||||||||||
1530 ± 10 years Confirmed Eruption
| Episode 1 | Eruption Episode | ||||||||||||||||||||
|---|---|---|---|---|---|---|---|---|---|---|---|---|---|---|---|---|---|---|---|---|
| 1530 ± 10 years - Unknown | Evidence from Sidereal: Ice Core | |||||||||||||||||||
|
List of 2 Events for Episode 1
| ||||||||||||||||||||
1521 (?) Confirmed Eruption
| Episode 1 | Eruption Episode | |||||||||||||||
|---|---|---|---|---|---|---|---|---|---|---|---|---|---|---|---|
| 1521 (?) - Unknown | Evidence from Sidereal: Ice Core | ||||||||||||||
|
List of 1 Events for Episode 1
| |||||||||||||||
1510 ± 10 years Confirmed Eruption
| Episode 1 | Eruption Episode | ||||||||||||||||||||
|---|---|---|---|---|---|---|---|---|---|---|---|---|---|---|---|---|---|---|---|---|
| 1510 ± 10 years - Unknown | Evidence from Sidereal: Ice Core | |||||||||||||||||||
|
List of 2 Events for Episode 1
| ||||||||||||||||||||
1509 (?) Confirmed Eruption
| Episode 1 | Eruption Episode | |||||||||||||||
|---|---|---|---|---|---|---|---|---|---|---|---|---|---|---|---|
| 1509 (?) - Unknown | Evidence from Sidereal: Ice Core | ||||||||||||||
|
List of 1 Events for Episode 1
| |||||||||||||||
1500 (?) Confirmed Eruption
| Episode 1 | Eruption Episode | |||||||||||||||
|---|---|---|---|---|---|---|---|---|---|---|---|---|---|---|---|
| 1500 (?) - Unknown | Evidence from Sidereal: Ice Core | ||||||||||||||
|
List of 1 Events for Episode 1
| |||||||||||||||
1490 ± 10 years Confirmed Eruption
| Episode 1 | Eruption Episode | ||||||||||||||||||||
|---|---|---|---|---|---|---|---|---|---|---|---|---|---|---|---|---|---|---|---|---|
| 1490 ± 10 years - Unknown | Evidence from Sidereal: Ice Core | |||||||||||||||||||
|
List of 2 Events for Episode 1
| ||||||||||||||||||||
1471 (?) Confirmed Eruption
| Episode 1 | Eruption Episode | |||||||||||||||
|---|---|---|---|---|---|---|---|---|---|---|---|---|---|---|---|
| 1471 (?) - Unknown | Evidence from Sidereal: Ice Core | ||||||||||||||
|
List of 1 Events for Episode 1
| |||||||||||||||
1470 ± 10 years Confirmed Eruption
| Episode 1 | Eruption Episode | ||||||||||||||||||||
|---|---|---|---|---|---|---|---|---|---|---|---|---|---|---|---|---|---|---|---|---|
| 1470 ± 10 years - Unknown | Evidence from Sidereal: Ice Core | |||||||||||||||||||
|
List of 2 Events for Episode 1
| ||||||||||||||||||||
1469 (?) Confirmed Eruption
| Episode 1 | Eruption Episode | |||||||||||||||
|---|---|---|---|---|---|---|---|---|---|---|---|---|---|---|---|
| 1469 (?) - Unknown | Evidence from Sidereal: Ice Core | ||||||||||||||
|
List of 1 Events for Episode 1
| |||||||||||||||
1450 ± 10 years Confirmed Eruption
| Episode 1 | Eruption Episode | ||||||||||||||||||||
|---|---|---|---|---|---|---|---|---|---|---|---|---|---|---|---|---|---|---|---|---|
| 1450 ± 10 years - Unknown | Evidence from Sidereal: Ice Core | |||||||||||||||||||
|
List of 2 Events for Episode 1
| ||||||||||||||||||||
1430 ± 10 years Confirmed Eruption
| Episode 1 | Eruption Episode | ||||||||||||||||||||
|---|---|---|---|---|---|---|---|---|---|---|---|---|---|---|---|---|---|---|---|---|
| 1430 ± 10 years - Unknown | Evidence from Sidereal: Ice Core | |||||||||||||||||||
|
List of 2 Events for Episode 1
| ||||||||||||||||||||
1390 ± 10 years Confirmed Eruption
| Episode 1 | Eruption Episode | ||||||||||||||||||||
|---|---|---|---|---|---|---|---|---|---|---|---|---|---|---|---|---|---|---|---|---|
| 1390 ± 10 years - Unknown | Evidence from Sidereal: Ice Core | |||||||||||||||||||
|
List of 2 Events for Episode 1
| ||||||||||||||||||||
1370 ± 10 years Confirmed Eruption
| Episode 1 | Eruption Episode | ||||||||||||||||||||
|---|---|---|---|---|---|---|---|---|---|---|---|---|---|---|---|---|---|---|---|---|
| 1370 ± 10 years - Unknown | Evidence from Sidereal: Ice Core | |||||||||||||||||||
|
List of 2 Events for Episode 1
| ||||||||||||||||||||
1369 (?) Confirmed Eruption
| Episode 1 | Eruption Episode | |||||||||||||||
|---|---|---|---|---|---|---|---|---|---|---|---|---|---|---|---|
| 1369 (?) - Unknown | Evidence from Sidereal: Ice Core | ||||||||||||||
|
List of 1 Events for Episode 1
| |||||||||||||||
1354 (?) Confirmed Eruption
| Episode 1 | Eruption Episode | ||||||||||||||||||||
|---|---|---|---|---|---|---|---|---|---|---|---|---|---|---|---|---|---|---|---|---|
| 1354 (?) - Unknown | Evidence from Observations: Reported | |||||||||||||||||||
|
List of 2 Events for Episode 1
| ||||||||||||||||||||
1350 (?) Confirmed Eruption
| Episode 1 | Eruption Episode | |||||||||||||||
|---|---|---|---|---|---|---|---|---|---|---|---|---|---|---|---|
| 1350 (?) - Unknown | Evidence from Sidereal: Ice Core | ||||||||||||||
|
List of 1 Events for Episode 1
| |||||||||||||||
1341 May Confirmed Eruption Max VEI: 2
| Episode 1 | Eruption Episode | |||||||||||||||||||||||||
|---|---|---|---|---|---|---|---|---|---|---|---|---|---|---|---|---|---|---|---|---|---|---|---|---|---|
| 1341 May - Unknown | Evidence from Observations: Reported | ||||||||||||||||||||||||
|
List of 3 Events for Episode 1
| |||||||||||||||||||||||||
1332 Nov Confirmed Eruption Max VEI: 2
| Episode 1 | Eruption Episode | |||||||||||||||||||||||||
|---|---|---|---|---|---|---|---|---|---|---|---|---|---|---|---|---|---|---|---|---|---|---|---|---|---|
| 1332 Nov - Unknown | Evidence from Observations: Reported | ||||||||||||||||||||||||
|
List of 3 Events for Episode 1
| |||||||||||||||||||||||||
1310 ± 10 years Confirmed Eruption
| Episode 1 | Eruption Episode | ||||||||||||||||||||
|---|---|---|---|---|---|---|---|---|---|---|---|---|---|---|---|---|---|---|---|---|
| 1310 ± 10 years - Unknown | Evidence from Sidereal: Ice Core | |||||||||||||||||||
|
List of 2 Events for Episode 1
| ||||||||||||||||||||
1290 ± 10 years Confirmed Eruption
| Episode 1 | Eruption Episode | ||||||||||||||||||||
|---|---|---|---|---|---|---|---|---|---|---|---|---|---|---|---|---|---|---|---|---|
| 1290 ± 10 years - Unknown | Evidence from Sidereal: Ice Core | |||||||||||||||||||
|
List of 2 Events for Episode 1
| ||||||||||||||||||||
1270 ± 10 years Confirmed Eruption
| Episode 1 | Eruption Episode | ||||||||||||||||||||
|---|---|---|---|---|---|---|---|---|---|---|---|---|---|---|---|---|---|---|---|---|
| 1270 ± 10 years - Unknown | Evidence from Sidereal: Ice Core | |||||||||||||||||||
|
List of 2 Events for Episode 1
| ||||||||||||||||||||
1230 ± 10 years Confirmed Eruption
| Episode 1 | Eruption Episode | ||||||||||||||||||||
|---|---|---|---|---|---|---|---|---|---|---|---|---|---|---|---|---|---|---|---|---|
| 1230 ± 10 years - Unknown | Evidence from Sidereal: Ice Core | |||||||||||||||||||
|
List of 2 Events for Episode 1
| ||||||||||||||||||||
1190 (?) Confirmed Eruption
| Episode 1 | Eruption Episode | |||||||||||||||
|---|---|---|---|---|---|---|---|---|---|---|---|---|---|---|---|
| 1190 (?) - Unknown | Evidence from Sidereal: Ice Core | ||||||||||||||
|
List of 1 Events for Episode 1
| |||||||||||||||
1150 (?) Confirmed Eruption
| Episode 1 | Eruption Episode | |||||||||||||||
|---|---|---|---|---|---|---|---|---|---|---|---|---|---|---|---|
| 1150 (?) - Unknown | Evidence from Sidereal: Ice Core | ||||||||||||||
|
List of 1 Events for Episode 1
| |||||||||||||||
1090 (?) Confirmed Eruption
| Episode 1 | Eruption Episode | |||||||||||||||
|---|---|---|---|---|---|---|---|---|---|---|---|---|---|---|---|
| 1090 (?) - Unknown | Evidence from Sidereal: Ice Core | ||||||||||||||
|
List of 1 Events for Episode 1
| |||||||||||||||
1060 (?) Confirmed Eruption
| Episode 1 | Eruption Episode | ||||||||||||||||||||
|---|---|---|---|---|---|---|---|---|---|---|---|---|---|---|---|---|---|---|---|---|
| 1060 (?) - Unknown | Evidence from Correlation: Tephrochronology | |||||||||||||||||||
|
List of 2 Events for Episode 1
| ||||||||||||||||||||
1010 (?) Confirmed Eruption
| Episode 1 | Eruption Episode | |||||||||||||||
|---|---|---|---|---|---|---|---|---|---|---|---|---|---|---|---|
| 1010 (?) - Unknown | Evidence from Sidereal: Ice Core | ||||||||||||||
|
List of 1 Events for Episode 1
| |||||||||||||||
0960 (?) Confirmed Eruption
| Episode 1 | Eruption Episode | |||||||||||||||
|---|---|---|---|---|---|---|---|---|---|---|---|---|---|---|---|
| 0960 (?) - Unknown | Evidence from Sidereal: Ice Core | ||||||||||||||
|
List of 1 Events for Episode 1
| |||||||||||||||
0910 (?) Confirmed Eruption
| Episode 1 | Eruption Episode | ||||||||||||||||||||
|---|---|---|---|---|---|---|---|---|---|---|---|---|---|---|---|---|---|---|---|---|
| 0910 (?) - Unknown | Evidence from Correlation: Tephrochronology | |||||||||||||||||||
|
List of 2 Events for Episode 1
| ||||||||||||||||||||
0050 BCE (?) Confirmed Eruption Max VEI: 2
| Episode 1 | Eruption Episode | Halsagigur | ||||||||||||||||||||||||||||||||||
|---|---|---|---|---|---|---|---|---|---|---|---|---|---|---|---|---|---|---|---|---|---|---|---|---|---|---|---|---|---|---|---|---|---|---|---|
| 0050 BCE (?) - Unknown | Evidence from Correlation: Tephrochronology | ||||||||||||||||||||||||||||||||||
|
List of 5 Events for Episode 1 at Halsagigur
| |||||||||||||||||||||||||||||||||||
1950 BCE ± 100 years Confirmed Eruption Max VEI: 2
| Episode 1 | Eruption Episode | Raudholar and Brunuholar | ||||||||||||||||||||||||||||||||||
|---|---|---|---|---|---|---|---|---|---|---|---|---|---|---|---|---|---|---|---|---|---|---|---|---|---|---|---|---|---|---|---|---|---|---|---|
| 1950 BCE ± 100 years - Unknown | Evidence from Correlation: Tephrochronology | ||||||||||||||||||||||||||||||||||
|
List of 5 Events for Episode 1 at Raudholar and Brunuholar
| |||||||||||||||||||||||||||||||||||
3550 BCE ± 500 years Confirmed Eruption Max VEI: 0
| Episode 1 | Eruption Episode | S of Thordarhyrna (Bergvatnsarhraun) | |||||||||||||||||||
|---|---|---|---|---|---|---|---|---|---|---|---|---|---|---|---|---|---|---|---|---|
| 3550 BCE ± 500 years - Unknown | Evidence from Correlation: Tephrochronology | |||||||||||||||||||
|
List of 2 Events for Episode 1 at S of Thordarhyrna (Bergvatnsarhraun)
| ||||||||||||||||||||
4550 BCE ± 500 years Confirmed Eruption Max VEI: 0
| Episode 1 | Eruption Episode | Laki (Botnahraun) | |||||||||||||||||||
|---|---|---|---|---|---|---|---|---|---|---|---|---|---|---|---|---|---|---|---|---|
| 4550 BCE ± 500 years - Unknown | Evidence from Correlation: Tephrochronology | |||||||||||||||||||
|
List of 2 Events for Episode 1 at Laki (Botnahraun)
| ||||||||||||||||||||
8230 BCE ± 50 years Confirmed Eruption Max VEI: 6
| Episode 1 | Eruption Episode | Saksunarvatn tephra | ||||||||||||||||||||||||
|---|---|---|---|---|---|---|---|---|---|---|---|---|---|---|---|---|---|---|---|---|---|---|---|---|---|
| 8230 BCE ± 50 years - Unknown | Evidence from Isotopic: 14C (calibrated) | ||||||||||||||||||||||||
|
List of 3 Events for Episode 1 at Saksunarvatn tephra
| |||||||||||||||||||||||||
There is data available for 3 deformation periods. Expand each entry for additional details.
| Start Date: 1999 | Stop Date: 2005 | Direction: Uplift | Method: GPS |
| Magnitude: 20.000 cm | Spatial Extent: Unknown | Latitude: Unknown | Longitude: Unknown |
Remarks: Grimsvotn is a subglacial volcano where deformation can only be measured by GPS. The vertical displacement shows uplift prior to the 1998 eruption, followed by subsidence during the eruption, followed by uplift again. | |||
Reference List: Sturkell et al. 2006.
Full References:
Sturkell, E., F. Sigmundsson, and R. Slunga,, 2006. 1983-2003 decaying rate of deflation at Askja caldera: Pressure decrease in an extensive magma plumbing system at a spreading plate boundary. Bull. Volc., 68, 727-735.
| Start Date: 1998 | Stop Date: 1999 | Direction: Subsidence | Method: GPS |
| Magnitude: 15.000 cm | Spatial Extent: Unknown | Latitude: Unknown | Longitude: Unknown |
Remarks: Grimsvotn is a subglacial volcano where deformation can only be measured by GPS. The vertical displacement shows uplift prior to the 1998 eruption, followed by subsidence during the eruption, followed by uplift again. | |||
Reference List: Sturkell et al. 2006.
Full References:
Sturkell, E., F. Sigmundsson, and R. Slunga,, 2006. 1983-2003 decaying rate of deflation at Askja caldera: Pressure decrease in an extensive magma plumbing system at a spreading plate boundary. Bull. Volc., 68, 727-735.
| Start Date: 1992 | Stop Date: 1998 | Direction: Uplift | Method: GPS |
| Magnitude: 8.000 cm | Spatial Extent: Unknown | Latitude: Unknown | Longitude: Unknown |
Remarks: Grimsvotn is a subglacial volcano where deformation can only be measured by GPS. The vertical displacement shows uplift prior to the 1998 eruption, followed by subsidence during the eruption, followed by uplift again. | |||
Reference List: Sturkell et al. 2006.
Full References:
Sturkell, E., F. Sigmundsson, and R. Slunga,, 2006. 1983-2003 decaying rate of deflation at Askja caldera: Pressure decrease in an extensive magma plumbing system at a spreading plate boundary. Bull. Volc., 68, 727-735.
There is data available for 4 emission periods. Expand each entry for additional details.
| Start Date: 2011 May 21 | Stop Date: 2011 May 21 | Method: Satellite (Aura OMI) |
| SO2 Altitude Min: 12 km | SO2 Altitude Max: 12 km | Total SO2 Mass: 300 kt |
Data Details
| Date Start | Date End | Assumed SO2 Altitude | SO2 Algorithm | SO2 Mass |
| 20110521 | 12.0 | 300.000 |
| Start Date: 2004 Nov 02 | Stop Date: 2004 Nov 02 | Method: Satellite (Aura OMI) |
| SO2 Altitude Min: 12 km | SO2 Altitude Max: 12 km | Total SO2 Mass: 30 kt |
Data Details
| Date Start | Date End | Assumed SO2 Altitude | SO2 Algorithm | SO2 Mass |
| 20041102 | 12.0 | 30.000 |
| Start Date: 1996 Oct 02 | Stop Date: 1996 Oct 02 | Method: Satellite (Earth Probe TOMS) |
| SO2 Altitude Min: 10 km | SO2 Altitude Max: 10 km | Total SO2 Mass: 10 kt |
Data Details
| Date Start | Date End | Assumed SO2 Altitude | SO2 Algorithm | SO2 Mass |
| 19961002 | 10.0 | 10.000 |
| Start Date: 1983 May 29 | Stop Date: 1983 May 29 | Method: Satellite (Nimbus-7 TOMS) |
| SO2 Altitude Min: 8 km | SO2 Altitude Max: 8 km | Total SO2 Mass: 10 kt |
Data Details
| Date Start | Date End | Assumed SO2 Altitude | SO2 Algorithm | SO2 Mass |
| 19830529 | 8.0 | 10.000 |
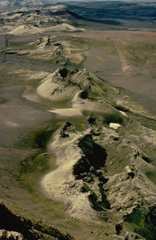 The most prominent of a series of fissures extending from Grímsvötn central volcano is the noted Laki (Skaftár) fissure, seen here, which trends to the SW. It produced the world's largest known historical lava flow during an eruption in 1783. Grímsvötn, Iceland's most frequently active volcano during historical time, lies largely beneath the vast Vatnajökull icecap. The caldera lake is covered by a 200-m-thick ice shelf, and only the southern rim of the 6 x 8 km caldera is exposed.
 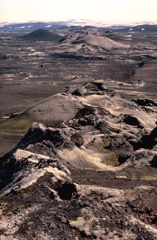 The Earth's largest known lava flow during historical time was erupted from the Lakagigar (Skaftár) fissure beginning June 8, 1783. Eruptive activity may have occurred at Grímsvötn caldera earlier in May. The 15 cu km Laki lavas were erupted over a 7-month period from a 27-km-long fissure system composed of 10 en-echelon fissures. Extensive crop damage and livestock losses caused a severe famine that resulted in the decimation of 22% of the population of Iceland.
 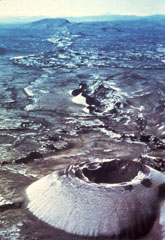 The most prominent of a series of fissures extending NE and SW from Grímsvötn central volcano is the noted Laki (Skaftár) fissure, which trends vertically across the photo SW of Grímsvötn and immediately SW of the Vatnajökull ice sheet. Laki produced the world's largest known historical lava flow during an eruption in 1783, as well as large volumes of gases but relatively little tephra. The approximately 27-km-long fissure is characterized by a sequence of craters and cones like that seen in the foreground.
 An ash plume rises from a new crater near the southern margin of Grímsvötn caldera in November 2004. Grímsvötn lies largely beneath the vast Vatnajökull icecap and the eruption melted its way through ice about 200 m thick. The plume extends towards the north due to the wind direction, coating the surface of the glacier in dark ash.
The maps shown below have been scanned from the GVP map archives and include the volcano on this page. Clicking on the small images will load the full 300 dpi map. Very small-scale maps (such as world maps) are not included. The maps database originated over 30 years ago, but was only recently updated and connected to our main database. We welcome users to tell us if they see incorrect information or other problems with the maps; please use the Contact GVP link at the bottom of the page to send us email.
The following 6 samples associated with this volcano can be found in the Smithsonian's NMNH Department of Mineral Sciences collections, and may be availble for research (contact the Rock and Ore Collections Manager). Catalog number links will open a window with more information.
| Catalog Number | Sample Description | Lava Source | Collection Date |
|---|---|---|---|
| NMNH 111085 | Basalt | LAKAGIGAR | -- |
| NMNH 116704 | Basalt | -- | 6 Oct 1995 |
| NMNH 116704 | Basalt | LAKI FLOW, E ARM OF (1783) | 6 Oct 1995 |
| NMNH 117571 | Volcanic Ash | -- | -- |
| NMNH 117682-1 | Basalt | Laki Flow | -- |
| NMNH 117682-2 | Basalt | Laki Flow | -- |
| Catalogue of Icelandic Volcanoes (Link to Grímsvötn) | The Catalogue of Icelandic Volcanoes is an interactive, web-based tool, containing information on volcanic systems that belong to the active volcanic zones of Iceland. It is a collaboration of the Icelandic Meteorological Office (the state volcano observatory), the Institute of Earth Sciences at the University of Iceland, and the Civil Protection Department of the National Commissioner of the Iceland Police, with contributions from a large number of specialists in Iceland and elsewhere. This official publication is intended to serve as an accurate and up-to-date source of information about active volcanoes in Iceland and their characteristics. The Catalogue forms a part of an integrated volcanic risk assessment project in Iceland GOSVÁ (commenced in 2012), as well as being part of the effort of FUTUREVOLC (2012-2016) on establishing an Icelandic volcano supersite. |
| Copernicus Browser | The Copernicus Browser replaced the Sentinel Hub Playground browser in 2023, to provide access to Earth observation archives from the Copernicus Data Space Ecosystem, the main distribution platform for data from the EU Copernicus missions. |
| MIROVA | Middle InfraRed Observation of Volcanic Activity (MIROVA) is a near real time volcanic hot-spot detection system based on the analysis of MODIS (Moderate Resolution Imaging Spectroradiometer) data. In particular, MIROVA uses the Middle InfraRed Radiation (MIR), measured over target volcanoes, in order to detect, locate and measure the heat radiation sourced from volcanic activity. |
| MODVOLC Thermal Alerts | Using infrared satellite Moderate Resolution Imaging Spectroradiometer (MODIS) data, scientists at the Hawai'i Institute of Geophysics and Planetology, University of Hawai'i, developed an automated system called MODVOLC to map thermal hot-spots in near real time. For each MODIS image, the algorithm automatically scans each 1 km pixel within it to check for high-temperature hot-spots. When one is found the date, time, location, and intensity are recorded. MODIS looks at every square km of the Earth every 48 hours, once during the day and once during the night, and the presence of two MODIS sensors in space allows at least four hot-spot observations every two days. Each day updated global maps are compiled to display the locations of all hot spots detected in the previous 24 hours. There is a drop-down list with volcano names which allow users to 'zoom-in' and examine the distribution of hot-spots at a variety of spatial scales. |
|
WOVOdat
Single Volcano View Temporal Evolution of Unrest Side by Side Volcanoes |
WOVOdat is a database of volcanic unrest; instrumentally and visually recorded changes in seismicity, ground deformation, gas emission, and other parameters from their normal baselines. It is sponsored by the World Organization of Volcano Observatories (WOVO) and presently hosted at the Earth Observatory of Singapore.
GVMID Data on Volcano Monitoring Infrastructure The Global Volcano Monitoring Infrastructure Database GVMID, is aimed at documenting and improving capabilities of volcano monitoring from the ground and space. GVMID should provide a snapshot and baseline view of the techniques and instrumentation that are in place at various volcanoes, which can be use by volcano observatories as reference to setup new monitoring system or improving networks at a specific volcano. These data will allow identification of what monitoring gaps exist, which can be then targeted by remote sensing infrastructure and future instrument deployments. |
| Volcanic Hazard Maps | The IAVCEI Commission on Volcanic Hazards and Risk has a Volcanic Hazard Maps database designed to serve as a resource for hazard mappers (or other interested parties) to explore how common issues in hazard map development have been addressed at different volcanoes, in different countries, for different hazards, and for different intended audiences. In addition to the comprehensive, searchable Volcanic Hazard Maps Database, this website contains information about diversity of volcanic hazard maps, illustrated using examples from the database. This site is for educational purposes related to volcanic hazard maps. Hazard maps found on this website should not be used for emergency purposes. For the most recent, official hazard map for a particular volcano, please seek out the proper institutional authorities on the matter. |
| IRIS seismic stations/networks | Incorporated Research Institutions for Seismology (IRIS) Data Services map showing the location of seismic stations from all available networks (permanent or temporary) within a radius of 0.18° (about 20 km at mid-latitudes) from the given location of Grímsvötn. Users can customize a variety of filters and options in the left panel. Note that if there are no stations are known the map will default to show the entire world with a "No data matched request" error notice. |
| UNAVCO GPS/GNSS stations | Geodetic Data Services map from UNAVCO showing the location of GPS/GNSS stations from all available networks (permanent or temporary) within a radius of 20 km from the given location of Grímsvötn. Users can customize the data search based on station or network names, location, and time window. Requires Adobe Flash Player. |
| DECADE Data | The DECADE portal, still in the developmental stage, serves as an example of the proposed interoperability between The Smithsonian Institution's Global Volcanism Program, the Mapping Gas Emissions (MaGa) Database, and the EarthChem Geochemical Portal. The Deep Earth Carbon Degassing (DECADE) initiative seeks to use new and established technologies to determine accurate global fluxes of volcanic CO2 to the atmosphere, but installing CO2 monitoring networks on 20 of the world's 150 most actively degassing volcanoes. The group uses related laboratory-based studies (direct gas sampling and analysis, melt inclusions) to provide new data for direct degassing of deep earth carbon to the atmosphere. |
| Large Eruptions of Grímsvötn | Information about large Quaternary eruptions (VEI >= 4) is cataloged in the Large Magnitude Explosive Volcanic Eruptions (LaMEVE) database of the Volcano Global Risk Identification and Analysis Project (VOGRIPA). |
| EarthChem | EarthChem develops and maintains databases, software, and services that support the preservation, discovery, access and analysis of geochemical data, and facilitate their integration with the broad array of other available earth science parameters. EarthChem is operated by a joint team of disciplinary scientists, data scientists, data managers and information technology developers who are part of the NSF-funded data facility Integrated Earth Data Applications (IEDA). IEDA is a collaborative effort of EarthChem and the Marine Geoscience Data System (MGDS). |