Report on Stromboli (Italy) — September 2023
Bulletin of the Global Volcanism Network, vol. 48, no. 9 (September 2023)
Managing Editor: Benjamin Andrews.
Edited by Kadie L. Bennis.
Stromboli (Italy) Explosions, spattering, and lava flows during May-August 2023
Please cite this report as:
Global Volcanism Program, 2023. Report on Stromboli (Italy) (Bennis, K.L., and Andrews, B., eds.). Bulletin of the Global Volcanism Network, 48:9. Smithsonian Institution.
Stromboli
Italy
38.789°N, 15.213°E; summit elev. 924 m
All times are local (unless otherwise noted)
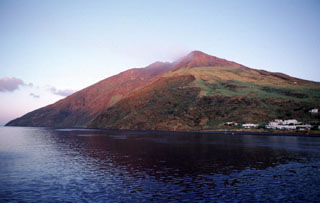
Stromboli, located in Italy, has exhibited nearly constant lava fountains for the past 2,000 years; recorded eruptions date back to 350 BCE. Eruptive activity occurs at the summit from multiple vents, which include a north crater area (N area) and a central-southern crater (CS area) on a terrace known as the ‘terrazza craterica’ at the head of the Sciara del Fuoco, a large scarp that runs from the summit down the NW side of the volcano-island. Activity typically consists of Strombolian explosions, incandescent ejecta, lava flows, and pyroclastic flows. Thermal and visual monitoring cameras are located on the nearby Pizzo Sopra La Fossa, above the terrazza craterica, and at multiple flank locations. The current eruption period has been ongoing since 1934 and recent activity has consisted of frequent Strombolian explosions and lava flows (BGVN 48:07). This report updates activity during May through August 2023 primarily characterized by frequent explosions and spattering and effusive activity based on reports from Italy's Istituto Nazionale di Geofisica e Vulcanologia (INGV) and various satellite data.
Explosive activity persisted throughout the reporting period, generally in the medium range, based on the number of hourly explosions in the summit crater (figure 260, table 17). Intermittent low-power thermal activity was recorded by the MIROVA (Middle InfraRed Observation of Volcanic Activity) analysis of MODIS satellite data, which included a pause in activity during late May to mid-June (figure 261). According to data collected by the MODVOLC thermal algorithm, a total of four thermal alerts were detected: one on 18 July, one on 8 August, and two on 18 August. Infrared satellite imagery captured consistent thermal hotspots at both active summit craters on clear weather days (figure 262).
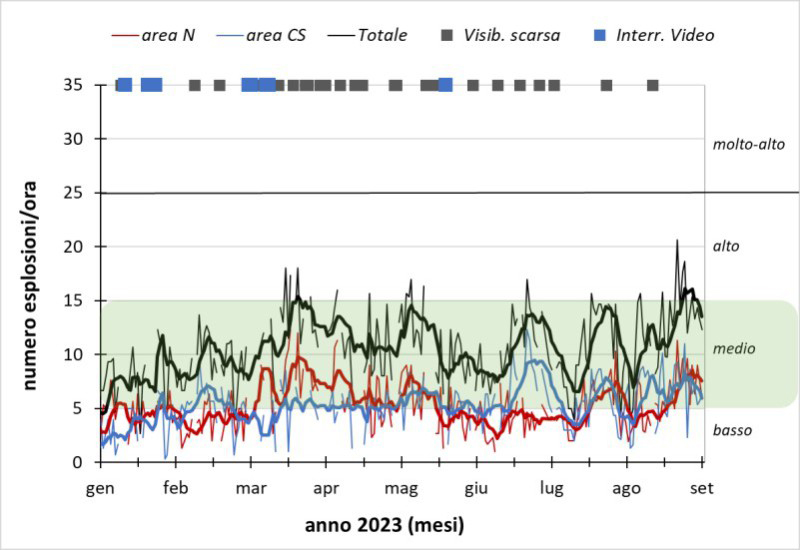 |
Figure 260. Explosive activity persisted at Stromboli during January through August 2023, with medium numbers of daily explosions at the summit crater. The average number of daily explosions (y-axis) during January through August (x-axis) are broken out by area and as a total, with red for the N area, blue for the CS area, and black for the combined total. The data are presented as daily (thin lines) and weekly (thick lines) averages. The black squares along the top represent days with no observations due to poor visibility (Visib. Scarsa). The right axis indicates the qualitative activity levels from low (basso) to highest (altissimo) with the green highlighted band indicating the most common level. Courtesy of INGV (Report 36/2023, Stromboli, Bollettino Settimanale, 28/08/2023 - 03/09/2023). |
Table 17. Summary of type, frequency, and intensity of explosive activity at Stromboli by month during May-August 2023; information from webcam observations. Courtesy of INGV weekly reports.
| Month | Explosive Activity |
| May 2023 | Typical Strombolian activity and spattering. Explosions were reported from 2 vents in the N area and 2-4 vents in the CS area. The average hourly frequency of explosions was 5-17 events/hour. The intensity of the explosions varied from low-to-medium (less than 150 m high) in the N crater area to medium-to-high (more than 150 m high) in the CS crater area. |
| Jun 2023 | Typical Strombolian activity and spattering. Explosions were reported from 2 vents in the N area and 4-5 vents in the CS area. The average hourly frequency of explosions was 6-17 events/hour. The intensity of the explosions varied from low-to-medium (80-150 m high) in the N crater area and low-to-high in the CS crater area. |
| Jul 2023 | Typical Strombolian activity and spattering. Explosions were reported from 2-3 vents in the N area and 1-5 vents in the CS area. The average hourly frequency of explosions was 9-15 events/hour. The intensity of the explosions varied from low-to-high (less than 80 m to more than 150 m high) in both the N and CS crater areas. |
| Aug 2023 | Typical Strombolian activity, spattering, and lava flows. Explosions were reported from 2-3 vents in the N area and 3-4 vents in the CS area. The average hourly frequency of explosions was 12-21 events/hour. The intensity of the explosions varied from low-to-high (less than 80 m to more than 150 m high) in both the N and CS crater areas. |
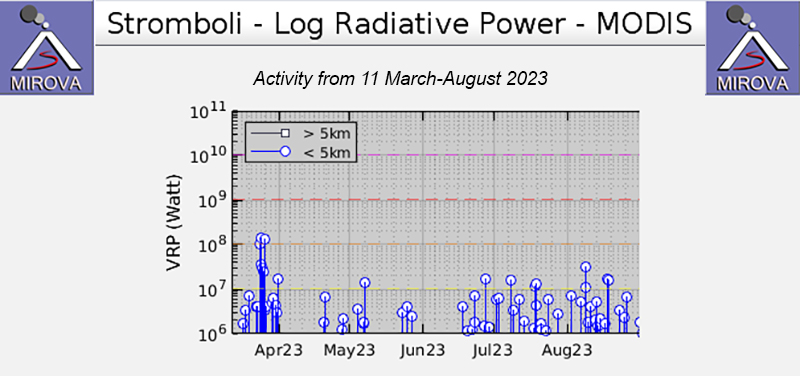 |
Figure 261. Intermittent low-power thermal activity was detected at Stromboli during May through August 2023, as shown in this MIROVA plot (Log Radiative Power). There was a brief pause in thermal activity during late May to mid-June. Courtesy of MIROVA. |
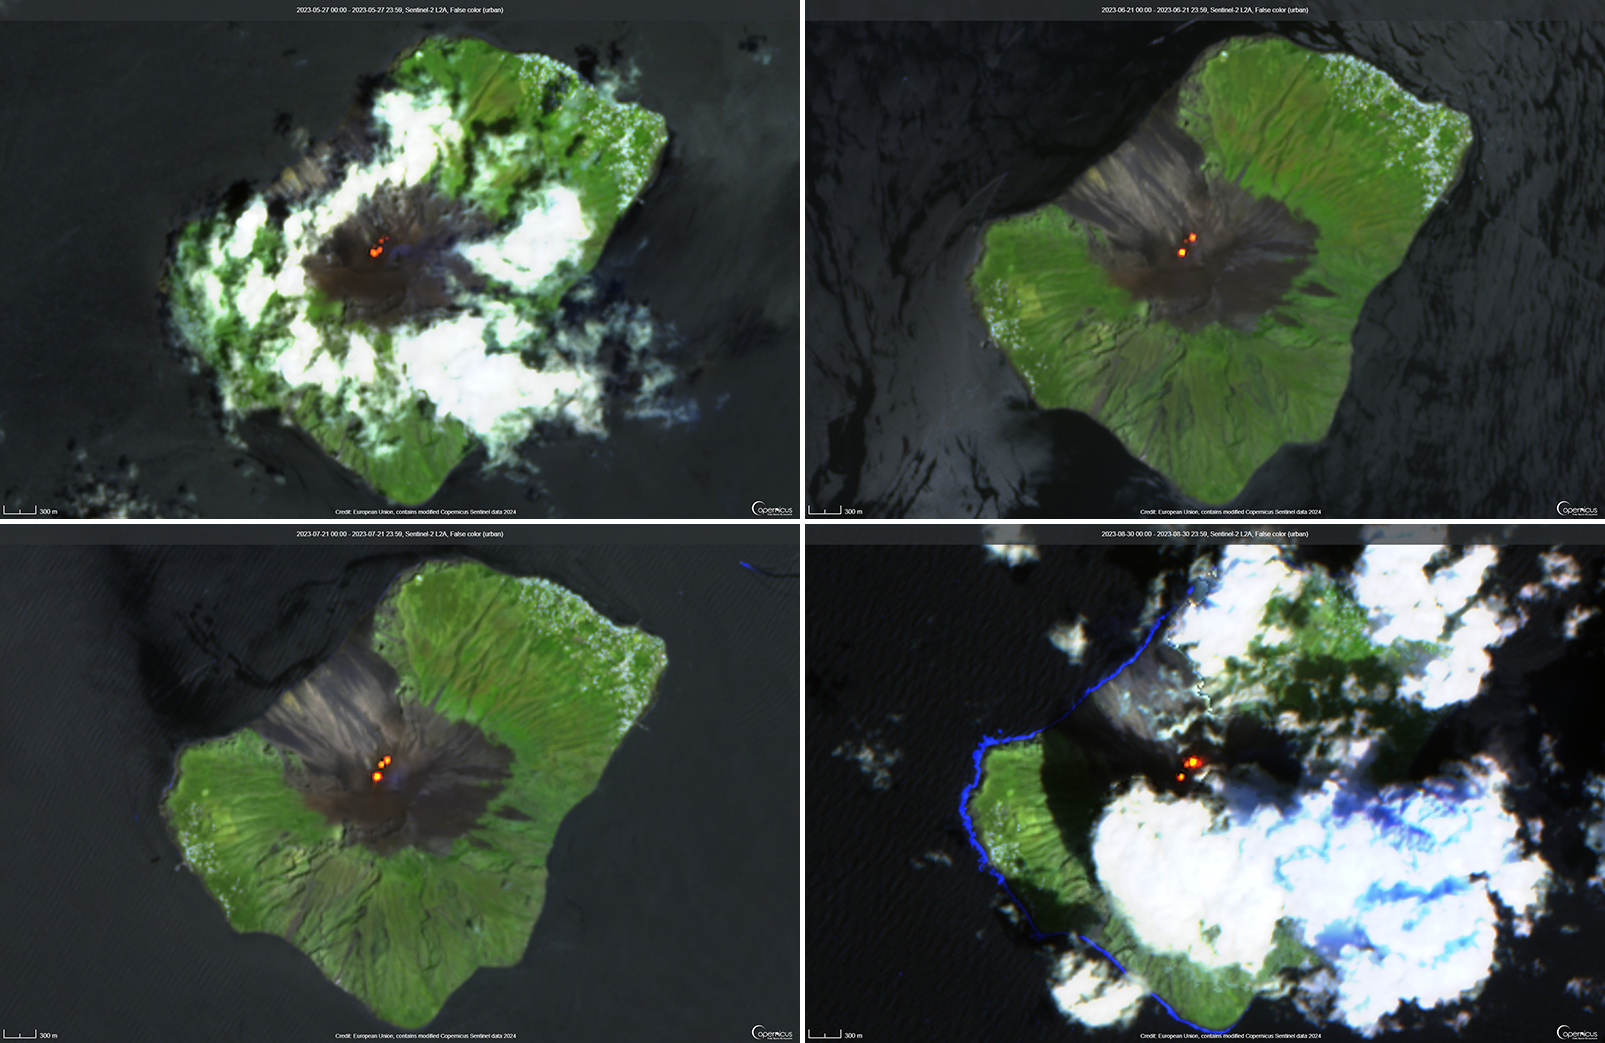 |
Figure 262. Infrared (bands B12, B11, B4) satellite images show persistent thermal hotspots at both summit craters on 27 May 2023 (top left), 21 June 2023 (top right), 21 July 2023 (bottom left), and 30 August 2023 (bottom right). Courtesy of Copernicus Browser. |
Activity during May-June 2023. Strombolian explosions were recorded by surveillance cameras in the N crater area, with one vent located in N1 (low-to-medium intensity) and one vent in N2 (low intensity) (figure 263). Both vents ejected coarse material (bombs and lapilli) and fine material (ash), although fine material was mainly present in N1. The average number of explosions at the N crater area varied between 1-9 events per hour. In the CS crater area, two active vents were reported in the S2 area (figure 263). One vent had medium-to-high intensity explosions that ejected fine material sometimes mixed with coarse material and the other vent had low-to-medium intensity explosions that ejected mainly coarse material and sometimes fine material was included. The average number of explosions at the CS crater area varied between 2 and 8 events per hour. The C and S1 areas did not show significant eruptive activity, though the vents at S1 occasionally produced low intensity gas-and-steam explosions that sometimes ejected coarse material. During 22-28 May spattering was reported in the C area, and during 27-30 May spattering was notably more intense (figure 263). This activity was occasionally interrupted by weak explosions of coarse material.
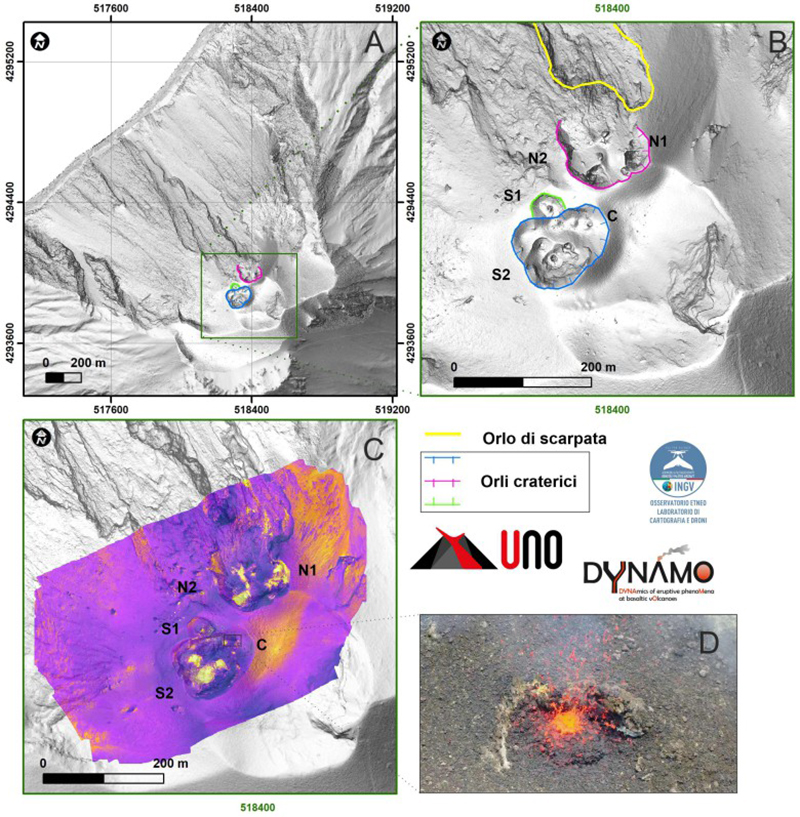 |
Figure 263. A) Shaded model of Stromboli’s crater rim and the Sciara del Fuoco based on drone images acquired on 22 and 24 May 2023. B) Detailed map of the crater areas, which includes the N crater (purple) and the CS crater (blue and green). C) Thermal orthomosaic of the crater area, showing colder area (purple) and warmer area (orange-yellow). D) Photo of the active vent in C area that shows spattering on 24 May 2023. Courtesy of INGV (Report 22/2023, Stromboli, Bollettino Settimanale, 22/05/2023 - 28/05/2023). |
During June, activity in the N crater area was characterized by one vent in N1 and one vent in N2 that had low-to-medium intensity explosions. The erupted products were mainly composed of coarse material that sometimes intermixed with fine material. The average frequency of explosions in the N crater areas varied between 1-7 event per hour. In the S1 crater area, degassing that sometimes ejected coarse material was reported. Sporadic spattering continued in the C area during the first week of June, accompanied by explosions that ejected coarse material. In the S2 area, three vents were active, characterized by mainly low-to-medium intense explosions consisting of coarse material mixed with fine material. The average frequency of explosions in the CS crater area ranged from 3-12 events per hour. During the week of 5-11 June some spattering was reported in the S1 crater area.
Activity during July-August 2023. Explosive activity persisted during July, as recorded by surveillance cameras. Low-to-high intensity explosions were detected in the N crater area, and coarse material was ejected, sometimes mixed with fine material. The average number of explosions detected ranged between 3-10 events per hour. Observations made during 1130-1330 on 4 and 8 July indicated low-to-medium frequency of explosions (with a maximum number of 12 events per hour) for both the N and CS crater areas (figure 264). Occasionally, rock avalanches were observed rolling down the Sciara del Fuoco. During this time, the N1 vent ejected mainly ash, sometimes mixed with coarse material. There were occasional explosions at the N2 vent, but no visible material was noted. Some modest spattering activity was observed in both the N1 and N2 during the week of 24-30 July.
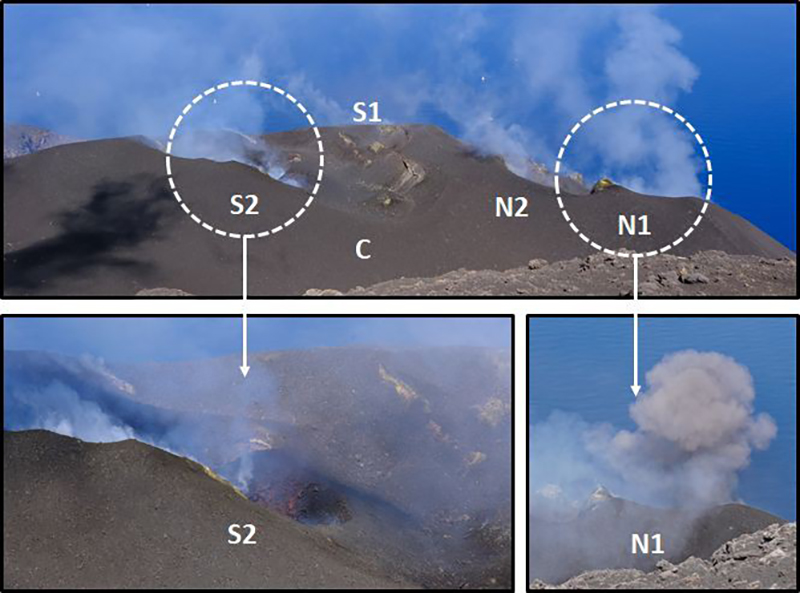 |
Figure 264. Photos showing the N and CS crater areas at Stromboli on 4 July 2023. Spattering activity is visible in the bottom-left photo at the S2 vent. Ash emissions are visible at the N1 vent in the bottom-right photo. Courtesy of INGV (Report 28/2023, Stromboli, Bollettino Settimanale, 03/07/2023 - 09/07/2023). |
Weak degassing continued to be reported at the S1 area, and the C area did not show explosive activity. The two active vents in the S2 area showed mainly explosive activity that varied from low-to-high intensity; coarse material was sometimes mixed with fine material. Intense spattering was reported from two vents in the S2 area, interspersed with jets of coarse material that rose 200 m above the crater during 3-9 July. The average number of explosions detected varied between 3-9 events per hour.
Strombolian activity continued during August, based on observations from surveillance cameras. The explosion intensity at both the N and CS crater areas varied from low-to-medium. Explosions were mainly produced at the N1, N2, and S2 areas; a mixture of coarse and fine material was dominant at the N crater area, whereas fine material was dominant at the S area. The average number of explosions that occurred at the N crater area varied from 5-11 events per hour. Variable degassing continued at the S1 area. The average number of explosions that occurred at the CS crater area varied from 2-11 events per hour.
Spattering that occurred during the last week of July in the N crater area increased in intensity, which resulted in three lava flow that started around 1230 UTC on 2 August (figure 265). The flows began to cool by the morning of 3 August and continued to cool and flow during the night of 6-7 August. The lava flows traveled a few hundred meters and were confined to the upper part of the Sciara del Fuoco.
 |
Figure 265. Infrared webcam images showing the lava flow activity at Stromboli on 2 (left) and 6 (right) August 2023 in the N crater area. The effusive activity occurred during intense phases of spattering and produced lava flows that were confined to the upper part of the Sciara del Fuoco. Courtesy of INGV (Report 32/2023, Stromboli, Bollettino Settimanale, 31/07/2023 - 06/08/2023). |
On 8 August a major explosive event was recorded at the N1 vent. The event developed as a sequence of two main explosions that occurred at 1906 (GMT) (figure 266). These events were followed by five additional minor explosions at 1906 and 1907 (at 07, 19, 28, and 32 s). The total duration of the event was one minute and 32 seconds, during which large pyroclastic products were deposited on the crater terrace and along the Sciara del Fuoco; no fallout was observed on the Pizzo Sopra la Fossa. Intense spattering activity followed the explosions at 1911 that generated two lava flows from the same N crater area. The effusive activity ended during the early morning of 9 August and the front of the flow was confined to the upper part of the Sciara del Fuoco. A second effusive event was produced by the N2 vent at 1800 (GMT) on 12 August following intense spattering activity. The flow remained on the upper part of the Sciara del Fuoco and gradually ceased during the morning of 13 August. A period of intense spattering activity occurred during 17-18 and 24 August.
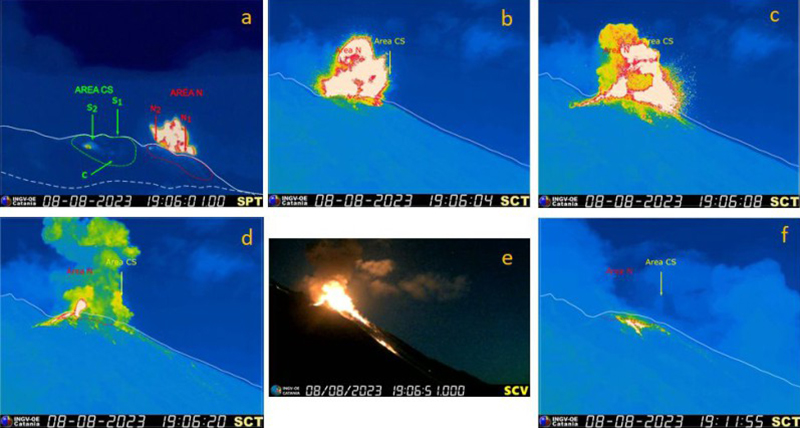 |
Figure 266. Infrared webcam images showing the large explosion at Stromboli’s N1 vent at the N crater area on 8 August 2023. The event developed as a sequence of two main events and five smaller explosions (a-d), which deposited material along the Sciara del Fuoco (e). The event was followed by a lava flow from the N crater area (f). Courtesy of INGV (Report 33/2023, Stromboli, Bollettino Settimanale, 08/08/2023 - 14/08/2023). |
Geological Summary. Spectacular incandescent nighttime explosions at Stromboli have long attracted visitors to the "Lighthouse of the Mediterranean" in the NE Aeolian Islands. This volcano has lent its name to the frequent mild explosive activity that has characterized its eruptions throughout much of historical time. The small island is the emergent summit of a volcano that grew in two main eruptive cycles, the last of which formed the western portion of the island. The Neostromboli eruptive period took place between about 13,000 and 5,000 years ago. The active summit vents are located at the head of the Sciara del Fuoco, a prominent scarp that formed about 5,000 years ago due to a series of slope failures which extends to below sea level. The modern volcano has been constructed within this scarp, which funnels pyroclastic ejecta and lava flows to the NW. Essentially continuous mild Strombolian explosions, sometimes accompanied by lava flows, have been recorded for more than a millennium.
Information Contacts: Istituto Nazionale di Geofisica e Vulcanologia (INGV), Sezione di Catania, Piazza Roma 2, 95123 Catania, Italy, (URL: http://www.ct.ingv.it/en/); MIROVA (Middle InfraRed Observation of Volcanic Activity), a collaborative project between the Universities of Turin and Florence (Italy) supported by the Centre for Volcanic Risk of the Italian Civil Protection Department (URL: http://www.mirovaweb.it/); Hawai'i Institute of Geophysics and Planetology (HIGP) - MODVOLC Thermal Alerts System, School of Ocean and Earth Science and Technology (SOEST), Univ. of Hawai'i, 2525 Correa Road, Honolulu, HI 96822, USA (URL: http://modis.higp.hawaii.edu/); Copernicus Browser, Copernicus Data Space Ecosystem, European Space Agency (URL: https://dataspace.copernicus.eu/browser/).