Recently Published Bulletin Reports
Agung (Indonesia) Three eruptive events reported in April, May, and December 2022
Tengger Caldera (Indonesia) Minor ash emission in December 2023; persistent weak thermal anomaly in the Bromo crater
Saunders (United Kingdom) Persistent thermal anomalies from the summit crater lava lake during February 2023-January 2024
Shishaldin (United States) New eruption with significant Strombolian explosions, ash plumes, and ashfall
Ioto (Japan) New eruption with discolored water, ejecta, and floating pumice during October-December 2023
Purace (Colombia) Gas-and-ash emission on 16 November 2023
Suwanosejima (Japan) Eruption plumes, crater incandescence, and occasional explosions during July-October 2023
Etna (Italy) Strombolian explosions, lava fountains, and lava flows during July-August 2023
Aira (Japan) Explosions, ash plumes, ash fall, and crater incandescence during July-October 2023
Nishinoshima (Japan) Gray emissions during October 2023
Kilauea (United States) Strong lava fountains, lava flows, and spatter at Halema’uma’u during January-September 2023
Tinakula (Solomon Islands) Continued lava flows and thermal activity during June through November 2023
Agung (Indonesia) — January 2024  Cite this Report
Agung
Indonesia
8.343°S, 115.508°E; summit elev. 2997 m
All times are local (unless otherwise noted)
Three eruptive events reported in April, May, and December 2022
Mount Agung, located on the E end of the island of Bali, Indonesia, rises above the SE rim of the Batur caldera. The summit area extends 1.5 km E-W, with the highest point on the W and a steep-walled 800-m-wide crater on the E. Recorded eruptions date back to the early 19th century. A large and deadly explosive and effusive eruption occurred during 1963-64, which was characterized by voluminous ashfall, pyroclastic flows, and lahars that caused extensive damage and many fatalities. More recent activity was documented during November 2017-June 2019 that consisted of multiple explosions, significant ash plumes, lava flows at the summit crater, and incandescent ejecta. This report covers activity reported during April-May 2022 and December 2022 based on data from the Darwin Volcanic Ash Advisory Center (VAAC).
Activity during 2022 was relatively low and mainly consisted of a few ash plumes during April-May and December. An ash plume on 3 April rising to 3.7 km altitude (700 m above the summit) and drifting N was reported in a Darwin VAAC notice based on a ground report, with ash seen in HIMAWARI-8 visible imagery. Another ash plume was reported at 1120 on 27 May that rose to 5.5 km altitude (2.5 m above the summit); the plume was not visible in satellite or webcam images due to weather clouds. An eruption was reported based on seismic data at 0840 on 13 December, with an estimated plume altitude of 3.7 km; however, no ash was seen using satellite imagery in clear conditions before weather clouds obscured the summit.
Geologic Background. Symmetrical Agung stratovolcano, Bali's highest and most sacred mountain, towers over the eastern end of the island. The volcano, whose name means "Paramount," rises above the SE rim of the Batur caldera, and the northern and southern flanks extend to the coast. The summit area extends 1.5 km E-W, with the high point on the W and a steep-walled 800-m-wide crater on the E. The Pawon cone is located low on the SE flank. Only a few eruptions dating back to the early 19th century have been recorded in historical time. The 1963-64 eruption, one of the largest in the 20th century, produced voluminous ashfall along with devastating pyroclastic flows and lahars that caused extensive damage and many fatalities.
Information Contacts: Darwin Volcanic Ash Advisory Centre (VAAC), Bureau of Meteorology, Northern Territory Regional Office, PO Box 40050, Casuarina, NT 0811, Australia (URL: http://www.bom.gov.au/info/vaac/).
Tengger Caldera (Indonesia) — February 2024 Cite this Report
Tengger Caldera
Indonesia
7.942°S, 112.95°E; summit elev. 2329 m
All times are local (unless otherwise noted)
Minor ash emission in December 2023; persistent weak thermal anomaly in the Bromo crater
Tengger Caldera, located at the N end of a volcanic massif in Indonesia’s East Java, consists of five overlapping stratovolcanoes. The youngest and only active cone in the 16-km-wide caldera is Bromo, which typically produces gas-and-steam plumes, occasional ash plumes and explosions, and weak thermal signals (BGVN 44:05, 47:01). This report covers activity during January 2022-December 2023, consisting of mostly white gas-and-steam emissions and persistent weak thermal anomalies. Information was provided by the Pusat Vulkanologi dan Mitigasi Bencana Geologi (PVMBG, also known as Indonesian Center for Volcanology and Geological Hazard Mitigation, CVGHM) and satellite imagery. The Alert Level remained at 2 (on a scale of 1-4), and visitors were warned to stay at least 1 km from the crater.
Activity was generally low during the reporting period, similar to that in 2021. According to almost daily images from MAGMA Indonesia (a platform developed by PVMBG), white emissions and plumes rose from 50 to 900 m above the main crater during this period (figure 24). During several days in March and June 2022, white plumes reached heights of 1-1.2 km above the crater.
After an increase in activity at 2114 on 3 February 2023, a PVMBG team that was sent to observe white emissions rising as high as 300 m during 9-12 February and heard rumbling noises. A sulfur dioxide odor was also strong near the crater and measurements indicated that levels were above the healthy (non-hazardous) threshold of 5 parts per million; differential optical absorption spectroscopy (DOAS) measurements indicated an average flux of 190 metric tons per day on 11 February. Incandescence originating from a large fumarole in the NNW part of the crater was visible at night. The team observed that vegetation on the E caldera wall was yellow and withered. The seismic network recorded continuous tremor and deep and shallow volcanic earthquakes.
According to a PVMBG press release, activity increased on 13 December 2023 with white, gray, and brown emissions rising as high as 900 m above Bromo’s crater rim and drifting in multiple directions (figure 25). The report noted that tremor was continuous and was accompanied in December by three volcanic earthquakes. Deformation data indicated inflation in December. There was no observable difference in the persistent thermal anomaly in the crater between 11 and 16 December 2023.
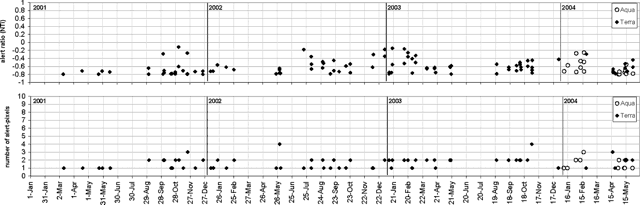
All clear views of the Bromo crater throughout this time, using Sentinel-2 infrared satellite images, showed a weak persistent thermal anomaly; none of the anomalies were strong enough to cause MODVOLC Thermal Alerts. A fire in the SE part of the caldera in early September 2023 resulted in a brief period of strong thermal anomalies.
Geologic Background. The 16-km-wide Tengger caldera is located at the northern end of a volcanic massif extending from Semeru volcano. The massive volcanic complex dates back to about 820,000 years ago and consists of five overlapping stratovolcanoes, each truncated by a caldera. Lava domes, pyroclastic cones, and a maar occupy the flanks of the massif. The Ngadisari caldera at the NE end of the complex formed about 150,000 years ago and is now drained through the Sapikerep valley. The most recent of the calderas is the 9 x 10 km wide Sandsea caldera at the SW end of the complex, which formed incrementally during the late Pleistocene and early Holocene. An overlapping cluster of post-caldera cones was constructed on the floor of the Sandsea caldera within the past several thousand years. The youngest of these is Bromo, one of Java's most active and most frequently visited volcanoes.
Information Contacts: Pusat Vulkanologi dan Mitigasi Bencana Geologi (PVMBG, also known as Indonesian Center for Volcanology and Geological Hazard Mitigation, CVGHM), Jalan Diponegoro 57, Bandung 40122, Indonesia (URL: http://www.vsi.esdm.go.id/); MAGMA Indonesia, Kementerian Energi dan Sumber Daya Mineral (URL: https://magma.esdm.go.id/v1); Copernicus Browser, Copernicus Data Space Ecosystem, European Space Agency (URL: https://dataspace.copernicus.eu/browser/); Hawai'i Institute of Geophysics and Planetology (HIGP) - MODVOLC Thermal Alerts System, School of Ocean and Earth Science and Technology (SOEST), Univ. of Hawai'i, 2525 Correa Road, Honolulu, HI 96822, USA (URL: http://modis.higp.hawaii.edu/).
Saunders (United Kingdom) — February 2024 Cite this Report
Saunders
United Kingdom
57.8°S, 26.483°W; summit elev. 843 m
All times are local (unless otherwise noted)
Persistent thermal anomalies from the summit crater lava lake during February 2023-January 2024
Saunders is one of eleven islands that comprise the South Sandwich Islands in the South Atlantic. The active Mount Michael volcano has been in almost continuous eruption since November 2014 (BGVN 48:02). Recent activity has resulted in intermittent thermal anomalies and gas-and-steam emissions (BGVN 47:03, 48:02). Visits are infrequent due to its remote location, and cloud cover often prevents satellite observations. Satellite thermal imagery and visual observation of incandescence during a research expedition in 2019 (BGVN 28:02 and 44:08) and a finding confirmed by a National Geographic Society research team that summited Michael in November 2022 reported the presence of a lava lake.
Although nearly constant cloud cover during February 2023 through January 2024 greatly limited satellite observations, thermal anomalies from the lava lake in the summit crater were detected on clear days, especially around 20-23 August 2023. Anomalies similar to previous years (eg. BGVN 48:02) were seen in both MIROVA (Middle InfraRed Observation of Volcanic Activity) data from MODIS instruments and in Sentinel 2 infrared imagery. The only notable sulfur dioxide plume detected near Saunders was on 25 September 2023, with the TROPOMI instrument aboard the Sentinel-5P satellite.
Geologic Background. Saunders Island consists of a large central volcanic edifice intersected by two seamount chains, as shown by bathymetric mapping (Leat et al., 2013). The young Mount Michael stratovolcano dominates the glacier-covered island, while two submarine plateaus, Harpers Bank and Saunders Bank, extend north. The symmetrical Michael has a 500-m-wide summit crater and a remnant of a somma rim to the SE. Tephra layers visible in ice cliffs surrounding the island are evidence of recent eruptions. Ash clouds were reported from the summit crater in 1819, and an effusive eruption was inferred to have occurred from a N-flank fissure around the end of the 19th century and beginning of the 20th century. A low ice-free lava platform, Blackstone Plain, is located on the north coast, surrounding a group of former sea stacks. A cluster of cones on the SE flank, the Ashen Hills, appear to have been modified since 1820 (LeMasurier and Thomson, 1990). Analysis of satellite imagery available since 1989 (Gray et al., 2019; MODVOLC) suggests frequent eruptive activity (when weather conditions allow), volcanic clouds, steam plumes, and thermal anomalies indicative of a persistent, or at least frequently active, lava lake in the summit crater. Due to this observational bias, there has been a presumption when defining eruptive periods that activity has been ongoing unless there is no evidence for at least 10 months.
Information Contacts: MIROVA (Middle InfraRed Observation of Volcanic Activity), a collaborative project between the Universities of Turin and Florence (Italy) supported by the Centre for Volcanic Risk of the Italian Civil Protection Department (URL: http://www.mirovaweb.it/); NASA Global Sulfur Dioxide Monitoring Page, Atmospheric Chemistry and Dynamics Laboratory, NASA Goddard Space Flight Center (NASA/GSFC), 8800 Greenbelt Road, Goddard MD 20771, USA (URL: https://so2.gsfc.nasa.gov/); Copernicus Browser (URL: https://dataspace.copernicus.eu/browser).
Shishaldin (United States) — December 2023 Cite this Report
Shishaldin
United States
54.756°N, 163.97°W; summit elev. 2857 m
All times are local (unless otherwise noted)
New eruption with significant Strombolian explosions, ash plumes, and ashfall
Shishaldin is located on the eastern half of Unimak Island, one of the Aleutian Islands. Frequent explosive activity, primarily consisting of Strombolian ash eruptions from the small summit crater, but sometimes producing lava flows, has been recorded since the 18th century. The previous eruption ended in May 2020 and was characterized by intermittent thermal activity, increased seismicity and surface temperatures, ash plumes, and ash deposits (BGVN 45:06). This report covers a new eruption during July through November 2023, which consisted of significant explosions, ash plumes, ashfall, and lava fountaining. Information comes from daily, weekly, and special reports from the Alaska Volcano Observatory (AVO) and various satellite data. AVO monitors the volcano using local seismic and infrasound sensors, satellite data, web cameras, and remote infrasound and lightning networks.
AVO reported that intermittent tremor and low-frequency earthquakes had gradually become more regular and consistent during 10-13 July. Strongly elevated surface temperatures at the summit were identified in satellite images during 10-13 July. On 11 July AVO raised the Aviation Color Code (ACC) to Yellow (the second color on a four-color scale) and Volcano Alert Level (VAL) to Advisory (the second level on a four-level scale) at 1439. Later in the day on 11 July summit crater incandescence was observed in webcam images. Observations of the summit suggested that lava was likely present at the crater, which prompted AVO to raise the ACC to Orange (the second highest color on a four-color scale) and the VAL to Watch (the second highest level on a four-level scale). The US Coast Guard conducted an overflight on 12 July and confirmed that lava was erupting from the summit. That same day, sulfur dioxide emissions were detected in satellite images.
A significant explosion began at 0109 on 14 July that produced an ash plume that rose to 9-12 km altitude and drifted S over the Pacific Ocean (figure 43). Webcam images and photos taken around 0700 from a ship SW off Unimak Island showed small lahar deposits, which were the result of the interaction of hot pyroclastic material and snow and ice on the flanks. There was also ashfall on the SW and N flanks. A smaller explosion at 0710 generated an ash plume that rose to 4.5 km altitude. Webcam images and pilot reports showed continued low-level ash emissions during the morning, rising to less than 4.6 km altitude; those emissions included a small ash plume near the summit around 1030 resulting from a small explosion.
Seismic tremor amplitude began increasing at around 1700 on 15 July; strongly elevated surface temperatures were also reported. An ash plume rose to 4.6 km altitude and drifted SSE at 2100, based on a satellite image. A continuous ash plume during 2150 through 2330 rose to 5 km altitude and extended 125 km S. At 2357 AVO raised the ACC to Red (the highest color on a four-color scale) and the VAL to Warning (the highest level on a four-level scale), noting that seismicity remained elevated for more than six hours and explosion signals were frequently detected by regional infrasound (pressure sensor) networks. Explosions generated an ash plume that rose to 4.9 km altitude and drifted as far as 500 km SE. Activity throughout the night declined and by 0735 the ACC was lowered to Orange and the VAL to Watch. High-resolution satellite images taken on 16 July showed pyroclastic deposits extending as far as 3 km from the vent; these deposits generated lahars that extended further down the drainages on the flanks. Ash deposits were mainly observed on the SSE flank and extended to the shore of Unimak Island. During 16-17 July lava continued to erupt at the summit, which caused strongly elevated surface temperatures that were visible in satellite imagery.
Lava effusion increased at 0100 on 18 July, as noted in elevated surface temperatures identified in satellite data, increasing seismic tremor, and activity detected on regional infrasound arrays. A significant ash plume at 0700 rose to 7 km altitude and continued until 0830, eventually reaching 9.1 km altitude and drifting SSE (figure 44). As a result, the ACC was raised to Red and the VAL to Warning. By 0930 the main plume detached, but residual low-level ash emissions continued for several hours, remaining below 3 km altitude and drifting S. The eruption gradually declined and by 1208 the ACC was lowered to Orange and the VAL was lowered to Watch. High-resolution satellite images showed ash deposits on the SW flank and pyroclastic deposits on the N, E, and S flanks, extending as far as 3 km from the vent; lahars triggered by the eruption extended farther down the flanks (figure 45). Lava continued to erupt from the summit crater on 19 July.
Elevated surface temperatures were detected in satellite images during 19-25 July, despite occasional weather cloud cover, which was consistent with increased lava effusion. During 22-23 July satellite observations acquired after the eruption from 18 July showed pyroclastic flow and lahar deposits extending as far as 3 km down the N, NW, and NE flanks and as far as 1.5 km down the S and SE flanks. Ash deposits covered the SW and NE flanks. No lava flows were observed outside the crater. On 22 July a sulfur dioxide plume was detected in satellite data midday that had an estimated mass of 10 kt. In a special notice issued at 1653 on 22 July AVO noted that eruptive activity had intensified over the previous six hours, which was characterized by an hours-long steady increase in seismic tremor, intermittent infrasound signals consistent with small explosions, and an increase in surface temperatures that were visible in satellite data. Pilots first reported low-level ash plumes at around 1900. At 2320 an ash plume had risen to 9 km altitude based on additional pilot reports and satellite images. The ACC was increased to Red and the VAL to Warning at 2343. Satellite images indicated growth of a significantly higher ash plume that rose to 11 km altitude continued until 0030 and drifted NE. During the early morning hours of 23 July ash plumes had declined to 4.6 k altitude. Seismic tremor peaked at 0030 on 23 July and began to rapidly decline at 0109; active ash emissions were no longer visible in satellite data by 0130. The ACC was lowered to Orange and the VAL to Watch at 0418; bursts of increased seismicity were recorded throughout the morning, but seismicity generally remained at low levels. Elevated surface temperatures were visible in satellite data until about 0600. On 24 July pilots reported seeing vigorous gas-and-steam plumes rising to about 3 km altitude; the plumes may have contained minor amounts of ash.
During 24-25 July low level seismicity and volcanic tremor were detected at low levels following the previous explosion on 23 July. Strongly elevated surface temperatures were observed at the summit crater in satellite data. Around 2200 on 25 July seismicity began to increase, followed by infrasound signals of explosions after 0200 on 26 July. An ash plume rose to 3 km altitude at 0500 and drifted ENE, along with an associated sulfur dioxide plume that drifted NE and had an estimated mass of 22 kt. Diffuse ash emissions were visible in satellite data and rose to 6.1-7.6 km altitude and extended 125 km from the volcano starting around 1130. These ash events were preceded by about seven hours of seismic tremor, infrasound detections of explosions, and five hours of increased surface temperatures visible in satellite data. Activity began to decline around 1327, which included low-frequency earthquakes and decreased volcanic tremor, and infrasound data no longer detected significant explosions. Surface temperatures remained elevated through the end of the month.
Seismicity, volcanic tremor, and ash emissions remained at low levels during early August. Satellite images on 1 August showed that some slumping had occurred on the E crater wall due to the recent explosive activity. Elevated surface temperatures continued, which was consistent with cooling lava. On 2 August small explosive events were detected, consistent with low-level Strombolian activity. Some episodes of volcanic tremor were reported, which reflected low-level ash emissions. Those ash emissions rose to less than 3 km altitude and drifted as far as 92.6 km N. Pilots that were located N of the volcano observed an ash plume that rose to 2.7 km altitude. Seismicity began to increase in intensity around 0900 on 3 August. Seismicity continued to increase throughout the day and through the night with strongly elevated surface temperatures, which suggested that lava was active at the surface.
An ash cloud that rose to 7.6-7.9 km altitude and drifted 60-75 km NE was visible in a satellite image at 0520 on 4 August. Pilots saw and reported the plume at 0836 (figure 46). By 0900 the plume had risen to 9.1 km altitude and extended over 100 km NE. AVO raised the ACC to Red and the VAL to Warning as a result. Seismic tremor levels peaked at 1400 and then sharply declined at 1500 to slightly elevated levels; the plume was sustained during the period of high tremor and drifted N and NE. The ACC was lowered to Orange and the VAL to Watch at 2055. During 5-14 August seismicity remained low and surface temperatures were elevated based on satellite data due to cooling lava. On 9 August a small lava flow was observed that extended from the crater rim to the upper NE flank. It had advanced to 55 m in length and appeared in satellite imagery on 11 August. Occasional gas-and-steam plumes were noted in webcam images. At 1827 AVO noted that seismic tremor had steadily increased during the afternoon and erupting lava was visible at the summit in satellite images.
Strong explosion signals were detected at 0200 on 15 August. An ash cloud that was visible in satellite data extended 100 km NE and may have risen as high as 11 km altitude around 0240. By 0335 satellite images showed the ash cloud rising to 7.6 km altitude and drifting NE. Significant seismicity and explosions were detected by the local AVO seismic and infrasound networks, and volcanic lightning was detected by the World Wide Lightning Location Network (WWLLN). A sulfur dioxide plume associated with the eruption drifted over the S Bering Sea and parts of Alaska and western Canada. Seismicity was significantly elevated during the eruption but had declined by 1322. A pilot reported that ash emissions continued, rising as high as 4.9 km altitude. Elevated surface temperatures detected in satellite data were caused by hot, eruptive material (pyroclastic debris and lava) that accumulated around the summit. Eruptive activity declined by 16 August and the associated sulfur dioxide plume had mostly dissipated; remnants continued to be identified in satellite images at least through 18 August. Surface temperatures remained elevated based on satellite images, indicating hot material on the upper parts of the volcano. Small explosions were detected in infrasound data on the morning of 19 August and were consistent with pilot reports of small, short-lived ash plumes that rose to about 4.3 km altitude. Low-level explosive activity was reported during 20-24 August, according to seismic and infrasound data, and weather clouds sometimes prevented views. Elevated surface temperatures were observed in satellite images, which indicated continued hot material on the upper parts of the volcano.
Seismic tremor began to increase at around 0300 on 25 August and was followed by elevated surface temperatures identified in satellite images, consistent with erupting lava. Small explosions were recorded in infrasound data. The ACC was raised to Red and the VAL to Warning at 1204 after a pilot reported an ash plume that rose to 9.1 km altitude. Seismicity peaked at 1630 and began to rapidly decline at around 1730. Ash plumes rose as high as 10 km altitude and drifted as far as 400 km NE. By 2020 the ash plumes had declined to 6.4 km altitude and continued to drift NE. Ash emissions were visible in satellite data until 0000 on 26 August and seismicity was at low levels. AVO lowered the ACC to Orange and the VAL to Watch at 0030. Minor explosive activity within the summit crater was detected during 26-28 August and strongly elevated surface temperatures were still visible in satellite imagery through the rest of the month. An AVO field crew working on Unimak Island observed a mass flow that descended the upper flanks beginning around 1720 on 27 August. The flow produced a short-lived ash cloud that rose to 4.5 km altitude and rapidly dissipated. The mass flow was likely caused by the collapse of spatter that accumulated on the summit crater rim.
Similar variable explosive activity was reported in September, although weather observations sometimes prevented observations. A moderate resolution satellite image from the afternoon of 1 September showed gas-and-steam emissions filling the summit crater and obscuring views of the vent. In addition, hot deposits from the previous 25-26 August explosive event were visible on the NE flank near the summit, based on a 1 September satellite image. On 2 and 4 September seismic and infrasound data showed signals of small, repetitive explosions. Variable gas-and-steam emissions from the summit were visible but there was no evidence of ash. Possible summit crater incandescence was visible in nighttime webcam images during 3-4 September.
Seismicity began to gradually increase at around 0300 on 5 September and activity escalated at around 0830. A pilot reported an ash plume that rose to 7.6 km altitude at 0842 and continued to rise as high as possibly 9.7 km altitude and drifted SSE based on satellite images (figure 47). The ACC was raised to Red and the VAL to Warning at 0900. In addition to strong tremor and sustained explosions, the eruption produced volcanic lightning that was detected by the WWLLN. Around 1100 seismicity decreased and satellite data confirmed that the altitude of the ash emissions had declined to 7.6 km altitude. By 1200 the lower-altitude portion of the ash plume had drifted 125 km E. Significant ash emissions ended by 1330 based on webcam images. The ACC was lowered to Orange and the VAL to Watch at 1440. Satellite images showed extensive pyroclastic debris flows on most of the flanks that extended 1.2-3.3 km from the crater rim.
During 6-13 September elevated surface temperatures continued to be observed in satellite data, seismicity remained elevated with weak but steady tremor, and small, low-frequency earthquakes and small explosions were reported, except on 12 September. On 6 September a low-level ash plume rose to 1.5-1.8 km altitude and drifted SSE. Occasional small and diffuse gas-and-steam emissions at the summit were visible in webcam images. Around 1800 on 13 September seismic tremor amplitudes began to increase, and small explosions were detected in seismic and infrasound data. Incandescent lava at the summit was seen in a webcam image taken at 0134 on 14 September during a period of elevated tremor. No ash emissions were reported during the period of elevated seismicity. Lava fountaining began around 0200, based on webcam images. Satellite-based radar observations showed that the lava fountaining activity led to the growth of a cone in the summit crater, which refilled most of the crater. By 0730 seismicity significantly declined and remained at low levels.
Seismic tremor began to increase around 0900 on 15 September and rapidly intensified. An explosive eruption began at around 1710, which prompted AVO to raise the ACC to Red and the VAL to Warning. Within about 30 minutes ash plumes drifted E below a weather cloud at 8.2 km altitude. The National Weather Service estimated that an ash-rich plume rose as high as 12.8 km altitude and produced volcanic lightning. The upper part of the ash plume detached from the vent around 1830 and drifted E, and was observed over the Gulf of Alaska. Around the same time, seismicity dramatically decreased. Trace ashfall was reported in the community of False Pass (38 km ENE) between 1800-2030 and also in King Cove and nearby marine waters. Activity declined at around 1830 although seismicity remained elevated, ash emissions, and ashfall continued until 2100. Lightning was again detected beginning around 1930, which suggested that ash emissions continued. Ongoing explosions were detected in infrasound data, at a lower level than during the most energetic phase of this event. Lightning was last detected at 2048. By 2124 the intensity of the eruption had decreased, and ash emissions were likely rising to less than 6.7 km altitude. Seismicity returned to pre-eruption levels. On 16 September the ACC was lowered to Orange and the VAL to Watch at 1244; the sulfur dioxide plume that was emitted from the previous eruption event was still visible over the northern Pacific Ocean. Elevated surface temperatures, gas-and-steam emissions from the vent, and new, small lahars were reported on the upper flanks based on satellite and webcam images. Minor deposits were reported on the flanks which were likely the result of collapse of previously accumulated lava near the summit crater.
Elevated seismicity with tremor, small earthquakes, and elevated surface temperatures were detected during 17-23 September. Minor gas-and-steam emissions were visible in webcam images. On 20 September small volcanic debris flows were reported on the upper flanks. On 21 September a small ash deposit was observed on the upper flanks extending to the NE based on webcam images. Seismic tremor increased significantly during 22-23 September. Regional infrasound sensors suggested that low-level eruptive activity was occurring within the summit crater by around 1800 on 23 September. Even though seismicity was at high levels, strongly elevated surface temperatures indicating lava at the surface were absent and no ash emissions were detected; weather clouds at 0.6-4.6 km altitude obscured views. At 0025 on 24 September AVO noted that seismicity continued at high levels and nearly continuous small infrasound signals began, likely from low-level eruptive activity. Strongly elevated surface temperatures were identified in satellite images by 0900 and persisted throughout the day; the higher temperatures along with infrasound and seismic data were consistent with lava erupting at the summit. Around 1700 similarly elevated surface temperatures were detected from the summit in satellite data, which suggested that more vigorous lava fountaining had started. Starting around 1800 low-level ash emissions rose to altitudes less than 4.6 km altitude and quickly dissipated.
Beginning at midnight on 25 September, a series of seismic signals consistent with volcanic flows were recorded on the N side of the volcano. A change in seismicity and infrasound signals occurred around 0535 and at 0540 a significant ash cloud formed and quickly reached 14 km altitude and drifted E along the Alaska Peninsula. The cloud generated at least 150 lightning strokes with thunder that could be heard by people in False Pass. Seismicity rapidly declined to near background levels around 0600. AVO increased the ACC to Red and the VAL to Warning at 0602. The ash cloud detached from the volcano at around 0700, rose to 11.6 km altitude, and drifted ESE. Trace to minor amounts of ashfall were reported by the communities of False Pass, King Cove, Cold Bay, and Sand Point around 0700. Ash emissions continued at lower altitudes of 6-7.6 km altitude at 0820. Small explosions at the vent area continued to be detected in infrasound data and likely represented low-level eruptive activity near the vent. Due to the significant decrease in seismicity and ash emissions the ACC was lowered to Orange and the VAL to Watch at 1234. Radar data showed significant collapses of the crater that occurred on 25 September. Satellite data also showed significant hot, degassing pyroclastic and lahar deposits on all flanks, including more extensive flows on the ENE and WSW sections below two new collapse scarps. Following the significant activity during 24-25 September, only low-level activity was observed. Seismicity decreased notably near the end of the strong activity on 25 September and continued to decrease through the end of the month, though tremor and small earthquakes were still reported. No explosive activity was detected in infrasound data through 2 October. Gas-and-steam emissions rose to 3.7 km altitude, as reported by pilots and seen in satellite images. Satellite data from 26 September showed that significant collapses had occurred at the summit crater and hot, steaming deposits from pyroclastic flows and lahars were present on all the flanks, particularly to the ENE and WSW. A small ash cloud was visible in webcam images on 27 September, likely from a collapse at the summit cone. High elevated surface temperatures were observed in satellite imagery during 27-28 September, which were likely the result of hot deposits on the flanks erupted on 25 September. Minor steaming at the summit crater and from an area on the upper flanks was visible in webcam images on 28 September.
During October, explosion events continued between periods of low activity. Seismicity significantly increased starting at around 2100 on 2 October; around the same time satellite images showed an increase in surface temperatures consistent with lava fountaining. Small, hot avalanches of rock and lava descended an unspecified flank. In addition, a distinct increase in infrasound, seismicity, and lightning detections was followed by an ash plume that rose to 12.2 km altitude and drifted S and E at 0520 on 3 October, based on satellite images. Nighttime webcam images showed incandescence due to lava fountaining at the summit and pyroclastic flows descending the NE flank. AVO reported that a notable explosive eruption started at 0547 and lasted until 0900 on 3 October, which prompted a rise in the ACC to Red and the VAL to Warning. Subsequent ash plumes rose to 6-7.6 km altitude by 0931. At 1036 the ACC was lowered back to Orange and the VAL to Watch since both seismic and infrasound data quieted substantially and were slightly above background levels. Gas-and-steam emissions were observed at the summit, based on webcam images. Trace amounts of ashfall were observed in Cold Bay. Resuspended ash was present at several kilometers altitude near the volcano. During the afternoon, low-level ash plumes were visible at the flanks, which appeared to be largely generated by rock avalanches off the summit crater following the explosive activity. These ash plumes rose to 3 km altitude and drifted W. Trace amounts of ashfall were reported by observers in Cold Bay and Unalaska and flights to these communities were disrupted by the ash cloud. Satellite images taken after the eruption showed evidence of pyroclastic flows and lahar deposits in drainages 2 km down the SW flank and about 3.2 km down the NE flank, and continued erosion of the crater rim. Small explosion craters at the end of the pyroclastic flows on the NE flank were noted for the first time, which may have resulted from gas-and-steam explosions when hot deposits interact with underlying ice.
During 4 October seismicity, including frequent small earthquakes, remained elevated, but was gradually declining. Ash plumes were produced for over eight hours until around 1400 that rose to below 3.7 km altitude. These ash plumes were primarily generated off the sides of the volcano where hot rock avalanches from the crater rim had entered drainages to the SW and NE. Two explosion craters were observed at the base of the NE deposits about 3.2 km from the crater rim. Webcam images showed the explosion craters were a source of persistent ash emissions; occasional collapse events also generated ash. Seismicity remained elevated with sulfur dioxide emissions that had a daily average of more than 1,000 tons per day, and frequent small earthquakes through the end of the month. Frequent elevated surface temperatures were identified in satellite images and gas-and-steam plumes were observed in webcam images, although weather conditions occasionally prevented clear views of the summit. Emissions were robust during 14-16 October and were likely generated by the interaction of hot material and snow and ice. During the afternoon of 21 October a strong gas-and-steam plume rose to 3-4.6 km altitude and extended 40 km WSW, based on satellite images and reports from pilots. On 31 October the ACC was lowered to Yellow and the VAL was lowered to Advisory.
Activity in November was characterized by elevated seismicity with ongoing seismic tremor and small, low-frequency earthquakes, elevated surface temperatures, and gas-and-steam emissions. There was an increase in seismic and infrasound tremor amplitudes starting at 1940 on 2 November. As a result, the ACC was again raised to Orange and the VAL was increased to Watch, although ash was not identified in satellite data. An ash cloud rose to 6.1 km altitude and drifted W according to satellite data at 2000. By 0831 on 3 November ash emissions were no longer visible in satellite images. On 6 and 9 November air pressure sensors detected signals consistent with small explosions. Small explosions were detected in infrasound data consistent with weak Strombolian activity on 19 and 21 November. Seismicity started to decrease on 21 November. On 25 November gas-and-steam emissions were emitted from the vent as well as from a scarp on the NE side of the volcano near the summit. A gas-and-steam plume extended about 50 km SSE and was observed in satellite and webcam images on 26 November. On 28 November small explosions were observed in seismic and local infrasound data and gas-and-steam emissions were visible from the summit and from the upper NE collapse scarp based on webcam images. Possible small explosions were observed in infrasound data on 30 November. Weakly elevated surface temperatures and a persistent gas-and-steam plume from the summit and collapse scarps on the upper flanks. A passing aircraft reported the gas-and-steam plume rose to 3-3.4 km altitude on 30 November, but no significant ash emissions were detected.
Satellite data. MODIS thermal anomaly data provided through MIROVA (Middle InfraRed Observation of Volcanic Activity) showed a strong pulse of thermal activity beginning in July 2023 that continued through November 2023 (figure 48). This strong activity was due to Strombolian explosions and lava fountaining events at the summit crater. According to data from MODVOLC thermal alerts, a total of 101 hotspots were detected near the summit crater in July (11-14, 16-19, 23-24 and 26), August (4, 25-26, and 29), September (5, 12, and 17), and October (3, 4, and 8). Infrared satellite data showed large lava flows descending primarily the northern and SE flanks during the reporting period (figure 49). Sulfur dioxide plumes often exceeded two Dobson Units (DUs) and drifted in different directions throughout the reporting period, based on satellite data from the TROPOMI instrument on the Sentinel-5P satellite (figure 50).
Geologic Background. The symmetrical glacier-covered Shishaldin in the Aleutian Islands is the westernmost of three large stratovolcanoes in the eastern half of Unimak Island. The Aleuts named the volcano Sisquk, meaning "mountain which points the way when I am lost." Constructed atop an older glacially dissected edifice, it is largely basaltic in composition. Remnants of an older edifice are exposed on the W and NE sides at 1,500-1,800 m elevation. There are over two dozen pyroclastic cones on its NW flank, which is covered by massive aa lava flows. Frequent explosive activity, primarily consisting of Strombolian ash eruptions from the small summit crater, but sometimes producing lava flows, has been recorded since the 18th century. A steam plume often rises from the summit crater.
Information Contacts: Alaska Volcano Observatory (AVO), a cooperative program of a) U.S. Geological Survey, 4200 University Drive, Anchorage, AK 99508-4667 USA (URL: https://avo.alaska.edu/), b) Geophysical Institute, University of Alaska, PO Box 757320, Fairbanks, AK 99775-7320, USA, and c) Alaska Division of Geological & Geophysical Surveys, 794 University Ave., Suite 200, Fairbanks, AK 99709, USA (URL: http://dggs.alaska.gov/); MIROVA (Middle InfraRed Observation of Volcanic Activity), a collaborative project between the Universities of Turin and Florence (Italy) supported by the Centre for Volcanic Risk of the Italian Civil Protection Department (URL: http://www.mirovaweb.it/); Hawai'i Institute of Geophysics and Planetology (HIGP) - MODVOLC Thermal Alerts System, School of Ocean and Earth Science and Technology (SOEST), Univ. of Hawai'i, 2525 Correa Road, Honolulu, HI 96822, USA (URL: http://modis.higp.hawaii.edu/); NASA Global Sulfur Dioxide Monitoring Page, Atmospheric Chemistry and Dynamics Laboratory, NASA Goddard Space Flight Center (NASA/GSFC), 8800 Greenbelt Road, Goddard, Maryland, USA (URL: https://so2.gsfc.nasa.gov/); Copernicus Browser, Copernicus Data Space Ecosystem, European Space Agency (URL: https://dataspace.copernicus.eu/browser/).
Ioto
Japan
24.751°N, 141.289°E; summit elev. 169 m
All times are local (unless otherwise noted)
New eruption with discolored water, ejecta, and floating pumice during October-December 2023
Ioto (Iwo-jima), located about 1,200 km S of Tokyo, lies within a 9-km-wide submarine caldera along the Izu-Bonin-Mariana volcanic arc. Previous eruptions date back to 1889 and have consisted of dominantly phreatic explosions, pumice deposits during 2001, and discolored water. A submarine eruption during July through December 2022 was characterized by discolored water, pumice deposits, and gas emissions (BGVN 48:01). This report covers a new eruption during October through December 2023, which consisted of explosions, black ejecta, discolored water, and floating pumice, based on information from the Japan Meteorological Association (JMA), the Japan Coast Guard (JCG), and satellite data.
JMA reported that an eruption had been occurring offshore of Okinahama on the SE side of the island since 21 October, which was characterized by volcanic tremor, according to the Japan Maritime Self-Defense Force (JMSDF) Iwo Jima Air Base (figure 22). According to an 18 October satellite image a plume of discolored water at the site of this new eruption extended NE (figure 23). During an overflight conducted on 30 October, a vent was identified about 1 km off the coast of Okinahama. Observers recorded explosions every few minutes that ejected dark material about 20 m above the ocean and as high as 150 m. Ejecta from the vent formed a black-colored island about 100 m in diameter, according to observations conducted from the air by the Earthquake Research Institute of the University of Tokyo in cooperation with the Mainichi newspaper (figure 24). Occasionally, large boulders measuring more than several meters in size were also ejected. Observations from the Advanced Land Observing Satellite Daichi-2 and Sentinel-2 satellite images also confirmed the formation of this island (figure 23). Brown discolored water and floating pumice were present surrounding the island.
The eruption continued during November. During an overflight on 3 November observers photographed the island and noted that material was ejected 169 m high, according to a news source. Explosions gradually became shorter, and, by the 3rd, they occurred every few seconds; dark and incandescent material were ejected about 800 m above the vent. On 4 November eruptions were accompanied by explosive sounds. Floating, brown-colored pumice was present in the water surrounding the island. There was a brief increase in the number of volcanic earthquakes during 8-14 November and 24-25 November. The eruption temporarily paused during 9-11 November and by 12 November eruptions resumed to the W of the island. On 10 November dark brown-to-dark yellow-green discolored water and a small amount of black floating material was observed (figure 25). A small eruption was reported on 18 November off the NE coast of the island, accompanied by white gas-and-steam plumes (figure 23). Another pause was recorded during 17-19 November, which then resumed on 20 November and continued erupting intermittently. According to a field survey conducted by the National Institute for Disaster Prevention Science and Technology on 19 November, a 30-m diameter crater was visible on the NE coast where landslides, hot water, and gray volcanic ash containing clay have occurred and been distributed previously. Erupted blocks about 10 cm in diameter were distributed about 90-120 m from the crater. JCG made observations during an overflight on 23 November and reported a phreatomagmatic eruption. Explosions at the main vent generated dark gas-and-ash plumes that rose to 200 m altitude and ejected large blocks that landed on the island and in the ocean (figure 26). Discolored water also surrounded the island. The size of the new island had grown to 450 m N-S x 200 m E-W by 23 November, according to JCG.
The eruption continued through 11 December, followed by a brief pause in activity, which then resumed on 31 December, according to JMA. Intermittent explosions produced 100-m-high black plumes at intervals of several minutes to 30 minutes during 1-10 December. Overflights were conducted on 4 and 15 December and reported that the water surrounding the new island was discolored to dark brown-to-dark yellow-green (figure 27). No floating material was reported during this time. In comparison to the observations made on 23 November, the new land had extended N and part of it had eroded away. In addition, analysis by the Geospatial Information Authority of Japan using SAR data from Daichi-2 also confirmed that the area of the new island continued to decrease between 4 and 15 December. Ejected material combined with wave erosion transformed the island into a “J” shape, 500-m-long and with the curved part about 200 m offshore of Ioto. The island was covered with brown ash and blocks, and the surrounding water was discolored to greenish-brown and contained an area of floating pumice. JCG reported from an overflight on 4 December that volcanic ash-like material found around the S vent on the NE part of the island was newly deposited since 10 November (figure 28). By 15 December the N part of the “J” shaped island had separated and migrated N, connecting to the Okinahama coast and the curved part of the “J” had eroded into two smaller islands (figure 27).
References. Ukawa, M., Fujita, E., Kobayashi, T., 2002, Recent volcanic activity of Iwo Jima and the 2001 eruption, Monthly Chikyu, Extra No. 39, 157-164.
Geologic Background. Ioto, in the Volcano Islands of Japan, lies within a 9-km-wide submarine caldera. The volcano is also known as Ogasawara-Iojima to distinguish it from several other "Sulfur Island" volcanoes in Japan. The triangular, low-elevation, 8-km-long island narrows toward its SW tip and has produced trachyandesitic and trachytic rocks that are more alkalic than those of other volcanoes in this arc. The island has undergone uplift for at least the past 700 years, accompanying resurgent doming of the caldera; a shoreline landed upon by Captain Cook's surveying crew in 1779 is now 40 m above sea level. The Motoyama plateau on the NE half of the island consists of submarine tuffs overlain by coral deposits and forms the island's high point. Many fumaroles are oriented along a NE-SW zone cutting through Motoyama. Numerous recorded phreatic eruptions, many from vents on the W and NW sides of the island, have accompanied the uplift.
Information Contacts: Japan Meteorological Agency (JMA), 1-3-4 Otemachi, Chiyoda-ku, Tokyo 100-8122, Japan (URL: http://www.jma.go.jp/jma/indexe.html); Japan Coast Guard (JCG) Volcano Database, Hydrographic and Oceanographic Department, 3-1-1, Kasumigaseki, Chiyoda-ku, Tokyo 100-8932, Japan (URL: https://www1.kaiho.mlit.go.jp/GIJUTSUKOKUSAI/kaiikiDB/kaiyo22-2.htm); Copernicus Browser, Copernicus Data Space Ecosystem, European Space Agency (URL: https://dataspace.copernicus.eu/browser/); Asahi, 5-3-2, Tsukiji, Chuo Ward, Tokyo, 104-8011, Japan (URL: https://www.asahi.com/ajw/articles/15048458).
Purace (Colombia) — December 2023 Cite this Report
Purace
Colombia
2.3095°N, 76.3948°W; summit elev. 4650 m
All times are local (unless otherwise noted)
Gas-and-ash emission on 16 November 2023
Puracé, located in Colombia, is a stratovolcano that contains a 500-m-wide summit crater. It is part of the Los Coconucos volcanic chain that is a NW-SE trending group of seven cones and craters. The most recent eruption occurred during March 2022 that was characterized by frequent seismicity and gas-and-steam emissions (BGVN 47:06). This report covers a brief eruption during November 2023 based on monthly reports from the Popayán Observatory, part of the Servicio Geologico Colombiano (SGC).
Activity during November 2022 through November 2023 primarily consisted of seismicity: VT-type events, LP-type events, HB-type events, and TR-type events (table 4). Maximum sulfur dioxide values were measured weekly and ranged from 259-5,854 tons per day (t/d) during November 2022 through April 2023. White gas-and-steam emissions were also occasionally reported.
SGC issued a report on 25 October that noted a significant increase in the number of earthquakes associated with rock fracturing. These earthquakes were located SE of the crater between Puracé and Piocollo at depths of 1-4 km. There were no reported variations in sulfur dioxide values, but SGC noted high carbon dioxide values, compared to those recorded in the first half of 2023.
SGC reported that at 1929 on 16 November the seismic network detected a signal that was possibly associated with a gas-and-ash emission, though it was not confirmed in webcam images due to limited visibility. On 17 November an observer confirmed ash deposits on the N flank. Webcam images showed an increase in degassing both inside the crater and from the NW flank, rising 700 m above the crater.
Table 4. Seismicity at Puracé during November 2022-November 2023. Volcano-tectonic (VT), long-period (LP), hybrid (HB), and tremor (TR) events are reported each month. Courtesy of SGC.
| Month |
Volcano-tectonic |
Long-period |
Hybrid |
Tremor |
| Nov 2022 |
429 |
2,023 |
5 |
831 |
| Dec 2022 |
423 |
1,390 |
9 |
834 |
| Jan 2023 |
719 |
1,622 |
0 |
957 |
| Feb 2023 |
598 |
1,701 |
2 |
1,124 |
| Mar 2023 |
331 |
2,408 |
147 |
607 |
| Apr 2023 |
614 |
4,427 |
33 |
148 |
| May 2023 |
620 |
3,717 |
170 |
109 |
| Jun 2023 |
467 |
3,293 |
86 |
148 |
| Jul 2023 |
1,116 |
5,809 |
183 |
542 |
| Aug 2023 |
692 |
2,927 |
94 |
321 |
| Sep 2023 |
887 |
1,505 |
82 |
848 |
| Oct 2023 |
2,373 |
2,949 |
135 |
692 |
| Nov 2023 |
1,212 |
2,302 |
69 |
293 |
Geologic Background. Puracé is an active andesitic volcano with a 600-m-diameter summit crater at the NW end of the Los Coconucos Volcanic Chain. This volcanic complex includes nine composite and five monogenetic volcanoes, extending from the Puracé crater more than 6 km SE to the summit of Pan de Azúcar stratovolcano. The dacitic massif which the complex is built on extends about 13 km NW-SE and 10 km NE-SW. Frequent small to moderate explosive eruptions reported since 1816 CE have modified the morphology of the summit crater, with the largest eruptions in 1849, 1869, and 1885.
Information Contacts: Servicio Geologico Colombiano (SGC), Diagonal 53 No. 34-53 - Bogotá D.C., Colombia (URL: https://www.sgc.gov.co/volcanes).
Suwanosejima (Japan) — December 2023 Cite this Report
Suwanosejima
Japan
29.638°N, 129.714°E; summit elev. 796 m
All times are local (unless otherwise noted)
Eruption plumes, crater incandescence, and occasional explosions during July-October 2023
Suwanosejima is an 8-km-long island that consists of a stratovolcano and two active summit craters, located in the northern Ryukyu Islands, Japan. Volcanism over the past century has been characterized by Strombolian explosions, ash plumes, and ashfall. The current eruption began in October 2004 and has more recently consisted of frequent eruption plumes, explosions, and incandescent ejecta (BGVN 48:07). This report covers similar activity of ash plumes, explosions, and crater incandescence during July through October 2023 using monthly reports from the Japan Meteorological Agency (JMA) and satellite data.
Thermal activity during the reporting period was relatively low; only one low-power thermal anomaly was detected during mid-July and one during early August, based on a MIROVA (Middle InfraRed Observation of Volcanic Activity) Log Radiative Power graph of the MODIS thermal anomaly data. On two clear weather days, a thermal anomaly was visible in infrared satellite images (figure 81).
Low-level activity was reported at the Otake crater during July and no explosions were detected. Eruption plumes rose as high as 1.8 km above the crater. On 13 July an ash plume rose 1.7 km above the crater rim, based on a webcam image. During the night of the 28th crater incandescence was visible in a webcam image. An eruptive event reported on 31 July produced an eruption plume that rose 2.1 km above the crater. Seismicity consisted of 11 volcanic earthquakes on the W flank, the number of which had decreased compared to June (28) and 68 volcanic earthquakes near the Otake crater, which had decreased from 722 in the previous month. According to observations conducted by the University of Tokyo Graduate School of Science, Kyoto University Disaster Prevention Research Institute, Toshima Village, and JMA, the amount of sulfur dioxide emissions released during the month was 400-800 tons per day (t/d).
Eruptive activity in the Otake crater continued during August and no explosions were reported. An eruptive event produced a plume that rose 1 km above the crater at 1447 on 12 August. Subsequent eruptive events were recorded at 0911 on 16 August, at 1303 on 20 August, and at 0317 on 21 August, which produced ash plumes that rose 1-1.1 km above the crater and drifted SE, SW, and W. On 22 August an ash plume was captured in a webcam image rising 1.4 km above the crater (figure 82). Multiple eruptive events were detected on 25 August at 0544, 0742, 0824, 1424, and 1704, which generated ash plumes that rose 1.1-1.2 km above the crater and drifted NE, W, and SW. On 28 August a small amount of ashfall was observed as far as 1.5 km from the crater. There were 17 volcanic earthquakes recorded on the W flank of the volcano and 79 recorded at the Otake crater during the month. The amount of sulfur dioxide emissions released during the month was 400-800 t/d.
Activity continued at the Otake crater during September. Occasionally, nighttime crater incandescence was observed in webcam images and ashfall was reported. An eruptive event at 1949 on 4 September produced an ash plume that rose 1 km above the crater and drifted SW. On 9 September several eruption events were detected at 0221, 0301, and 0333, which produced ash plumes that rose 1.1-1.4 km above the crater rim and drifted W; continuous ash emissions during 0404-0740 rose to a maximum height of 2 km above the crater rim (figure 83). More eruptive events were reported at 1437 on 10 September, at 0319 on 11 September, and at 0511 and 1228 on 15 September, which generated ash plumes that rose 1-1.8 km above the crater. During 25, 27, and 30 September, ash plumes rose as high as 1.3 km above the crater rim. JMA reported that large blocks were ejected as far as 300 m from the center of the crater. There were 18 volcanic earthquakes detected beneath the W flank and 82 volcanic earthquakes detected near the Otake crater. The amount of sulfur dioxide released during the month ranged from 600 to 1,600 t/d.
Activity during early-to-mid-October consisted of occasional explosions, a total number of 13, and ash plumes that rose as high as 1.9 km above the Otake crater rim on 29 October (figure 84). These explosions are the first to have occurred since June 2023. Continuous ash emissions were reported during 0510-0555 on 1 October. Explosions were recorded at 0304, 2141, and 2359 on 2 October, at 0112 on 3 October, and at 1326 on 6 October, which produced ash plumes that rose as high as 1 km above the crater rim and drifted SW and W. An explosion was noted at 0428 on 3 October, but emission details were unknown. A total of eight explosions were recorded by the seismic network at 1522 on 14 October, at 0337, 0433, 0555, 1008, and 1539 on 15 October, and at 0454 and 0517 on 16 October. Ash plumes from these explosions rose as high as 900 m above the crater and drifted SE. Eruptive events during 25-27 and 29-30 October generated plumes that rose as high as 1.9 km above the crater and drifted SE, S, and SW. Ash was deposited in Toshima village (3.5 km SSW). Eruptive activity occasionally ejected large volcanic blocks as far as 600 m from the crater. Nighttime crater incandescence was visible in webcams. Intermittent ashfall was reported as far as 1.5 km from the crater. There were 43 volcanic earthquakes detected on the W flank during the month, and 184 volcanic earthquakes detected near the Otake crater. The amount of sulfur dioxide emitted ranged between 400 and 900 t/d.
Geologic Background. The 8-km-long island of Suwanosejima in the northern Ryukyu Islands consists of an andesitic stratovolcano with two active summit craters. The summit is truncated by a large breached crater extending to the sea on the E flank that was formed by edifice collapse. One of Japan's most frequently active volcanoes, it was in a state of intermittent Strombolian activity from Otake, the NE summit crater, between 1949 and 1996, after which periods of inactivity lengthened. The largest recorded eruption took place in 1813-14, when thick scoria deposits covered residential areas, and the SW crater produced two lava flows that reached the western coast. At the end of the eruption the summit of Otake collapsed, forming a large debris avalanche and creating an open collapse scarp extending to the eastern coast. The island remained uninhabited for about 70 years after the 1813-1814 eruption. Lava flows reached the eastern coast of the island in 1884. Only about 50 people live on the island.
Information Contacts: Japan Meteorological Agency (JMA), 1-3-4 Otemachi, Chiyoda-ku, Tokyo 100-8122, Japan (URL: http://www.jma.go.jp/jma/indexe.html); MIROVA (Middle InfraRed Observation of Volcanic Activity), a collaborative project between the Universities of Turin and Florence (Italy) supported by the Centre for Volcanic Risk of the Italian Civil Protection Department (URL: http://www.mirovaweb.it/); Hawai'i Institute of Geophysics and Planetology (HIGP) - MODVOLC Thermal Alerts System, School of Ocean and Earth Science and Technology (SOEST), Univ. of Hawai'i, 2525 Correa Road, Honolulu, HI 96822, USA (URL: http://modis.higp.hawaii.edu/); Copernicus Browser, Copernicus Data Space Ecosystem, European Space Agency (URL: https://dataspace.copernicus.eu/browser/).
Etna
Italy
37.748°N, 14.999°E; summit elev. 3357 m
All times are local (unless otherwise noted)
Strombolian explosions, lava fountains, and lava flows during July-August 2023
Etna, located on the Italian island of Sicily, has had documented eruptions dating back to 1500 BCE. Activity typically originates from multiple cones at the summit, where several craters have formed and evolved. The currently active craters are Northeast Crater (NEC), Voragine (VOR), and Bocca Nuova (BN), and the Southeast Crater (SEC); VOR and BN were previously referred to as the “Central Crater”. The original Southeast crater formed in 1978, and a second eruptive site that opened on its SE flank in 2011 was named the New Southeast Crater (NSEC). Another eruptive site between the SEC and NSEC developed during early 2017 and was referred to as the "cono della sella" (saddle cone). The current eruption period began in November 2022 and has been characterized by intermittent Strombolian activity, lava flows, and ash plumes (BGVN 48:08). This report updates activity during July through October 2023, which includes primarily gas-and-steam emissions; during July and August Strombolian explosions, lava fountains, and lava flows were reported, based on weekly and special reports by the Osservatorio Etneo (OE), part of the Catania Branch of Italy's Istituo Nazionale di Geofisica e Vulcanologica (INGV) and satellite data.
Variable fumarolic degassing was reported at all summit craters (BN, VOR, NEC, and SEC) throughout the entire reporting period (table 15). The MIROVA (Middle InfraRed Observation of Volcanic Activity) volcano hotspot detection system based on the analysis of MODIS data showed frequent low-to-moderate power thermal anomalies during the reporting period (figure 399). During mid-August there was a pulse in activity that showed an increase in the power of the anomalies due to Strombolian activity, lava fountains, and lava flows. Infrared satellite imagery captured strong thermal anomalies at the central and southeast summit crater areas (figure 400). Accompanying thermal activity were occasional sulfur dioxide plumes that exceeded 2 Dobson Units (DUs) recorded by the TROPOMI instrument on the Sentinel-5P satellite (figure 401).
Table 15. Summary of activity at the four primary crater areas at the summit of Etna during July-October 2023. Information is from INGV weekly reports.
| Month |
Bocca Nuova (BN) |
Voragine (VOR) |
Northeast Crater (NEC) |
Southeast Crater (SEC) |
| Jul 2023 |
Continuous degassing. |
No observations. |
Weak gas emissions. |
Continuous degassing. Sporadic and weak-to-moderate ash emissions. Strombolian explosions. |
| Aug 2023 |
Continuous degassing. |
No observations. |
No observations. |
Continuous degassing. Occasional ash emissions. Strombolian activity, lava fountaining, and lava flows. |
| Sep 2023 |
Variable degassing. Crater incandescence. |
Weak fumarolic activity. |
Weak fumarolic activity. |
Variable degassing. |
| Oct 2023 |
Continuous degassing. |
Weak fumarolic activity. |
Weak fumarolic activity. |
Continuous degassing. |
Activity during July and August was relatively low and mainly consisted of degassing at the summit craters, particularly at SEC and BN. Cloudy weather prevented clear views of the summit during early July. During the night of 2 July some crater incandescence was visible at SEC. Explosive activity resumed at SEC during 9-10 July, which was characterized by sporadic and weak ash emissions that rapidly dispersed in the summit area (figure 402). INGV reported moderate Strombolian activity began at 2034 on 14 July and was confined to the inside of the crater and fed by a vent located in the E part of SEC. An ash emission was detected at 2037. A new vent opened on 15 July in the SE part of BN and began to produce continuous gas-and-steam emissions. During an inspection carried out on 28 July pulsating degassing, along with audible booms, were reported at two active vents in BN. Vigorous gas-and-steam emissions intermittently generated rings. On rare occasions, fine, reddish ash was emitted from BN1 and resuspended by the gas-and-steam emissions.
Around 2000 on 13 August INGV reported a sudden increase in volcanic tremor amplitude. Significant infrasonic activity coincided with the tremor increase. Incandescent flashes were visible through the cloud cover in webcam images of SEC (figure 403). Strombolian activity at SEC began to gradually intensify starting at 2040 as seismicity continued to increase. The Aviation Color Code (ACC) was raised to Yellow (the second lowest-level on a four-color scale) at 2126 and then to Orange (the second highest-level on a four-color scale) at 2129 due to above-background activity. The activity rapidly transitioned from Strombolian activity to lava fountains around 2333 that rose 300-400 m above the crater (figure 403). Activity was initially focused on the E vent of the crater, but then the vent located above the S flank of the cone also became active. A lava flow from this vent traveled SW into the drainage created on 10 February 2022, overlapping with previous flows from 10 and 21 February 2022 and 21 May 2023, moving between Monte Barbagallo and Monte Frumento Supino (figure 404). The lava flow was 350 m long, oriented NNE-SSW, and descended to an elevation of 2.8 km. Flows covered an area of 300,000 m2 and had an estimated volume of 900,000 m3. The ACC was raised to Red at 2241 based on strong explosive activity and ashfall in Rifugio Sapienza-Piano Vetore at 1.7 km elevation on the S flank. INGV reported that pyroclastic flows accompanied this activity.
Activity peaked between 0240 and 0330 on 14 August, when roughly 5-6 vents erupted lava fountains from the E to SW flank of SEC. The easternmost vents produced lava fountains that ejected material strongly to the E, which caused heavy fallout of incandescent pyroclastic material on the underlying flank, triggering small pyroclastic flows. This event was also accompanied by lightning both in the ash column and in the ash clouds that were generated by the pyroclastic flows. A fracture characterized by a series of collapse craters (pit craters) opened on the upper SW flank of SEC. An ash cloud rose a few kilometers above the crater and drifted S, causing ash and lapilli falls in Rifugio Sapienza and expanding toward Nicolosi, Mascalucia, Catania, and up to Syracuse. Ashfall resulted in operational problems at the Catania airport (50 km S), which lasted from 0238 until 2000. By 0420 the volcanic tremor amplitude values declined to background levels. After 0500 activity sharply decreased, although the ash cloud remained for several hours and drifted S. By late morning, activity had completely stopped. The ACC was lowered to Orange as volcanic ash was confined to the summit area. Sporadic, minor ash emissions continued throughout the day. At 1415 the ACC was lowered to Yellow and then to Green at 1417.
During the night of 14-15 August only occasional flashes were observed, which were more intense during avalanches of material inside the eruptive vents. Small explosions were detected at SEC at 2346 on 14 August and at 0900 on 26 August that each produced ash clouds which rapidly dispersed into the atmosphere (figure 405). According to a webcam image, an explosive event detected at 2344 at SEC generated a modest ash cloud that was rapidly dispersed by winds. The ACC was raised to Yellow at 2355 on 14 August due to increasing unrest and was lowered to Green at 0954 on 15 August.
Activity during September and October was relatively low and mainly characterized by variable degassing from BN and SEC. Intense, continuous, and pulsating degassing was accompanied by roaring sounds and flashes of incandescence at BN both from BN1 and the new pit crater that formed during late July (figure 406). The degassing from the new pit crater sometimes emitted vapor rings. Cloudy weather during 6-8 September prevented observations of the summit craters .
Geologic Background. Mount Etna, towering above Catania on the island of Sicily, has one of the world's longest documented records of volcanism, dating back to 1500 BCE. Historical lava flows of basaltic composition cover much of the surface of this massive volcano, whose edifice is the highest and most voluminous in Italy. The Mongibello stratovolcano, truncated by several small calderas, was constructed during the late Pleistocene and Holocene over an older shield volcano. The most prominent morphological feature of Etna is the Valle del Bove, a 5 x 10 km caldera open to the east. Two styles of eruptive activity typically occur, sometimes simultaneously. Persistent explosive eruptions, sometimes with minor lava emissions, take place from one or more summit craters. Flank vents, typically with higher effusion rates, are less frequently active and originate from fissures that open progressively downward from near the summit (usually accompanied by Strombolian eruptions at the upper end). Cinder cones are commonly constructed over the vents of lower-flank lava flows. Lava flows extend to the foot of the volcano on all sides and have reached the sea over a broad area on the SE flank.
Information Contacts: Sezione di Catania - Osservatorio Etneo, Istituto Nazionale di Geofisica e Vulcanologia (INGV), Sezione di Catania, Piazza Roma 2, 95123 Catania, Italy (URL: http://www.ct.ingv.it/it/); MIROVA (Middle InfraRed Observation of Volcanic Activity), a collaborative project between the Universities of Turin and Florence (Italy) supported by the Centre for Volcanic Risk of the Italian Civil Protection Department (URL: http://www.mirovaweb.it/); NASA Global Sulfur Dioxide Monitoring Page, Atmospheric Chemistry and Dynamics Laboratory, NASA Goddard Space Flight Center (NASA/GSFC), 8800 Greenbelt Road, Goddard MD 20771, USA (URL: https://so2.gsfc.nasa.gov/); Copernicus Browser, Copernicus Data Space Ecosystem, European Space Agency (URL: https://dataspace.copernicus.eu/browser/).
Aira
Japan
31.5772°N, 130.6589°E; summit elev. 1117 m
All times are local (unless otherwise noted)
Explosions, ash plumes, ash fall, and crater incandescence during July-October 2023
Aira caldera, located in the northern half of Kagoshima Bay, Japan, contains the post-caldera Sakurajima volcano. Eruptions typically originate from the Minamidake crater, and since the 8th century, ash deposits have been recorded in the city of Kagoshima (10 km W), one of Kyushu’s largest cities. The Minamidake summit cone and crater has had persistent activity since 1955; the Showa crater on the E flank has also been intermittently active since 2006. The current eruption period began during March 2017 and has recently been characterized by intermittent explosions, eruption plumes, and ashfall (BGVN 48:07). This report updates activity during July through October 2023 and describes explosive events, ash plumes, nighttime crater incandescence, and ashfall, according to monthly activity reports from the Japan Meteorological Agency (JMA) and satellite data.
Thermal activity remained at low levels during this reporting period, according to the MIROVA (Middle InfraRed Observation of Volcanic Activity) system (figure 149). There was a slight increase in the number of anomalies during September through October. Occasional thermal anomalies were visible in infrared satellite images mainly at the Minamidake crater (Vent A is located to the left and Vent B is located to the right) (figure 150).
Table 30. Number of monthly explosive events, days of ashfall, area of ash covered, and sulfur dioxide emissions from Sakurajima’s Minamidake crater at Aira during July-October 2023. Note that smaller ash events are not listed. Ashfall days were measured at Kagoshima Local Meteorological Observatory and ashfall amounts represent material covering all the Kagoshima Prefecture. Data courtesy of JMA monthly reports.
| Month |
Explosive events |
Days of ashfall |
Ashfall amount (g/m2) |
SO2 emissions (tons/day) |
| Jul 2023 |
3 |
0 |
0 |
1,600-3,200 |
| Aug 2023 |
3 |
10 |
7 |
1,800-3,300 |
| Sep 2023 |
3 |
7 |
3 |
1,600-2,300 |
| Oct 2023 |
33 |
8 |
61 |
2,200-4,200 |
JMA reported that during July, there were eight eruptions, three of which were explosion events in the Showa crater. Large blocks were ejected as far as 600 m from the Showa crater. Very small eruptions were occasionally reported at the Minamidake crater. Nighttime incandescence was observed in both the Showa and Minamidake crater. Explosions were reported on 16 July at 2314 and on 17 July at 1224 and at 1232 (figure 151). Resulting eruption plumes rose 700-2,500 m above the crater and drifted N. On 23 July the number of volcanic earthquakes on the SW flank of the volcano increased. A strong Mw 3.1 volcanic earthquake was detected at 1054 on 26 July. The number of earthquakes recorded throughout the month was 545, which markedly increased from 73 in June. No ashfall was observed at the Kagoshima Regional Meteorological Observatory during July. According to a field survey conducted during the month, the daily amount of sulfur dioxide emissions was 1,600-3,200 tons per day (t/d).
There were three eruptions reported at the Minamidake crater during August, each of which were explosive. The explosions occurred on 9 August at 0345, on 13 August at 2205, and on 31 August at 0640, which generated ash plumes that rose 800-2,000 m above the crater and drifted W. There were two eruptions detected at Showa crater; on 4 August at 2150 ejecta traveled 800 m from the Showa crater and associated eruption plumes rose 2.3 km above the crater. The explosion at 2205 on 13 August generated an ash plume that rose 2 km above the crater and was accompanied by large blocks that were ejected 600 m from the Minamidake crater (figure 152). Nighttime crater incandescence was visible in a high-sensitivity surveillance camera at both craters. Seismicity consisted of 163 volcanic earthquakes, 84 of which were detected on the SW flank. According to the Kagoshima Regional Meteorological Observatory there was a total of 7 g/m2 of ashfall over the course of 10 days during the month. According to a field survey, the daily amount of sulfur dioxide emitted was 1,800-3,300 t/d.
During September, four eruptions were reported, three of which were explosion events. These events occurred at 1512 on 9 September, at 0018 on 11 September, and at 2211 on 13 September. Resulting ash plumes generally rose 800-1,100 m above the crater. An explosion produced an ash plume at 2211 on 13 September that rose as high as 1.7 km above the crater. Large volcanic blocks were ejected 600 m from the Minamidake crater. Smaller eruptions were occasionally observed at the Showa crater. Nighttime crater incandescence was visible at the Minamidake crater. Seismicity was characterized by 68 volcanic earthquakes, 28 of which were detected beneath the SW flank. According to the Kagoshima Regional Meteorological Observatory there was a total of 3 g/m2 of ashfall over the course of seven days during the month. A field survey reported that the daily amount of sulfur dioxide emitted was 1,600-2,300 t/d.
Eruptive activity during October consisted of 69 eruptions, 33 of which were described as explosive. These explosions occurred during 4 and 11-21 October and generated ash plumes that rose 500-3,600 m above the crater and drifted S, E, SE, and N. On 19 October at 1648 an explosion generated an ash plume that rose 3.6 km above the crater (figure 153). No eruptions were reported in the Showa crater; white gas-and-steam emissions rose 100 m above the crater from a vent on the N flank. Nighttime incandescence was observed at the Minamidake crater. On 24 October an eruption was reported from 0346 through 0430, which included an ash plume that rose 3.4 km above the crater. Ejected blocks traveled 1.2 km from the Minamidake crater. Following this eruption, small amounts of ashfall were observed from Arimura (4.5 km SE) and a varying amount in Kurokami (4 km E) (figure 154). The number of recorded volcanic earthquakes during the month was 190, of which 14 were located beneath the SW flank. Approximately 61 g/m2 of ashfall was reported over eight days of the month. According to a field survey, the daily amount of sulfur dioxide emitted was 2,200-4,200 t/d.
Geologic Background. The Aira caldera in the northern half of Kagoshima Bay contains the post-caldera Sakurajima volcano, one of Japan's most active. Eruption of the voluminous Ito pyroclastic flow accompanied formation of the 17 x 23 km caldera about 22,000 years ago. The smaller Wakamiko caldera was formed during the early Holocene in the NE corner of the caldera, along with several post-caldera cones. The construction of Sakurajima began about 13,000 years ago on the southern rim and built an island that was joined to the Osumi Peninsula during the major explosive and effusive eruption of 1914. Activity at the Kitadake summit cone ended about 4,850 years ago, after which eruptions took place at Minamidake. Frequent eruptions since the 8th century have deposited ash on the city of Kagoshima, located across Kagoshima Bay only 8 km from the summit. The largest recorded eruption took place during 1471-76.
Information Contacts: Japan Meteorological Agency (JMA), 1-3-4 Otemachi, Chiyoda-ku, Tokyo 100-8122, Japan (URL: http://www.jma.go.jp/jma/indexe.html); MIROVA (Middle InfraRed Observation of Volcanic Activity), a collaborative project between the Universities of Turin and Florence (Italy) supported by the Centre for Volcanic Risk of the Italian Civil Protection Department (URL: http://www.mirovaweb.it/); Copernicus Browser, Copernicus Data Space Ecosystem, European Space Agency (URL: https://dataspace.copernicus.eu/browser/).
Nishinoshima (Japan) — November 2023 Cite this Report
Nishinoshima
Japan
27.247°N, 140.874°E; summit elev. 100 m
All times are local (unless otherwise noted)
Gray emissions during October 2023
Nishinoshima is a small island in the Ogasawara Arc, about 1,000 km S of Tokyo, Japan. It contains prominent submarine peaks to the S, W, and NE. Recorded eruptions date back to 1973, with the current eruption period beginning in October 2022. Eruption plumes and fumarolic activity characterize recent activity (BGVN 48:10). This report covers the end of the eruption for September through October 2023, based on information from monthly reports of the Japan Meteorological Agency (JMA) monthly reports, and satellite data.
No eruptive activity was reported during September 2023, although JMA noted that the surface temperature was slightly elevated compared to the surrounding area since early March 2023. The Japan Coast Guard (JCG) conducted an overflight on 20 September and reported white gas-and-steam plumes rising 3 km above the central crater of the pyroclastic cone, as well as multiple white gas-and-steam emissions emanating from the N, E, and S flanks of the crater to the coastline. In addition, dark reddish brown-to-green discolored water was distributed around almost the entire circumference of the island.
Similar low-level activity was reported during October. Multiple white gas-and-steam emissions rose from the N, E, and S flanks of the central crater of the pyroclastic cone and along the coastline; these emissions were more intense compared to the previous overflight observations. Dark reddish brown-to-green discolored water remained visible around the circumference of the island. On 4 October aerial observations by JCG showed a small eruption consisting of continuous gas-and-steam emissions emanating from the central crater, with gray emissions rising to 1.5 km altitude (figure 129). According to observations from the marine weather observation vessel Keifu Maru on 26 October, white gas-and-steam emissions persisted from the center of the pyroclastic cone, as well as from the NW, SW, and SE coasts of the island for about five minutes. Slightly discolored water was visible up to about 1 km.
Frequent low-to-moderate power thermal anomalies were recorded in the MIROVA graph (Middle InfraRed Observation of Volcanic Activity) during September (figure 130). Occasional anomalies were detected during October, and fewer during November through December. A thermal anomaly was visible in the crater using infrared satellite imagery on 6, 8, 11, 16, 18, 21, and 23 September and 8, 13, 21, 26, and 28 October (figure 131).
Geologic Background. The small island of Nishinoshima was enlarged when several new islands coalesced during an eruption in 1973-74. Multiple eruptions that began in 2013 completely covered the previous exposed surface and continued to enlarge the island. The island is the summit of a massive submarine volcano that has prominent peaks to the S, W, and NE. The summit of the southern cone rises to within 214 m of the ocean surface 9 km SSE.
Information Contacts: Japan Meteorological Agency (JMA), 1-3-4 Otemachi, Chiyoda-ku, Tokyo 100-8122, Japan (URL: http://www.jma.go.jp/jma/indexe.html); MIROVA (Middle InfraRed Observation of Volcanic Activity), a collaborative project between the Universities of Turin and Florence (Italy) supported by the Centre for Volcanic Risk of the Italian Civil Protection Department (URL: http://www.mirovaweb.it/); Copernicus Browser, Copernicus Data Space Ecosystem, European Space Agency (URL: https://dataspace.copernicus.eu/browser/).
Kilauea (United States) — October 2023 Cite this Report
Kilauea
United States
19.421°N, 155.287°W; summit elev. 1222 m
All times are local (unless otherwise noted)
Strong lava fountains, lava flows, and spatter at Halema’uma’u during January-September 2023
Kīlauea is on the island of Hawai’i and overlaps the E flank of the Mauna Loa volcano. Its East Rift Zone (ERZ) has been intermittently active for at least 2,000 years. An extended eruption period began in January 1983 and was characterized by open lava lakes and lava flows from the summit caldera and the East Rift Zone. During May 2018 magma migrated into the Lower East Rift Zone (LERZ) and opened 24 fissures along a 6-km-long NE-trending fracture zone that produced lava flows traveling in multiple directions. As lava emerged from the fissures, the lava lake at Halema'uma'u drained and explosions sent ash plumes to several kilometers altitude (BGVN 43:10).
The current eruption period started during September 2021 and has been characterized by low-level lava effusions in the active Halema’uma’u lava lake (BGVN 48:01). This report covers three notable eruption periods during February, June, and September 2023 consisting of lava fountaining, lava flows, and spatter during January through September 2023 using information from daily reports, volcanic activity notices, and abundant photo, map, and video data from the US Geological Survey's (USGS) Hawaiian Volcano Observatory (HVO).
Activity during January 2023. Small earthquake swarms were recorded on 2 January 2023; increased seismicity and changes in the pattern of deformation were noted on the morning of 5 January. At around 1500 both the rate of deformation and seismicity drastically increased, which suggested magma movement toward the surface. HVO raised the Volcano Alert Level (VAL) to Watch (the second highest level on a four-level scale) and the Aviation Color Code (ACC) to Orange (the second highest color on a four-color scale) at 1520.
Multiple lava fountains and lava effusions from vents in the central eastern portion of the Halema’uma’u crater began on 5 January around 0434; activity was confined to the eastern half of the crater and within the basin of the western half of the crater, which was the focus of the eruption in 2021-2022 (figure 525). Incandescence was visible in webcam images at 1634 on 5 January, prompting HVO to raise the VAL to Warning (the highest level on a four-level scale) and the ACC to Red (the highest color on a four-color scale). Lava fountains initially rose as high as 50 m above the vent at the onset of the eruption (figure 526) but then declined to a more consistent 5-6 m height in the proceeding days. By 1930 that same day, lava had covered most of the crater floor (an area of about 1,200,000 m2) and the lava lake had a depth of 10 m. A higher-elevation island that formed during the initial phase of the December 2020 eruption remained exposed, appearing darker in images, along with a ring of older lava around the lava lake that was active prior to December 2022. Overnight during 5-6 January the lava fountains continued to rise 5 m high, and the lava effusion rate had slowed.
On 6 January at 0815 HVO lowered the VAL to Watch and the ACC to Orange due to the declining effusion rates. Sulfur dioxide emission rates ranged from 3,000-12,500 tonnes per day (t/d), the highest value of which was recorded on 6 January. Lava continued to erupt from the vents during 6-8 January, although the footprint of the active area had shrunk; a similar progression has been commonly observed during the early stages of recent eruptions at Halema’uma’u. On 9 January HVO reported one dominant lava fountain rising 6-7 m high in the E half of the crater. Lava flows built up the margins of the lake, causing the lake to be perched. On 10 January the eastern lava lake had an area of approximately 120,000 m2 that increased to 250,000 m2 by 17 January. During 13-31 January several small overflows occurred along the margins of the E lake. A smaller area of lava was active within the basin in the W half of the crater that had been the focus of activity during 2021-2022. On 19 January just after 0200 a small ooze-out was observed on the crater’s W edge.
Activity during February 2023. Activity continued in the E part of Halema’uma’u crater, as well as in a smaller basin in the W part of the 2021-2022 lava lake (figure 527). The E lava lake contained a single lava fountain and frequent overflows. HVO reported that during the morning of 1 February the large E lava lake began to cool and crust over in the center of the lake; two smaller areas of lava were observed on the N and S sides by the afternoon. The dominant lava fountain located in the S part of the lava lake paused for roughly 45 minutes at 2315 and resumed by midnight, rising 1-2 m. At 0100 on 2 February lava from the S part was effusing across the entire E lava lake area, covering the crusted over portion in the center of the lake and continuing across the majority of the previously measured 250,000 m2 by 0400. A small lava pond near the E lake produced an overflow around 0716 on 2 February. On 3 February some lava crust began to form against the N and E levees, which defined the 250,000 m2 eastern lava lake. The small S lava fountain remained active, rising 1-6 m high during 3-9 February; around 0400 on 5 February occasional bursts doubled the height of the lava fountain.
A large breakout occurred overnight during 2100 on 4 February to 0900 on 5 February on the N part of the crater floor, equal to or slightly larger in size than the E lava lake. A second, smaller lava fountain appeared in the same area of the E lava lake between 0300 and 0700 on 5 February and was temporarily active. This large breakout continued until 7 February. A small, brief breakout was reported in the S of the E lava lake around midnight on 7 February. In the W lake, as well as the smaller lava pond in the central portion of the crater floor, contained several overflows during 7-10 February and intermittent fountaining. Activity at the S small lava pond and the small S lava fountain within the E lake declined during 9-10 February. The lava pond in the central portion of the crater floor had nearly continuous, expansive flows during 10-13 February; channels from the small central lava pond seemed to flow into the larger E lake. During 13-18 February a small lava fountain was observed in the small lava pond in the central portion of the crater floor. Continuous overflows persisted during this time.
Activity in the eastern and central lakes began to decline in the late afternoon of 17 February. By 18 February HVO reported that the lava effusions had significantly declined, and that the eastern and central lakes were no longer erupting. The W lake in the basin remained active but at a greatly reduced level that continued to decline. HVO reported that this decrease in activity is attributed to notable deflationary tilt that began early on the morning of 17 February and lasted until early 19 February. By 19 February the W lake was mostly crusted over although some weak lava flows remained, which continued through 28 February. The sulfur dioxide emission rates ranged 250-2,800 t/d, the highest value of which was recorded on 6 February.
Activity during March 2023. The summit eruption at Halema’uma’u crater continued at greatly reduced levels compared to the previous two months. The E and central vents stopped effusing lava, and the W lava lake remained active with weak lava flows; the lake was mostly crusted over, although slowly circulating lava intermittently overturned the crust. By 6 March the lava lake in the W basin had stopped because the entire surface was crusted over. The only apparent surface eruptive activity during 5-6 March was minor ooze-outs of lava onto the crater floor, which had stopped by 7 March. Several hornitos on the crater floor still glowed through 12 March according to overnight webcam images, but they did not erupt any lava. A small ooze-out of lava was observed just after 1830 in the W lava lake on 8 March, which diminished overnight. The sulfur dioxide emission rate ranged from 155-321 t/d on 21 March. The VAL was lowered to Advisory, and the ACC was lowered to Yellow (the second lowest on a four-color scale) on 23 March due to a pause in the eruption since 7 March.
Activity during April-May 2023. The eruption at Halema’uma’u crater was paused; no lava effusions were visible on the crater floor. Sulfur dioxide emission rates ranged from 75-185 t/d, the highest of which was measured on 22 April. During May and June summit seismicity was elevated compared to seismicity that preceded the activity during January.
Activity during June 2023. Earthquake activity and changes in the patterns of ground deformation beneath the summit began during the evening of 6 June. The data indicated magma movement toward the surface, prompting HVO to raise the VAL to Watch and the ACC to Orange. At about 0444 on 7 June incandescence in Halema’uma’u crater was visible in webcam images, indicating that a new eruption had begun. HVO raised the VAL to Warning and the ACC to Red (the highest color on a four-color scale). Lava flowed from fissures that had opened on the crater floor. Multiple minor lava fountains were active in the central E portion of the Halema’uma’u crater, and one vent opened on the W wall of the caldera (figure 528). The eruptive vent on the SW wall of the crater continued to effuse into the lava lake in the far SW part of the crater (figure 529). The largest lava fountain consistently rose 15 m high; during the early phase of the eruption, fountain bursts rose as high as 60 m. Lava flows inundated much of the crater floor and added about 6 m depth of new lava within a few hours, covering approximately 10,000 m2. By 0800 on 7 June lava filled the crater floor to a depth of about 10 m. During 0800-0900 the sulfur dioxide emission rate was about 65,000 t/d. Residents of Pahala (30 km downwind of the summit) reported minor deposits of fine, gritty ash and Pele’s hair. A small spatter cone had formed at the vent on the SW wall by midday, and lava from the cone was flowing into the active lava lake. Fountain heights had decreased from the onset of the eruption and were 4-9 m high by 1600, with occasional higher bursts. Inflation switched to deflation and summit earthquake activity greatly diminished shortly after the eruption onset.
At 0837 on 8 June HVO lowered the VAL to Watch and the ACC to Orange because the initial high effusion rates had declined, and no infrastructure was threatened. The surface of the lava lake had dropped by about 2 m, likely due to gas loss by the morning of 8 June. The drop left a wall of cooled lava around the margins of the crater floor. Lava fountain heights decreased during 8-9 June but continued to rise to 10 m high. Active lava and vents covered much of the W half of Halema’uma’u crater in a broad, horseshoe-shape around a central, uplifted area (figure 530). The preliminary average effusion rate for the first 24 hours of the eruption was about 150 cubic meters per second, though the estimate did not account for vesiculated lava and variations in crater floor topography. The effusion rate during the very earliest phases of the eruption appeared significantly higher than the previous three summit eruptions based on the rapid coverage of the entire crater floor. An active lava lake, also referred to as the “western lava lake” was centered within the uplifted area and was fed by a vent in the NE corner. Two small active lava lakes were located just SE from the W lava lake and in the E portion of the crater floor.
During 8-9 June the lava in the central lava lake had a thickness of approximately 1.5 m, based on measurements from a laser rangefinder. During 9-12 June the height of the lava fountains decreased to 9 m high. HVO reported that the previously active lava lake in the E part of the crater appeared stagnant during 10-11 June. The surface of the W lake rose approximately 1 m overnight during 11-12 June, likely due to the construction of a levee around it. Only a few small fountains were active during 12-13 June; the extent of the active lava had retreated so that all activity was concentrated in the SW and central parts of Halema’uma’u crater. Intermittent spattering from the vent on the SW wall was visible in overnight webcam images during 13-18 June. On the morning of 14 June a weak lava effusion originated from near the western eruptive vent, but by 15 June there were no signs of continued activity. HVO reported that other eruptive vents in the SW lava lake had stopped during this time, following several days of waning activity; lava filled the lake by about 0.5 m. Lava circulation continued in the central lake and no active lava was reported in the northern or eastern parts of the crater. Around 0800 on 15 June the top of the SW wall spatter cone collapsed, which was followed by renewed and constant spattering from the top vent and a change in activity from the base vent; several new lava flows effused from the top of the cone, as well as from the pre-existing tube-fed flow from its base. Accumulation of lava on the floor resulted in a drop of the central basin relative to the crater floor, allowing several overflows from the SW lava lake to cascade into the basin during the night of 15 June into the morning of 16 June.
Renewed lava fountaining was reported at the eruptive vent on the SW side of the crater during 16-19 June, which effused lava into the far SW part of the crater. This activity was described as vigorous during midday on 16 June; a group of observatory geologists estimated that the lava was consistently ejected at least 10 m high, with some spatter ejected even higher and farther. Deposits from the fountain further heightened and widened the spatter cone built around the original eruptive vent in the lower section of the crater wall. Multiple lava flows from the base of the cone were fed into the SW lava lake and onto the southwestern-most block from the 2018 collapse within Halema’uma’u on 17 June (figure 531); by 18 June they focused into a single flow feeding into the SW lava lake. On the morning of 19 June a second lava flow from the base of the eruptive cone advanced into the SW lava lake.
Around 1600 on 19 June there was a rapid decline in lava fountaining and effusion at the eruptive vent on the SW side of the crater; vent activity had been vigorous up to that point (figure 532). Circulation in the lava lake also slowed, and the lava lake surface dropped by several meters. Overnight webcam images showed some previously eruptive lava still flowing onto the crater floor, which continued until those flows began to cool. By 21 June no lava was erupting in Halema’uma’u crater. Overnight webcam images during 29-30 June showed some incandescence from previously erupted lava flows as they continued to cool. Seismicity in the crater declined to low levels. Sulfur dioxide emission rates ranged 160-21,000 t/d throughout the month, the highest measurement of which was recorded on 8 June. On 30 June the VAL was lowered to Advisory (the second level on a four-level scale) and the ACC was lowered to Yellow. Gradual inflation was detected at summit tiltmeters during 19-30 June.
Activity during July-August 2023. During July, the eruption paused; no lava was erupting in Halema’uma’u crater. Nighttime webcam images showed some incandescence from previously erupted lava as it continued to cool on the crater floor. During the week of 14 August HVO reported that the rate in seismicity increased, with 467 earthquakes of Mw 3.2 and smaller occurring. Sulfur dioxide emission rates remained low, ranging from 75-86 t/d, the highest of which was recorded on 10 and 15 August. On 15 August beginning at 0730 and lasting for several hours, a swarm of approximately 50 earthquakes were detected at a depth of 2-3 km below the surface and about 2 km long directly S of Halema’uma’u crater. HVO reported that this was likely due to magma movement in the S caldera region. During 0130-0500 and 1700-2100 on 21 August two small earthquake swarms of approximately 20 and 25 earthquakes, respectively, occurred at the same location and at similar depths. Another swarm of 50 earthquakes were recorded during 0430-0830 on 23 August. Elevated seismicity continued in the S area through the end of the month.
Activity during September 2023. Elevated seismicity persisted in the S summit with occasional small, brief seismic swarms. Sulfur dioxide measurements were relatively low and were 70 t/d on 8 September. About 150 earthquakes occurred during 9-10 September, and tiltmeter and Global Positioning System (GPS) data showed inflation in the S portion of the crater.
At 0252 on 10 September HVO raised the VAL to Watch and the ACC to Orange due to increased earthquake activity and changes in ground deformation that indicated magma moving toward the surface. At 1515 the summit eruption resumed in the E part of the caldera based on field reports and webcam images. Fissures opened on the crater floor and produced multiple minor lava fountains and flows (figure 533). The VAL and ACC were raised to Warning and Red, respectively. Gas-and-steam plumes rose from the fissures and drifted downwind. A line of eruptive vents stretched approximately 1.4 km from the E part of the crater into the E wall of the down dropped block by 1900. The lava fountains at the onset of the eruption had an estimated 50 m height, which later rose 20-25 m high. Lava erupted from fissures on the down dropped block and expanded W toward Halema’uma’u crater. Data from a laser rangefinder recorded about 2.5 m thick of new lava added to the W part of the crater. Sulfur dioxide emissions were elevated in the eruptive area during 1600-1500 on 10 September, measuring at least 100,000 t/d.
At 0810 on 11 September HVO lowered the VAL and ACC back to Watch and Orange due to the style of eruption and the fissure location had stabilized. The initial extremely high effusion rates had declined (but remained at high levels) and no infrastructure was threatened. An eruption plume, mainly comprised of sulfur dioxide and particulates, rose as high as 3 km altitude. Several lava fountains were active on the W side of the down dropped block during 11-15 September, while the easternmost vents on the down dropped block and the westernmost vents in the crater became inactive on 11 September (figure 534). The remaining vents spanned approximately 750 m and trended roughly E-W. The fed channelized lava effusions flowed N and W into Halema’uma’u. The E rim of the crater was buried by new lava flows; pahoehoe lava flows covered most of the crater floor except areas of higher elevation in the SW part of the crater. The W part of the crater filled about 5 m since the start of the eruption, according to data from a laser rangefinder during 11-12 September. Lava fountaining continued, rising as high as 15 m by the morning of 12 September. During the morning of 13 September active lava flows were moving on the N and E parts of the crater. The area N of the eruptive vents that had active lava on its surface became perched and was about 3 m higher than the surrounding ground surface. By the morning of 14 September active lava was flowing on the W part of the down dropped block and the NE parts of the crater. The distances of the active flows progressively decreased. Spatter had accumulated on the S (downwind) side of the vents, forming ramparts about 20 m high.
Vigorous spattering was restricted to the westernmost large spatter cone with fountains rising 10-15 m high. Minor spattering occurred within the cone to the E of the main cone, but HVO noted that the fountains remained mostly below the rim of the cone. Lava continued to effuse from these cones and likely from several others as well, traveled N and W, confined to the W part of the down-dropped block and the NE parts of Halema’uma’u. Numerous ooze-outs of lava were visible over other parts of the crater floor at night. Laser range-finder measurements taken of the W part of the crater during 14-15 September showed that lava filled the crater by 10 m since the start of the eruption. Sulfur dioxide emissions remained elevated after the onset of the eruption, ranging 20,000-190,000 t/d during the eruption activity, the highest of which occurred on 10 September.
Field crews observed the eruptive activity on 15 September; they reported a notable decrease or stop in activity at several vents. Webcam images showed little to no fountaining since 0700 on 16 September, though intermittent spattering continued from the westernmost large cone throughout the night of 15-16 September. Thermal images showed that lava continued to flow onto the crater floor. On 16 September HVO reported that the eruption stopped around 1200 and that there was no observable activity anywhere overnight or on the morning of 17 September. HVO field crews reported that active lava was no longer flowing onto Halema’uma’u crater floor and was restricted to a ponded area N of the vents on the down dropped block. They reported that spattering stopped around 1115 on 16 September. Nighttime webcam images showed some incandescence on the crater floor as lava continued to cool. Field observations supported by geophysical data showed that eruptive tremor in the summit region decreased over 15-16 September and returned to pre-eruption levels by 1700 on 16 September. Sulfur dioxide emissions were measured at a rate of 800 t/d on 16 September while the eruption was waning, and 200 t/d on 17 September, which were markedly lower compared to measurements taken the previous week of 20,000-190,000 t/d.
Geologic Background. Kilauea overlaps the E flank of the massive Mauna Loa shield volcano in the island of Hawaii. Eruptions are prominent in Polynesian legends; written documentation since 1820 records frequent summit and flank lava flow eruptions interspersed with periods of long-term lava lake activity at Halemaumau crater in the summit caldera until 1924. The 3 x 5 km caldera was formed in several stages about 1,500 years ago and during the 18th century; eruptions have also originated from the lengthy East and Southwest rift zones, which extend to the ocean in both directions. About 90% of the surface of the basaltic shield volcano is formed of lava flows less than about 1,100 years old; 70% of the surface is younger than 600 years. The long-term eruption from the East rift zone between 1983 and 2018 produced lava flows covering more than 100 km2, destroyed hundreds of houses, and added new coastline.
Information Contacts: Hawaiian Volcano Observatory (HVO), U.S. Geological Survey, PO Box 51, Hawai'i National Park, HI 96718, USA (URL: http://hvo.wr.usgs.gov/).
Tinakula (Solomon Islands) — December 2023 Cite this Report
Tinakula
Solomon Islands
10.386°S, 165.804°E; summit elev. 796 m
All times are local (unless otherwise noted)
Continued lava flows and thermal activity during June through November 2023
Tinakula is a remote 3.5 km-wide island in the Solomon Islands, located 640 km ESE of the capital, Honiara. The current eruption period began in December 2018 and has more recently been characterized by intermittent lava flows and thermal activity (BGVN 48:06). This report covers similar activity during June through November 2023 using satellite data.
During clear weather days (20 July, 23 September, 23 October, and 12 November), infrared satellite imagery showed lava flows that mainly affected the W side of the island and were sometimes accompanied by gas-and-steam emissions (figure 54). The flow appeared more intense during July and September compared to October and November. According to the MODVOLC thermal alerts, there were a total of eight anomalies detected on 19 and 21 July, 28 and 30 October, and 16 November. Infrared MODIS satellite data processed by MIROVA (Middle InfraRed Observation of Volcanic Activity) detected a small cluster of thermal activity occurring during late July, followed by two anomalies during August, two during September, five during October, and five during November (figure 55).
Geologic Background. The small 3.5-km-wide island of Tinakula is the exposed summit of a massive stratovolcano at the NW end of the Santa Cruz islands. It has a breached summit crater that extends from the summit to below sea level. Landslides enlarged this scarp in 1965, creating an embayment on the NW coast. The Mendana cone is located on the SE side. The dominantly andesitic volcano has frequently been observed in eruption since the era of Spanish exploration began in 1595. In about 1840, an explosive eruption apparently produced pyroclastic flows that swept all sides of the island, killing its inhabitants. Recorded eruptions have frequently originated from a cone constructed within the large breached crater. These have left the upper flanks and the steep apron of lava flows and volcaniclastic debris within the breach unvegetated.
Information Contacts: MIROVA (Middle InfraRed Observation of Volcanic Activity), a collaborative project between the Universities of Turin and Florence (Italy) supported by the Centre for Volcanic Risk of the Italian Civil Protection Department (URL: http://www.mirovaweb.it/); Hawai'i Institute of Geophysics and Planetology (HIGP) - MODVOLC Thermal Alerts System, School of Ocean and Earth Science and Technology (SOEST), Univ. of Hawai'i, 2525 Correa Road, Honolulu, HI 96822, USA (URL: http://modis.higp.hawaii.edu/); Copernicus Browser, Copernicus Data Space Ecosystem, European Space Agency (URL: https://dataspace.copernicus.eu/browser/).
Search Bulletin Archive by Publication Date
Select a month and year from the drop-downs and click "Show Issue" to have that issue displayed in this tab.
The default month and year is the latest issue available.
Bulletin of the Global Volcanism Network - Volume 29, Number 06 (June 2004)
Ambrym (Vanuatu)
Continued MODVOLC thermal alerts indicating activity, January 2003-May 2004
Bagana (Papua New Guinea)
MODVOLC thermal alerts peak in July 2003 and April 2004
Dukono (Indonesia)
Despite ongoing volcanism, a paucity of MODVOLC thermal alerts after 2002
Guagua Pichincha (Ecuador)
Phreatic explosions in November 2001 and October-December 2002
Kilauea (United States)
Surface lava flows and renewed ocean entries; lava tubes in June
Langila (Papua New Guinea)
Observed January 2004 lava ejections and four MODVOLC thermal alerts
Lopevi (Vanuatu)
MODVOLC thermal alerts of 4-6 pixels during 9-16 June 2003
Nyiragongo (DR Congo)
Significant ash plumes up to 6 km altitude and extending 185 km
Rabaul (Papua New Guinea)
Numerous MODVOLC thermal alerts during October 2003-January 2004
Santa Maria (Guatemala)
Continued frequent ash explosions and lava-dome collapses
Semeru (Indonesia)
Persistent seismicity and ash plumes during April-June 2004
Shishaldin (United States)
Seismic unrest and modest ash plumes in 2004
Three Sisters (United States)
March 2004 seismic swarm and continued magmatic uplift
Tinakula (Solomon Islands)
Additional MODVOLC thermal anomalies identified from January 2001
Ulawun (Papua New Guinea)
No MODVOLC thermal anomalies detected despite other observed activity
Veniaminof (United States)
Ash emissions and seismic activity from mid-February through June 2004
Yasur (Vanuatu)
Intermittent activity detected by satellite after June 2003
Ambrym
Vanuatu
16.25°S, 168.12°E; summit elev. 1334 m
All times are local (unless otherwise noted)
Continued MODVOLC thermal alerts indicating activity, January 2003-May 2004
Ambrym triggered continued alerts during 2003 and 2004 at both Marum and Benbow craters, with Marum alerts being the slightly more common (figures 12 and 13). Activity appeared less intense than in previous years, but more alerts were issued due to the availability of Aqua data starting from January 2004. The highest alert ratio (-0.088) (see BGVN 28:01 for a discussion of the alert ration) was detected by Aqua on 14 May 2004 and the highest number of alert pixels detected for any one pass was four, a situation repeated on 29 June, 21 August, and 2 November 2003. Visual observations during September 2003 (BGVN 28:09) confirmed that there was activity at these craters.
Data acquisition and analysis. Reports from Diego Coppola and David A. Rothery provided analyses of MODIS thermal alerts during 2001 and 2002 (using the MODVOLC alert-detection algorithm) extracted from the MODIS Thermal Alerts website (http://modis.hgip.hawaii.edu/) maintained by the University of Hawaii HIGP MODIS Thermal Alerts team (BGVN 28:01). Rothery and Charlotte Saunders provided updates to 31 May 2004. MODVOLC data are now routinely available from the Aqua satellite (equator crossing times 0230 and 1430 local time) in addition to the original Terra satellite (equator crossing times 1030 and 2230 local time).
Geologic Background. Ambrym is a large basaltic volcano with a 12-km-wide caldera formed during a major Plinian eruption with dacitic pyroclastic flows about 1,900 years ago. A thick, almost exclusively pyroclastic sequence, initially dacitic then basaltic, overlies lava flows of a pre-caldera shield volcano. Post-caldera eruptions, primarily from Marum and Benbow cones, have partially filled the caldera floor and produced lava flows that ponded on the floor or overflowed through gaps in the caldera rim. Post-caldera eruptions have also formed a series of scoria cones and maars along a fissure system oriented ENE-WSW. Eruptions have been frequently reported since 1774, though mostly limited to extra-caldera eruptions that would have affected local populations. Since 1950 observations of eruptive activity from cones within the caldera or from flank vents have occurred almost yearly.
Information Contacts: David A. Rothery and Charlotte Saunders, Department of Earth Sciences, The Open University, Milton Keynes, MK7 6AA, United Kingdom.
Bagana (Papua New Guinea) — June 2004 Cite this Report
Bagana
Papua New Guinea
6.137°S, 155.196°E; summit elev. 1855 m
All times are local (unless otherwise noted)
MODVOLC thermal alerts peak in July 2003 and April 2004
MODVOLC alerts occurred at the same rate as in 2001-2002 (BGVN 28:01), with quasi-continuous alerts from January 2003 to May 2004 (figure 6). These were mostly one- or two-pixel alerts with an average alert ratio of -0.712. On 21 July 2003 activity appeared to have intensified, with an alert ratio of -0.328 and three alert pixels detected. By 13 August 2003 activity was back to 'normal' levels. Then on 18 April 2004, activity picked up again, with a maximum alert ratio for this period of -0.135, along with a maximum number of four alert pixels on 22 April (Aqua satellite) and 6 May 2004 (Terra satellite).
Data acquisition and analysis. Reports from Diego Coppola and David A. Rothery provided analyses of MODIS thermal alerts during 2001 and 2002 (using the MODVOLC alert-detection algorithm) extracted from the MODIS Thermal Alerts website (http://modis.hgip.hawaii.edu/) maintained by the University of Hawaii HIGP MODIS Thermal Alerts team (BGVN 28:01). Rothery and Charlotte Saunders provided updates to 31 May 2004. MODVOLC data are now routinely available from the Aqua satellite (equator crossing times 0230 and 1430 local time) in addition to the original Terra satellite (equator crossing times 1030 and 2230 local time).
Geologic Background. Bagana volcano, in a remote portion of central Bougainville Island, is frequently active. This massive symmetrical cone was largely constructed by an accumulation of viscous andesitic lava flows. The entire edifice could have been constructed in about 300 years at its present rate of lava production. Eruptive activity is characterized by non-explosive effusion of viscous lava that maintains a small lava dome in the summit crater, although occasional explosive activity produces pyroclastic flows. Lava flows with tongue-shaped lobes up to 50 m thick and prominent levees descend the flanks on all sides.
Information Contacts: David A. Rothery and Charlotte Saunders, Department of Earth Sciences, The Open University, Milton Keynes, MK7 6AA, United Kingdom.
Dukono
Indonesia
1.6992°N, 127.8783°E; summit elev. 1273 m
All times are local (unless otherwise noted)
Despite ongoing volcanism, a paucity of MODVOLC thermal alerts after 2002
Based on MODVOLC thermal alert data, Coppola and Rothery had previously reported a significant thermal event during 26 August-7 September 2002 (BGVN 28:03). This was the first sign of activity at Dukono since the inception of MODVOLC data in May 2000. Subsequent reports from the Volcanological Survey of Indonesia and the Darwin VAAC (BGVN 28:06, 28:09, and 28:11) documented ash eruptions in February and June-December 2003.
An updated analysis of MODVOLC data covering the period August 2000-April 2004 confirmed the August-September 2002 event by the addition of thermal alerts from NASA's Aqua satellite (26 August, 6 and 7 September 2002), but found very little sign of activity subsequently throughl the end of April 2004. During the whole period since September 2002 the only thermal alerts were single-pixel events, only slightly above the MODVOLC detection threshold, on 1 March and 10 November 2003. Inspection of raw MODIS data revealed an additional anomaly on 17 November 2003 with an alert ratio slightly below the MODVOLC detection threshold. The scarcity of thermal alerts at Dukono despite recurrent ash eruptions indicated the general invisibility (or small size) of any hot feature at the source, such as an incandescent vent or lava dome.
Data acquisition and analysis. Reports from Diego Coppola and David A. Rothery provided analyses of MODIS thermal alerts during 2001 and 2002 (using the MODVOLC alert-detection algorithm) extracted from the MODIS Thermal Alerts website (http://modis.hgip.hawaii.edu/) maintained by the University of Hawaii HIGP MODIS Thermal Alerts team (BGVN 28:01). Rothery and Charlotte Saunders provided updates to 31 May 2004. MODVOLC data are now routinely available from the Aqua satellite (equator crossing times 0230 and 1430 local time) in addition to the original Terra satellite (equator crossing times 1030 and 2230 local time).
Geologic Background. The Dukono complex in northern Halmahera is on an edifice with a broad, low profile containing multiple peaks and overlapping craters. Almost continuous explosive eruptions, sometimes accompanied by lava flows, have occurred since 1933. During a major eruption in 1550 CE, a lava flow filled in the strait between Halmahera and the Gunung Mamuya cone, 10 km NE. Malupang Wariang, 1 km SW of the summit crater complex, contains a 700 x 570 m crater that has also had reported eruptions.
Information Contacts: David A. Rothery and Charlotte Saunders, Department of Earth Sciences, The Open University, Milton Keynes, MK7 6AA, United Kingdom.
Guagua Pichincha (Ecuador) — June 2004 Cite this Report
Guagua Pichincha
Ecuador
0.171°S, 78.598°W; summit elev. 4784 m
All times are local (unless otherwise noted)
Phreatic explosions in November 2001 and October-December 2002
This report is a summary of notable activity at Guagua Pichincha since September 2001 (BGVN 26:09). On 26 November 2001, seismic data indicated that an ~ 20-minute-long phreatic explosion began around noon and that continuous tremor was recorded for ~ 16 hours after the eruption. This was the first explosion since 25 May 2001 (BGVN 26:09). Seismic signals from a relatively high number of rockfalls were also recorded. Two new craters were formed N of the 1981 crater by the 26 November 2001 event. Volcanic and seismic activity returned to low levels after 27 November, with only low-level fumarolic activity occurring.
The next event of note occurred on 11 October 2002 following 6 months with no explosions, as reported by the El Universo newspaper. Four phreatic eruptions were presumably triggered by groundwater encountering the magmatic system after several days of heavy rainfall. The eruption sent ballistic blocks to distances of 100-200 m from the vent. Subsequently, long-period and volcano-tectonic earthquakes and continuous background tremor were recorded until 17 October.
The Washington VAAC reported explosions at 2056 and 2115 on 3 November 2002 and at 2120 on 7 December. The Washington VAAC was unable to determine the heights of the plumes produced from the explosions in November, or state if they contained ash, because ash was already in the atmosphere from a large eruption that day at Reventador, ~ 100 km E of Guagua Pichincha.
On 17 April 2003, the Instituto Geofísico (IG) detected seismic signals indicating a possible minor eruption, but there were no visual signs of ash venting. Similar seismic signals in the previous few days were thought to result from outgassing. Several volcano-tectonic earthquakes, one long-period earthquake, and seismic signals of rockfalls were also reported. During the week of 23-29 April 2003, seismic unrest continued. Typically several earthquakes were detected per day, but 16 long-period earthquakes occurred on 26 April. Subsequently, the volcano exhibited low-to-moderate seismicity, including two earthquakes with M < 3 on 30 April and 1 May. Both had epicenters within an earthquake swarm centered N of Quito. Episodes of harmonic tremor appeared, most noteworthy on 4 and 5 May, with each episode lasting over 40 minutes. Cloud cover obscured the crater area for much of the week but improved visibility on 3 May enabled observers to see fumaroles sending condensate up to heights of 100 m.
During the afternoon of 7 January 2004, strong rains occurred and seismic signals attributed to rockfalls and lahars were recorded. A visit to the area by IG scientists on 13 January confirmed that a lahar had traveled down the NNE wall of the volcano's crater. In addition, there were small fractures in the SE sector of the volcano and in the crater but IG noted that this activity did not indicate a change in volcanic activity at Guagua Pichincha.
Geologic Background. Guagua Pichincha and the older Pleistocene Rucu Pichincha stratovolcanoes form a broad volcanic massif that rises immediately W of Ecuador's capital city, Quito. A lava dome grew at the head of a 6-km-wide scarp formed during a late-Pleistocene slope failure ~50,000 years ago. Subsequent late-Pleistocene and Holocene eruptions from the central vent consisted of explosive activity with pyroclastic flows accompanied by periodic growth and destruction of the lava dome. Many minor eruptions have been recorded since the mid-1500's; the largest took place in 1660, when ash fell over a 1,000 km radius and accumulated to 30 cm depth in Quito. Pyroclastic flows and surges also occurred, primarily to then W, and affected agricultural activity.
Information Contacts: Instituto Geofísico (IG), Escuela Politécnica Nacional, Apartado 17-01-2759, Quito, Ecuador (URL: http://www.igepn.edu.ec/); Washington Volcanic Ash Advisory Center (VAAC), Satellite Analysis Branch, NOAA/NESDIS E/SP23, NOAA Science Center Room 401, 5200 Auth Road, Camp Springs, MD 20746, USA (URL: http://www.ssd.noaa.gov/).
Kilauea (United States) — June 2004 Cite this Report
Kilauea
United States
19.421°N, 155.287°W; summit elev. 1222 m
All times are local (unless otherwise noted)
Surface lava flows and renewed ocean entries; lava tubes in June
During mid-2004 lava flows erupting from Kīlauea once again began reaching the ocean, where they slowly added new land to the SE coast of Hawai`i Island (figure 164). Lava began spilling into the ocean on 30-31 May 2004. Nearly a year before that, on 9 July 2003, the lava tube system feeding flows to the ocean ceased carrying lava, which instead escaped in a series of breakouts and numerous surface flows between the Pu`u `O`o vent and the coast. Hundreds of breakouts occurred between July 2003 and May 2004 within ~ 5 km of the vent.
One of these flows, termed the Banana flow (see figure 164), started to advance down Pulama pali in April 2004. The Banana flow developed from breakouts from part of the Mother's Day lava tube, centered near the former Banana Tree kipuka (an "island" of undisturbed land completely surrounded by one or more lava flows). The breakouts became prominent in the middle of April, and lava started down Pulama pali shortly thereafter. The Banana Flow eventually reached the coastal flat on 2 May. It took nearly a month for the Banana flow to creep across the flat and enter the sea off Wilipe`a lava delta on 30 May. Interaction of the lava and water was not explosive. A spectacular set of photos of lava pouring into the ocean at this time appears on the Hawaiian Volcano Observatory website (figure 165, for example).
On 13 June, two collapses occurred at Kīlauea's lava delta along its W sector, sending sizable chunks of the delta into the sea (figure 166). On 14 June, most lava was being supplied to the ocean through lava tubes, but several surface lava flows were visible on the delta and traveling down the old sea cliff behind the Wilipe`a delta. The larger eastern part of the lava delta had several active lava entries into the ocean, in general larger than those on the western part of the delta. All vents were active in the crater of Pu`u `O`o.
Since March 2004, very weak background tremor continued at Kīlauea's summit along with a few long-period earthquakes. Tremor at Pu`u `O`o remained at its typical moderate levels through early June 2004, after which some higher levels were observed. Several episodes of inflation and deflation occurred during this time. One deflation-inflation event began 20 March and culminated 23 March with lava emerging from the S base of Pu`u `O`o cone. A weak swarm of low-frequency earthquakes and a 2-hour period of moderate-to-strong volcano tectonic earthquakes were recorded during 24-25 March.
Geologic Background. Kilauea overlaps the E flank of the massive Mauna Loa shield volcano in the island of Hawaii. Eruptions are prominent in Polynesian legends; written documentation since 1820 records frequent summit and flank lava flow eruptions interspersed with periods of long-term lava lake activity at Halemaumau crater in the summit caldera until 1924. The 3 x 5 km caldera was formed in several stages about 1,500 years ago and during the 18th century; eruptions have also originated from the lengthy East and Southwest rift zones, which extend to the ocean in both directions. About 90% of the surface of the basaltic shield volcano is formed of lava flows less than about 1,100 years old; 70% of the surface is younger than 600 years. The long-term eruption from the East rift zone between 1983 and 2018 produced lava flows covering more than 100 km2, destroyed hundreds of houses, and added new coastline.
Information Contacts: Hawaiian Volcano Observatory (HVO), U.S. Geological Survey, PO Box 51, Hawaii National Park, HI 96718, USA (URL: https://volcanoes.usgs.gov/observatories/hvo/).
Langila (Papua New Guinea) — June 2004 Cite this Report
Langila
Papua New Guinea
5.525°S, 148.42°E; summit elev. 1330 m
All times are local (unless otherwise noted)
Observed January 2004 lava ejections and four MODVOLC thermal alerts
Activity detected by MODVOLC at Langila was minimal, with only one alert pixel for 2003 (9 April) recorded just above the detection threshold, even though activity observed during January and February 2003 included weak lava projections (BGVN 28:03). Four alert pixels were recorded for 2004, on 20 (one each on Aqua and Terra), 25, and 27 January. All were 1-pixel alerts, with the highest alert ratio on 27 January at -0.764.
A thorough search of MODIS image data (i.e. original data, rather than the thresholded alert data on the MODVOLC website) was made for the period 20 May-25 October 2002, which revealed single-pixel sub-threshold thermal anomalies on Langila on a total of 25 dates, strengthening the case for the quasi-continuous or intermittent activity interpreted on the basis of MODVOLC alerts (BGVN 28:01).
Data acquisition and analysis. Reports from Diego Coppola and David A. Rothery provided analyses of MODIS thermal alerts during 2001 and 2002 (using the MODVOLC alert-detection algorithm) extracted from the MODIS Thermal Alerts website (http://modis.hgip.hawaii.edu/) maintained by the University of Hawaii HIGP MODIS Thermal Alerts team (BGVN 28:01). Rothery and Charlotte Saunders provided updates to 31 May 2004. MODVOLC data are now routinely available from the Aqua satellite (equator crossing times 0230 and 1430 local time) in addition to the original Terra satellite (equator crossing times 1030 and 2230 local time).
Geologic Background. Langila, one of the most active volcanoes of New Britain, consists of a group of four small overlapping composite basaltic-andesitic cones on the lower E flank of the extinct Talawe volcano in the Cape Gloucester area of NW New Britain. A rectangular, 2.5-km-long crater is breached widely to the SE; Langila was constructed NE of the breached crater of Talawe. An extensive lava field reaches the coast on the N and NE sides of Langila. Frequent mild-to-moderate explosive eruptions, sometimes accompanied by lava flows, have been recorded since the 19th century from three active craters at the summit. The youngest and smallest crater (no. 3 crater) was formed in 1960 and has a diameter of 150 m.
Information Contacts: David A. Rothery and Charlotte Saunders, Department of Earth Sciences, The Open University, Milton Keynes, MK7 6AA, United Kingdom.
Lopevi
Vanuatu
16.507°S, 168.346°E; summit elev. 1413 m
All times are local (unless otherwise noted)
MODVOLC thermal alerts of 4-6 pixels during 9-16 June 2003
Subsequent to the events of June 2001 (BGVN 28:01) only one further period of activity, between 9 and 16 June 2003, was indicated by MODVOLC. MODIS detected activity on 9 June 2003 first with Terra at 1135 UTC with six alert pixels, followed by Aqua at 1435 UTC, when the alert pixels had reduced in number to four. The highest alert ratio, +0.432 (unusually high ) was detected by the Aqua satellite on 13 June 2003. There were three days when the number of alert pixels reached six (on 9, 13, and 16 June 2003). These data suggested that a lava flow, previously noted as occurring on 14 June 2003 (BGVN 28:06), probably began effusion at least as early as 9 June.
Data acquisition and analysis. Reports from Diego Coppola and David A. Rothery provided analyses of MODIS thermal alerts during 2001 and 2002 (using the MODVOLC alert-detection algorithm) extracted from the MODIS Thermal Alerts website (http://modis.hgip.hawaii.edu/) maintained by the University of Hawaii HIGP MODIS Thermal Alerts team (BGVN 28:01). Rothery and Charlotte Saunders provided updates to 31 May 2004. MODVOLC data are now routinely available from the Aqua satellite (equator crossing times 0230 and 1430 local time) in addition to the original Terra satellite (equator crossing times 1030 and 2230 local time).
Geologic Background. The small 7-km-wide conical island of Lopevi, known locally as Vanei Vollohulu, is one of Vanuatu's most active volcanoes. A small summit crater containing a cinder cone is breached to the NW and tops an older cone that is rimmed by the remnant of a larger crater. The basaltic-to-andesitic volcano has been active during historical time at both summit and flank vents, primarily along a NW-SE-trending fissure that cuts across the island, producing moderate explosive eruptions and lava flows that reached the coast. Historical eruptions at the 1413-m-high volcano date back to the mid-19th century. The island was evacuated following major eruptions in 1939 and 1960. The latter eruption, from a NW-flank fissure vent, produced a pyroclastic flow that swept to the sea and a lava flow that formed a new peninsula on the western coast.
Information Contacts: David A. Rothery and Charlotte Saunders, Department of Earth Sciences, The Open University, Milton Keynes, MK7 6AA, United Kingdom.
Nyiragongo (DR Congo) — June 2004 Cite this Report
Nyiragongo
DR Congo
1.52°S, 29.25°E; summit elev. 3470 m
All times are local (unless otherwise noted)
Significant ash plumes up to 6 km altitude and extending 185 km
When last reported on, activity at Nyiragongo remained at relatively low levels, with the continued presence of an active lava lake inside the crater (BGVN 28:12). Continued activity in May and June 2004 was characterized by weak emissions that produced ash plumes to various heights.
Activity during May 2004. The Toulouse VAAC reported that satellite imagery showed a weak eruption of Nyiragongo on 21 May. Activity intensified during the evening of 24 May, with thermal anomolies and aerosol plumes visible in true- and false-color satellite imagery on 25 May (figure 32). By the evening of 25 May, the plume was no longer visible on satellite imagery due to meteorological clouds in the area. The Toulouse VAAC reported that during 26 May to 1 June there were weak but steady emissions from both Nyiragongo and neighboring Nyamuragira (~ 13 km NW of Nyiragongo). The Goma Volcano Observatory confirmed that ash fell within a radius of 60 km of both volcanoes.
Activity during June 2004. A series of plumes were noted, several to estimated altitudes of over 5 km. On 4 June a new eruption began at Nyiragongo, producing a plume that probably contained ash. It rose to ~ 6 km altitude and stretched ~ 150 km SW. By 5 June the plume extended 185 km SW and was under ~ 4 km altitude. On 6 June, satellite imagery showed only a moderate plume stretching to the SW and a disconnected remnant of the earlier plume. The moderate plume, drifting SW, remained through 7 June. An ash plume extended ~ 75 km SW at ~ 5.5 km altitude on 8 June. During 9-15 June, ash from Nyiragongo was sometimes visible on satellite imagery below ~ 5.5 km altitude drifting WSW. Satellite imagery suggested that the ash emissions that began on 4 June ceased by 22 June.
Geologic Background. The Nyiragongo stratovolcano contained a lava lake in its deep summit crater that was active for half a century before draining catastrophically through its outer flanks in 1977. The steep slopes contrast to the low profile of its neighboring shield volcano, Nyamuragira. Benches in the steep-walled, 1.2-km-wide summit crater mark levels of former lava lakes, which have been observed since the late-19th century. Two older stratovolcanoes, Baruta and Shaheru, are partially overlapped by Nyiragongo on the north and south. About 100 cones are located primarily along radial fissures south of Shaheru, east of the summit, and along a NE-SW zone extending as far as Lake Kivu. Many cones are buried by voluminous lava flows that extend long distances down the flanks, which is characterized by the eruption of foiditic rocks. The extremely fluid 1977 lava flows caused many fatalities, as did lava flows that inundated portions of the major city of Goma in January 2002.
Information Contacts: Tolouse Volcanic Ash Advisory Center (VAAC), Toulouse, Météo-France, 42 Avenue G. Coriolis, 31057 Toulouse Cedex, France (URL: http://www.meteo.fr/vaac/); Goma Volcano Observatory, Departement de Geophysique, Centre de Recherche en Sciences Naturelles, Lwiro, D.S. Bukavu, DR Congo.
Rabaul (Papua New Guinea) — June 2004 Cite this Report
Rabaul
Papua New Guinea
4.2459°S, 152.1937°E; summit elev. 688 m
All times are local (unless otherwise noted)
Numerous MODVOLC thermal alerts during October 2003-January 2004
MODVOLC alerts were still intermittent adjacent to the site of the Tavurvur cone up to the end of April 2003, with single alert pixels detected on 8 January, 31 March, and 30 April 2003 (figure 39). This was consistent with earlier reports of ground-based observations (BGVN 28:03 and 28:09), which described sub-continuous ash emissions for this period. Although there were frequent ash eruptions during March-October 2003 (BGVN 28:09), no alerts were generated by MODVOLC.
MODVOLC detection started again on 12 October 2003, when three alert pixels were recorded. Alerts were numerous through October-December 2003, concluding with six single-pixel alerts, with the last occurring on 25 January 2004. The highest alert ratio was -0.57, seen on 16 October 2003, but most of the alerts for this period were just above the detection threshold. This was consistent with previously reported observations (BGVN 28:11), although there were no ground-based observational reports of higher activity for 12-16 October when the alerts appeared most intense.
Data acquisition and analysis. Reports from Diego Coppola and David A. Rothery provided analyses of MODIS thermal alerts during 2001 and 2002 (using the MODVOLC alert-detection algorithm) extracted from the MODIS Thermal Alerts website (http://modis.hgip.hawaii.edu/) maintained by the University of Hawaii HIGP MODIS Thermal Alerts team (BGVN 28:01). Rothery and Charlotte Saunders provided updates to 31 May 2004. MODVOLC data are now routinely available from the Aqua satellite (equator crossing times 0230 and 1430 local time) in addition to the original Terra satellite (equator crossing times 1030 and 2230 local time).
Geologic Background. The low-lying Rabaul caldera on the tip of the Gazelle Peninsula at the NE end of New Britain forms a broad sheltered harbor utilized by what was the island's largest city prior to a major eruption in 1994. The outer flanks of the asymmetrical shield volcano are formed by thick pyroclastic-flow deposits. The 8 x 14 km caldera is widely breached on the east, where its floor is flooded by Blanche Bay and was formed about 1,400 years ago. An earlier caldera-forming eruption about 7,100 years ago is thought to have originated from Tavui caldera, offshore to the north. Three small stratovolcanoes lie outside the N and NE caldera rims. Post-caldera eruptions built basaltic-to-dacitic pyroclastic cones on the caldera floor near the NE and W caldera walls. Several of these, including Vulcan cone, which was formed during a large eruption in 1878, have produced major explosive activity during historical time. A powerful explosive eruption in 1994 occurred simultaneously from Vulcan and Tavurvur volcanoes and forced the temporary abandonment of Rabaul city.
Information Contacts: David A. Rothery and Charlotte Saunders, Department of Earth Sciences, The Open University, Milton Keynes, MK7 6AA, United Kingdom.
Santa Maria (Guatemala) — June 2004 Cite this Report
Santa Maria
Guatemala
14.757°N, 91.552°W; summit elev. 3745 m
All times are local (unless otherwise noted)
Continued frequent ash explosions and lava-dome collapses
Recent activity at Santa María has been characterized by weak-to-moderate explosions producing ash, crater-rim collapses and avalanches of block lava and ash, pyroclastic flows, and an active lava flow (BGVN 28:10). Activity was similar from October 2003 to June 2004, consisting mostly of explosions from Santiaguito, a lava-dome complex that includes the Caliente vent. The explosions produced ash plumes, and there were numerous block-lava-and-ash avalanches from Caliente collapses.
Activity during October-November 2003. Instituto Nacional de Sismologia, Vulcanologia, Meteorologia e Hidrologia (INSIVUMEH) reported frequent explosions during October 2003 (BGVN 28:10). The Washingon VAAC noted low-level ash plumes visible in 31 October satellite imagery.
As of 17 November, according to INSIVUMEH, several weak-to-moderate eruptions from the lava dome complex sent plumes to ~ 700 m above the crater that drifted SW. According to the Washington VAAC, a pilot saw a plume above Santa María on 16 November; the narrow plume was visible on satellite imagery extending ~ 35 km W. Small eruptions on 18 and 23 November produced local tephra fall. Small avalanches occurred on 18 November. On 24 November five explosions occurred at 1-minute intervals, producing an ash-and-gas plume that rose to 2 km above the crater and dispersed up to 12 km SSW.
On 28 November the seismic network recorded several explosions. INSIVUMEH noted that many of the explosions were followed by block-and-ash avalanches, which traveled SW and S down the Caliente dome. At least five collapses of megablocks from the S rim of the active vent generated short pyroclastic flows to the base of the Caliente dome. On 1 December ash emissions drifted SE and nearly constant avalanches occcurred in the active lava-flow area.
Activity during December 2003. During 7-9 December, frequent, small explosive eruptions expelled ash to less than 1 km above the crater that dispersed to the NW. Moderate-sized avalanches from the S and SE sides of the dome were recorded during the same time period. Weak-to-moderate explosions continued during 10-16 December. On 10 December ash mainly drifted SE toward Santa María de Jesús and las Majadas. Avalanches traveled S and SW from the fronts of lava flows. According to the Washington VAAC, on 12 December ash clouds were visible on satellite imagery at an altitude of ~ 4.5 km, drifting SW.
During 18-22 December, weak-to-moderate explosions caused plumes to drift mainly S and SE towards the Monte Claro, Monte Bello, La Florida, and El Faro fincas (ranches). Nearly constant avalanches traveled S and SW from the fronts of lava flows. Based on information from Retalhuleu airport, the Washington VAAC reported a minor emission on 18 December. No ash was visible on satellite imagery.
On 30 December more weak-to-moderate explosions sent ash-and-gas plumes 500-700 m high. They drifted SW and deposited fine ash in a mountainous region with several ranches. Avalanches continued to spall off of lava-flow fronts on the volcano's SW and S flanks and occasionally from the Caliente dome.
Activity during January 2004. According to seismic data, during 1-5 January weak-to-moderate explosions occurred, causing block-and-ash avalanches to travel 100-250 m down the volcano's SW and S flanks and the Caliente dome. Small amounts of ash fell around the volcano.
During 7-12 January, several weak-to-moderate explosions and avalanches occurred. A partial lava-dome collapse on 7 January produced avalanches down the SW flank. Many of the avalanches were moderate to strong, lasting 1-2 minutes as they traveled SW and S down Caliente dome. Explosions on 12 January produced plumes to ~ 500 m above the volcano. Ash plumes were also visible on satellite imagery several days during the report period.
On the morning of 15 January a moderate explosion at the dome caused a collapse at the edge of the crater. Volcanic material traveled down the SW flank, reaching the base. Ash rose ~ 900 m above the crater and fell on the observatory. Weak avalanches occurred in the SE portion of the lava dome. On 19 January moderate explosions occurred and avalanches descended the lava dome. The plumes produced from the explosions traveled E, depositing small amounts of fine ash around the volcano, including on the ranches of San Jose, Quina, and San Juan Patzulín.
During 21-27 January, weak-to-moderate explosions continued. Avalanches of blocks of lava and ash descended the S and SW flanks of the Caliente dome and explosions produced low-level ash plumes. Small-to-moderate explosions continued during 28 January to 2 February. During 31 January to 2 February, collapses occurred at the SW edge of the lava dome within the Caliente dome. Ash plumes rose to ~ 1 km above the lava dome, accompanied by small avalanches of blocks and ash. According to the Washington VAAC, on 2 February ash plumes were visible on satellite imagery rising to ~ 1 km above the volcano.
Activity during February 2004. During 4-9 February, small-to-moderate explosions occurred, and relatively weak avalanches traveled down Santa María's SW flank. According to the Washington VAAC, ash plumes were visible on satellite imagery on 5 February ~ 2.3 km above the volcano. INSIVUMEH reported that on the morning of 8 February, an explosion produced an ash-and-gas cloud that rose 1-1.3 km above the volcano and drifted WSW.
During 11-16 February, small-to-moderate explosions produced ash plumes to a maximum height of 1.4 km above Santa María. In addition, avalanches went down the volcano's SW flank. Explosions on 16 February deposited fine ash up to 12 km SW. Moderate explosions continued on 19 February. Plumes rose 0.7-1 km above the volcano and mainly drifted SSW as fine ash fell in the mountainous region around the volcano. On 23 February, avalanches of lava blocks and derived ash moved SW down the dome.
During 25 February to 2 March, weak-to-moderate explosions continued. Ash-and-gas plumes rose to ~ 1.4 km above the crater, and ash fell in the mountainous region around the volcano. Weak-to-moderate avalanches of volcanic material was shed from lava-flow fronts.
Activity during March 2004. During 4-9 March, small-to-medium explosions occurred, producing ash-and-gas plumes to 1.5 km above the crater. Avalanches traveled S and SW. Small-to-medium explosions continued during 10-15 March, producing ash-and-gas plumes to ~ 1.3 km above the crater. A small partial collapse on 10 March sent pyroclastic flows down the SSW flank. During the rest of the period, weak avalanches traveled S and SW.
During 15-23 March, several small-to-medium explosions produced ash-and-gas plumes to ~ 1.5 km above the crater. Incandescent avalanches traveled SW from the lava dome. In addition, ash fell in proximal areas. A partial lava-dome collapse on 17 March sent a pyroclastic flow down the volcano's flanks. Weak to moderate explosions produced plumes up to 1 km high during the week of 24-30 March. Light ashfall occurred in nearby areas on several occasions. On 25 March incandescent avalanches from the S flank of the Caliente dome flowed to the SE. Lahars descended the Nimá I river on 28 March and the Nimá I and Nimá II rivers on the evening of 29 March.
Activity during April 2004. During 31 March to 6 April, weak-to-moderate explosions continued, producing plumes to 1.3 km above the volcano. Several partial lava-dome collapses produced avalanches down the S flank. A strong explosion on 1 April caused a collapse and produced a pyroclastic flow that moved ~ 4 km SW toward the Nimá II river. On 12 April weak-to-moderate explosions sent plumes 500-800 m above the volcano. Avalanches of lava blocks and ash traveled down the S flank.
On 18 April, explosions at the lava dome produced ash-and-gas plumes that rose up to ~ 0.8 km above the vent. Small avalanches of incandescent lava also descended the SW side of the Caliente dome. On 19 April, an ash-and-gas plume rose to ~ 4.5 km altitude and drifted SW.
During 22 April-4 May, explosions produced ash-and-gas plumes that rose to ~ 1 km above the crater. Small incandescent avalanches descended the SW side of the Caliente dome. An explosion on 27 April produced a pyroclastic flow that traveled ~ 3 km to the SW.
Activity during May 2004. During 5-7 May, weak-to-moderate explosions sent ash-and-gas plumes to ~ 900 m above the crater. Small partial collapses at the edge of the Caliente dome produced incandescent avalanches to the SW. Weak-to-moderate explosions continued during 10-17 May, producing ash-and-gas plumes that rose to ~ 1 km above the crater. Small partial collapses at the edge of the Caliente dome produced incandescent avalanches to the SW. On 17 May a lahar traveled S down Nimá River I.
During 18-21 May, weak-to-moderate explosions produced ash-and-gas plumes that rose to ~ 1 km above the crater. Many of the moderate explosions were accompanied by incandescent avalanches. On 20 May aa small partial collapse at the edge of the Caliente dome produced an incandescent avalanche to the SW base of the dome. Weak-to-moderate explosions during 31 May-1 June produced ash-and-gas plumes that rose ~ 1.5 km above the crater. Small collapses at the edge of the dome sent avalanches of incandescent material down the SW flank.
Activity during June 2004. On 1 June, 33 weak to moderate explosions producing plumes up to 1.5 km above the summit were recorded. Collapses on the SW side of Caliente produced small pyroclastic flows that descended to the base of the Caliente and La Mitad domes. During 6-8 June, many weak to moderate explosions sent ash-and-gas plumes up to ~ 1.5 km above the Caliente dome, along with some avalanches and flank collapses. Moderate-volume lahars descended the Nimá Segundo river and San Isidro ravine on 1 and 6 June, respectively.
INSIVUMEH reported that on 18 June weak-to-moderate explosions sent ash plumes to 0.4-1 km above the crater. The plumes drifted W, depositing fine ash. According to the Washington VAAC, satellite imagery showed three ash emissions on the 18th that rapidly moved W, becoming more diffuse near the Mexican border. Weak-to-moderate explosions occurred during 25-29 June. Plumes rose to ~ 1 km above the crater and there were sporadic, weak avalanches. On 28 June a partial collapse sent material down the W side of Caliente dome for ~ 40 minutes.
Geologic Background. Symmetrical, forest-covered Santa María volcano is part of a chain of large stratovolcanoes that rise above the Pacific coastal plain of Guatemala. The sharp-topped, conical profile is cut on the SW flank by a 1.5-km-wide crater. The oval-shaped crater extends from just below the summit to the lower flank, and was formed during a catastrophic eruption in 1902. The renowned Plinian eruption of 1902 that devastated much of SW Guatemala followed a long repose period after construction of the large basaltic andesite stratovolcano. The massive dacitic Santiaguito lava-dome complex has been growing at the base of the 1902 crater since 1922. Compound dome growth at Santiaguito has occurred episodically from four vents, with activity progressing E towards the most recent, Caliente. Dome growth has been accompanied by almost continuous minor explosions, with periodic lava extrusion, larger explosions, pyroclastic flows, and lahars.
Information Contacts: Instituto Nacional de Sismologia, Vulcanologia, Meteorologia e Hidrologia (INSIVUMEH), Unit of Volcanology, Geologic Department of Investigation and Services, 7a Av. 14-57, Zona 13, Guatemala City, Guatemala (URL: http://www.insivumeh.gob.gt/); Washington Volcanic Ash Advisory Center (VAAC), Satellite Analysis Branch, NOAA/NESDIS E/SP23, NOAA Science Center Room 401, 5200 Auth Road, Camp Springs, MD 20746, USA (URL: http://www.ssd.noaa.gov/).
Semeru
Indonesia
8.108°S, 112.922°E; summit elev. 3657 m
All times are local (unless otherwise noted)
Persistent seismicity and ash plumes during April-June 2004
According to the Volcanological Survey of Indonesia (VSI), Semeru remained at Alert Level II (on a scale of 1-4) for the entire report period of April-June 2004. VSI characterizes Level II as "increasing seismic activity and other volcanic events and visual changes around the crater" but also states that this definition implies "no eruption is imminent." A pilot reported an 18 June ash plume rising to 6 km.
During the week of 12-18 April, tectonic earthquakes and tremor increased. Plumes sometimes containing ash were observed reaching heights of 110-400 m above the summit. Other seismic signals (including those from explosions, avalanches, and tremor) also continued. The Darwin VAAC reported that an ash plume was visible in satellite imagery on 18 April, reaching a height of ~ 4.5 km and extending ~ 90 km NW.
During 19-25 April, white-gray ash plumes were observed reaching heights of 100-400 m above the summit. The Darwin VAAC reported that an ash plume was visible in satellite imagery on 20 April, reaching a height of ~ 4.5 km and extending ~ 75 km SSE. Another plume on 21 April rose to ~ 4.6 km altitude and drifted ESE. Increases occurred in tremor as well as tectonic earthquakes, shallow-volcanic earthquakes, and explosion earthquakes. The number of avalanche signals decreased (table 16).
Table 16. Summary of seismicity at Semeru during 12 April-4 July 2004. The highest values in several categories occured during 7-13 June. Courtesy of VSI.
| Date |
Volcanic-A earthquakes |
Volcanic-B earthquakes |
Tremor |
Tectonic earthquakes |
Explosion signals |
Avalanche signals |
| 12 Apr-18 Apr 2004 |
0 |
0 |
25 |
5 |
508 |
10 |
| 19 Apr-25 Apr 2004 |
0 |
3 |
38 |
11 |
638 |
8 |
| 26 Apr-02 May 2004 |
1 |
2 |
19 |
7 |
736 |
12 |
| 03 May-09 May 2004 |
1 |
0 |
22 |
7 |
853 |
9 |
| 07 Jun-13 Jun 2004 |
2 |
9 |
34 |
15 |
902 |
22 |
| 14 Jun-20 Jun 2004 |
1 |
0 |
19 |
14 |
630 |
11 |
| 21 Jun-27 Jun 2004 |
4 |
5 |
39 |
8 |
860 |
14 |
| 28 Jun-04 Jul 2004 |
0 |
1 |
27 |
16 |
805 |
12 |
During the week of 26 April-2 May, explosion and avalanche signals increased, with continuing tremor, and volcanic earthquakes. Tremor and explosion signals increased, but avalanche signals decreased, during the week of 3-9 May. White-gray ash plumes were observed reaching heights of 300-400 m above the summit during both weeks. The Darwin VAAC reported that a thin ash plume from Semeru was visible on satellite imagery on 23 May around 0625; it reached a height of ~ 4.3 km altitude and extended ~ 110 km SSE.
An ash plume from Semeru was reported on 4 June rising to ~ 4.5 km altitude During the week of 7-13 June, a white-gray plume was observed on a clear day rising to heights of 300-400 m above the summit. Seismographs recorded an increasing number of volcanic, tectonic, and tremor earthquakes, and explosion and avalanche signals compared to the previous week. Indeed, that week was the most seismically active on the basis of most parameters, with more than 900 explosion signals and more volcanic earthquakes, tremor, and avalanche signals than any other week (table 16).
Visual observation was difficult during 14-20 June due to fog, although a white-gray plume was observed on 18 June, rising to heights of 500-600 m above the summit. Based on a pilot's report, the Darwin VAAC reported that on 18 June an ash cloud from Semeru was visible at a height of ~ 6 km altitude, extending ~ 40 km E; this was the highest recorded ash cloud during the report interval. No ash was visible on satellite imagery. The number of volcanic, tremor, and tectonic earthquakes, and explosion and avalanche signals decreased from the previous week.
Foggy weather made visual observation difficult again during the week of 21-27 June. On one clear day a white-gray ash explosion was observed rising 500-600 m above the summit. Seismographs recorded volcanic, tremor, and tectonic earthquakes, and explosion and avalanche signals. Seismicity had generally increased, except for tectonic earthquakes, compared to the previous week.
During the week of 28 June-4 July, visual observations of the summit were again difficult because of cloud cover, but a gray ash plume was observed rising to 500-600 m above the summit on one clear day. Seismographs still recorded volcanic, tremor, and tectonic earthquakes, and explosion and avalanche signals.
Geologic Background. Semeru, the highest volcano on Java, and one of its most active, lies at the southern end of a volcanic massif extending north to the Tengger caldera. The steep-sided volcano, also referred to as Mahameru (Great Mountain), rises above coastal plains to the south. Gunung Semeru was constructed south of the overlapping Ajek-ajek and Jambangan calderas. A line of lake-filled maars was constructed along a N-S trend cutting through the summit, and cinder cones and lava domes occupy the eastern and NE flanks. Summit topography is complicated by the shifting of craters from NW to SE. Frequent 19th and 20th century eruptions were dominated by small-to-moderate explosions from the summit crater, with occasional lava flows and larger explosive eruptions accompanied by pyroclastic flows that have reached the lower flanks of the volcano.
Information Contacts: Dali Ahmad, Hetty Triastuty, Nia Haerani, and Suswati, Vulcanological Survey of Indonesia (VSI), Jalan Diponegoro No. 57, Bandung 40122, Indonesia (URL: http://www.vsi.esdm.go.id/); Darwin Volcanic Ash Advisory Centre (VAAC), Bureau of Meteorology, Northern Territory Regional Office, PO Box 40050, Casuarina, NT 0811, Australia (URL: http://www.bom.gov.au/info/vaac/).
Shishaldin (United States) — June 2004 Cite this Report
Shishaldin
United States
54.756°N, 163.97°W; summit elev. 2857 m
All times are local (unless otherwise noted)
Seismic unrest and modest ash plumes in 2004
The last report on Shishaldin (BGVN 27:05) described an increase in backround seismicity in mid-May 2002. Specifically, there was an increase in shallow low-frequency earthquakes and several tremor-like signals. However, because there were no thermal anomolies visible on satellite imagery, and no reports of anomalous volcanic activity, Shishaldin remained at Concern Color Code Green.
Activity during August 2002. On 16 August 2002, the Alaska Volcano Observatory (AVO) received notification of a pilot report, via the National Weather Service (NWS) Alaska Aviation Weather Unit (AAWU), of volcanic activity. The pilot report indicated that Shishaldin appeared to be erupting, producing steam and dark clouds to 3.2 km altitude that moved to the NW-SE. A NWS observer in Cold Bay, ~ 100 km E of the volcano, reported a steam-rich plume coming from Shishaldin. As per operating policy, the AAWU issued an "eruption SIGMET" advising the aviation community of the possibility of airborne volcanic ash. Upon receiving the pilot report, the AVO immediately analyzed seismic and satellite data and determined that Shishaldin was at a normal background state and had not erupted. Further discussions with the observer in Cold Bay indicated that the steam plume was not uncommon. The last significant ash-producing eruptions of Shishaldin occurred during April-May 1999. Since that time, low-frequency seismic events and occasional steam plumes have characterized activity at the volcano. Shishaldin remained at Concern Color Code Green.
Activity during April-May 2004. The AVO raised the Concern Color Code at Shishaldin from Green to Yellow on 3 May due to unusual seismicity during the previous week. Seismicity changed from discrete earthquakes to more continuous ones, and tremor was observed for the first time since the most recent eruption ended in May 1999. Airwaves (acoustical waves traveling in air) accompanying earthquakes were recorded by the seismic network, suggesting that the source of seismicity had become more shallow. Satellite data showed no significant increase in ground temperature, nor had there been reports of increased steaming. However, AVO warned that activity at Shishaldin could increase rapidly and increased the frequency of their seismic-data analysis.
Seismic unrest continued during 30 April to 7 May, and was characterized by sequences of volcanic earthquakes and seismic tremor. The number of airwaves recorded by the seismic network diminished in comparison to the previous week, with weaker signals recorded.
Thermal anomalies at the summit were observed on satellite imagery under optimal viewing conditions. Retrospective analysis confirmed that these data, as well as similar signals observed in January 2004, were the first observed since August 2000. AVO saw no signs that an eruption was imminent. Shishaldin remained at Concern Color Code Yellow throughout the month.
During 8-14 May seismic unrest continued, characterized by sequences of volcanic earthquakes, small explosions, and seismic tremor. A weak thermal anomaly observed at the summit on 11 May was similar to those detected occasionally since January 2004. On 16 May, a pilot reported an ash plume that rose ~ 300 m above the volcano's summit. Satellite imagery from 17 May (figure 4) showed a vigorous plume, possibly containing small amounts of ash, emanating from the summit. Seismic unrest during 14-21 May was characterized by weak seismic tremor and small explosions, and during 21-28 May also included occasional discrete low-frequency earthquakes. In addition, small explosion signals were recorded by a pressure sensor. Meteorological clouds obscured views of the volcano. Satellite data acquired at 0823 UTC (0023 ADT) on 29 May showed that the crater to continue to be warmer than background temperatures.
Activity during June-July 2004. Seismic unrest continued during 18 June-2 July, characterized by weak seismic tremor and occasional discrete low-frequency earthquakes. At roughly 0800 ADT on 24 June, pilots reported steam rising at least 100 m above Shishaldin's cone. Around that time, a possible weak thermal anomaly was visible on satellite imagery. Shishaldin remained at Concern Color Code Yellow.
Geologic Background. The symmetrical glacier-covered Shishaldin in the Aleutian Islands is the westernmost of three large stratovolcanoes in the eastern half of Unimak Island. The Aleuts named the volcano Sisquk, meaning "mountain which points the way when I am lost." Constructed atop an older glacially dissected edifice, it is largely basaltic in composition. Remnants of an older edifice are exposed on the W and NE sides at 1,500-1,800 m elevation. There are over two dozen pyroclastic cones on its NW flank, which is covered by massive aa lava flows. Frequent explosive activity, primarily consisting of Strombolian ash eruptions from the small summit crater, but sometimes producing lava flows, has been recorded since the 18th century. A steam plume often rises from the summit crater.
Information Contacts: Alaska Volcano Observatory (AVO), a cooperative program of a) U.S. Geological Survey, 4200 University Drive, Anchorage, AK 99508-4667, USA (URL: http://www.avo.alaska.edu/), b) Geophysical Institute, University of Alaska, PO Box 757320, Fairbanks, AK 99775-7320, USA, and c) Alaska Division of Geological & Geophysical Surveys, 794 University Ave., Suite 200, Fairbanks, AK 99709, USA.
Three Sisters (United States) — June 2004 Cite this Report
Three Sisters
United States
44.133°N, 121.767°W; summit elev. 3159 m
All times are local (unless otherwise noted)
March 2004 seismic swarm and continued magmatic uplift
At approximately 1000 on 23 March 2004, a swarm of small earthquakes began at the Three Sisters volcanic center in the central Oregon Cascade Range. As of the morning of 24 March, the regional seismic network had detected ~ 100 earthquakes, with M ~ 1.5; by the end of the swarm, over 300 volcano-tectonic earthquakes with M ~ 1.9 were recorded (figure 3), with the rate of earthquakes peaking late on 23 March. The earthquakes occurred in the NE part of an area centered 5 km W of South Sister volcano, a zone in which the ground had been uplifted by as much as 25 cm since late 1997.
Scientists inferred that the cause of the uplift was continuing magmatic intrusion ~ 7 km below the surface. The intrusion volume was estimated at ~ 40 million cubic meters. Until 23 March, only a few earthquakes had accompanied this process, but scientists predicted that swarms of small earthquakes would eventually accompany the uplift, and they suggested that the most likely cause of the earthquakes was small amounts of slippage on faults as the crust adjusted to the slow ground deformation that had been occurring since 1997. Heat and gases related to the magmatic intrusion also likely caused increases in fluid pressure deep underground, helping trigger minor faulting events.
Scientists deployed another seismometer in order to locate earthquakes more precisely. They also planned additional fieldwork with the assistance of the Willamette and Deschutes National Forests, aiming to fix problems with some field instruments that resulted from a heavy winter snow-pack, and to assess sites for new instruments.
Geologic Background. The north-south-trending Three Sisters volcano group dominates the landscape of the Central Oregon Cascades. All Three Sisters stratovolcanoes ceased activity during the late Pleistocene, but basaltic-to-rhyolitic flank vents erupted during the Holocene, producing both blocky lava flows north of North Sister and rhyolitic lava domes and flows south of South Sister volcano. Glaciers have deeply eroded the Pleistocene andesitic-dacitic North Sister stratovolcano, exposing the volcano's central plug. Construction of the main edifice ceased at about 55,000 yrs ago, but north-flank vents produced blocky lava flows in the McKenzie Pass area as recently as about 1600 years ago. Middle Sister volcano is located only 2 km to the SW and was active largely contemporaneously with South Sister until about 14,000 years ago. South Sister is the highest of the Three Sisters. It was constructed beginning about 50,000 years ago and was capped by a symmetrical summit cinder cone formed about 22,000 years ago. The late Pleistocene or early Holocene Cayuse Crater on the SW flank of Broken Top volcano and other flank vents such as Le Conte Crater on the SW flank of South Sister mark mafic vents that have erupted at considerable distances from South Sister itself, and a chain of dike-fed rhyolitic lava domes and flows at Rock Mesa and Devils Chain south of South Sister erupted about 2000 years ago.
Information Contacts: Cascades Volcano Observatory (CVO), U.S. Geological Survey (USGS), Building 10, Suite 100, 1300 SE Cardinal Court, Vancouver, WA 98683 (URL: https://volcanoes.usgs.gov/observatories/cvo/); Volcano Hazards Team, USGS, 345 Middlefield Road, Menlo Park, CA 94025-3591 USA (URL: http://volcanoes.usgs.gov/); Pacific Northwest Seismograph Network (PNSN), University of Washington Geophysics Program, Box 351650, Seattle, WA 98195-1650, USA (URL: http://www.geophys.washington.edu/SEIS/PNSN/).
Tinakula (Solomon Islands) — June 2004 Cite this Report
Tinakula
Solomon Islands
10.386°S, 165.804°E; summit elev. 796 m
All times are local (unless otherwise noted)
Additional MODVOLC thermal anomalies identified from January 2001
Inspection of Terra MODIS day- and night-time data (i.e. original data, rather than the thresholded alert data on the MODVOLC website) for 2001 and 2002 identified cloud-free intervals over Tinakula during January-April 2001, August-September 2001, January 2002, and August-September 2002. MODVOLC thermal alerts were previously reported for 15 January, 6 March, and 16 April 2001 (BGVN 28:01). Recognizable thermal anomalies not noted earlier by the automated system appeared at night on 10 January 2001 (alert ratio, -0.804), and during the day on 25 January 2001 (alert ratio, -0.790). This new information reinforces the interpretation that small-scale activity was occurring during the January-April 2001 time period.
Data acquisition and analysis. Reports from Diego Coppola and David A. Rothery provided analyses of MODIS thermal alerts during 2001 and 2002 (using the MODVOLC alert-detection algorithm) extracted from the MODIS Thermal Alerts website (http://modis.hgip.hawaii.edu/) maintained by the University of Hawaii HIGP MODIS Thermal Alerts team (BGVN 28:01). Rothery and Charlotte Saunders provided updates to 31 May 2004. MODVOLC data are now routinely available from the Aqua satellite (equator crossing times 0230 and 1430 local time) in addition to the original Terra satellite (equator crossing times 1030 and 2230 local time).
Geologic Background. The small 3.5-km-wide island of Tinakula is the exposed summit of a massive stratovolcano at the NW end of the Santa Cruz islands. It has a breached summit crater that extends from the summit to below sea level. Landslides enlarged this scarp in 1965, creating an embayment on the NW coast. The Mendana cone is located on the SE side. The dominantly andesitic volcano has frequently been observed in eruption since the era of Spanish exploration began in 1595. In about 1840, an explosive eruption apparently produced pyroclastic flows that swept all sides of the island, killing its inhabitants. Recorded eruptions have frequently originated from a cone constructed within the large breached crater. These have left the upper flanks and the steep apron of lava flows and volcaniclastic debris within the breach unvegetated.
Information Contacts: David A. Rothery and Charlotte Saunders, Department of Earth Sciences, The Open University, Milton Keynes, MK7 6AA, United Kingdom.
Ulawun (Papua New Guinea) — June 2004 Cite this Report
Ulawun
Papua New Guinea
5.05°S, 151.33°E; summit elev. 2334 m
All times are local (unless otherwise noted)
No MODVOLC thermal anomalies detected despite other observed activity
No new activity was detected by MODVOLC as recently as mid-2004. This was the case despite reports of seismic activity and deflation during January-March 2003 (BGVN 28:03), as well as white vapor emissions and offshore effervescence (BGVN 28:09) and intermittent ash plumes during September-December 2003 (BGVN 28:11).
Data acquisition and analysis. Reports from Diego Coppola and David A. Rothery provided analyses of MODIS thermal alerts during 2001 and 2002 (using the MODVOLC alert-detection algorithm) extracted from the MODIS Thermal Alerts website (http://modis.hgip.hawaii.edu/) maintained by the University of Hawaii HIGP MODIS Thermal Alerts team (BGVN 28:01). Rothery and Charlotte Saunders provided updates to 31 May 2004. MODVOLC data are now routinely available from the Aqua satellite (equator crossing times 0230 and 1430 local time) in addition to the original Terra satellite (equator crossing times 1030 and 2230 local time).
Geologic Background. The symmetrical basaltic-to-andesitic Ulawun stratovolcano is the highest volcano of the Bismarck arc, and one of Papua New Guinea's most frequently active. The volcano, also known as the Father, rises above the N coast of the island of New Britain across a low saddle NE of Bamus volcano, the South Son. The upper 1,000 m is unvegetated. A prominent E-W escarpment on the south may be the result of large-scale slumping. Satellitic cones occupy the NW and E flanks. A steep-walled valley cuts the NW side, and a flank lava-flow complex lies to the south of this valley. Historical eruptions date back to the beginning of the 18th century. Twentieth-century eruptions were mildly explosive until 1967, but after 1970 several larger eruptions produced lava flows and basaltic pyroclastic flows, greatly modifying the summit crater.
Information Contacts: David A. Rothery and Charlotte Saunders, Department of Earth Sciences, The Open University, Milton Keynes, MK7 6AA, United Kingdom.
Veniaminof (United States) — June 2004 Cite this Report
Veniaminof
United States
56.17°N, 159.38°W; summit elev. 2507 m
All times are local (unless otherwise noted)
Ash emissions and seismic activity from mid-February through June 2004
After many years of quiescence, Veniaminof began exhibiting increased seismicity during September 2002 along with some possible low-level eruptive activity (BGVN 27:10). Variable seismicity contined to be recorded from October 2002 through mid-April 2003 accompanied by steam emissions from the intracaldera cone (BGVN 28:01 and 28:03). No additional signs of activity were noted until mid-February 2004.
Activity during February 2004. During the week of 15 February 2004, the Alaska Volcano Observatory (AVO) received several reports of small ash clouds rising ~ 30-90 m above the intracaldera cinder and spatter cone of Veniaminof. Residents of Perryville (~ 30 km S) reported a "black puff" of ash on 16 February, followed by strong steam emissions.
A pilot reported a small black ash cloud on 19 February. Satellite imagery from 2310 UTC (1410 AST) on 19 February showed a small, dark trail on the snow leading away from the intracaldera cone, possibly an intra-caldera ash deposit. Aerial photographs on 21 February showed distinct ash deposits (figure 8). No significant seismic activity or thermal anomalies were recorded during the week. Due to the lack of significant seismic activity beneath the volcano, AVO concluded that these small ash clouds were the result of minor explosions caused by the heating of ground water below the intracaldera cone. The Concern Color Code remained at Green.
Satellite imagery on 22 February (figure 9) again showed very localized deposits within the ice-filled caldera. No additional signs of volcanic activity were visible on satellite imagery during 23-27 February, and there were no more reports of ash-plume sightings from observers. Seismicity remained at a low level, and the thermal signature of the intracaldera cone was unchanged from previous months.
Activity during April 2004. During the week of 11 April, several low-level episodes of volcanic tremor and small volcanic earthquakes were recorded. The tremor occurred in pulses lasting several minutes. This represented the strongest seismicity since early 2003 when the Concern Color Code was downgraded from Yellow to Green, although no significant changes in the thermal signature of the intracaldera cone were noted in satellite data.
Perryville residents reported that a steam emission, possibly containing a small amount of volcanic ash, was visible most of the day on 18 April. It became most vigorous at approximately 1730 ADT (0130 UTC on 19 April) when it rose to ~ 460-610 m above the intracaldera cone (~ 2,590-2,740 m altitude). Starting at approximately 1130 ADT on 19 April, tremor and earthquake levels increased, albeit to lower levels than those during the previous week. The Color Code was upgraded to Yellow. During subsequent days in the week of 19 April there was a marked decrease in the episodes of low-level volcanic tremor and small volcanic earthquakes. No emissions were reported.
On the afternoon and evening of 25 April, more than 25 small steam and ash emissions were seen during an 8-hour period, producing clouds that rose ~ 300-610 m above the active cone. During the week of 25 April activity was characterized by small, intermittent ash emissions, low-level volcanic tremor, and small volcanic earthquakes. Small ash emissions were observed during periods of clear weather on 28 April. Ash clouds rose ~ 0.3-1 km above the active cone, and at times were observed drifting for distances of ~ 16 km. Seismic activity fluctuated but remained above background levels.
Activity during May 2004. The week of 2 May was characterized by small, intermittent ash emissions, low-level volcanic tremor, and small volcanic earthquakes. Small ash emissions were observed during periods of clear weather on 1-3 May. Ash clouds rose ~ 300-610 m above the active cone. No systematic visual observations of ash plumes were made during 4-18 May due to the camera-monitoring system being repaired, though residents reported continued activity on 5 May. However, the observed seismicity was similar to that recorded in the previous week, suggesting that ash emissions continued. Satellite imagery showed ash deposits on the snow to distances of ~ 8 km from the vent, and a pilot reported ash as far as 33 km from the cone.
There were no observations of ash emissions during the week of 9 May, when cloudy conditions obscured the volcano. Seismic activity was more intermittent and lower in amplitude than in previous weeks; however, seismicity suggested that ash emissions occasionally occurred. Unrest during the week of 16 May was characterized by moderate levels of intermittent volcanic tremor, which was similar to the seismic signals recorded in association with the small ash emissions of 25 and 28 April and 1-3 May. On 18 May, a pilot reported an ash plume rising 300-900 m above the volcano's summit (2.8-3.4 km altitude) and extending ~32 km NE. Cloudy conditions obscured observation by satellite.
Bursts of volcanic tremor continued during the week of 24 May. Activity in general was lower than that of the previous week, but sequences of tremor accompanying ash emissions continued to be observed. Clear views of the volcano on 26 May showed weak steam and low ash emissions emanating from the intracaldera cone. Most of these emissions did not rise higher than the active cone (2,507 m elevation). Satellite data acquired on 26 May showed ash deposits in the N and SE portions of the caldera. The only significant ash emissions observed during the week of 31 May occurred the evening of 30 May into the morning of 31 May; none appeared to have exceeded 3,000 m altitude. Clear views earlier on 30 May showed steam emissions from near the base of the intracaldera cone, which rarely rose above the top of the cone. No activity was observed in satellite data as the volcano was largely obscured by clouds.
Activity during June 2004. Bursts of volcanic tremor continued throughout June, and were thought to be indicative of small, low-level ash emissions. Clouds obscured the volcano for most of the month, making observations difficult. The only ash emissions observed in the week of 7 June occurred the evening of 11 June. None appeared to have exceeded 3,000 m altitude. On 16 June at 2350, a pilot observed an ash cloud that rose ~ 2,650 m altitude. This ash cloud was also observed in satellite imagery. Low-level activity continued during the week of 28 June, with episodes of low-level tremor and small volcanic earthquakes occurring regularly on 30 June. Observations made by AVO during an aerial overflight of the active cone on 27 June indicated small amounts of dark ash on the surface of the snow within the ice-and-snow-filled caldera. The ash, although apparently thin, covered most of the snow surface inside the caldera.
Geologic Background. Veniaminof, on the Alaska Peninsula, is truncated by a steep-walled, 8 x 11 km, glacier-filled caldera that formed around 3,700 years ago. The caldera rim is up to 520 m high on the north, is deeply notched on the west by Cone Glacier, and is covered by an ice sheet on the south. Post-caldera vents are located along a NW-SE zone bisecting the caldera that extends 55 km from near the Bering Sea coast, across the caldera, and down the Pacific flank. Historical eruptions probably all originated from the westernmost and most prominent of two intra-caldera cones, which rises about 300 m above the surrounding icefield. The other cone is larger, and has a summit crater or caldera that may reach 2.5 km in diameter, but is more subdued and barely rises above the glacier surface.
Information Contacts: Alaska Volcano Observatory (AVO), a cooperative program of a) U.S. Geological Survey, 4200 University Drive, Anchorage, AK 99508-4667, USA (URL: http://www.avo.alaska.edu/), b) Geophysical Institute, University of Alaska, PO Box 757320, Fairbanks, AK 99775-7320, USA, and c) Alaska Division of Geological & Geophysical Surveys, 794 University Ave., Suite 200, Fairbanks, AK 99709, USA.
Yasur
Vanuatu
19.532°S, 169.447°E; summit elev. 361 m
All times are local (unless otherwise noted)
Intermittent activity detected by satellite after June 2003
Activity consistently identified in MODVOLC thermal alerts through most of 2002 (BGVN 28:01) continued to 4 June 2003, but at lower levels (figure 34). There was usually only one alert pixel on each detection, barely above the detection threshold, with the highest alert ratio of -0.74. After a brief respite, activity was detected several times during 17 September through October 2003. No subsequent activity was detected until 15 March, 10 April, and 28 May 2004. These three alerts each triggered one alert pixel and had low alert ratios, about -0.8, just above the detection threshold. It seems likely that activity continued throughout the period, but was below the MODVOLC threshold most of the time and did not trigger an alert. There were no other reports of activity for this period.
Data acquisition and analysis. Reports from Diego Coppola and David A. Rothery provided analyses of MODIS thermal alerts during 2001 and 2002 (using the MODVOLC alert-detection algorithm) extracted from the MODIS Thermal Alerts website (http://modis.hgip.hawaii.edu/) maintained by the University of Hawaii HIGP MODIS Thermal Alerts team (BGVN 28:01). Rothery and Charlotte Saunders provided updates to 31 May 2004. MODVOLC data are now routinely available from the Aqua satellite (equator crossing times 0230 and 1430 local time) in addition to the original Terra satellite (equator crossing times 1030 and 2230 local time).
Geologic Background. Yasur has exhibited essentially continuous Strombolian and Vulcanian activity at least since Captain Cook observed ash eruptions in 1774. This style of activity may have continued for the past 800 years. Located at the SE tip of Tanna Island in Vanuatu, this pyroclastic cone has a nearly circular, 400-m-wide summit crater. The active cone is largely contained within the small Yenkahe caldera, and is the youngest of a group of Holocene volcanic centers constructed over the down-dropped NE flank of the Pleistocene Tukosmeru volcano. The Yenkahe horst is located within the Siwi ring fracture, a 4-km-wide open feature associated with eruption of the andesitic Siwi pyroclastic sequence. Active tectonism along the Yenkahe horst accompanying eruptions has raised Port Resolution harbor more than 20 m during the past century.
Information Contacts: David A. Rothery and Charlotte Saunders, Department of Earth Sciences, The Open University, Milton Keynes, MK7 6AA, United Kingdom.