Recently Published Bulletin Reports
Erebus (Antarctica) Lava lake remains active; most thermal alerts recorded since 2019
Rincon de la Vieja (Costa Rica) Frequent phreatic explosions during July-December 2023
Bezymianny (Russia) Explosion on 18 October 2023 sends ash plume 8 km high; lava flows and incandescent avalanches
Kilauea (United States) Low-level lava effusions in the lava lake at Halema’uma’u during July-December 2022
Nyamulagira (DR Congo) Lava flows and thermal activity during May-October 2023
Bagana (Papua New Guinea) Explosions, ash plumes, ashfall, and lava flows during April-September 2023
Mayon (Philippines) Lava flows, pyroclastic flows, ash emissions, and seismicity during April-September 2023
Nishinoshima (Japan) Eruption plumes and gas-and-steam plumes during May-August 2023
Krakatau (Indonesia) White gas-and-steam plumes and occasional ash plumes during May-August 2023
Villarrica (Chile) Strombolian activity, gas-and-ash emissions, and crater incandescence during April-September 2023
Merapi (Indonesia) Frequent incandescent avalanches during April-September 2023
Ebeko (Russia) Moderate explosive activity with ash plumes continued during June-November 2023
Erebus (Antarctica) — January 2024  Cite this Report
Erebus
Antarctica
77.53°S, 167.17°E; summit elev. 3794 m
All times are local (unless otherwise noted)
Lava lake remains active; most thermal alerts recorded since 2019
The lava lake in the summit crater of Erebus has been active since at least 1972. Located in Antarctica overlooking the McMurdo Station on Ross Island, it is the southernmost active volcano on the planet. Because of the remote location, activity is primarily monitored by satellites. This report covers activity during 2023.
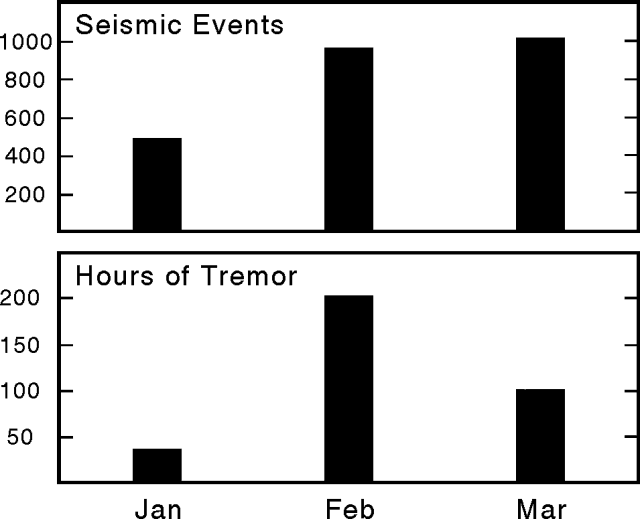
The number of thermal alerts recorded by the Hawai'i Institute of Geophysics and Planetology’s MODVOLC Thermal Alerts System increased considerably in 2023 compared to the years 2020-2022 (table 9). In contrast to previous years, the MODIS instruments aboard the Aqua and Terra satellites captured data from Erebus every month during 2023. Consistent with previous years, the lowest number of anomalous pixels were recorded in January, November, and December.
Table 9. Number of monthly MODIS-MODVOLC thermal alert pixels recorded at Erebus during 2017-2023. See BGVN 42:06 for data from 2000 through 2016. The table was compiled using data provided by the HIGP – MODVOLC Thermal Alerts System.
| Year |
Jan |
Feb |
Mar |
Apr |
May |
Jun |
Jul |
Aug |
Sep |
Oct |
Nov |
Dec |
SUM |
| 2017 |
0 |
21 |
9 |
0 |
0 |
1 |
11 |
61 |
76 |
52 |
0 |
3 |
234 |
| 2018 |
0 |
21 |
58 |
182 |
55 |
17 |
137 |
172 |
103 |
29 |
0 |
0 |
774 |
| 2019 |
2 |
21 |
162 |
151 |
55 |
56 |
75 |
53 |
29 |
19 |
1 |
0 |
624 |
| 2020 |
0 |
2 |
16 |
18 |
4 |
4 |
1 |
3 |
18 |
3 |
1 |
6 |
76 |
| 2021 |
0 |
9 |
1 |
0 |
2 |
56 |
46 |
47 |
35 |
52 |
5 |
3 |
256 |
| 2022 |
1 |
13 |
55 |
22 |
15 |
32 |
39 |
19 |
31 |
11 |
0 |
0 |
238 |
| 2023 |
2 |
33 |
49 |
82 |
41 |
32 |
70 |
64 |
42 |
17 |
5 |
11 |
448 |
Sentinel-2 infrared images showed one or two prominent heat sources within the summit crater, accompanied by adjacent smaller sources, similar to recent years (see BGVN 46:01, 47:02, and 48:01). A unique image was obtained on 25 November 2023 by the OLI-2 (Operational Land Imager-2) on Landsat 9, showing the upper part of the volcano surrounded by clouds (figure 32).
Geologic Background. Mount Erebus, the world's southernmost historically active volcano, overlooks the McMurdo research station on Ross Island. It is the largest of three major volcanoes forming the crudely triangular Ross Island. The summit of the dominantly phonolitic volcano has been modified by one or two generations of caldera formation. A summit plateau at about 3,200 m elevation marks the rim of the youngest caldera, which formed during the late-Pleistocene and within which the modern cone was constructed. An elliptical 500 x 600 m wide, 110-m-deep crater truncates the summit and contains an active lava lake within a 250-m-wide, 100-m-deep inner crater; other lava lakes are sometimes present. The glacier-covered volcano was erupting when first sighted by Captain James Ross in 1841. Continuous lava-lake activity with minor explosions, punctuated by occasional larger Strombolian explosions that eject bombs onto the crater rim, has been documented since 1972, but has probably been occurring for much of the volcano's recent history.
Information Contacts: Hawai'i Institute of Geophysics and Planetology (HIGP) - MODVOLC Thermal Alerts System, School of Ocean and Earth Science and Technology (SOEST), Univ. of Hawai'i, 2525 Correa Road, Honolulu, HI 96822, USA (URL: http://modis.higp.hawaii.edu/); Copernicus Browser, Copernicus Data Space Ecosystem, European Space Agency (URL: https://dataspace.copernicus.eu/browser/); NASA Earth Observatory, EOS Project Science Office, NASA Goddard Space Flight Center, Goddard, Maryland, USA (URL: https://earthobservatory.nasa.gov/images/152134/erebus-breaks-through).
Rincon de la Vieja (Costa Rica) — January 2024 Cite this Report
Rincon de la Vieja
Costa Rica
10.83°N, 85.324°W; summit elev. 1916 m
All times are local (unless otherwise noted)
Frequent phreatic explosions during July-December 2023
Rincón de la Vieja is a volcanic complex in Costa Rica with a hot convecting acid lake that exhibits frequent weak phreatic explosions, gas-and-steam emissions, and occasional elevated sulfur dioxide levels (BGVN 45:10, 46:03, 46:11). The current eruption period began June 2021. This report covers activity during July-December 2023 and is based on weekly bulletins and occasional daily reports from the Observatorio Vulcanologico Sismologica de Costa Rica-Universidad Nacional (OVSICORI-UNA).
Numerous weak phreatic explosions continued during July-December 2023, along with gas-and-steam emissions and plumes that rose as high as 3 km above the crater rim. Many weekly OVSICORI-UNA bulletins included the previous week's number of explosions and emissions (table 9). For many explosions, the time of explosion was given (table 10). Frequent seismic activity (long-period earthquakes, volcano-tectonic earthquakes, and tremor) accompanied the phreatic activity.
Table 9. Number of reported weekly phreatic explosions and gas-and-steam emissions at Rincón de la Vieja, July-December 2023. Counts are reported for the week before the Weekly Bulletin date; not all reports included these data. Courtesy of OVSICORI-UNA.
| OVSICORI Weekly Bulletin |
Number of explosions |
Number of emissions |
| 28 Jul 2023 |
6 |
14 |
| 4 Aug 2023 |
10 |
12 |
| 1 Sep 2023 |
13 |
11 |
| 22 Sep 2023 |
12 |
13 |
| 29 Sep 2023 |
6 |
11 |
| 6 Oct 2023 |
12 |
5 |
| 13 Oct 2023 |
7 |
9 |
| 20 Oct 2023 |
1 |
15 |
| 27 Oct 2023 |
3 |
23 |
| 3 Nov 2023 |
3 |
10 |
| 17 Nov 2023 |
0 |
Some |
| 24 Nov 2023 |
0 |
14 |
| 8 Dec 2023 |
4 |
16 |
| 22 Dec 2023 |
8 |
18 |
Table 10. Summary of activity at Rincón de la Vieja during July-December 2023. Weak phreatic explosions and gas emissions are noted where the time of explosion was indicated in the weekly or daily bulletins. Height of plumes or emissions are distance above the crater rim. Courtesy of OVSICORI-UNA.
| Date |
Time |
Description of Activity |
| 1 Jul 2023 |
0156 |
Explosion. |
| 2 Jul 2023 |
0305 |
Explosion. |
| 4 Jul 2023 |
0229, 0635 |
Event at 0635 produced a gas-and-steam plume that rose 700 m and drifted W; seen by residents in Liberia (21 km SW). |
| 9 Jul 2023 |
1843 |
Explosion. |
| 21 Jul 2023 |
0705 |
Explosion. |
| 26 Jul 2023 |
1807 |
Explosion. |
| 28 Jul 2023 |
0802 |
Explosion generated a gas-and-steam plume that rose 500 m. |
| 30 Jul 2023 |
1250 |
Explosion. |
| 31 Jul 2023 |
2136 |
Explosion. |
| 11 Aug 2023 |
0828 |
Explosion. |
| 18 Aug 2023 |
1304 |
Explosion. |
| 21 Aug 2023 |
1224 |
Explosion generated gas-and-steam plumes rose 500-600 m. |
| 22 Aug 2023 |
0749 |
Explosion generated gas-and-steam plumes rose 500-600 m. |
| 24 Aug 2023 |
1900 |
Explosion. |
| 25 Aug 2023 |
0828 |
Event produced a steam-and-gas plume that rose 3 km and drifted NW. |
| 27-28 Aug 2023 |
0813 |
Four small events; the event at 0813 on 28 August lasted two minutes and generated a steam-and-gas plume that rose 2.5 km. |
| 1 Sep 2023 |
1526 |
Explosion generated plume that rose 2 km and ejected material onto the flanks. |
| 2-3 Sep 2023 |
- |
Small explosions detected in infrasound data. |
| 4 Sep 2023 |
1251 |
Gas-and-steam plume rose 1 km and drifted W. |
| 7 Nov 2023 |
1113 |
Explosion. |
| 8 Nov 2023 |
0722 |
Explosion. |
| 12 Nov 2023 |
0136 |
Small gas emissions. |
| 14 Nov 2023 |
0415 |
Small gas emissions. |
According to OVSICORI-UNA, during July-October the average weekly sulfur dioxide (SO2) flux ranged from 68 to 240 tonnes/day. However, in mid-November the flux increased to as high as 334 tonnes/day, the highest value measured in recent years. The high SO2 flux in mid-November was also detected by the TROPOMI instrument on the Sentinel-5P satellite (figure 43).
Geologic Background. Rincón de la Vieja, the largest volcano in NW Costa Rica, is a remote volcanic complex in the Guanacaste Range. The volcano consists of an elongated, arcuate NW-SE-trending ridge constructed within the 15-km-wide early Pleistocene Guachipelín caldera, whose rim is exposed on the south side. Sometimes known as the "Colossus of Guanacaste," it has an estimated volume of 130 km3 and contains at least nine major eruptive centers. Activity has migrated to the SE, where the youngest-looking craters are located. The twin cone of Santa María volcano, the highest peak of the complex, is located at the eastern end of a smaller, 5-km-wide caldera and has a 500-m-wide crater. A Plinian eruption producing the 0.25 km3 Río Blanca tephra about 3,500 years ago was the last major magmatic eruption. All subsequent eruptions, including numerous historical eruptions possibly dating back to the 16th century, have been from the prominent active crater containing a 500-m-wide acid lake located ENE of Von Seebach crater.
Information Contacts: Observatorio Vulcanológico Sismológica de Costa Rica-Universidad Nacional (OVSICORI-UNA), Apartado 86-3000, Heredia, Costa Rica (URL: http://www.ovsicori.una.ac.cr/); NASA Global Sulfur Dioxide Monitoring Page, Atmospheric Chemistry and Dynamics Laboratory, NASA Goddard Space Flight Center (NASA/GSFC), 8800 Greenbelt Road, Goddard MD 20771, USA (URL: https://so2.gsfc.nasa.gov/).
Bezymianny (Russia) — November 2023 Cite this Report
Bezymianny
Russia
55.972°N, 160.595°E; summit elev. 2882 m
All times are local (unless otherwise noted)
Explosion on 18 October 2023 sends ash plume 8 km high; lava flows and incandescent avalanches
Bezymianny, located on Russia’s Kamchatka Peninsula, has had eruptions since 1955 characterized by dome growth, explosions, pyroclastic flows, ash plumes, and ashfall. Activity during November 2022-April 2023 included gas-and-steam emissions, lava dome collapses generating avalanches, and persistent thermal activity. Similar eruptive activity continued from May through October 2023, described here based on information from weekly and daily reports of the Kamchatka Volcano Eruptions Response Team (KVERT), notices from Tokyo VAAC (Volcanic Ash Advisory Center), and from satellite data.
Overall activity decreased after the strong period of activity in late March through April 2023, which included ash explosions during 29 March and 7-8 April 2023 that sent plumes as high as 10-12 km altitude, along with dome growth and lava flows (BGVN 48:05). This reduced activity can be seen in the MIROVA thermal detection system graph (figure 56), which was consistent with data from the MODVOLC thermal detection system and with Sentinel-2 satellite images that showed persistent hotspots in the summit crater when conditions allowed observations. A renewed period of strong activity began in mid-October 2023.
Activity increased significantly on 17 October 2023 when large collapses began during 0700-0830 on the E flanks of the lava dome and continued to after 0930 the next day (figure 57). Ash plumes rose to an altitude of 4.5-5 km, extending 220 km NNE by 18 October. A large explosion at 1630 on 18 October produced an ash plume that rose to an altitude of 11 km (8 km above the summit) and drifted NNE and then NW, extending 900 km NW within two days at an altitude of 8 km. Minor ashfall was noted in Kozyrevsk (45 km WNW). At 0820 on 20 October an ash plume was identified in satellite images drifting 100 km ENE at altitudes of 4-4.5 km.
Lava flows and hot avalanches from the dome down the SE flank continued over the next few days, including 23 October when clear conditions allowed good observations (figures 58 and 59). A large thermal anomaly was observed over the volcano through 24 October, and in the summit crater on 30 October (figure 60). Strong fumarolic activity continued, with numerous avalanches and occasional incandescence. By the last week of October, volcanic activity had decreased to a level consistent with that earlier in the reporting period.
Aviation warnings were frequently updated during 17-20 October. KVERT issued a Volcano Observatory Notice for Aviation (VONA) on 17 October at 1419 and 1727 (0219 and 0527 UTC) raising the Aviation Color Code (ACC) from Yellow to Orange (second highest level). The next day, KVERT issued a VONA at 1705 (0505 UTC) raising the ACC to Red (highest level) but lowered it back to Orange at 2117 (0917 UTC). After another decrease to Yellow and back to Orange, the ACC was reduced to Yellow on 20 October at 1204 (0004 UTC). In addition, the Tokyo VAAC issued a series of Volcanic Ash Advisories beginning on 16 October and continuing through 30 October.
Geologic Background. The modern Bezymianny, much smaller than its massive neighbors Kamen and Kliuchevskoi on the Kamchatka Peninsula, was formed about 4,700 years ago over a late-Pleistocene lava-dome complex and an edifice built about 11,000-7,000 years ago. Three periods of intensified activity have occurred during the past 3,000 years. The latest period, which was preceded by a 1,000-year quiescence, began with the dramatic 1955-56 eruption. This eruption, similar to that of St. Helens in 1980, produced a large open crater that was formed by collapse of the summit and an associated lateral blast. Subsequent episodic but ongoing lava-dome growth, accompanied by intermittent explosive activity and pyroclastic flows, has largely filled the 1956 crater.
Information Contacts: Kamchatka Volcanic Eruptions Response Team (KVERT), Far Eastern Branch, Russian Academy of Sciences, 9 Piip Blvd., Petropavlovsk-Kamchatsky, 683006, Russia (URL: http://www.kscnet.ru/ivs/kvert/); Kamchatka Volcanological Station, Kamchatka Branch of Geophysical Survey, (KB GS RAS), Klyuchi, Kamchatka Krai, Russia (URL: http://volkstat.ru/); Tokyo Volcanic Ash Advisory Center (VAAC), 1-3-4 Otemachi, Chiyoda-ku, Tokyo 100-8122, Japan (URL: http://ds.data.jma.go.jp/svd/vaac/data/); Hawai'i Institute of Geophysics and Planetology (HIGP) - MODVOLC Thermal Alerts System, School of Ocean and Earth Science and Technology (SOEST), Univ. of Hawai'i, 2525 Correa Road, Honolulu, HI 96822, USA (URL: http://modis.higp.hawaii.edu/); MIROVA (Middle InfraRed Observation of Volcanic Activity), a collaborative project between the Universities of Turin and Florence (Italy) supported by the Centre for Volcanic Risk of the Italian Civil Protection Department (URL: http://www.mirovaweb.it/); Copernicus Browser, Copernicus Data Space Ecosystem, European Space Agency (URL: https://dataspace.copernicus.eu/browser/).chr
Kilauea (United States) — January 2023 Cite this Report
Kilauea
United States
19.421°N, 155.287°W; summit elev. 1222 m
All times are local (unless otherwise noted)
Low-level lava effusions in the lava lake at Halema’uma’u during July-December 2022
Kīlauea is the southeastern-most volcano in Hawaii and overlaps the E flank of the Mauna Loa volcano. Its East Rift Zone (ERZ) has been intermittently active for at least 2,000 years. An extended eruption period began in January 1983 and was characterized by open lava lakes and lava flows from the summit caldera and the East Rift Zone. During May 2018 magma migrated into the Lower East Rift Zone (LERZ) and opened 24 fissures along a 6-km-long NE-trending fracture zone that produced lava flows traveling in multiple directions. As lava emerged from the fissures, the lava lake at Halema'uma'u drained and explosions sent ash plumes to several kilometers altitude (BGVN 43:10).
The current eruption period started during September 2021 and has recently been characterized by lava effusions, spatter, and sulfur dioxide emissions in the active Halema’uma’u lava lake (BGVN 47:08). Lava effusions, some spatter, and sulfur dioxide emissions have continued during this reporting period of July through December 2022 using daily reports, volcanic activity notices, and abundant photo, map, and video data from the US Geological Survey's (USGS) Hawaiian Volcano Observatory (HVO).
Summary of activity during July-December 2022. Low-level effusions have continued at the western vent of the Halema’uma’u crater during July through early December 2022. Occasional weak ooze-outs (also called lava break outs) would occur along the margins of the crater floor. The overall level of the active lava lake throughout the reporting period gradually increased due to infilling, however it stagnated in mid-September (table 13). During September through November, activity began to decline, though lava effusions persisted at the western vent. By 9 December, the active part of the lava lake had completely crusted over, and incandescence was no longer visible.
Table 13. Summary of measurements taken during overflights at Kīlauea that show a gradual increase in the active lava lake level and the volume of lava effused since 29 September 2021. Lower activity was reported during September-October. Data collected during July-December 2022. Courtesy of HVO.
| Date: |
Level of the active lava lake (m): |
Cumulative volume of lava effused (million cubic meters): |
| 7 Jul 2022 |
130 |
95 |
| 19 Jul 2022 |
133 |
98 |
| 4 Aug 2022 |
136 |
102 |
| 16 Aug 2022 |
137 |
104 |
| 12 Sep 2022 |
143 |
111 |
| 5 Oct 2022 |
143 |
111 |
| 28 Oct 2022 |
143 |
111 |
Activity during July 2022. Lava effusions were reported from the western vent in the Halema’uma’u crater, along with occasional weak ooze-outs along the margins of the crater floor. The height of the lava lake was variable due to deflation-inflation tilt events; for example, the lake level dropped approximately 3-4 m during a summit deflation-inflation event reported on 1 July. Webcam images taken during the night of 6-12 July showed intermittent low-level spattering at the western vent that rose less than 10 m above the vent (figure 519). Measurements made during an overflight on 7 July indicated that the crater floor was infilled about 130 m and that 95 million cubic meters of lava had been effused since 29 September 2021. A single, relatively small lava ooze-out was active to the S of the lava lake. Around midnight on 8 July there were two brief periods of lava overflow onto the lake margins. On 9 July lava ooze-outs were reported near the SE and NE edges of the crater floor and during 10-11 July they occurred near the E, NE, and NW edges. On 16 July crater incandescence was reported, though the ooze-outs and spattering were not visible. On 18 July overnight webcam images showed incandescence in the western vent complex and two ooze-outs were reported around 0000 and 0200 on 19 July. By 0900 there were active ooze-outs along the SW edge of the crater floor. Measurements made from an overflight on 19 July indicated that the crater floor was infilled about 133 m and 98 million cubic meters of lava had erupted since 29 September 2021 (figure 520). On 20 July around 1600 active ooze-outs were visible along the N edge of the crater, which continued through the next day. Extensive ooze-outs occurred along the W margin during 24 July until 1900; on 26 July minor ooze-outs were noted along the N margin. Minor spattering was visible on 29 July along the E margin of the lake. The sulfur dioxide emission rates ranged 650-2,800 tons per day (t/d), the higher of which was measured on 8 July (figure 519).
Activity during August 2022. The eruption continued in the Halema’uma’u crater at the western vent. According to HVO the lava in the active lake remained at the level of the bounding levees. Occasional minor ooze-outs were observed along the margins of the crater floor. Strong nighttime crater incandescence was visible after midnight on 6 August over the western vent cone. During 6-7 August scattered small lava lobes were active along the crater floor and incandescence persisted above the western vent through 9 August. During 7-9 August HVO reported a single lava effusion source was active along the NW margin of the crater floor. Measurements from an overflight on 4 August indicated that the crater floor was infilled about 136 m total and that 102 million cubic meters of lava had been erupted since the start of the eruption. Lava breakouts were reported along the N, NE, E, S, and W margins of the crater during 10-16 August. Another overflight survey conducted on 16 August indicated that the crater floor infilled about 137 m and 104 million cubic meters of lava had been erupted since September 2021. Measured sulfur dioxide emissions rates ranged 1,150-2,450 t/d, the higher of which occurred on 8 August.
Activity during September 2022. During September, lava effusion continued from the western vent into the active lava lake and onto the crater floor. Intermittent minor ooze-outs were reported through the month. A small ooze-out was visible on the W crater floor margin at 0220 on 2 September, which showed decreasing surface activity throughout the day, but remained active through 3 September. On 3 September around 1900 a lava outbreak occurred along the NW margin of the crater floor but had stopped by the evening of 4 September. Field crews monitoring the summit lava lake on 9 September observed spattering on the NE margin of the lake that rose no higher than 10 m, before falling back onto the lava lake crust (figure 521). Overflight measurements on 12 September indicated that the crater floor was infilled a total of 143 m and 111 million cubic meters of lava had been erupted since September 2021. Extensive breakouts in the W and N part of the crater floor were reported at 1600 on 20 September and continued into 26 September. The active part of the lava lake dropped by 10 m while other parts of the crater floor dropped by several meters. Summit tiltmeters recorded a summit seismic swarm of more than 80 earthquakes during 1500-1800 on 21 September, which occurred about 1.5 km below Halema’uma’u; a majority of these were less than Mw 2. By 22 September the active part of the lava lake was infilled about 2 m. On 23 September the western vent areas exhibited several small spatter cones with incandescent openings, along with weak, sporadic spattering (figure 522). The sulfur dioxide emission rate ranged from 930 t/d to 2,000 t/d, the higher of which was measured on 6 September.
Activity during October 2022. Activity during October declined slightly compared to previous months, though lava effusions persisted from the western vent into the active lava lake and onto the crater floor during October (figure 523). Slight variations in the lava lake were noted throughout the month. HVO reported that around 0600 on 3 October the level of the lava lake has lowered slightly. Overflight measurements taken on 5 October indicated that the crater floor was infilled a total of about 143 m and that 111 million cubic meters of lava had been effused since September 2021. During 6-7 October the lake gradually rose 0.5 m. Sulfur dioxide measurements made on 22 October had an emission rate of 700 t/d. Another overflight taken on 28 October showed that there was little to no change in the elevation of the crater floor: the crater floor was infilled a total of 143 m and 111 million cubic meters of lava had erupted since the start of the eruption.
Activity during November 2022. Activity remained low during November, though HVO reported that lava from the western vent continued to effuse into the active lava lake and onto the crater floor throughout the month. The rate of sulfur dioxide emissions during November ranged from 300-600 t/d, the higher amount of which occurred on 9 November.
Activity during December 2022. Similar low activity was reported during December, with lava effusing from the western vent into the active lava lake and onto the crater floor. During 4-5 December the active part of the lava lake was slightly variable in elevation and fluctuated within 1 m. On 9 December HVO reported that lava was no longer erupting from the western vent in the Halema’uma’u crater and that sulfur dioxide emissions had returned to near pre-eruption background levels; during 10-11 December, the lava lake had completely crusted over, and no incandescence was visible (figure 524). Time lapse camera images covering the 4-10 December showed that the crater floor showed weak deflation and no inflation. Some passive events of crustal overturning were reported during 14-15 December, which brought fresh incandescent lava to the lake surface. The sulfur dioxide emission rate was approximately 200 t/d on 14 December. A smaller overturn event on 17 December and another that occurred around 0000 and into the morning of 20 December were also detected. A small seismic swarm was later detected on 30 December.
Geologic Background. Kilauea overlaps the E flank of the massive Mauna Loa shield volcano in the island of Hawaii. Eruptions are prominent in Polynesian legends; written documentation since 1820 records frequent summit and flank lava flow eruptions interspersed with periods of long-term lava lake activity at Halemaumau crater in the summit caldera until 1924. The 3 x 5 km caldera was formed in several stages about 1,500 years ago and during the 18th century; eruptions have also originated from the lengthy East and Southwest rift zones, which extend to the ocean in both directions. About 90% of the surface of the basaltic shield volcano is formed of lava flows less than about 1,100 years old; 70% of the surface is younger than 600 years. The long-term eruption from the East rift zone between 1983 and 2018 produced lava flows covering more than 100 km2, destroyed hundreds of houses, and added new coastline.
Information Contacts: Hawaiian Volcano Observatory (HVO), U.S. Geological Survey, PO Box 51, Hawai'i National Park, HI 96718, USA (URL: http://hvo.wr.usgs.gov/).
Nyamulagira (DR Congo) — November 2023 Cite this Report
Nyamulagira
DR Congo
1.408°S, 29.2°E; summit elev. 3058 m
All times are local (unless otherwise noted)
Lava flows and thermal activity during May-October 2023
Nyamulagira (also known as Nyamuragira) is a shield volcano in the Democratic Republic of Congo with the summit truncated by a small 2 x 2.3 km caldera with walls up to about 100 m high. Documented eruptions have occurred within the summit caldera, as well as from numerous flank fissures and cinder cones. The current eruption period began in April 2018 and has more recently been characterized by summit crater lava flows and thermal activity (BGVN 48:05). This report describes lava flows and variable thermal activity during May through October 2023, based on information from the Observatoire Volcanologique de Goma (OVG) and various satellite data.
Lava lake activity continued during May. The MIROVA (Middle InfraRed Observation of Volcanic Activity) system recorded moderate-to-strong thermal activity throughout the reporting period; activity was more intense during May and October and relatively weaker from June through September (figure 95). The MODVOLC thermal algorithm, detected a total of 209 thermal alerts. There were 143 hotspots detected during May, eight during June, nine during September, and 49 during October. This activity was also reflected in infrared satellite images, where a lava flow was visible in the NW part of the crater on 7 May and strong activity was seen in the center of the crater on 4 October (figure 96). Another infrared satellite image taken on 12 May showed still active lava flows along the NW margin of the crater. According to OVG lava effusions were active during 7-29 May and moved to the N and NW parts of the crater beginning on 9 May. Strong summit crater incandescence was visible from Goma (27 km S) during the nights of 17, 19, and 20 May (figure 97). On 17 May there was an increase in eruptive activity, which peaked at 0100 on 20 May. Notable sulfur dioxide plumes drifted NW and W during 19-20 May (figure 98). Drone footage acquired in partnership with the USGS (United States Geological Survey) on 20 May captured images of narrow lava flows that traveled about 100 m down the W flank (figure 99). Data from the Rumangabo seismic station indicated a decreasing trend in activity during 17-21 May. Although weather clouds prevented clear views of the summit, a strong thermal signature on the NW flank was visible in an infrared satellite image on 22 May, based on an infrared satellite image. On 28 May the lava flows on the upper W flank began to cool and solidify. By 29 May seismicity returned to levels similar to those recorded before the 17 May increase. Lava effusion continued but was confined to the summit crater; periodic crater incandescence was observed.
Low-level activity was noted during June through October. On 1 June OVG reported that seismicity remained at lower levels and that crater incandescence had been absent for three days, though infrared satellite imagery showed continued lava effusion in the summit crater. The lava flows on the flanks covered an estimated 0.6 km2. Satellite imagery continued to show thermal activity confined to the lava lake through October (figure 96), although no lava flows or significant sulfur dioxide emissions were reported.
Geologic Background. Africa's most active volcano, Nyamulagira (also known as Nyamuragira), is a massive high-potassium basaltic shield about 25 km N of Lake Kivu and 13 km NNW of the steep-sided Nyiragongo volcano. The summit is truncated by a small 2 x 2.3 km caldera that has walls up to about 100 m high. Documented eruptions have occurred within the summit caldera, as well as from the numerous flank fissures and cinder cones. A lava lake in the summit crater, active since at least 1921, drained in 1938, at the time of a major flank eruption. Recent lava flows extend down the flanks more than 30 km from the summit as far as Lake Kivu; extensive lava flows from this volcano have covered 1,500 km2 of the western branch of the East African Rift.
Information Contacts: Observatoire Volcanologique de Goma (OVG), Departement de Geophysique, Centre de Recherche en Sciences Naturelles, Lwiro, D.S. Bukavu, DR Congo; Hawai'i Institute of Geophysics and Planetology (HIGP) - MODVOLC Thermal Alerts System, School of Ocean and Earth Science and Technology (SOEST), Univ. of Hawai'i, 2525 Correa Road, Honolulu, HI 96822, USA (URL: http://modis.higp.hawaii.edu/); MIROVA (Middle InfraRed Observation of Volcanic Activity), a collaborative project between the Universities of Turin and Florence (Italy) supported by the Centre for Volcanic Risk of the Italian Civil Protection Department (URL: http://www.mirovaweb.it/); NASA Global Sulfur Dioxide Monitoring Page, Atmospheric Chemistry and Dynamics Laboratory, NASA Goddard Space Flight Center (NASA/GSFC), 8800 Greenbelt Road, Goddard, Maryland, USA (URL: https://so2.gsfc.nasa.gov/); Copernicus Browser, Copernicus Data Space Ecosystem, European Space Agency (URL: https://dataspace.copernicus.eu/browser/); Charles Balagizi, Goma Volcano Observatory, Departement de Geophysique, Centre de Recherche en Sciences Naturelles, Lwiro, D.S. Bukavu, DR Congo.
Bagana (Papua New Guinea) — October 2023 Cite this Report
Bagana
Papua New Guinea
6.137°S, 155.196°E; summit elev. 1855 m
All times are local (unless otherwise noted)
Explosions, ash plumes, ashfall, and lava flows during April-September 2023
The remote volcano of Bagana is located in central Bougainville Island, Papua New Guinea. Recorded eruptions date back to 1842 and activity has consisted of effusive activity that has built a small lava dome in the summit crater and occasional explosions that produced pyroclastic flows. The most recent eruption has been ongoing since February 2000 and has produced occasional explosions, ash plumes, and lava flows. More recently, activity has been characterized by ongoing effusive activity and ash emissions (BGVN 48:04). This report updates activity from April through September 2023 that has consisted of explosions, ash plumes, ashfall, and lava flows, using information from the Darwin Volcanic Ash Advisory Center (VAAC) and satellite data.
An explosive eruption was reported on 7 July that generated a large gas-and-ash plume to high altitudes and caused significant ashfall in local communities; the eruption plume had reached upper tropospheric (16-18 km altitude) altitudes by 2200, according to satellite images. Sulfur dioxide plumes were detected in satellite images on 8 July and indicated that the plume was likely a mixture of gas, ice, and ash. A report issued by the Autonomous Bougainville Government (ABG) (Torokina District, Education Section) on 10 July noted that significant ash began falling during 2000-2100 on 7 July and covered most areas in the Vuakovi, Gotana (9 km SW), Koromaketo, Laruma (25 km W) and Atsilima (27 km NW) villages. Pyroclastic flows also occurred, according to ground-based reports; small deposits confined to one drainage were inspected by RVO during an overflight on 17 July and were confirmed to be from the 7 July event. Ashfall continued until 10 July and covered vegetation, which destroyed bushes and gardens and contaminated rivers and streams.
RVO reported another eruption on 14 July. The Darwin VAAC stated that an explosive event started around 0830 on 15 July and produced an ash plume that rose to 16.5 km altitude by 1000 and drifted N, according to satellite images. The plume continued to drift N and remained visible through 1900, and by 2150 it had dissipated.
Ashfall likely from both the 7 and 15 July events impacted about 8,111 people in Torokina (20 km SW), including Tsito/Vuakovi, Gotana, Koromaketo, Kenaia, Longkogari, Kenbaki, Piva (13 km SW), and Atsinima, and in the Tsitovi district, according to ABG. Significant ashfall was also reported in Ruruvu (22 km N) in the Wakunai District of Central Bougainville, though the thickness of these deposits could not be confirmed. An evacuation was called for the villages in Wakunai, where heavy ashfall had contaminated water sources; the communities of Ruruvu, Togarau, Kakarapaia, Karauturi, Atao, and Kuritaturi were asked to evacuate to a disaster center at the Wakunai District Station, and communities in Torokina were asked to evacuate to the Piva District station. According to a news article, more than 7,000 people needed temporary accommodations, with about 1,000 people in evacuation shelters. Ashfall had deposited over a broad area, contaminating water supplies, affecting crops, and collapsing some roofs and houses in rural areas. Schools were temporarily shut down. Intermittent ash emissions continued through the end of July and drifted NNW, NW, and SW. Fine ashfall was reported on the coast of Torokina, and ash plumes also drifted toward Laruma and Atsilima.
A small explosive eruption occurred at 2130 on 28 July that ejected material from the crater vents, according to reports from Torokina, in addition to a lava flow that contained two lobes. A second explosion was detected at 2157. Incandescence from the lava flow was visible from Piva as it descended the W flank around 2000 on 29 July (figure 47). The Darwin VAAC reported that a strong thermal anomaly was visible in satellite images during 30-31 July and that ash emissions rose to 2.4 km altitude and drifted WSW on 30 July. A ground report from RVO described localized emissions at 0900 on 31 July.
The Darwin VAAC reported that ash plumes were identified in satellite imagery at 0800 and 1220 on 12 August and rose to 2.1 km and 3 km altitude and drifted NW and W, respectively. A news report stated that aid was sent to more than 6,300 people that were adversely affected by the eruption. Photos taken during 17-19 August showed ash emissions rising no higher than 1 km above the summit and drifting SE. A small explosion generated an ash plume during the morning of 19 August. Deposits from small pyroclastic flows were also captured in the photos. Satellite images captured lava flows and pyroclastic flow deposits. Two temporary seismic stations were installed near Bagana on 17 August at distances of 7 km WSW (Vakovi station) and 11 km SW (Kepox station). The Kepox station immediately started to record continuous, low-frequency background seismicity.
Satellite data. Little to no thermal activity was detected during April through mid-July 2023; only one anomaly was recorded during early April and one during early June, according to MIROVA (Middle InfraRed Observation of Volcanic Activity) data (figure 48). Thermal activity increased in both power and frequency during mid-July through September, although there were still some short gaps in detected activity. MODVOLC also detected increased thermal activity during August; thermal hotspots were detected a total of five times on 19, 20, and 27 August. Weak thermal anomalies were also captured in infrared satellite images on clear weather days throughout the reporting period on 7, 12, and 17 April, 27 May, 1, 6, 16, and 31 July, and 19 September (figure 48); a strong thermal anomaly was visible on 31 July. Distinct sulfur dioxide plumes that drifted generally NW were intermittently captured by the TROPOMI instrument on the Sentinel-5P satellite and sometimes exceeded two Dobson Units (DUs) (figure 49).
Geologic Background. Bagana volcano, in a remote portion of central Bougainville Island, is frequently active. This massive symmetrical cone was largely constructed by an accumulation of viscous andesitic lava flows. The entire edifice could have been constructed in about 300 years at its present rate of lava production. Eruptive activity is characterized by non-explosive effusion of viscous lava that maintains a small lava dome in the summit crater, although occasional explosive activity produces pyroclastic flows. Lava flows with tongue-shaped lobes up to 50 m thick and prominent levees descend the flanks on all sides.
Information Contacts: Rabaul Volcano Observatory (RVO), Geohazards Management Division, Department of Mineral Policy and Geohazards Management (DMPGM), PO Box 3386, Kokopo, East New Britain Province, Papua New Guinea; Darwin Volcanic Ash Advisory Centre (VAAC), Bureau of Meteorology, Northern Territory Regional Office, PO Box 40050, Casuarina, NT 0811, Australia (URL: http://www.bom.gov.au/info/vaac/); MIROVA (Middle InfraRed Observation of Volcanic Activity), a collaborative project between the Universities of Turin and Florence (Italy) supported by the Centre for Volcanic Risk of the Italian Civil Protection Department (URL: http://www.mirovaweb.it/); Hawai'i Institute of Geophysics and Planetology (HIGP) - MODVOLC Thermal Alerts System, School of Ocean and Earth Science and Technology (SOEST), Univ. of Hawai'i, 2525 Correa Road, Honolulu, HI 96822, USA (URL: http://modis.higp.hawaii.edu/); NASA Global Sulfur Dioxide Monitoring Page, Atmospheric Chemistry and Dynamics Laboratory, NASA Goddard Space Flight Center (NASA/GSFC), 8800 Greenbelt Road, Goddard, Maryland, USA (URL: https://so2.gsfc.nasa.gov/); Copernicus Browser, Copernicus Data Space Ecosystem, European Space Agency (URL: https://dataspace.copernicus.eu/browser/); Autonomous Bougainville Government, P.O Box 322, Buka, AROB, PNG (URL: https://abg.gov.pg/); Andrew Tupper (Twitter: @andrewcraigtupp); Simon Carn, Geological and Mining Engineering and Sciences, Michigan Technological University, 1400 Townsend Drive, Houghton, MI 49931, USA (URL: http://www.volcarno.com/, Twitter: @simoncarn); Radio NZ (URL: https://www.rnz.co.nz/news/pacific/494464/more-than-7-000-people-in-bougainville-need-temporary-accommodation-after-eruption); USAID, 1300 Pennsylvania Ave, NW, Washington DC 20004, USA (URL: https://www.usaid.gov/pacific-islands/press-releases/aug-08-2023-united-states-provides-immediate-emergency-assistance-support-communities-affected-mount-bagana-volcanic-eruptions).
Mayon (Philippines) — October 2023 Cite this Report
Mayon
Philippines
13.257°N, 123.685°E; summit elev. 2462 m
All times are local (unless otherwise noted)
Lava flows, pyroclastic flows, ash emissions, and seismicity during April-September 2023
Mayon is located in the Philippines and has steep upper slopes capped by a small summit crater. Historical eruptions date back to 1616 CE that have been characterized by Strombolian eruptions, lava flows, pyroclastic flows, and mudflows. Eruptions mostly originated from a central conduit. Pyroclastic flows and mudflows have commonly descended many of the approximately 40 drainages that surround the volcano. The most recent eruption occurred during June through October 2022 and consisted of lava dome growth and gas-and-steam emissions (BGVN 47:12). A new eruption was reported during late April 2023 and has included lava flows, pyroclastic density currents, ash emissions, and seismicity. This report covers activity during April through September 2023 based on daily bulletins from the Philippine Institute of Volcanology and Seismology (PHIVOLCS).
During April through September 2023, PHIVOLCS reported near-daily rockfall events, frequent volcanic earthquakes, and sulfur dioxide measurements. Gas-and-steam emissions rose 100-900 m above the crater and drifted in different directions. Nighttime crater incandescence was often visible during clear weather and was accompanied by incandescent avalanches of material. Activity notably increased during June when lava flows were reported on the S, SE, and E flanks (figure 52). The MIROVA graph (Middle InfraRed Observation of Volcanic Activity) showed strong thermal activity coincident with these lava flows, which remained active through September (figure 53). According to the MODVOLC thermal algorithm, a total of 110 thermal alerts were detected during the reporting period: 17 during June, 40 during July, 27 during August, and 26 during September. During early June, pyroclastic density currents (PDCs) started to occur more frequently.
Low activity was reported during much of April and May; gas-and-steam emissions rose 100-900 m above the crater and generally drifted in different directions. A total of 52 rockfall events and 18 volcanic earthquakes were detected during April and 147 rockfall events and 13 volcanic events during May. Sulfur dioxide flux measurements ranged between 400-576 tons per day (t/d) during April, the latter of which was measured on 29 April and between 162-343 t/d during May, the latter of which was measured on 13 May.
Activity during June increased, characterized by lava flows, pyroclastic density currents (PDCs), crater incandescence and incandescent rockfall events, gas-and-steam emissions, and continued seismicity. Weather clouds often prevented clear views of the summit, but during clear days, moderate gas-and-steam emissions rose 100-2,500 m above the crater and drifted in multiple directions. A total of 6,237 rockfall events and 288 volcanic earthquakes were detected. The rockfall events often deposited material on the S and SE flanks within 700-1,500 m of the summit crater and ash from the events drifted SW, S, SE, NE, and E. Sulfur dioxide emissions ranged between 149-1,205 t/d, the latter of which was measured on 10 June. Short-term observations from EDM and electronic tiltmeter monitoring indicated that the upper slopes were inflating since February 2023. Longer-term ground deformation parameters based on EDM, precise leveling, continuous GPS, and electronic tilt monitoring indicated that the volcano remained inflated, especially on the NW and SE flanks. At 1000 on 5 June the Volcano Alert Level (VAL) was raised to 2 (on a 0-5 scale). PHIVOLCS noted that although low-level volcanic earthquakes, ground deformation, and volcanic gas emissions indicated unrest, the steep increase in rockfall frequency may indicate increased dome activity.
A total of 151 dome-collapse PDCs occurred during 8-9 and 11-30 June, traveled 500-2,000 m, and deposited material on the S flank within 2 km of the summit crater. During 8-9 June the VAL was raised to 3. At approximately 1947 on 11 June lava flow activity was reported; two lobes traveled within 500 m from the crater and deposited material on the S (Mi-isi), SE (Bonga), and E (Basud) flanks. Weak seismicity accompanied the lava flow and slight inflation on the upper flanks. This lava flow remained active through 30 June, moving down the S and SE flank as far as 2.5 km and 1.8 km, respectively and depositing material up to 3.3 km from the crater. During 15-16 June traces of ashfall from the PDCs were reported in Sitio Buga, Nabonton, City of Ligao and Purok, and San Francisco, Municipality of Guinobatan. During 28-29 June there were two PDCs generated by the collapse of the lava flow front, which generated a light-brown ash plume 1 km high. Satellite monitors detected significant concentrations of sulfur dioxide beginning on 29 June. On 30 June PDCs primarily affected the Basud Gully on the E flank, the largest of which occurred at 1301 and lasted eight minutes, based on the seismic record. Four PDCs generated between 1800 and 2000 that lasted approximately four minutes each traveled 3-4 km on the E flank and generated an ash plume that rose 1 km above the crater and drifted N and NW. Ashfall was recorded in Tabaco City.
Similar strong activity continued during July; slow lava effusion remained active on the S and SE flanks and traveled as far as 2.8 km and 2.8 km, respectively and material was deposited as far as 4 km from the crater. There was a total of 6,983 rockfall events and 189 PDCs that affected the S, SE, and E flanks. The volcano network detected a total of 2,124 volcanic earthquakes. Continuous gas-and-steam emissions rose 200-2,000 m above the crater and drifted in multiple directions. Sulfur dioxide emissions averaged 792-4,113 t/d, the latter of which was measured on 28 July. During 2-4 July three PDCs were generated from the collapse of the lava flow and resulting light brown plumes rose 200-300 m above the crater. Continuous tremor pulses were reported beginning at 1547 on 3 July through 7 July at 1200, at 2300 on 8 July and going through 0300 on 10 July, and at 2300 on 16 July, as recorded by the seismic network. During 6-9 July there were 10 lava flow-collapse-related PDCs that generated light brown plumes 300-500 m above the crater. During 10-11 July light ashfall was reported in some areas of Mabinit, Legazpi City, Budiao and Salvacion, Daraga, and Camalig, Albay. By 18 July the lava flow advanced 600 m on the E flank as well.
During 1733 on 18 July and 0434 on 19 July PHIVOLCS reported 30 “ashing” events, which are degassing events accompanied by audible thunder-like sounds and entrained ash at the crater, which produced short, dark plumes that drifted SW. These events each lasted 20-40 seconds, and plume heights ranged from 150-300 m above the crater, as recorded by seismic, infrasound, visual, and thermal monitors. Three more ashing events occurred during 19-20 July. Short-term observations from electronic tilt and GPS monitoring indicate deflation on the E lower flanks in early July and inflation on the NW middle flanks during the third week of July. Longer-term ground deformation parameters from EDM, precise leveling, continuous GPS, and electronic tilt monitoring indicated that the volcano was still generally inflated relative to baseline levels. A short-lived lava pulse lasted 28 seconds at 1956 on 21 July, which was accompanied by seismic and infrasound signals. By 22 July, the only lava flow that remained active was on the SE flank, and continued to extend 3.4 km, while those on the S and E flanks weakened markedly. One ashing event was detected during 30-31 July, whereas there were 57 detected during 31 July-1 August; according to PHIVOLCS beginning at approximately 1800 on 31 July eruptive activity was dominated by phases of intermittent ashing, as well as increased in the apparent rates of lava effusion from the summit crater. The ashing phases consisted of discrete events recorded as low-frequency volcanic earthquakes (LFVQ) typically 30 seconds in duration, based on seismic and infrasound signals. Gray ash plume rose 100 m above the crater and generally drifted NE. Shortly after these ashing events began, new lava began to effuse rapidly from the crater, feeding the established flowed on the SE, E, and E flanks and generating frequent rockfall events.
Intensified unrest persisted during August. There was a total of 4,141 rockfall events, 2,881 volcanic earthquakes, which included volcanic tremor events, 32 ashing events, and 101 PDCs detected throughout the month. On clear weather days, gas-and-steam emissions rose 300-1,500 m above the crater and drifted in different directions (figure 54). Sulfur dioxide emissions averaged 735-4,756 t/d, the higher value of which was measured on 16 August. During 1-2 August the rate of lava effusion decreased, but continued to feed the flows on the SE, S, and E flanks, maintaining their advances to 3.4 km, 2.8 km, and 1.1 km from the crater, respectively (figure 55). Rockfall and PDCs generated by collapses at the lava flow margins and from the summit dome deposited material within 4 km of the crater. During 3-4 August there were 10 tremor events detected that lasted 1-4 minutes. Short-lived lava pulse lasted 35 seconds and was accompanied by seismic and infrasound signals at 0442 on 6 August. Seven collapses were recorded at the front of the lava flow during 12-14 August.
During September, similar activity of slow lava effusion, PDCs, gas-and-steam emissions, and seismicity continued. There was a total of 4,452 rockfall events, 329 volcanic earthquakes, which included volcanic tremor events, two ashing events, and 85 PDCs recorded throughout the month. On clear weather days, gas-and-steam emissions rose 100-1,500 m above the crater and drifted in multiple directions. Sulfur dioxide emissions averaged 609-2,252 t/d, the higher average of which was measured on 6 September. Slow lava effusion continued advancing on the SE, S, and E flanks, maintaining lengths of 3.4 km, 2.8 km, and 1.1 km, respectively. Rockfall and PDC events generated by collapses along the lava flow margins and at the summit dome deposited material within 4 km of the crater.
Geologic Background. Symmetrical Mayon, which rises above the Albay Gulf NW of Legazpi City, is the most active volcano of the Philippines. The steep upper slopes are capped by a small summit crater. Recorded eruptions since 1616 CE range from Strombolian to basaltic Plinian, with cyclical activity beginning with basaltic eruptions, followed by longer periods of andesitic lava flows. Eruptions occur predominately from the central conduit and have also produced lava flows that travel far down the flanks. Pyroclastic density currents and mudflows have commonly swept down many of the approximately 40 ravines that radiate from the summit and have often damaged populated lowland areas. A violent eruption in 1814 killed more than 1,200 people and devastated several towns.
Information Contacts: Philippine Institute of Volcanology and Seismology (PHIVOLCS), Department of Science and Technology, University of the Philippines Campus, Diliman, Quezon City, Philippines (URL: http://www.phivolcs.dost.gov.ph/); MIROVA (Middle InfraRed Observation of Volcanic Activity), a collaborative project between the Universities of Turin and Florence (Italy) supported by the Centre for Volcanic Risk of the Italian Civil Protection Department (URL: http://www.mirovaweb.it/); Hawai'i Institute of Geophysics and Planetology (HIGP) - MODVOLC Thermal Alerts System, School of Ocean and Earth Science and Technology (SOEST), Univ. of Hawai'i, 2525 Correa Road, Honolulu, HI 96822, USA (URL: http://modis.higp.hawaii.edu/); Copernicus Browser, Copernicus Data Space Ecosystem, European Space Agency (URL: https://dataspace.copernicus.eu/browser/); William Rogers, Legazpi City, Albay Province, Philippines.
Nishinoshima (Japan) — October 2023 Cite this Report
Nishinoshima
Japan
27.247°N, 140.874°E; summit elev. 100 m
All times are local (unless otherwise noted)
Eruption plumes and gas-and-steam plumes during May-August 2023
Nishinoshima, located about 1,000 km S of Tokyo, is a small island in the Ogasawara Arc in Japan. The island is the summit of a massive submarine volcano that has prominent submarine peaks to the S, W, and NE. Eruptions date back to 1973 and the current eruption period began in October 2022. Recent activity has consisted of small ash plumes and fumarolic activity (BGVN 48:07). This report covers activity during May through August 2023, using information from monthly reports of the Japan Meteorological Agency (JMA) monthly reports and satellite data.
Activity during May through June was relatively low. The Japan Coast Guard (JCG) did overflights on 14 and 22 June and reported white gas-and-steam emissions rising 600 m and 1,200 m from the central crater of the pyroclastic cone, respectively (figure 125). In addition, multiple white gas-and-steam emissions rose from the inner rim of the W side of the crater and from the SE flank of the pyroclastic cone. Discolored brown-to-green water was observed around almost the entire perimeter of the island; on 22 June light green discolored water was observed off the S coast of the island.
Observations from the Himawari meteorological satellite confirmed an eruption on 9 and 10 July. An eruption plume rose 1.6 km above the crater and drifted N around 1300 on 9 July. Satellite images acquired at 1420 and 2020 on 9 July and at 0220 on 10 July showed continuing emissions that rose 1.3-1.6 km above the crater and drifted NE and N. The Tokyo VAAC reported that an ash plume seen by a pilot and identified in a satellite image at 0630 on 21 July rose to 3 km altitude and drifted S.
Aerial observations conducted by JCG on 8 August showed a white-and-gray plume rising from the central crater of the pyroclastic cone, and multiple white gas-and-steam emissions were rising from the inner edge of the western crater and along the NW-SE flanks of the island (figure 126). Brown-to-green discolored water was also noted around the perimeter of the island.
Intermittent low-to-moderate power thermal anomalies were recorded in the MIROVA graph (Middle InfraRed Observation of Volcanic Activity), showing an increase in both frequency and power beginning in July (figure 127). This increase in activity coincides with eruptive activity on 9 and 10 July, characterized by eruption plumes. According to the MODVOLC thermal alert algorithm, one thermal hotspot was recorded on 20 July. Weak thermal anomalies were also detected in infrared satellite imagery, accompanied by strong gas-and-steam plumes (figure 128).
Geologic Background. The small island of Nishinoshima was enlarged when several new islands coalesced during an eruption in 1973-74. Multiple eruptions that began in 2013 completely covered the previous exposed surface and continued to enlarge the island. The island is the summit of a massive submarine volcano that has prominent peaks to the S, W, and NE. The summit of the southern cone rises to within 214 m of the ocean surface 9 km SSE.
Information Contacts: Japan Meteorological Agency (JMA), 1-3-4 Otemachi, Chiyoda-ku, Tokyo 100-8122, Japan (URL: http://www.jma.go.jp/jma/indexe.html); Tokyo Volcanic Ash Advisory Center (VAAC), 1-3-4 Otemachi, Chiyoda-ku, Tokyo 100-8122, Japan (URL: http://ds.data.jma.go.jp/svd/vaac/data/); MIROVA (Middle InfraRed Observation of Volcanic Activity), a collaborative project between the Universities of Turin and Florence (Italy) supported by the Centre for Volcanic Risk of the Italian Civil Protection Department (URL: http://www.mirovaweb.it/); Copernicus Browser, Copernicus Data Space Ecosystem, European Space Agency (URL: https://dataspace.copernicus.eu/browser/).
Krakatau (Indonesia) — October 2023 Cite this Report
Krakatau
Indonesia
6.1009°S, 105.4233°E; summit elev. 285 m
All times are local (unless otherwise noted)
White gas-and-steam plumes and occasional ash plumes during May-August 2023
Krakatau is located in the Sunda Strait between Java and Sumatra, Indonesia. Caldera collapse during the catastrophic 1883 eruption destroyed Danan and Perbuwatan cones and left only a remnant of Rakata. The post-collapse cone of Anak Krakatau (Child of Krakatau) was constructed within the 1883 caldera at a point between the former Danan and Perbuwatan cones; it has been the site of frequent eruptions since 1927. The current eruption period began in May 2021 and has recently consisted of Strombolian eruptions and ash plumes (BGVN 48:07). This report describes lower levels of activity consisting of ash and white gas-and-steam plumes during May through August 2023, based on information provided by the Indonesian Center for Volcanology and Geological Hazard Mitigation, referred to as Pusat Vulkanologi dan Mitigasi Bencana Geologi (PVMBG), MAGMA Indonesia, and satellite data.
Activity was relatively low during May and June. Daily white gas-and-steam emissions rose 25-200 m above the crater and drifted in different directions. Five ash plumes were detected at 0519 on 10 May, 1241 on 11 May, 0920 on 12 May, 2320 on 12 May, and at 0710 on 13 May, and rose 1-2.5 km above the crater and drifted SW. A webcam image taken on 12 May showed ejection of incandescent material above the vent. A total of nine ash plumes were detected during 6-11 June: at 1434 and 00220 on 6 and 7 June the ash plumes rose 500 m above the crater and drifted NW, at 1537 on 8 June the ash plume rose 1 km above the crater and drifted SW, at 0746 and at 0846 on 9 June the ash plumes rose 800 m and 3 km above the crater and drifted SW, respectively, at 0423, 1431, and 1750 on 10 June the ash plumes rose 2 km, 1.5 km, and 3.5 km above the crater and drifted NW, respectively, and at 0030 on 11 June an ash plume rose 2 km above the crater and drifted NW. Webcam images taken on 10 and 11 June at 0455 and 0102, respectively, showed incandescent material ejected above the vent. On 19 June an ash plume at 0822 rose 1.5 km above the crater and drifted SE.
Similar low activity of white gas-and-steam emissions and few ash plumes were reported during July and August. Daily white gas-and-steam emissions rose 25-300 m above the crater and drifted in multiple directions. Three ash plumes were reported at 0843, 0851, and 0852 on 20 July that rose 500-2,000 m above the crater and drifted NW.
The MIROVA (Middle InfraRed Observation of Volcanic Activity) graph of MODIS thermal anomaly data showed intermittent low-to-moderate power thermal anomalies during May through August 2023 (figure 140). Although activity was often obscured by weather clouds, a thermal anomaly was visible in an infrared satellite image of the crater on 12 May, accompanied by an eruption plume that drifted SW (figure 141).
Geologic Background. The renowned Krakatau (frequently mis-named as Krakatoa) volcano lies in the Sunda Strait between Java and Sumatra. Collapse of an older edifice, perhaps in 416 or 535 CE, formed a 7-km-wide caldera. Remnants of that volcano are preserved in Verlaten and Lang Islands; subsequently the Rakata, Danan, and Perbuwatan cones were formed, coalescing to create the pre-1883 Krakatau Island. Caldera collapse during the catastrophic 1883 eruption destroyed Danan and Perbuwatan, and left only a remnant of Rakata. This eruption caused more than 36,000 fatalities, most as a result of tsunamis that swept the adjacent coastlines of Sumatra and Java. Pyroclastic surges traveled 40 km across the Sunda Strait and reached the Sumatra coast. After a quiescence of less than a half century, the post-collapse cone of Anak Krakatau (Child of Krakatau) was constructed within the 1883 caldera at a point between the former Danan and Perbuwatan cones. Anak Krakatau has been the site of frequent eruptions since 1927.
Information Contacts: Pusat Vulkanologi dan Mitigasi Bencana Geologi (PVMBG, also known as Indonesian Center for Volcanology and Geological Hazard Mitigation, CVGHM), Jalan Diponegoro 57, Bandung 40122, Indonesia (URL: http://www.vsi.esdm.go.id/); MAGMA Indonesia, Kementerian Energi dan Sumber Daya Mineral (URL: https://magma.esdm.go.id/v1); MIROVA (Middle InfraRed Observation of Volcanic Activity), a collaborative project between the Universities of Turin and Florence (Italy) supported by the Centre for Volcanic Risk of the Italian Civil Protection Department (URL: http://www.mirovaweb.it/); Copernicus Browser, Copernicus Data Space Ecosystem, European Space Agency (URL: https://dataspace.copernicus.eu/browser/).
Villarrica (Chile) — October 2023 Cite this Report
Villarrica
Chile
39.42°S, 71.93°W; summit elev. 2847 m
All times are local (unless otherwise noted)
Strombolian activity, gas-and-ash emissions, and crater incandescence during April-September 2023
Villarrica, in central Chile, consists of a 2-km-wide caldera that formed about 3,500 years ago and is located at the base of the presently active cone at the NW margin of a 6-km-wide caldera. Historical eruptions eruptions date back to 1558 and have been characterized by mild-to-moderate explosive activity with occasional lava effusions. The current eruption period began in December 2014 and has recently consisted of nighttime crater incandescence, ash emissions, and seismicity (BGVN 48:04). This report covers activity during April through September 2023 and describes occasional Strombolian activity, gas-and-ash emissions, and nighttime crater incandescence. Information for this report primarily comes from the Southern Andes Volcano Observatory (Observatorio Volcanológico de Los Andes del Sur, OVDAS), part of Chile's National Service of Geology and Mining (Servicio Nacional de Geología y Minería, SERNAGEOMIN) and satellite data.
Seismicity during April consisted of long period (LP) events and tremor (TRE); a total of 9,413 LP-type events and 759 TR-type events were detected throughout the month. Nighttime crater incandescence persisted and was visible in the degassing column. Sulfur dioxide data was obtained using Differential Absorption Optical Spectroscopy Equipment (DOAS) that showed an average value of 1,450 ± 198 tons per day (t/d) during 1-15 April and 1,129 ± 201 t/d during 16-30 April, with a maximum daily value of 2,784 t/d on 9 April. Gas-and-steam emissions of variable intensities rose above the active crater as high as 1.3 km above the crater on 13 April. Strombolian explosions were not observed and there was a slight decrease in the lava lake level.
There were 14,123 LP-type events and 727 TR-type events detected during May. According to sulfur dioxide measurements taken with DOAS equipment, the active crater emitted an average value of 1,826 ± 482 t/d during 1-15 May and 912 ± 41 t/d during 16-30 May, with a daily maximum value of 5,155 t/d on 13 May. Surveillance cameras showed continuous white gas-and-steam emissions that rose as high as 430 m above the crater on 27 May. Nighttime incandescence illuminated the gas column less than 300 m above the crater rim was and no pyroclastic emissions were reported. A landslide was identified on 13 May on the E flank of the volcano 50 m from the crater rim and extending 300 m away; SERNAGEOMIN noted that this event may have occurred on 12 May. During the morning of 27 and 28 May minor Strombolian explosions characterized by incandescent ejecta were recorded at the crater rim; the last reported Strombolian explosions had occurred at the end of March.
Seismic activity during June consisted of five volcano-tectonic (VT)-type events, 21,606 LP-type events, and 2,085 TR-type events. The average value of sulfur dioxide flux obtained by DOAS equipment was 1,420 ± 217 t/d during 1-15 June and 2,562 ± 804 t/d, with a maximum daily value of 4,810 t/d on 17 June. White gas-and-steam emissions rose less than 480 m above the crater; frequent nighttime crater incandescence was reflected in the degassing plume. On 12 June an emission rose 100 m above the crater and drifted NNW. On 15 June one or several emissions resulted in ashfall to the NE as far as 5.5 km from the crater, based on a Skysat satellite image. Several Strombolian explosions occurred within the crater; activity on 15 June was higher energy and ejected blocks 200-300 m on the NE slope. Surveillance cameras showed white gas-and-steam emissions rising 480 m above the crater on 16 June. On 19 and 24 June low-intensity Strombolian activity was observed, ejecting material as far as 200 m from the center of the crater to the E.
During July, seismicity included 29,319 LP-type events, 3,736 TR-type events, and two VT-type events. DOAS equipment recorded two days of sulfur dioxide emissions of 4,220 t/d and 1,009 t/d on 1 and 13 July, respectively. Constant nighttime incandescence was also recorded and was particularly noticeable when accompanied by eruptive columns on 12 and 16 July. Minor explosive events were detected in the crater. According to Skysat satellite images taken on 12, 13, and 16 July, ashfall deposits were identified 155 m S of the crater. According to POVI, incandescence was visible from two vents on the crater floor around 0336 on 12 July. Gas-and-ash emissions rose as high as 1.2 km above the crater on 13 July and drifted E and NW. A series of gas-and-steam pulses containing some ash deposited material on the upper E flank around 1551 on 13 July. During 16-31 July, average sulfur dioxide emissions of 1,679 ± 406 t/d were recorded, with a maximum daily value of 2,343 t/d on 28 July. Fine ash emissions were also reported on 16, 17, and 23 July.
Seismicity persisted during August, characterized by 27,011 LP-type events, 3,323 TR-type events, and three VT-type events. The average value of sulfur dioxide measurements taken during 1-15 August was 1,642 ± 270 t/d and 2,207 ± 4,549 t/d during 16-31 August, with a maximum daily value of 3,294 t/d on 27 August. Nighttime crater incandescence remained visible in degassing columns. White gas-and-steam emissions rose 480 m above the crater on 6 August. According to a Skysat satellite image from 6 August, ash accumulation was observed proximal to the crater and was mainly distributed toward the E slope. White gas-and-steam emissions rose 320 m above the crater on 26 August. Nighttime incandescence and Strombolian activity that generated ash emissions were reported on 27 August.
Seismicity during September was characterized by five VT-type events, 12,057 LP-type events, and 2,058 TR-type events. Nighttime incandescence persisted. On 2 September an ash emission rose 180 m above the crater and drifted SE at 1643 (figure 125) and a white gas-and-steam plume rose 320 m above the crater. According to the Buenos Aires VAAC, periods of continuous gas-and-ash emissions were visible in webcam images from 1830 on 2 September to 0110 on 3 September. Strombolian activity was observed on 2 September and during the early morning of 3 September, the latter event of which generated an ash emission that rose 60 m above the crater and drifted 100 m from the center of the crater to the NE and SW. Ashfall was reported to the SE and S as far as 750 m from the crater. The lava lake was active during 3-4 September and lava fountaining was visible for the first time since 26 March 2023, according to POVI. Fountains captured in webcam images at 2133 on 3 September and at 0054 on 4 September rose as high as 60 m above the crater rim and ejected material onto the upper W flank. Sulfur dioxide flux of 1,730 t/d and 1,281 t/d was measured on 3 and 4 September, respectively, according to data obtained by DOAS equipment.
Strong Strombolian activity and larger gas-and-ash plumes were reported during 18-20 September. On 18 September activity was also associated with energetic LP-type events and notable sulfur dioxide fluxes (as high as 4,277 t/d). On 19 September Strombolian activity and incandescence were observed. On 20 September at 0914 ash emissions rose 50 m above the crater and drifted SSE, accompanied by Strombolian activity that ejected material less than 100 m SSE, causing fall deposits on that respective flank. SERNAGEOMIN reported that a Planet Scope satellite image taken on 20 September showed the lava lake in the crater, measuring 32 m x 35 m and an area of 0.001 km2. Several ash emissions were recorded at 0841, 0910, 1251, 1306, 1312, 1315, and 1324 on 23 September and rose less than 150 m above the crater. The sulfur dioxide flux value was 698 t/d on 23 September and 1,097 t/d on 24 September. On 24 September the Volcanic Alert Level (VAL) was raised to Orange (the third level on a four-color scale). SENAPRED maintained the Alert Level at Yellow (the middle level on a three-color scale) for the communities of Villarrica, Pucón (16 km N), Curarrehue, and Panguipulli.
During 24-25 September there was an increase in seismic energy (observed at TR-events) and acoustic signals, characterized by 1 VT-type event, 213 LP-type events, and 124 TR-type events. Mainly white gas-and-steam emissions, in addition to occasional fine ash emissions were recorded. During the early morning of 25 September Strombolian explosions were reported and ejected material 250 m in all directions, though dominantly toward the NW. On 25 September the average value of sulfur dioxide flux was 760 t/d. Seismicity during 25-30 September consisted of five VT-type events, 1,937 LP-type events, and 456 TR-type events.
During 25-29 September moderate Strombolian activity was observed and ejected material as far as the crater rim. In addition, ash pulses lasting roughly 50 minutes were observed around 0700 and dispersed ENE. During 26-27 September a TR episode lasted 6.5 hours and was accompanied by discrete acoustic signals. Satellite images from 26 September showed a spatter cone on the crater floor with one vent that measured 10 x 14 m and a smaller vent about 35 m NE of the cone. SERNAGEOMIN reported an abundant number of bomb-sized blocks up to 150 m from the crater, as well as impact marks on the snow, which indicated explosive activity. A low-altitude ash emission was observed drifting NW around 1140 on 28 September, based on webcam images. Between 0620 and 0850 on 29 September an ash emission rose 60 m above the crater and drifted NW. During an overflight taken around 1000 on 29 September scientists observed molten material in the vent, a large accumulation of pyroclasts inside the crater, and energetic degassing, some of which contained a small amount of ash. Block-sized pyroclasts were deposited on the internal walls and near the crater, and a distal ash deposit was also visible. The average sulfur dioxide flux measured on 28 September was 344 t/d. Satellite images taken on 29 September ashfall was deposited roughly 3 km WNW from the crater and nighttime crater incandescence remained visible. The average sulfur dioxide flux value from 29 September was 199 t/d. On 30 September at 0740 a pulsating ash emission rose 1.1 km above the crater and drifted NNW (figure 126). Deposits on the S flank extended as far as 4.5 km from the crater rim, based on satellite images from 30 September.
Infrared MODIS satellite data processed by MIROVA (Middle InfraRed Observation of Volcanic Activity) showed intermittent thermal activity during April through September, with slightly stronger activity detected during late September (figure 127). Small clusters of thermal activity were detected during mid-June, early July, early August, and late September. According to the MODVOLC thermal alert system, a total of four thermal hotspots were detected on 7 July and 3 and 23 September. This activity was also intermittently captured in infrared satellite imagery on clear weather days (figure 128).
Geologic Background. The glacier-covered Villarrica stratovolcano, in the northern Lakes District of central Chile, is ~15 km south of the city of Pucon. A 2-km-wide caldera that formed about 3,500 years ago is located at the base of the presently active, dominantly basaltic to basaltic andesite cone at the NW margin of a 6-km-wide Pleistocene caldera. More than 30 scoria cones and fissure vents are present on the flanks. Plinian eruptions and pyroclastic flows that have extended up to 20 km from the volcano were produced during the Holocene. Lava flows up to 18 km long have issued from summit and flank vents. Eruptions documented since 1558 CE have consisted largely of mild-to-moderate explosive activity with occasional lava effusion. Glaciers cover 40 km2 of the volcano, and lahars have damaged towns on its flanks.
Information Contacts: Servicio Nacional de Geología y Minería (SERNAGEOMIN), Observatorio Volcanológico de Los Andes del Sur (OVDAS), Avda Sta María No. 0104, Santiago, Chile (URL: http://www.sernageomin.cl/); Proyecto Observación Villarrica Internet (POVI) (URL: http://www.povi.cl/); Sistema y Servicio Nacional de Prevención y Repuesta Ante Desastres (SENAPRED), Av. Beauchef 1671, Santiago, Chile (URL: https://web.senapred.cl/); Buenos Aires Volcanic Ash Advisory Center (VAAC), Servicio Meteorológico Nacional-Fuerza Aérea Argentina, 25 de mayo 658, Buenos Aires, Argentina (URL: http://www.smn.gov.ar/vaac/buenosaires/inicio.php); MIROVA (Middle InfraRed Observation of Volcanic Activity), a collaborative project between the Universities of Turin and Florence (Italy) supported by the Centre for Volcanic Risk of the Italian Civil Protection Department (URL: http://www.mirovaweb.it/); Hawai'i Institute of Geophysics and Planetology (HIGP) - MODVOLC Thermal Alerts System, School of Ocean and Earth Science and Technology (SOEST), Univ. of Hawai'i, 2525 Correa Road, Honolulu, HI 96822, USA (URL: http://modis.higp.hawaii.edu/); Copernicus Browser, Copernicus Data Space Ecosystem, European Space Agency (URL: https://dataspace.copernicus.eu/browser/).
Merapi (Indonesia) — October 2023 Cite this Report
Merapi
Indonesia
7.54°S, 110.446°E; summit elev. 2910 m
All times are local (unless otherwise noted)
Frequent incandescent avalanches during April-September 2023
Merapi, located just north of the major city of Yogyakarta in central Java, Indonesia, has had activity within the last 20 years characterized by pyroclastic flows and lahars accompanying growth and collapse of the steep-sided active summit lava dome. The current eruption period began in late December 2020 and has more recently consisted of ash plumes, intermittent incandescent avalanches of material, and pyroclastic flows (BGVN 48:04). This report covers activity during April through September 2023, based on information from Balai Penyelidikan dan Pengembangan Teknologi Kebencanaan Geologi (BPPTKG), the Center for Research and Development of Geological Disaster Technology, a branch of PVMBG which specifically monitors Merapi. Additional information comes from the Pusat Vulkanologi dan Mitigasi Bencana Geologi (PVMBG, also known as Indonesian Center for Volcanology and Geological Hazard Mitigation, CVGHM), MAGMA Indonesia, the Darwin Volcanic Ash Advisory Centre (VAAC), and various satellite data.
Activity during April through September 2023 primarily consisted of incandescent avalanches of material that mainly affected the SW and W flanks and traveled as far as 2.3 km from the summit (table 25) and white gas-and-steam emissions that rose 10-1,000 m above the crater.
Table 25. Monthly summary of avalanches and avalanche distances recorded at Merapi during April through September 2023. The number of reported avalanches does not include instances where possible avalanches were heard but could not be visually confirmed as a result of inclement weather. Data courtesy of BPPTKG (April-September 2023 daily reports).
| Month |
Average number of avalanches per day |
Distance avalanches traveled (m) |
| Apr 2023 |
19 |
1,200-2,000 |
| May 2023 |
22 |
500-2,000 |
| Jun 2023 |
18 |
1,200-2,000 |
| Jul 2023 |
30 |
300-2,000 |
| Aug 2023 |
25 |
400-2,300 |
| Sep 2023 |
23 |
600-2,000 |
BPPTKG reported that during April and May white gas-and-steam emissions rose 10-750 m above the crater, incandescent avalanches descended 500-2,000 m on the SW and W flanks (figure 135). Cloudy weather often prevented clear views of the summit, and sometimes avalanches could not be confirmed. According to a webcam image, a pyroclastic flow was visible on 17 April at 0531. During the week of 28 April and 4 May a pyroclastic flow was reported on the SW flank, traveling up to 2.5 km. According to a drone overflight taken on 17 May the SW lava dome volume was an estimated 2,372,800 cubic meters and the dome in the main crater was an estimated 2,337,300 cubic meters.
During June and July similar activity persisted with white gas-and-steam emissions rising 10-350 m above the crater and frequent incandescent avalanches that traveled 300-2,000 m down the SW, W, and S flanks (figure 136). Based on an analysis of aerial photos taken on 24 June the volume of the SW lava dome was approximately 2.5 million cubic meters. A pyroclastic flow was observed on 5 July that traveled 2.7 km on the SW flank. According to the Darwin VAAC multiple minor ash plumes were identified in satellite images on 19 July that rose to 3.7 km altitude and drifted S and SW. During 22, 25, and 26 July a total of 17 avalanches descended as far as 1.8 km on the S flank.
Frequent white gas-and-steam emissions continued during August and September, rising 10-450 m above the crater. Incandescent avalanches mainly affected the SW and W flanks and traveled 400-2,300 m from the vent (figure 137). An aerial survey conducted on 10 August was analyzed and reported that estimates of the SW dome volume was 2,764,300 cubic meters and the dome in the main crater was 2,369,800 cubic meters.
Frequent and moderate-power thermal activity continued throughout the reporting period, according to a MIROVA (Middle InfraRed Observation of Volcanic Activity) analysis of MODIS satellite data (figure 138). There was an increase in the number of detected anomalies during mid-May. The MODVOLC thermal algorithm recorded a total of 47 thermal hotspots: six during April, nine during May, eight during June, 15 during July, four during August, and five during September. Some of this activity was captured in infrared satellite imagery on clear weather days, sometimes accompanied by incandescent material on the SW flank (figure 139).
Geologic Background. Merapi, one of Indonesia's most active volcanoes, lies in one of the world's most densely populated areas and dominates the landscape immediately north of the major city of Yogyakarta. It is the youngest and southernmost of a volcanic chain extending NNW to Ungaran volcano. Growth of Old Merapi during the Pleistocene ended with major edifice collapse perhaps about 2,000 years ago, leaving a large arcuate scarp cutting the eroded older Batulawang volcano. Subsequent growth of the steep-sided Young Merapi edifice, its upper part unvegetated due to frequent activity, began SW of the earlier collapse scarp. Pyroclastic flows and lahars accompanying growth and collapse of the steep-sided active summit lava dome have devastated cultivated lands on the western-to-southern flanks and caused many fatalities.
Information Contacts: Balai Penyelidikan dan Pengembangan Teknologi Kebencanaan Geologi (BPPTKG), Center for Research and Development of Geological Disaster Technology (URL: http://merapi.bgl.esdm.go.id/, Twitter: @BPPTKG); MAGMA Indonesia, Kementerian Energi dan Sumber Daya Mineral (URL: https://magma.esdm.go.id/v1); Pusat Vulkanologi dan Mitigasi Bencana Geologi (PVMBG, also known as Indonesian Center for Volcanology and Geological Hazard Mitigation, CVGHM), Jalan Diponegoro 57, Bandung 40122, Indonesia (URL: http://www.vsi.esdm.go.id/); Darwin Volcanic Ash Advisory Centre (VAAC), Bureau of Meteorology, Northern Territory Regional Office, PO Box 40050, Casuarina, NT 0811, Australia (URL: http://www.bom.gov.au/info/vaac/); MIROVA (Middle InfraRed Observation of Volcanic Activity), a collaborative project between the Universities of Turin and Florence (Italy) supported by the Centre for Volcanic Risk of the Italian Civil Protection Department (URL: http://www.mirovaweb.it/); Hawai'i Institute of Geophysics and Planetology (HIGP) - MODVOLC Thermal Alerts System, School of Ocean and Earth Science and Technology (SOEST), Univ. of Hawai'i, 2525 Correa Road, Honolulu, HI 96822, USA (URL: http://modis.higp.hawaii.edu/); Copernicus Browser, Copernicus Data Space Ecosystem, European Space Agency (URL: https://dataspace.copernicus.eu/browser/); Øystein Lund Andersen (URL: https://www.oysteinlundandersen.com/, https://twitter.com/oysteinvolcano).
Ebeko
Russia
50.686°N, 156.014°E; summit elev. 1103 m
All times are local (unless otherwise noted)
Moderate explosive activity with ash plumes continued during June-November 2023
Ebeko, located on the N end of Paramushir Island in Russia’s Kuril Islands just S of the Kamchatka Peninsula, consists of three summit craters along a SSW-NNE line at the northern end of a complex of five volcanic cones. Observed eruptions date back to the late 18th century and have been characterized as small-to-moderate explosions from the summit crater, accompanied by intense fumarolic activity. The current eruptive period began in June 2022, consisting of frequent explosions, ash plumes, and thermal activity (BGVN 47:10, 48:06). This report covers similar activity during June-November 2023, based on information from the Kamchatka Volcanic Eruptions Response Team (KVERT) and satellite data.
Moderate explosive activity continued during June-November 2023 (figures 50 and 51). According to visual data from Severo-Kurilsk, explosions sent ash 2-3.5 km above the summit (3-4.5 km altitude) during most days during June through mid-September. Activity after mid-September was slightly weaker, with ash usually reaching less than 2 km above the summit. According to KVERT the volcano in October and November was, with a few exceptions, either quiet or obscured by clouds that prevented satellite observations. KVERT issued Volcano Observatory Notices for Aviation (VONA) on 8 and 12 June, 13 and 22 July, 3 and 21 August, and 31 October warning of potential aviation hazards from ash plumes drifting 3-15 km from the volcano. Based on satellite data, KVERT reported a persistent thermal anomaly whenever weather clouds permitted viewing.
Geologic Background. The flat-topped summit of the central cone of Ebeko volcano, one of the most active in the Kuril Islands, occupies the northern end of Paramushir Island. Three summit craters located along a SSW-NNE line form Ebeko volcano proper, at the northern end of a complex of five volcanic cones. Blocky lava flows extend west from Ebeko and SE from the neighboring Nezametnyi cone. The eastern part of the southern crater contains strong solfataras and a large boiling spring. The central crater is filled by a lake about 20 m deep whose shores are lined with steaming solfataras; the northern crater lies across a narrow, low barrier from the central crater and contains a small, cold crescentic lake. Historical activity, recorded since the late-18th century, has been restricted to small-to-moderate explosive eruptions from the summit craters. Intense fumarolic activity occurs in the summit craters, on the outer flanks of the cone, and in lateral explosion craters.
Information Contacts: Kamchatka Volcanic Eruptions Response Team (KVERT), Far Eastern Branch, Russian Academy of Sciences, 9 Piip Blvd., Petropavlovsk-Kamchatsky, 683006, Russia (URL: http://www.kscnet.ru/ivs/kvert/).
Search Bulletin Archive by Publication Date
Select a month and year from the drop-downs and click "Show Issue" to have that issue displayed in this tab.
The default month and year is the latest issue available.
Bulletin of the Global Volcanism Network - Volume 19, Number 03 (March 1994)
Managing Editor: Richard Wunderman
Arenal (Costa Rica)
Vigorous venting of gas and emission of lava flows from Crater C
Colima (Mexico)
Fresh lava on the active dome; no subsidence in the past year
Etna (Italy)
Summary of activity since the end of the 1991-1993 eruption
Galeras (Colombia)
Low levels of seismicity, SO2 emission, and deformation
Irazu (Costa Rica)
Crater lake remains yellow-green, slightly acidic, warm, and high
Kanaga (United States)
Intermittent low-level activity, steam-and-ash plume
Kilauea (United States)
New lava flows, bench collapse, and postulated water entry into lava tubes
Klyuchevskoy (Russia)
Weak seismicity and fumarolic activity continue
Koryaksky (Russia)
Significant increase in seismic activity centered at 5 km depth
Langila (Papua New Guinea)
Explosion sounds and small ash emissions
Las Pilas-El Hoyo Complex (Nicaragua)
Dense white plumes issue from a 10-m-diameter pit crater
Lascar (Chile)
Dome collapse almost complete; new fractures and fumaroles; small ash emissions
Manam (Papua New Guinea)
Weak ash emission from Southern Crater
Masaya (Nicaragua)
Incandescence visible in daylight; small eruptions
Merapi (Indonesia)
Hazard status up: sharp increases in pyroclastic flows, glowing rock falls, and tilt
Momotombo (Nicaragua)
Voluminous plume from summit crater
Poas (Costa Rica)
Fumarolic and phreatic activity from N crater lake
Rabaul (Papua New Guinea)
Seismicity declines slightly; three earthquake swarms
Rincon de la Vieja (Costa Rica)
Subaqueous degassing; fractures surrounding SE crater rim
Ruapehu (New Zealand)
Minor phreatic eruptions from crater lake
Sabancaya (Peru)
Moderate Vulcanian activity continues; hazard maps completed
Sheveluch (Russia)
Gas-and-steam plume persists; avalanches from the extrusive dome
Stromboli (Italy)
Normal Strombolian activity; crater descriptions
Telica (Nicaragua)
Passive fumarole and San Jacinto mud-pot temperatures remain stable; possible decrease in fumarole mass flux
Turrialba (Costa Rica)
Weak fumarolic activity
Unzendake (Japan)
Endogenous growth of lava dome; seismicity increases
Veniaminof (United States)
Lava emissions from the active cone; short-lived ash bursts
Whakaari/White Island (New Zealand)
Small ash eruptions and steam plumes
Arenal (Costa Rica) — March 1994 Cite this Report
Arenal
Costa Rica
10.463°N, 84.703°W; summit elev. 1670 m
All times are local (unless otherwise noted)
Vigorous venting of gas and emission of lava flows from Crater C
In March, . . . Crater C continued to emit gases, lava, and sporadic Strombolian eruptions. Lava progressing toward the NE and the Tabacón valley flowed along the same drainages in early 1994 as in 1993. A lobe branched off at 840 m elev and advanced separately. The front of the older, main flow has remained stationary at 620 m elev, 2.4 km from the source vent. Ash columns ascended up to 1 km above crater C; falling blocks and bombs reached 1,100 m elev (several hundred meters above the base of the edifice). Near the explosive vent, the erupted material built a small, blocky, dome-like structure. During March the seismic station VACR recorded 1,011 seismic events and 101 hours of tremor (figure 68). Sampling in early April revealed no new changes in temperature or acidity of hot and cold springs around the volcano.
Geologic Background. Conical Volcán Arenal is the youngest stratovolcano in Costa Rica and one of its most active. The 1670-m-high andesitic volcano towers above the eastern shores of Lake Arenal, which has been enlarged by a hydroelectric project. Arenal lies along a volcanic chain that has migrated to the NW from the late-Pleistocene Los Perdidos lava domes through the Pleistocene-to-Holocene Chato volcano, which contains a 500-m-wide, lake-filled summit crater. The earliest known eruptions of Arenal took place about 7000 years ago, and it was active concurrently with Cerro Chato until the activity of Chato ended about 3500 years ago. Growth of Arenal has been characterized by periodic major explosive eruptions at several-hundred-year intervals and periods of lava effusion that armor the cone. An eruptive period that began with a major explosive eruption in 1968 ended in December 2010; continuous explosive activity accompanied by slow lava effusion and the occasional emission of pyroclastic flows characterized the eruption from vents at the summit and on the upper western flank.
Information Contacts: G. Soto, G. Alvarado, and F. Arias, ICE; E. Fernández, J. Barquero, R. Van der Laat, F. de Obaldia, T. Marino, V. Barboza, and R. Sáenz, OVSICORI.
Colima
Mexico
19.514°N, 103.62°W; summit elev. 3850 m
All times are local (unless otherwise noted)
Fresh lava on the active dome; no subsidence in the past year
Clouds hampered observations during a climb to the summit on 2 March. Fresh, dark, unaltered lava on the active dome (figure 19) was hot, particularly along cracks. [J.B. Murray clarifies that this visual description was meant to emphasize the contrast between the newer dome rocks, which remained hot, and older highly altered rocks elsewhere. There was no evidence on 2 March to suggest that new lava had extruded since 1992.] The well-defined dome, ~100 m across and 15 m above the general level of the summit, had a depression on the W side. Fumarolic activity was concentrated in a pit on the E edge of the summit.
Only one rockfall was observed every 6 hours, compared to an average of one every 47 minutes recorded by John Murray during visits between 1982 and 1993. The low rockfall activity has coincided with an apparent change in the deformation regime. Preliminary analysis of 26 February-4 March 1994 ground deformation data, compared to the February 1993 survey, revealed no definite subsidence (unlike previous years), little movement, and no vertical changes >1 cm. Some stations have subsided while others have risen during this period.
Three GPS stations were established in the summit area: 1) at 3,802 m near the lowest fumarole on the NE side, 2) at 3,860 m near the N edge of the summit plateau, and 3) on the active dome. The station on the active dome was close to the summit, presently one of 4-5 lava spires protruding from the top of the dome at a measured elevation of 3,882 m (19.512°N, 103.617°W). These elevations are relative to the stations on the leveling traverse only; the nearest benchmarks of the national network are >20 km away. Elevations of the leveling stations were estimated by interpolation relative to the contours on 1:50,000 maps, and are consistent with accurately leveled heights to ± 3.4 m standard deviation. The summit height on the map is between 3,820 and 3,840 m. Although this implies an increase of >40 m since the aerial survey in 1975, the accuracy of the map is unknown.
Geologic Background. The Colima complex is the most prominent volcanic center of the western Mexican Volcanic Belt. It consists of two southward-younging volcanoes, Nevado de Colima (the high point of the complex) on the north and the historically active Volcán de Colima at the south. A group of late-Pleistocene cinder cones is located on the floor of the Colima graben west and east of the complex. Volcán de Colima (also known as Volcán Fuego) is a youthful stratovolcano constructed within a 5-km-wide scarp, breached to the south, that has been the source of large debris avalanches. Major slope failures have occurred repeatedly from both the Nevado and Colima cones, producing thick debris-avalanche deposits on three sides of the complex. Frequent recorded eruptions date back to the 16th century. Occasional major explosive eruptions have destroyed the summit (most recently in 1913) and left a deep, steep-sided crater that was slowly refilled and then overtopped by lava dome growth.
Information Contacts: J. Murray and B. van Wyk de Vries, Open Univ; Mitchell Ventura and Julian H. Reynoso, Colima Fire Service, Colima, México.
Etna
Italy
37.748°N, 14.999°E; summit elev. 3357 m
All times are local (unless otherwise noted)
Summary of activity since the end of the 1991-1993 eruption
Only steady degassing has been observed at Bocca Nuova, Voragine, and Southeast summit craters following the December 1991-30 March 1993 eruption. Northeast Crater, obstructed by debris that fell from the inner wall, has not shown appreciable degassing.
On 3 August 1993 the Bocca Nuova bottom sank ~30 m during one hour of strong degassing and ash emission that produced an ash column hundreds of meters high; small blocks and a few fresh bombs fell close to the vent. Unusually strong noise was heard and ground vibration was felt at the summit area during this explosive activity. These phenomena also enlarged the unstable crater rim, causing rockfalls for several weeks. Activity did not change significantly through the end of 1993; continuous degassing activity was observed at all craters except Northeast Crater, where reddish ash emissions in early October were probably related to release of overpressurized gas.
A slight renewal of seismicity was observed after the end of the eruption. Fracturing was the probable cause of 83 events (M >1); 14 of them were M 2.5. The cumulative strain-release trend was almost flat throughout the entire period, the only significant episode was a seismic swarm on 24 May 1993 (twenty-one M 1 shocks; Mmax = 3.2). The seismic activity was mainly located on the N and SE sides of the volcano; the N events had hypocentral depths of 12-26 km, whereas the SE events were <10 km. Volcanic tremor amplitude remained low during 1993; a moderate increase was recorded in July. Also, 27 long-period earthquake swarms were recorded in 1993. The best constrained hypocentral locations revealed a source volume below the summit area at a depth of <=3 km.
Tilt recorded at most of Etna's bore-hole stations showed a continuous small deflation of the radial component that started during the 1991-93 eruption. This tilt was confirmed by general contraction measured by the three EDM networks.
The following report is from S. Saunders and W.l McGuire. An EDM network high on the S and E flanks has been reoccupied 13 times between 1981 and 1993. Measurements have revealed >5 m of lateral displacement associated with four rifting events. The network was at least partly re-occupied in April, July, and November 1993. All three surveys came after the cessation of effusive activity in March 1993 (18:03). Compared to the immediately preceding measurements, 1993 data showed that N-S trending lines, broadly parallel to the eruptive fracture and the W rim of the Valle del Bove, lengthened by small amounts (30-60 ppm). Lines trending E-W, perpendicular to the fracture zone, showed no significant length changes between November 1992 and November 1993. These data confirm that the rifting process is contemporaneous with the initial propagation of the feeder dike for the 1991-93 eruption, with little additional dilation-related lateral displacement during the later stages of activity or following the end of lava effusion.
Geologic Background. Mount Etna, towering above Catania on the island of Sicily, has one of the world's longest documented records of volcanism, dating back to 1500 BCE. Historical lava flows of basaltic composition cover much of the surface of this massive volcano, whose edifice is the highest and most voluminous in Italy. The Mongibello stratovolcano, truncated by several small calderas, was constructed during the late Pleistocene and Holocene over an older shield volcano. The most prominent morphological feature of Etna is the Valle del Bove, a 5 x 10 km caldera open to the east. Two styles of eruptive activity typically occur, sometimes simultaneously. Persistent explosive eruptions, sometimes with minor lava emissions, take place from one or more summit craters. Flank vents, typically with higher effusion rates, are less frequently active and originate from fissures that open progressively downward from near the summit (usually accompanied by Strombolian eruptions at the upper end). Cinder cones are commonly constructed over the vents of lower-flank lava flows. Lava flows extend to the foot of the volcano on all sides and have reached the sea over a broad area on the SE flank.
Information Contacts: IIV; S. Saunders, West London Institute; W. McGuire, Cheltenham & Gloucester College of Higher Education.
Galeras
Colombia
1.22°N, 77.37°W; summit elev. 4276 m
All times are local (unless otherwise noted)
Low levels of seismicity, SO2 emission, and deformation
The number of seismic events, SO2 emission rate, and deformation were all low in March. Instruments detected a total of 2,247 "butterfly-type" events. These were characterized by small magnitudes, associated with rock fracturing and fluid movement at depths of <2 km within the active cone, and influenced by earth tidal movements and external agents such as rain. Rock fracture events of M <2.5, were located predominantly in the W and NNE sectors of the active cone. Background tremor was variable. There were also new occurrences of the long-period "screw-type" events that are associated with pressurization of the system. These events are important because they were registered before most of the explosive eruptions at Galeras between July 1992 and June 1993, when volcanic activity was low. Measurements of SO2 emission obtained by the mobil COSPEC method remained low (<780 t/d). Aerial observations of the active volcanic cone revealed no changes; gas emission continues to be concentrated in the W sector of the main crater. Electronic tiltmeters showed no deformation changes.
Geologic Background. Galeras, a stratovolcano with a large breached caldera located immediately west of the city of Pasto, is one of Colombia's most frequently active volcanoes. The dominantly andesitic complex has been active for more than 1 million years, and two major caldera collapse eruptions took place during the late Pleistocene. Long-term extensive hydrothermal alteration has contributed to large-scale edifice collapse on at least three occasions, producing debris avalanches that swept to the west and left a large open caldera inside which the modern cone has been constructed. Major explosive eruptions since the mid-Holocene have produced widespread tephra deposits and pyroclastic flows that swept all but the southern flanks. A central cone slightly lower than the caldera rim has been the site of numerous small-to-moderate eruptions since the time of the Spanish conquistadors.
Information Contacts: INGEOMINAS, Pasto.
Irazu
Costa Rica
9.979°N, 83.852°W; summit elev. 3436 m
All times are local (unless otherwise noted)
Crater lake remains yellow-green, slightly acidic, warm, and high
During March, yellow-green water in the crater lake at Irazú remained high, covering the bottom of the crater. Subaqueous fumaroles persisted in the N, NW, SW, and SE parts of the lake. At the contact between the slide deposit along the E crater wall and the lake, there appeared a new subaqueous fumarole. The lake temperature was 20-24.5°C, pH minimum was 5.5, and fumarole temperatures reached as high as 80°C.
Seismicity during 1993 took the form of sporadic, locally detected earthquakes with magnitudes in the 1.7-2.2 range. The earthquakes were thought to originate along a fault that lies within 5 km of the crater.
Geologic Background. The massive Irazú volcano in Costa Rica, immediately E of the capital city of San José, covers an area of 500 km2 and is vegetated to within a few hundred meters of its broad summit crater complex. At least 10 satellitic cones are located on its S flank. No lava effusion is known since the eruption of the Cervantes lava flows from S-flank vents about 14,000 years ago, and all known Holocene eruptions have been explosive. The focus of eruptions at the summit crater complex has migrated to the W towards the main crater, which contains a small lake. The first well-documented eruption occurred in 1723, and frequent explosive eruptions have occurred since. Ashfall from the last major eruption during 1963-65 caused significant disruption to San José and surrounding areas. Phreatic activity reported in 1994 may have been a landslide event from the fumarolic area on the NW summit (Fallas et al., 2018).
Information Contacts: G. Soto, Guillermo E. Alvarado, and Francisco (Chico) Arias, ICE; E. Fernández, J. Barquero, R. Van der Laat, F. de Obaldia, T. Marino, V. Barboza, and R. Sáenz, OVSICORI.
Kanaga (United States) — March 1994 Cite this Report
Kanaga
United States
51.923°N, 177.168°W; summit elev. 1307 m
All times are local (unless otherwise noted)
Intermittent low-level activity, steam-and-ash plume
Intermittent low-level activity continued in mid-March. Although ground observations from Adak . . . were limited due to poor weather, ground observers reported a moderate steam plume on the afternoon of 16 March and sulfur odors on 20 March. On 31 March, pilots and ground observers reported a vigorous steam plume containing minor ash that extended above the volcano to an estimated 3,050 m altitude. Local winds carried the plume to the N and NE, and light ashfall occurred on the flanks of the volcano. Satellite images revealed a warm spot . . . as well as a faint plume headed N, consistent with pilot reports. Observers in Adak reported no significant ashfall in March.
Residents of Adak reported that poor weather obscured Kanaga during the first half of April. The FAA and NWS logged no pilot reports of continuing eruptive activity at Kanaga through mid-April. Naval weather observers in Adak reported steam and ash rising a few hundred meters above the volcano on 12 April. Adak residents also reported a very strong sulfur smell during the second week of April.
Geologic Background. Symmetrical Kanaga stratovolcano is situated within the Kanaton caldera at the northern tip of Kanaga Island. The caldera rim forms a 760-m-high arcuate ridge south and east of Kanaga; a lake occupies part of the SE caldera floor. The volume of subaerial dacitic tuff is smaller than would typically be associated with caldera collapse, and deposits of a massive submarine debris avalanche associated with edifice collapse extend nearly 30 km to the NNW. Several fresh lava flows from historical or late prehistorical time descend the flanks of Kanaga, in some cases to the sea. Historical eruptions, most of which are poorly documented, have been recorded since 1763. Kanaga is also noted petrologically for ultramafic inclusions within an outcrop of alkaline basalt SW of the volcano. Fumarolic activity occurs in a circular, 200-m-wide, 60-m-deep summit crater and produces vapor plumes sometimes seen on clear days from Adak, 50 km to the east.
Information Contacts: AVO.
Kilauea (United States) — March 1994 Cite this Report
Kilauea
United States
19.421°N, 155.287°W; summit elev. 1222 m
All times are local (unless otherwise noted)
New lava flows, bench collapse, and postulated water entry into lava tubes
In March . . . E-51 and E-53 vents continued to erupt fluid tholeiitic lavas that traveled through tubes and plunged into the ocean (figures 94 and 95). On 2 March, half of the newly formed W Kamoamoa bench collapsed. Spectacular explosions followed (visible from the Chain of Craters road), which deposited spatter over an area extending 280 m along the coast and 35 m inland.
Lava stopped entering the ocean the next day, but by 1100 on 3 March, a flow escaped from a weak point in a tube at the base of a fault scarp (Pali Uli, figure 95); by 1153 the flow reached the coast. Explosions rapidly built a 6-m-high littoral cone on the bench. By 1200 on 5 March the rate of discharge decreased, leading to a lull in the eruptions. The rate of discharge picked up again on 8 March and continued through the next evening. These post-lull eruptions were accompanied by particularly large steam plumes, and they contained abundant spatter derived from broken bubble-walls, including some "Limu o Pele" (thin flakes of basaltic glass).
The large steam plumes in the post-lull eruptions presumably came about because seawater invaded the unoccupied tube system during the interval with low discharge. When lava reentered the tubes, contact with seawater lead to bubble-rich explosions.
Activity quieted by 10 March, and 3 days later lava again stopped entering the ocean. Activity resumed on 14 March when lava flows escaped at the 610-m and 274-m elevations. Lava continued to escape from the ~610-m elevation (the top of the cliff area called Pulama pali), but in the days that followed lava flows broke out of the tube system at progressively lower elevations. Lava escaped from the tube system just below Pali Uli on 15 March; on the following day it flowed into the ocean. The active flow front at the ocean (figure 95) wrapped around existing littoral cones, leaving their tops as prominent landmarks. By the end of the month, at least four tubes delivered lava to the active bench.
The surface of the Pu`u `O`o pond was 90-95 m below the level of the spillway rim during March. The pond's surface was not stagnant, it circulated with upwelling in the center moving outward.
During March the east rift zone continued to produce eruption tremor with fluctuating amplitude, sustained highs interrupted by nearly background levels ("banded tremor"). The last report on seismicity, 29 March, noted that after 27 March sustained tremor sometimes rose to 3x background. The number of microearthquakes was low beneath Kīlauea's summit, and it ranged from low to average along the east rift zone. Shallow, long-period earthquakes were abundant in these areas on both 15 March (200 events) and 16 March (84 events).
Geologic Background. Kilauea overlaps the E flank of the massive Mauna Loa shield volcano in the island of Hawaii. Eruptions are prominent in Polynesian legends; written documentation since 1820 records frequent summit and flank lava flow eruptions interspersed with periods of long-term lava lake activity at Halemaumau crater in the summit caldera until 1924. The 3 x 5 km caldera was formed in several stages about 1,500 years ago and during the 18th century; eruptions have also originated from the lengthy East and Southwest rift zones, which extend to the ocean in both directions. About 90% of the surface of the basaltic shield volcano is formed of lava flows less than about 1,100 years old; 70% of the surface is younger than 600 years. The long-term eruption from the East rift zone between 1983 and 2018 produced lava flows covering more than 100 km2, destroyed hundreds of houses, and added new coastline.
Information Contacts: T. Mattox, P. Okubo, and C. Heliker, HVO.
Klyuchevskoy (Russia) — March 1994 Cite this Report
Klyuchevskoy
Russia
56.056°N, 160.642°E; summit elev. 4754 m
All times are local (unless otherwise noted)
Weak seismicity and fumarolic activity continue
Weak volcanic tremor (0.6-1.3 hours/day) and 1-3 volcanic earthquakes/day were registered in mid-February. During late February and early March, weak tremor continued and the number of seismic events increased slightly (2-5/day). Weak volcanic tremor was consistently registered for 1-3 hours/day throughout March, although it was slightly higher (<=4.5 hours/day) during the third week. Shallow volcanic earthquakes were more variable, ranging from 2 to 18 events/day. Seismic activity during the last week of March included both deep (3-13 events/day) and shallow (1-2 events/day) earthquakes, as well as weak volcanic tremor (4.5-6 hours/day). Weak fumarolic activity from the central crater was observed throughout most of March, and on 29 March a plume extended ~1 km above the crater.
Seismicity continued to increase in the first half of April, consisting of weak deep and shallow earthquakes (4-37 events/day) and weak volcanic tremor (0.5-6 hours/day). Weak fumarolic activity was observed in the central crater on 1-4 and 13 April, and the gas-and-steam plume reached as high as 800 m above the crater.
Geologic Background. Klyuchevskoy is the highest and most active volcano on the Kamchatka Peninsula. Since its origin about 6,000 years ago, this symmetrical, basaltic stratovolcano has produced frequent moderate-volume explosive and effusive eruptions without major periods of inactivity. It rises above a saddle NE of Kamen volcano and lies SE of the broad Ushkovsky massif. More than 100 flank eruptions have occurred during approximately the past 3,000 years, with most lateral craters and cones occurring along radial fissures between the unconfined NE-to-SE flanks of the conical volcano between 500 and 3,600 m elevation. Eruptions recorded since the late 17th century have resulted in frequent changes to the morphology of the 700-m-wide summit crater. These eruptions over the past 400 years have originated primarily from the summit crater, but have also included numerous major explosive and effusive eruptions from flank craters.
Information Contacts: V. Kirianov, IVGG.
Koryaksky
Russia
53.321°N, 158.712°E; summit elev. 3430 m
All times are local (unless otherwise noted)
Significant increase in seismic activity centered at 5 km depth
During 6 March-8 April there was a significant increase in seismic activity. Most of the 43 seismic events recorded took place at a depth of 5 km beneath the volcano. The three strongest earthquakes occurred on 4 April. The level of seismic activity beneath the volcano decreased during the second week of April; only a few weak earthquakes were registered at depths of 5-10 km. On 8 April the Level of Concern Color Code was upgraded to Yellow from Green, indicating that an eruption is possible with little or no additional warning.
Geologic Background. The large symmetrical Koryaksky stratovolcano is the most prominent landmark of the NW-trending Avachinskaya volcano group, which towers above Kamchatka's largest city, Petropavlovsk. Erosion has produced a ribbed surface on the eastern flanks of the 3430-m-high volcano; the youngest lava flows are found on the upper W flank and below SE-flank cinder cones. Extensive Holocene lava fields on the western flank were primarily fed by summit vents; those on the SW flank originated from flank vents. Lahars associated with a period of lava effusion from south- and SW-flank fissure vents about 3900-3500 years ago reached Avacha Bay. Only a few moderate explosive eruptions have occurred during historical time, but no strong explosive eruptions have been documented during the Holocene. Koryaksky's first historical eruption, in 1895, also produced a lava flow.
Information Contacts: V. Kirianov, IVGG.
Langila (Papua New Guinea) — March 1994 Cite this Report
Langila
Papua New Guinea
5.525°S, 148.42°E; summit elev. 1330 m
All times are local (unless otherwise noted)
Explosion sounds and small ash emissions
"Crater 2 and Crater 3 both produced mild spasmodic eruptions. Crater 2 released small volumes of ash during 11-18 March, accompanied by deep roaring sounds and incandescent projections on the 15th and 16th. Crater 3 generated occasional explosion noises during 1-10 March, and released small volumes of ash on 3, 10, 13, 15, 17, 27, and 29 March. The ash emissions on 15 March were accompanied by loud explosion noises and incandescent projections. Low explosion noises were also heard on the 29th. There was no seismic monitoring at Langila in March."
Geologic Background. Langila, one of the most active volcanoes of New Britain, consists of a group of four small overlapping composite basaltic-andesitic cones on the lower E flank of the extinct Talawe volcano in the Cape Gloucester area of NW New Britain. A rectangular, 2.5-km-long crater is breached widely to the SE; Langila was constructed NE of the breached crater of Talawe. An extensive lava field reaches the coast on the N and NE sides of Langila. Frequent mild-to-moderate explosive eruptions, sometimes accompanied by lava flows, have been recorded since the 19th century from three active craters at the summit. The youngest and smallest crater (no. 3 crater) was formed in 1960 and has a diameter of 150 m.
Information Contacts: B. Talai and C. McKee, RVO.
Las Pilas-El Hoyo Complex (Nicaragua) — March 1994 Cite this Report
Las Pilas-El Hoyo Complex
Nicaragua
12.4922°N, 86.6786°W; summit elev. 1088 m
All times are local (unless otherwise noted)
Dense white plumes issue from a 10-m-diameter pit crater
On 6 March 1994, we visited Las Pilas to determine the source and nature of a dense white plume, visible for at least 10 km to the S, that rose from the upper S slope of the volcano. The plume, which smelled strongly of sulfur, emerged from the bottom of a small phreatic (?) pit crater. The crater measured roughly 10 m in diameter and 5-10 m deep. The pit walls were vertical, and the pit opening was mantled by a thin coating of native sulfur. Extensive mixing with atmospheric gases occurred before the plume rose from the pit. Immediately downslope from the crater there appeared to be bedded volcanic deposits. Their presence suggests that the pit crater was the source of numerous phreatic-phreatomagmatic explosions.
We briefly examined a large, circular phreatic pit crater 50-75 m W of the small phreatic pit. This larger crater was about 30-40 m in diameter, and roughly 30 m deep. The phreatic explosion that produced the crater must have been unusually powerful, because it disrupted several (5-7 m thick) basaltic lava flows. No fumarolic activity was observed at this crater, and we saw no evidence of surge deposits in its vicinity. A Hewlett Packard chromatograph of in-situ soils at Las Pilas yielded 0.19 and 0.21 vol. % CO2, values probably within the range of background in local volcanic soils (0.04-0.1 vol.%).
CO2 in soils at volcanic areas varies considerably, and includes some relatively high values. A preliminary survey of the literature suggests soil gas CO2 in volcanic areas ranges from ten to several-hundred times the background found in many non-volcanic areas.
Geologic Background. Las Pilas-El Hoyo volcanic complex, overlooking Cerro Negro volcano to the NW, includes a diverse cluster of cones within about a 3-km-diameter area. A N-S-trending fracture system cutting across the edifice is marked by numerous flank vents, including maars, that are part of a 30-km-long volcanic massif. The Cerro Negro chain of cinder cones is listed separately in this compilation because of its extensive historical eruptions and possible distinct magmatic system. The lake-filled Asososca maar is located adjacent to the Cerro Asososca cone on the southern side of the fissure system, south of the axis of the Marrabios Range. Two small maars west of Lake Managua are located at the southern end of the fissure. Aside from a possible eruption in the 16th century, eruptions of Las Pilas took place in the 1950s from a fissure that cuts the eastern side of the 700-m-wide crater and extends down the N flank.
Information Contacts: Cristian Lugo, Instituto Nicaraguense de Estudios Territoriales (INETER), Apartado 17610-2110, Managua, Nicaragua; Michael Conway, Andrew Macfarlane, and Peter LaFemina, Florida International Univ (FIU), Miami, FL 33199 USA; John B. Murray, Ben van Wyk de Vries, and Adam Maciejewski, Open Univ, Milton Keynes, MK7 6AA, U.K..
Lascar
Chile
23.37°S, 67.73°W; summit elev. 5592 m
All times are local (unless otherwise noted)
Dome collapse almost complete; new fractures and fumaroles; small ash emissions
Normal fumarolic activity has continued since the small eruption on 17 December 1993. During fieldwork between 10 February and 5 March, the plume was unusually low (200-400 m above the crater), with occasional increases to normal levels (800-1,000 m). The yellowish plume sometimes contained small amounts of gray ash. A short-lived eruption on the [evening] of 27 February was witnessed by S. Matthews from 40 km W of the volcano. A high dark eruption column produced a plume extending W and WNW; the plume detached from the volcano 15 minutes later. On 28 February the Argentinian Civil Defense reported that ash had fallen in Jujuy, Argentina (~265 km SE). Fumarolic activity diminished the next day.
Crater observations, 19 February 1994. Gardeweg and Matthews reached the summit using a helicopter provided by the Fuerza Aerea de Chile. The April 1993 dome (18:4) had been almost completely replaced by a deep hole (bottom not visible) produced by continuous collapse into the vent (18:11). It occupied the central and N side of the previously flat surface of the dome. The S side of the dome was cut by deep annular collapse fractures (figure 20). Strong degassing was concentrated in the collapse crater. Weaker fumarolic activity was observed along the outer fractures and margin of the dome. These had persistent low-velocity emissions without the "jet engine" noise heard on previous visits. Yellow sulfur deposits associated with small fumaroles were also observed on the inner crater walls. Continuous rockfall into the active crater was observed coming from the overhanging W wall and the higher part of the S wall.
New fractures and fumaroles defined an elliptical zone centered on the active crater, but incorporating a larger part of the edifice (figure 21). An annular fracture with active fumaroles was observed along the rim of a previously inactive crater to the E. Small fumaroles were also present on the inside of the N wall and up to 50 m outside the S wall of the active crater. Two types of fumaroles occurred on the E side of the older W edifice, aligned on small (2, and H2SO4, and precipitating yellow and white sulfate minerals. The second type were hot (>=230°C) active fumaroles emitting steam and SO2, and depositing white sulfur.
Potential hazards. Subsidence of the crater floor as a result of conduit degassing since April 1993 has destabilized the inner part of the entire edifice. Collapse of the central part of the dome began in May 1993, coincident with the first observation of fumaroles on the S side of the active crater. An aerial photograph taken on 26 April 1993 shows a distinct fumarole on the inside rim of the N wall. Part of the subsidence occurred during the December 1993 eruption, as shown by aerial photographs taken by the Chilean Air Force on 28 December. As of early March, the apparent blockage of the degassing system due to dome collapse was similar to pre-eruptive conditions observed in previous cycles, and is likely to cause another eruption in the near future. If subsidence and widening of the collapse zone continues, the entire edifice may be destabilized. Another potential hazard involves slippage of the overhanging W wall of the active crater, which may also block the degassing system leading to "throat clearing" eruptions.
Additional information about past activity. Photographs taken on the morning of 17 December 1993 by Gonzalo Cabero (MINSAL) from Toconao (35 km NW) show a vertical column rising 8,000-9,000 m above the rim of the active crater. A small umbrella developed in the upper third of the column, but no plume extended laterally from the volcano. Partial column collapse generated weak ash clouds to the N and S, but no new pyroclastic deposits were recognized during fieldwork. No bomb ejections or ashfall were reported from this activity. However, fieldwork between 10 February and 5 March identified a large number of bombs within 3.5 km of the crater that had been erupted after April 1993. Blocks from the April 1993 eruption (18:4) exhibited a wide variety of density and textures. The more recent blocks are distinctly different, composed of dense, banded glassy andesite.
A previously unreported eruption, on an unknown day in August 1993, was observed from Soncor (~15 km W). A black ash cloud rose 1-2 km above the crater in ~ 10 minutes; no sound or seismicity was detected. This small eruption was probably a result of dome collapse.
Gregg Bluth provided the following satellite-based TOMS results for the 19 April 1993 eruption. Tonnage calculations did not require reflectivity corrections, but the scan bias was accounted for. An SO2 cloud was not visible on 19 April, but one was observed on 20-22 April. The SO2 cloud on 20 April was streaming from the volcano to ~1,800 km E and SE; tonnage was 355 kt. By 21 April the SO2 cloud had separated from the volcano by ~300 km and continued drifting SE. The leading edge was ~2,000 km SE of the volcano. The measured SO2 on this day was 340 kt. By 22 April some values were still above background, but there was no obvious cloud mass. On 23 April only a few pixels were above background; no days were checked after 23 April. The elongated cloud seen on 20 April indicates that earlier SO2 emissions may have been lost to TOMS observation. However, because the SO2 cloud showed only a slight decrease the next day, there is no justification for estimating a significantly higher original emission based on an SO2 loss rate. Estimated total SO2 yield for this eruption was 400 kt.
Geologic Background. Láscar is the most active volcano of the northern Chilean Andes. The andesitic-to-dacitic stratovolcano contains six overlapping summit craters. Prominent lava flows descend its NW flanks. An older, higher stratovolcano 5 km E, Volcán Aguas Calientes, displays a well-developed summit crater and a probable Holocene lava flow near its summit (de Silva and Francis, 1991). Láscar consists of two major edifices; activity began at the eastern volcano and then shifted to the western cone. The largest eruption took place about 26,500 years ago, and following the eruption of the Tumbres scoria flow about 9000 years ago, activity shifted back to the eastern edifice, where three overlapping craters were formed. Frequent small-to-moderate explosive eruptions have been recorded since the mid-19th century, along with periodic larger eruptions that produced ashfall hundreds of kilometers away. The largest historical eruption took place in 1993, producing pyroclastic flows to 8.5 km NW of the summit and ashfall in Buenos Aires.
Information Contacts: M. Gardeweg, SERNAGEOMIN, Santiago; S. Matthews, S. Sparks, and P. McLeod, Univ of Bristol; G. Bluth, GSFC.
Manam (Papua New Guinea) — March 1994 Cite this Report
Manam
Papua New Guinea
4.08°S, 145.037°E; summit elev. 1807 m
All times are local (unless otherwise noted)
Weak ash emission from Southern Crater
"Low-level activity prevailed at Main and Southern Craters. Both craters gently emitted weak white vapour. A small ash emission from Southern Crater on 8 March was accompanied by roaring sounds and steady weak glow. This activity had ceased by 10 March. Seismic activity was at a moderate level throughout the month, although there was a steady, but small, increase starting at the time of the ash emission. Measurements from water-tube tiltmeters . . . showed slight deflation."
Geologic Background. The 10-km-wide island of Manam, lying 13 km off the northern coast of mainland Papua New Guinea, is one of the country's most active volcanoes. Four large radial valleys extend from the unvegetated summit of the conical basaltic-andesitic stratovolcano to its lower flanks. These valleys channel lava flows and pyroclastic avalanches that have sometimes reached the coast. Five small satellitic centers are located near the island's shoreline on the northern, southern, and western sides. Two summit craters are present; both are active, although most observed eruptions have originated from the southern crater, concentrating eruptive products during much of the past century into the SE valley. Frequent eruptions, typically of mild-to-moderate scale, have been recorded since 1616. Occasional larger eruptions have produced pyroclastic flows and lava flows that reached flat-lying coastal areas and entered the sea, sometimes impacting populated areas.
Information Contacts: B. Talai and C. McKee, RVO.
Masaya
Nicaragua
11.9844°N, 86.1688°W; summit elev. 594 m
All times are local (unless otherwise noted)
Incandescence visible in daylight; small eruptions
When visited by a team of scientists from INETER and FIU during 1000-1100 on 1 March 1994, Masaya exhibited two adjacent incandescent openings in the cooling lava lake. The 4- to 7-m-diameter openings appeared at the base of the N wall of a smaller crater within Santiago crater. In September 1993 incandescence was only visible at a single opening, and only at night. According to Canadian Missionaries living in Leon, the second incandescent opening was exposed in mid-February 1994. Several tourists reported seeing ash ejected from the incandescent openings on several occasions, an event documented by a second research team later in the month (see below).
INETER-FIU researchers saw a "diffuse, white, sulfur-rich plume . . . punctuated every several minutes by stronger, short-lived (tens of seconds) pulses of gas. The pulses were accompanied by jetting sounds that were easily heard on the S rim." They also noted a mantle of fresh black ash on the crater floor immediately adjacent to the incandescent openings.
During the period 7-11 March 1994, a research team from Open Univ (OU) revisited a 21 km leveling network established in February 1993. They resurveyed the network using precise leveling to find the vertical deformation. Errors in this portion of their survey were several millimeters. The OU team found that relative to stations 5 km E on the shore of Laguna de Masaya, the summit had shifted 2-3 cm upwards. A zone of uplift trended NE across the summit; the greatest uplift occurred near the caldera wall 2 km SW of the summit.
On 7 March at 1100 the OU team noted that the two incandescent openings remained separate, but by 1800 they had merged as the division between them collapsed. On 11 March the team tied this incandescent opening into their survey net. They used electronic distance measuring (EDM) instrumentation, shooting with double bearings, to determined the elevation of the opening as 233 m (error of 0.2 m). This elevation is equivalent to 294 m below the level of the car parking area on the S rim (150-200 m above sea level). The vent that contained the incandescent openings was elongate N-S, about 12-m long, and at least several meters deep.
Since their previous visit in February 1993, the OU team reported increased summit activity, including "strong smell of SO2" and a "fainter whiff of HCl at times." One team member felt that there were more fumaroles in Santiago crater and also along the uppermost arcuate fracture on the N side of Nindirí crater than in recent years. On 31 August 1993 fumaroles were found between Santiago and Masaya craters (BGVN 18:09), but during March 1994 they were absent. From observations of activity, OU researchers suggested that the top of the magma body is perhaps 30-80 m below the level of the vent.
During the interval 7-22 March the OU team reported that incandescence remained visible, ". . . glowing bright red even in broad daylight." Audible gas exhalations were monitored 16 times during this interval: they averaged 30-40 puffs/minute. Bombs were typically ejected slightly less than once per minute, but each explosion produced 1-10 bombs. They landed at most about 30 m from the vent, to the WSW, W, or NW. Maximum bomb diameter was 50 cm. The blanket of tephra in this quadrant grew noticeably during the observation period.
Even though in September 1993 only one incandescent opening was visible, a short time later, in early October 1993, Masaya underwent an episode of increased explosive activity that included lava splashing every 10-15 seconds (BGVN 18:10). Some previous Masaya reports described fluctuations in the color of incandescent openings (for example in 1982, SEAN 07:11).
In addition to their geological observations, the OU team also remarked that "Hundreds of parrots, which had deserted the crater last year, have returned to nest in holes and crevices in the S walls of Santiago crater now that it is active again." In 1979 Masaya became Nicaragua's first National Park.
Geologic Background. Masaya volcano in Nicaragua has erupted frequently since the time of the Spanish Conquistadors, when an active lava lake prompted attempts to extract the volcano's molten "gold" until it was found to be basalt rock upon cooling. It lies within the massive Pleistocene Las Sierras caldera and is itself a broad, 6 x 11 km basaltic caldera with steep-sided walls up to 300 m high. The caldera is filled on its NW end by more than a dozen vents that erupted along a circular, 4-km-diameter fracture system. The Nindirí and Masaya cones, the source of observed eruptions, were constructed at the southern end of the fracture system and contain multiple summit craters, including the currently active Santiago crater. A major basaltic Plinian tephra erupted from Masaya about 6,500 years ago. Recent lava flows cover much of the caldera floor and there is a lake at the far eastern end. A lava flow from the 1670 eruption overtopped the north caldera rim. Periods of long-term vigorous gas emission at roughly quarter-century intervals have caused health hazards and crop damage.
Information Contacts: Cristian Lugo, INETER; Michael Conway, Andrew Macfarlane, and Peter LaFemina, Florida International Univ (FIU); J. Murray, B. van Wyk de Vries, and A. Maciejewski, Open Univ.
Merapi
Indonesia
7.54°S, 110.446°E; summit elev. 2910 m
All times are local (unless otherwise noted)
Hazard status up: sharp increases in pyroclastic flows, glowing rock falls, and tilt
The number of pyroclastic flows, glowing rock falls, and tilt increased sharply in the past several months (table 7). Both pyroclastic flows and rockfalls with substantial incandescent components traveled as far as 1.8 km (more typically, 0.5-1.0 km) down the SW slopes. In March, the number of these falls increased 1,550-fold over the background value at an undisclosed time (table 7).
Table 7. Merapi activity during 1 November 1993-23 March 1994. Pyroclastic flows have a background level ("bkgd.") of ~60-120 flows/month. In 1994 they ranged from 5-47x the background level. The background level for rockfalls was undisclosed. The RSAM curve refers to a measure of seismic power output.
| Date |
Pyroclastic Flows |
Rockfalls |
SO2 flux variation |
SO2 flux average |
RSAM background |
RSAM maximum |
| Nov 1993 |
bkgd. |
297x |
31-188 |
91 |
~13 |
~13 |
| Dec 1993 |
bkgd. |
409x |
41-108 |
66 |
~14 |
~22 (1) |
| Jan 1994 |
5x |
599x |
37-151 |
81 |
~16 |
~18 |
| Feb 1994 |
9x |
827x |
64-162 |
73 |
~17 |
~18 |
| 1-23 Mar 1994 |
47x |
1550x |
65-197 |
123 |
~16 |
greater than 24 (2) |
Tiltmeters were installed in November 1992 on the crater rim near the contact with the 1992 dome. Beginning in July 1993 they showed a consistent outward rotation of ~5 µrad/day, achieving a change of 1,200 µrad overall through the end of March 1994. A measure of seismic power output (RSAM) also showed cumulative increases during November 1993-Mar 1994, indicating heightened seismic activity (table 7). During this interval the SO2 flux data were less compelling, but also showed both overall and generally progressive increases in the smallest values measured for any one interval (table 7).
Based on these monitoring data VSI proposed a shift in the hazard status, from "Normal Activity" to "First Alert Level."
Geologic Background. Merapi, one of Indonesia's most active volcanoes, lies in one of the world's most densely populated areas and dominates the landscape immediately north of the major city of Yogyakarta. It is the youngest and southernmost of a volcanic chain extending NNW to Ungaran volcano. Growth of Old Merapi during the Pleistocene ended with major edifice collapse perhaps about 2,000 years ago, leaving a large arcuate scarp cutting the eroded older Batulawang volcano. Subsequent growth of the steep-sided Young Merapi edifice, its upper part unvegetated due to frequent activity, began SW of the earlier collapse scarp. Pyroclastic flows and lahars accompanying growth and collapse of the steep-sided active summit lava dome have devastated cultivated lands on the western-to-southern flanks and caused many fatalities.
Information Contacts: W. Tjetjep and R. Sukhyar, VSI; S. Bronto, MVO; UPI.
Momotombo (Nicaragua) — March 1994 Cite this Report
Momotombo
Nicaragua
12.423°N, 86.539°W; summit elev. 1270 m
All times are local (unless otherwise noted)
Voluminous plume from summit crater
The joint INETER and FIU team visited Momotombo on 13 March 1994, but did not gain access to the crater. At that time the plume rising from the summit crater was voluminous and visible for many kilometers. Temperatures of fumaroles located near the seismic station (just above the S base of the volcano) were similar to last year (though values were unreported in BGVN 18:03, 18:09, & 18:10).
Geologic Background. Momotombo is a young stratovolcano that rises prominently above the NW shore of Lake Managua, forming one of Nicaragua's most familiar landmarks. Momotombo began growing about 4500 years ago at the SE end of the Marrabios Range and consists of a somma from an older edifice that is surmounted by a symmetrical younger cone with a 150 x 250 m wide summit crater. Young lava flows extend down the NW flank into the 4-km-wide Monte Galán caldera. The youthful cone of Momotombito forms an island offshore in Lake Managua. Momotombo has a long record of Strombolian eruptions, punctuated by occasional stronger explosive activity. The latest eruption, in 1905, produced a lava flow that traveled from the summit to the lower NE base. A small black plume was seen above the crater after a 10 April 1996 earthquake, but later observations noted no significant changes in the crater. A major geothermal field is located on the south flank.
Information Contacts: Cristian Lugo, INETER; Michael Conway, Andrew Macfarlane, and Peter LaFemina, Florida International Univ; John B. Murray, Ben van Wyk de Vries, and Adam Maciejewski, Open Univ.
Poas
Costa Rica
10.2°N, 84.233°W; summit elev. 2697 m
All times are local (unless otherwise noted)
Fumarolic and phreatic activity from N crater lake
Escaping gases in the 200-m-diameter, northernmost crater lake at Poás continued to bubble, gush, and geyser, and they produced weak phreatic eruptions through the lake surface. In March, subaqueous fumaroles in the SE emitted small bubbles, but those in the lake center produced phreatic eruptions that drove through the lake surface and reached several meters in height. The lake was dark green in color and 50.5°C; its level had subsided 60 cm with respect to the level in January, leaving a yellow strandline along the banks. A gas cloud or plume frequently rose 500 m above the lake surface, damaging vegetation at several locations near the active crater.
The seismic station adjacent the active crater (POA2) registered 7,118 low-frequency events and 114 moderate-frequency events during March, the most active month so far this year. On the most seismically active day of the month, 16 March, 436 seismic events took place.
Geologic Background. The broad vegetated edifice of Poás, one of the most active volcanoes of Costa Rica, contains three craters along a N-S line. The frequently visited multi-hued summit crater lakes of the basaltic-to-dacitic volcano are easily accessible by vehicle from the nearby capital city of San José. A N-S-trending fissure cutting the complex stratovolcano extends to the lower N flank, where it has produced the Congo stratovolcano and several lake-filled maars. The southernmost of the two summit crater lakes, Botos, last erupted about 7,500 years ago. The more prominent geothermally heated northern lake, Laguna Caliente, is one of the world's most acidic natural lakes, with a pH of near zero. It has been the site of frequent phreatic and phreatomagmatic eruptions since an eruption was reported in 1828. Eruptions often include geyser-like ejections of crater-lake water.
Information Contacts: G. Soto, G. Alvarado, and F. Arias, ICE; E. Fernández, J. Barquero, R. Van der Laat, F. de Obaldia, T. Marino, V. Barboza, and R. Sáenz, OVSICORI.
Rabaul (Papua New Guinea) — March 1994 Cite this Report
Rabaul
Papua New Guinea
4.2459°S, 152.1937°E; summit elev. 688 m
All times are local (unless otherwise noted)
Seismicity declines slightly; three earthquake swarms
"Seismicity declined slightly in March. The total number of recorded caldera earthquakes was 458 . . . . Three small earthquake swarms occurred. The first two, on 9 March, were located in Greet Harbour and near the airport; a total of 53 earthquakes were recorded that day. The other swarm consisted of 123 earthquakes on 13 March in the Karavia Bay area. During the month, 46 earthquakes were located instrumentally, 17 of them with reasonable errors (<1 km). Locations were mainly in Greet Harbour, the airport region, and ~1 km E of Vulcan cone . . . . Routine leveling to the S end of Matupit Island on 16 March showed no significant change compared to measurements made on 24 February."
Geologic Background. The low-lying Rabaul caldera on the tip of the Gazelle Peninsula at the NE end of New Britain forms a broad sheltered harbor utilized by what was the island's largest city prior to a major eruption in 1994. The outer flanks of the asymmetrical shield volcano are formed by thick pyroclastic-flow deposits. The 8 x 14 km caldera is widely breached on the east, where its floor is flooded by Blanche Bay and was formed about 1,400 years ago. An earlier caldera-forming eruption about 7,100 years ago is thought to have originated from Tavui caldera, offshore to the north. Three small stratovolcanoes lie outside the N and NE caldera rims. Post-caldera eruptions built basaltic-to-dacitic pyroclastic cones on the caldera floor near the NE and W caldera walls. Several of these, including Vulcan cone, which was formed during a large eruption in 1878, have produced major explosive activity during historical time. A powerful explosive eruption in 1994 occurred simultaneously from Vulcan and Tavurvur volcanoes and forced the temporary abandonment of Rabaul city.
Information Contacts: L. Sipison and C. McKee, RVO.
Rincon de la Vieja (Costa Rica) — March 1994 Cite this Report
Rincon de la Vieja
Costa Rica
10.83°N, 85.324°W; summit elev. 1916 m
All times are local (unless otherwise noted)
Subaqueous degassing; fractures surrounding SE crater rim
During March, Rincón de la Vieja continued fumarolic and seismic activity. The crater lake, which was 40 cm below the level seen in June 1993, had a temperature of 36°C. The lake had a clear gray color, although a fog of condensed gases hovering over the lake hampered visual observations. Visitors noted that vigorous, noisy fumaroles in the E crater wall produced enough sulfurous fumes to provoke coughing and irritate the eyes and skin. Fumes have also injured the already sparse vegetation adjacent to the active crater.
ICE researchers reported "sporadic and intermittent bubbling events (up to several meters in height and diameter) rising up from the center and SE portions of the warm lake, producing strong waves and noise, and giving a muddy-gray color to the lake." They also saw new, open fractures surrounding the SE crater rim.
In the interval February-March 1993, Rincón's seismic station registered an increase in events of low frequency (0.5-1.3 Hz) with durations [of] 25-150 seconds (figure 9). When previously seismically active, as in January and September 1993, both high- and low-frequency signals were common.
Geologic Background. Rincón de la Vieja, the largest volcano in NW Costa Rica, is a remote volcanic complex in the Guanacaste Range. The volcano consists of an elongated, arcuate NW-SE-trending ridge constructed within the 15-km-wide early Pleistocene Guachipelín caldera, whose rim is exposed on the south side. Sometimes known as the "Colossus of Guanacaste," it has an estimated volume of 130 km3 and contains at least nine major eruptive centers. Activity has migrated to the SE, where the youngest-looking craters are located. The twin cone of Santa María volcano, the highest peak of the complex, is located at the eastern end of a smaller, 5-km-wide caldera and has a 500-m-wide crater. A Plinian eruption producing the 0.25 km3 Río Blanca tephra about 3,500 years ago was the last major magmatic eruption. All subsequent eruptions, including numerous historical eruptions possibly dating back to the 16th century, have been from the prominent active crater containing a 500-m-wide acid lake located ENE of Von Seebach crater.
Information Contacts: Gerardo J. Soto, Guillermo E. Alvarado, and Francisco (Chico) Arias, ICE; E. Fernández, J. Barquero, R. Van der Laat, F. de Obaldia, T. Marino, V. Barboza, and R. Sáenz, OVSICORI.
Ruapehu (New Zealand) — March 1994 Cite this Report
Ruapehu
New Zealand
39.28°S, 175.57°E; summit elev. 2797 m
All times are local (unless otherwise noted)
Minor phreatic eruptions from crater lake
Crater Lake underwent a strong heating phase beginning in mid-January (see figure 15) that resulted in minor phreatic eruptions in February and March [but see 19:05]. The heating phase accompanied and followed a period of increased volcanic tremor, briefly enhanced acoustic noise levels, and minor inflation.
Following 2-3 days of elevated 2-Hz acoustic signal, temperatures at a depth of 20 m off Logger Point suddenly began rising on 9 January. Temperature increases of 6-9°C at 20 m depths, coupled with a lack of significant upwelling, suggested that the lake was stratified, with the upper layer disconnected from convection at depth. A new temperature logger was installed on 18 January, 4 m NE of Logger Point, to record at a depth of 1-2 m. Temperatures peaked around 18 February after rises of 19°C at 20 m depth (to 47°C) and ~14°C on the surface at Outlet (to 39°C). In March the temperature at 20-m depth declined at a steady rate of 0.5°C/day, but then stabilized. Various reports received by IGNS indicated minor phreatic eruptions, consisting primarily of steam clouds, on 12 February, on 1, 5, 7, and 31 March, and on 1 April. The 7 March activity consisted of a sudden upwelling near the center of the lake that created waves and a steam column.
No evidence of upwelling over the main vent in the battleship-gray crater lake was detected during fieldwork on 18 and 28 January, 11-12 March, and 22-23 March. On 28 January the N vent area exhibited one extremely weak convection cell surrounded by scattered yellow slicks; at least three clearly defined cells are normally present at this location. Moderately strong meltwater inflows and occasional minor ice-falls were seen on both January visits. Very weak convection with thin surface slicks was observed in the N vent area on 12 March. New snow that fell on 8 March was undisturbed close to the N shore, precluding any surging since then. Sulfur strandlines had formed 10-20 cm above lake level near Outlet, also indicative of little recent activity. However, fresh deposits of mud (2-3 cm thick) were observed at Outlet on 12 March. Strong convection had resumed by 22-23 March at several sites over the N vent, after a 2-3 month period of very weak convection. Large yellow slicks from that area were clearly visible when washed up around the shore. The lake had risen to overflow level, but the outflow rate appeared low. Convection at the N vent area was less pronounced on 28 March.
Volcanic tremor remained at background levels in November-December 1993 after declining steadily from a peak value in late August. Tremor power began increasing again in mid-December, peaked at ~8,000 watts on 7 January, and remained high (~3,000 watts) through early February. Dominant frequency remained in the 2-3 Hz range. Signal noise interrupted power records in mid-February, but drum records indicated that tremor remained high until late February. No reliable tremor data were obtained in March. Following few recorded volcanic earthquakes in November, the number of A- and B-type events increased in mid-December and mid-January. Several distinct B-type events were recorded at the dome station in January. On average, 10 B-type events/day were detected in the second half of February, but they decreased in number during March.
Minor inflation between 4 November and 18 January increased the crater width to equal the relatively high value measured in early 1992, a period of strong lake heating and minor eruptions. The crater remained inflated on 12 March, but had deflated somewhat by 28 March. The most significant change in January was the westward shift (28 mm) of a station on the W side of the crater lake, which is typical of seasonal movement recorded at that location over the last 5 years; it had almost returned to its original position by 12 March. The movement was most likely due to ground thawing or relief from snow loading rather than from volcanic influences.
Geologic Background. Ruapehu, one of New Zealand's most active volcanoes, is a complex stratovolcano constructed during at least four cone-building episodes dating back to about 200,000 years ago. The dominantly andesitic 110 km3 volcanic massif is elongated in a NNE-SSW direction and surrounded by another 100 km3 ring plain of volcaniclastic debris, including the NW-flank Murimoto debris-avalanche deposit. A series of subplinian eruptions took place between about 22,600 and 10,000 years ago, but pyroclastic flows have been infrequent. The broad summait area and flank contain at least six vents active during the Holocene. Frequent mild-to-moderate explosive eruptions have been recorded from the Te Wai a-Moe (Crater Lake) vent, and tephra characteristics suggest that the crater lake may have formed as recently as 3,000 years ago. Lahars resulting from phreatic eruptions at the summit crater lake are a hazard to a ski area on the upper flanks and lower river valleys.
Information Contacts: P. Otway, IGNS Wairakei.
Sabancaya
Peru
15.787°S, 71.857°W; summit elev. 5960 m
All times are local (unless otherwise noted)
Moderate Vulcanian activity continues; hazard maps completed
Fieldwork was conducted on 4-8 March by scientists from the Univ Blaise Pascal (Clermont-Ferrand, France), the Instituto de Geofisico del Perú (Arequipa, Perú), and the Univ de Liège (Belgium). The purpose of the visit was to observe current activity, assess eruptive hazards, and collect samples of juvenile material. The joint mission investigations included the geology and geomorphology of the summit domes and block-lava flows, the role played by explosions on the morphology of the summit, crater, and ice cap (fracturing, gullying, tephra-fall cover, and mudflows), and analysis of tephra, lavas, and ice.
An ash explosion was observed early in the morning on 5 March from Sallili (8 km E at the base of the volcano). The eruption column rose for 30 seconds to a height of 2.5 km and generated a dark gray plume that was blown W. A vapor-rich explosion ~ 2.5 hours later produced a dominantly white plume that rose 1.5 km. Between these explosion there was a discrete vapor plume above the crater. Another early morning explosion on 7 March lasted for about 60 seconds and fed a dark gray plume 1.5 km high. Dominantly white plumes later that morning rose 1-2 km.
Activity of a similar nature has been exhibited since December 1992, with strong explosions of gas, ash, and blocks forming a gray or light-gray plume rising 1-3 km above the summit. Explosions have occurred every 1-2 hours (20-30 minutes in late 1992), and generally lasted <1 minute. Residents of Sallili have seen glowing projections at night since autumn 1993. Observations in December 1992 (Salas and Thouret) indicated that the crater had widened.
The 1990-92 tephra represent a small bulk volume (0.025 km3), but are widely dispersed around the crater; ballistic blocks reached a few hundred meters, and ash as far as 20 km. The juvenile component belongs to a K-rich calc-alkaline series and is compositionally variable from andesite (58% SiO2) to dacite (63% SiO2). The mineral assemblage of 1990-93 juvenile magma consists of plagioclase, green pyroxene, brown amphibole, biotite, destabilized olivine, and Fe-Ti oxides. Since 1990 the juvenile component has increased from 15 to ~50% by volume. Ejecta consist of black, vitreous, slightly vesicular andesitic fragments and gray dacitic fragments. Glassy black blocks with radial fractures dominate the 1994 tephra. Although the geochemical difference between the andesite and dacite is small, mineralogical disequilibrium suggests an interaction between two magma batches. One was more felsic than the dacite and included oligoclase and hypersthene; the other was more mafic than the andesite and included labradorite, bronzite, and olivine.
Hazard assessment and hazard-zone mapping has been done based on geological and geomorphological data, photo interpretation, remote sensing, and models of tephra dispersion (Thouret and others, 1994). Hazard zones are defined for tephra-fall, pyroclastic flows, lahars, and potential catastrophic events. These zones are portrayed for moderate Vulcanian activity (1990-94), growth of a dome and/or emission of a blocky lava flow, possible increase of Vulcanian activity (including small-scale pyroclastic flows), and a potential large Plinian event. Geological study and remote sensing of the current activity have provided a sound basis for evaluating and mapping hazards at and around Sabancaya. Holocene block-lava flows cover as much as 40 km2 around the summit domes. Thin Plinian tephra-fall deposits from historical eruptions are found as far as 11 km from the crater, and block-and-ash pyroclastic-flow deposits as far as 7 km from the source. Recent lahars have traveled ~25 km downstream.
Unstable lava domes pose a threat for ~35,000 people living in the Rio Colca and Siguas valleys. Sabancaya is still ice-clad (currently estimated to be 3.5 km2 of glacial ice) despite its recent 4-year period of activity. The Majes River irrigation canal project is also at potential risk should a moderate-to-large eruption melt the ice and snow on Sabancaya and Ampato.
Reference. Thouret, J-C., Guillande, R., Huaman, D., Gourgaud, A., Salas, G., and Chorowicz, J., 1994, L'activité actuelle du Nevado Sabancaya (Sud-Pérou): reconnaissance géologique et satellitaire, évaluation et cartographie des menaces volcaniques: Bull. Soc. Geol. France, v. 165, no. 1, p. 49-63.
Geologic Background. Sabancaya, located in the saddle NE of Ampato and SE of Hualca Hualca volcanoes, is the youngest of these volcanic centers and the only one to have erupted in historical time. The oldest of the three, Nevado Hualca Hualca, is of probable late-Pliocene to early Pleistocene age. The name Sabancaya (meaning "tongue of fire" in the Quechua language) first appeared in records in 1595 CE, suggesting activity prior to that date. Holocene activity has consisted of Plinian eruptions followed by emission of voluminous andesitic and dacitic lava flows, which form an extensive apron around the volcano on all sides but the south. Records of observed eruptions date back to 1750 CE.
Information Contacts: A. Gourgaud, F. Legros, and J-C. Thouret, Univ Blaise Pascal, Clermont-Ferrand, France; G. Salas, Univ San Augustine, Arequipa; A. Rodriguez and M. Uribe, Instituto de Géofisico del Perú, Arequipa; E. Juvigné, Univ de Liège, Belgium.
Sheveluch
Russia
56.653°N, 161.36°E; summit elev. 3283 m
All times are local (unless otherwise noted)
Gas-and-steam plume persists; avalanches from the extrusive dome
During March a gas-and-steam plume was observed above the extrusive dome. The height of the plume varied from 800 to 2,500 m above the crater rim and extended 40-60 km downwind to the S, SW, and W. Weak volcanic tremor occurred for ~2-4 hours/day, and shallow volcanic earthquakes were registered at a rate of 2-5 events/day. Avalanches from the N part of the dome occurred on 17 March. Fumarolic activity from the extrusive dome was observed during the last week of March. Small explosive events may have occurred on 25 and 31 March based on interpretation of seismic activity. Weak volcanic tremor decreased during the last week of March (0.2-1.5 hours/day), but shallow volcanic earthquakes (1-5 events/day) occurred at a similar rate.
In early April, weak shallow seismic activity (3-8 earthquakes/day) accompanied the continued growth of the extrusive crater dome. Seismicity increased during the second week of April (7-23 events/day), with volcanic tremor registered for 1-3 hours/day. A gas-and-steam plume reached as high as 3 km above the crater rim on 2 April.
Geologic Background. The high, isolated massif of Sheveluch volcano (also spelled Shiveluch) rises above the lowlands NNE of the Kliuchevskaya volcano group. The 1,300 km3 andesitic volcano is one of Kamchatka's largest and most active volcanic structures, with at least 60 large eruptions during the Holocene. The summit of roughly 65,000-year-old Stary Shiveluch is truncated by a broad 9-km-wide late-Pleistocene caldera breached to the south. Many lava domes occur on its outer flanks. The Molodoy Shiveluch lava dome complex was constructed during the Holocene within the large open caldera; Holocene lava dome extrusion also took place on the flanks of Stary Shiveluch. Widespread tephra layers from these eruptions have provided valuable time markers for dating volcanic events in Kamchatka. Frequent collapses of dome complexes, most recently in 1964, have produced debris avalanches whose deposits cover much of the floor of the breached caldera.
Information Contacts: V. Kirianov, IVGG.
Stromboli
Italy
38.789°N, 15.213°E; summit elev. 924 m
All times are local (unless otherwise noted)
Normal Strombolian activity; crater descriptions
"On two of three visits during 9-12 March, very detailed observations of crater morphology and eruptive activity were made. The volcano continues its millennia-long eruption; the intensity of the current activity is considered normal and characteristic of Stromboli's persistent activity. A brief visit to the Pizzo Sopra la Fossa (figure 33) was carried out on the afternoon of 9 March, but due to dense weather clouds few visual observations were possible. The noise of explosions was audible every 10-15 minutes, and continuous lava splashing could be heard. Breaks in the cloud cover revealed vigorous degassing in the entire crater area.
"The second summit climb and overnight stay was undertaken during much improved weather conditions, from about 1700 on 10 March until 0700 the next morning. The active craters were observed from the beginning of the visit until 0200 on 11 March. Observations were made at close range from the rim of crater 3 (the SW-most active crater) from 2130 until 2300. Eruptions from at least 3 vents all produced largely ash-free lava fountains that rose <=150 m. Vent 4 in Crater 3 (figure 34) ejected low lava fountains about every 10 minutes between 1700 and 2000, but then remained inactive for several hours. The eruptions made little noise, similar to eruptions from the same vent during visits in September 1989, March and November 1990, and August 1991. Another vent (1 & 2) was present in the NE part of Crater 3, at the location where several small incandescent pits and conelets existed in 1990-91. However, there is now a larger and deeper pit with much more vigorous activity. The pit is roughly circular and has a diameter of about 30-50 m; its bottom (and active bocca) is not visible from any accessible place on the crater rim. Nonetheless, it appears probable that there is an active, vigorously spattering lava pond in the pit.
"During the 90-minute observation from the crater rim, remarkable fluctuations in pit activity were seen. There would be a period of very low-level activity (up to 5 minutes long) when little or no spatter was thrown above the pit lip. Then bombs and spatter would be obliquely projected against the S wall of the pit for several minutes. This was followed by more vigorous vertical fountains of gradually increasing height. For ~ 10-20 minutes there would be a stupendous display of such fountains until a sequence of very large fountains (up to 100 m high) marked the end of increased activity. The heat of the large fountains could be felt on the crater rim; fortunately, no bombs fell closer than 25 m to the vantage point. Three such large fountains, or fountaining sequences, were observed during the stay on the crater rim.
"Crater 2 was inactive and not visible, but vent 4 at the SW end of Crater 1 had very violent and loud eruptions every 20-30 minutes, sometimes at shorter intervals. These eruptions began instantaneously with crashing sounds and ejection of a very thin, tall, vertical incandescent column. Within ~1 second, another fountain would shoot obliquely from a second vent a few meters away and jet right through the first column; these eruptions lasted <5 seconds. Several of them were followed within the next few minutes by a series of up to four more eruptions of gradually decreasing intensity. Many bombs from the oblique fountains fell into the adjacent pit with continuous spattering. Similar activity continued after our departure to make observations from Pizzo Sopra la Fossa. Loud crashing noises from vent 4 of Crater 1 were frequently heard during attempts to sleep below the observation platform and the next morning when descending towards the village of Stromboli.
"The summit was climbed a third time during daylight on 12 March, and a visit was made to the craters from 0900 until 1100. All of the craters are significantly deeper than during visits in March 1990 and August 1991. The pit (vent 1 & 2) in Crater 3 (figure 34) was still continuously spattering and ejecting small lava fountains, but there were fewer large fountains. Vent 4 in Crater 3 ejected low lava fountains ~ 3 times, but was hidden by dense gas-and-steam clouds most of the time. Striking changes have occurred in Crater 1, probably during the violent explosions of October 1993. All cinder cones observed within this crater in 1990-91 have vanished; now there is an elongate chasm up to 60 m deep that appears to have a large but inactive fissure on its floor. An irregularly shaped vent in the NE portion of the crater, not active 10-11 March, erupted several times. These eruptions had durations of up to 30 seconds and produced low (~50 m) fountains mixed with very dense steam-and-gas plumes and accompanied by relatively loud rumblings. The gas plumes made the stay on the crater rim inconvenient but did not cause other problems.
"The most impressive eruptions came from vents 3 & 4 at the SW end of Crater 1. These vents lie within a larger depression of highly irregular shape; one bocca continuously emitted a bluish gas column at high pressure from a mouth maybe 2 m in diameter. Most eruptions came without any warning, especially when gas plumes caused poor visibility. However, several were preceded by brief roaring noises. The eruptions themselves began with immense crashing noises that were heart-rending at a distance of <= 50 m. Initially a diffuse ash plume would boil up from vent 3 and turbulently shoot to ~ 50 m, then large but continuously fragmenting incandescent lava lumps would be ejected at extremely high velocity. Great turbulence within the rising fountain violently tossed and turned the bombs, which therefore did not travel along the parabolic trajectories commonly observed during Strombolian eruptions. At times there were very loud but brief gas emissions from this vent that did not develop into eruptions; one particularly violent eruption was followed by several minutes of powerful degassing.
"After the end of the 12 March summit visit, ash plumes from vent 4 in Crater 1 became more common. During departure from the island on the morning of 14 March, a dense brown ash plume rose several hundred meters above the weather clouds that covered the summit."
Geologic Background. Spectacular incandescent nighttime explosions at Stromboli have long attracted visitors to the "Lighthouse of the Mediterranean" in the NE Aeolian Islands. This volcano has lent its name to the frequent mild explosive activity that has characterized its eruptions throughout much of historical time. The small island is the emergent summit of a volcano that grew in two main eruptive cycles, the last of which formed the western portion of the island. The Neostromboli eruptive period took place between about 13,000 and 5,000 years ago. The active summit vents are located at the head of the Sciara del Fuoco, a prominent scarp that formed about 5,000 years ago due to a series of slope failures which extends to below sea level. The modern volcano has been constructed within this scarp, which funnels pyroclastic ejecta and lava flows to the NW. Essentially continuous mild Strombolian explosions, sometimes accompanied by lava flows, have been recorded for more than a millennium.
Information Contacts: B. Behncke, Geomar, Kiel, Germany.
Telica
Nicaragua
12.606°N, 86.84°W; summit elev. 1036 m
All times are local (unless otherwise noted)
Passive fumarole and San Jacinto mud-pot temperatures remain stable; possible decrease in fumarole mass flux
Researchers from INETER and FIU visited Telica on 7 March 1994; Mike Conway submitted the following report. In late 1993, INETER deployed a seismic station about 500 m E of the crater, on the crest of an E-W trending ridge. Since the seismic station was deployed, the number of daily seismic events has ranged from 200 to 300. The unusually high seismicity led to concern that Telica was returning to an active phase.
Fumaroles feeding the plume rising from the Telica crater were inaccessible. A small field of passive fumaroles, situated in the E-W trending ridge wall almost immediately below the seismic station, yielded 78-84°C temperatures. These temperatures are similar to the 85°C temperature reported in September for the same fumaroles (BGVN 18:09). Mass flux from the fumaroles, however, appears to have decreased since September 1993. The change in mass flux may be related to seasonal variation in rainfall; the dry season in Nicaragua extends from November through March. Researchers at Telica are currently developing a program to study diffuse gases in soil.
San Jacinto Hot Springs. At the small village of San Jacinto there exist a number of boiling mud pots. San Jacinto is located along Nicaragua Highway 26, about 9 km NE of the town of Telica and 2 km E of Santa Clara volcano. Based on a 9 March 1994 visit by FIU researchers, Mike Conway submitted the following report.
The active mud-pot field measured about 35 x 100 m, elongate N to S. Alteration of basaltic lava flows to the E suggests that the geothermal field was much larger at one time, and probably equidimensional (225 x 225 m).
Individual mud pots ranged in size from 1 m to as much as 3-4 m in diameter. Many of the mud pots were actively spewing mud, and one, located at the SW corner of the field, had, according to local villagers, constructed a mud volcano (to 1-m height) during February-March 1994. For individual mud pots the ratio of mud or muddy water to relatively mud-free water varied. Mud-water temperatures throughout the field, however, were consistent and ranged from 98 to 100°C. These 100°C temperatures were similar to those measured in January 1988 (SEAN 13:01).
Eight soil gas samples, from sites distributed throughout the field, were analyzed for CO2 using a Hewlett Packard chromatograph. Soil gas CO2 ranged from 0.04 to 0.09 vol. %, with a mean value of 0.058 vol. % (standard deviation, 0.0184), well within the normal background range of about 0.04-0.1 vol. % typically found in many non-volcanic areas.
Geologic Background. Telica, one of Nicaragua's most active volcanoes, has erupted frequently since the beginning of the Spanish era. This volcano group consists of several interlocking cones and vents with a general NW alignment. Sixteenth-century eruptions were reported at symmetrical Santa Clara volcano at the SW end of the group. However, its eroded and breached crater has been covered by forests throughout historical time, and these eruptions may have originated from Telica, whose upper slopes in contrast are unvegetated. The steep-sided cone of Telica is truncated by a 700-m-wide double crater; the southern crater, the source of recent eruptions, is 120 m deep. El Liston, immediately E, has several nested craters. The fumaroles and boiling mudpots of Hervideros de San Jacinto, SE of Telica, form a prominent geothermal area frequented by tourists, and geothermal exploration has occurred nearby.
Information Contacts: Cristian Lugo and Martha Navarro, INETER; Michael Conway, Andrew Macfarlane, and Peter LaFemina, Florida International Univ (FIU); John B. Murray, Ben van Wyk de Vries, and Adam Maciejewski, Open Univ.
Turrialba (Costa Rica) — March 1994 Cite this Report
Turrialba
Costa Rica
10.025°N, 83.767°W; summit elev. 3340 m
All times are local (unless otherwise noted)
Weak fumarolic activity
A visit on 25 March revealed almost no activity at the central part of the main crater, and very weak fumarolic activity at the SW part. Maximum temperature at the SW part of the crater reached 89°C -- nearly the same as measured in July 1993.
Geologic Background. Turrialba, the easternmost of Costa Rica's Holocene volcanoes, is a large vegetated basaltic-to-dacitic stratovolcano located across a broad saddle NE of Irazú volcano overlooking the city of Cartago. The massive edifice covers an area of 500 km2. Three well-defined craters occur at the upper SW end of a broad 800 x 2200 m summit depression that is breached to the NE. Most activity originated from the summit vent complex, but two pyroclastic cones are located on the SW flank. Five major explosive eruptions have occurred during the past 3500 years. A series of explosive eruptions during the 19th century were sometimes accompanied by pyroclastic flows. Fumarolic activity continues at the central and SW summit craters.
Information Contacts: G. Soto, Guillermo E. Alvarado, and Francisco (Chico) Arias, ICE.
Unzendake
Japan
32.761°N, 130.299°E; summit elev. 1483 m
All times are local (unless otherwise noted)
Endogenous growth of lava dome; seismicity increases
Endogenous growth of the lava dome continued in March, with no new lava extrusion since late January. The eruption rate has remained at ~50,000 m3/day. Dome growth was toward the N, NW, and W; other parts of the dome remained stable. The spine-like cone that appeared near lobe 12 in February reached an elevation of 1,490 m by early April, 240 m above the crater floor. This cone moved NW in March and W in early April, settling just above the former Jigokuato Crater, from which the first lobe emerged in May 1991. The migrating cone created a depression 20-30 m deep behind it to the E, which was emitting volcanic gas (figure 68). The growing cone consisted of a massive-lava core surrounded by crumbled breccia. The core was composed of older brown lava that had solidified within the dome. Crest line measurements determined by theodolite from the UWS showed that the W part of the dome continued to uplift and move W at a rate of 2-3 m/day. As of 9 April, the peak had move ~80 m W and risen ~ 5-10 m from its location on 6 March.
Only 10 pyroclastic flows occurred in March, the lowest monthly total since they began in 1991. Some pyroclastic flows generated on 19 March by collapse of part of the dome traveled 1.5 km NNW. Residents living about 4 km from the summit in this direction are not staying in their homes at night. These flows went N because the caldera floor in that direction has now been completely filled by talus. Pyroclastic-flow deposits were
Rockfalls mainly went in the direction of the moving cone, advancing the talus front NW and W at a rate of 2-3 m/day. There is now a thick cover of talus on the Byobu-iwa craters, from which phreatic eruptions took place in February-May 1991. Rockfalls also forced seismic and GPS stations of the SEVO to repeatedly move farther away. Many mirrors installed for EDM measurements near the dome by the GSJ have been destroyed.
Strong deformation extended NW and W of the dome for 50-100 m away from the talus front. The ground had a wavy surface and had been uplifted as high as a few tens of meters. Many open cracks, up to 1 m wide, were radially oriented towards the growing cone; smaller cracks had various orientations. This ground deformation, which began in late January, had ceased by the end of March. EDM measurements revealed that the distance between a point immediately below the dome and a point on the N flank had shortened by about 30 m during February and March.
Microearthquakes increased to a total of 5,110 in March, compared to 1,726 in February. After 20 March, > 200 events/day were recorded.
Geologic Background. The massive Unzendake volcanic complex comprises much of the Shimabara Peninsula east of the city of Nagasaki. An E-W graben, 30-40 km long, extends across the peninsula. Three large stratovolcanoes with complex structures, Kinugasa on the north, Fugen-dake at the east-center, and Kusenbu on the south, form topographic highs on the broad peninsula. Fugendake and Mayuyama volcanoes in the east-central portion of the andesitic-to-dacitic volcanic complex have been active during the Holocene. The Mayuyama lava dome complex, located along the eastern coast west of Shimabara City, formed about 4000 years ago and was the source of a devastating 1792 CE debris avalanche and tsunami. Historical eruptive activity has been restricted to the summit and flanks of Fugendake. The latest activity during 1990-95 formed a lava dome at the summit, accompanied by pyroclastic flows that caused fatalities and damaged populated areas near Shimabara City.
Information Contacts: JMA; S. Nakada, Kyushu Univ.
Veniaminof (United States) — March 1994 Cite this Report
Veniaminof
United States
56.17°N, 159.38°W; summit elev. 2507 m
All times are local (unless otherwise noted)
Lava emissions from the active cone; short-lived ash bursts
Low-level steam-and-ash plume emissions continued during mid-March along with possible eruptions of lava. Ground observers saw glow near the summit and "sparks" at the vent during the week of 11-18 March. Satellite infrared images (AVHRR NOAA-11, 12; 1.1 km resolution) indicated hot spots on the ground near the vent. These probably represent fresh lava erupting from the volcano's active cone. Ground observers reported short-lived ash-bursts from the caldera's cone on 18-25 March. Poor weather obscured Veniaminof from satellite and ground observers during the last week of March. Although clear weather prevailed . . . in the first half of April, no steam or ash over the volcano was noted by residents of Port Heiden . . . .
Geologic Background. Veniaminof, on the Alaska Peninsula, is truncated by a steep-walled, 8 x 11 km, glacier-filled caldera that formed around 3,700 years ago. The caldera rim is up to 520 m high on the north, is deeply notched on the west by Cone Glacier, and is covered by an ice sheet on the south. Post-caldera vents are located along a NW-SE zone bisecting the caldera that extends 55 km from near the Bering Sea coast, across the caldera, and down the Pacific flank. Historical eruptions probably all originated from the westernmost and most prominent of two intra-caldera cones, which rises about 300 m above the surrounding icefield. The other cone is larger, and has a summit crater or caldera that may reach 2.5 km in diameter, but is more subdued and barely rises above the glacier surface.
Information Contacts: AVO.
Whakaari/White Island (New Zealand) — March 1994 Cite this Report
Whakaari/White Island
New Zealand
37.52°S, 177.18°E; summit elev. 294 m
All times are local (unless otherwise noted)
Small ash eruptions and steam plumes
The lake in Wade Crater was first observed in March 1993. Following an ash-bearing phreatic eruption on 19 October 1993, the crater lake temperature decreased from ~45 to 22°C. By the end of November, lake temperature had again risen to >50°C, the water color was green-yellow, and there was strong bubbling and geyser-like activity near the W shore.
Fieldwork on 14 January 1994 revealed that the lake in Wade Crater had shrunk to a small pond of bubbling gray water at its former W end. Noise from the fumarole in the NW corner of Royce Crater, where a lake was present in early December, was loud enough to cause discomfort without ear protection. The next day, this fumarole emitted brown ash that formed a plume to 200 m above the main crater floor. Ballistic blocks up to 50 cm in diameter were thrown as high as 30 m above the vent. Noise levels were variable, but generally lower in intensity than on the day before. Maximum temperature of the pond, as measured by infrared pyrometer, dropped to 40°C on 15 January from 87°C on the 14th.
By 19 January, a thin layer of khaki-colored ash covered the Main Crater floor near the 1978/90 Crater Complex, and extended as far as peg E, ~380 m SE of the vent (figure 21). The pond in Wade Crater had disappeared, and a blocky tuff cone stood near the former active vent in the NW part of the crater. There was no sign of impact craters, even adjacent to the cone. The primary activity during the visit was geysering from a sludgy pool in the NW corner of Wade Crater. Bright white steam frequently burst through the surface of the pool immediately before upwelling commenced. Based on a strand line, the former lake had only been 2-5 m deep. The divide between Princess and TV1 craters had collapsed further, allowing clear views of the floor of Princess Crater.
A deformation survey on 19 January suggested that local cooling, withdrawal of underlying brine fluids, and subterranean collapse were still operating beneath the Donald Mound area. Since 2 December 1993 an area centered W of Donald Mound-Donald Duck subsided at a rate similar to December 1992-December 1993 (4-5 mm/month). Possible deflation of ~3 mm SE of Donald Mound since last December, where inflation over the past year had averaged 1.7 mm/month, indicated that recent inferred heating in that area had stopped.
Lakes had reappeared in Wade and Royce craters by 29 January. A very sharp boundary could be seen within the Wade Crater lake. It was gray and steaming on the W side with a maximum temperature of 65°C, but the E side was greenish-yellow with a maximum temperature of 49°C. Steam discharges continued from the large vent at the W end of the crater, but noise levels were lower than on 15 January. A vigorously discharging superheated fumarole was observed on the N crater wall above the lake, but it was too small for a temperature measurement. Heavy rains on 4-5 February caused flash-flooding that stripped a large amount of ash from the surface and caused several landslides. A helicopter pilot noted that the lake level appeared 3-5 m higher, and that there was geysering and vigorous overturning in the lake.
A small eruption on 23 February was observed at about 1012, while scientists were in transit to the island. By 1018, the white, apparently ash-free steam plume had reached an altitude of 2 km (determined by an on-board altimeter), at which point the top of the plume was still vigorously convecting and ascending. Considering the temperature and ebullient nature of the crater lake, and because this was essentially a steam eruption, the vent in the crater lake was considered the most likely source for the eruption. A pulse of orange-brown ash was emitted from the 1978/90 Crater Complex at about 1155, followed by lesser amounts of pale gray ash for the rest of the afternoon. Because the vent area was almost totally obscured by steam, the source vent could not be determined.
The lake in Wade Crater again exhibited the two-tone coloration and similar temperatures as observed on 29 January, although the level was considerably higher. The turbid gray water in the W half of the lake appeared to descend beneath the comparatively suspension-free green water to the E. At least two sources of upwelling were apparent in the hotter gray water. Primary steam sources from the crater included the main fumarolic discharge from the NW part of Royce Crater, and increased discharges from fumaroles on the N wall immediately above the lake. Comments from a helicopter pilot indicated that this change in activity occurred after torrential rains about two weeks earlier. Combined noise levels from the fumaroles were moderate.
A small eruption near the location of a previous fumarole on Donald Mound had formed an elongate crater approximately 1 x 3 m in size and 50 cm deep. Two distinct low-temperature (98°C) discharges issued from this crater, one under high pressure. Preliminary analysis revealed fairly dry output gases with a high N2/Ar ratio of ~1,300. Temperatures at Noisy Nellie fumarole ... were in the 201-208°C range in January and February. Other fumaroles ranged from 98 to 109°C during the same period.
Geologic Background. The uninhabited Whakaari/White Island is the 2 x 2.4 km emergent summit of a 16 x 18 km submarine volcano in the Bay of Plenty about 50 km offshore of North Island. The island consists of two overlapping andesitic-to-dacitic stratovolcanoes. The SE side of the crater is open at sea level, with the recent activity centered about 1 km from the shore close to the rear crater wall. Volckner Rocks, sea stacks that are remnants of a lava dome, lie 5 km NW. Descriptions of volcanism since 1826 have included intermittent moderate phreatic, phreatomagmatic, and Strombolian eruptions; activity there also forms a prominent part of Maori legends. The formation of many new vents during the 19th and 20th centuries caused rapid changes in crater floor topography. Collapse of the crater wall in 1914 produced a debris avalanche that buried buildings and workers at a sulfur-mining project. Explosive activity in December 2019 took place while tourists were present, resulting in many fatalities. The official government name Whakaari/White Island is a combination of the full Maori name of Te Puia o Whakaari ("The Dramatic Volcano") and White Island (referencing the constant steam plume) given by Captain James Cook in 1769.
Information Contacts: B. Christenson and B. Scott, IGNS, Wairakei.