On 19 August GeoNet reported that activity at Tongariro's Te Maari Craters had declined significantly since the eruption in 2012, with data suggesting that unrest associated with the eruption was over. The Volcanic Alert Level was lowered to 0 (on a scale of 0-5). The Volcanic Alert Level for Ngauruhoe is separate and had been lowered to 0 on 20 April.
Source: GeoNet
Small eruption on 21 November 2012; subsequent mild degassing and seismicity
A previous report on Tongariro covered the 6-7 August 2012 eruption and subsequent return to quiet (BGVN 37:07). Aside from a short-lived eruptive episode on 21 November 2012, GeoNet Data Centre reported only occasional mild degassing and small earthquakes occurred through August 2013. No further eruptive activity was reported through late 2014.
Activity during 2012. Degassing continued after the August 2012 eruption. Gas flux was relatively low on 29 August; sulfur dioxide emissions were 150 tonnes/day and carbon dioxide flux was 420 tonnes/day. Gas flights on 13 and 18 September revealed sulfur dioxide levels of 980 and 540 tonnes/day, respectively, and carbon dioxide flux of 1,340 tonnes/day on 18 September. The report noted that although the levels were lower than the 2,100 tonnes/day of sulfur dioxide and 3,900 tons of carbon dioxide measured on 9 August, shortly after the eruption, they had increased and were considered significant.
A field team visited the craters on 13 September and noted that Upper Te Maari crater has been widened and deepened by the 6 August eruption. They installed a new webcam pointed directly at the new Te Maari vents.
GeoNet researchers visited the Upper Te Maari Craters on 30 September to sample fumaroles, conduct a carbon dioxide soil gas survey, collect ejecta from the August eruption, and photograph the area (figures 9 and 10). The average carbon dioxide soil gas flux was lower than on 27 July; 24 sites had increased fluxes while 20 had decreased. The estimated soil gas emissions had decreased overall from about 5.8 to 2.5 metric tonnes per day.
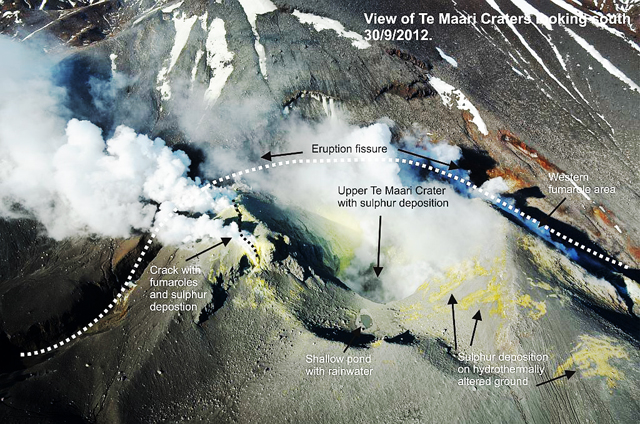 |
Figure 9. View of Te Maari craters at Tongariro looking S on 30 September 2012. Courtesy of GeoNet. |
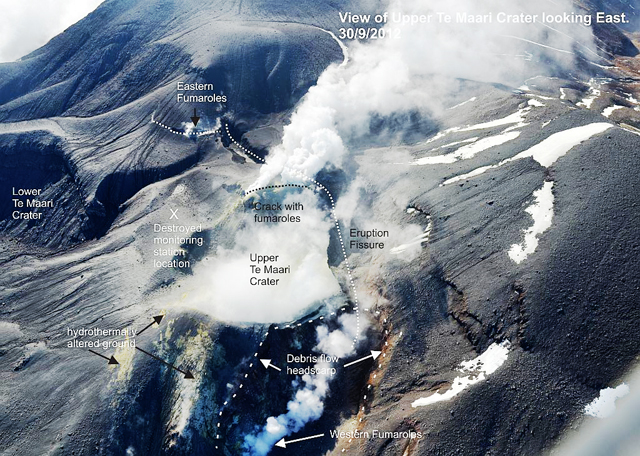 |
Figure 10. View of Upper Te Maari Crater looking E, 30 September 2012. Courtesy of GeoNet. |
On 12 October, GeoNet reported that gas plumes drifting downwind had been detected a hundred kilometers or more away. During the previous two weeks an odor attributed to venting was noticed in Manawatu (112 km S) and Hawke's Bay (120 km ESE). On 30 October the SO2 flux was 154 tonnes per day and the carbon dioxide flux was 477 tonnes per day. Several teams of scientists visited the Te Maari Craters on 5 November to service portable seismometers (complementing four permanent installations), sample gas vents, and collect samples of ejecta. The GeoNet report noted that not many earthquakes had been recorded recently, and that the hottest gas vent was 235° C while the others ranged from 95-104°.
A small eruption at the Te Maari Craters occurred at 1325 on 21 November (figure 11), without precursory events, prompting GeoNet to raise the Volcanic Alert Level to 2 and the Aviation Colour Code to Red. A report at 1730 noted that the eruption appeared to be over; the Aviation Colour Code was lowered to Orange, signaling that ash was no longer being emitted.
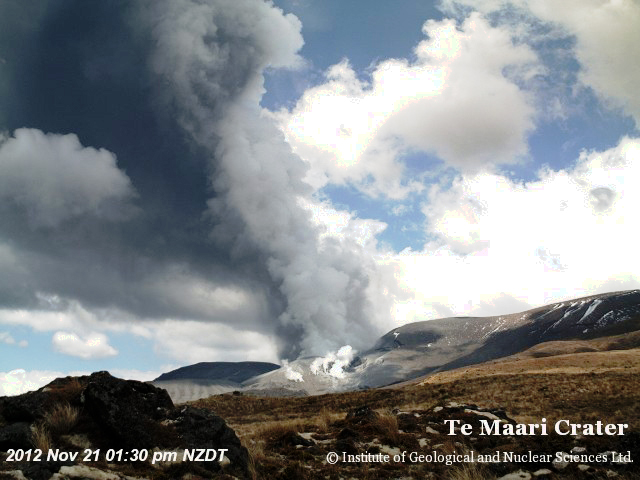 |
Figure 11. An ash plume rose from the Te Maari Crater at Tongariro at 1330 local time, shortly after the 21 November 2012 eruption. Courtesy of Institute of Geological and Nuclear Sciences, Ltd. |
The eruption occurred from the same area as the eruption on 6 August and lasted less than five minutes, although local seismic activity lasted about 15 minutes. GNS staff and hikers saw the eruption; an ash plume rose 3-4 km above the Upper Te Maari crater and produced ashfall across part of State Highway 46 and NE towards Turangi (21 km NE). Two small pyroclastic density currents were produced at the base of the column, to the W and N of the crater, and traveled a few hundred meters downslope. Later that afternoon gas-and-steam plumes drifted SE. On 22 November a sulfur gas odor was reported downwind in Manawatu (S) and Hawke's Bay (115 km ESE). A substantial amount of gas was emitted during 22-23 November. The Aviation Colour Code was lowered to Yellow on 23 November due to the absence of emitted ash. On 26 November GeoNet noted that no further volcanic activity had occurred since the eruption, gas flux had decreased, and seismic activity remained low.
Reports during 2013 and 2014. GeoNet reported on 14 February 2013 that no eruptive activity had been detected since the 21 November 2012 explosion. Steam-and-gas plumes rose from the Te Maari Craters, and had been unusually strong during recent weeks possibly due to weather conditions. On 25 March GeoNet reported continued quiescence, but with continuing steam-and-gas plumes. The Aviation Color Code was lowered to Green (second lowest on a 4 four-color scale) and the Volcanic Alert Level remained at 1 (on a scale of 0-5).
On 6 August 2013 small earthquakes were detected beneath Tongariro. These events were recorded only by a few seismic stations and were too small to be precisely located. GNS Science noted that the earthquakes could simply have been part of the background unrest typical of most active volcanoes, but they were of interest because there had been so few since November 2012 and potentially could have signaled changes inside the volcano.
The amounts of CO2 and sulfur gases emitted from Tongariro had remained at low levels since the start of 2013 and were about half the amount produced after the November 2012 explosion. These conditions, and the small number and small size of recent earthquakes, were not sufficient to alter the unrest status of the volcano; the Volcanic Alert remained at Level 1; the Aviation Color Code remained Green.
On 23 December 2013 GeoNet reported that the volcano continued to remain quiet. A few small earthquakes were recorded on the northern flanks at a rate of 2-3 per month. Gas measurements showed SO2 fluxes of about 10-15 tonnes/day, also a low level. Volcanologists also sampled the fumaroles on Te Maari that have been active since the 2012 eruptions; the main fumarole, which often provides strong steam plumes visible from Taupo, was emitting gases at over 400 °C.
A 10 February 2014 survey of carbon dioxide (CO2) emissions near Red Crater (~4 km SSW from Te Maari) noted little change since a 2009 survey. In 2009 there was a calculated flux of 47 tonnes per day from the survey area. The result from the February 2014 survey indicated a flux of 39 tonnes per day; the difference was not considered significant. The temperature just below the ground surface was also similar to 2009 values.
Information Contacts: GeoNet, a collaboration between the Earthquake Commission and GNS Science (URL: http://www.geonet.org.nz/); GNS Science, Wairakei Research Center, Private Bag 2000, Taupo 3352, New Zealand (URL: http://www.gns.cri.nz/).
2015: March
| April
| August
2013: February
| March
2012: July
| August
| September
| October
| November
2008: December
2006: June
| November
On 19 August GeoNet reported that activity at Tongariro's Te Maari Craters had declined significantly since the eruption in 2012, with data suggesting that unrest associated with the eruption was over. The Volcanic Alert Level was lowered to 0 (on a scale of 0-5). The Volcanic Alert Level for Ngauruhoe is separate and had been lowered to 0 on 20 April.
Source: GeoNet
On 20 April GeoNet reported that it had been three weeks since anomalous seismicity at Tongariro's Ngauruhoe cone had been detected. In addition, no anomalous ground temperatures or unusual levels of gas emissions were detected at the summit during fieldwork, indicating that the minor unrest had ceased. The Volcanic Alert Level was lowered to 0 (on a scale of 0-5).
Source: GeoNet
On 23 March GeoNet reported that during the previous two to three weeks an increase in the number and magnitude of earthquakes at Tongariro was detected by the seismographs around Ngauruhoe. The earthquakes were shallow, with depths less than 5 km. The report noted that although earthquakes are not unusual near Ngauruhoe, it had been some time since significant numbers or events above M 1 were recorded. The Volcanic Alert Level was raised to 1 (on a scale of 0-5).
Source: GeoNet
On 25 March GeoNet reported that Tongariro remained quiet with no eruptive activity being detected since the explosion on 21 November 2012. Steam-and-gas plumes rose from the Te Maari Craters. The Aviation Colour Code was lowered to Green (second lowest on a 4 four-color scale) and the Volcanic Alert Level remained at 1 (on a scale of 0-5).
Source: GeoNet
On 14 February GeoNet reported that Tongariro remained quiet with no eruptive activity being detected since the explosion on 21 November 2012. Steam-and-gas plumes rose from the Te Maari Craters, and were unusually strong during the recent weeks possibly due to weather conditions. The Aviation Colour Code remained at Yellow (second lowest on a 4 four-color scale) and the Volcanic Alert Level remained at 1 (on a scale of 0-5).
Source: GeoNet
A small eruption at Tongariro's Te Maari Craters occurred at 1325 on 21 November, without precursory events, prompting GeoNet to raise the Volcanic Alert Level to 2 and the Aviation Colour Code to Red. A report at 1730 noted that the eruption appeared to be over; the Aviation Colour Code was lowered to Orange.
The eruption occurred in the same area as the previous eruption on 6 August and lasted less than five minutes, although local seismic activity lasted about 15 minutes. GNS staff and hikers saw the eruption. An ash plume rose 3-4 km above the Upper Te Maari crater and produced ashfall across part of State Highway 46 and NE towards Turangi (21 km NE). Two small pyroclastic density currents were produced at the base of the column, to the W and N of the crater, and traveled a limited distance of a few hundred meters downslope. Later that afternoon gas-and-steam plumes drifted SE. On 22 November a sulfur gas odor was reported in Manawatu (S) and Hawke's Bay (115 km ESE), downwind of Tongariro. A substantial amount of gas was emitted during 22-23 November. The Aviation Colour Code was lowered to Yellow on 23 November due to the absence of emitted ash. On 26 November GeoNet noted that no further volcanic activity had occurred since the eruption, gas flux had decreased, and seismic activity remained low.
Source: GeoNet
On 5 November, GeoNet reported that several teams of scientists had been visiting Tongariro's Te Mari Craters to service portable seismometers (complementing four permanent installations), sample gas vents, and collect samples of ejecta. The report noted that not many earthquakes had been recorded recently, and that the hottest gas vent was 235 degrees Celsius while the others ranged from 95-104 degrees. On 30 October the sulfur dioxide flux was 154 tonnes per day and the carbon dioxide flux was 477 tonnes per day. The volcano continued to actively degas. The Aviation Colour Code remained at Yellow and the Volcanic Alert Level remained at 1 (signs of volcano unrest).
Source: GeoNet
On 12 October, the GeoNet Data Centre reported that Tongariro had been degassing after the 6 August eruption from the Te Mari Craters. Gas plumes drifted downwind and were detected a hundred kilometers or more away. During the previous two weeks an odor was noticed in Manawatu (112 km S) and Hawke's Bay (120 km ESE).
Source: GeoNet
The GeoNet Data Centre reported that researchers visited Tongariro's Upper Te Mari Craters on 30 September to sample several of the fumaroles, conduct a carbon dioxide soil gas survey, collect ejecta from the 6-7 August eruption, and photograph the area. They found that the average carbon dioxide soil gas flux was lower than the 27 July measurements; 24 sites had increased fluxes while 20 had decreased. The estimated soil gas emission has decreased from about 5.8 to 2.5 tonnes per day based on these measurements.
Source: GeoNet
GeoNet reported that seismic activity at Tongariro remained low during 14-16 August; weather conditions prevented observations of the craters. There were several reports of gas odors on 15 August, particularly from the Manawatu region (S). On 17 August GeoNet noted that although very minor amounts of ash were emitted in the first few days after the eruption, there had been no significant activity since 6 August. Seismic activity had returned to low levels after the eruption. The Alert Level was lowered to 1 (on a scale of 0-5) and the Aviation Colour Code remained at Yellow (second lowest on a four-color scale).
Source: GeoNet
GeoNet reported that favorable weather allowed GNS Science and Department of Conservation scientists to conduct an observation flight over Tongariro on 8 August. They noted actively steaming vents that were visible at a new crater area formed on 6 August below the Upper Te Mari crater, but low clouds prevented any views above this elevation. Blocks of old and hydrothermally altered lava, as large as 1 m in diameter, ejected by the eruption fell 1.5-2 km from the Te Mari craters area. Falling blocks formed impact craters in the ground in an extensive area to the E and W of the new vents. Most blocks were covered by grey ash but many on the W slopes were not, suggesting that they were ejected after the main ash-producing phase of the eruption.
The scientists also noted that previously steaming ground at Ketetahi and Lower Te Mari crater appeared more vigorous, but there were no obvious major changes. A debris flow generated by the eruption partly filled a stream valley draining N-W from the Upper Te Mari crater area. The deposit had blocked some stream tributaries but most water diverted around the edges. Ash had slumped from the banks into the stream valley, and in other stream valleys ash has been re-mobilized in slurry flows. No lahars were generated by the eruption.
New rock falls were visible around the walls of the new vent area and Lower Te Mari craters and in some stream valley walls near the craters. This suggested that significant ground shaking took place during the eruption. The Alert Level remained at 2 (on a scale of 0-5) and the Aviation Colour Code was lowered to Yellow (second lowest on a four-color scale).
During 8-9 August seismic activity remained at a low level; only a few small events were recorded. Preliminary analysis of the ash showed that there was little to no new magma erupted. Gas analysis on 9 August revealed emissions around 2,100 tonnes per day of sulfur dioxide, 3,900 tonnes per day of carbon dioxide, and 364 tonnes per day of hydrogen sulfide, confirming the presence of magma below the volcano. [Steam vents were clearly visible during a 10 August overflight; a very minor amount of ash was reported from some of those vents.] [On 17 August GeoNet noted that although very minor amounts of ash were emitted in the first few days after the eruption, there had been no significant activity since 6 August.] Seismicity continued to remain low during 10-14 August. Heavy rains on 12 August caused a lahar to cross State Highway 46, approximately 6 km W of Rangipo.
Source: GeoNet
On 6 August GeoNet reported that volcanic earthquakes continued beneath Tongariro but the size and number had decreased; there were fewer than five events each day. At about 2350 a short-lived (~1-2 minutes) phreatic eruption occurred at the Te Mari craters area, followed by a series of discrete small earthquakes over the next few tens of minutes. The Alert Level was raised to 2 (on a scale of 0-5) and the Aviation Colour Code was raised to Orange (second highest on a four-color scale). An ash plume drifted E and ashfall was reported in areas around the volcano. According to a news article, a GNS Science volcanologist noted that there were reports of "red hot rocks being thrown out of the crater", explosions, and lighting. The article also stated that some people in the Tongariro area had self-evacuated following the eruption. The Desert Road section of State Highway 1 (NE) had been closed due to poor visibility from the ash, and about 5 cm of ash had fallen on State Highway 46, to the N. Some flights to and from Gisborne (210 km ENE), Rotorua (120 NNE), Taupo (60 km NE), and Palmerston North (135 km S) were delayed or cancelled due to the eruption, and Hawke's Bay Airport (110 km ESE) had closed. GeoNet observed that no volcanic tremor occurred in the days preceding the eruption. The last eruption occurred in 1897. [Correction: The last eruption from the Te Mari craters area had occurred in 1896.]
On 7 August white steam clouds rose from the Te Mari craters area but poor weather conditions at the time obscured a direct view of the active vent(s). A few small earthquakes had been detected. A news article stated that alpine guides observed three active vents that appeared to be new.
On 31 July GeoNet reported that seismicity at Tongariro had declined the previous week but increased again during 28-29 July, and as of 31 July, between 3 and 10 events were being recorded daily. The earthquakes were clustered in a zone between Tongariro and the E side of Lake Rotoaira, at 2-7 km depth. The Alert Level remained at 1 (on a scale of 0-5) and the Aviation Colour Code remained at Yellow (on a four-color scale).
Source: GeoNet
A sequence of small volcanic earthquakes beneath Tongariro was detected by a few of the seismometers in the permanent network. Earthquakes with magnitudes less than 2.5 were clustered between Emerald Crater (E of the summit) and the Te Mari craters (2 km E east of Ketetahi hot springs on the N flank) at 2-7 km depth. The sequence started on 13 July, soon declined, and then again increased during 18-20 July. The Alert Level was raised to 1 (on a scale of 0-5) and the Aviation Colour Code was raised to Yellow (on a four-color scale) on 20 July.
In response to the increased seismicity, GeoNet installed four portable seismographs and conducted gas and spring sampling. During 21-22 July seismicity declined; one event was detected on 23 July. Provisional analysis of the gas samples collected during 21-22 July indicated a marked increase in the volcanic gas component of the typical mix of volcanic and hydrothermal gases. Residents reported a gas odor.
Source: GeoNet
The Alert Level for Tongariro was lowered to 0 (typical background activity) on 2 December. The number of volcanic earthquakes declined to background levels since mid-2008. In addition, regular measurements of volcanic gas levels and the temperature of the summit gas vent showed no changes over the previous two and a half years.
Source: GeoNet
Seismic activity from Tongariro continued to remain elevated during 27 July-1 November. Temperature and gas-concentration measurements from the summit remained normal. The Volcanic Alert Level remained at Level 1 (some signs of unrest).
Source: GeoNet
According to GeoNet on 14 June, seismic activity at Ngauruhoe (the youngest cone of the Tongariro complex) remained elevated. The Alert Level remained at 1.
Source: GeoNet
According to GeoNet, the number of small low-frequency earthquakes at Ngauruhoe (the youngest cone of the Tongariro complex) increased in the past 3 weeks. On 6 June, the Alert Level was raised to 1.
Source: GeoNet
Reports are organized chronologically and indexed below by Month/Year (Publication Volume:Number), and include a one-line summary. Click on the index link or scroll down to read the reports.
Steam and ash eruption in late January
Card 1790 (05 February 1974) Steam and ash eruption in late January
"Ngāuruhoe volcano went into eruption on 22 January 1974. In the evening it was erupting red-hot blocks to a height of several hundred feet and at times down the outer flanks. Aerial inspections on 23 and 24 January, while the eruption of steam and ash continued with varied but moderate intensity, showed no lava to be visible in the crater within at least 100 m of the rim. During this stage of the eruption, blue flames of burning sulphur were seen at a fumarole about 200 m down the N flank.
"Ash eruption continued, interspersed by occasional violent explosions which reached maximum intensity on 26 and 27 January, when a number of explosive eruptions momentarily enveloped the entire summit in ash and sent large blocks cascading down the sides. A number of hot avalanches were observed. By 28 January the frequency of the eruptions was decreasing.
"The activity is continuing but on a reduced scale. The volcano has been intermittently active on a minor scale over the past year but not very impressively. The present activity is more in the nature of a major eruption."
Information Contacts: J. Healy, New Zealand Geological Survey.
Two vents active within the crater during overflight on 29 March
Card 1839 (10 April 1974) Two vents active within the crater during overflight on 29 March
A scientific party of four plus two pilots left Paraparaumu on the morning of 29 March 1974 by Aero Commander to survey the White Island/Tongariro Volcanoes. The following is the report on the Ngāuruhoe observation:
"The aircraft made several passes over the eastern side of Ngāuruhoe from 1000 to 1015. There was a vigorous light grey ash column rising to approximately 4,000 m, and drifting WNW. Fine ash was falling from the ash cloud and there was a thin covering of recently deposited ash over the whole of the western side of Tongariro. Red Crater had lost its characteristic color and was a uniform light grey. Banks of cumulus cloud had built up on the NW of the mountain probably due to the presence of ash within the cloud. Elsewhere there was no cloud. Haze existed over the area between Ngāuruhoe and Lake Taupo, probably also due to dust particles from the eruption. There appeared to be two vents within Ngāuruhoe crater. Ash was being erupted from a northerly vent and white steam from a southerly vent. It was not possible to look into the crater to estimate the depth of the lava column. The volcano was in a Vulcanian phase of eruption with widespread distribution of fine ash. No blocks were observed to be ejected during the duration of the observations."
Information Contacts: J.W. Cole, Victoria University of Wellington, New Zealand.
Strong explosive ash eruptions during 12-19 February
Card 2119 (12 March 1975) Strong explosive ash eruptions during 12-19 February
Ngāuruhoe volcano erupted ash intermittently between 12 and 19 February in the first major activity since March 1974. Bad weather restricted observations, but several explosive ash eruptions occurred. An aerial inspection on the morning of 19 February revealed no obvious change in crater topography, and no new large ejecta on the summit. No ash emission was occurring. At about 1300 on 19 February (NZ Daylight Time) Ngāuruhoe suddenly commenced the most voluminous pyroclastic eruption since the 1954 lava flows. A coherent, strongly convoluting eruption column rose to 11,000 m above sea level (8,700 m above the summit), spreading out into an ash cloud reaching 14,600 m above sea level. Continual ash emission was accompanied by a series of visible air shock waves, loud explosions, and large pyroclastic avalanches down the slopes of the 600-m-high cone. Incandescent ejecta was clearly visible in the eruption column. Walking parties within 2 km of the crater were pelted with scoria, and one group was nearly over-run by hot avalanches which passed close to the walking tracks. This eruption was accompanied by vigorous volcanic tremor and lasted until about 1420 on 19 February, when ash emission ceased. Ash was blown 160 km to the NNW to fall on Hamilton City.
A series of violently explosive eruptions followed periods of quiescence later in the afternoon. Explosions were accompanied by large visible air shock waves, closely followed by ejection of very large blocks (many up to 20 m above the crater. Extremely loud and very sharp reports were heard close to the volcano, loud rumblings being heard at least 70 km distant. Very dense eruption slugs expanded violently above the crater to envelop the summit and collapse into large pyroclastic avalanches which flowed rapidly down the cone. Impacting blocks raised large dust clouds down the cone, and set fire to tussock grass on surrounding areas. Smaller blocks (up to 1 m across) were thrown 2 km to the N, forming 2-m-diameter craters near walking tracks on Mt. Tongariro. Sharp volcanic earthquakes accompanied each explosion, which were preceded by periods of low seismic activity. Incandescent ejecta was observed during the night of 19-20 February as activity waned.
Bad weather restricted observations on 20-21 February, but steam explosions and small mud flows were observed. A helicopter landing on the summit was made on 22 February. The summit was covered by large blocks of lava which had been plastic on impact, the largest measuring 27 m long. Part of the western crater wall had collapsed into the vent. The crater was no deeper than after March 1974, due to infilling by collapse of vent walls, and possibly upward movement of a lava plug. No liquid lava was apparent in the vent. Strong gas emission (including SO2) prevented clear observations and measurements within the crater, which appeared to be between 50 and 100 m deep. A further explosive eruption was reported on 23 February.
Information Contacts: B.W. Marshall, University of Auckland, New Zealand.
Eruption columns rise 900 m
The NZGS reports that cigar-shaped eruption columns rose to 900 m above the crater on 4 July 1977 at 0800 and 1030.
Information Contacts: New Zealand Geological Survey.
Earthquake swarms
The following seismic data, from Balsillie and Latter (1985), replaces the first two sentences of the original report, which dealt only with 16 May seismicity. [Three swarms of A-type earthquakes were recorded during the first half of 1983. The first and smallest included 14 events to M 1.8 on 16-19 February. About 20 A-type and 4 B-type (including the largest, at magnitude 2.4) shocks occurred 1-7 April, plus two episodes of possible volcanic tremor (for 7 hours on 2 April and 10 hours on 4 April). The largest swarm began gradually on 7 May, peaked 14-16 May (maximum magnitude 2.1), and ended about 29 May, accompanied by 4 more episodes of possible volcanic tremor. During the strongest activity, 15-20 events of M >1.0 were recorded daily.]
On 10 May, NZGS personnel measured temperatures of the hot gases issuing from the crater bottom. Rockfalls from the overhanging E crater wall and growing talus fans had reduced the degassing area. Temperatures of 320-350°C were measured 1-2 m from the accessible edge of the hot area. These reflected a nearly steady decrease: 620° (1 July 1978), 520° (24 February 1979), 478° (25 June 1981), 418° (21 January 1982), 458° (10 June 1982), [349° (4 May 1983) and 105° (7 February 1985]. Ngāuruhoe last erupted 12-23 February 1975, when strong explosive activity sent eruption plumes to 10 km and pyroclastic flows moved down the flanks (Nairn and Self, 1978).
Reference. Nairn, I.A., and Self, S., 1978, Explosive eruptions and pyroclastic avalanches from Ngāuruhoe in February 1975: JVGR, v. 3, p. 39-60.
Further Reference. Balsillie, F.H., and Latter, J.H., 1985, Volcano-seismic activity at Ngāuruhoe during 1983: New Zealand Volcanological Record, no. 13, p. 66-71.
Information Contacts: W. Giggenbach, DSIR, Wellington.
Fumarole temperatures and gas chemistry unchanged from 1989; no significant deformation or seismicity
Fumarole temperatures (93.9 & 94.3°C) and preliminary gas chromatograph data collected on 7 April were unchanged since the previous fieldwork in March 1989. No significant deformation was evident. Seismicity has remained relatively low.
Information Contacts: P. Otway, DSIR Geology & Geophysics, Wairakei.
Fumarole temperatures decrease
The following ... is based on fieldwork in late March and early May 1993. "Activity in the crater of Ngāuruhoe has declined further over the past year and is at an all time low since records were first kept. Fumarole temperatures have decreased to 90°C after remaining stable at 94°C (boiling point for altitude) since 1986. No volcanic deformation was identified by surveys to points on the crater rim and at the base of the mountain."
Information Contacts: B. Christenson, I. Nairn, P. Otway, and B. Scott, IGNS, Wairakei.
Fumarole temperatures continue to decline; no deformation
Annual fieldwork was carried out on 30 March and 29 April 1994. Maximum fumarole temperatures had fallen to 78°C by the end of April. ... There was insufficient fumarole discharge for adequate sampling, and temperatures and pressures were at the lowest levels ever recorded. Except for minor landslide debris, no significant changes were noted in the Ngāuruhoe crater.
Tilt leveling surveys were carried out at the Tama Lakes (1.7 km SSW) and Mangatepopo (1.8 km NNW) locations on 30 March. Apparent tilt recorded at Tama Lakes during the previous 11 months represented 4 µrad of inflation, but was within the range of random fluctuations recorded since installation in 1978. At Mangatepopo approximately 14 µrad of tilt towards Ngāuruhoe (deflation) was recorded over the same period. This is ~2-3x the past noise level resulting from normal survey errors and seasonal movements. The most likely explanation, based on earlier experiences, is that two benchmarks near a walking trail have settled.
Repairs were made to the three highest crater rim stations on 30 March and two new stations were installed; two old stations are scheduled for removal after the 1995 survey. All six rim sites were surveyed for horizontal deformation on 29 April. Measurements were made by EDM and theodolite from 2 km N on Tongariro volcano. Relative movement vectors for the 1992-94 period at three stations were well within the normal noise range. Instabilities noted at the other sites resulted from various surface movements. Overall, there was no indication of recent volcanic deformation.
Geological mapping of the crater, N flank, and SW flank accomplished during these visits is part of the ongoing mapping project of the Tongariro complex.
Information Contacts: P. Otway, IGNS Wairakei.
No fumarolic activity in Ngauruhoe crater or deformation
Extremely low activity levels were found during an annual crater inspection and deformation survey on 11 May in the crater and at the base of Ngāuruhoe. Crater fumaroles failed to discharge gases: the first complete absence of activity ever previously reported there. However, the NE rim of the outer crater was steaming vigorously as in the past. Neither horizontal nor vertical deformation were of sufficient magnitude to suggest volcanic significance. The current level of crater activity is probably the lowest in recorded history.
Ngāuruhoe is the highest and most recent of more than a dozen composite cones that comprise the large Tongariro volcanic massif N of Ruapehu. Ten years ago, in February 1975, Ngāuruhoe produced its last eruption, an event that generated 10-km-high plumes and pyroclastic flows. In 1983 several seismic swarms were recorded.
Information Contacts: P.M. Otway, Institute of Geological and Nuclear Sciences (IGNS), Private Bag 2000, Wairakei, New Zealand.
Elevated seismicity at Ngauruhoe during May-October 2006
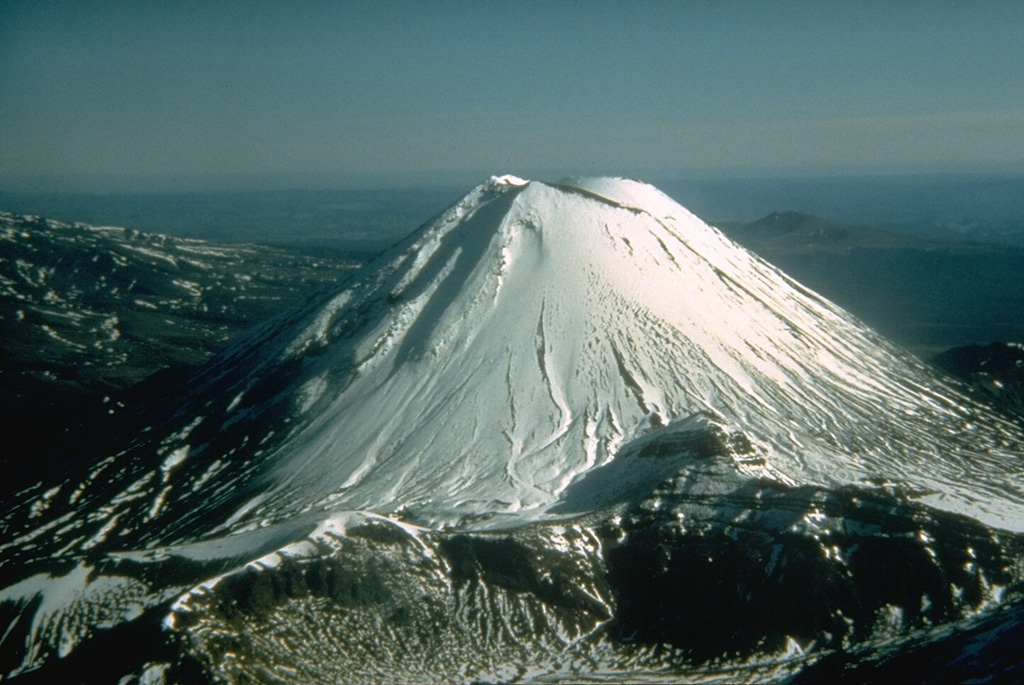
Ngāuruhoe is the youngest and highest volcanic cone (figure 1) of the Tongariro volcanic complex on the North Island of New Zealand. According to New Zealand GeoNet Project volcanologists, the number of small (less than magnitude 2), low-frequency earthquakes near Ngāuruhoe recorded by seismometers increased from less than five per day at the beginning of May 2006 to more than 20/day by the end of May. Typically, only a few earthquakes of any type are recorded in the vicinity of Ngāuruhoe each year. In 1983, 1991, and 1994 there were clusters of similar earthquakes recorded near Ngāuruhoe, but there have been very few recorded since then. Due to the increased seismicity, the Scientific Alert Level was raised to Alert Level 1 (some signs of unrest) on 6 June. Earthquakes of this type are commonly interpreted as being related to the movement of magma and/or volcanic gases.
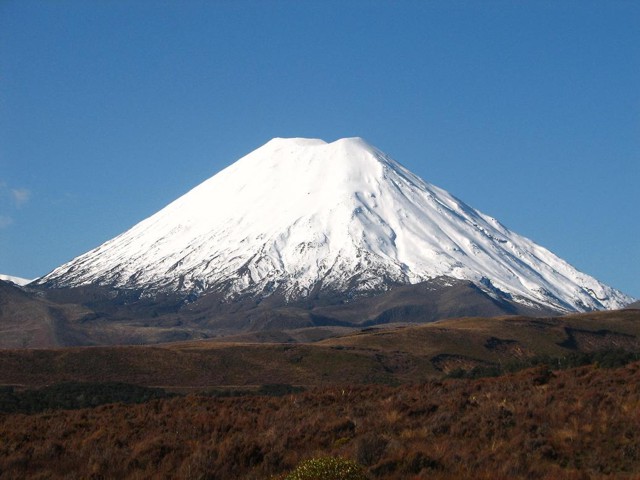 |
Figure 1. Snow covered Mt. Ngāuruhoe as seen on 28 July 2006. Photo credit to University of Auckland Snowsports Club. |
Earthquakes peaked in early June at about 50/day and then declined to about 10-20/day by the 14th, with the largest about magnitude 1. Seismic activity has remained elevated through the middle of December 2006. Initial observations suggested that hypocenters were 1-4 km deep, slightly N or E of the summit. By mid-June volcanologists had installed three additional seismographs around the base of Ngāuruhoe, including one that could be monitored in real-time. Between 14 June and 3 July the number of volcanic earthquakes recorded near Ngāuruhoe has varied between approximately 20 and 40 per day. Using data from the additional seismographs, volcanologists were able to refine the location of the earthquakes to within about 1 km of the surface beneath the N flank; the largest events were approximately magnitude 1. Elevated seismicity continued at up to 30 events/day through October 2006.
As of the last GeoNet report on 1 November, no other signs of unrest had been recorded. Multiple measurements showed that temperatures and volcanic gas concentrations have not changed since the increased seismicity began in May, and were similar to measurements made in 2003. Carbon-dioxide release through the soil (from degassing magma) is also similar to measurements in 2003. The maximum fumarole temperature near the summit is about 85°C. Reports of steaming in the summit area were investigated, but because no new features were seen that could have caused emissions, the sightings were attributed to clouds rather than volcanic activity.
Information Contacts: New Zealand GeoNet Project, a project sponsored by the New Zealand Government through these agencies: Earthquake Commission (E.C.), Geological and Nuclear Sciences (GNS), and Foundation for Research, Science and Technology (FAST) (URL: https://www.geonet.org.nz/); University of Auckland Snowsports Club, University of Auckland, New Zealand (URL: http://www.uasc.co.nz/).
High seismicity in January 2008; declined to background by mid-year
Our most recent report on Tongariro (BGVN31:12) discussed elevated seismicity during May-October 2006. The M < 2 long-period seismic event occurred near Ngāuruhoe, the youngest cone of the Tongariro volcanic complex.
Between 1 November 2006 and January 2008, elevated, low-level volcanic earthquakes continued at Ngāuruhoe. The number of events per day typically ranged between 5 and 30. Then, on 6 January 2008, the number of events per day began to increase, and by 9-10 January the number had shot up to 80 per day, before decreasing slightly. The larger events ranged between M 1.2 and 1.5.
In response to these changes, volcanologists from GeoNet visited on 17 January 2008 and measured gas concentrations, temperatures, and soil gas flux at the summit area of Ngāuruhoe. The resulting data were similar to measurements made in 2006-2007. The maximum fumarole temperature near the summit remained about 86°C. No other signs of unrest were found. The data suggested that the earthquakes were occurring within about 1 km of the surface beneath the N flank.
GeoNet noted that the number of volcanic earthquakes since mid-2008 has declined to background levels. Regular measurements of volcanic gas levels and the temperature of the summit gas vent have showed no changes over the previous two and a half years. Consequently, on 2 December 2008, the Alert Level was lowered from 1 to 0 (typical background activity). No thermal anomalies have been measured by MODIS/MODVOLC satellites (HIGP Hot Spots System) in the at least the past 5 years.
Information Contacts: New Zealand GeoNet Project, a collaboration between the Earthquake Commission and GNS Science, Wairakei Research Centre, Private Bag 2000, Taupo 3352, New Zealand (URL: http://www.geonet.org.nz/); Hawai'i Institute of Geophysics and Planetology (HIGP) Hot Spots System, University of Hawai'i, 2525 Correa Road, Honolulu, HI 96822, USA (URL: http://modis.higp.hawaii.edu/).
Seismicity preceded phreatic explosion; associated rainfall-fed lahar
Elevated seismicity in July 2012 preceded a phreatic eruption at Tongariro on 6 August. The eruption ejected blocks of old lava from the crater area, and triggered a debris flow down a drainage on a flank of the volcano. Six days later, heavy rainfall remobilized some of the debris flow and generated a small flood/lahar that crossed a state highway. This report summarizes GeoNet alert bulletins and Taupo Civil Defense postings concerning the phreatic explosion and associated events (through 17 August 2012).
Precursory seismicity. GeoNet reported elevated numbers of volcanic earthquakes (M < 2.5) beginning on 13 July (figure 2). Seismicity then declined until 18 July, when volcanic earthquakes returned, increasing in magnitude and abundance through 20 July. The earthquakes were clustered between Emerald Lake and the SE shore of Lake Rotoaira at 2-7 km depth; a subset of the earthquakes were tightly clustered between Blue Lake and Te Maari (Te Mari) Craters within the same depth range (figures 2 and 3). As a result, the Volcano Alert Level was raised from 0 to 1 (on a scale from 0-5) and the Avation Colour Code was raised from Green to Yellow (on a four color scale; Green-Yellow-Orange-Red) on 20 July.
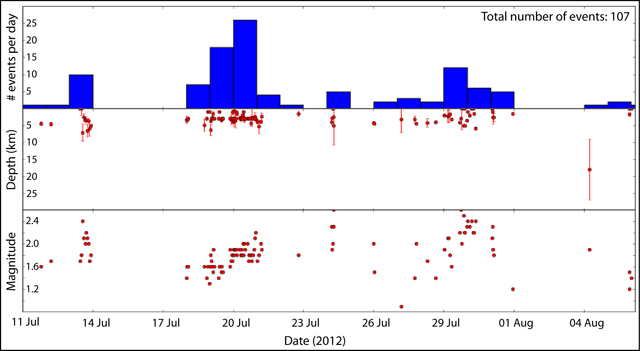 |
Figure 2. Seismicity at Tongariro during 11 July-6 August 2012, leading up to a phreatic eruption at 2350 on 6 August. Shown are the number of seismic events per day (107 in total, top panel), the depth at which each event occurred (and associated error bars, middle panel), and the magnitude of each event (bottom panel). Courtesy of GeoNet. |
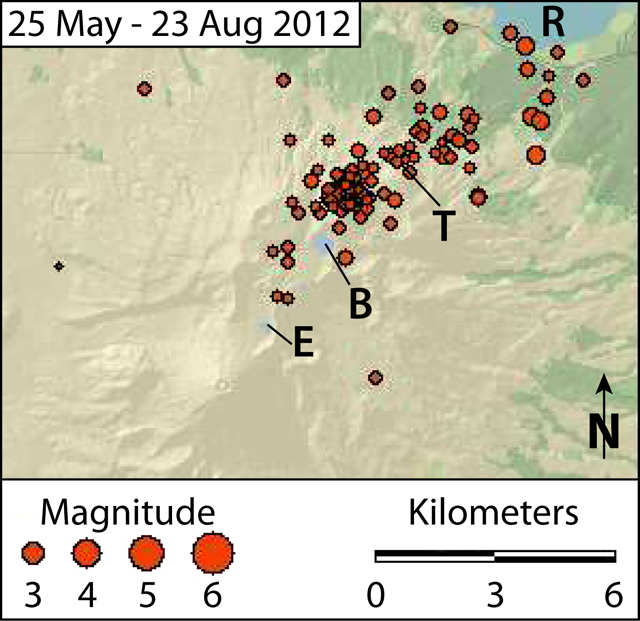 |
Figure 3. Mapped epicenters of seismic events recorded at Tongariro during 25 May-23 August 2012. A phreatic eruption occurred late on 6 August (see figure 2). During the precursory activity (late July and early August), seismicity concentrated between Emerald Lake (E) and Lake Rotoaira (R), with a cluster between Blue Lake (B) and Te Maari Craters (T). Courtesy of GeoNet. |
By 23 July, GeoNet had deployed four portable seismometers and had sampled springs and fumaroles. They reported that provisional analyses of gas samples indicated a marked increase in volcanic gases above typical mixtures of hydrothermal and volcanic gas signatures (see subsection "Ash and gas analyses" for detail). By 31 July, GeoNet had also installed a GPS instrument to monitor any deformation.
Phreatic eruption. At 2352 on 6 August, a phreatic eruption occurred from a vent located within the Te Maari Craters area. An explosion generated seismic signals that lasted a few minutes, followed by a series of discrete small earthquakes during the next few tens of minutes. Within 35 minutes, GeoNet posted an Alert Bulletin announcing that ashfall had been reported; the Volcano Alert Level was raised to 2 and the Aviation Colour Code was raised to Red. Taupo Civil Defense responded by closing State Highways 1 and 46 (to the E and N of Tongariro, respectively).
Approximately one hour after the eruption, the Cooperative Institute for Meteorological Satellite Studies (CIMSS) observed in satellite imagery that an ash plume was drifting more than 50 km E from Tongariro (figure 4). They also reported that airports had cancelled flights at Gisborne (210 km ENE), Rotorua (120 km NNE), Taupo (60 km NE), and Palmerston North (135 km S).
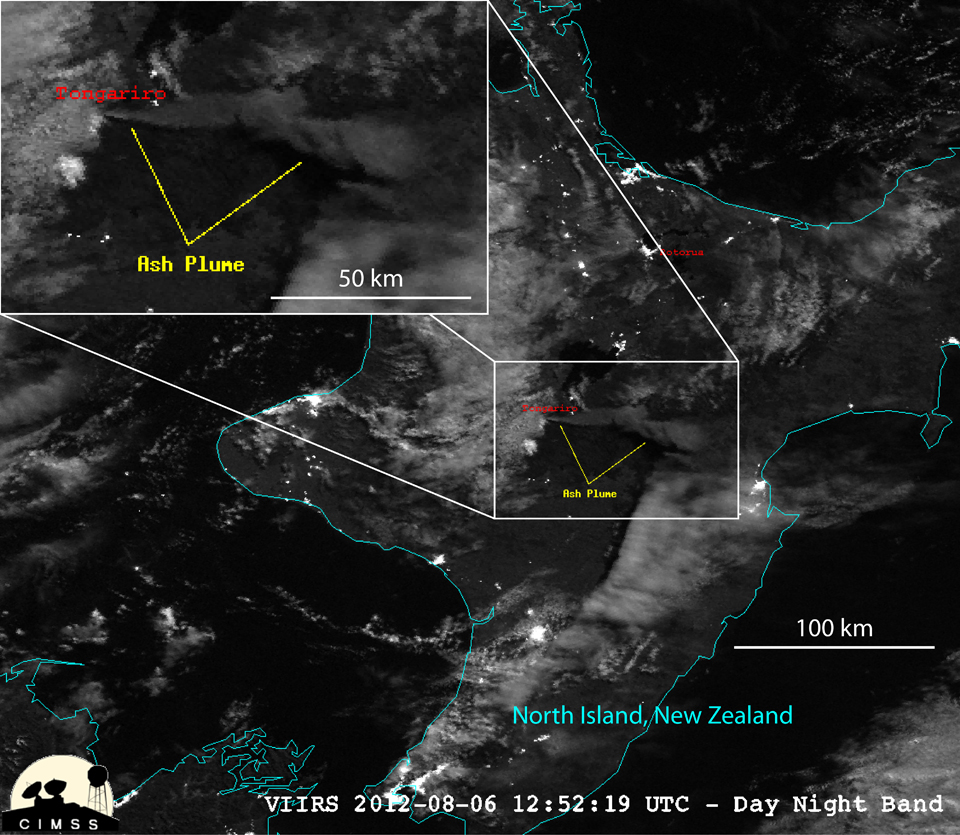 |
Figure 4. A Visible Infrared Imaging Radiometer Suite (VIIRS) image acquired by the Suomi National Polar-orbiting Partnership (NPP) satellite at 1252 UTC on 6 August 2012 (0052 NZST on 7 August) showing an ash plume drifting more than 50 km E from Tongariro, after the phreatic explosion ~1 hour earlier. The windward end of the plume remains over the volcano, implying ongoing emissions. In the main image, the North Island of New Zealand is outlined in teal, and Rotorua is labeled to the N of the plume. In both images, the ash plume is labeled in yellow, and Tongariro is labeled in red, just W of the plume. Courtesy of CIMSS. |
GeoNet reported that no volcanic tremor occurred before or after the event, and the Aviation Colour Code was reduced to Orange ~12 hours later (about 1200 on 7 August), and reduced again the next day (1500 on 8 August).
GeoNet conducted an observation flight on 8 August and photographed a variety of features discussed and illustrated in more detail below. They included: (1) a new vent area residing in a small crater, and associated steaming fissures, (2) a debris flow, and (3) impact craters.
The new vent(s) are located in the Upper Te Maari Craters area (figure 5a); low clouds prevented scientists from viewing areas higher than the lowest parts of Upper Te Maari Crater. Photographs of the area revealed a nearby steaming eruptive fissure, and more intense steaming in areas of ground that had been steaming prior to the eruption (figure 5b).
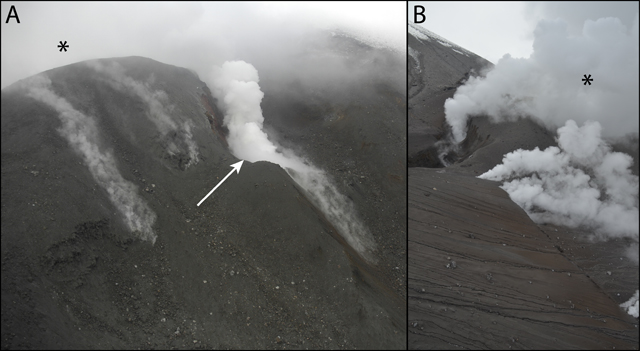 |
Figure 5. Photographs taken after Tongariro's 6 August 2012 phreatic eruption showing the Upper Te Maari vent area. In (A) the view is looking SE towards Upper Te Maari crater, with areas of fumaroles and a new vent on the outer edge of the crater (indicated by the arrow). (B) is looking NW showing vents along a fissure around the S side of Upper Te Maari crater. Upper Te Maari crater is indicated in each photo with the '*' symbol. Both photographs were taken during a morning observation flight on 8 August 2012. Courtesy of GeoNet. |
A debris flow generated by the phreatic eruption comprised rock and soil debris that blocked a stream valley draining NW from the Te Maari Craters area (figure 6). GeoNet reported water ponding around the edges, and ash that had been remobilized into slurry flows. GeoNet noted that areas of the debris flow (especially in the upper sections) had eroded into the substrate (figure 6a).
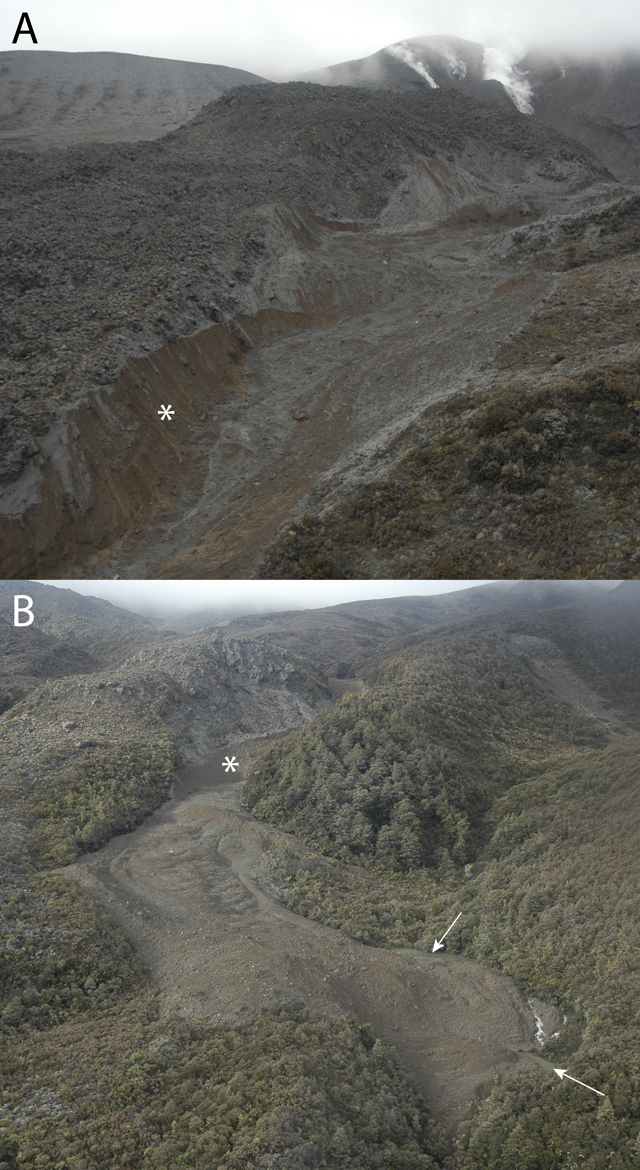 |
Figure 6. Upper (A) and lower (B) portions of the debris flow generated by the 6 August 2012 phreatic eruption at Tongariro. The debris flow extended down a stream valley draining NW from the Te Maari Craters (steaming areas visible in the top-most portion of (A)). White asterisks in both photos indicate regions where the debris flow eroded into the substrate. White arrows in (B) indicate areas of newly ponded water at the edges of the flow. Courtesy of GeoNet. |
The explosion ejected blocks of lava up to 2 km from the Te Maari Craters area, leaving impact craters in vegetation and ground surfaces (figure 7). All blocks were angular, and none were steaming or surrounded by burnt vegetation; GeoNet thus concluded that the blocks comprised old (non-juvenile) lava(s) ejected from the vent area.
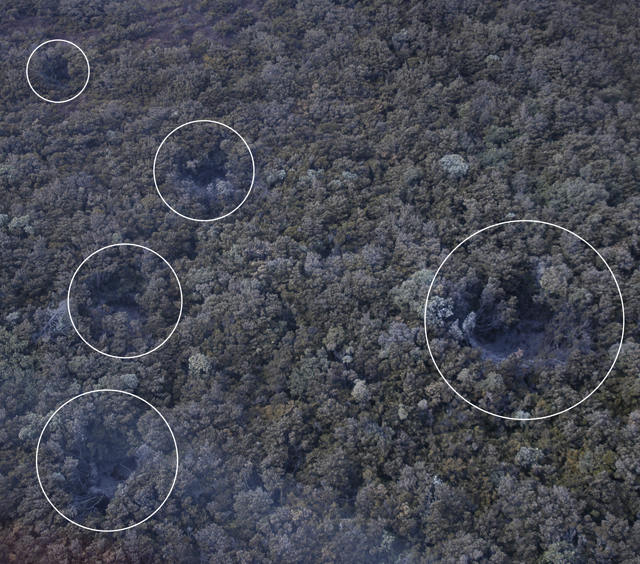 |
Figure 7. Blocks of lava ejected up to 2 km from the Te Maari Craters area during the phreatic explosion on 6 August 2012 left impact craters in vegetation and ground surfaces (circled). Courtesy of GeoNet. |
Ash and gas analyses. Textural analyses indicated that the ash emitted during the 6 August explosion contained little-to-no fresh (juvenile) lava, suggesting that the eruption was primarily steam driven (phreatic). GeoNet also reported that analysis of the fluorine content of the ash indicated that, except in the immediate vicinity of the volcano, there were little health or agricultural concerns.
For 9 August, GeoNet reported emissions of 2,100 tons/day of SO2, 3,900 tons/day of CO2, and 364 tons/day of H2S from vents. Sulfur (H2S) smells were reported in downwind locations during 11-12 August, and further reports were filed from the Manawatu region on 15 August. GeoNet attributed the sulfur odors to "passive degassing of magma beneath the surface of Tongariro."
Heavy rains spawn minor lahar. In concert with the 11 August release of a new, updated hazard map of Tongariro (figure 8), GeoNet warned motorists not to stop their vehicles along Highway 46 (N of Tongariro) due to hazards in that area. Following heavy rains the next morning, a minor flood/lahar crossed State Highway 46 near the S tip of Lake Rotoaira (at a location ~6 km W of Rangipo). According to the New Zealand Herald, a driver described 13-cm-deep mud crossing the road at 0830 that day. Scientists at GNS Science stressed that the lahar was not a direct result of an eruptive process, and a resident reported that the area was commonly washed out during heavy rains.
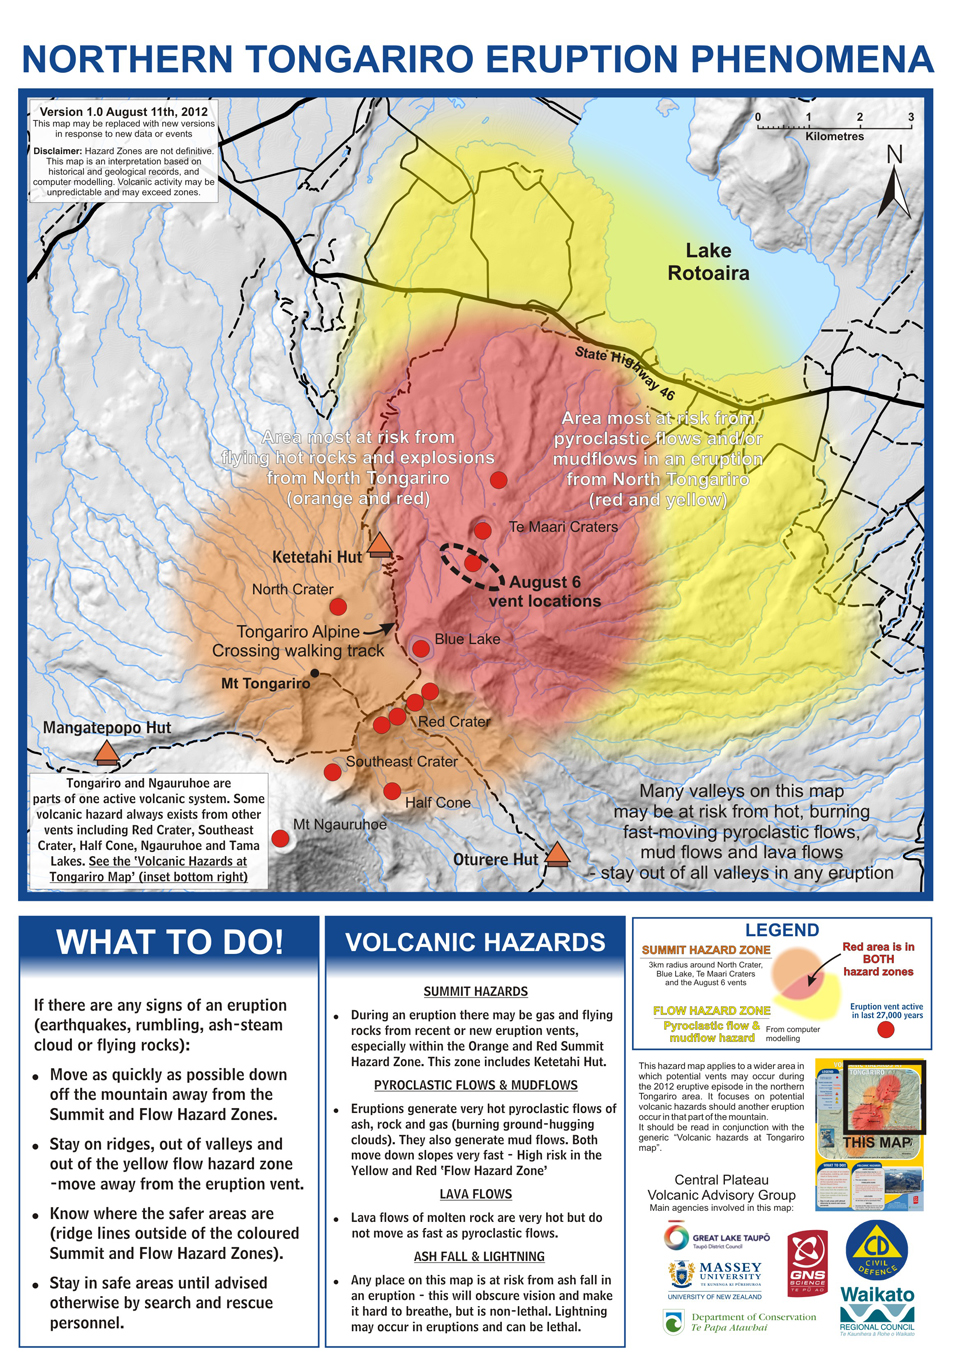 |
Figure 8. The updated hazard map released by GeoNet on 11 August 2012, which includes the 6 August vents seen in Tongariro's Te Maari Craters area (dashed black circle). As seen in the legend, the map indicates the locations prone to pyroclastic flows and mudflows (shaded yellow) and an area within a 3 km radius of the summit that is prone to gas hazards and flying rocks (shaded orange). Where the two zones overlap, the map is shaded red. Red dots indicate eruptive vents active in the last 27,000 years. Orange triangular "hut" icons indicate nearby mountain refuges. The larger poster conveys extensive hazard information. Note disclaimer (upper left) and wide range of agency collaboration (lower right) in map production. The highest peak of the complex is at Ngāuruhoe (near the SW corner of the map). As stated in the comment in the SW corner of the map, "Tongariro and Ngāuruhoe are parts of one active volcanic system." Courtesy of GeoNet. |
Ten days after the phreatic explosion, GeoNet reduced the Volcano Alert Level to 1, stating that minor eruptive activity, required for Volcanic Alert Level 2, had ceased. The Aviation Colour Code remained at Yellow as of 24 August 2012.
Information Contacts: GeoNet, a collaboration between theEarthquake Commission and GNS Science (URL: http://www.geonet.org.nz/); GNS Science, Wairakei Research Center, Private Bag 2000, Taupo 3352, New Zealand (URL: http://www.gns.cri.nz/); Earthquake Commission (EQC), PO Box 790, Wellington, New Zealand (URL: http://www.eqc.govt.nz/); The Cooperative Institute for Meteorological Satellite Studes (CIMSS), a collaboration between theUniversity of Wisonsin-Madison, theNational Oceanic and Atmospheric Administration, and theNational Aeronautics and Space Administration, Space Science and Engineering Center, 1225 W. Dayton St., Madison, WI 53706 (URL: http://cimss.ssec.wisc.edu/); University of Wisconsin-Madison (UW-Madison) (URL: http://www.wisc.edu/); National Oceanic and Atmospheric Administration (NOAA) (URL: http://www.noaa.gov/about-noaa.html); National Aeronautics and Space Administration (NASA) (URL: http://www.nasa.gov/); New Zealand Herald (URL: http://www.nzherald.co.nz/).
Small eruption on 21 November 2012; subsequent mild degassing and seismicity
A previous report on Tongariro covered the 6-7 August 2012 eruption and subsequent return to quiet (BGVN 37:07). Aside from a short-lived eruptive episode on 21 November 2012, GeoNet Data Centre reported only occasional mild degassing and small earthquakes occurred through August 2013. No further eruptive activity was reported through late 2014.
Activity during 2012. Degassing continued after the August 2012 eruption. Gas flux was relatively low on 29 August; sulfur dioxide emissions were 150 tonnes/day and carbon dioxide flux was 420 tonnes/day. Gas flights on 13 and 18 September revealed sulfur dioxide levels of 980 and 540 tonnes/day, respectively, and carbon dioxide flux of 1,340 tonnes/day on 18 September. The report noted that although the levels were lower than the 2,100 tonnes/day of sulfur dioxide and 3,900 tons of carbon dioxide measured on 9 August, shortly after the eruption, they had increased and were considered significant.
A field team visited the craters on 13 September and noted that Upper Te Maari crater has been widened and deepened by the 6 August eruption. They installed a new webcam pointed directly at the new Te Maari vents.
GeoNet researchers visited the Upper Te Maari Craters on 30 September to sample fumaroles, conduct a carbon dioxide soil gas survey, collect ejecta from the August eruption, and photograph the area (figures 9 and 10). The average carbon dioxide soil gas flux was lower than on 27 July; 24 sites had increased fluxes while 20 had decreased. The estimated soil gas emissions had decreased overall from about 5.8 to 2.5 metric tonnes per day.
|
Figure 9. View of Te Maari craters at Tongariro looking S on 30 September 2012. Courtesy of GeoNet. |
|
Figure 10. View of Upper Te Maari Crater looking E, 30 September 2012. Courtesy of GeoNet. |
On 12 October, GeoNet reported that gas plumes drifting downwind had been detected a hundred kilometers or more away. During the previous two weeks an odor attributed to venting was noticed in Manawatu (112 km S) and Hawke's Bay (120 km ESE). On 30 October the SO2 flux was 154 tonnes per day and the carbon dioxide flux was 477 tonnes per day. Several teams of scientists visited the Te Maari Craters on 5 November to service portable seismometers (complementing four permanent installations), sample gas vents, and collect samples of ejecta. The GeoNet report noted that not many earthquakes had been recorded recently, and that the hottest gas vent was 235° C while the others ranged from 95-104°.
A small eruption at the Te Maari Craters occurred at 1325 on 21 November (figure 11), without precursory events, prompting GeoNet to raise the Volcanic Alert Level to 2 and the Aviation Colour Code to Red. A report at 1730 noted that the eruption appeared to be over; the Aviation Colour Code was lowered to Orange, signaling that ash was no longer being emitted.
|
Figure 11. An ash plume rose from the Te Maari Crater at Tongariro at 1330 local time, shortly after the 21 November 2012 eruption. Courtesy of Institute of Geological and Nuclear Sciences, Ltd. |
The eruption occurred from the same area as the eruption on 6 August and lasted less than five minutes, although local seismic activity lasted about 15 minutes. GNS staff and hikers saw the eruption; an ash plume rose 3-4 km above the Upper Te Maari crater and produced ashfall across part of State Highway 46 and NE towards Turangi (21 km NE). Two small pyroclastic density currents were produced at the base of the column, to the W and N of the crater, and traveled a few hundred meters downslope. Later that afternoon gas-and-steam plumes drifted SE. On 22 November a sulfur gas odor was reported downwind in Manawatu (S) and Hawke's Bay (115 km ESE). A substantial amount of gas was emitted during 22-23 November. The Aviation Colour Code was lowered to Yellow on 23 November due to the absence of emitted ash. On 26 November GeoNet noted that no further volcanic activity had occurred since the eruption, gas flux had decreased, and seismic activity remained low.
Reports during 2013 and 2014. GeoNet reported on 14 February 2013 that no eruptive activity had been detected since the 21 November 2012 explosion. Steam-and-gas plumes rose from the Te Maari Craters, and had been unusually strong during recent weeks possibly due to weather conditions. On 25 March GeoNet reported continued quiescence, but with continuing steam-and-gas plumes. The Aviation Color Code was lowered to Green (second lowest on a 4 four-color scale) and the Volcanic Alert Level remained at 1 (on a scale of 0-5).
On 6 August 2013 small earthquakes were detected beneath Tongariro. These events were recorded only by a few seismic stations and were too small to be precisely located. GNS Science noted that the earthquakes could simply have been part of the background unrest typical of most active volcanoes, but they were of interest because there had been so few since November 2012 and potentially could have signaled changes inside the volcano.
The amounts of CO2 and sulfur gases emitted from Tongariro had remained at low levels since the start of 2013 and were about half the amount produced after the November 2012 explosion. These conditions, and the small number and small size of recent earthquakes, were not sufficient to alter the unrest status of the volcano; the Volcanic Alert remained at Level 1; the Aviation Color Code remained Green.
On 23 December 2013 GeoNet reported that the volcano continued to remain quiet. A few small earthquakes were recorded on the northern flanks at a rate of 2-3 per month. Gas measurements showed SO2 fluxes of about 10-15 tonnes/day, also a low level. Volcanologists also sampled the fumaroles on Te Maari that have been active since the 2012 eruptions; the main fumarole, which often provides strong steam plumes visible from Taupo, was emitting gases at over 400 °C.
A 10 February 2014 survey of carbon dioxide (CO2) emissions near Red Crater (~4 km SSW from Te Maari) noted little change since a 2009 survey. In 2009 there was a calculated flux of 47 tonnes per day from the survey area. The result from the February 2014 survey indicated a flux of 39 tonnes per day; the difference was not considered significant. The temperature just below the ground surface was also similar to 2009 values.
Information Contacts: GeoNet, a collaboration between the Earthquake Commission and GNS Science (URL: http://www.geonet.org.nz/); GNS Science, Wairakei Research Center, Private Bag 2000, Taupo 3352, New Zealand (URL: http://www.gns.cri.nz/).
This compilation of synonyms and subsidiary features may not be comprehensive. Features are organized into four major categories: Cones, Craters, Domes, and Thermal Features. Synonyms of features appear indented below the primary name. In some cases additional feature type, elevation, or location details are provided.
Cones |
||||
| Feature Name | Feature Type | Elevation | Latitude | Longitude |
| Emerald Lakes | Vent | |||
|
Ngāuruhoe
Auruhoe |
Stratovolcano | 2291 m | 39° 9' 24" S | 175° 37' 57" E |
| Pukekaikiore | Cone | 1680 m | 39° 9' 0" S | 175° 34' 0" E |
| Pukeonake | Cone | 1225 m | 39° 9' 0" S | 175° 36' 0" E |
Craters |
||||
| Feature Name | Feature Type | Elevation | Latitude | Longitude |
| Blue Lake | Crater | 1686 m | 39° 8' 0" S | 175° 40' 0" E |
| Lower Tama Lake | Crater | |||
| North Crater | Crater | 1830 m | 39° 7' 0" S | 175° 41' 0" E |
| Red Crater | Crater | 1860 m | 39° 8' 0" S | 175° 41' 0" E |
|
Te Maari
Te Mari Puia Hou Sulphur Lagoon |
Crater | 1500 m | 39° 7' 0" S | 175° 40' 0" E |
| Upper Tama Lake | Crater | |||
Thermal |
||||
| Feature Name | Feature Type | Elevation | Latitude | Longitude |
| Ketetahi | Thermal | 1400 m | 39° 6' 0" S | 175° 41' 0" E |
|
|
||||||||||||||||||||||||||
There is data available for 76 confirmed Holocene eruptive periods.
2012 Nov 21 - 2012 Nov 21 Confirmed Eruption Max VEI: 2
| Episode 1 | Eruption Episode | Upper Te Maari Craters | |||||||||||||||||||||||||||||||||||||||
|---|---|---|---|---|---|---|---|---|---|---|---|---|---|---|---|---|---|---|---|---|---|---|---|---|---|---|---|---|---|---|---|---|---|---|---|---|---|---|---|---|
| 2012 Nov 21 - 2012 Nov 21 | Evidence from Observations: Reported | |||||||||||||||||||||||||||||||||||||||
|
List of 6 Events for Episode 1 at Upper Te Maari Craters
| ||||||||||||||||||||||||||||||||||||||||
2012 Aug 6 - 2012 Aug 7 Confirmed Eruption Max VEI: 2
| Episode 1 | Eruption Episode | Upper Te Maari Craters | ||||||||||||||||||||||||||||||||||||||||||||||||||||||||||||||||||||||||||
|---|---|---|---|---|---|---|---|---|---|---|---|---|---|---|---|---|---|---|---|---|---|---|---|---|---|---|---|---|---|---|---|---|---|---|---|---|---|---|---|---|---|---|---|---|---|---|---|---|---|---|---|---|---|---|---|---|---|---|---|---|---|---|---|---|---|---|---|---|---|---|---|---|---|---|---|
| 2012 Aug 6 - 2012 Aug 7 | Evidence from Observations: Reported | ||||||||||||||||||||||||||||||||||||||||||||||||||||||||||||||||||||||||||
|
List of 13 Events for Episode 1 at Upper Te Maari Craters
| |||||||||||||||||||||||||||||||||||||||||||||||||||||||||||||||||||||||||||
1977 Jul 4 - 1977 Jul 4 Confirmed Eruption Max VEI: 1
| Episode 1 | Eruption Episode | Ngauruhoe | |||||||||||||||||||
|---|---|---|---|---|---|---|---|---|---|---|---|---|---|---|---|---|---|---|---|---|
| 1977 Jul 4 - 1977 Jul 4 | Evidence from Observations: Reported | |||||||||||||||||||
|
List of 2 Events for Episode 1 at Ngauruhoe
| ||||||||||||||||||||
1976 Aug 23 - 1976 Aug 28 Confirmed Eruption Max VEI: 1
| Episode 1 | Eruption Episode | Ngauruhoe | |||||||||||||||||||
|---|---|---|---|---|---|---|---|---|---|---|---|---|---|---|---|---|---|---|---|---|
| 1976 Aug 23 - 1976 Aug 28 | Evidence from Observations: Reported | |||||||||||||||||||
|
List of 2 Events for Episode 1 at Ngauruhoe
| ||||||||||||||||||||
1975 Feb 12 - 1975 Feb 23 Confirmed Eruption Max VEI: 3
| Episode 1 | Eruption Episode | Ngauruhoe | |||||||||||||||||||||||||||||||||||||||||||||||||||||||||||
|---|---|---|---|---|---|---|---|---|---|---|---|---|---|---|---|---|---|---|---|---|---|---|---|---|---|---|---|---|---|---|---|---|---|---|---|---|---|---|---|---|---|---|---|---|---|---|---|---|---|---|---|---|---|---|---|---|---|---|---|---|
| 1975 Feb 12 - 1975 Feb 23 | Evidence from Observations: Reported | |||||||||||||||||||||||||||||||||||||||||||||||||||||||||||
|
List of 10 Events for Episode 1 at Ngauruhoe
| ||||||||||||||||||||||||||||||||||||||||||||||||||||||||||||
1972 Nov 22 - 1974 Aug 19 Confirmed Eruption Max VEI: 3
| Episode 1 | Eruption Episode | Ngauruhoe | |||||||||||||||||||||||||||||||||||||||||||||||||||||||||||
|---|---|---|---|---|---|---|---|---|---|---|---|---|---|---|---|---|---|---|---|---|---|---|---|---|---|---|---|---|---|---|---|---|---|---|---|---|---|---|---|---|---|---|---|---|---|---|---|---|---|---|---|---|---|---|---|---|---|---|---|---|
| 1972 Nov 22 - 1974 Aug 19 | Evidence from Observations: Reported | |||||||||||||||||||||||||||||||||||||||||||||||||||||||||||
|
List of 10 Events for Episode 1 at Ngauruhoe
| ||||||||||||||||||||||||||||||||||||||||||||||||||||||||||||
1972 Mar 19 - 1972 Jun 6 Confirmed Eruption Max VEI: 2
| Episode 1 | Eruption Episode | Ngauruhoe | ||||||||||||||||||||||||||||||||||
|---|---|---|---|---|---|---|---|---|---|---|---|---|---|---|---|---|---|---|---|---|---|---|---|---|---|---|---|---|---|---|---|---|---|---|---|
| 1972 Mar 19 - 1972 Jun 6 | Evidence from Observations: Reported | ||||||||||||||||||||||||||||||||||
|
List of 5 Events for Episode 1 at Ngauruhoe
| |||||||||||||||||||||||||||||||||||
1969 Jan 21 Confirmed Eruption Max VEI: 2
| Episode 1 | Eruption Episode | Ngauruhoe | ||||||||||||||||||||||||
|---|---|---|---|---|---|---|---|---|---|---|---|---|---|---|---|---|---|---|---|---|---|---|---|---|---|
| 1969 Jan 21 - Unknown | Evidence from Observations: Reported | ||||||||||||||||||||||||
|
List of 3 Events for Episode 1 at Ngauruhoe
| |||||||||||||||||||||||||
1968 Aug 18 Confirmed Eruption Max VEI: 2
| Episode 1 | Eruption Episode | Ngauruhoe | ||||||||||||||||||||||||
|---|---|---|---|---|---|---|---|---|---|---|---|---|---|---|---|---|---|---|---|---|---|---|---|---|---|
| 1968 Aug 18 - Unknown | Evidence from Observations: Reported | ||||||||||||||||||||||||
|
List of 3 Events for Episode 1 at Ngauruhoe
| |||||||||||||||||||||||||
1962 May 24 Confirmed Eruption Max VEI: 2
| Episode 1 | Eruption Episode | Ngauruhoe | ||||||||||||||||||||||||
|---|---|---|---|---|---|---|---|---|---|---|---|---|---|---|---|---|---|---|---|---|---|---|---|---|---|
| 1962 May 24 - Unknown | Evidence from Observations: Reported | ||||||||||||||||||||||||
|
List of 3 Events for Episode 1 at Ngauruhoe
| |||||||||||||||||||||||||
1959 Jun 1 Confirmed Eruption Max VEI: 2
| Episode 1 | Eruption Episode | Ngauruhoe | ||||||||||||||||||||||||
|---|---|---|---|---|---|---|---|---|---|---|---|---|---|---|---|---|---|---|---|---|---|---|---|---|---|
| 1959 Jun 1 - Unknown | Evidence from Observations: Reported | ||||||||||||||||||||||||
|
List of 3 Events for Episode 1 at Ngauruhoe
| |||||||||||||||||||||||||
1958 Nov 5 - 1958 Nov 18 (?) Confirmed Eruption Max VEI: 2
| Episode 1 | Eruption Episode | Ngauruhoe | ||||||||||||||||||||||||
|---|---|---|---|---|---|---|---|---|---|---|---|---|---|---|---|---|---|---|---|---|---|---|---|---|---|
| 1958 Nov 5 - 1958 Nov 18 (?) | Evidence from Observations: Reported | ||||||||||||||||||||||||
|
List of 3 Events for Episode 1 at Ngauruhoe
| |||||||||||||||||||||||||
1956 Jan 11 - 1956 Feb 11 Confirmed Eruption Max VEI: 2
| Episode 1 | Eruption Episode | Ngauruhoe (south sub-crater) | ||||||||||||||||||||||||
|---|---|---|---|---|---|---|---|---|---|---|---|---|---|---|---|---|---|---|---|---|---|---|---|---|---|
| 1956 Jan 11 - 1956 Feb 11 | Evidence from Observations: Reported | ||||||||||||||||||||||||
|
List of 3 Events for Episode 1 at Ngauruhoe (south sub-crater)
| |||||||||||||||||||||||||
1954 May 13 - 1955 Jun 25 Confirmed Eruption Max VEI: 3
| Episode 1 | Eruption Episode | Ngauruhoe (south sub-crater) | |||||||||||||||||||||||||||||||||||||||||||||||||||||||||||
|---|---|---|---|---|---|---|---|---|---|---|---|---|---|---|---|---|---|---|---|---|---|---|---|---|---|---|---|---|---|---|---|---|---|---|---|---|---|---|---|---|---|---|---|---|---|---|---|---|---|---|---|---|---|---|---|---|---|---|---|---|
| 1954 May 13 - 1955 Jun 25 | Evidence from Observations: Reported | |||||||||||||||||||||||||||||||||||||||||||||||||||||||||||
|
List of 10 Events for Episode 1 at Ngauruhoe (south sub-crater)
| ||||||||||||||||||||||||||||||||||||||||||||||||||||||||||||
1953 Dec 28 (in or before) Confirmed Eruption Max VEI: 0
| Episode 1 | Eruption Episode | Ngauruhoe (south sub-crater) | |||||||||||||||||||
|---|---|---|---|---|---|---|---|---|---|---|---|---|---|---|---|---|---|---|---|---|
| 1953 Dec 28 (in or before) - Unknown | Evidence from Observations: Reported | |||||||||||||||||||
|
List of 2 Events for Episode 1 at Ngauruhoe (south sub-crater)
| ||||||||||||||||||||
1952 Nov 29 - 1953 Jul 16 ± 15 days Confirmed Eruption Max VEI: 2
| Episode 1 | Eruption Episode | Ngauruhoe (south sub-crater) | ||||||||||||||||||||||||||||||||||||||||||||
|---|---|---|---|---|---|---|---|---|---|---|---|---|---|---|---|---|---|---|---|---|---|---|---|---|---|---|---|---|---|---|---|---|---|---|---|---|---|---|---|---|---|---|---|---|---|
| 1952 Nov 29 - 1953 Jul 16 ± 15 days | Evidence from Observations: Reported | ||||||||||||||||||||||||||||||||||||||||||||
|
List of 7 Events for Episode 1 at Ngauruhoe (south sub-crater)
| |||||||||||||||||||||||||||||||||||||||||||||
1951 May 16 ± 15 days Confirmed Eruption Max VEI: 2
| Episode 1 | Eruption Episode | Ngauruhoe | ||||||||||||||||||||||||
|---|---|---|---|---|---|---|---|---|---|---|---|---|---|---|---|---|---|---|---|---|---|---|---|---|---|
| 1951 May 16 ± 15 days - Unknown | Evidence from Observations: Reported | ||||||||||||||||||||||||
|
List of 3 Events for Episode 1 at Ngauruhoe
| |||||||||||||||||||||||||
1950 Jun 16 Confirmed Eruption Max VEI: 2
| Episode 1 | Eruption Episode | Ngauruhoe | ||||||||||||||||||||||||
|---|---|---|---|---|---|---|---|---|---|---|---|---|---|---|---|---|---|---|---|---|---|---|---|---|---|
| 1950 Jun 16 - Unknown | Evidence from Observations: Reported | ||||||||||||||||||||||||
|
List of 3 Events for Episode 1 at Ngauruhoe
| |||||||||||||||||||||||||
1949 Feb 9 - 1949 Mar 3 Confirmed Eruption Max VEI: 2
| Episode 1 | Eruption Episode | Ngauruhoe (south sub-crater) | |||||||||||||||||||||||||||||||||||||||||||||||||
|---|---|---|---|---|---|---|---|---|---|---|---|---|---|---|---|---|---|---|---|---|---|---|---|---|---|---|---|---|---|---|---|---|---|---|---|---|---|---|---|---|---|---|---|---|---|---|---|---|---|---|
| 1949 Feb 9 - 1949 Mar 3 | Evidence from Observations: Reported | |||||||||||||||||||||||||||||||||||||||||||||||||
|
List of 8 Events for Episode 1 at Ngauruhoe (south sub-crater)
| ||||||||||||||||||||||||||||||||||||||||||||||||||
1948 Sep Confirmed Eruption Max VEI: 2
| Episode 1 | Eruption Episode | Ngauruhoe | ||||||||||||||||||||||||
|---|---|---|---|---|---|---|---|---|---|---|---|---|---|---|---|---|---|---|---|---|---|---|---|---|---|
| 1948 Sep - Unknown | Evidence from Observations: Reported | ||||||||||||||||||||||||
|
List of 3 Events for Episode 1 at Ngauruhoe
| |||||||||||||||||||||||||
1948 Apr 30 - 1948 May Confirmed Eruption Max VEI: 2
| Episode 1 | Eruption Episode | Ngauruhoe | |||||||||||||||||||||||||||||||||||||||||||||||||
|---|---|---|---|---|---|---|---|---|---|---|---|---|---|---|---|---|---|---|---|---|---|---|---|---|---|---|---|---|---|---|---|---|---|---|---|---|---|---|---|---|---|---|---|---|---|---|---|---|---|---|
| 1948 Apr 30 - 1948 May | Evidence from Observations: Reported | |||||||||||||||||||||||||||||||||||||||||||||||||
|
List of 8 Events for Episode 1 at Ngauruhoe
| ||||||||||||||||||||||||||||||||||||||||||||||||||
1940 Sep - 1940 Oct Confirmed Eruption Max VEI: 2
| Episode 1 | Eruption Episode | Ngauruhoe | ||||||||||||||||||||||||
|---|---|---|---|---|---|---|---|---|---|---|---|---|---|---|---|---|---|---|---|---|---|---|---|---|---|
| 1940 Sep - 1940 Oct | Evidence from Observations: Reported | ||||||||||||||||||||||||
|
List of 3 Events for Episode 1 at Ngauruhoe
| |||||||||||||||||||||||||
1939 Aug Confirmed Eruption Max VEI: 2
| Episode 1 | Eruption Episode | Ngauruhoe | ||||||||||||||||||||||||
|---|---|---|---|---|---|---|---|---|---|---|---|---|---|---|---|---|---|---|---|---|---|---|---|---|---|
| 1939 Aug - Unknown | Evidence from Observations: Reported | ||||||||||||||||||||||||
|
List of 3 Events for Episode 1 at Ngauruhoe
| |||||||||||||||||||||||||
1937 Jan Confirmed Eruption Max VEI: 2
| Episode 1 | Eruption Episode | Ngauruhoe | ||||||||||||||||||||||||
|---|---|---|---|---|---|---|---|---|---|---|---|---|---|---|---|---|---|---|---|---|---|---|---|---|---|
| 1937 Jan - Unknown | Evidence from Observations: Reported | ||||||||||||||||||||||||
|
List of 3 Events for Episode 1 at Ngauruhoe
| |||||||||||||||||||||||||
1934 Dec - 1935 Feb Confirmed Eruption Max VEI: 2
| Episode 1 | Eruption Episode | Ngauruhoe | ||||||||||||||||||||||||
|---|---|---|---|---|---|---|---|---|---|---|---|---|---|---|---|---|---|---|---|---|---|---|---|---|---|
| 1934 Dec - 1935 Feb | Evidence from Observations: Reported | ||||||||||||||||||||||||
|
List of 3 Events for Episode 1 at Ngauruhoe
| |||||||||||||||||||||||||
1934 Jun Confirmed Eruption Max VEI: 2
| Episode 1 | Eruption Episode | Ngauruhoe | ||||||||||||||||||||||||
|---|---|---|---|---|---|---|---|---|---|---|---|---|---|---|---|---|---|---|---|---|---|---|---|---|---|
| 1934 Jun - Unknown | Evidence from Observations: Reported | ||||||||||||||||||||||||
|
List of 3 Events for Episode 1 at Ngauruhoe
| |||||||||||||||||||||||||
1931 Feb - 1931 May Confirmed Eruption Max VEI: 2
| Episode 1 | Eruption Episode | Ngauruhoe | ||||||||||||||||||||||||
|---|---|---|---|---|---|---|---|---|---|---|---|---|---|---|---|---|---|---|---|---|---|---|---|---|---|
| 1931 Feb - 1931 May | Evidence from Observations: Reported | ||||||||||||||||||||||||
|
List of 3 Events for Episode 1 at Ngauruhoe
| |||||||||||||||||||||||||
1928 Jul Confirmed Eruption Max VEI: 2
| Episode 1 | Eruption Episode | Ngauruhoe | ||||||||||||||||||||||||
|---|---|---|---|---|---|---|---|---|---|---|---|---|---|---|---|---|---|---|---|---|---|---|---|---|---|
| 1928 Jul - Unknown | Evidence from Observations: Reported | ||||||||||||||||||||||||
|
List of 3 Events for Episode 1 at Ngauruhoe
| |||||||||||||||||||||||||
1928 Mar 3 Confirmed Eruption Max VEI: 2
| Episode 1 | Eruption Episode | Ngauruhoe | ||||||||||||||||||||||||||||||||||
|---|---|---|---|---|---|---|---|---|---|---|---|---|---|---|---|---|---|---|---|---|---|---|---|---|---|---|---|---|---|---|---|---|---|---|---|
| 1928 Mar 3 - Unknown | Evidence from Observations: Reported | ||||||||||||||||||||||||||||||||||
|
List of 5 Events for Episode 1 at Ngauruhoe
| |||||||||||||||||||||||||||||||||||
[ 1927 ] Uncertain Eruption
| Episode 1 | Eruption Episode | North flank (Ketetahi) | |||||||||||||||||||
|---|---|---|---|---|---|---|---|---|---|---|---|---|---|---|---|---|---|---|---|---|
| 1927 - Unknown | Evidence from Unknown | |||||||||||||||||||
|
List of 2 Events for Episode 1 at North flank (Ketetahi)
| ||||||||||||||||||||
1926 Dec 21 - 1926 Dec 30 (?) Confirmed Eruption Max VEI: 2
| Episode 1 | Eruption Episode | Ngauruhoe | ||||||||||||||||||||||||
|---|---|---|---|---|---|---|---|---|---|---|---|---|---|---|---|---|---|---|---|---|---|---|---|---|---|
| 1926 Dec 21 - 1926 Dec 30 (?) | Evidence from Observations: Reported | ||||||||||||||||||||||||
|
List of 3 Events for Episode 1 at Ngauruhoe
| |||||||||||||||||||||||||
1926 Apr 16 - 1926 Jun Confirmed Eruption Max VEI: 2
| Episode 1 | Eruption Episode | Ngauruhoe and Red Crater | |||||||||||||||||||||||||||||
|---|---|---|---|---|---|---|---|---|---|---|---|---|---|---|---|---|---|---|---|---|---|---|---|---|---|---|---|---|---|---|
| 1926 Apr 16 - 1926 Jun | Evidence from Observations: Reported | |||||||||||||||||||||||||||||
|
List of 4 Events for Episode 1 at Ngauruhoe and Red Crater
| ||||||||||||||||||||||||||||||
1925 Nov - 1925 Dec Confirmed Eruption Max VEI: 2
| Episode 1 | Eruption Episode | Ngauruhoe | ||||||||||||||||||||||||
|---|---|---|---|---|---|---|---|---|---|---|---|---|---|---|---|---|---|---|---|---|---|---|---|---|---|
| 1925 Nov - 1925 Dec | Evidence from Observations: Reported | ||||||||||||||||||||||||
|
List of 3 Events for Episode 1 at Ngauruhoe
| |||||||||||||||||||||||||
1924 Oct - 1924 Nov Confirmed Eruption Max VEI: 2
| Episode 1 | Eruption Episode | Ngauruhoe | ||||||||||||||||||||||||
|---|---|---|---|---|---|---|---|---|---|---|---|---|---|---|---|---|---|---|---|---|---|---|---|---|---|
| 1924 Oct - 1924 Nov | Evidence from Observations: Reported | ||||||||||||||||||||||||
|
List of 3 Events for Episode 1 at Ngauruhoe
| |||||||||||||||||||||||||
1924 May 22 Confirmed Eruption Max VEI: 2
| Episode 1 | Eruption Episode | Ngauruhoe | |||||||||||||||||||||||||||||
|---|---|---|---|---|---|---|---|---|---|---|---|---|---|---|---|---|---|---|---|---|---|---|---|---|---|---|---|---|---|---|
| 1924 May 22 - Unknown | Evidence from Observations: Reported | |||||||||||||||||||||||||||||
|
List of 4 Events for Episode 1 at Ngauruhoe
| ||||||||||||||||||||||||||||||
1924 Jan 9 - 1924 Jan 30 Confirmed Eruption Max VEI: 2
| Episode 1 | Eruption Episode | Ngauruhoe | ||||||||||||||||||||||||
|---|---|---|---|---|---|---|---|---|---|---|---|---|---|---|---|---|---|---|---|---|---|---|---|---|---|
| 1924 Jan 9 - 1924 Jan 30 | Evidence from Observations: Reported | ||||||||||||||||||||||||
|
List of 3 Events for Episode 1 at Ngauruhoe
| |||||||||||||||||||||||||
1917 Oct - 1917 Nov Confirmed Eruption Max VEI: 2
| Episode 1 | Eruption Episode | Ngauruhoe | ||||||||||||||||||||||||
|---|---|---|---|---|---|---|---|---|---|---|---|---|---|---|---|---|---|---|---|---|---|---|---|---|---|
| 1917 Oct - 1917 Nov | Evidence from Observations: Reported | ||||||||||||||||||||||||
|
List of 3 Events for Episode 1 at Ngauruhoe
| |||||||||||||||||||||||||
1914 Sep - 1914 Oct Confirmed Eruption Max VEI: 2
| Episode 1 | Eruption Episode | Ngauruhoe | ||||||||||||||||||||||||
|---|---|---|---|---|---|---|---|---|---|---|---|---|---|---|---|---|---|---|---|---|---|---|---|---|---|
| 1914 Sep - 1914 Oct | Evidence from Observations: Reported | ||||||||||||||||||||||||
|
List of 3 Events for Episode 1 at Ngauruhoe
| |||||||||||||||||||||||||
1913 May Confirmed Eruption Max VEI: 2
| Episode 1 | Eruption Episode | Ngauruhoe | ||||||||||||||||||||||||
|---|---|---|---|---|---|---|---|---|---|---|---|---|---|---|---|---|---|---|---|---|---|---|---|---|---|
| 1913 May - Unknown | Evidence from Observations: Reported | ||||||||||||||||||||||||
|
List of 3 Events for Episode 1 at Ngauruhoe
| |||||||||||||||||||||||||
1913 Jan Confirmed Eruption Max VEI: 2
| Episode 1 | Eruption Episode | Ngauruhoe | |||||||||||||||||||
|---|---|---|---|---|---|---|---|---|---|---|---|---|---|---|---|---|---|---|---|---|
| 1913 Jan - Unknown | Evidence from Observations: Reported | |||||||||||||||||||
|
List of 2 Events for Episode 1 at Ngauruhoe
| ||||||||||||||||||||
1910 Oct - 1911 Jan Confirmed Eruption Max VEI: 2
| Episode 1 | Eruption Episode | Ngauruhoe | |||||||||||||||||||
|---|---|---|---|---|---|---|---|---|---|---|---|---|---|---|---|---|---|---|---|---|
| 1910 Oct - 1911 Jan | Evidence from Observations: Reported | |||||||||||||||||||
|
List of 2 Events for Episode 1 at Ngauruhoe
| ||||||||||||||||||||
1910 Jan Confirmed Eruption Max VEI: 2
| Episode 1 | Eruption Episode | Ngauruhoe | ||||||||||||||||||||||||
|---|---|---|---|---|---|---|---|---|---|---|---|---|---|---|---|---|---|---|---|---|---|---|---|---|---|
| 1910 Jan - Unknown | Evidence from Observations: Reported | ||||||||||||||||||||||||
|
List of 3 Events for Episode 1 at Ngauruhoe
| |||||||||||||||||||||||||
1909 Mar - 1909 Jul Confirmed Eruption Max VEI: 2
| Episode 1 | Eruption Episode | Ngauruhoe | ||||||||||||||||||||||||
|---|---|---|---|---|---|---|---|---|---|---|---|---|---|---|---|---|---|---|---|---|---|---|---|---|---|
| 1909 Mar - 1909 Jul | Evidence from Observations: Reported | ||||||||||||||||||||||||
|
List of 3 Events for Episode 1 at Ngauruhoe
| |||||||||||||||||||||||||
1907 Nov Confirmed Eruption Max VEI: 2
| Episode 1 | Eruption Episode | Ngauruhoe | |||||||||||||||||||
|---|---|---|---|---|---|---|---|---|---|---|---|---|---|---|---|---|---|---|---|---|
| 1907 Nov - Unknown | Evidence from Observations: Reported | |||||||||||||||||||
|
List of 2 Events for Episode 1 at Ngauruhoe
| ||||||||||||||||||||
1907 Feb - 1907 May Confirmed Eruption Max VEI: 2
| Episode 1 | Eruption Episode | Ngauruhoe (south sub-crater) | ||||||||||||||||||||||||
|---|---|---|---|---|---|---|---|---|---|---|---|---|---|---|---|---|---|---|---|---|---|---|---|---|---|
| 1907 Feb - 1907 May | Evidence from Observations: Reported | ||||||||||||||||||||||||
|
List of 3 Events for Episode 1 at Ngauruhoe (south sub-crater)
| |||||||||||||||||||||||||
1906 Mar Confirmed Eruption Max VEI: 2
| Episode 1 | Eruption Episode | Ngauruhoe | ||||||||||||||||||||||||
|---|---|---|---|---|---|---|---|---|---|---|---|---|---|---|---|---|---|---|---|---|---|---|---|---|---|
| 1906 Mar - Unknown | Evidence from Observations: Reported | ||||||||||||||||||||||||
|
List of 3 Events for Episode 1 at Ngauruhoe
| |||||||||||||||||||||||||
1905 Confirmed Eruption Max VEI: 2
| Episode 1 | Eruption Episode | Ngauruhoe | ||||||||||||||||||||||||
|---|---|---|---|---|---|---|---|---|---|---|---|---|---|---|---|---|---|---|---|---|---|---|---|---|---|
| 1905 - Unknown | Evidence from Observations: Reported | ||||||||||||||||||||||||
|
List of 3 Events for Episode 1 at Ngauruhoe
| |||||||||||||||||||||||||
1904 Nov 22 Confirmed Eruption Max VEI: 2
| Episode 1 | Eruption Episode | Ngauruhoe | ||||||||||||||||||||||||
|---|---|---|---|---|---|---|---|---|---|---|---|---|---|---|---|---|---|---|---|---|---|---|---|---|---|
| 1904 Nov 22 - Unknown | Evidence from Observations: Reported | ||||||||||||||||||||||||
|
List of 3 Events for Episode 1 at Ngauruhoe
| |||||||||||||||||||||||||
1898 Jan Confirmed Eruption Max VEI: 2
| Episode 1 | Eruption Episode | Ngauruhoe | ||||||||||||||||||||||||
|---|---|---|---|---|---|---|---|---|---|---|---|---|---|---|---|---|---|---|---|---|---|---|---|---|---|
| 1898 Jan - Unknown | Evidence from Observations: Reported | ||||||||||||||||||||||||
|
List of 3 Events for Episode 1 at Ngauruhoe
| |||||||||||||||||||||||||
1897 Confirmed Eruption Max VEI: 2
| Episode 1 | Eruption Episode | Ngauruhoe | |||||||||||||||||||
|---|---|---|---|---|---|---|---|---|---|---|---|---|---|---|---|---|---|---|---|---|
| 1897 - Unknown | Evidence from Observations: Reported | |||||||||||||||||||
|
List of 2 Events for Episode 1 at Ngauruhoe
| ||||||||||||||||||||
1896 Nov - 1896 Dec 26 ± 5 days Confirmed Eruption Max VEI: 2
| Episode 1 | Eruption Episode | NE flank (upper Te Mari Crater) | ||||||||||||||||||||||||||||||||||
|---|---|---|---|---|---|---|---|---|---|---|---|---|---|---|---|---|---|---|---|---|---|---|---|---|---|---|---|---|---|---|---|---|---|---|---|
| 1896 Nov - 1896 Dec 26 ± 5 days | Evidence from Observations: Reported | ||||||||||||||||||||||||||||||||||
|
List of 5 Events for Episode 1 at NE flank (upper Te Mari Crater)
| |||||||||||||||||||||||||||||||||||
1892 Nov 30 Confirmed Eruption Max VEI: 2
| Episode 1 | Eruption Episode | NE flank (upper Te Mari Crater) | ||||||||||||||||||||||||||||||||||||||||||||||||||||||
|---|---|---|---|---|---|---|---|---|---|---|---|---|---|---|---|---|---|---|---|---|---|---|---|---|---|---|---|---|---|---|---|---|---|---|---|---|---|---|---|---|---|---|---|---|---|---|---|---|---|---|---|---|---|---|---|
| 1892 Nov 30 - Unknown | Evidence from Observations: Reported | ||||||||||||||||||||||||||||||||||||||||||||||||||||||
|
List of 9 Events for Episode 1 at NE flank (upper Te Mari Crater)
| |||||||||||||||||||||||||||||||||||||||||||||||||||||||
1892 Nov - 1892 Dec Confirmed Eruption Max VEI: 2
| Episode 1 | Eruption Episode | Ngauruhoe | ||||||||||||||||||||||||
|---|---|---|---|---|---|---|---|---|---|---|---|---|---|---|---|---|---|---|---|---|---|---|---|---|---|
| 1892 Nov - 1892 Dec | Evidence from Observations: Reported | ||||||||||||||||||||||||
|
List of 3 Events for Episode 1 at Ngauruhoe
| |||||||||||||||||||||||||
1892 Feb - 1892 Mar Confirmed Eruption Max VEI: 2
| Episode 1 | Eruption Episode | Ngauruhoe | ||||||||||||||||||||||||
|---|---|---|---|---|---|---|---|---|---|---|---|---|---|---|---|---|---|---|---|---|---|---|---|---|---|
| 1892 Feb - 1892 Mar | Evidence from Observations: Reported | ||||||||||||||||||||||||
|
List of 3 Events for Episode 1 at Ngauruhoe
| |||||||||||||||||||||||||
[ 1890 Mar ] Uncertain Eruption
| Episode 1 | Eruption Episode | SSE flank (Red Crater) | |||||||||||||||||||
|---|---|---|---|---|---|---|---|---|---|---|---|---|---|---|---|---|---|---|---|---|
| 1890 Mar - Unknown | Evidence from Unknown | |||||||||||||||||||
|
List of 2 Events for Episode 1 at SSE flank (Red Crater)
| ||||||||||||||||||||
1886 Jun Confirmed Eruption Max VEI: 2
| Episode 1 | Eruption Episode | NE flank (upper Te Mari Crater) | |||||||||||||||||||||||||||||
|---|---|---|---|---|---|---|---|---|---|---|---|---|---|---|---|---|---|---|---|---|---|---|---|---|---|---|---|---|---|---|
| 1886 Jun - Unknown | Evidence from Observations: Reported | |||||||||||||||||||||||||||||
|
List of 4 Events for Episode 1 at NE flank (upper Te Mari Crater)
| ||||||||||||||||||||||||||||||
1885 ± 1 years - 1887 Confirmed Eruption Max VEI: 1
| Episode 1 | Eruption Episode | SSE flank (Red Crater) | |||||||||||||||||||
|---|---|---|---|---|---|---|---|---|---|---|---|---|---|---|---|---|---|---|---|---|
| 1885 ± 1 years - 1887 | Evidence from Observations: Reported | |||||||||||||||||||
|
List of 2 Events for Episode 1 at SSE flank (Red Crater)
| ||||||||||||||||||||
1883 Apr 25 ± 5 days Confirmed Eruption Max VEI: 2
| Episode 1 | Eruption Episode | Ngauruhoe (south sub-crater) | ||||||||||||||||||||||||
|---|---|---|---|---|---|---|---|---|---|---|---|---|---|---|---|---|---|---|---|---|---|---|---|---|---|
| 1883 Apr 25 ± 5 days - Unknown | Evidence from Observations: Reported | ||||||||||||||||||||||||
|
List of 3 Events for Episode 1 at Ngauruhoe (south sub-crater)
| |||||||||||||||||||||||||
1881 Jul 6 Confirmed Eruption Max VEI: 2
| Episode 1 | Eruption Episode | Ngauruhoe | ||||||||||||||||||||||||
|---|---|---|---|---|---|---|---|---|---|---|---|---|---|---|---|---|---|---|---|---|---|---|---|---|---|
| 1881 Jul 6 - Unknown | Evidence from Observations: Reported | ||||||||||||||||||||||||
|
List of 3 Events for Episode 1 at Ngauruhoe
| |||||||||||||||||||||||||
1878 Sep 1 ± 120 days Confirmed Eruption Max VEI: 2
| Episode 1 | Eruption Episode | Ngauruhoe (NW sub-crater) | |||||||||||||||||||||||||||||
|---|---|---|---|---|---|---|---|---|---|---|---|---|---|---|---|---|---|---|---|---|---|---|---|---|---|---|---|---|---|---|
| 1878 Sep 1 ± 120 days - Unknown | Evidence from Observations: Reported | |||||||||||||||||||||||||||||
|
List of 4 Events for Episode 1 at Ngauruhoe (NW sub-crater)
| ||||||||||||||||||||||||||||||
[ 1875 Oct 1 ± 90 days ] Uncertain Eruption
| Episode 1 | Eruption Episode | Ngauruhoe | |||||||||||||||||||
|---|---|---|---|---|---|---|---|---|---|---|---|---|---|---|---|---|---|---|---|---|
| 1875 Oct 1 ± 90 days - Unknown | Evidence from Unknown | |||||||||||||||||||
|
List of 2 Events for Episode 1 at Ngauruhoe
| ||||||||||||||||||||
1870 Apr - 1870 Aug Confirmed Eruption Max VEI: 2
| Episode 1 | Eruption Episode | Ngauruhoe (NW sub-crater) | ||||||||||||||||||||||||||||||||||
|---|---|---|---|---|---|---|---|---|---|---|---|---|---|---|---|---|---|---|---|---|---|---|---|---|---|---|---|---|---|---|---|---|---|---|---|
| 1870 Apr - 1870 Aug | Evidence from Observations: Reported | ||||||||||||||||||||||||||||||||||
|
List of 5 Events for Episode 1 at Ngauruhoe (NW sub-crater)
| |||||||||||||||||||||||||||||||||||
1869 Aug Confirmed Eruption Max VEI: 2
| Episode 1 | Eruption Episode | Ngauruhoe | ||||||||||||||||||||||||
|---|---|---|---|---|---|---|---|---|---|---|---|---|---|---|---|---|---|---|---|---|---|---|---|---|---|
| 1869 Aug - Unknown | Evidence from Observations: Reported | ||||||||||||||||||||||||
|
List of 3 Events for Episode 1 at Ngauruhoe
| |||||||||||||||||||||||||
1869 Confirmed Eruption Max VEI: 2
| Episode 1 | Eruption Episode | NE flank (Upper Te Mari Crater) | ||||||||||||||||||||||||
|---|---|---|---|---|---|---|---|---|---|---|---|---|---|---|---|---|---|---|---|---|---|---|---|---|---|
| 1869 - Unknown | Evidence from Observations: Reported | ||||||||||||||||||||||||
|
List of 3 Events for Episode 1 at NE flank (Upper Te Mari Crater)
| |||||||||||||||||||||||||
1864 Dec - 1865 Jan Confirmed Eruption Max VEI: 2
| Episode 1 | Eruption Episode | Ngauruhoe | ||||||||||||||||||||||||
|---|---|---|---|---|---|---|---|---|---|---|---|---|---|---|---|---|---|---|---|---|---|---|---|---|---|
| 1864 Dec - 1865 Jan | Evidence from Observations: Reported | ||||||||||||||||||||||||
|
List of 3 Events for Episode 1 at Ngauruhoe
| |||||||||||||||||||||||||
1863 - 1864 Apr Confirmed Eruption Max VEI: 2
| Episode 1 | Eruption Episode | Ngauruhoe | ||||||||||||||||||||||||
|---|---|---|---|---|---|---|---|---|---|---|---|---|---|---|---|---|---|---|---|---|---|---|---|---|---|
| 1863 - 1864 Apr | Evidence from Observations: Reported | ||||||||||||||||||||||||
|
List of 3 Events for Episode 1 at Ngauruhoe
| |||||||||||||||||||||||||
1862 Jan Confirmed Eruption Max VEI: 2
| Episode 1 | Eruption Episode | Ngauruhoe | ||||||||||||||||||||||||
|---|---|---|---|---|---|---|---|---|---|---|---|---|---|---|---|---|---|---|---|---|---|---|---|---|---|
| 1862 Jan - Unknown | Evidence from Observations: Reported | ||||||||||||||||||||||||
|
List of 3 Events for Episode 1 at Ngauruhoe
| |||||||||||||||||||||||||
1859 Apr 21 Confirmed Eruption Max VEI: 1 (?)
| Episode 1 | Eruption Episode | SSE flank (Red Crater) | |||||||||||||||||||
|---|---|---|---|---|---|---|---|---|---|---|---|---|---|---|---|---|---|---|---|---|
| 1859 Apr 21 - Unknown | Evidence from Observations: Reported | |||||||||||||||||||
|
List of 2 Events for Episode 1 at SSE flank (Red Crater)
| ||||||||||||||||||||
1857 Feb - 1857 Mar Confirmed Eruption Max VEI: 2
| Episode 1 | Eruption Episode | Ngauruhoe | ||||||||||||||||||||||||
|---|---|---|---|---|---|---|---|---|---|---|---|---|---|---|---|---|---|---|---|---|---|---|---|---|---|
| 1857 Feb - 1857 Mar | Evidence from Observations: Reported | ||||||||||||||||||||||||
|
List of 3 Events for Episode 1 at Ngauruhoe
| |||||||||||||||||||||||||
1855 Confirmed Eruption Max VEI: 2
| Episode 1 | Eruption Episode | SSE flank (Red Crater) | |||||||||||||||||||||||||||||
|---|---|---|---|---|---|---|---|---|---|---|---|---|---|---|---|---|---|---|---|---|---|---|---|---|---|---|---|---|---|---|
| 1855 - Unknown | Evidence from Observations: Reported | |||||||||||||||||||||||||||||
|
List of 4 Events for Episode 1 at SSE flank (Red Crater)
| ||||||||||||||||||||||||||||||
1844 Oct - 1845 Jan Confirmed Eruption Max VEI: 2
| Episode 1 | Eruption Episode | Ngauruhoe | ||||||||||||||||||||||||
|---|---|---|---|---|---|---|---|---|---|---|---|---|---|---|---|---|---|---|---|---|---|---|---|---|---|
| 1844 Oct - 1845 Jan | Evidence from Observations: Reported | ||||||||||||||||||||||||
|
List of 3 Events for Episode 1 at Ngauruhoe
| |||||||||||||||||||||||||
1841 Confirmed Eruption Max VEI: 2
| Episode 1 | Eruption Episode | Ngauruhoe | ||||||||||||||||||||||||
|---|---|---|---|---|---|---|---|---|---|---|---|---|---|---|---|---|---|---|---|---|---|---|---|---|---|
| 1841 - Unknown | Evidence from Observations: Reported | ||||||||||||||||||||||||
|
List of 3 Events for Episode 1 at Ngauruhoe
| |||||||||||||||||||||||||
1839 Feb - 1839 Mar Confirmed Eruption Max VEI: 1 (?)
| Episode 1 | Eruption Episode | Ngauruhoe | ||||||||||||||||||||||||
|---|---|---|---|---|---|---|---|---|---|---|---|---|---|---|---|---|---|---|---|---|---|---|---|---|---|
| 1839 Feb - 1839 Mar | Evidence from Observations: Reported | ||||||||||||||||||||||||
|
List of 3 Events for Episode 1 at Ngauruhoe
| |||||||||||||||||||||||||
1500 ± 50 years Confirmed Eruption
| Episode 1 | Eruption Episode | Upper Te Mari Craters | ||||||||||||||
|---|---|---|---|---|---|---|---|---|---|---|---|---|---|---|---|
| 1500 ± 50 years - Unknown | Evidence from Correlation: Tephrochronology | ||||||||||||||
|
List of 1 Events for Episode 1 at Upper Te Mari Craters
| |||||||||||||||
0550 BCE ± 200 years Confirmed Eruption Max VEI: 5
| Episode 1 | Eruption Episode | Ngauruhoe and Red Crater | ||||||||||||||||||||||||
|---|---|---|---|---|---|---|---|---|---|---|---|---|---|---|---|---|---|---|---|---|---|---|---|---|---|
| 0550 BCE ± 200 years - Unknown | Evidence from Isotopic: 14C (uncalibrated) | ||||||||||||||||||||||||
|
List of 3 Events for Episode 1 at Ngauruhoe and Red Crater
| |||||||||||||||||||||||||
9350 BCE (?) Confirmed Eruption Max VEI: 5
| Episode 1 | Eruption Episode | Tama Lakes to Te Mari | |||||||||||||||||||||||||||||||||||||||||||||||||
|---|---|---|---|---|---|---|---|---|---|---|---|---|---|---|---|---|---|---|---|---|---|---|---|---|---|---|---|---|---|---|---|---|---|---|---|---|---|---|---|---|---|---|---|---|---|---|---|---|---|---|
| 9350 BCE (?) - Unknown | Evidence from Correlation: Tephrochronology | |||||||||||||||||||||||||||||||||||||||||||||||||
|
List of 8 Events for Episode 1 at Tama Lakes to Te Mari
| ||||||||||||||||||||||||||||||||||||||||||||||||||
9450 BCE (?) Confirmed Eruption Max VEI: 5
| Episode 1 | Eruption Episode | Saddle cone area to Half Cone | |||||||||||||||||||||||||||||||||||||||||||||||||
|---|---|---|---|---|---|---|---|---|---|---|---|---|---|---|---|---|---|---|---|---|---|---|---|---|---|---|---|---|---|---|---|---|---|---|---|---|---|---|---|---|---|---|---|---|---|---|---|---|---|---|
| 9450 BCE (?) - Unknown | Evidence from Isotopic: 14C (calibrated) | |||||||||||||||||||||||||||||||||||||||||||||||||
|
List of 8 Events for Episode 1 at Saddle cone area to Half Cone
| ||||||||||||||||||||||||||||||||||||||||||||||||||
9650 BCE (?) Confirmed Eruption Max VEI: 5
| Episode 1 | Eruption Episode | Saddle Cone to Half Cone | |||||||||||||||||||||||||||||
|---|---|---|---|---|---|---|---|---|---|---|---|---|---|---|---|---|---|---|---|---|---|---|---|---|---|---|---|---|---|---|
| 9650 BCE (?) - Unknown | Evidence from Correlation: Tephrochronology | |||||||||||||||||||||||||||||
|
List of 4 Events for Episode 1 at Saddle Cone to Half Cone
| ||||||||||||||||||||||||||||||
9850 BCE (?) Confirmed Eruption
| Episode 1 | Eruption Episode | UT1 tephra | |||||||||||||||||||
|---|---|---|---|---|---|---|---|---|---|---|---|---|---|---|---|---|---|---|---|---|
| 9850 BCE (?) - Unknown | Evidence from Isotopic: 14C (calibrated) | |||||||||||||||||||
|
List of 2 Events for Episode 1 at UT1 tephra
| ||||||||||||||||||||
There is no Deformation History data available for Tongariro.
There is data available for 1 emission periods. Expand each entry for additional details.
| Start Date: 2012 Aug 06 | Stop Date: 2012 Aug 06 | Method: Satellite (Aura OMI) |
| SO2 Altitude Min: 12 km | SO2 Altitude Max: 12 km | Total SO2 Mass: 1 kt |
Data Details
| Date Start | Date End | Assumed SO2 Altitude | SO2 Algorithm | SO2 Mass |
| 20120806 | 12.0 | 1.000 |
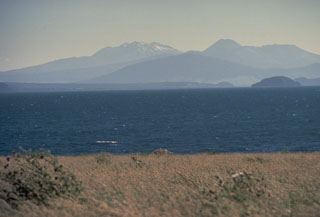 This view looking SW across Lake Taupo, the southernmost major caldera of the Taupo Volcanic Zone, shows several major peaks of Tongariro and Ruapehu. The broad forested peak below the center horizon is the Pleistocene Pihanga volcano. The steep-sided cone on the horizon to its right is Ngāuruhoe, the youngest cone of the Tongariro complex. The broad massif to its right is Tongariro. The snow-capped massif on the left-center horizon is Ruapehu.
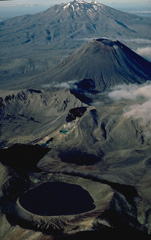 An aerial view from the north shows the Tongariro volcanic centre in the foreground with massive Ruapehu volcano in the background. The Tongariro volcanic centre consists of a dozen or more partially overlapping volcanoes. The 400-m-wide Blue Lake crater, in the foreground, erupted about 9700 years ago. The small Red Crater, at the center, had minor eruptions during the 19th and 20th centuries, and the symmetrical Ngāuruhoe stratovolcano behind it has been one of New Zealand's most frequently active volcanoes during historical time.
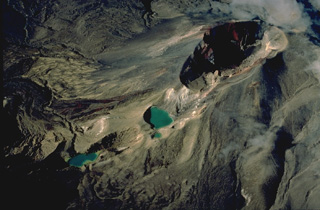 Red Crater (upper right) is one of a dozen or more volcanic centers of the Tongariro volcano group. The Emerald Lakes, NE of Red Crater, mark a chain of explosion vents associated with eruptions of Red Crater. Activity at Red Crater continued into historical time. Minor phreatic explosive eruptions took place during the late 19th century and most recently in 1926.
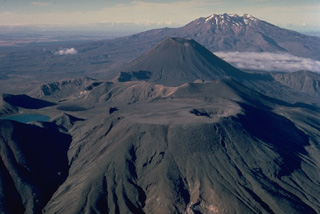 The Tongariro volcanic massif is a complex of more than a dozen composite volcanic cones erupted along a NE-SW line. Flat-topped North Crater in the foreground and conical Ngāuruhoe behind it are the two most prominent Tongariro volcanoes. North Crater's broad, flat top is the surface of a former lava lake; a small explosion crater later punctured its right side. Most historical eruptions of Tongariro have originated from the symmetrical Ngaurohoe stratovolcano. Ruapehu volcano forms the broad massif in the distance to the south.
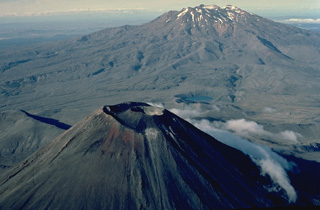 Two New Zealand volcanoes, the symmetrical Ngāuruhoe in the foreground and the massive Ruapehu in the background, are stratovolcanoes with dramatically different profiles. The steep-sided cone of Ngāuruhoe was formed during the past 2500 years by repeated eruptions from a single central conduit. The broad, elongated Ruapehu is a complex volcano that was formed by eruptions over a much longer period of time that constructed at least four overlapping volcanic edifices.
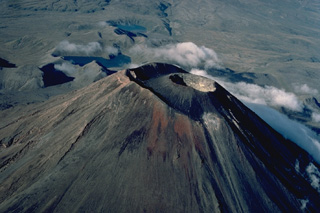 Symmetrical Ngāuruhoe volcano, seen here in an aerial view from the NE, contains a compound summit crater. The most recent eruptions have occurred from the crater of a small cinder cone that was constructed within the outer summit crater beginning in 1954. Ngāuruhoe is one of New Zealand's most active volcanoes; frequent changes in the morphology of the summit crater have been documented during historical eruptions. The two lakes in the background are the Tama Lakes, flank vents of Ruapehu volcano.
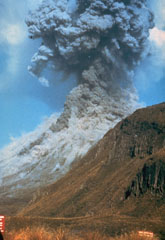 Pyroclastic flows traveling down the flanks of Ngāuruhoe volcano on 19 February 1975 as an ash plume rises above the summit crater. The eruption column rose 12 km above the vent and ash fell 160 km away in Hamilton City. Explosive activity had begun on the 12th and continued until the 23rd.
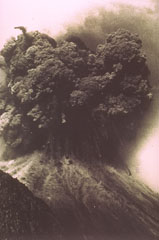 A Vulcanian explosion from the Ngāuruhoe cone of Tongariro volcano in New Zealand on 19 February ejects an ash plume and ballistic ejecta. Blocks up to 20 m across reached hundreds of meters above the vent before impacting the flanks.
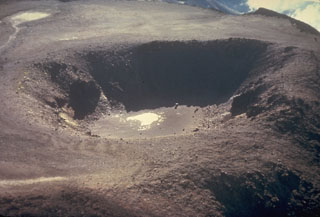 An aerial view from the south in the late 1970s shows a close-up of a 400-m-wide crater in a flat-lying former lava lake at the summit of the North Crater of the Tongariro volcanic complex.
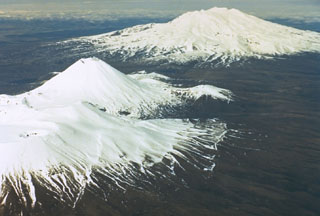 Tongariro, in the foreground, is a cluster of about a dozen cones and craters dominated by the symmetrical Ngāuruhoe cone. Ruapehu, in the background to the south, contains a frequently active crater lake. The two volcanoes have been two of the most frequently active in New Zealand.
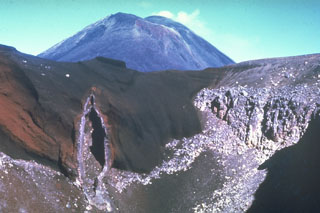 The SE wall of Red Crater is cut by a vertical volcanic dike that fed eruptions along a NE-SW-trending fissure. Magma along the outer part of the dike cooled against the red scoria walls, while magma at the center of the dike partially drained away, leaving this cavity. Ngāuruhoe is visible in the background. These are two of more than a dozen cones and craters forming the Tongariro volcanic complex.
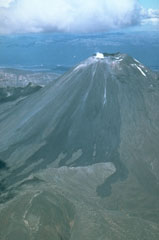 The black lava flows extending from the summit of Ngāuruhoe volcano to its flanks erupted in 1954. An eruption that began with explosive activity on 13 May 1954, was followed on 4 June by the emission of lava flows that traveled down the NW flank until 26 September. Explosive activity, which constructed a scoria cone in the summit crater, continued until March 1955; incandescent lava was present in the crater until June.
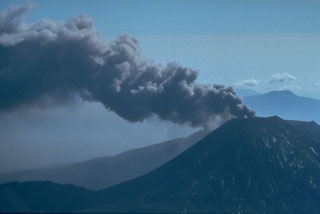 An ash plume on 29 March 1974, is directed by the wind from the summit of Ngāuruhoe volcano one day after powerful explosions that were accompanied by pyroclastic flows. Intermittent explosive eruptions had been occurring since 22 November 1972 and continued until 19 August 1974. Eruptions in January and March 1974 were the largest in two decades from Ngāuruhoe.
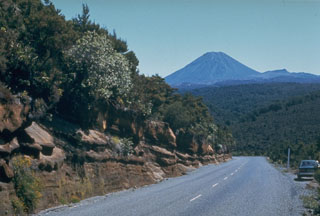 A roadcut along the desert road between Waiouru and Turangi exposes some of the tephra layers erupted from the Tongariro volcanic complex during its early stage of development. Ngāuruhoe is the visible cone in the background.
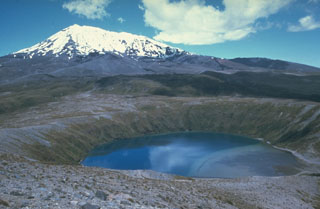 Lower Tama Lake on Tongariro was formed late in a series of eruptions that began about 10,000 years ago. The eruptions included the emplacement of two lava flows from Upper Tama Lake with a combined volume of 0.2 km3 and a smaller lava flow from Lower Tama Lake.
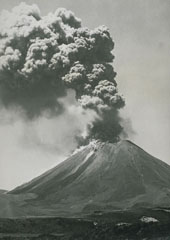 An ash plume rises above Ngāuruhoe volcano on 26 January 1974 in this view from the W. Small pyroclastic flows descend the upper flanks of the cone. Eruptions during 26-28 January and 27-29 March 1974 were the most powerful at Ngāuruhoe in two decades. Explosive activity had been occurring since November 1972 and lasted until August 1974. The dark streaks descending to the base of the cone to the left are lava flows from the 1954 eruption.
 Snow-capped Ngāuruhoe, seen here from the NE, rises 800 m above its surroundings and is the highest peak of the Tongariro massif. This large massif is located immediately NE of Ruapehu volcano, and is comprised of more than a dozen cones and craters. Frequent explosive eruptions have been recorded from Ngāuruhoe since 1839.
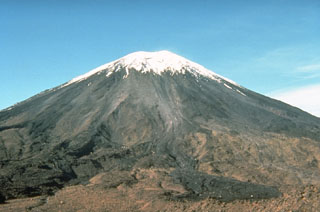 Snow-capped Ngāuruhoe volcano rises above the Mangatepopo track on the NW side of the volcano. The dark lobe in the right foreground is a deposit produced by lithic-rich pyroclastic flows during the 1975 eruption. Meter-scale ballistic blocks from powerful Vulcanian explosions during the 1975 eruption were ejected out to distances of 2.8 km, beyond the location of this photo.
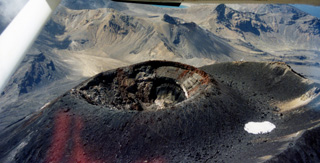 The scoria cone within the summit crater of Tongariro’s Ngāuruhoe cone formed during the 1954-75 eruptions. The majority of the cone formed during 1954-55 with the red unit at the top (along the right rim of the crater in this view) forming during the 1974-75 eruption. The outer crater rim is to the right. The northeastern part of the Tongariro volcanic complex is in the background, with Blue Lake visible at the top of the photo.
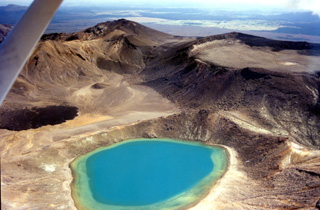 The Blue Lake vent of the Tongariro volcanic complex is in the foreground of this 1995-96 photo, looking SW. The roughly 1-km-wide North Crater is to the right and to the left is a post-1.85 ka lava flow from Red Crater that was emplaced into Central Crater (not of eruption origin).
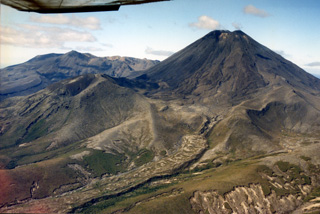 Ngāuruhoe is at the southern end of the Tongariro volcanic complex, seen here from the SW with the northern Tongariro complex to the left. Lava flows erupted during the 1954-55 eruption are visible down the flank to the left, originating from the summit scoria cone. Pukekaikiore is below the W flank (left) and is the remnant of an older eruption center of Tongariro.
 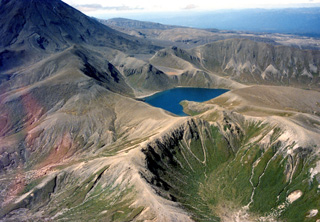 The Upper Tama Lake is in the center of this photo with the southern flank of Ngāuruhoe to the right, both of which are eruption centers of the Tongariro volcanic complex. The lake fills several craters that were active around 10,000 years ago, with lava flows s180,000-200,000 years old forming the cliffs surrounding it.
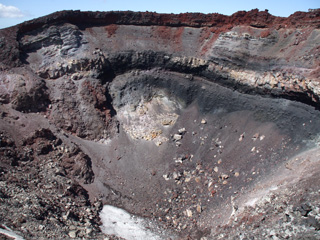 The crater of the Ngāuruhoe scoria cone is seen here from the NW rim on 8 February 2008. The cone formed mainly through a series of Strombolian and Vulcanian eruptions in 1954-55, with the red uppermost scoria unit emplaced in 1974-75.
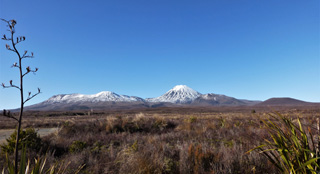 Eruptions of the Tongariro have occurred across at least 12 vents, with the western flank of the complex seen here in 2012. From left to right are the broad North Crater, the Ngāuruhoe cone, Pukekaikiore, and Pukeonake. Eruption deposits and material that has eroded from the edifice forms the plain in the foreground.
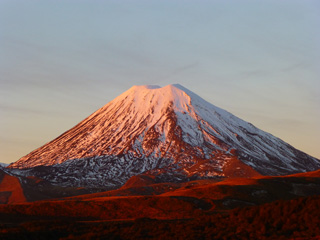 The Ngāuruhoe cone reaches around 900 m above the Tongariro volcanic complex. Seen here from the W in 2012, the summit scoria cone mostly formed in 1954-55 within the larger summit crater area. The older crater rim is on the right side of the summit in this view.
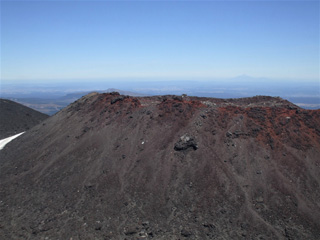 The scoria cone within the Ngāuruhoe summit crater largely formed during the 1954-55 eruption and was the location of the 1974-75 eruption, seen here from the larger crater rim to the E. The Ngāuruhoe cone is at the southern end of the Tongariro volcanic complex and is one of the youngest features. Taranaki is to the W, visible in the distance.
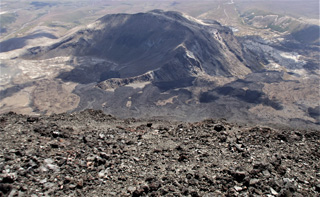 This view from the Ngāuruhoe summit to below the SW flank shows the lava flows emplaced during the 1954-55 eruption, down the Tongariro flank and around the eroded Pukekaikiore cone. They overlie older lava flows from the same vent.
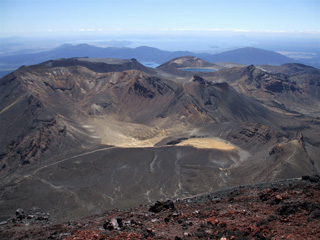 This 2008 view from the Ngāuruhoe summit (red scoria at the bottom) looks across Tongariro and to Lake Taupō in the distance. Within Tongariro going in a clockwise direction, South Crater is in the foreground, North Crater is to the upper left, Blue Lake is to its right, and Red Crater is below it.
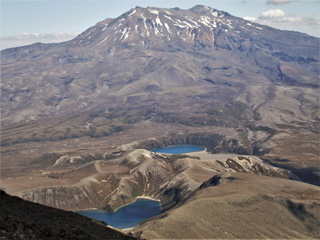 This 2008 view is from the Ngāuruhoe summit at Tongariro, to the south towards Ruapehu. In the foreground are the Upper Tama (foreground) and Lower Tama lakes, vents that predate formation of the Ngāuruhoe cone.
The maps shown below have been scanned from the GVP map archives and include the volcano on this page. Clicking on the small images will load the full 300 dpi map. Very small-scale maps (such as world maps) are not included. The maps database originated over 30 years ago, but was only recently updated and connected to our main database. We welcome users to tell us if they see incorrect information or other problems with the maps; please use the Contact GVP link at the bottom of the page to send us email.
The following 3 samples associated with this volcano can be found in the Smithsonian's NMNH Department of Mineral Sciences collections, and may be availble for research (contact the Rock and Ore Collections Manager). Catalog number links will open a window with more information.
| Catalog Number | Sample Description | Lava Source | Collection Date |
|---|---|---|---|
| NMNH 116210-26 | Tephra | NORTH CRATER | -- |
| NMNH 116210-27 | Tephra | BLUE LAKE CRATER | -- |
| NMNH 116691-10 | Scoria | NGAURUHOE | 1 Feb 1986 |
| Copernicus Browser | The Copernicus Browser replaced the Sentinel Hub Playground browser in 2023, to provide access to Earth observation archives from the Copernicus Data Space Ecosystem, the main distribution platform for data from the EU Copernicus missions. |
| MIROVA | Middle InfraRed Observation of Volcanic Activity (MIROVA) is a near real time volcanic hot-spot detection system based on the analysis of MODIS (Moderate Resolution Imaging Spectroradiometer) data. In particular, MIROVA uses the Middle InfraRed Radiation (MIR), measured over target volcanoes, in order to detect, locate and measure the heat radiation sourced from volcanic activity. |
| MODVOLC Thermal Alerts | Using infrared satellite Moderate Resolution Imaging Spectroradiometer (MODIS) data, scientists at the Hawai'i Institute of Geophysics and Planetology, University of Hawai'i, developed an automated system called MODVOLC to map thermal hot-spots in near real time. For each MODIS image, the algorithm automatically scans each 1 km pixel within it to check for high-temperature hot-spots. When one is found the date, time, location, and intensity are recorded. MODIS looks at every square km of the Earth every 48 hours, once during the day and once during the night, and the presence of two MODIS sensors in space allows at least four hot-spot observations every two days. Each day updated global maps are compiled to display the locations of all hot spots detected in the previous 24 hours. There is a drop-down list with volcano names which allow users to 'zoom-in' and examine the distribution of hot-spots at a variety of spatial scales. |
|
WOVOdat
Single Volcano View Temporal Evolution of Unrest Side by Side Volcanoes |
WOVOdat is a database of volcanic unrest; instrumentally and visually recorded changes in seismicity, ground deformation, gas emission, and other parameters from their normal baselines. It is sponsored by the World Organization of Volcano Observatories (WOVO) and presently hosted at the Earth Observatory of Singapore.
GVMID Data on Volcano Monitoring Infrastructure The Global Volcano Monitoring Infrastructure Database GVMID, is aimed at documenting and improving capabilities of volcano monitoring from the ground and space. GVMID should provide a snapshot and baseline view of the techniques and instrumentation that are in place at various volcanoes, which can be use by volcano observatories as reference to setup new monitoring system or improving networks at a specific volcano. These data will allow identification of what monitoring gaps exist, which can be then targeted by remote sensing infrastructure and future instrument deployments. |
| Volcanic Hazard Maps | The IAVCEI Commission on Volcanic Hazards and Risk has a Volcanic Hazard Maps database designed to serve as a resource for hazard mappers (or other interested parties) to explore how common issues in hazard map development have been addressed at different volcanoes, in different countries, for different hazards, and for different intended audiences. In addition to the comprehensive, searchable Volcanic Hazard Maps Database, this website contains information about diversity of volcanic hazard maps, illustrated using examples from the database. This site is for educational purposes related to volcanic hazard maps. Hazard maps found on this website should not be used for emergency purposes. For the most recent, official hazard map for a particular volcano, please seek out the proper institutional authorities on the matter. |
| IRIS seismic stations/networks | Incorporated Research Institutions for Seismology (IRIS) Data Services map showing the location of seismic stations from all available networks (permanent or temporary) within a radius of 0.18° (about 20 km at mid-latitudes) from the given location of Tongariro. Users can customize a variety of filters and options in the left panel. Note that if there are no stations are known the map will default to show the entire world with a "No data matched request" error notice. |
| UNAVCO GPS/GNSS stations | Geodetic Data Services map from UNAVCO showing the location of GPS/GNSS stations from all available networks (permanent or temporary) within a radius of 20 km from the given location of Tongariro. Users can customize the data search based on station or network names, location, and time window. Requires Adobe Flash Player. |
| DECADE Data | The DECADE portal, still in the developmental stage, serves as an example of the proposed interoperability between The Smithsonian Institution's Global Volcanism Program, the Mapping Gas Emissions (MaGa) Database, and the EarthChem Geochemical Portal. The Deep Earth Carbon Degassing (DECADE) initiative seeks to use new and established technologies to determine accurate global fluxes of volcanic CO2 to the atmosphere, but installing CO2 monitoring networks on 20 of the world's 150 most actively degassing volcanoes. The group uses related laboratory-based studies (direct gas sampling and analysis, melt inclusions) to provide new data for direct degassing of deep earth carbon to the atmosphere. |
| Large Eruptions of Tongariro | Information about large Quaternary eruptions (VEI >= 4) is cataloged in the Large Magnitude Explosive Volcanic Eruptions (LaMEVE) database of the Volcano Global Risk Identification and Analysis Project (VOGRIPA). |
| EarthChem | EarthChem develops and maintains databases, software, and services that support the preservation, discovery, access and analysis of geochemical data, and facilitate their integration with the broad array of other available earth science parameters. EarthChem is operated by a joint team of disciplinary scientists, data scientists, data managers and information technology developers who are part of the NSF-funded data facility Integrated Earth Data Applications (IEDA). IEDA is a collaborative effort of EarthChem and the Marine Geoscience Data System (MGDS). |

