GeoNet reported that minor unrest continued at Ruapehu as of 31 October. Te Wai a-moe (Ruapehu Crater Lake) has remained cool; however, monitoring data suggests that a slow heating trend is underway. The crater lake water temperature has increased from 8 degrees Celsius to 10-11 degrees Celsius since mid-October. Gas monitoring sensors have recorded low to moderate levels of sulfur dioxide (SO2) emissions, while volcanic tremor signals have also remained low. The Volcanic Alert Level remained at 1 (on a scale from 0-5) and the Aviation Color Code remained at Green (the lowest level on a four-color scale).
Source: GeoNet
2009-2011: Earthquake triggered shift in lake height; lake heating cycle
New Zealand's GeoNet, a combination of the country's Earthquake Commission and GNS Science, reported that at 1830 on 13 July 2009, there was a small (M 2) volcanic earthquake beneath Ruapehu's crater lake. As a result of a new research project measuring the temperature and level of the lake, instruments documented a sudden 15-cm jump in lake level following the earthquake. The lake temperature remained unchanged at 20°C.
The lake was examined from a helicopter on 14 July 2009. Viewing conditions were very poor, but no obvious changes had occurred since the last visit on 2 July 2009. No eruption had occurred and the lake was overflowing. The preliminary interpretation was that the volcanic earthquake was followed by about 20 x 106 liters of extra water moving into the lake from the hydrothermal system beneath it. A much larger rise in lake level had followed a very small eruption in October 2006, so lake-height adjustments were not unknown at Ruapehu. However, this was the first time that scientists had been able to correlate such a small rise with a single volcanic earthquake. The Volcanic Alert Level remained at Level 1 (a designation signifying a departure from typical background surface activity and signs of unrest).
In October 2010, GeoNet reported that the lake had began a heating cycle, the eighth since the lake was re-established in 2002 after the 1995-1996 eruptions (BGVN 20:09 and 20:10). Later, on 7 March 2011, GeoNet reported the lake temperature at 40°C, the third highest temperature recorded since the re-establishment of the lake (table 14).
Table 14. Summary of reported temperatures in Ruapehu's Crater Lake. Courtesy of GeoNet.
| Date | Crater Lake Temperature | Comments |
| May 2003 | 42.5°C | Highest temperature since re-establishment of lake in 2002 |
| 13 Jul 2009 | 20°C | Low temperature |
| Oct 2010 | -- | Onset of 2010-2011 heating cycle |
| 07 Mar 2011 | 40-41°C | High temperatures |
| 05 Apr 2011 | 38-39°C | Slightly decreased (but still high) temperatures around this time |
| 18 Apr 2011 | 33-34°C | Decreased temperatures |
| 02 May 2011 | 30°C | Further drop in temperature |
Other monitored indicators had shown variable trends in parts of March 2011. Those indicators included gas output, seismicity, lake chemistry, and ground deformation. Such variable trends were like those previously seen during lake heating cycles. GeoNet reported on 5 April 2011 that Ruapehu had undergone a sustained period of high Crater Lake water temperatures. In recent weeks changes also occurred in volcanic gas output, seismic activity and lake water chemistry. These changes suggested unrest above known background levels, hence authorities elevated the Aviation Color Code to Yellow but kept the Volcanic Alert Level at 1. After 4 April there was a general decrease in activity, with lower CO2 gas flux, less seismicity, little change in lake-water chemistry, and cessation of lake overflow accompanying the start of the cooling trend. On 18 April 2011 GeoNet reported decreased lake temperature; other monitored indicators in recent weeks also suggest a slow decrease of activity. On 2 May 2011 authorities lowered the Aviation Color Code to Green, the lowest hazard status. This followed a continued decrease in lake-water temperature and several weeks of slow decreases in other available indicators.
Information Contacts: GeoNet (URL: http://www.geonet.org.nz/).
2024: October
2023: April
| November
2022: March
| April
| May
| June
2021: January
| September
2020: February
| April
| December
2019: April
2018: June
2016: May
| June
| August
| September
2015: January
| April
2013: February
| March
2012: November
2011: March
| April
2008: September
2007: March
| September
| October
2006: October
2004: November
2002: January
| December
2001: February
| November
GeoNet reported that minor unrest continued at Ruapehu as of 31 October. Te Wai a-moe (Ruapehu Crater Lake) has remained cool; however, monitoring data suggests that a slow heating trend is underway. The crater lake water temperature has increased from 8 degrees Celsius to 10-11 degrees Celsius since mid-October. Gas monitoring sensors have recorded low to moderate levels of sulfur dioxide (SO2) emissions, while volcanic tremor signals have also remained low. The Volcanic Alert Level remained at 1 (on a scale from 0-5) and the Aviation Color Code remained at Green (the lowest level on a four-color scale).
Source: GeoNet
GeoNet reported that minor unrest continued at Ruapehu and the crater lake remained cool. The temperature of the crater lake water decreased from 31 to 11 degrees Celsius during March-August and remained cool through 8 October, decreasing further to 8 degrees, the lowest temperature recorded since 1970. Sulfur dioxide emissions were at low-to-moderate levels. The reduced temperature and sulfur dioxide emissions suggested partial sealing of the vent; areas of upwelling on the lake’s surface and sulfur slicks were visible on 30 September. Volcanic tremor levels remained low during 2024. The Volcanic Alert Level remained at 1 (on a scale from 0-5) and the Aviation Color Code remained at Green (the lowest level on a four-color scale).
Source: GeoNet
GeoNet reported that 40 small earthquakes at Ruapehu was recorded by the seismic network during 21-26 November. The earthquakes were 0.3-1.8 in magnitude and located at depths of 3-6 km, though most clustered at depths of 4-5 km. Volcanic tremor levels were low during 2023 and did not vary in response to the sequence. The temperature of the crater lake water was slowly rising, starting in mid-October. During an overflight on 22 November, scientists observed that the color of the lake had changed to blue-green instead of the typical gray color, consistent with less gas flux disturbing lake-bottom sediment. No upwelling was observed and sulfur slicks on the water’s surface were visible. Water was overflowing at the lake’s outlet. Overall, activity was low. The Volcanic Alert Level remained at 1 (on a scale from 0-5) and the Aviation Color Code remained at Green (the lowest level on a four-color scale).
Source: GeoNet
On 3 May GeoNet reported that temperatures in Ruapehu’s cater lake had declined from 32 to 21 degrees Celsius since January, and other monitoring parameters indicated that volcanic unrest remained low. Weak volcanic tremor persisted and very few earthquakes were located beneath the volcano. Gas emissions were at low-to-moderate levels during the previous three months, and only minor changes to the lake water chemistry were identified over the past several months and most recently on 6 April. The Volcanic Alert Level remained at 1 (on a scale from 0-5) and the Aviation Color Code remained at Green (the lowest level on a four-color scale).
Source: GeoNet
On 4 July GeoNet reported that analysis of water from Ruapehu’s cater lake confirmed that there is no interaction between magma and the hydrothermal system that drives composition, level, and temperature of the lake. New magma that had intruded over the previous 2-3 months had stopped moving. Tremor had declined to near background levels and gas emission rates were generally low. The lake water temperature had decreased by one degree and stabilized at 24 degrees Celsius. The Volcanic Alert Level was lowered to 1 (on a scale from 0-5) and the Aviation Color Code was lowered to Green (the lowest level on a four-color scale).
Source: GeoNet
On 28 June GeoNet reported that it had been 10 days since the last notable tremor at Ruapehu and the level remained weak. Lake water temperatures declined to 21 degrees Celsius on 14 June from a high of 40 degrees Celsius recorded in early May; temperatures had increased to 25 degrees Celsius during the previous two weeks. Gas emissions continued to fluctuate based on data collected during overflights and were about 10% less on 23 June than on 13 May, though the sulfur dioxide rate during 24-25 June was comparable to those recorded in mid-May, based on gas measuring equipment recently installed at the volcano. The emission, water temperature and seismic data together indicated continuing moderate levels of unrest. The Volcanic Alert Level remained at 2 (on a scale from 0-5) and the Aviation Color Code remained at Yellow.
Source: GeoNet
On 20 June GeoNet reported continuing unrest at Ruapehu. Tremor levels had been characterized as weak to moderate for the previous three weeks but increased for a brief period. Levels increased sharply during the evening of 17 June, fluctuated between moderate and strong levels on 18 June, and then decreased to weak levels by 19 June. Lake water temperatures continued to decline, reaching 22 degrees Celsius. The Volcanic Alert Level remained at 2 (on a scale from 0-5) and the Aviation Color Code remained at Yellow.
Source: GeoNet
On 14 June GeoNet reported that unrest at Ruapehu continued to decline. During the previous week volcanic tremor levels were weak, but remained above background levels recorded since 2013. Lake water temperatures had dropped to 23 degrees Celsius, which corresponded to the long-term average heat flow. Relatively high sulfur dioxide and carbon dioxide measurements were recorded in mid-May, but weather conditions prevented gas measurement flights after that time. The level of unrest was at moderate levels, though the volcanic processes that caused the unrest were unknown; the Volcanic Alert Level remained at 2 (on a scale from 0-5) and the Aviation Color Code remained at Yellow.
Source: GeoNet
On 7 June GeoNet reported that elevated unrest at Ruapehu continued, though at reduced levels. During the previous week volcanic tremor levels had decreased from moderate to weak, and lake water temperatures had declined to 28 degrees Celsius. Weather conditions prevented gas measurement flights during the previous few weeks. The Volcanic Alert Level remained at 2 (on a scale from 0-5) and the Aviation Color Code remained at Yellow.
Source: GeoNet
On 24 May GeoNet reported that elevated unrest at Ruapehu continued, though at reduced levels. During the previous week the levels of volcanic tremor further declined, were variable, but remained above normal. The lake water temperature decreased from a peak of 41 degrees Celsius on 8 May to 30 degrees Celsius, showing a cooling trend. A gas measurement flight on 13 May confirmed continuing high levels of gas emissions, though at values lower than measured two weeks prior; sulfur dioxide and carbon dioxide flux rates were at 179 and 1,658 tonnes per day, respectively; data from new instruments confirmed that these levels remained elevated. The Volcanic Alert Level remained at 2 (on a scale from 0-5) and the Aviation Color Code remained at Yellow.
Source: GeoNet
On 17 May GeoNet reported that elevated unrest at Ruapehu continued, though at reduced levels. During the previous two weeks the level of volcanic tremor declined from strong to moderate. The lake water temperature decreased from a peak of 41 degrees Celsius on 8 May to 37 degrees Celsius. A gas measurement flight on 13 May confirmed continuing high levels of gas emissions, though at values lower than measured two weeks prior; sulfur dioxide and carbon dioxide flux rates at 179 and 1,658 tonnes per day, respectively. Lake upwelling over the northern vent area was also visible during the overflight. The Volcanic Alert Level remained at 2 (on a scale from 0-5) and the Aviation Color Code remained at Yellow.
Source: GeoNet
On 11 May GeoNet reported that elevated unrest at Ruapehu continued during the previous week, consisting of lake water heating, volcanic gas output, and strong volcanic tremor. The lake water temperature continued to rise, peaking at 41 degrees Celsius. Steam plumes were visible rising from the lake; an overflight confirmed that they were caused by a combination of the warming lake and atmospheric conditions, with no eruptive activity. Tremor levels declined but remained high. A gas measurement flight on 4 May confirmed high levels of gas emissions with sulfur dioxide and carbon dioxide flux rates at 260 and 1,970 tonnes per day, respectively. Lake upwelling over the central and northern vents areas was also visible during multiple overflights. The sustained carbon dioxide and sulfur gas emissions, along with high tremor levels, continue to indicate that magma is driving this period of heightened unrest. The Volcanic Alert Level remained at 2 (on a scale from 0-5) and the Aviation Color Code remained at Yellow.
Source: GeoNet
On 2 May GeoNet reported that elevated unrest at Ruapehu continued during the previous week, consisting of lake water heating, volcanic gas output, and strong volcanic tremor. Variable tremor levels were characterized by bursts of strong tremor and short periods of weaker tremor. The lake water temperature had risen to 38 degrees Celsius. During an overflight scientists observed reduced upwelling in the lake over the Northern vents and additional upwelling over the main Central Vent, indicating that it was at least partially unblocked. A sulfur dioxide flux of 390 tonnes per day was measured during a flight on 28 April, the sixth highest amount since 2003. The sustained carbon dioxide and sulfur gas emissions, along with high tremor levels, continue to indicate that magma is driving this period of heightened unrest. At around 0945 on 3 May a steam plume was visible slowly rising as high as 1.5 km above the crater rim; it dissipated by 1030. The plume was not accompanied by seismic or acoustic signals, and weather conditions favored cloud formation. Scientists on an overflight that afternoon observed active upwelling and a slightly higher lake level, similar to observations the previous day. The lake temperature had risen to 39 degrees Celsius. Results from lake water chemistry analysis showed no indication that magma was interacting with the hydrothermal system beneath the lake. The Volcanic Alert Level remained at 2 (on a scale from 0-5) and the Aviation Color Code remained at Yellow.
Source: GeoNet
On 26 April GeoNet reported that elevated unrest at Ruapehu had been ongoing for the past five weeks, characterized by lake water heating, volcanic gas output, and strong volcanic tremor. Tremor levels fluctuated the past week but represented a record for the longest and strongest tremor episode ever recorded at the volcano. The lake water temperature remained at 37 degrees Celsius, indicating a substantial amount of heat from magma at a shallow depth (0.5-2 km), though water chemistry showed no change based on sampling during 31 March-15 April. The Volcanic Alert Level remained at 2 (on a scale from 0-5) and the Aviation Color Code remained at Yellow.
Source: GeoNet
On 20 April GeoNet reported that elevated unrest at Ruapehu had continued during the previous week. Scientists observed upwelling in the lake over the N vent area and visible sulfur slicks on the lake’s surface during an observation flight. The lake water temperature had stabilized at 37 degrees Celsius and continued to be medium gray in color. The lake observations were within normal ranges for a typical heating cycle. Tremor levels remain elevated, though, representing the longest period of tremor recorded over the previous 20 years. The Volcanic Alert Level remained at 2 (on a scale from 0-5) and the Aviation Color Code remained at Yellow.
Source: GeoNet
On 12 April GeoNet reported that unrest at Ruapehu had intensified during the previous week, characterized by increased gas emissions, elevated tremor, and increasing crater lake water temperatures. Tremor levels were elevated but had declined from the peak reached during 6-7 April. Higher levels of gas emissions were confirmed during an overflight on 11 April; a peak carbon dioxide value was the second highest ever recorded at Ruapehu. Lake temperatures continued to slowly climb and reached 38 degrees Celsius. The lake water was gray in color and had area of upwelling over the N vents; sulfur slicks on the lake’s surface were visible. GeoNet noted that temperature and modeled heat input to the lake were within typical ranges for a heating cycle, though the elevated tremor levels and gas emissions suggested that magma was interacting with the geothermal system. The Volcanic Alert Level remained at 2 (on a scale from 0-5) and the Aviation Color Code remained at Yellow.
Source: GeoNet
On 28 March and 5 April GeoNet reported that unrest continued at Ruapehu with elevated levels of tremor and increasing crater lake water temperatures from 32 degrees Celsius to 36 degrees Celsius. The Volcanic Alert Level remained at 2 (on a scale from 0-5) and the Aviation Color Code was raised to Yellow on 28 March.
Source: GeoNet
On 28 March GeoNet reported that unrest continued at Ruapehu with strong levels of tremor and increasing crater lake water temperatures that began two weeks prior. The temperature was 32 degrees Celsius, up one degree from the week before; the temperature rose at a slow rate due to heavy rainfall and an influx of cold water into the lake. The Volcanic Alert Level remained at 2 (on a scale from 0-5) and the Aviation Color Code remained at Green.
Source: GeoNet
GeoNet reported that a warming trend of the crater lake water at Ruapehu was evident by 13 March, and by 21 March the temperature was 31 degrees Celsius. The heating cycle was accompanied by strong levels of volcanic tremor, indicating increased gas flux though the system, and an increased likelihood of eruptive activity. The Volcanic Alert Level was raised to 2 (on a scale from 0-5) on 21 March and the Aviation Color Code remained at Green.
Source: GeoNet
GeoNet reported that a heating cycle at Ruapehu’s summit Crater Lake had ended. During the previous two months the temperature of the water increased from 20 degrees Celsius to a peak of 39.5 degrees on 4 September, and then decreased to 28 degrees. During the cycle the color of the lake changed from a blue-green color to a darker gray, reflecting the disturbed lake floor sediments suspended in the water from the influx of hot fluids. The key monitoring parameters of water level and temperature, seismic activity, and tremor levels, were all within normal ranges. The Volcanic Alert Level remained at 1 (minor volcanic unrest) and the Aviation Color Code remained at Green.
Source: GeoNet
GeoNet reported that volcanic tremor at Ruapehu declined to low levels on 29 December 2020, and remained low; volcanic gas emissions returned to background levels by the next day. Water chemistry had only slightly changed compared to data collected a few weeks prior. Although the temperature of the crater lake water remained high (40 degrees Celsius), the period of heightened unrest was over; the Volcanic Alert Level was lowered to 1 and the Aviation Color Code was lowered to Green on 11 January.
Source: GeoNet
On 28 December GeoNet reported that during the previous week the temperature of Ruapehu’s crater lake water slightly decreased from 43 to 41 degrees Celsius. Moderate-to-strong levels of volcanic tremor were recorded along with a small number of shallow volcanic earthquakes. The largest volcanic earthquake was an M 2.2 (on 26 December) which was uncommonly large, and combined with elevated tremor indicated ongoing unrest. The Volcanic Alert Level remained at 2 and the Aviation Color Code remained at Yellow.
Source: GeoNet
GeoNet reported a warming trend of the crater lake water at Ruapehu, with a high temperature of 43 degrees Celsius. During an overflight to measure gas emissions the previous week, scientists observed that the lake was a uniform gray color (suggesting it is well mixed) and some water overflow at the lake’s outlet. Gas output had increased in response to the heating cycle; the amounts of carbon dioxide (CO2) and sulfur gases (SO2 and H2S) in the plume were the largest measured in the past two decades. Short-lived pulses of volcanic tremor were coincident with gas emissions. The Volcanic Alert Level was raised to 2 and the Aviation Color Code was raised to Yellow on 21 December.
Source: GeoNet
On 4 May GeoNet reported a cooling trend of the crater lake water at Ruapehu with a current temperature of 35 degrees Celsius. During February-April the water temperature had peaked at 42 degrees Celsius. The intensity of volcanic tremor had been weak during the past month after a peak in strength in early March; tremor had declined slowly almost in conjunction with the lake water cooling trend. During a visit to the lake the previous week volcanologists noted that the lake was a uniform gray color with a few surface slicks and no obvious upwelling. Since that visit the water level had risen and was flowing into the upper Whangaehu River. The Volcanic Alert Level remained at 1 (minor volcanic unrest) and the Aviation Color Code remained at Green.
Source: GeoNet
GeoNet reported that a period of increased seismicity was detected at Ruapehu during 22-23 February. The series of volcanic earthquakes began with the largest event, a M 1.3, which was followed by smaller events. The data showed that the seismicity originated from a source 3 km below the summit. The amplitude of the volcanic tremor declined during 24-28 February and then again increased around 29 February-1 March.
In response to the 22-23 February sequence, volcanologists collected lake water samples and measured gas emissions the week after. The temperature of the lake water suggested slow heating from 24 to 30 degrees Celsius. They observed upwelling of gray sediment and sulfur slicks on the surface of the water. Carbon dioxide and sulfur gas emissions had increased since last measured on 7 February. GeoNet noted that gas-flux and the increased seismicity remained within the normal ranges for Ruapehu; the Volcanic Alert Level remained at 1 (minor volcanic unrest) and the Aviation Color Code remained at Green.
Source: GeoNet
GeoNet reported that the period of high water temperatures at Ruapehu’s summit Crater Lake along with elevated tremor levels was over. Tremor levels began to decline on 16 April and by 29 April was described as weak. The lake water reached a peak temperature of 44 degrees Celsius on 19 April and then began cooling; the temperature was 39 degrees Celsius by 29 April. The report noted that the probability of an eruption during a heating cycle had decreased with the decreasing activity. The Volcanic Alert Level remained at 1 (minor volcanic unrest) and the Aviation Color Code remained at Green.
Source: GeoNet
GeoNet reported that, at least for the last 10 years of continuous lake-temperature monitoring, heating cycles at Ruapehu’s summit Crater Lake have occurred over periods of about 12 months with temperatures ranging from 15 to 45 degrees Celsius. However, the temperature remained elevated at 30 degrees for a period of six months starting in September 2018. GeoNet noted that during the previous two weeks the lake temperature increased further, at a rate of around a half of a degree per day, to 42 degrees on 9 April. Tremor levels also increased. The Volcanic Alert Level remained at 1 (minor volcanic unrest) and the Aviation Color Code remained at Green.
Source: GeoNet
On 5 June GeoNet reported that a new heating cycle at Ruapehu’s summit Crater Lake began, as indicated by a recent rise in the water temperature. The increasing lake temperature began 29 May, at a rate of about 1°C per day. Volcanic tremor also increased, representing a greater flow of hydrothermal fluids into the lake. Many heating and cooling cycles have occurred in the past; the current cycle does not indicate an unusual sign of unrest. The Volcanic Alert Level remained at 1 (minor volcanic unrest) and the Aviation Color Code remained at Green.
Source: GeoNet
On 7 September GeoNet reported that the temperature of Ruapehu’s summit Crater Lake had been declining, cooling to 12 ºC on 15 August which was the lowest temperature since the 1995/1996 eruptions, but had recently started to rapidly heat. The temperature began to slowly and variably rise in late August; however, by 2 September a rising trend was apparent. On 4 September tremor levels also increased, and remained elevated. The Volcanic Alert Level remained at 1 (minor volcanic unrest) and the Aviation Colour Code remained at Green.
Source: GeoNet
GeoNet reported that the temperature of Ruapehu’s summit Crater Lake had been declining since May. During an overflight on 10 August scientists recorded gas emissions at typical low background levels. The next day the lake water temperature was 12.6ºC, one of the lowest temperatures since the 1995/1996 eruptions. The lake was a dark green, overflowing, and sulfur slicks outlined areas of upwelling. A strong sulfur odor was noted near the lake. The level of volcanic tremor which was at moderate levels during May-June had declined to typical background levels. The Volcanic Alert Level was lowered to 1 (minor volcanic unrest) and the Aviation Colour Code was lowered to Green.
Source: GeoNet
On 5 July GeoNet reported that the elevated activity at Ruapehu had declined; gas emissions returned to baseline levels, volcanic tremor decreased to levels detected in the second half of 2015, and the temperature of the summit Crater Lake had declined from a high of 46 to 23 ºC. The Volcanic Alert Level was lowered to 1 (minor volcanic unrest) and the Aviation Colour Code was lowered to Green.
Source: GeoNet
On 17 May GeoNet reported that the lake temperature of Ruapehu's summit Crater Lake had decreased from a high of 46 degrees Celsius to 39 degrees, with some of the decrease attributed to rain and snowfall. Moderate levels of volcanic tremor continued, and analysis of water samples collected the previous week showed no changes in the lake chemistry. During recent visits, scientists measured a larger output of volcanic gases. The Volcanic Alert Level remained at 2 (moderate to heightened unrest) and the Aviation Colour Code remained at Yellow.
Source: GeoNet
GeoNet reported that a volcanic earthquake swarm beneath Ruapehu's summit Crater Lake was detected during 25-26 April. This type of swarm has been uncommon at the volcano in recent years, when volcanic tremor has dominated the seismicity. In addition, the crater lake water temperature had been rising since late 2015, from 25 degrees Celsius to 40 degrees in the last half of April. Similar temperature increases were detected in March 2011, April 2014, and February 2015.
In a 3 May notice GeoNet stated that the size and number of events in the swarm had decreased; a period of moderate volcanic tremor began at 1310 on 2 May and lasted about an hour. The lake temperature had peaked at 42 degrees, equal to the highest recorded temperature since 2011. At around 1400 on 7 May tourists on an overflight of the area observed vigorous steaming at the lake surface and upwelling bubbles. The lake temperature rose further, to 44 degrees, establishing a new high since temperatures started to be recorded in 2000. The earthquake swarm had stopped, though the seismic network continued to record volcanic tremor. On 11 May GeoNet stated that recent visits to the lake confirmed increased gas emissions from the crater lake. The lake temperature increased to 46 degrees and moderate levels of volcanic tremor continued. The Volcanic Alert Level was raised to 2 (moderate to heightened unrest) and the Aviation Colour Code was raised to Yellow.
Source: GeoNet
GeoNet reported that water temperatures of Ruapehu's summit Crater Lake had been increasing since early December 2014, rising from 15 degrees Celsius to over 40 degrees in late January-early February. The temperatures declined to 31 degrees in mid-March, and then climbed again to 37-39 degrees. No other changes were detected at the lake. In addition, over the previous 2-3 weeks intermittent moderate-to-strong levels of volcanic tremor were detected, which had been some of the strongest recorded there over the past eight years. The report noted that historically there had not been a direct link between volcanic tremor and discrete volcanic eruptions or sequences of eruptions. The Aviation Colour Code remained at Green and the Volcanic Alert Level remained at 1 (signs of volcano unrest).
Source: GeoNet
On 30 January, GeoNet reported that water temperatures of Ruapehu's summit Crater Lake had been increasing since early December 2014, rising from 15 degrees Celsius to over 40. Similar temperatures were recorded in March 2011 and April 2014, before the lake cooled.
Data from a field visit on 14 January showed increased amounts of volcanic gas emissions through the lake. Other recent observations from pilots and field visits confirmed that the lake changed color from blue green to light gray due to lake convection. A GeoNet volcanologist noted that lake temperature cycling was not unusual; five heating cycles have been detected since 2010. The Aviation Colour Code remained at Green and the Volcanic Alert Level remained at 1 (signs of volcano unrest).
Source: GeoNet
On 12 March, GeoNet reported that the Volcanic Alert Level for Ruapehu remained at 1 (signs of volcano unrest) and the Aviation Colour Code was lowered to Green based on the analysis of monitoring data and the lack of recent seismic activity.
Source: GeoNet
On 5 March, GeoNet reported that monitoring of the Ruapehu Crater Lake showed that temperatures at depth remained above background levels but had started a declining trend. Gas data from January and February showed emission rates of 15-25 tonnes per day of sulfur dioxide and around 650 tonnes per day carbon dioxide; these are within the usual range of emissions measured at Ruapehu. Seismicity remained low, characterized by weak volcanic tremor and some shallow earthquakes. Areas of discoloration in the lake, sometimes observed during the previous few weeks, are relatively common and thought to reflect internal lake convection processes. Scientists speculated that there was a partial blockage between the deep and shallow systems causing the lake temperature to remain steady; the relatively low temperature of Crater Lake, 22-25°C since March 2012, is one of the longest periods of low lake temperatures recorded. The Volcanic Alert Level remained at 1 (signs of volcano unrest) and the Aviation Colour Code remained at Yellow.
Source: GeoNet
On 3 December, GeoNet reported that monitoring data suggested that Ruapehu continued in a state of unrest. Scientists aboard an overflight observed that the crater lake was quiet and that the temperature remained steady at 22 degrees Celsius. Seismicity had decreased since the early part of November. The Volcanic Alert Level remained at 1 (signs of volcano unrest) and the Aviation Colour Code remained at Yellow.
Source: GeoNet
On 23 November, GeoNet reported that measurements of Ruapehu's crater lake taken on 21 November suggested that conditions had not changed since the previous week and that Ruapehu was in a state of unrest. The Volcanic Alert Level remained at 1 (signs of volcano unrest) and the Aviation Colour Code remained at Yellow.
Source: GeoNet
GeoNet reported that measurements at Ruapehu during the previous few weeks indicated that the likelihood of an eruption had increased. Scientists were concerned that increased heat at depth beneath the crater indicated a partialyl blocked vent and the potential for an eruption due to increased pressure. On 16 November the Volcanic Alert Level remained at 1 (signs of volcano unrest) and the Aviation Colour Code was raised to Yellow.
Source: GeoNet
On 5 November, GeoNet reported that Ruapehu's summit Crater Lake was hot during field visits in December 2011 and January 2012, exhibiting temperatures over 35 degrees Celsius. The lake cooled afterwards, reaching 16 degrees in May and fluctuating between 18-24 degrees during June-October. Scientists visited the lake in late October and reported that the water temperature was 19.5 degrees. During that visit they observed weak convection near the center of the blue-green lake.
GeoNet noted that Ruapehu is often seismically active; during the last month weak volcanic tremor was recorded and more recently several small earthquakes under the volcano had been detected. The largest earthquake was an M 2.
An overflight on 26 October to measure gas flux revealed that sulfur dioxide was 63 tonnes per day and carbon dioxide was 908 tonnes per day. The Aviation Colour Code remained at Green and the Volcanic Alert Level remained at 1 (signs of volcano unrest).
Source: GeoNet
On 2 May, GeoNet reported that the temperature of Ruapehu's summit Crater Lake continued to slowly cool and was about 30 degrees Celsius, down from a peak of 41 degrees in March. The lake level remained below the overflow level and no earthquakes had been located within 10 km of the Crater Lake for two weeks. The Aviation Colour Code was lowered to Green and the Volcanic Alert Level remained at 1 (signs of volcano unrest).
Source: GeoNet
On 18 April, GeoNet reported that the temperature of Ruapehu's summit Crater Lake was slowly cooling and decreased to 33-34 degrees Celsius from a peak of 41 degrees in March. A general decline of activity had been noted since 4 April, including lower carbon dioxide gas flux, less seismicity, modest change in the Crater Lake water chemistry, and cessation of lake overflow accompanying the start of the cooling trend. The Aviation Colour Code remained at Yellow and the Volcanic Alert Level remained at 1 (signs of volcano unrest).
Source: GeoNet
On 5 April, GeoNet reported that the temperature of Ruapehu's summit Crater Lake had been high for a sustained period and was currently between 38 and 39 degrees Celsius. The highest temperature since unrest began in October 2010 was 41 degrees Celsius, measured on 1 March. The report also noted that during the previous few weeks there was an increase in carbon dioxide gas emissions, increased seismicity, and changes in Crater Lake water chemistry. The unrest prompted GeoNet to raise the Aviation Colour Code although the Volcanic Alert Level remained at 1 (some signs of volcano unrest).
Source: GeoNet
On 18 September, GeoNet reported that the temperature of Ruapehu's summit crater lake had increased to 22.5 degrees Celsius, up from 16 degrees Celsius in August. Levels of sulfur dioxide and carbon dioxide also increased. Tremor was detected. GeoNet stated that the cyclic nature of the crater lake temperature and gas flux from Ruapehu was common; the Volcano Alert Level remained at 1 (some signs of volcano unrest).
Source: GeoNet
The Alert Level at Ruapehu was lowered to 1 (on a scale of 0-5) on 9 October because no further eruptions have occurred since the activity on 25 September.
Source: GeoNet
An eruption of Ruapehu that occurred on 25 September prompted GeoNet to raise the Alert level to 2 (on a scale of 0-5). Pilots reported that an eruption plume rose to an altitude below 4.6 km (15,000 ft) a.s.l. Further reports from ski field operators and the Eastern Ruapehu Lahar Alarm and Warning System (ERLAWS) indicated that lahars traveled down the Whakapapa ski field and possibly E in the Whangaehu river valley, and other areas.
On 26 September, aerial observations revealed that the summit area was covered with ash and mud, mostly directed N and reached 2 km from the crater lake. Impact craters caused by falling blocks over 1 m in diameter were also evident.
According to news articles, the eruption prompted evacuations at several ski lodges and caused train service to be temporarily suspended. A boulder crashed through the roof of a hut and injured one person.
Sources: GeoNet; Agence France-Presse (AFP)
According to news articles, a "moderate" lahar from Ruapehu's crater lake traveled E down the Whangaehu River valley on 18 March and reached the sea 140 km away after a soft rock-and-ash dam was breached. The section of dam that failed was about 40 m long and 7 m high. There were no reports of injuries or major damage to infrastructure and only some flooding to farmlands at the base of the volcano. The volume of water and debris was estimated at 1.3 million cubic meters. On 19 March, IGNS confirmed a 6-m drop in the crater lake level and reported an increase in seismicity following the lahar.
Sources: Stuff; GeoNet; Associated Press; New Zealand Herald
A M 2.8 earthquake centered at Ruapehu was recorded on 4 October. Scientists visited the summit crater lake on 7 October and confirmed that a small hydrothermal eruption had occurred. The lake water level had risen 1 m since a previous measurement, and evidence suggested wave action up to 4-5 m above the surface of the lake. The lake temperature was 22.5°C, up from 15°C. Ruapehu remained at Volcanic Alert Level 1 (some signs of volcano unrest).
Source: GeoNet
IGNS reported that a new heating cycle may be under way at Ruapehu volcano. The temperature of Crater Lake has increased three degrees to 18 degrees Celsius, and elevated levels of volcanic tremor have occurred over the last three weeks. Ruapehu remained at Volcanic Alert Level 1 (some signs of volcano unrest).
Source: GeoNet
Elevated levels of volcanic tremor continue at Ruapehu and may signal the start of another Crater Lake heating cycle. The Volcanic Alert Level remained at 1 (some signs of volcano unrest).
Source: GeoNet
On 2 November, volcanic tremor at Ruapehu increased to the highest level recorded for at least 12 months. The tremor was at moderate levels, but appeared to be declining slowly. The Volcanic Alert Level remained at 1 (some signs of volcano unrest).
Source: GeoNet
IGNS reported on 12 December that during the previous 2 months volcanic tremor and earthquakes had been occurring at Ruapehu, but there had been little surface change. However, during 5-12 December the temperature of Crater Lake rose 11°C, to 35°C. Ruapehu remained at Alert Level 1 (signs of volcano unrest).
Source: GeoNet
On 11 and 12 January steam plumes were emitted from Ruapehu. This activity was believed to be associated with hydrothermal activity in the crater lake. Prior to the steam emissions, measurements taken on 8 December revealed that the lake water temperature was at 36-38°C and that it had been heating since late November 2001. Evidence of convection was observed at the S-central vent area including minor sulfur slicks, upwelling, and light steaming. Only minor volcanic tremor was recorded at Ruapehu. The volcano remained at Alert Level 1 ("Initial signs of possible volcano unrest.").
Source: GeoNet
Seismicity returned to normal levels on 25 November after a moderate-to-large volcanic earthquake occurred at Ruapehu on 21 November. Observations on 25 November revealed no signs of eruptive activity. Scientists found that upwelling sediment in Ruapehu's crater lake caused the lake to change from its normal blue-green color to dark gray. In addition, the temperature of the lake was relatively low (22°C in comparison to 21°C in September), which further supported the theory that no eruptive activity occurred after the earthquake. The volcano remained at Alert Level 1 (on a scale of 0-5).
Source: GeoNet
On 21 November at 0218 a moderate-to-large volcanic earthquake was recorded at Ruapehu. The earthquake was followed by ~1 hour of moderate-to-strong volcanic tremor. IGNS did not believe an eruption accompanied the earthquake because no air waves were recorded and there were no reports of unusual activity. As of 23 November, seismicity continued to be higher than normal. Ruapehu remained at Alert Level 1 (on a scale of 0-5).
Source: GeoNet
The IGNS reported that an episode of strong volcanic tremor was recorded at Ruapehu. The tremor episode peaked on 16 February and was the strongest tremor recorded since the 1996 eruptions, but direct observations of the crater revealed a lack of unusual activity. By approximately 23 February the tremor had declined to background levels. The volcano remained at Alert Level 1.
Source: GeoNet
Reports are organized chronologically and indexed below by Month/Year (Publication Volume:Number), and include a one-line summary. Click on the index link or scroll down to read the reports.
Ash eruption from the crater lake on 22 June generates mudflows
Card 0610 (24 June 1969) Ash eruption from the crater lake on 22 June
"The eruption took place at 0025 on 22 June (1225 GMT 21 June). It was an explosive eruption from the Crater Lake. There was probably no adverse effect to the biological environment. It has, however, apparently killed a lot of fish in the Whangaehu River. I flew over the mountain on the day of the eruption. There was no lava flow, but a lot of ash erupted. The ash was spread in one direction because of the wind. The ash went in a line towards the NW, and I think that it was a hot blast of ash, and there were several small, hot avalanches of ash. The volcano is now quiet. The heat from this ash melted some of the snow and there were some mud flows. These hot avalanches, I think, were a variety of nuée ardents. We would call this ash eruption an eruption cloud. The seismic records have not yet been examined. The mud flows that were caused did some damage. There was one of the new ski buildings damaged on the NW side. The mud flow which went into the building was about six feet deep and the building has partially collapsed. There was no loss of life. It happened in the middle of the night and skiers were all asleep. I think that the volcano was erupting for only a few minutes. When I flew over later in the day, the lake was steaming quite strongly. It was very black and discolored, but there was no more eruption activity."
Card 0625 (30 June 1969) Details of eruption and resulting mudflows
At about 0025 on 22 June J. Mazey, Tongariro National Park Chief Ranger, felt a shock-wave (compressional air wave) in his home 9 km NNW from the crater (elev. 2,530 m) of Mount Ruapehu. At 0300 hours Mazey heard two or three rolls of a low, long rumbling sound. At approximately the same time another eyewitness is reputed to have seen flashes of light and sparks, and heard rumbles from the direction of the crater. He described the sight as a massive fireworks display. At 0033 hours, a hail of ash and scoria fell on the skiing grounds 4 km NNW of the crater, and finer ash deposits have been subsequently observed up to 15 km NW from the crater.
It appears that an ash eruption had occurred, expelling it with enough water from the crater's lake (18,000 m2 surface area) to lower the level 10-20 feet. Hot ash flows moved down the N slopes of the mountain, melting the freshly fallen snow and creating at least one known lahar. One of these partly demolished a shop and cafeteria on the ski grounds. A shelter hut immediately above the crater was flattened, presumably by the eruption blast or an ash flow. Boulders between 3 and 10 feet in diameter are scattered up to 500 yards from the rim of the crater. The lahar, generated by hot water from the lake or byhot ash flows way in to the Whakapapaiti and Whakapapanui Rivers. In the Whakapapaiti, 15 km from the crater, 3-4 feet of sand and scoria was deposited following the eruption, much of this material probably being derived from the valley of the stream. The water level had risen 5-6 feet above normal during th epassage of the lahar in the Whakapapa River. The two branches join and feed the Wanganui River where a kill of trout, eels, and insects is reported.
It is thought that Mount Ruapehu is working up to an ash and lava eruption similar to that of 1945. Crater lake eruptions over the last four years, all of lesser extent than the present one, together with an overall increase in crater lake temperature, have been cited as evidence that an ash and lava eruption can be reasonably expected in the next year or so.
The crater lake at present is calm and discolored with wisps of steam rising. Large volumes of water have been discharged down rivers on the E (Whangaehu River) and W (Mangaturuturu River) sides of the mountain.
The whole of the N and NW slopes are covered with 0.5 inch of muddy ash containing scoria fragments up to 1 inch across. This coating is sulfurous and has polluted water supplies.
Card 0629 (30 June 1969) Aerial inspection observations
"An explosive volcanic eruption took place from the crater lake of Ruapehu . . . at 0025 on 22 June 1969.
"An aerial inspection by the writer at noon of the same day revealed that an eruptive ash cloud had been emitted and was directed towards the NW by a strong wind blowing at the time. Ash fell along a strip extending down the NW side of the volcano and for some miles away from the foot. Coarse debris, including large blocks, was spread for varying distances up to one-half mile from the crater, and hot avalanches passed SW from the Mangaturuturu glacier and SE down the Whangaehu glacier; in both cases snow melted by the hot ash mixed with it to form mud flows, which passed for some distance down the valleys. It is suspected that the ash on the NW side which covered the Whakapapa glacier was also hot and melted further snow, sending mud flows down the glacier and for some distance down the Whakapapanui and Whakapapaiti valleys.
"At the time of the inspection the crater lake was discolored dark gray-brown, and a considerable amount of steam was being emitted from its surface. Ground inspections will be made within the next few days."
Card 0630 (30 June 1969) Ecological effects of the eruption
As a result of the eruption of Mount Ruapehu volcano on 22 June 1969, a sulfurous lahar passed down the Whakapapaiti and Whakapapanui Rivers. These join to form the Whakapapa River, which after the addition of further tributaries, becomes the Wanganui River, near the town of Taumarunui.
D.C. Hogan, Tamarunui Ranger for the Auckland Acclimitisation Society, has reported the following information concerning the fish and insect kill resulting from the passage of the sand and mud-laden sulfurous water. As far down as Aukopae, 77 km downstream from the source of the Whakapapa River, dead trout and eels up to five pounds in weight are distributed along the banks. Some were still alive but their skin peeled when they were picked up, suggesting a considerable quantity of acid in the water. No sign of insect life was observed in the river, so reestablishment of the trout population would be very difficult. . . Some trout were found alive in small side streams but these contained no appreciable food in any case. He observed two dead fish every minute floating downstream at a point four miles downstream of Taumarunui (i.e., 32 miles from the source). The same event occurred during the 1945 eruption of Mount Ruapehu.
Card 0631 (30 June 1969) Summary news report about the eruption; sketch map of mudflows
"Scalding mud and ash bulldozed through the main ski field on Mt. Ruapehu yesterday morning. People on the mountain say the wall of mud must have been about eight feet high. It was one of four mud-flows which rolled down the mountain after a major eruption at 0025. Ruapehu lay under a clear sky when a cracking blast erupted from the crater. Bolts of blue light flashed around the summit. Then came a gusting, sulphurous wind. At the mountain peak, a fiery cloud of glowing ash hissed into the sky. Several minutes later falling pellets of ash blackened the snow and clattered on the roofs of mountain buildings. Thousands of tons of hot mud and water had been heaved from the crater lake and began to pour down in four different directions. Masses of churning slush seethed down the Whakapapaiti Glacier and the Whakapapanui Glacier. From the air it could be seen that the fierce eruption had blanketed the entire ski fields above National Park with ash and mud. The crater lake was between ten and twenty feet below is normal level. Boiling mud could be seen in the crater. Blackened boulders lay strewn nearby.
"A park ranger, B.E. Jeffries, saw blue flashes of light at the time of the eruption. M.W. Rea heard what sounded like a lot of hail suddenly falling. I smelt the sulphur and realized it was volcanic ash. It was quite heavy for a while, perhaps five minutes. It was a fairly clear night and we could see a black cloud above the crater. Another huge black cloud shot up while we were watching and a little while later more ash fell. Rea said the particles of ash were about the size of shotguns pellets, but there were also chunks of pumice up to two inches in diameter.
"The eruption caused minor earth tremors which were felt as far afield as National Park Township. Rivers and streams around the mountain were swollen and discolored yesterday. The Whakapapaita Stream was about three feet six inches above its normal level.
"There had been no indication at all that any activity was building up. There was no sign of steam from the crater on Saturday. Yesterday, a wisp of steam from the crater was not rising high but was being blown across Te Heu Heu Peak.
"The eruption has probably killed 95% of the fish in the Wanganui River around Taumarunui and ruined 24 years of trout stocking. A ranger said that the trout population was all in the headwaters of the river at this time of year for spawning, and 95 percent of them would have drowned after toxic chemicals in the ash, which spewed into the tributaries, had affected their gills.
"The government vulcanologist in Rotorua, J. Healy, said Mt. Ruapehu appeared to have erupted in the form of a rather rapid explosion. It was the worst he knew of at Mt. Ruapehu. Healy flew over the mountain and saw that a considerable amount of ash and boulders had been thrown from the crater. Some of the boulders were about ten feet across and were scattered all over the summit. Others were thrown for about half a mile and had penetrated the ice so they could not be seen. Ash flows poured over the side of the crater. The ash melted the snow as it went. This would have caused some of the strreams to flood and carry down a considerable amount of ash.
"Healy said that after this type of eruption there are often a series of small eruptions over the following weeks. The alternative is that a large eruption will take place but I do not think this will happen. If a major eruption took place it would involve the rise of lava in the crater as happened on Mt. Ruapehu in 1945."
Information Contacts:
Card 0610 (24 June 1969) Jim Healy, New Zealand Geological Survey.
Card 0625 (30 June 1969) J.A.S. Dow and W.M. Prebble, New Zealand Geological Survey.
Card 0629 (30 June 1969) J. Healy, New Zealand Geological Survey.
Card 0630 (30 June 1969) W.M. Prebble, New Zealand Geological Survey.
Card 0631 (30 June 1969) The New Zealand Herald, Auckland, New Zealand.
Seismic data from 22 June eruption
Card 0652 (07 July 1969) Seismic data from 22 June eruption
"Since the hydrothermal eruptions from Ruapehu Crater lake through April and June 1968, there has been little volcano-seismic acttivity at Ruapehu.
"At 0004 NZST on 22 June, moderate volcanic tremor began to record on both the summit seismograph and the Chateau seismograph (CNZ) 9 km away. During this, volcanic earthquakes or explosion vibrations of magnitude up to ML = 1.7 occurred at 0007, 0008, 0014, 0020, and 0025 NZST. At 0031 NZST, the seismic power of volcanic ttremor increased to 100 kW (1012 erg/s assuming spherical propagation of all energy as P waves from a source 1 km from the summit seismometer), and at 0032.25 NZST there was a further increase of seismic power to over 45 MW. At 0033 NZST signals from the summit seismograph ceased, probably when the hut was wrecked by a base surge, but on CNZ powerful vibrations continued and gradually decreased until 0048 NZST, when a second large increase in vibration occurred. This also decreased gradually, becoming a tremor of frequency 2 c/s, and fairly narrow bandwidth, until after 0300 NZST the seismic power was less than 0.5 kW. No further eruptions have occurred."
Information Contacts: R.R. Dibble, Victoria University of Wellington.
Tremor and lake color changes precede steam explosions
Card 1180 (26 April 1971) Tremor and lake color changes precede steam explosions
"Volcanic tremor commencedto be recorded at Ruapehu volcano on 24 March 1971 and has continued with minor interruptions until the present time. On 28 March the Crater Lake was observed to have changed colour from turquoise-green to grey-brown and a turbulent patch in the center indicated where water was welling up. On 31 March 1971 the lake temperature was reported to be 34.5°C. By 5 April it had risen to 38°C. It was again measured on 7 April but by 12 April the temperature had reached 41.5°C where it apparently remains.
"However, steam explosions occurred in the crater from 23 March and are apparently continuing at intervals. One of these threw debris up to 1/4 mile from the crater. The volcanic tremor has ceased at intervals and there have been discrete shocks, one of which on 12 April was felt on the mountain. Generally, these appear to be associated with steam explosions. It had been thought that lava was rising and accumulating beneath the lake surface in the crater but a sounding made on 7 April showed the depth in the center to be approximately 60 m which is about 13 m deeper than in 1969."
Information Contacts: J. Healy, New Zealand Geological Survey.
Eruption on 8 May drenches scientists at the summit in hot water and mud
Card 1206 (17 May 1971) Eruption on 8 May drenches scientists at the summit in hot water and mud
"An eruption occurred from Crater Lake on Ruapehu Volcano at 1553 on 8 May 1971. At the time of the eruption a party of four members from the Dept. of Scientific and Industrial Research were on the summit making observations when the water in the center of the lake was thrown up and two further explosions followed, which sent ash and debris high above the volcano where it was directed to the east by a strong westerly wind. Mud, hot water, ash and stones fell in that direction and spread down the Whangaehu glacier and valley. The members of the party were drenched with mud and hot water and lost equipment through damage, but fortunately were not hurt. The steam cloud reached a height of approximately, 15,000 feet above sea level (i.e. 6,000 feet above the summit).
"The eruption occurred without warning. Volcanic tremor was recorded on the siesmograph until the moment of commencement of the eruption when there was a sudden increase in seismic energy to the level of 10 W at the seismograph on the dome, a short distance NW from the Crater Lake. The eruptive material included fresh pumice bombs and black, glassy andesite, as well as ash and mud. Tremor with periods of greater seismic activity had occurred since 24 March and there have been a number of lesser steam eruptions on a number of occasions. The temperature in Crater Lake increased during this period to 55°C. The day after the eruption on 8 May, the temperature hadfallen to 53°C and the seismic activity had fallen off considerably though there were still occasional shocks being recorded from a probable depth of about 3 km."
Information Contacts: J. Healy, New Zealand Geological Survey.
Major eruption on 24 April; lahars and ashfall
Card 2190 (21 May 1975) Major eruption on 24 April; lahars and ashfall
A major phreatic eruption occurred in Ruapehu Crater Lake at 0359 on 24 April 1975, following a nine-minute period during which volcanic earthquakes occurred, and about 1.5 minutes of high amplitude volcanic tremor. The eruption threw out large quantities of Crater lake water, and showered lava blocks and mud over the summit. Lava blocks fell at least 1.4 km from the vent. Fine ash fell over a narrow plume extending at least 130 km SE to Hastings. The eruption was detected at 0430 24 April, when a lahar down the Whakapapanui Stream passed adjacent to Whakapapa Village on the northern slopes of Ruapehu. Other major lahars passed down the Whakapapaiti, Mangaturuturu, and Whangaehu river valleys. Some bridges were destroyed or damaged, a ski chairlift and refreshment kiosk were damaged, and fish poisoned in several streams and rivers. A shelter hut near the summit of Ruapehu was hit by many hot blocks which charred wood on which they came to rest, and the geophysical instrumentation pit and communications cable situated 700 m N of the lake were largely destroyed by blast effects. The Whangaehu lahar flooded a hydroscheme tunnel under construction 16 km SE of the crater.
Continuing bad weather during 24 and 25 April hindered investigations, but streams flowing off the volcano were sampled and flood peaks measured. Block and ash samples were obtained from the summit during a helicopter inspection on 25 April, before a heavy snowfall largely obliterated evidence of the eruption. Smaller phreatic eruptions occurred on the morning of 27 April, showering mud and some blocky ejecta over the summit of Ruapehu. Helicopter inspections were made on 27 and 29 April, when ejecta and lake water samples were collected. The lake level was found to have dropped by about 7 m, representing an ejected water volume approaching 1.5 x 10⁶ m³ (lake area is 0.2 km²). Lake temperature was 46°C, having risen from 25°C last measured on 9 April. A sounding made in the lake center on 8 May showed a depth exceeding 60 m, while lake temperature had fallen to 43°C.
Further Reference. Nairn, I.A., Wood, C.P., Hewson, C.A.Y., and Otway, P.M., 1979, Phreatic eruptions of Ruapehu: April 1975: New Zealand Journal of Geology and Geophysics, v. 22, p. 155-173.
Information Contacts: I.A. Nairn, New Zealand Geological Survey.
Moderate phreato-magmatic eruption from Crater Lake on 2 November
A moderate phreatomagmatic eruption from Crater Lake occurred at 1350 on 2 November, accompanied by a [M 3.4] earthquake. Two eruptive pulses were observed, the second producing an ash cloud that rose 1800 m above the summit before being blown NE.
NZGS personnel inspected the volcano from the air less than 2 hours after the eruption and conducted ground investigations on 5 and 9 November. Airfall tephra was deposited in a narrow zone, extending several km NE of the vent (figure 1). The margins of the deposits consisted of 40-150 mm of normally graded ejecta, ranging in size from coarse lapilli at the base to ash at the surface. Accessory material was estimated to comprise >99% of the deposit, which included a substantial quantity of sulfur spherules and gypsum. Within about 600 m of the vent, numerous impact craters were observed, most 0.15-0.2 m in diameter, cylindrical, and steeply inclined (figure 2). The largest crater in this area was l m in diameter, but a single isolated crater, 5 m in diameter, was discovered 1.2 km from the vent. Craters were formed by dense accessory andesite blocks that were also scattered across the surface of the deposits, accompanied by rare (
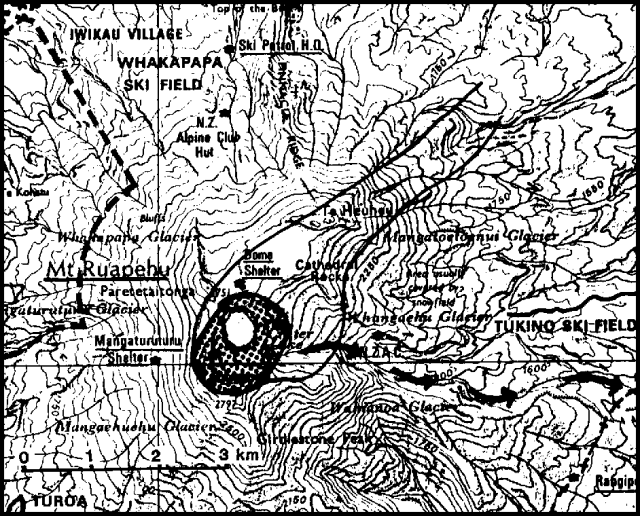 |
Figure 1. Summit region of Mt. Ruapehu, showing area of 2 November 1977 impact craters (stippled) and ash deposits (enclosed by solid line). Crater Lake is 500 m in diameter. Arrows indicate the upper portion of the path of the lahar down the Whangaehu River. Contoured interval is 50 m. |
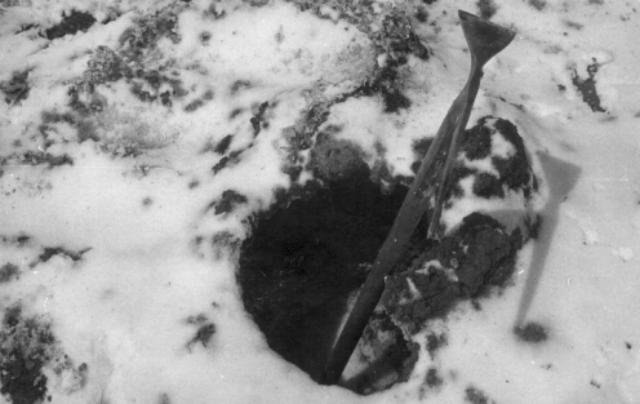 |
Figure 2. Impact crater, northern Crater Lake Basin at Ruapehu, 9 November 1977. Courtesy of NZGS. |
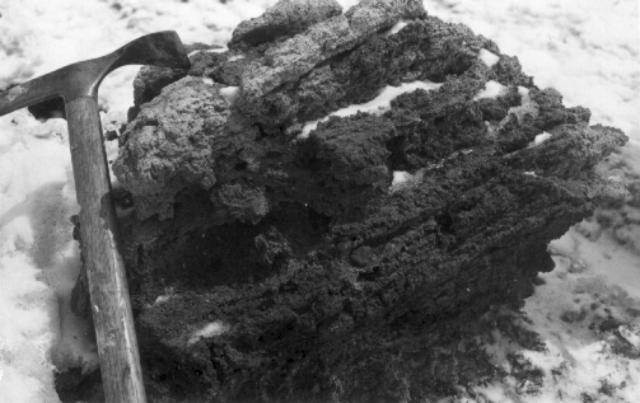 |
Figure 3. Broken face on large breadcrust bomb, revealing scoriaceous interior, Ruapehu Crater Lake Basin, 9 November 1977. Courtesy of NZGS. |
Several months of small-scale phreatic activity in Crater Lake preceded the 2 November event. During the aerial survey, vigorous steam emission was occurring from the lake, which contained a black sulfur slick near its center, indicating convective upwelling. Several small steam eruptions were observed between 4 and 9 November, none of which produced new tephra deposits. The volume of 2 November ejecta is estimated to be at least as great as that of the 1971 phreatomagmatic eruption.
Further Reference. Wood, C.P., 1978, Bombs from the Ruapehu Eruption, 2 November, 1977; New Zealand Volcanological Record, no. 7, p. 39
Information Contacts: B. Houghton, E. Lloyd, NZGS, Rotorua; P. Otway, NZGS, Wairakei.
Summary of 1978-79 activity
"A dark column of water was erupted to about 610 m above Crater Lake on 7 March 1978 at about 1240. Only fine grey airfall ash, similar to the material suspended in the lake water, was ejected. This tephra fell within a 500-m-wide band that extended 2.3 km NNE of Crater Lake at a thickness that nowhere exceeded 5 mm. Small geyser-like eruptions were observed in Crater Lake in June, when the lake temperature rose to 48.3°C. Tephra, presumably deposited by a phreatic eruption, was observed around Crater Lake on 2 September, and further eruptions occurred on 7 and 9 September. Small geyser-like phreatic eruptions were also observed in early October.
"Following a period of quiescence since mid October 1978, small phreatic eruptions occurred on 7 and 17 January 1979. The temperature of the lake rose to reach a maximum recorded value of 33.5°C on 26 March, while the discharge also increased to a maximum of 185 l/s on the same date but had decreased to 24 l/s by 2 April. Further small phreatic episodes were reported in late June and July. Lake temperatures rose to 26.5°C during this time, then gradually declined for the rest of the year."
Information Contacts: New Zealand Geological Survey.
Small explosions from crater lake
Small phreatic explosions, accompanied by summit inflation and an increase in crater lake temperature, have occurred at Ruapehu, probably beginning in late January (figure 4). During each several-hour summit visit by NZGS personnel (from late January through mid-March), 2-4 explosions took place from the crater lake.
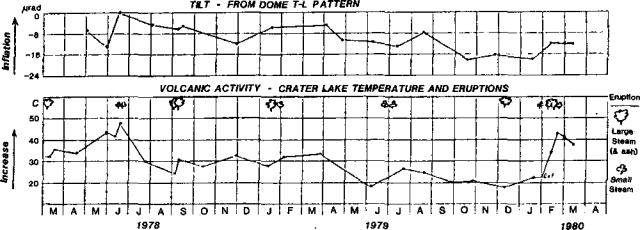 |
Figure 4. Ruapehu summit tilt in µrad (top) and Crater Lake temperature with eruptions shown schematically (bottom), March 1978-March 1980. |
Although explosion sizes varied, their characteristics were similar. A dark eruption slug of water and particulate matter broke through the lake surface (sometimes preceded by updoming of the lake water), rose a maximum of a few tens of meters, then collapsed to form a toroidal ring. Surtseyan jets formed, distinct from the main mass of ejecta. A steam column was sometimes produced, from which base surges moved radially outward. Waves generated by the explosions usually overtopped the lake outlet, sending pulses of water eastward down the Whangaehu River. Trains of black or yellow sulfur were seen floating on the lake surface after some explosions. Dark floating objects about l m across were also observed, but it was not possible to determine whether these were pumiceous blocks or frothy sulfur.
Lake temperature rose from 22°C on 31 January to 43°C on 22 February, then declined to 37.5° by 14 March. Six µrad of summit inflation took place between surveys on 15 January and 12 February, but no inflation has been measured in the three surveys since then.
The NZGS notes that similar periods of phreatic activity have occurred several times in the past 12 years, including 1968, 1971, 1974, and 1978. The 1971 activity culminated in a major phreatomagmatic eruption, but the eruptions of 1969 and 1975 took place up to a year after such active periods, and the 1977 eruption was not preceded by renewed phreatic events.
Information Contacts: B. Houghton, E. Lloyd, and B. McG. Simpson, NZGS, Rotorua; P. Otway, NZGS, Wairakei.
Small explosions through the crater lake continue
Geologists visited Ruapehu on 27 March, and 12-13 and 16 April. During the 27 March visit, three small phreatic explosions took place through Crater Lake in 4 hours and 40 minutes, continuing the activity that probably began in late January. The largest explosion produced 20-m-high water jets and a few waves big enough to overtop the lake outlet, sending very small pulses of water down the Whangaehu River. A strong H2S odor was noted after this explosion. The lake water temperature near the outlet was 40°C, 2.5° higher than on 14 March, but close to the average value recorded since 20 February. Strong upwelling occurred near the center of the lake, but was less distinct in the N area. There was no evidence of recent ashfall around the crater.
Activity was similar during the 12-13 April inspection, with 6 explosions in about 23 hours. One, with a muffled booming sound, ejected jets of water 30 m high, formed 1-2 m waves, and sprinkled dark ash on the observers. There was a strong H2S odor downwind from all of the explosions. The lake color remained battleship gray, but lake level had risen more than 0.5 m since 27 March and was overflowing at about 20 liters/sec down the Whangaehu River. The lake temperature at the outlet had dropped 3°C to 37°C since 27 March. A leveling survey indicated that less than 1 µrad of tilt had occurred since mid-March. There has been minimal deformation during the last 2.5 months.
No explosions took place during a 2.5-hour visit on 16 April, but a thin layer of ash had fallen on snow NNE of the crater, perhaps from an eruption cloud seen from a distance early 14 April.
Information Contacts: P. Otway, NZGS, Wairakei.
Phreatic explosions end
NZGS personnel visited Ruapehu on 7 May. Although occasional small phreatic explosions had occurred through Crater Lake during previous visits beginning in late January, no explosions were observed on 7 May. There was no ash on snow that had fallen around the summit area on 29 April.
Large, yellow-green sulfur slicks floated at the N end of the battleship-gray lake. Upwelling at the center of the lake was only intermittent, in contrast to the continuous upwelling seen during earlier visits. Lake water temperature was at 39°C at the outlet, 2° higher than on 13 April, but within the range of temperatures recorded since mid-February.
The seismometer recorded continuous low-level tremor [on 7 May, as on many other days].
Information Contacts: B. McG. Simpson, NZGS, Rotorua.
Activity declines
NZGS personnel observed reduced activity during a 1.5-hour visit on 30 May. Upwelling in Crater Lake had been continuous and fairly vigorous when visited from mid-February through mid-April, and intermittent on 7 May. However, upwelling was not evident on 30 May, although faint yellow sulfur slicks were visible near the center of the lake. The water temperature near the lake outlet was 31°C, 7.5° lower than 22 days earlier. The small explosions through the lake that had occurred intermittently in previous months were not observed on 30 May, and there was no ash on snow surrounding the lake. Tiltmeters recorded 4 µrad of deflation since 13 April, in contrast to <1 µrad of change 12 February-13 April.
Information Contacts: P. Otway, NZGS, Wairakei.
Small ash eruption from crater lake
Visits by F. Greenhall on 19 October and P. Otway on 20 October revealed a thin layer of pale gray ash in a 400 m-wide area S of Crater Lake. The ash appeared to be composed entirely of lake sediments and contained no coarse particles. It had been deposited in the upper layers of snow known to have fallen between 17 October and the late afternoon of 18 October. Only a minor wave surge of less than 1 m appeared to have been associated with the ash ejection.
J.H. Latter reported that a period of low-frequency volcanic seismicity occurred on 18 October at 1435, reaching a maximum magnitude of 2.5. [Similar activity occurred 13 and 15 September and 3 November without associated ash emission.] The temperature of the lake on 20 October was 31°C, a 6° increase in 13 days. The lake was a turbid gray, with large slicks of dark sulfur floating near its center and much steam rising from the surface. Upwelling near the center appeared strong, although steam partially obscured this area.
Occasional explosions from the crater lake began in late January and continued through mid-April. No evidence of additional activity had been observed since April.
Information Contacts: P. Otway, NZGS, Wairakei; J. Latter, DSIR, Wellington; F. Greenhall, Ohakune.
Increased seismicity; lower crater lake temperatures; eruption expected
Ruapehu's Crater Lake has cooled from 32.5°C in late April to 11°C in early October. The temperatures recorded since late August were the lowest since detailed measurements began. Periods of low Crater Lake temperature preceded strong eruptions in June 1969 and April 1975.
The following report, from J. H. Latter, describes recent seismicity.
"The period of declining temperatures up to 7 September was seismically quiet, apart from minor volcanic tremor and associated B-type earthquakes that ended on 6 July, a short swarm of roof rock shocks from 11 to 13 July, and less than an hour of strong volcanic tremor on 24 August. In particular, there were no large B-type earthquakes, as after the April 1975 eruption, which might have suggested activity at the volcanic focus that was unable to break out at the surface. This might be interpreted as evidence that the low lake temperatures were due either to a blockage deeper than the volcanic focus (thought to be about 1 km below Crater Lake), or that heat transfer had declined or stopped, for some different reason.
"Beginning gradually on 7 September, a swarm of roof rock earthquakes marked the end of seismic quiescence. The swarm was unusually prolonged, ending on 2 October with an earthquake of magnitude 2.4 ML (i.e. quite small), which was not a true roof rock earthquake. This was well-recorded on the Tongariro National Park network and could be accurately located at 2 km below Crater Lake, which, in the model used, marks the top of the Tertiary sedimentary rocks below the volcano. Rather than being a roof rock earthquake, it was therefore a "wall rock," or perhaps even "floor rock" earthquake, for the known volcanic focus; although it is possible that it may represent a roof rock earthquake for a deeper volcanic focus (magma chamber?) below the Tertiary sedimentary rocks.
"A train of weak B-type earthquakes preceded the 2 October earthquake by about 54 hours. Volcanic tremor began about 8 hours later but lasted only a few hours. Tremor did not become common on the records until after the 2 October earthquake. Since then it has built up steadily on the records, becoming quite strong and almost continuous since 14 October. Clearly the roof rock swarm and terminating earthquake took place in response to stress caused by blockage of some kind and had the effect of removing the blockage. Since 2 October, more typical volcano-seismic activity, as shown by the tremor, has resumed.
"An unusual feature of the volcanic tremor has been that some has been of a much higher frequency than measured previously at Ruapehu. In the past, 3 Hz tremor has been thought to have been correlated with eruptions. On 7 October, tremor with dominant frequencies as high as 4.5 Hz was recorded, probably because of intrusion at shallow levels high in the volcano in very restricted or narrow spaces [see also 28 October in 6:12].
"In spite of the interesting type of recent seismic activity, it is stressed that the amount of energy released is small. Roof rock activity has peaked at a level well below that reached in November 1976 and March 1977. Furthermore, B-type earthquakes have all been small (the largest ML 2.3), and the volcanic tremor, which peaked on 18 October at about 1.9 x 10⁶ J [and again on 25 October (~3.5 x 10⁶ J)], was exceeded in November 1976, October 1977, October 1978, and August and October 1979. It is far below the level that prevailed before the 1971 eruptions.
"It seems likely that the present moderately high level of tremor will be associated with reheating of Crater Lake, and that eruptions will take place. But the volcano can perhaps be considered in a less dangerous state than during its recent period of low temperatures and marked roof rock activity."
Information Contacts: J. Latter, DSIR, Wellington.
Small ash eruption
The increased seismicity reported last month was followed by resumption of upwelling in Crater Lake, a sharp increase in its temperature, and a small ash eruption.
Geologists recorded a Crater Lake temperature of only 10.5°C on 8 October, a decline of 3° since 28 August and the lowest since detailed measurements began (although the lake was reportedly frozen in 1886 and 1926). The lake showed no sign of sulfur slicks or steam and only minor upwelling was evident, at the N end. When geologists returned late 12 October, sulfur was upwelling from the center of the lake at 10-20 minute intervals and the temperature had risen slightly, to 11.8°C. Tilt measurements indicated that about 8 µrad of inflationhad occurred since 17 August. The distance across the N part of the crater rim had increased 21 mm between surveys 1 May and 28 August, also indicating inflation, but this increase had been entirely reversed by 13 October.
Float plane pilot K. Newton reported that he saw a patchy layer of ash extending southward from the crater during the week prior to 30 October, probably about 27 October. Geologists inspecting the crater area 4 November observed a thin layer of ash extending 500 m S of the lake. Snow that fell 1 November had covered the ash, but subsequent melting exposed some of the distal end of the deposit. Tilt measurements 4 November indicated that the 8 µrad of inflation noted 13 October had been completely reversed. The lake temperature had increased to 24°C, its color had changed from blue-green to its normal battleship gray since mid-October, and upwelling in the center produced black sulfur slicks.
Information Contacts: P. Otway, NZGS, Wairakei.
Small ash eruption; seismicity; possible intrusion
Increased seismicity and higher crater lake temperatures preceded a small ash eruption in late October. About 3 weeks later, a second small explosion from the crater lake ejected tephra that may have included fresh magma. Minor explosive activity was continuing in late December. Volcanic tremor may indicate shallow intrusions of magma beneath the summit crater lake, or lava extrusion onto the lake bottom.
Volcanic tremor started to increase in early October, and had become quite strong and almost continuous by the 14th. For the next 2 weeks, seismographs recorded moderately strong tremor with frequencies between 1.1 and 2.7 Hz, a normal range for Ruapehu during periods of activity [but see 6:10]. Tremor declined on 28 October, stopping completely for 5.5 hours. Tremor resumed at 2230 on 28 October, at the highest frequency (5 Hz) recorded at Ruapehu since a seismograph was installed near the summit in May 1976. The high-frequency tremor continued for about 10 hours and was interpreted by J.H. Latter as indicating shallow intrusive activity. Between 29 October and 14 November, seismographs recorded occasional normal-frequency (2.0-2.8 Hz) tremor and a few weak low-frequency (B-type) volcanic earthquakes, the strongest a magnitude 2.4 event on 6 November. A 3-hour episode of high-frequency (3-3.5 Hz) tremor was recorded late 17 November, and 3-5 Hz tremor that started late the next day lasted about 10 hours.
Park Ranger Pat Sheridan observed ash on snow in the Crater Lake area just before noon on 19 November. However, an Air New Zealand pilot flew over the volcano 4 hours later and saw no evidence of a recent eruption. Geologists have not been able to resolve the conflicting observations, but their overflight the next morning revealed dark gray mud extending about 150 m SW of the lake. NZGS personnel visited the summit area 24 November and saw dark gray ash to 700-800 m down the valley of the Whangaehu River, which flows down the E flank from Crater Lake. The maximum thickness of the deposit was less than 1 cm. C. P. Wood analyzed the tephra, primarily precipitated lake sediment (including yellow sulfur spheres to 1 mm in diameter) and altered andesite, but containing many angular chips of fresh-looking dense black glassy andesite, particularly in the coarser size fraction. Wood suggested that the glassy andesite may have been ejected directly as fresh magma or may have been fragments of lava extruded very recently onto the crater lake floor. A [very small (M 1.7)] B-type earthquake at 0123 on 20 November, at the end of an episode of high-frequency tremor, seemed the seismic event most likely to have accompanied the tephra eruption. The crater lake temperature was 42°C on 24 November, up from 36.5° three days earlier and 24° during the last visit by geologists on 4 November. Tilt stations were reoccupied on 24 November, but no significant changes had occurred since measurements 20 days before.
Between 18 and 27 November (the last day for which detailed seismic records were available at press time), 10-20 hours of volcanic tremor were recorded on most days, at frequencies of 4.5-5 Hz until 22 November, 3.5-5 Hz until the 24th, and 3-3.5 Hz thereafter. There were only about 2 hours of tremor on the 24th and 25th. None of the tremor was strong, but the highest amplitudes were recorded 27 November. Small low-frequency volcanic earthquakes began early 23 November, apparently centered less than 1 km below the crater lake, at about the level where roof rock events normally occur (06:10). Latter noted that this suggests magma has intruded the roof rock beneath the lake. Low-amplitude tremor was continuing as of late December.
Geologists returned to the volcano 28 December. They observed three large vapor plumes during their climb to the summit, and while at the crater lake saw a vigorous explosion that produced a 500-m steam column and waves more than 2 m high. No ashfall was noted although the initial jets of water were darkened by tephra. A nearby seismograph recorded a 3 Hz signal during the explosion. The only indications of recent tephra emission were small 1- to 2-mm-thick lobes of dark gray ash and sulfur that extended about 100 m from the lake. The temperature of the lake had risen further since the previous measurement 24 November, to nearly 47°C. Reoccupation of tilt stations showed about 7 µrad of inflation since 24 November, but there had still been a net deflation of 4 µrad since 13 October.
Information Contacts: J. Latter, DSIR, Wellington; B. Scott, I. Nairn, and C. Wood, NZGS, Rotorua.
Small phreatic explosions; seismicity
Frequent explosions from Crater Lake continued through late January. The lake temperature continued to rise, and volcanic tremor and shallow volcanic earthquakes were frequent. NZGS personnel carried out field work in the summit area 12, 18, and 21 January. Eruptive Activity, Temperature, and Ion Concentration of Lake Water. During the roughly 12-hour visit on 12 January, 23 small hydrothermal explosions from the crater lake were noted, separated by quiet periods of 4-127 minutes. Water jets from these events rose as much as 70 m, and two generated large steam columns. A dark-colored deposit on snow extended from Crater Lake onto the lower flanks. The phreatic explosion that produced this deposit was not observed, but possibly accompanied a moderate B-type volcanic earthquake recorded the previous day. The crater lake temperature was about 57°C, 10° hotter than when it was last measured, on 28 December. Geologists were hampered by poor weather 18 January, but observed 4 hydrothermal explosions, similar to those of 6 days earlier, during brief periods of good visibility. During better weather on 21 January, 20 hydrothermal explosions were seen in 7 hours, again similar to those of 12 January. The temperature of the lake remained at 57°C. Depth soundings at two points in the center of Crater Lake indicated that no major lava dome growth has occurred, but did not rule out the extrusion of small quantities of lava onto the lake floor. Concentrations of Mg and Cl, and the Mg/Cl ratio of lake water have both shown large increases after falling during early 1981. The NZGS noted that these increases demonstrate that interaction between fresh rock and lake water has been occurring, but it is uncertain whether the fresh rock is new magma or older rock exposed to lake water for the first time because of explosive activity.
Deformation. Tilt surveys in the summit dome area measured only 3 µrad of apparent deflation between 28 December and 12 January, and no additional deflation was detected on 18 January. Since inflation peaked 25 June, very little change in tilt has been detected in this area. However, horizontal deformation measurements showed that 16 mm of expansion had occurred 13 October and 21 January along a 600-m line across the N side of the crater. Horizontal movements across the dome during this period did not exceed 10 mm.
Seismic activity. The increased seismic activity that started 18 November peaked 30 November-2 December, then declined. [Although reported in considerable detail here, November-December seismicity was substantially weaker than that associated with October's minor eruptive activity.] High-frequency (3.5 Hz) tremor, strongest 28 November, was succeeded by low-frequency (1-2 Hz) tremor of deeper origin that peaked 30 November and declined 1 December. A magnitude 2.3 B-type (low-frequency volcanic) earthquake was recorded on 1 December and a magnitude 2.4 low-frequency volcanic event occurred the next day at 1221, centered in the roof rock overlying the usual focus of B-type shocks. Until the first roof rock event of clearly intrusive or magmatic character occurred on 23 November, all of the roof rock seismicity had been tectonic and of high frequency. Volcanic tremor remained at a low level until 26 December, except for a minor peak on the 3rd. However, tremor was detected every day through this period, with dominant frequencies of 3.5-4.5 Hz through 15 December, and more normal frequencies (2-2.5 Hz) after that date.
A sequence of small earthquakes on 22 December was probably accompanied by an explosive eruption. A magnitude 2.0 B-type shock at 1208 was followed 2.5 minutes later by a M 2.2 low-frequency volcanic event located in the roof rock zone. A weak air wave, detected by a nearby microbarograph, had a probable origin time of 8 seconds before the second earthquake. Similarly, a small explosion witnessed by geologists on 28 December was accompanied by the onset of very weak low-frequency tremor, and was followed 9 and 12 seconds later by magnitude 1.25 and 1.5 volcanic events in the roof rock zone.
Tremor strengthened in late December and early January, accompanied by discrete low-frequency volcanic earthquakes, the strongest at 0722 on 24 December (in the roof rock zone, M 2.2), 1 January at 0613, and 2 January at 0104 (both slightly deeper, magnitude 2.3, B-type events). This period of increased seismicity was interpreted by J. H. Latter to suggest that high-level intrusion of magma was accelerating, probably accompanied by extrusion onto the crater lake floor.
High-frequency tremor continued until 5 January, then diminished by about a factor of 4. Tremor increased again on the 14th and reached a peak 17-18 January. Dominant frequencies ranged from 3 to 5 Hz, indicating that the activity continued to be very shallow. Few significant discrete volcanic earthquakes were recorded during the first half of January, but explosions observed on 12 January were accompanied by very small B-type events.
Portable seismographs were operated by NZGS geologists visiting the crater 18 and 21 January. On the 18th, they recorded weak high-frequency but detected no earthquakes accompanying the 4 observed hydrothermal explosions. Increases in tremor amplitude preceded some of the explosions observed 21 January by as much as 5 minutes, but again, none were accompanied by discrete earthquakes.
Information Contacts: J. Latter, DSIR, Wellington; D. Sheppard, Chemistry Division, Wellington; B. Scott, P. Otway, and I. Nairn, NZGS, Rotorua.
Fewer explosions; lake temperature drops
NZGS personnel returned to Ruapehu 5 February and observed an apparent decline from the fairly vigorous January activity. During 3.5 hours of field work the geologists saw only one explosion; a geysering of muddy black water from near Crater Lake's center that lasted at least 25 seconds. Sounds that may have been produced by two additional explosions were heard during cloudy periods that obscured Crater Lake for most of the last 2 hours of the NZGS visit. In contrast, 2-3 explosions per hour were noted 12 and 21 January. The amplitude of volcanic tremor, measured for 2 hours by a portable seismograph on 5 February, had decreased considerably since 21 January [but J. Latter notes that such fluctuations are common]. Tremor frequency was about 3 Hz. Crater Lake temperature dropped from 57°C on 12 and 21 January to 49°C on 5 February. However, preliminary analyses indicated that both Mg and Cl concentrations and the Mg/Cl ratio continued to increase, consistent with increasing interaction between lake water and magma or rock not previously exposed to lake water. Depth soundings in the central area of Crater Lake indicated that no major lava dome growth had occurred on that portion of the lake bottom.
Information Contacts: I. Nairn, NZGS, Rotorua.
Explosions from crater lake; seismicity summarized
Seismic activity, Crater Lake temperature, and strength and frequency of the lake's hydrothermal eruptions declined in February and early March, but increased again in mid-March.
Summit-area monitoring by NZGS personnel 11 February showed little change since the visit 6 days earlier. Only 4 small explosions from Crater Lake were noted in 8.5 hours. The largest, lasting about a minute, ejected three 30 m-high columns of muddy black water, which collapsed onto the lake surface to form small base surges. The temperature of the lake water had risen slightly, from 49° to 50.5°C. Distance-measuring and tilt surveys showed no significant changes. The next visit by geologists, on 5 March, lasted 4 hours, but no explosions were observed nor was there any evidence of new ash around the lake. However, climbers saw two very small explosions the next day. The lake temperature had dropped almost 10°C, to 41°C, in about 3 weeks. Only minor tilt changes were observed.
Park rangers received a report of an eruption at about 1215 on 16 March that generated a steam cloud filling the entire crater area to an estimated height of 1 km. NZGS personnel saw one steam explosion during a 2.5-hour visit 18 March. Continuous steaming of Crater Lake was reported during the early morning of 20 March. Geologists returned 23 March and observed 5 explosions from Crater Lake in 10 hours. Four were relatively small, producing columns of water 5-30 m high. However, a larger explosion at about 1430 produced large waves, and jets of black water that rose more than 100 m above the lake surface. Lake temperature had increased 6° since 5 March, to 47°C. No significant tilt changes were detected during surveys 23 and 26 March. A single Crater Lake explosion was observed during 5 hours of NZGS fieldwork 26 March.
The following is from reports by J.H. Latter. [For Latter's definitive analysis of this activity, see New Zealand Volcanological Record, no. 12, p. 31-37].
A period of higher-amplitude volcanic tremor began about 1600 on 14 January, climaxed 26 January and ended 30 January. Since then, strong tremor has been recorded only during an 8-hour period 10-11 February. Through 25 January, the tremor was dominantly high-frequency (3-4 Hz), suggesting that its origin was very shallow, but since then the strongest tremor has been mainly low-frequency (1-2 Hz). The focus of activity has evidently moved down to a lower level within the volcano. Latter notes that this could either be due to a process of withdrawal of magma, which up to now has been standing at a high level, or to the arrival of fresh magma from greater depths at the normal volcanic focus about 1 km below Crater Lake.
Only small volcanic earthquakes occurred between mid January and the end of February. A marked swarm of low-frequency volcanic earthquakes (B-type) took place, at about the normal focus, 20-22 February; activity peaked about 1200 on 20 February with several magnitude 2.1 earthquakes. This magnitude was relatively low, and it was not known whether the events were accompanied by eruptions. Latter notes that it was likely that the B-type swarm represented a minor stoppage in the volcano's conduits, but that the stoppage must have been rather weak since it was evidently overcome by quite small-magnitude earthquakes. Similar but smaller events took place 21-22 January (when no eruptions took place), and 3 and 14 February.
Shallower seismic activity peaked 23-25 January, when high-frequency tremor was fairly strong, preceded by the largest magnitude volcanic earthquakes at this level since 24 December (the so-called C-types, two ML 2.0 events). A smaller C-type earthquake (ML 1.8) occurred 28 January; since then there have been few, the largest only ML 1.6 (on 26 February). During the declining stages of activity 24-25 January, 31 January, and 24-26 February (after the B-type swarm mentioned above), high-frequency roof rock earthquakes with magnitudes between 1.6 and 1.9 have been detected.
Latter notes that "the best fit for B-type earthquake data suggests a mean depth of origin of 0.77 km beneath the floor of Crater Lake. Adopting an explosion model for the earthquakes, and equating the travel time (origin time of earthquake minus observed eruption time) of 8.5 seconds with upward movement of gas from this depth, gives an average velocity of the gas column of about 90 m/s. Applying the same velocity to the onsets of C-type earthquakes yields a depth of origin of about 250 m below the floor of the lake. This estimate, though crude, is probably of the right order, and suggests that magma had risen during the increased activity (since September 1981) by about 500 m.
"The decline in seismic activity at the end of January, and the change to tremor of deeper origin, appears more likely to have been due to withdrawal of magma than to a major blockage of conduits within the volcano. Although lake temperature has declined, partly no doubt because of the accelerated melt around Crater Lake during the long spell of fine weather, the volcano still gives the impression of being 'open vent.' The small magnitude (ML 2.1) of the largest earthquakes occurring since activity declined suggests that only minor blockages have formed, and have been fairly quickly overcome."
High-level (high-frequency) tremor continued 1-23 March, although none was recorded 4 or 7-10 March. Tremor was strong 11-16 March, peaking on the 13th, but remained much weaker than in late January. Occasional episodes of low-frequency tremor were recorded during the first 3 weeks in March, some lasting for several hours. These were interpreted by Latter as indicating movement at the base of the magma column, at least 500 m tall, that may extend from 200-300 to 700-800 m below Crater Lake. A swarm of B- and C-type earthquakes began on 15 March, culminating in a 6-minute B-type sequence 21 March that reached a magnitude of 2.7, the largest volcanic earthquake at Ruapehu since 2 January. Clouds obscured the volcano 21 March, so it was impossible to determine if an eruption accompanied this event. The swarm was continuing as of 23 March.
Information Contacts: J. Latter, DSIR, Wellington; I. Nairn and B. Scott, NZGS, Rotorua; P. Otway, NZGS, Wairakei; R. Beetham, NZGS, Turangi.
Explosive activity declines
NZGS personnel observed increased explosive activity from Crater Lake in mid to late March, but no explosions occurred during visits to the summit area 15 and 21 April. The temperature of the lake water declined from 47°C on 23 March to 39° on 15 April, then increased slightly to 42° six days later. On 15 April, lake-surge deposits could be seen on 6-day-old snow as much as 2 m above the lake surface, but on 23 April there was no evidence of additional surges or recent ash emission. Deformation surveys indicated that about 12 mm of inflationary expansion had occurred across Crater Lake 23 MarCH-15 April, but 10 mm of contraction of the same line was measured on 23 April. However, this line remained 15 mm longer than it had been a year earlier.
Information Contacts: A. Cody and I. Nairn, NZGS, Rotorua; P. Otway, NZGS, Wairakei.
Lake temperature and level drop; no new explosions
NZGS personnel surveying Ruapehu on 29 May observed no hydrothermal eruptions from Crater Lake during their 8-hour stay, nor did they see evidence of recent large surges of lake water in the heavy snow cover within 1-2 m of the water's edge. The lake level was lower than on the 15 and 21 April visits; measurements indicated it was 2 m below overflow, the lowest since the April 1975 eruption. Bathymetric surveys had shown a decrease in the depth to the vent area of about 250 m between 1965 and 1970 but data collected from remote depth sounding buoys in 1982 indicated that the vent area was about 150 m deeper than in 1970. Water temperature in the outlet area was 27°C, 15° lower than on 21 April (figure 5). A large yellow-black sulfur slick usually occupied the center of the battleship gray lake. Chemical analysis of lake water showed small increases in Mg and Cl concentrations, but no change in the Mg/Cl ratio.
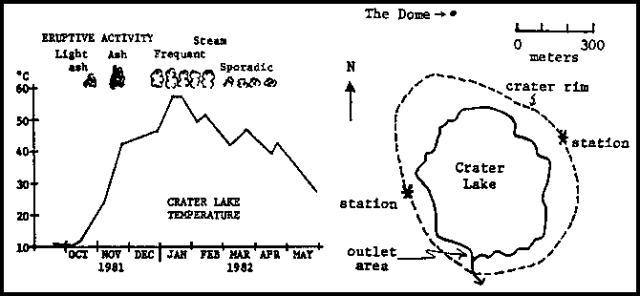 |
Figure 5. Temperature of Crater Lake at Ruapehu as measured in the Outlet area (left), and sketch of the crater area showing measurement sites used to collect data (right). Courtesy of P. Otway. |
Deformation surveys of the volcano showed no measurable tilt, but an increase of about 10 mm, since 21 April, in a precisely measured 600-m line across the crater. About 10 µrad of inflation have occurred since the latter half of 1981, and the crater was about 20 mm wider than a year ago (figure 6). NZGS interpreted the slight inflation as either non-elastic expansion possibly related to the eruptive period that began late in 1981 (06:10-12), or still-elevated gas pressure within the vent.
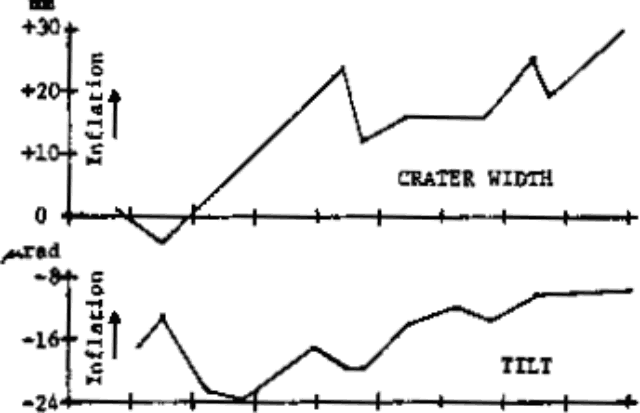 |
Figure 6. Ruapehu crater width as measured October 1981-May 1982 between two stations ~600 m apart on the crater rim (top), and tilt as measured from the Dome, ~200 m N of the crater rim (bottom). Courtesy of P. Otway. |
Information Contacts: P. Otway, NZGS, Wairakei; I. Nairn, NZGS, Rotorua.
No new explosions; lake temperature lower
No hydrothermal eruptions from Crater Lake were observed on 5 or 26 July, when NZGS personnel worked at the volcano. The lake, colored its usual battleship gray, was steaming moderately on the 5th; on the 26th there was upwelling from the center of the lake but only a little steam was rising.
On 5 July the water temperature in the Outlet area was 33°C, 6° higher than on 29 May. Snow within 1-2 m of the water's edge showed no signs of recent large surges. Considerable sulfur coated the lake margin in the outlet area. A preliminary water analysis showed no change in magnesium concentration but a small increase in chloride: Mg/Cl = 0.119. A triangulation survey showed that the length of a precisely measured 600-m line across the crater had decreased 7 mm since 29 May. NZGS interpreted the 1981 crater width measurements as showing virtually no deformation following the 20 mm expansion recorded during the onset of the eruptive period in January.
On 26 July the water temperature had dropped to 24.5°C. Snow lay within 0.5 m of the edge and showed no signs of recent ash deposits or surging. Magnesium concentration in the lake water was down slightly (by 4 ppm), but was only 1 ppm less than the mean January-April value.
Information Contacts: I. Nairn and B. Scott, NZGS, Rotorua; P. Otway, NZGS, Wairakei.
No explosive activity
Few changes have been observed since the end of July. NZGS personnel visited Ruapehu on 19-20 and 24 August, 17-18 September, and 21 October.
On all the visits the gray Crater Lake had yellow sulfur patches on its surface and minor to moderate upwelling in the center and near the N shore. Snow lay within 0.5 m of the water's edge and showed no sign of water surge. Water temperatures were 24°C on 24 August, 29° on 17 September, and 25° on 21 October. Magnesium concentration in the water has remained unchanged since February, but chloride concentration has increased. The Mg/Cl ratio has gradually declined from 0.130 in February to 0.115 on 24 August and 0.113 on 17 September. Deformation surveys indicated no apparent summit inflation.
Volcanic tremor has been recorded for some time and peaked in early September. The NZGS interpreted the low [normal] tremor frequency and the unchanged magnesium concentration to indicate that magma is still deep beneath Crater Lake. The increased chloride concentration suggested that gas can freely vent into the bottom of the lake, and the slow rate of lake refilling suggested that no shallow magmatic intrusion had occurred.
Information Contacts: P. Otway, NZGS, Wairakei; I. Nairn, B. Scott, NZGS, Rotorua; A. Cody, F.R.I., Rotorua.
Moderate inflation; lake temperature lower
A NZGS deformation survey on 15 December showed a moderate degree of inflation. The distance between two stations on opposite sides of the 600-m-wide crater was 15-20 mm longer than on 17 September. About half the increase had occurred since 9 November.
The temperature of Crater Lake as measured at the outlet was 13°C, the lowest of the year. The lake temperature had been falling since the eruptive activity in January. Some intermittent upwelling was observed in the N part of the lake, but little or none in the center. Due to meltwater inflow, the lake was greener and less turbid than in October, and the magnesium and chlorine concentrations were lower. The Mg:Cl ratio was 0.115 on 21 October, 0.113 on 9 November and 0.109 on 15 December. The decline was attributed to lack of interaction between lake water and lava (lower Mg values), but some continued fumarolic input of Cl.
The NZGS team noted that similar periods of cooling lake water in 1979, 1980, and 1981 ended with rapid lake temperature increase accompanied by hydrothermal eruptions. They also noted that the inflation was moderate but probably significant, indicating that Ruapehu may enter a phase of renewed activity within the next few months.
Information Contacts: I. Nairn, NZGS, Rotorua.
Pattern of changes presages activity
NZGS personnel visited Ruapehu on 3 and 24 January. Crater Lake was clearer than in December, and was not steaming on either day. On 3 January, no upwelling was apparent over the central vent, but moderately strong upwelling was occurring from one of the vents at the N end of the lake, radiating discolored water and yellow-gray sulfur slicks. Lake temperature measured at the outlet was 22°C, 7° higher than on 15 December. The NZGS ascribed this to the significantly increased upwelling from the N vent, but also to reduced meltwater inflow. Reduced heat flow from the main vent was credited with the steady color change from gray to blue-green, as had occurred in the past.
On 24 January, upwelling was slight over the main vent and moderate over the N vent. A considerable number of sulfur globules were floating in the outlet area, where lake temperature was 20°C.
Although concentrations of magnesium and chlorine were higher on 3 January than in December, and lower on 24 January, the Mg:Cl ratio remained stable at 0.110 and 0.109 respectively, reflecting the generally low level of activity in the lake.
The 3 January horizontal deformation survey showed that the November and December inflationary trend had reversed. The 20-mm extension of the 600 m-wide crater that had developed between the 17 September and 15 December surveys had disappeared. The tilt-levelling survey detected no significant changes since the previous measurements on 17 September. However, a second deformation survey on 24 January revealed renewed extension. The distance between two stations on opposite sides of the crater was only 10 mm less than on 19 October. Analysis of deformation measurements since September showed greater changes than had been estimated, the most rapid changes recorded in recent years.
According to an NZGS tentative interpretation, the changing conditions at the volcano (table 1) indicate "strain release as a deep blockage (at about 1 km) of the vent was overcome in the latter part of December. The main vent may now be in an open state, and will possibly allow magma or gas to rise relatively freely. The degree of activity at the N vent is complex and is related to the degree to which the main vent is blocked as well as to the supply of heat from depth.
Table 1. Changing conditions at Ruapehu between September 1982 and January 1983. Deformation is measured between two stations on opposite sides of the crater (see figure 6). Lake temperature is measured at the outlet. Upwelling and Mg and Cl measurements are on last day of each interval.
| Interval | Deformation | Temperature Change (°C) | Main Vent Upwelling | North Vent Upwelling | Mg (ppm) | Cl- (ppm) | Mg/Cl- Ratio |
| 17 Sep-19 Oct 1982 | None | -4 (to 25) | None | Slight | 1022 | 8850 | 0.115 |
| 19 Oct-09 Nov 1982 | +8 mm | -4 (to 21) | None | None | 988 | 8725 | 0.113 |
| 09 Nov-15 Dec 1982 | +22 mm | -8 (to 13) | None | Slight | 900 | 8240 | 0.109 |
| 15 Dec-03 Jan 1983 | -50 mm | +9 (to 22) | None | Strong | 918 | 8350 | 0.110 |
| 03 Jan-24 Jan 1983 | +10 mm | -2 (to 20) | Slight | Moderate | 850 | 7785 | 0.109 |
"The pattern of low lake temperatures with no visible upwelling above the main vent combined with temporary inflationary expansion of about 20 mm is similar to that of July 1980 and August 1981. In both cases heating from the main vent recommenced 6-7 weeks later, followed by hydrothermal eruptions from the same site about a month after that. If the same sequence occurs on this occasion we can expect to see strong convection start from the main vent by the end of January or early February, and (provided excessive heat is not released by the N vent) eruptions may commence by early March. (However) . . . due to the now apparently relaxed state of main vent, the onset of renewed activity . . . may start with relatively quiet lake reheating."
Information Contacts: P. Otway, NZGS, Wairakei; I. Nairn, NZGS, Rotorua.
Possibly pre-eruptive changes continue
When NZGS personnel returned to Ruapehu 10-11 February, they found the lake turbid. It had been clear on their previous visit, 24 January. Upwelling was slight over the central vent with a trace of dark sulfur, and minor from two or three cells at the N end of the lake.
Thick strands of gray sulfur spheroids and some yellow teardrop shapes floated near the outlet. Fine-grained glass-foam fragments also were present in the floating material. Glass-foam appeared in May 1973; was produced in abundance during the April 1975 eruption; was found during the October-November 1977 eruptive period; and appeared in sulfur slicks on 21 February 1978. No glass-foam was found during the February 1980 or November 1981-January 1982 eruptive periods.
Lake water temperature at the outlet was 19°C, 1° cooler than on 24 January. The water's magnesium concentration had remained stable, but chlorine concentration had risen by 250 ppm, indicating to the NZGS a resumption of fumarolic activity. The Mg/Cl ratio was 0.106.
The horizontal deformation survey showed a 12-mm extension of the 600-m-wide crater as measured between 2 stations on opposite sides of the rim. After a period of rapid inflation, then deflation, the distance across the crater had returned to that of 19 October.
When NZGS personnel flew over Ruapehu 6 days later, the lake was relatively clear and a pale blue-green. Upwelling was absent over the central vent, but moderate at the N end of the lake, where 3 brownish cells were visible. The NZGS attributed the lake's rapid clearing (by sediment settlement) to cessation of heat flow from the main vent.
On 22 February the NZGS found the slightly steaming, calm lake a bright blue-green, with no upwelling over the main vent. Yellow and gray sulfur strands were drifting S from moderate upwelling over at least three locations at the lake's N end. Water temperature measured at the outlet was 23.5°C, up 4.5° from 10 February. The horizontal deformation survey showed shortening of 5 mm across the crater. Only 2 µrad of tilt had occurred since the last measurements on 3 January.
The level of volcanic tremor and B-type earthquakes was moderately high throughout January and [tremor peaked on 2 February]. Activity rapidly declined to a very low level 10-15 February. It remained low until 0845 on 23 February, when a B-type earthquake sequence with events of ML 3.0-3.1 was triggered by a magnitude 2.1 roof rock earthquake. On 24 February, the NZGS noted that "The increased seismicity and the recent changes in the appearance of the lake indicate that Ruapehu has entered a phase where the probability of eruption is now at a relatively high level. Visitors to the crater are being advised not to approach the lake too closely." A similar sequence of B-type earthquakes occurred 26 February at 2356. The series of magnitude 3.0-3.1 events was again triggered by a high-frequency roof rock earthquake, of magnitude 2.0. On 1 March at 0757, a third sequence of B-type events reached M 2.9. Depths for the 1 March events were estimated at 300-600 m beneath Crater Lake, somewhat shallower than usual. Weak volcanic tremor began 2 March at about 0500, at perhaps 300 m below Crater Lake. J. H. Latter noted that this probably represented gas moving toward the surface.
The Chief Ranger, Tongariro National Park, and pilot K. Newton both reported that the lake was gray early 24 February, but there were no signs of ash deposits or upwelling from the main vent. The NZGS interpreted the color change "as being due to a sudden, strong upwelling, possibly in the form of a hydrothermal eruption, following the shallow seismic events at 0845 on 23 February." By the 28th, the lake temperature had risen a further 3.5° in 6 days, to 27°C, and an additional 9 mm of shortening (deflation) was measured across the 600 m-wide crater. Moderate upwelling was noted from the N end of the lake but the water became noticeably clearer during 4 hours of observations. The lake was still milky gray when observed from the air 2 March, but only slight upwelling was occurring and there were no signs of recent eruptions.
Information Contacts: P. Otway, NZGS, Wairakei; J. Latter, DSIR, Wellington.
Deflation and B-type earthquakes
Viewing Crater Lake from the air, pilot K. Newton had reported the color was gray on 5 March, but was reverting to blue-green 3 days later. When NZGS personnel visited Ruapehu on 17 March, Crater Lake was gray. They found no evidence of recent eruptions; neither ash deposits nor surge marks. Upwelling over the N vent area was slight. Over the central vent no upwelling was visible, but thin black sulfur strands appeared in midafternoon.
Lake water temperature measured at the outlet was 23°C, 4° lower than on their last visit, 28 February. Concentrations of both chlorine and magnesium had risen slightly; the Mg/Cl ratio remained 0.104.
The horizontal deformation survey showed that the distance between 2 stations on opposite sides of the crater had decreased an additional 8 mm since 28 February, for a total contraction of 22 mm since 10 February.
Since seismicity increased 23 February, there have been 9 B-type earthquake sequences, the three reported last month plus others on 4, 7, 8, 9, 12, and 14 March. These sequences typically began with a high-frequency roof rock (tectonic) earthquake of about M 2 at a relatively shallow depth. Within a minute or so, this was followed by a deeper B-type (volcanic) earthquake of magnitude 2.9-3.4, at a depth between the focus of normal magmatic events (about 1 km depth) and those in the roof rock. No significant volcanic tremor has occurred since the earthquake series began. The lake's color changes appeared to correlate with the earthquake series.
The largest B-type earthquake in the series, [ML 3.25], occurred at 1406 on 12 March. According to J.H. Latter, earthquakes at Ruapehu have not in the past exceeded this magnitude in a closed-vent situation, as this appears to be, without an accompanying eruption.
The seismicity and deflation were tentatively interpreted by the NZGS as indicating a decreasing magmatic or gas pressure at a deep level below the N vents (or, less likely, intrusion occurring beyond the crater, resulting in compression of the crater rim). As long as the present seismicity persists, they consider the probability of eruption to remain higher than usual.
Information Contacts: P. Otway, NZGS, Wairakei; J. Latter, DSIR, Wellington.
Crater lake green; low pH of river water
When W.W. Chadwick visited the volcano on 18 April, the lake was mostly green, with extensive floating yellow and gray sulfur slicks. Minor upwelling, marked by a light gray patch, was occurring over the N vents; none was observed over the central vent. There was no evidence of recent eruptions or surging. Lake temperature measured at the outlet was 20°C, 3° lower than on the previous visit, 17 March. . . .
On 25 March the New Zealand Railways Communications Section, Taumaranui, reported an abnormally low pH for the Whangaehu River, which drains Crater Lake. Records showed a pH of 3.5 on 3 March, 4.0 on 11 March, 3.5 on 18 March, but 1.5 on 25 March. Chadwick interpreted the data as showing that Crater Lake was overflowing continuously during March and that a substantial increase in flow occurred toward the end of the month.
Information Contacts: W. Chadwick, NZGS, Wairakei.
Decreases seismicity; lake temperature lower
On 15 May, when NZGS personnel visited the volcano, Crater Lake was uniformly battleship gray. Faint upwelling over the central (main) vent was marked by black sulfur slicks. Weak upwelling was observed over the N vents. At the outlet there was no evidence in the new snow surrounding the lake of recent ash deposits or surging. Lake temperature measured at the outlet was 16.5°C, 3.5° lower than on the last visit, 18 April.
The horizontal deformation survey showed that since 24 April the maximum change in distance between pairs of stations around the crater was an increase of 17 mm. This distance, between stations on opposite sides of the 600-m-wide crater, had decreased 22 mm 10 February-17 March, then stayed virtually unchanged until 24 April. There has been little cumulative movement of the several survey stations during the past year, but three stations S of the lake have moved about 18 mm SE. Only 4.5 µrad of apparent inflationary tilt were recorded on the Dome since 22 February.
Sequences of B-type earthquakes occurred every 2-4 days in late February and March, but have been less frequent since then; only two B-type earthquake sequences were recorded 18 April-15 May. Small shocks, interpreted as tectonic, have occurred since 29 April. The largest was M 1.8 on 5 May. There have also been occasional episodes of weak tremor.
Information Contacts: P. Otway, NZGS, Wairakei.
Lake water characteristics unchanged; deflation
When NZGS personnel visited Ruapehu on 15-16 and 22 June, conditions at Crater Lake were very similar to those observed on 15 May. The lake color was battleship gray, and water temperature measured at the outlet remained 16.5°C. Concentrations of both magnesium and chlorine (750 and 7,455 ppm) were also virtually unchanged. Discontinuous sulfur slicks indicated intermittent up-welling over the main vent. Upwelling was also observed over three sites at the N end of the lake. According to the NZGS, the volcano has entered a phase of steady, but low activity.
Gray mud and yellow sulfur covering the outlet suggested higher recent rates of outflow, but snow lay within 30 cm of the water, indicating no recent large surges. Varying pH values measured by the New Zealand Railways Communications Section, Taumaranui, on the Whangaehu River, which drains Crater Lake, marked periods of strong overflow (low pH) alternating with little or no overflow (high pH).
The horizontal deformation survey on 22 June revealed a 20 mm decrease since mid May in the distance between stations on opposite sides of the 600 m-wide crater. Since the stations were installed in 1976, this distance had shortened to its 22 June length on only a few occasions (in early 1976 and several times in 1980 and 1981). The NZGS interpreted the shortening as deflationary contraction indicating low magmatic or gas prassure.
No volcanic (B-type) earthquakes were recorded [8 June through 21 August]. Bursts of possible moderate-frequency, moderate-amplitude tremor were recorded during the first half of June.
Information Contacts: I. Nairn, NZGS, Rotorua; P. Otway, NZGS, Wairakei.
Upwelling in crater lake; slight inflation
Inspections by NZGS personnel revealed no significant changes. On 15 and 21 July, and 16 August, Crater Lake appeared its usual battleship gray color. Moderate upwelling was observed over the vents at the N end of the lake, none over the central vent. Water temperature measured at the outlet was 18.7°C in July (2.2° higher than on 15 June), and 18.3° in August. Concentrations of magnesium (778 and 744 ppm) and chlorine (7,310 and 7,470 ppm) were virtually unchanged for the two months. Horizontal deformation surveys showed that by August the distance between two stations on opposite sides of the 600 m-wide crater had increased 16 mm from a 2-year minimum value measured in June.
Information Contacts: P. Otway, NZGS, Wairakei; B. Scott, A. Cody, NZGS, Rotorua.
Summary of 1984 activity
"1984, as with 1983, was characterized by a low level of eruptive activity from Crater Lake. The relatively high lake temperatures measured at the end of 1983 continued until 8 February when a maximum of 31°C was recorded. Lake temperature dropped gradually to 11.6°C in July, accompanied by the cessation of convection above the central vent area. Convection continued above the northern vent areas. When convection resumed from the central area in September, the lake temperature began to rise, reaching 21°C in October. The cessation of convection from the central vent area in December was accompanied by a temperature decline.
"The lake level was recorded at 0.5 m below overflow at the beginning of 1984 but was overflowing by 8 February. The discharge remained very constant (about 50 l/s) through the year, until the summer thaw induced a significant increase in the flow. Only one hydrothermal eruption (2 April) was positively reported during 1984."
Information Contacts: New Zealand Geological Survey.
Hydrothermal eruptions accompany seismic activity
After 3 years of quiescience, small hydrothermal eruptions began on or shortly before 21 May. On 16 May, major overflow of Crater Lake into the Whangaehu River began, as shown by pH and conductivity measurements downstream (at Tangiwai). Seismic activity, characterized by increased high-frequency tremor and local earthquakes, began [in early May, with some minor tremor on the 5th and small volcanic earthquakes on the 11th]. Eruptions were first observed in Crater Lake on 21 May and were also seen on 25 May.
On 28 May NZGS personnel noted 15 small hydrothermal eruptions during a 10-hour period. All the eruptions occurred in the lake center, where resumption of weak upwelling had first been observed on 26 April. The eruptions were characterized by updoming of the central lake surface, noisy ejection of water and mud jetting to 10 m above the lake surface, and waves radiating from the lake center. Clouds limited deformation measurements across the crater but a pair of horizontal angle observations indicated no major change in crater diameter.
The lake was battleship-gray in color, with clean snow around the water margin about 1 m above lake level. The lake temperature had increased to 45°C from the 20-25°C range of recent months. Interim analyses of the lake water show a progressive dilution throughout the summer months. Chlorine and magnesium contents have increased since activity began, but the Mg/Cl ratio has not changed significantly.
Information Contacts: I. Nairn and B. Scott, NZGS, Rotorua; P. Otway, NZGS, Wairakei.
Hydrothermal eruptions and seismicity
Small hydrothermal eruptions from Crater Lake, accompanied by increased seismicity, continued through early June. Geologists returned to the volcano on 4 June and found activity similar to that observed during the previous inspection on 28 May. However, the frequent minor hydrothermal eruptions that began on or before 21 May appear to have concluded, perhaps as early as 9 June.
Eight small hydrothermal eruptions from the central vent were noted during 8.5 hours of observations on 4 June. Water spurted to as much as 15 m above the vent, and waves surged onto the lake shore and through the outlet. One eruption generated a 100-m steam plume. Convective upwelling between eruptions was observed over an area approximately 50 m in diameter in the center of the main vent area, but was often obscured by steam. No activity was observed from the N vent. Lake temperature remained at 44-45°C but the eruptive activity was accompanied by a major drop in outflow rate to about 5 l/sec, from 200 l/s on 28 May. The lake surface remained battleship-gray in color, and new snow was trimmed back to about 0.5-1 m above lake level.
Geologists returned on 28 June and observed neither upwelling nor evidence of recent eruptions. Dark green sulfur slicks appeared from time to time in the central area but were constantly visible in the N vent area, accompanying faint upwelling there. Steam columns were formed by the large temperature differential (40°C) between the lake surface and the air. Lake temperature had declined 7° since 4 June. The water had dropped to 0.2 m below overflow level, and the channel was full of clean snow. Water samples were taken during both the June inspections.
The start date of this eruptive episode remain uncertain. A major overflow from Crater Lake began 16 May. From Whakapapa (about 9 km NNW of Crater Lake) at noon the next day (± 50 minutes), Quentin Forman of Auckland University heard a noise and saw steam rising from the direction of Ruapehu, but a ridge blocked his direct view of Crater Lake. The first observed eruptive activity was on 21 May. Uncertainty also surrounds the end of the eruption. After the 4 June eruptions reported above, P. M. Otway had a clear view of the volcano from Taupo (roughly 75 km from Ruapehu) on 9 and 11 June, but saw no plume. Steam clouds were seen over Ruapehu by geologists on 25 June (the day before they arrived at the crater) but were thought to have most likely been caused by atmospheric effects.
The eruptive activity was preceded and accompanied by weak seismicity in a wide vertical range beneath Crater Lake. Volcanic tremor associated with heating of Crater Lake began fairly strongly on 5 May at 0452 in the roof rock zone below the lake. The tremor had dominant frequencies of 1.5-2.5 Hz, usual at Ruapehu. A number of small volcano-tectonic earthquakes occurred around that time. The largest, magnitude 2.15 on 6 May, was at 2 km depth. Their amplitudes at the summit station were anomalously high [relative to those measured at the volcano's foot, indicating that they were unusually shallow or near the station]. Other similar events were associated with high-frequency volcanic tremor, suggesting to seismologists that magma was intruding the wall-rock north of Crater Lake conduit. Volcanic earthquakes (multiple events showing characteristic features attributed to an origin in magma or pockets of hot gas), which had begun to occur at shallower foci in September 1983, reached maximum magnitudes (2.25) on 11 May.
High-frequency volcanic tremor (superimposed on the 2 Hz tremor that started 5 May) first became conspicuous on 19 May at 2209, immediately after a M 2.9 earthquake ~10.5 km ESE of Crater Lake. This was the smallest of four earthquakes at the same focus: two others occurred on 19 May (both M 3.0), and one M 3.25 event on 20 May. The earthquakes were shallow, probably less than 2 km deep, on or very close to the prominent fault bounding Ruapehu on the SE side. A composite focal mechanism determination suggested right-lateral strike-slip on this fault, with a compressional component in the direction of the summit. Low-frequency volcanic earthquakes began on 25 May at 1519, culminating in a magnitude 2.4 roof-rock event at 1725, and were continuing 9 June. J. H. Latter noted that the episode is typical of an open-vent period of energy release at Ruapehu. He also noted that the data suggest that the present state of increased activity is similar to, but less intense than, the 1981-1982 period when similar events continued for 3-4 months without any major eruptions.
Preliminary results of deformation surveys indicate that no significant crater deformation has occurred in the last few months. NZGS geologists noted that this appears to be in accordance with the seismic interpretation of open-vent conditions during this episode.
Information Contacts: A. Cody, I. Nairn, B. Scott, NZGS, Rotorua; J. Latter, S. Sherburn, DSIR, Wairakei; P. Otway, NZGS, Wairakei.
Hydrothermal activity ceases; lake temperatures drop
Geologists returned to Crater Lake on 11 July and 5 August to monitor trends in lake temperature and crater deformation following June's increased activity.
In July, the lake was the normal battleship-gray color with some sulfur slicks at the central vent area, unchanged from late June. The lake temperature was 31.5°C (a 5.5° decline since late June) and the air carried a strong gas odor toward one lake outlet. The lake was about 0.5 m below overflow level and there was no evidence of recent large surges. No hydrothermal eruptions cccurred during the 4.5-hour observation period.
By 5 August, the lake color had changed to light gray and its temperature was nearly unchanged. There was no sign of convection at either of the two vents, and snow and ice were within 0.5 m of the lake surface. The lake had begun overflowing at 3 l/s.
Only a 15 ± 10 mm expansion across the N rim of the crater was reported on the 11 July inspection. Rapid but minor deformations were occurring in July, but their significance was uncertain.
Information Contacts: I. Nairn, NZGS, Rotorua; P. Otway, NZGS, Wairakei.
Crater lake temperature drops 10°C
Geologists visited Ruapehu on 13, 14, and 20 September. Crater Lake's temperature had declined by 10°C since 5 August. On 20 September the lake was 0.4 m below overflow level (it was overflowing on 5 August). There were no clear signs of any eruptions having occurred.
Information Contacts: P. Otway, NZGS, Wairakei.
Crater lake upwelling; higher temperatures
Park Ranger Paul Dale witnessed a large upwelling and surging of the lake on 31 October at 1342, lasting 30-40 seconds and producing [25 cm] waves on the shore. The lake temperature at 1405 was 26.5°C with an outflow rate of 150 l/s, a significant increase from the 20.0°C temperature and water level 0.1-0.2 m below overflow recorded on 17 October. Fresh ash was not present on the snow. Pilot Bruce Williams, flying just E of the mountain on 11 November at 1100, reported steam accompanying strong upwelling in the lake center. He considered the lake to be in the most agitated state he had observed since witnessing a relatively large eruption 4 years ago; the activity was also observed by a Geyserland Airways pilot.
During a 15 November inspection by NZGS personnel, the lake was gray with scattered yellow sulfur slicks, in contrast to the 17 October observation of dark concentric rings of sulfur. An upwelling of muddy water occurred at 1027, doming to 2 m above the lake surface, and generating steam and 0.5 m waves near the center of the lake. At 1336 water domed to 4-5 m, producing 1 m waves. The waves did not further erode the low-lying snow or generate significant surges in the outlet channel, illustrating the difficulty of detecting evidence for small events. The upwellings observed during the November inspection were smaller than some seen during a period of apparently similar activity in May (10:05). A minor inflationary extension measured on 17-18 October had reversed by 15 November. Tremor and volcanic earthquakes increased in magnitude in October. Seismic records 4-10 November included both low- (~2 Hz) and high-frequency (~5 Hz) tremor of generally low amplitude. Some small B-type events were recorded on 4 November and very shallow earthquakes (L-shocks) were common. During the geologists' 15 November observations, seismometers recorded low-frequency (2 Hz) tremor.
Information Contacts: P. Otway, NZGS, Wairakei.
Small hydrothermal eruption from Crater Lake
Hydrothermal eruptions, apparently accompanied by felt earthquakes, were observed 8 and 9 February. On 8 February at 1202, ranger Lisle Irwin saw a vigorous steam column rise > 150 m above Crater Lake and heard loud roaring from his vantage point 2 km to the NE. Inside Dome Shelter, ~350 m NNW of the lake, Rob McCallum felt what he described as a slight earthquake during the eruption. Irwin noted no fresh ejecta deposits around the lake after the eruption. At 1517, he observed a second apparently smaller eruption that produced a steam column and audible water surges over the lake's outlet channel. While flying over the crater the next day at 0719, ranger Paul Dale saw a small column of muddy water rising to ~5 m before it was obscured by steam. Between 1300 and 1330, two climbers saw a "high bubbling circle in the middle of the lake and at the same time felt the ground shake."
When geologists visited the crater 11 February, lake temperature had risen to 46°C (from 29°C on 14 January) and there was evidence of surging of 1 vertical meter or more within the previous 12-24 hours. Strands of sulfur were floating on the lake and there was a strong odor of SO2. Activity was similar on 14 February, and there appeared to have been additional but somewhat weaker surging in the preceding 24 hours. Deformation surveys 11 and 14 February suggested minor deflation since a small inflation peak was measured in mid-January. The lake temperature had dropped to 34°C by 26 February and there was no evidence of further eruptions.
Information Contacts: NZGS, Rotorua.
Crater Lake temperature rises after 5-month decline
Crater Lake had cooled 6.5°C/month since February, reaching 10.8°C by 31 July. Four similar periods of cooling have occurred during the last 6 years, three of them followed by minor hydrothermal eruptions 2-3 months later.
On 19 and 31 July, weak upwelling was occurring at the N end of Crater Lake. Yellow sulfur slicks appeared to emanate from the N vent area, with dark green slicks in the center of the lake. By the next visit, on 26 August, lake temperature had risen to 14.5°C. Lake appearance was similar to that of late July, with some weak upwelling over the central vent.
Deformation measurements on 31 July recorded only slight changes since the 8 May survey, including 13 mm of apparent shortening across the crater. Little additional change was measured 26 August.
Information Contacts: P. Otway, NZGS Wairakei; I. Nairn, NZGS Rotorua.
Crater Lake temperature increases from July low
Crater Lake temperature had increased to 23°C by 15 October ... . Upwelling over the main vent was first observed 15 October, while upwelling over the N vent was continuous since early September. Rapid oscillations of 2-7 cm in lake level were observed on 15 October, but there were no high surges, ash deposits, or other evidence of eruptions. Sulfur emissions were at background levels and lake color has remained battleship gray. The 15 October deformation data showed no significant changes since the July and August surveys.
Information Contacts: P. Otway, NZGS Wairakei.
Crater lake cools
Crater Lake cooled rapidly from 34°C on 20 November to 12°C on 17 December, reversing a continuous rise that began in late July (figure 7). On 17 December, geologists saw no sign of recent surging or upwelling, but lake-surface conditions hampered detailed observations. Most of the lake remained gray but areas along the N and E shores had cleared to a blue-green color. Sulfur slicks were observed in the center of the lake but no gas smell was detected. Slight deformation, consistent with continuing minor inflation, was recorded by electronic distance measurements (figure 7). The recent [heating] episode appears to have ended without a recorded eruption.
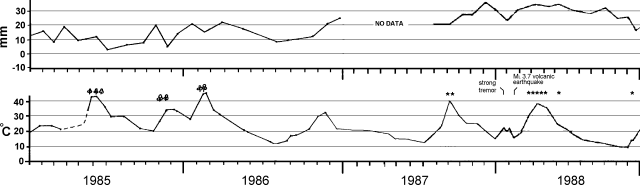 |
Figure 7. Distance change across the N part of the Ruapehu crater, January 1985-December 1989 (top). Crater width was 600.013 m when first measured in February 1976. Standard error is ±3 mm for a single survey. Lake temperature during the same period (bottom). Clouds above the temperature graph represent small hydrothermal eruptions. |
Information Contacts: P. Otway, NZGS Wairakei.
Crater lake temperature falls; some tremor
Activity remained at a low level when geologists visited the crater on 26 May. Crater Lake temperature had fallen to 14.2°C (from 19.0°C on 15 April) although it had probably been relatively stable since early May. Minor convection occurred over the main vent. No significant deformation was recorded.
After a long period of weak seismicity, tremor began on 21 May, increasing to maximum amplitude on 24 May (<10 mm, 0-peak), then decayed almost to background by 28 May.
Information Contacts: P. Otway, NZGS Wairakei.
Crater lake temperature increase; convecting lake water
Crater Lake temperature had increased from 11.5 to 24.5°C between visits by geologists on 3 July and 17 August. Convection of lake water was occurring at both the central and N vents on 17 August. Outflow had increased from 30 l/s to >200 l/s, and total heat flow from the lake had increased by a factor of 4 since the July visit, reaching ~180 MW.
No recent eruptions appear to have occurred and no significant deformation or seismicity has accompanied the lake heating. Lake temperature had been relatively stable after dropping rapidly between November and December 1986, but reached a low in July (figure 7).
Information Contacts: I. Nairn, NZGS Rotorua; P. Otway, NZGS Wairakei.
Small hydrothermal eruptions
Small hydrothermal eruptions were reported on 24 August as 1-m-high bubble-like updomings in the lake center. The upwelling generated waves and steam plumes. Steam plumes were also observed 29-30 August when several eruptions threw muddy water jets to >10 m above the lake surface. On 31 August lake temperature was measured at 40°C, up from 24.5°C on 17 August. During a 14 September inspection the lake was steaming strongly. The observed hydrothermal events did not appear to correlate with seismicity, which continued at generally low levels. The activity was regarded by NZGS personnel as part of the normal cycle of heatflow rather than precursory to a major eruption.
Information Contacts: I. Nairn, NZGS Rotorua; P. Otway, NZGS Wairakei.
Lake temperatures fall; minor inflation
. . . Crater Lake temperature fell. . . . to 28.5°C on 16 October. The lake was steaming and dark yellow-green (sulfur) slicks were periodically observed near the lake center. Deformation measurements indicated a minor 8 mm (inflationary) increase in crater diameter. Seismicity since 8 September has been dominated by low-amplitude 2 Hz volcanic tremor. No eruptive activity has been reported. During a visit on 28 September a geologist observed a seiche with amplitude of 50 mm and period of ~35 seconds. A similar seiche was observed on 17 October 1986.
Information Contacts: P. Otway, NZGS Wairakei; B. Scott, NZGS Rotorua.
Declining lake temperature; minor deflation
Crater lake temperature had declined to 17°C by 19 December, 10° lower than when last measured on 12 November. ... Geologists noted that although recent strong inflow of water into the lake had probably contributed to the temperature decrease, a color change suggested decreased heat flow. Minor deflation, following the period of gradual inflation that occurred through 1987, was recorded by the deformation survey. Seismicity has remained generally low since 12 November and there was no sign of recent volcanic activity.
Information Contacts: P. Otway, NZGS Wairakei.
Crater lake temperature increases but no eruption
Crater Lake temperature increased significantly during the first half of the month, reaching 23.5°C by 17 January, but declined to 20.0°C by 25 January. No eruptive activity occurred. Deformation and seismicity remained low.
Information Contacts: P. Otway, NZGS Wairakei.
Small phreatic eruptions
Small phreatic eruptions were reported 20-27 March, and lake temperature rose from 18.5°C on 1 March to 31.8°C on the 22nd. On 20 March at about noon, hikers heard a rumbling, avalanche-like sound, then noted that the surface of Crater Lake was agitated and partially obscured by steam. Between 1255 and 1300, two steam clouds appeared above the crater and quickly dissipated. Another phreatic eruption was photographed at about 1315. Some apparent high-frequency tremor had been detected on a nearby low-gain seismic instrument during the previous several hours. On 22 March at 1410, geologists observed an eruption from Crater Lake. A jet of muddy water rose 15 m or more above the surface, waves roughly 1-2 m high surged onto the lake's shore, and a steam cloud reached ~200 m height. No tremor was evident. A considerably smaller eruption was photographed at 1547. Another small eruption was reported on 27 March at about 1300.
Seismic data, available 21-24 March, showed semi-continuous, low-amplitude, 2-Hz tremor. Strong tremor was also reported on 24 February, and 3 and 10-13 March. B-type earthquakes were also recorded on 13 March. A tilt survey on 22 March showed little change since the last measurements in February 1987.
Information Contacts: P. Otway, NZGS Wairakei.
Minor phreatic activity from crater lake; tremor
Minor phreatic activity . . . continued through mid-April. During a 5-hour visit by geologists on 12 April, one small eruption was observed, generating 1-2 m of updoming and a 100-m steam plume. Lake temperature was 38.5°C, 7° higher than three weeks earlier. No significant deformation was detected. Data from one seismic station starting 30 March showed low-amplitude 2-Hz tremor through 3 April. None was detected 4-5 April, but similar tremor resumed late 6 April. Tremor stopped for 2.5 hours early 7 April, then resumed and gradually built to a large 4.5-minute volcanic earthquake that saturated the instrument. Low-amplitude tremor continued for ~8 hours. Little tremor was recorded the next two days, but low-amplitude tremor was again recorded 9-11 April.
Information Contacts: P. Otway, NZGS Wairakei.
Phreatic activity subsides
The occasional minor phreatic activity . . . continued through late May, then stopped as Crater Lake cooled substantially. Since the observed 12 April activity, small eruptions occurred around mid-day on 16 April, and steam clouds were observed above Crater Lake at 1000 on 19 April and 0956-0958 on 3 May. Low-amplitude 2-Hz tremor was observed daily 12 April-2 May. Geologists visited the crater 3 May, 1 June, and 21-22 June. On 3 May, total heat flow remained elevated at 290 MW (compared to 120 MW on 25 January). Crater Lake temperature was 36.5°C, a decrease of 2.3° since the last visit 12 April. Distinct convection cells with yellow-green slicks were present above several of the N vents.
A volcanic earthquake recorded at 0515 on 29 April was preceded by 1 hour of seismic quiet. Low-amplitude 2-Hz tremor with a number of small discrete earthquakes continued through May. From 24 May until 0800 on 26 May, there were 50-100 small high-frequency tectonic events that ceased when strong 2-Hz tremor began. Tremor persisted until 31 May. By 1 June, Crater Lake temperature had dropped 11° to 25.5°C, equivalent to a surface heat flow of 160 MW. Weak upwelling cells with yellow slicks were seen in the lake's N end. Minor phreatic eruptions had occurred between 21 and 28 May, possibly associated with the 24-26 May seismicity. By the 21-22 June visits, phreatic activity that began 20 March had ended. Crater Lake temperature was 22.5°C, down 3° since 1 June. No central vent upwelling occurred and N vent convection had weakened. Since early June only minor tremor had been recorded and no volcanic earthquakes were detected.
Cumulative 3-year extension of a crater EDM line totaled 28 mm. Monthly surveys indicated that this inflation accumulated from a series of four short-lived inflationary-deflationary pulses (October 1985, January & November 1986, and August 1987) associated with significant Crater Lake heating episodes that culminated in minor phreatic eruptions. Negligible deformation recorded by outer stations suggests no lasting deep magmatic movements since early 1976.
Information Contacts: I. Nairn and B. Scott, NZGS Rotorua; P. Otway, NZGS Wairakei.
Coldest recorded crater lake temperature
When geologists visited Ruapehu on 15 September, Crater Lake's temperature was 10°C, a decrease of 4° since August and the lowest temperature on record. Geologists attributed this decrease to continuing low heat flow aided by recent cold weather. No central convection was evident in the lake . One of at least three remaining convection cells in the N portion of the lake produced a strand of yellow sulfur. Since mid-l986, Mg/Cl ratios have remained near 0.06-0.07, suggesting heating of the lake by steam rather than by direct magma-water interaction.
Geologists noted that similar slow declines in activity over the past 8 years have usually been followed closely by rapid lake reheating.
Information Contacts: P. Otway, NZGS Wairakei.
Crater lake eruption ejects ash and blocks
The longest recorded period of low Crater Lake temperatures was interrupted by a moderate eruption on 8 December. Earthquakes started at 0843 that morning after a month of weak seismicity [but see 14:01]. The third event, at 0903, was followed by the onset of 2-Hz tremor. Just 1-2 minutes before the 6th and strongest earthquake (M [3.6]) at [1011], white steam clouds rose in 2-3 pulses to a short distance above the crater lake before being blown NE by strong winds. No ash was evident in the clouds but a thin veneer of dark gray wet ash extended 1.1 km NE of the crater lake (figure 8). Swirling patterns and feathered edges in the airfall zone suggested deposition from a turbulent cloud. Most blocks fell within 100 m of the lake, producing many impact and melt craters up to 1 m across. Most of the blocks consisted of altered andesite; no juvenile bombs were found. No fresh glass was evident in samples of fine-grained tephra. The ash was dominantly silty silica particles and aggregates mixed with solid sulfur globules and spheroids, plus a few fine andesite grains and plagioclase fragments. Ash and water on the upper Whangaehu Glacier formed a small mudflow, only a few meters wide, that extended ~500 m downslope.
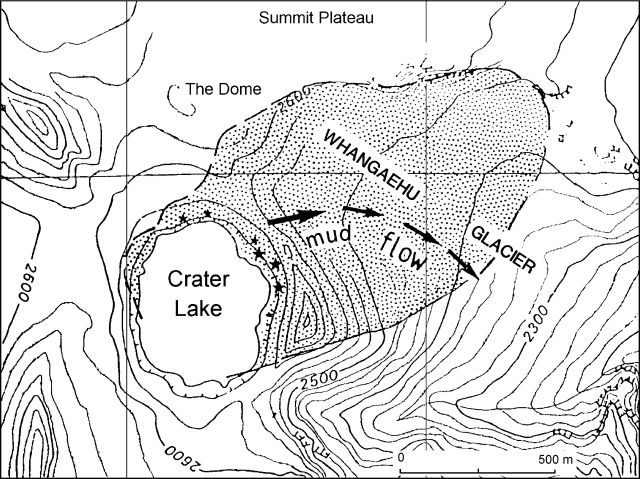 |
Figure 8. Ashfall (stippled), mudflow (arrows), and sites of greatest block concentrations (stars) from the 8 December 1988 eruption of Ruapehu. |
Lake temperature was 13.7°C the day after the eruption, only slightly above the record low of 9° measured during previous fieldwork on 14 November. Only minor deformation changes had occurred since 14 November. Semi-continuous to continuous 2-Hz tremor was observed on seismic records through 12 December, and 8-10 low-frequency earthquakes occurred 9-10 December.
Information Contacts: I. Nairn, P. Otway, B. Scott, and C. Wood, NZGS Rotorua; S. Sherburn and B. Christenson, DSIR Chemistry, Wairakei.
December seismicity reviewed; lake temperature rises
J.H. Latter reports that the [8 December] eruption was preceded by nearly continuous [weak, high-frequency (3-4 Hz)] volcanic tremor that began gradually on 2 December. At 0806 on the morning of the eruption, high-frequency tectonic earthquakes began [in the roof- and wall-rocks surrounding the source of volcanic earthquakes below Crater Lake]. Volcanic earthquake sequences were recorded 0844-0850 and 0903-0911 (before the eruption) and at 1010 (1-2 minutes after the eruption). Events of the main sequence at 1010 were initially relatively deep, but migrated upwards in < 10 seconds to within a short distance of the surface, just N of the lake. Tremor was strongest after the eruption from 1100 to 1500 and continued until 16 December. After about 18 December, seismicity gradually decreased to background levels. However, at about noon on 10 January, a series of sporadic, powerful, tremor episodes began, suggesting renewed gas movement.
Field observations 16 December showed little change in lake temperature or chemistry (Mg and Cl contents) since the eruption; however, effervescing rapids at the outflow area suggested a relatively high CO2 content. Slight convection in the lake on the morning of the 16th had increased to a slow continuous upwelling from the central vent by afternoon. The lake temperature was 14°C.
On 11 January, the N vent area was convecting with unusual strength, and six upwelling cells produced yellow sulfur slicks. At about 1400, strong convection began over the central vent. Lake temperature had increased to 27°C. Mg/Cl had increased by 0.007 since the 8 December eruption. This increase suggested that deeper, hotter fluids had been discharged into the lake, or that upper-level vent rocks had been exposed to more reactive fluids. Deformation remained low. On 13 January at 1230, ski lift personnel saw steam rising above the volcano. Geologists noted that on eight occasions since 1980, small phreatic/hydrothermal eruptions have followed within 3-7 weeks of episodes of rapid lake heating (at 15-20°C/month). The most recent occurred July-August 1987 and March-April 1988.
Information Contacts: J. Latter, DSIR Geophysics, Wellington; B. Christenson and S. Sherburn, DSIR Wairakei; P. Otway, NZGS Wairakei.
Lake temperature rises; small phreatic explosions
When geologists visited the volcano 24 January, there was no evidence of recent eruptive activity in the crater area. The lake temperature was 32°C, an increase from 27° on 11 January and 13.7° after the 8 December eruption. Discontinuous convection over the central vent produced a black sulfur slick while very weak convection produced a yellow slick over the N vent. Dissolved Mg and Cl contents in the lake continued to increase, with Mg/Cl decreasing slightly from 11 January values. Strong SO2 fumes were noted above the outflow area. From about 27 January through the end of February, minor phreatic eruptions similar to those of April 1988 were reported. Geologists noted that phreatic activity at Ruapehu seems to begin when the lake temperature approaches ~30°C.
On 10 February, Crater Lake's temperature was 39°C, and it was 42.5°C by the 26th. There was no evidence of recent moderate-large eruptions. The lake surface was covered with steam but no eruptions were observed. Several fresh sulfur strandlines, ~10-15 cm above the lake level, suggested that any recent eruptions produced only small waves. Mg/Cl had increased slightly from the 24 January sampling. Steam clouds were sighted above the volcano on four days in late February.
Sporadic 2-Hz tremor episodes that began 10 January were continuing as of 12 February. Tremor amplitude increased on 20 January, but returned to more normal levels the next day. Seismicity since 24 January (3 days before the first eruption of the year was reported) remained low. EDM observations showed only small changes since 11 January.
Information Contacts: B. Christenson and S. Sherburn, DSIR, Wairakei; P. Otway, NZGS Wairakei.
Small phreatic explosions end; heat flow drops abruptly
Minor phreatic eruptions were reported from late January through February, but only steam emission has been reported since then. Crater Lake's temperature dropped from 42.5°C on 26 February to 32° on 22 March, and 31.3° on 6 April, suggesting to geophysicists that heat flow through the lake had dropped by roughly an order of magnitude. A continuous temperature monitor was installed near the Crater Lake outlet on 21 March. Minor inflation that had accumulated across the N crater rim between 26 February and 22 March had nearly disappeared by 5 April. Seismic records in March and early April showed little or no tremor or volcanic earthquakes.
Information Contacts: P. Otway, NZGS Wairakei.
Heat flow declines
Since February, no discrete eruptions have been reported although steam passively rising from Crater Lake has occasionally been witnessed. When geologists visited the volcano 21-22 March, slight upwelling in the N vent area formed broken sulfur slicks. Crater Lake's temperature had fallen to 32°C (a 10.5° drop over 23 days) representing a decline in heat flow to ~10% of its previous rate. Lake level had decreased to 100-150 mm below overflow. Lake chemistry was stable, showing little change in Mg/Cl since 11 January. Minor inflation was measured across the N crater rim. On 5 April, geologists observed slightly increased upwelling in the N vent area. The lake temperature was 31.3°C. N-rim inflation had largely disappeared. NZGS geologists noted that some previous pulses of inflation/deflation have been followed by renewed lake heating (or strong seismicity). Few tremor episodes and volcanic earthquakes were recorded on seismic records through . . . 5 April.
Information Contacts: P. Otway, NZGS Wairakei.
Small phreatic eruption
The first reported phreatic eruptions from Crater Lake since January-February 1989 began in early July. Small steam explosions up to 200 m high were observed 1-3 July (the first at 1300 on the 1st) by climbers and two conservation officers. The explosions followed a week of volcanic tremor that first appeared 25 June and remained strong until declining in early July. Preliminary examination of seismic records showed no eruption signals.
During geologic field work on 24 July, Crater Lake appeared gray with dark surface slicks. A small phreatic eruption, accompanied by a relatively sharp detonation, occurred at about 0942. Twenty seconds later, the lake level fell 1 m, then passively rose to ~0.5-0.6 m above overflow and receded a similar amount. A 1-1.8 m wave soon washed onto the shore, succeeded by several smaller waves in the next 5 minutes. Ten minutes after the eruption, the lake temperature was 33.7°C, and by 1240, it had risen to 35.4°C, a sharp increase from 13.8°C measured on 14 June.
Deformation measurements indicated no significant change in the crater diameter. The Cl content of lake water collected 24 July was 694 mg/kg, higher than in samples collected 14 June, interpreted by geologists to indicate an increase in fumarolic activity but no apparent contact of lake water and fresh lava. The present activity appeared typical of at least three earlier episodes over the past two years in which a sudden 10-fold increase in the heatflow through the vent caused rapid lake heating and phreatic eruptions (figure 9). Due to generally poor weather, it is not known if minor eruptive activity has occurred continuously since early July.
Information Contacts: B. Scott, NZGS Rotorua; P. Otway and S. Sherburn, DSIR Wairakei.
Upwelling in crater lake; inflation stops
When geologists visited Ruapehu on 17 November, Crater Lake temperature was 23°C, a decrease from 25°C on 19 October. Chemical concentrations in the lake remained stable, but lake color had changed from pale gray in October to pale blue green. Three small brown upwelling cells over the N vent formed yellow sulfur strands. Upwelling over the central vent formed a gray slick, which had spread over ~80% of the lake by a 22 November overflight. Only minor seismicity was observed after 20 September. Minor deflation was measured between 19 October and 17 November, reversing the inflationary trend recorded in September and October. Within the past two years, three similar inflationary pulses recorded during declining lake temperatures have been followed 3-4 months later by episodes of renewed lake heating and small eruptions (figures 7 and 9).
Information Contacts: P. Otway, DSIR Wairakei.
Phreatic eruptions from crater lake preceded by three hours of increased tremor
The first phreatic eruptions since July 1989 began in January, with episodes on the 7th (1215-1230), 12th (1100 and 1355), and 14th (1000, 1200, and 1232). The eruption at 1232 on the 14th sent water to 3-5 m and a nearby rockfall suggested that it may have been preceded by a small earthquake.
Intermittent 2-Hz tremor was recorded 30 December 1989-12 January 1990, and 5 hours of 1-Hz tremor, believed to reflect a deeper source, began on 10 January at 2300. Tremor amplitude increased ~3 hours before the 7 January eruption, but no changes accompanied the eruption, and geologists did not believe that the tremor increase was significant. A new episode of lake heating began around 5 January as Crater Lake's temperature rose from ~15°C on the 5th to 27° on the 11th.
When B. Scott flew over Ruapehu on 7 January at about 0915, a black slick, 100 m in diameter, covered the center of Crater Lake. The remainder of the lake was uniformly gray except for an area (50-100 m wide) of blue-green water extending from the NW through the NE quadrant. Later that day between 1215 and 1230, the first phreatic eruption ejected steam and water to 50-60 m, with a steam cloud 200 m in diameter. The activity turned the lake gray and formed a sulfur strand on the shore.
During 11 January fieldwork, sulfur strands up to 5 m from the lake's edge (~0.75 m above the current lake level) gave further evidence of the 7 January eruption. Lake temperatures of 25.3 and 26.8°C were measured at two locations. The lake was battleship gray and minor upwelling at the N vents formed a yellow slick. Upwelling over the main vent that produced a dark area strengthened by midafternoon, and at 1611 a 10-20-second audible burst of upwelling occurred.
Information Contacts: P. Otway, DSIR Wairakei.
Phreatic eruptions continue; Crater Lake temperatures highest since 1982
Eruptions and vigorous upwellings continued throughout January, with the latest episodes reported on 23-26 and 31 January. The lake temperature continued to rise, from 27°C on 11 January to 46.7°C on 1 February. No significant changes in lake chemistry, deformation, or seismicity were observed.
During fieldwork on 26 January, the lake was battleship gray and visibly convecting from the central and N vents, which were surrounded by black and yellow slicks, respectively. Water temperature was 42.1°C (at the outflow). Within 4 hours, geologists witnessed five episodes of phreatic activity at the central vent. A 1-2-m updoming of the lake surface occurred at 1232. Two minutes later, a vigorous steam eruption ejected a dark gray, 5-m, superheated steam plume, 4 m in diameter. A 30-minute eruption at 1332 was followed by a small, 25-second, audible upwelling. The largest eruption, at 1519, ejected a 25-m-wide superheated column to ~30 m, cored by black, suspension-laden fluid. The diffuse steam column rose several hundred meters. Water surged onto the lake shore, washing ~3.0 m above the outlet.
Crater Lake appeared similar when next visited on 1 February. One small phreatic episode at about 1153 produced upwelling to ~10 m above the lake surface, followed by a decrease in lake outflow. The maximum temperature measured by thermocouple was 46.7°C (at the outlet).
Seismicity was generally typical of recent Crater Lake heating episodes. Continuous, moderate to strong, 2-Hz and occasional 1-Hz tremor was recorded through early February. Small high-frequency earthquakes sometimes accompanied eruptions but appeared unrelated to the activity. No discrete volcanic earthquakes were recorded.
Geologists noted that characteristics of the current lake heating episode were slightly different from those of the early 1980's. Although the lake has reached its highest temperature since 1982, Mg/Cl ratios have persistently declined, suggesting continuous introduction of HCl into the lake, with little or no exposure of fresh rock to reactive vent fluids. The present low deformation is consistent with an open vent situation and suggests no recent intrusion of magma.
Information Contacts: B. Christenson, DSIR Wairakei; B. Scott, NZGS Rotorua.
Phreatic explosions stop; increased tremor
Phreatic eruptions had apparently stopped by 1 February. A possible eruption cloud was reported on 19 March, but a field inspection that day revealed only steam rising from the lake surface. There was no evidence of recent surging associated with small eruptions. Crater Lake was battleship gray with yellow and gray sulfur slicks. No convection was observed over the main vent, and only faint upwelling could be detected over the N vents. The lake temperature had cooled to 34.1°C from 46.5°C on 6 February. A sizeable lake had formed in an area of ice collapse in the valley draining Crater Lake to the S. Since 1 February, the lake had grown from ~60 ± 15 m to 100 ± 30 m. Sudden release of the lake could cause flooding in the Whangaehu River.
Volcanic tremor gradually declined in February, nearing background levels by 8 March. Continuous tremor with fairly uniform amplitude changed to bursts of tremor alternating with periods of quiet, similar to small volcanic earthquakes. On 8 March, tremor increased to high levels and broadened its frequency range, with 1 and 1.5 Hz tremor in addition to the usual 2 Hz signal. Tremor remained strong for 2-3 days before declining to more moderate amplitude. During the period of strongest activity, 6-hour energy release reached 400-1,400 x 104 joules, exceeding levels that accompanied the January 1982 eruptions, but less than in September 1982, when there were no eruptions and declining lake temperature. Tremor increased again on 16 March, almost to the level of 8 March, but by the 22nd had decreased to moderate-strong amplitude. EDM measurements on four lines across the N portion of the crater detected only small (<7mm) changes since the 1 February survey.
Information Contacts: P. Otway, DSIR Wairakei.
Crater lake temperature drops; tremor amplitude fluctuates
Fieldwork on 12 April revealed that the temperature of Crater Lake had dropped to 29.5°C, continuing a decline from 34°C on 19 March and an 8-year peak of 46.5° on 6 February. Upwelling occurred from three vents in the lake's N vent area, from which yellow sulfur slicks were drifting SE. Chemistry of lake water indicated that HCl-bearing steam was the lake's dominant thermal input. Deformation measurements revealed only minor changes.
Tremor amplitude declined in late March, was increasing again by the beginning of April, then declined toward mid-month. Low-frequency tremor remained uncommon, with 1-Hz signals recorded only on 7 and 8 April.
Information Contacts: P. Otway, DSIR Wairakei.
Hot blocks emerge onto lake surface after increased seismicity and lake level rise
Hot, buoyant blocks rose to the surface of Crater Lake on two occasions during 17 June fieldwork. Both episodes were associated with increased seismicity. However, lake temperatures continued their decline of the past several months.
Filling of the lake's outlet pond was noted between 1242 and 1244, indicating a rise in lake level estimated at ~0.15 m (equivalent to a volume of ~3 ± 105 m3). A steaming object surfaced above the main lake floor vent at about 1245 without noise or upwelling of discolored water. Within the next 2 minutes, several similar but much smaller fragments, all steaming, rose ~20 m from the first object. Through a telescope, the larger block appeared pale gray with deep surface cracks, similar to a pumiceous breadcrust bomb. Steam emerged vigorously from a single orifice on the large block. The smaller blocks sank within 5-10 minutes, but the larger one remained on the surface for ~15 minutes, and was still steaming, although less vigorously, when it sank. Lake level dropped during the episode. Data from a 1970 bathymetric survey indicated that depths to vent areas at the bottom of the lake were roughly 60-80 m (Hurst and Dibble, 1981) [but see 15:07].
A second, smaller, temporary rise in lake level began at about 1439. Two large steaming blocks broke the lake surface 1 minute later, soundlessly but with enough vigor to cause small waves to radiate outward. During the next 3 minutes, three much smaller blocks surfaced over an area at least 50 m across. Diameters of blocks were estimated at 0.2-1 m, and they rose to 0.2 m above the surface. The blocks again had a breadcrust bomb appearance and all steamed vigorously from one or two openings, but moved very little while at the surface. Sinking occurred in order of ascending size, with the largest block remaining at the surface for ~15 minutes. Geologists noted that similar activity in January 1980 ended a period of lake cooling and marked the onset of a period of phreatic eruptions.
A series of small to moderate volcanic earthquakes began early the same day (table 2). An earthquake that began at 1239 and continued until 1244 triggered a period of moderate volcanic tremor and coincided with the first block ejection episode. No volcanic earthquakes were recorded during the second episode. Before the 17 June seismicity, local volcanic earthquakes had last been recorded on 17 May (M 2) and 16 April (M 1.8). Although such earthquakes have been rare in 1990, small bursts of tremor, resembling volcanic earthquakes, have been common at times.
Table 2. Volcanic earthquakes at Ruapehu, 17 June-early 18 June 1990. Times mark peak signal amplitude for a given event. [JL magnitudes estimated by J. Latter from HZ digital records.]
| Date | Time | Magnitude | Comments |
| 17 Jun 1990 | 0344 | 2.0 | -- |
| 17 Jun 1990 | 0349 | 1.9 | Ended a period of tremor. |
| 17 Jun 1990 | 0953 | 1.7 | Started a brief period of tremor. |
| 17 Jun 1990 | 1242 | 1.7 | Started a period of tremor; coincided with lake level rise just before buoyant block ejection. |
| 17 Jun 1990 | 1557 | 1.8 | During a period of moderate tremor. |
| 17 Jun 1990 | 1720 | 1.9 | During a period of moderate tremor. |
| 17 Jun 1990 | 1955 | 2.1 | During a period of moderate tremor. |
| 17 Jun 1990 | 2230 | 1.4 | During a period of moderate tremor. |
| 18 Jun 1990 | 0134 | 1.6 | During a period of moderate tremor. |
Deformation measurements suggested minor inflation across the crater (figure 9, top). Lake temperature continued its gradual decline, to 23.5°C on 17 June, down from 46.5° on 6 February (figure 9, bottom). A 2% rise in the lake's chloride content accompanied by a slight decline in Mg values dropped the Mg/Cl ratio to 0.053, the lowest value yet recorded at Ruapehu. This trend suggested to geologists that the vent remained essentially closed, with the vapor phase (including HCl gas) rather than the liquid phase (including Mg++ ions) strongly dominating influx into the lake.
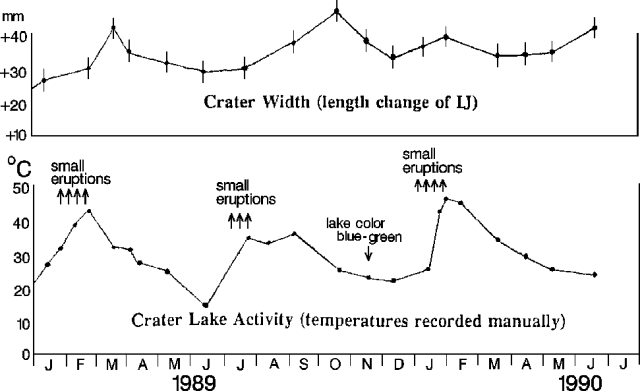 |
Figure 9. Crater lake temperatures at Ruapehu (bottom), and change in length of an EDM line (IJ) across the crater (top), January 1989-October 1990. Arrows mark eruptions. |
Reference. Hurst, A.W., and Dibble, R.R., 1981, Bathymetry, heat output and convection in Ruapehu Crater Lake, New Zealand: JVGR, v. 9, p. 215-236.
Information Contacts: P. Otway, DSIR Wairakei.
Tremor declines after buoyant block eruption; Crater Lake temperature drops
Crater Lake temperature (measured by a continuously recording Temtrac data logger) rose 3° to 27.5°C during the seven days that followed the ejection of hot buoyant blocks on 17 June, then fell steadily, reaching 21° on 20 July. Tremor amplitude decreased after 17 June, and tremor had disappeared from seismic records by 1 July.
During fieldwork on 20 July, Crater Lake was steam-free but turbid (battleship gray), with upwelling at the N vent and some slight upwelling at the lake's center. The lake's Mg/Cl ratio showed a slight increase (to 0.054), perhaps associated with the increased late June heat flow. However, the Mg/Cl data did not suggest significant lava extrusion onto the lake floor around the time of the 17 June activity. EDM data indicated reversal of deformation trends noted 17 June, and cumulative changes 10 May-20 July were generally small.
In BGVN 15:06 we cited a 1970 bathymetric survey that gave depths of 60-80 m to vents in Crater Lake. However, 1982 soundings yielded depths exceeding 180 m in a cone-shaped central eruptive area (Nairn and others, 1982). Nairn notes that the pressure change from lake bottom to surface would exceed 40 bars, requiring slow rise rates if blocks such as those that rose to the lake surface on 17 June are to survive without fragmenting from internal gas pressure. Such floating blocks would therefore be diagnostic of very low-energy, low-velocity phreatic events that only just reach the lake surface.
Reference. Nairn, I.A., Scott, B.J., Otway, P.M., and Cody, A.D., 1982, Depth measurements in Ruapehu Crater Lake: Volcano News, no. 12, p. 3.
Information Contacts: I. Nairn, NZGS Rotorua.
Crater Lake temperature increases; tremor resumes; inflation
Crater Lake temperatures had risen to 25°C (at the Outlet) and 27° (at the logger site) on 22 August, compared to 20 and 21°C respectively during 20 July fieldwork. Convection above the lake's center was indicated by dark slicks, while yellow slicks were present over the N vents; the rest of the lake was battleship gray. Clearer visibility on 29 August confirmed central vent convection that produced dark yellow-green slicks. Steam rising from the lake formed an impressive column by 1330, when it was reported to the Dept of Conservation as a possible eruption by the crew of a commercial airliner. Lake water collected 22 August showed declines in Mg and Cl contents of 1.4% and 7.2% respectively since 20 July. The Mg/Cl ratio continued to drop (to 0.051) indicating continued steam discharge into the lake with little or no liquid phase input from the vent.
After a month with little or no tremor, amplitude rose to low-moderate levels for ~2 weeks beginning 1 August; after the 15th, only low-amplitude tremor has been recorded. A series of small to moderate volcanic earthquakes (maximum ML 2.1) was recorded, mainly between 2 and 5 August, and a short episode of low-frequency tremor occurred 10 August. Deformation measurements showed extensions of as much as 21 mm across Crater Lake between 20 July and 29 August.
Information Contacts: B. Scott, NZGS Rotorua; P. Otway, DSIR Wairakei.
Crater Lake temperatures rise then fall; seismicity remains low; deflation
Fieldwork on 11 and 26 September, and 9 October, monitored changes in deformation and in Crater Lake. The lake appeared gray, with upwelling occurring over the N vents during all three visits, over the central vents on 11 September (when visibility was poor), and on rare occasions on 9 October. Yellow slicks were observed over the central vents on 26 September and 9 October. Undercutting of snow along the shore of the lake (around 1 m above lake level) and the wide channel cut through snow at the outlet, suggested that a surge (potentially related to minor phreatic activity) had occurred sometime before new snow (which may have fallen on 8 September) re-covered part of the exposed area.
Water temperatures increased to a maximum of 35°C by the end of September ... then decreased to 31°C by 9 October (figure 9). Lake Mg/Cl ratios were 0.052 on 26 September and 0.053 on 9 October, slightly higher than 22 August (0.051).
Seismicity has remained at very low levels since late August. A few small earthquakes (M <= 2.5) were recorded (instrument failure prevented monitoring 28 September-3 October). Tremor amplitude was low, except on 14-15 September when moderate amplitudes were recorded (figure 10).
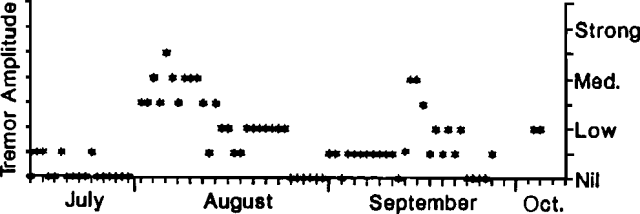 |
Figure 10. Qualitative ampliude of tremor at Ruapehu, July-October 1990. |
Deformation measurements showed that the decrease in crater width that began in early September continued through early October, although distances had not yet returned to pre-inflation, early July values (figures 9 and 11).
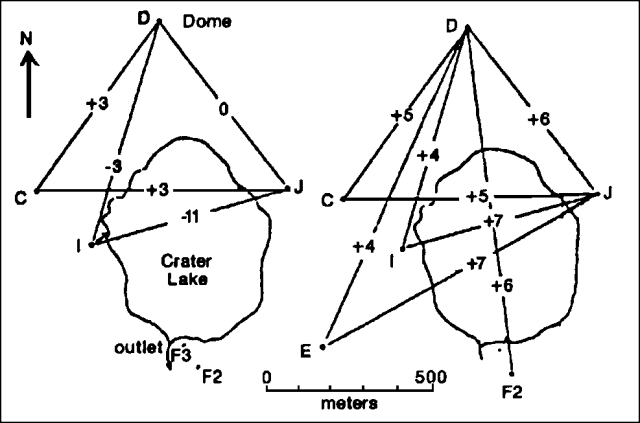 |
Figure 11. Apparent deformation (in millimeters) at Ruapehu, 22 August-9 October (left) and 20 July-9 October 1990 (right). |
Information Contacts: B. Scott and I. Nairn, DSIR Rotorua; P. Otway and S. Sherburn, DSIR Wairakei; J. Allen and R. O'Brien, Dept of Conservation, Whakapapa.
Lake temperatures decrease, then stabilize
Crater Lake temperature continued to decrease ... to 24°C at the end of December, then fluctuated between 24 and 27°C through 21 March (figure 12). Several dips to 20°C were believed related to heavy rainfall. Upwelling and occasional yellow sulfur slicks were observed above the N vents, although no activity was detected above the central vents. The Mg/Cl ratio decreased from 0.053 on 9 October to 0.046 on 27 December, then ranged between 0.45 and 0.50 during 18 January-21 March.
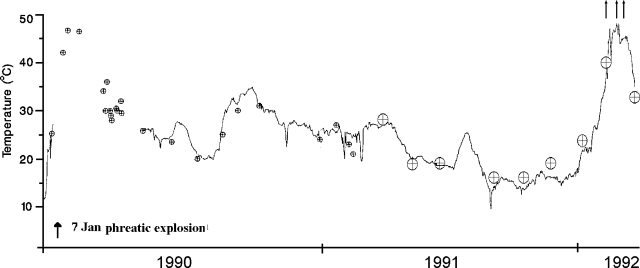 |
Figure 12. Crater Lake temperatures at Ruapehu, January 1990-24 March 1992, from a continuously-recording instrument (curve) and individual measurements by geologists (circled crosses). An arrow marks the January 1990 phreatic explosions. |
Seismicity has remained low since August. Low levels of 2-Hz tremor were recorded until early February, when low to moderate levels of 3-Hz tremor began. Until early 1988, 3-Hz tremor usually occurred during periods of high lake temperatures, but this pattern is no longer evident. Deformation measurements showed that the crater width was stable from 9 October with minor shortening measured 8 February-21 March.
Information Contacts: B. Scott, DSIR Rotorua.
Lake temperature rises; possible minor eruptions
A brief period of strong heating in Crater Lake was accompanied by small volcanic earthquakes and possibly by minor eruptions. Continuously recorded lake temperature data showed a gradual decline to 16°C by mid-June, then little change until a sharp increase began about 1 July. Temperatures reached 24.4°C on the 18th before declining again to 13° by late August. A series of small volcanic earthquakes occurred 5-14 July, none exceeding M 1.8.
Severe winter weather limited observations near the time of the increased activity, although the lake appeared normal on 11 July. When briefly observed on 12 August, evidence of 1-2 m of surging was visible under fresh (about 10 August) snow around the lake margin. More detailed observations during fieldwork 27 and 29 August revealed dirty, ash-covered ice under fresh snow 1-2 m above lake level, and widening of the lake's outlet channel by previous strong outflow or surging. No clear patterns were evident in summit-area deformation data.
Information Contacts: P. Otway, DSIR Wairakei.
Crater lake temperature increases, then small explosions through lake; strong seismicity
Low activity and low water temperatures (14-17°C) persisted at Crater Lake through October-December, and seismicity was at background levels. There was no apparent eruptive activity during this time, although moderately strong upwelling continued over the lake's N vents, producing a yellow slick on 11 October. Upwelling was also occasionally observed above the lake's central vents.
A sharp increase in Crater Lake water temperature began in early January. Temperatures paused at ~20°C from 7 to 21 January, then rose at an even higher rate (1.1°/day), reaching 36°C by 8 February (figure 12). Strong sulfur odors were noted at the lake on 3 January, and 9 km N (in Whakapapa Village) during still air and clear weather on 5 February.
During a midday 8 February overflight, January Clayton-Green (Dept of Conservation) reported a gray slick surrounded by blue-green water in the center of Crater Lake, but no anomalous upwelling. Later that day (1500-1600), shortly after the start of a sequence of 30-40 volcanic earthquakes (at 1458; figure 13), Rob McCallum (DOC) observed upwelling 45-60 cm high that produced a surge over the lake's outlet. Agitation of the water was reported as "lasting some time." The next day, McCallum noted that the lake was entirely gray (at 0900), and that a strong sulfur odor was present. Bruce Williams (a Mt. Cook Airlines pilot), reported that Crater Lake, viewed from the air, was a typical blue-green on 8-9 February, but became more active on 10 February, and further increased in activity on 11 February.
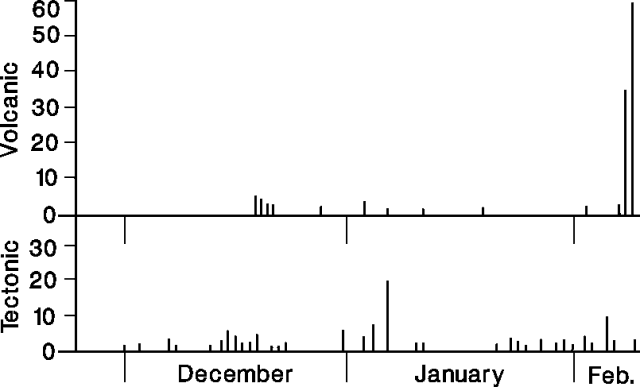 |
Figure 13. Daily number of volcanic (top) and tectonic (bottom) earthquakes at Ruapehu, December 91-9 February 92. Courtesy of DSIR. |
Vigorous seismicity continued on 9 February, although earthquake magnitudes dropped from just above M 2 on 8 February (maximum M 2.3), to just below M 2. One episode of low-amplitude, 1-Hz tremor was recorded at 0800-0930 on 9 February. Higher frequency (2 Hz) tremor remained at background levels during this part of February.
A team of scientists from DSIR and DOC visited the crater on 11 February from 1000 to 1450. Four small eruptions were observed (at 1023, 1133, 1257, and 1410), each consisting of a sudden updoming of dark gray water over the central vent, possibly rising several meters and affecting an area 10-20 m across, but rapidly obscured by steam. There was little sound except for a "whooshing" from the agitated water. Small waves (<20 cm high at the shoreline) radiated out from the center, and steam rose approximately 100 m before dissipating.
Water temperature reached 39°C, and outflow was 120 l/s on 11 February (compared to <10 l/s on 17 October and 20 November, and 70 l/s on 3 January). Mg/Cl ratios remained stable, ranging from 0.046 to 0.048 since 3 May 1991, although there did appear to be a slight dilution (from 312 to 295 ppm magnesium, and from 6,526 to 6,245 ppm chloride).
Deformation measurements on 11 February indicated a reversal from apparent deflation to inflation. Fieldwork on 17 October and 3 January had indicated slow deflation since 29 August. Similar deformation reversals were recorded during the 8 other discrete heating episodes since 1985.
A small phreatic eruption was observed on 18 February at about 1100, by airplane pilot Darren Kirkland. The event produced a column of steam, and generated waves estimated at 60-90 cm height. Geologists considered the January-February activity to be typical of the volcano's post-1985 periods of minor phreatic activity. . . .
Information Contacts: P. Otway, DSIR Wairakei.
Small phreatic eruptions accompany rise in Crater Lake temperature
Increased thermal activity began in early January, peaked around 23-26 February, and concluded about 8 March. Several minor phreatic eruptions were observed beginning on 8 February, including several since 11 February fieldwork. Steam clouds were observed over Crater Lake at 1500-1600 on 12 February by Dept of Conservation staff. On 18 February, airplane pilots (Darren Kirkland and Ross Bateup) reported a phreatic eruption generating a steam column and waves 0.6-0.9 m high at around 1100, and two large "bubbles" and a pulse of steam at 1822. During a visit on 20 February, Dr. Ockens (Univ of Sydney) heard an airplane engine-like noise, followed by steam emission from the lake and a sulfur odor. Kirkland observed an eruption that produced large waves at 1200 on 23 February, and after a week of relative quiet, reported the lake to be vigorously active at 1600-1800 on 6 March, producing dense steam clouds and large waves. Steam clouds were noted rising from the lake that day at about 1330, by Roger Smith (from near the lake shore) and Keith McKenzie (from a helicopter, at a distance). Smith also reported the appearance of sulfurous, yellow-green patches in the lake.
During fieldwork on 24 March, Crater Lake appeared pale gray, with upwelling (three or four cells) and yellow slicks over the N vent area. New snow was visible at the water's edge and there was no evidence of recent activity. The temperature data logger recorded a peak of 47°C on 23 and 26 February, then temperature fell, plateauing briefly at ~44°C on 2-8 March, and reaching 31.5°C (direct measurement) on 24 March (figure 12). Water analyses indicated no significant changes in Mg or Cl concentrations during the February-March activity.
EDM measurements showed moderate inflation associated with the February/March activity. Seismicity has remained at background levels since 11 February, with low-level volcanic tremor or small volcanic earthquakes recorded on most days. No signals related to reported activity were seen. Geologists noted that the February/March activity was similar to the minor events that occurred every 5-10 months between 1985 and January 1990.
Information Contacts: P. Otway, DSIR Wairakei.
Thermal activity but no phreatic eruptions from Crater Lake
The lake's temperature, measured during fieldwork on 6 May, had risen slightly to 34.5°C, but there was no evidence of further phreatic activity. Moderate upwelling over the N vents produced yellow slicks in the moderately steaming, battleship-gray lake. No upwelling from the central vent was visible. EDM data showed continued minor inflation across the lake.
Information Contacts: P. Otway, DSIR Wairakei.
Crater Lake cools
Activity from Crater Lake was limited to thin, dark slicks that occasionally appeared over the central vent, and weak to moderate upwelling from the N vents during fieldwork on 31 August and 13 September. No steaming was evident and the lake remained a clear blue-green color. Little deformation was detected, but heavy snow-cover prevented measurements at most of the network.
Lake temperature was only 10.2°C on 13 September, 7° cooler than on 17 July. Diminished heat flow into the lake has lowered its temperature to the 10°C range only eight times since 1980, and phreatic eruptions occurred within 1-2 months of half of those cooling episodes. One was a moderately explosive vent-clearing event on 8 December 1988, but the others were relatively small.
Information Contacts: P. Otway, IGNS Wairakei [formerly DSIR].
Lake temperature increases; seismic swarm
Fieldwork on 21 December revealed no evidence of eruptions since the last summit visit on 29 October. Suspended sediment carried by convection colored the crater lake battleship-gray, a change from the clear blue-green color observed in August and September. Evidence for upwelling centers was obscured by wind-generated waves. Pilot observations indicated that the color change began in late November, although the lake was reported to be blue-green on 17 December. Lake temperature was 28.2°C, an increase of 16°C since late October and 18°C since 13 September (figure 14). Snow almost to the waters' edge indicated a lack of recent eruptive surges.
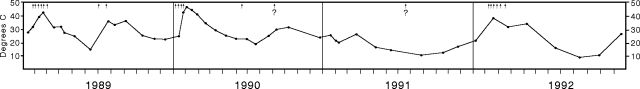 |
Figure 14. Temperature and minor eruptive activity (arrows) at Ruapehu's crater lake, 1989-92. Courtesy of IGNS. |
Seismicity recorded at the nearby Dome shelter station 5-23 November consisted of a sequence of high-frequency shocks followed by strong 2-Hz tremor that gradually declined to background levels over 5-10 days. Tremor was replaced by small discrete volcanic earthquakes, the largest, M 2.0, on 9 November. The signal from the Dome station was lost 23 November-7 December, but occasional volcanic earthquakes were recorded by the more distant Chateau seismograph. When recording from Dome resumed on 7 December, activity was at background levels. No significant deformation was detected during a survey limited by snow conditions.
Based on the seismicity and past activity patterns, geologists believe that the current heating phase began around mid-November, and that small eruptive events are possible in the near future.
Information Contacts: P. Otway, IGNS Wairakei; I. Nairn, IGNS Rotorua.
Little change in crater lake; episodes of tremor
Fieldwork on 17 February revealed little change compared to previous visits. The lake was pale gray-green with a large area of brownish discoloration over the N vent area, where several convection cells were apparent. Blue-green meltwater around the N and W margins increased in area during the day. There was no shoreline evidence of recent surging. Following a decline in January, the lake temperature had increased from 21°C (measured on 12 January) to 24°C. Over the same period the lake outflow decreased from 100 l/s to 90 l/s. The Mg/Cl ratio in the lake water has remained essentially constant since December (table 3), after reaching a low of 0.042 in September.
Table 3. Temperature, outflow measurements, and water analyses from the crater lake of Ruapehu, 21 December 1992 to 10 December 1993. Discharge is in liters/second (l/s). Discharge of "0" indicates a lake level below overflow stage. A dash (--) signifies no measurement. (The low Mg and Cl values on 11 January were due to excessive meltwater dilution. Analyses done by M.E. Crump). Courtesy of IGNS.
| Date | Outlet (°C) | Logger Point (°C) | Discharge (l/s) | Mg (ppm) | Cl (ppm) | Mg/Cl |
| 21 Dec 1992 | -- | -- | -- | 311 | 6731 | 0.046 |
| 11 Jan 1993 | -- | -- | -- | 273 | 5947 | 0.046 |
| 17 Feb 1993 | -- | -- | -- | 299 | 6674 | 0.045 |
| 03 Jun 1993 | 14.0 | 16.5 | less than 1 | 282 | 6403 | 0.044 |
| 18 Jun 1993 | 10.9 | 13.0 | 30 | 273 | 6194 | 0.044 |
| 03 Jul 1993 | 11.2 | 12.5 | -- | 277 | 6267 | 0.044 |
| 06 Aug 1993 | 19.6 | -- | 85 | 277 | 6404 | 0.043 |
| 21 Sep 1993 | 35.5 | -- | 25 | 283 | 6753 | 0.042 |
| 29 Sep 1993 | 38.2 | -- | 0 | 282 | 6883 | 0.041 |
| 09 Oct 1993 | 35.5 | -- | 0 | 294 | 7016 | 0.042 |
| 04 Nov 1993 | 37.2 | 39.0 | 0 | 296 | 7233 | 0.041 |
| 10 Dec 1993 | 26.0 | -- | 0 | 293 | 7175 | 0.041 |
EDM measurements revealed no long-term movements of volcanic significance. A key benchmark, buried by snow since July, was exhumed. Its burial prevented detection of any short-term inflationary changes.
The crater was revisited 28 February-2 March to install telemetry equipment. The lake initially appeared unchanged from 17 February, but by 2 March it was a uniform gray. Outflow was estimated to be 140 l/s. Lake temperatures of 28-29°C measured near the telemetry equipment were similar to the 29.2°C telemetered via ARGOS on 4 March.
Seismicity was generally low with some volcanic earthquakes recorded. Strong tremor was recorded 9-10 January and moderate tremor on 25-28 February.
Information Contacts: P. Otway, IGNS Wairakei.
Activity remains at low levels; lake cooling
Overall volcanic activity has been at an unusually low but stable level in recent months. Deformation and seismicity have remained at background levels, and lake chemistry has shown little change. No evidence of eruptive activity was observed during fieldwork on 23 March or 20 April. The weather on 23 March was clear with a light wind and a temperature of -1°C. The crater lake was pale gray with a slight upwelling and yellow slicks at two or three sites in the N vent area. Small rafts of floating yellow sulfur were observed near the shoreline. There was no upwelling visible over the main vent. Blue-green meltwater was present in some areas around the N shore, but there was no evidence of recent surging.
Measurements in late March and April show that the lake is now undergoing slow cooling. The mid-day lake temperature measured manually on 23 March at 15 cm depth was 23.0°C at the Outlet (S end of the lake) and 24.5°C at Logger Point (~150 m E of the outlet on the S shore). A thermistor measurement directly offshore of Logger Point recorded a temperature of 28.0°C at the same time, at a depth of at least 10 m. No change was apparent in the lake on 20 April, although the meltwater had disappeared. Lake temperatures had dropped to 21.0°C at Outlet and 21.5°C at Logger Point. The temperature telemetered from the thermistor was 25.0°C. The 3.5°C temperature difference observed on both days at Logger Point is thought to reflect stratification between the relatively clear surface water and the warmer sediment-laden water 10 m below. The outflow rate 23 March was estimated to be 30 l/s, much less than the 140 l/s on 2 March..
Apparent tilt since the last leveling survey, in March 1991, was insignificant (0.4-1.2 µrad), and did not exceed the normal survey error. EDM measurements were also insignificant (generally <10 mm) since the last survey on 17 February. Shortening of two lines by 14-18 mm is consistent with an 18 mm eastward shift of station C, located ~225 m WNW of the lake. This is a reversal of the early westward movement of station C, which is typical of the changes recorded since about 1987, and interpreted as a seasonal effect related to snow-loading or frost-heave. All other movements recorded by recent surveys can likewise be attributed to station or site instability of various forms. None of the movement recorded in March or April has been interpreted as short-term volcanic deformation. Long-term volcanic deformation over the past 2 years has also been insignificant, including tilt measured at sites 0.5 and 2.1 km N of the crater lake.
The Mg/Cl ratio remained constant from 1 March through 20 April at 0.044. Results have been interpreted as indicating essentially stable chemistry over the last few months. Seismicity has been generally low since February, although the seismograph ceased transmission on 4 April.
Information Contacts: P. Otway, I. Nairn, and D. Johnston, IGNS Wairakei.
Temperature and outflow from crater lake increase; activity remains low
Heatflow in the crater lake continued at low levels in June and July but increased significantly in August. Little change was observed in the pale gray color of the lake during fieldwork on 3 June, 18 June, and 3 July. Snow was present along the lake's edge and there was no shoreline evidence of surging on any of the field dates. Moderate upwelling was observed with associated yellow slicks over two sites in the N vent area on 3 and 18 June. Some weak convection and a faint short-lived dark slick were visible above the central vent on 18 June. Yellow sulfur globules (hollow spheres with long tails) were also seen floating and stranded on the shore near the outlet on 18 June. Weak upwelling from the N vents on 3 July produced a sulfur slick extending nearly 150 m E of the outlet on the S shore to Logger Point, but no slicks were seen from the central vent. Convection had recommenced from the central vent by 6 August and produced khaki-yellow slicks on the lake surface. The calculated August heatflow was ~3x that of July. Temperature and discharge from the outlet (at the S end of the lake) had increased since June, while the temperature at Logger Point declined (see table 3).
EDM distances measured on 3 June showed a minimal change of -7 mm overall since the last leveling survey on 20 April, which is unlikely to have any volcanic significance. No distance measurements were made in July. Changes since 3 June were generally below detection limits (<5 mm ) with the exception of the shortening of two lines to a station SW of the crater lake (station E), continuing the trend since February. Two other stations moved ~18 mm closer to station E. None of these movements is thought to have any significance in terms of future eruptive activity. Snow was still an obstacle during the 6 August survey with deep drifts around stations on the W side of the crater lake.
Detailed seismic monitoring in June was hindered by the failure of the Dome seismograph, which was struck by lightning in early April. Very little tremor was recorded by the Chateau seismograph. The signal from Dome was restored on 18 June and some very small A-type events were recorded on many days. During a 6-minute period on 3 July, a sequence of five events with a dominant frequency of 2-3 Hz was recorded, indicating low-frequency volcanic earthquakes or short duration tremor. Some very small local high-frequency events were also recorded in early July and were attributed to probable ice-induced quakes. No records were obtained from Dome during 12-20 July, and when recording recommenced a 2-Hz volcanic tremor of variable amplitude was occurring. The tremor was continuous up to the time of the 6 August report, with the dominant frequency rising from 2 to 3 Hz on 27-28 July. Small high-frequency events continued to occur in early August.
Information Contacts: P. Otway, B. Scott, and A. Hurst, IGNS Wairakei.
Temperature of crater lake increases, generating high steam plumes
The crater lake temperature has increased sharply since early July, and by late September had reached levels at which small phreatic events have previously occurred (figure 15). Numerous reports of high steam columns in September generated public and media speculation, but there was no significant eruptive activity.
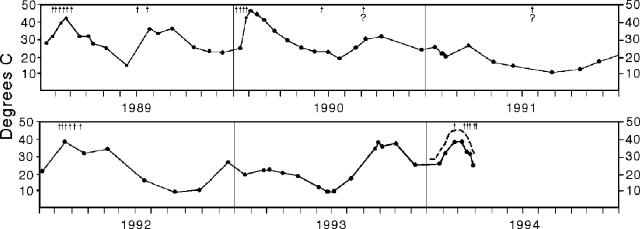 |
Figure 15. Water temperature (1-2 m depth) and minor eruptive activity (arrows) at Ruapehu's crater lake, January 1989 to March 1994. Dashed line shows temperatures recorded at a depth of 20 m (sensors are linked by ARGOS satellite telemetry). Courtesy of IGNS. |
Steam clouds, possibly to heights of 400 m above the summit, were seen on 20 September from Taupo, ~75 km NE. Geologists who visited the volcano on 21 September observed a steam cloud rising up to 500 m above the lake, preventing observations of possible upwelling over the main vent. Dense steam covered much of the central part of the turbid gray lake; light steam was present along the shore. In the N vent area, a large but weak upwelling cell was defined by a semicircular yellow-gray slick with several smaller cells nearby. Large slicks were observed drifting towards the outlet. There were no waves except those caused by occasional falls from ice cliffs on the N shore, and no evidence of surging on the beach or in the outlet channel. The snowline N of the lake had melted back from the shore because of steam and sunlight. During the next visit, on 29 September, the lake was still a turbid gray color, but only minor steam was coming from the surface. Very slight convection was seen at three sites in the N vent area, with no upwelling or slicks noticed until the early afternoon, when a brief period of upwelling over the main vent took place with associated black slicks. No surging or high lake levels had occurred since the 21 September visit.
Following a period of slow cooling from February to early July the lake temperature again began to increase, accompanied by a decrease in discharge (see table 3). By 29 September the falling lake was 16 cm below the overflow level (no discharge) and the temperature was 38.2°C. Lake water analyses since 18 June showed a minor increase in Mg content (~3%), but about an 11% increase in Cl content (see table 3). This is consistent with either the injection of HCl-bearing steam into the lake, expulsion of a vent condensate that did not interact significantly with fresh andesite, or a mixture of these fluids.
EDM distance changes between 6 August and 21 September were insignificant, with the possible exception of a 9 mm lengthening of a line that runs from the N to the SW side of the lake, reversing the previous trend. Variable levels of volcanic tremor in the 2-3 Hz range continue to be recorded. Long-duration earthquake swarms were recorded on 11 and 17 September, but neither was associated with significant eruptive activity.
Information Contacts: P. Otway, IGNS Wairakei.
Temperature of crater lake remains high, but no eruption
As of 4 November there was no evidence of any significant eruption.... despite elevated temperatures that have previously correlated with minor eruptions. Crater lake inspection at Outlet, the lake's drainage point, on 4 November, revealed elevated water temperature. The temperature, 37.2°C, was one degree cooler than on 29 September, but ~26°C warmer than measured in June and July. In the years 1989-92, minor eruptive activity consistently took place when similar elevations in lake temperature occurred; this pattern was repeated 4-5 times in this interval (see figure 15). In addition, during this interval one or two eruptions took place with comparatively low lake temperatures. Minor eruptions also showed strong correlation with elevated lake temperatures in the interval from March 1978-April 1980 (McClelland and others, 1989). Elevated temperatures during September-November 1993 have yet to follow the same pattern and correlate with an eruption.
On 4 November the crater lake was battleship gray in color, its surface frequently obscured by steam. No convection was visible, although broken dark slicks appeared near the main vent and the N vent area exhibited minor upwelling and yellow slicks. The lake surface level on 4 November remained similar to 29 September: ~16 cm below the overflow level. No surging was noted, in contrast with 21 September when the lake surface at Outlet underwent well defined oscillations (a seiche). That seiche was of 3-13 cm amplitude and had an irregular periodicity of 25-50 seconds.
As of 4 November, volcanic tremor had declined from a high reached 3 months earlier. In terms of daily power output, tremor peaked in early August at over 1,000 W. The lowest point in daily power output happened in early October, 3-4 W. Thereafter, it fluctuated in the 10-70 W range.
A deformation circuit encircled the lake on 4 November. Survey lines comprising the circuit were between ~600 and 1,200 m long. The bulk of the lines mainly showed either length increases in the range of 1-9 mm or length decreases in the range of 6-19 mm. The surveyors regarded the changes as too small to have any volcanic significance.
More than 4 m of snow rested on the crater rim, possibly the deepest snow-pack encountered in 23 years of observations. This much snow should have provided an abundant source of water, but the Lake level was below the level of Outlet. This paradox was explained as follows. First, seepage through the vent walls and evaporation due to high water temperatures have reduced the lake level. Second, the amount of meltwater that entered the Lake was below normal due to unseasonably cold air temperatures.
Information Contacts: P. Otway, IGNS Wairakei.
Cooling trend follows 3 months of high temperatures in the crater lake
During a visit by geologists on 10 December, the crater lake was a battleship-gray color with no upwelling or slicks around the main (central) vent. The N vent area exhibited moderate upwelling, possibly slightly stronger than seen in recent months, with yellow slicks. Little or no steam was present, and there was no indication of surging or other eruptive activity. Except for exposed rock near Outlet, the entire lake remained surrounded by snow. A tour operator reported similar conditions following a visit on 4 December, although the N vent area was not observed. A commercial pilot reported that on the morning of 19 December there was extensive ash staining on the snow down the E side of the mountain, though no steam was visible from the crater lake. A guided party that visited the crater lake later that day observed no evidence of recent activity. The most likely source for the staining is old ash exposed by the recent thaw that was blown across the snow. This phenomenon has been observed frequently at this time of year in the past.
The lake temperature measured at Outlet on 10 December was 26.0°C (see table 3), a drop of 11°C since 4 November. The lake level was estimated to be at least 20 mm below overflow level with evidence of a recent retreat (fresh strandlines). By the next day, scientists repaired the ARGOS satellite telemetry station at the crater lake, which had been inactive since 3 July. The crater lake appears to have been cooling rapidly after approximately 3 months of above-average heatflow. However, temperatures telemetered from the ARGOS station since 10 December indicated minor renewed heating of the lake (an increase of 1.2°C between 11 and 19 December). The recent heating follows a minor increase in volcanic tremor in late November, so it is unclear whether the cooling phase will continue. Lake water analyses (see table 3) show that Mg and Cl concentrations appear to have stabilized following a minorincrease between June and November.
Tremor power output declined to very low levels on 2 October before rising again into the 10-70 W range for the rest of the month. Late in November the power output rose above background levels, reaching 200 W on 21 November. Several small earthquakes, mostly A-type, but some B-type events, were recorded by the Dome seismograph, especially in late November.
Information Contacts: P. Otway, IGNS Wairakei.
Minor phreatic eruptions from crater lake
Crater Lake underwent a strong heating phase beginning in mid-January (see figure 15) that resulted in minor phreatic eruptions in February and March [but see 19:05]. The heating phase accompanied and followed a period of increased volcanic tremor, briefly enhanced acoustic noise levels, and minor inflation.
Following 2-3 days of elevated 2-Hz acoustic signal, temperatures at a depth of 20 m off Logger Point suddenly began rising on 9 January. Temperature increases of 6-9°C at 20 m depths, coupled with a lack of significant upwelling, suggested that the lake was stratified, with the upper layer disconnected from convection at depth. A new temperature logger was installed on 18 January, 4 m NE of Logger Point, to record at a depth of 1-2 m. Temperatures peaked around 18 February after rises of 19°C at 20 m depth (to 47°C) and ~14°C on the surface at Outlet (to 39°C). In March the temperature at 20-m depth declined at a steady rate of 0.5°C/day, but then stabilized. Various reports received by IGNS indicated minor phreatic eruptions, consisting primarily of steam clouds, on 12 February, on 1, 5, 7, and 31 March, and on 1 April. The 7 March activity consisted of a sudden upwelling near the center of the lake that created waves and a steam column.
No evidence of upwelling over the main vent in the battleship-gray crater lake was detected during fieldwork on 18 and 28 January, 11-12 March, and 22-23 March. On 28 January the N vent area exhibited one extremely weak convection cell surrounded by scattered yellow slicks; at least three clearly defined cells are normally present at this location. Moderately strong meltwater inflows and occasional minor ice-falls were seen on both January visits. Very weak convection with thin surface slicks was observed in the N vent area on 12 March. New snow that fell on 8 March was undisturbed close to the N shore, precluding any surging since then. Sulfur strandlines had formed 10-20 cm above lake level near Outlet, also indicative of little recent activity. However, fresh deposits of mud (2-3 cm thick) were observed at Outlet on 12 March. Strong convection had resumed by 22-23 March at several sites over the N vent, after a 2-3 month period of very weak convection. Large yellow slicks from that area were clearly visible when washed up around the shore. The lake had risen to overflow level, but the outflow rate appeared low. Convection at the N vent area was less pronounced on 28 March.
Volcanic tremor remained at background levels in November-December 1993 after declining steadily from a peak value in late August. Tremor power began increasing again in mid-December, peaked at ~8,000 watts on 7 January, and remained high (~3,000 watts) through early February. Dominant frequency remained in the 2-3 Hz range. Signal noise interrupted power records in mid-February, but drum records indicated that tremor remained high until late February. No reliable tremor data were obtained in March. Following few recorded volcanic earthquakes in November, the number of A- and B-type events increased in mid-December and mid-January. Several distinct B-type events were recorded at the dome station in January. On average, 10 B-type events/day were detected in the second half of February, but they decreased in number during March.
Minor inflation between 4 November and 18 January increased the crater width to equal the relatively high value measured in early 1992, a period of strong lake heating and minor eruptions. The crater remained inflated on 12 March, but had deflated somewhat by 28 March. The most significant change in January was the westward shift (28 mm) of a station on the W side of the crater lake, which is typical of seasonal movement recorded at that location over the last 5 years; it had almost returned to its original position by 12 March. The movement was most likely due to ground thawing or relief from snow loading rather than from volcanic influences.
Information Contacts: P. Otway, IGNS Wairakei.
Cooling trend in crater lake ends in early May; no recent activity
Heatflow during April remained low (table 4), but evidence of convection (dark slicks from the central vent) on 6 May indicated some recent increase. Lake temperature at 20 m depth continued to decline from 47°C on 18 February to 23.6°C on 6 May. Two bursts of strong tremor, on 5 and 8 May, corresponded to a renewed steady temperature rise to 24.9°C by 11 May. As with the previous heating phase, this activity occurred several weeks after strong low-frequency acoustic signals were recorded.
Table 4. Temperature, outflow measurements, and water analyses from the crater lake of Ruapehu, 18 January 1994 to 27 August 1994. Discharge of "0" indicates a lake level below overflow stage. A dash (--) signifies no measurement. Courtesy of IGNS.
| Date | Outlet (°C) | Logger Point (°C) | Discharge (l/s) | Mg (ppm) | Cl (ppm) | Mg/Cl |
| 18 Jan 1994 | 25.2 | -- | 230 | 255 | 6642 | 0.038 |
| 28 Jan 1994 | 32.7 | -- | <=200 | 278 | 7140 | 0.039 |
| 10 Feb 1994 | 36 | 39 | -- | 253 | 6646 | 0.038 |
| 18 Feb 1994 | 39 | 40 | 0 | 271 | 7118 | 0.038 |
| 26 Feb 1994 | 38.5 | 39.5 | 0 | -- | -- | -- |
| 06 Mar 1994 | 32 | 36.5 | 0 | -- | -- | -- |
| 12 Mar 1994 | 31.6 | -- | 0 | 273 | 7198 | 0.038 |
| 28 Mar 1994 | 25.0 | -- | low | 277 | 7195 | 0.038 |
| 18 Apr 1994 | 23.0 | -- | 40 | 272 | 7150 | 0.038 |
| 06 May 1994 | 19.0 | -- | 110 | 270 | 7128 | 0.038 |
| 04 Jul 1994 | -- | -- | -- | 262 | 7029 | 0.037 |
| 12 Aug 1994 | -- | 16 | ~25 | -- | -- | -- |
| 27 Aug 1994 | 17 | -- | ~25 | -- | -- | -- |
On 18 April the lake was a uniform battleship gray color with no evidence of upwelling, although the N vents were not fully visible from the observation point. No signs of surging were seen around the shoreline or at Outlet. A dark khaki-green slick emanating from the central vent area on 6 May drifted slowly onto the SE shore, but no upwelling was observed. Broken yellow slicks originating from several weak upwelling cells in the N vent area were also present over the N half of the lake. The general color of the lake was the same as in April, and there was no sign of recent activity. Prior to the heating episode in February, the ratio of Mg to Cl in the lake water decreased slightly from 0.042 in late 1993 to 0.038 in January (table 4), due mainly to a decrease in Mg. This ratio had remained stable at least through 18 April.
Inspection of photographs taken during the reported steam eruption on 1 March revealed an apparently passive steam cloud, a common atmospheric effect at the crater lake. The rising cloud was most intense over an area of discolored water, and may have been caused by vigorous convection or a minor phreatic event shortly beforehand. This incident is a reminder that even reports from reliable eyewitnesses should be treated with caution; reports of possible eruptions in February-April should be regarded as unproven.
The only deformation change of possible volcanic significance detected on 6 May was a reversal of the 9 mm contraction of the crater width indicator line recorded between 12 and 28 March. This suggested a return to the mildly inflated level first recorded in January. It is not yet known if the evidence of minor inflation is significant. A leveling survey on 18 April indicated 21 µrad of tilt towards the crater (deflation) at the Dome location over the past year, the largest tilt since 1981. Because this follows a period of slow apparent deflation (0.7 µrad/year), the measurement may not be reliable. Southern benchmarks may have been lowered by downhill creep of a lava slab. However, large systematic apparent tilts of
Information Contacts: P. Otway, IGNS Wairakei.
Relatively stable with water cooling of Crater Lake
When visited on 8 June, Crater Lake appeared a very pale, almost yellowish, gray. On 4 July, as was more typical for the recent past, the crater lake was a uniform battleship-gray with no evidence of convection or slicks. Temperature at Outlet, 22°C, was slightly higher than for June-July in past years. The lake is currently cooling following a minor heating event in early June that followed strong acoustic signals, minor earthquakes, and volcanic tremor 10-15 days earlier. These two recent visits revealed no evidence of eruptive activity.
On 4 July, unusually thick accumulations of snow prevented deformation surveys and emphasized the need to install tiltmeters in key locations to improve the continuity of monitoring. Snow and ice were removed from the ARGOS satellite installation, but the solar panel could not be located under deep snow and battery and transmission power steadily declined.
A working party coordinated by the Ministry of Civil Defence has considered developing a contingency plan for volcanic hazards. They also may adopt a system using "Volcanic Alert Levels" graded from 1 (low level) to 5 (highest level, hazardous eruption in progress).
Information Contacts: P. Otway, B. Scott, and A. Hurst, IGNS Wairakei.
Cooling trend of crater lake reverses in late August
Crater Lake has continued cooling since a minor heating event in early June, which occurred without eruptions. Observations through late August indicated a possible reversal of this cooling trend: minor convection, slightly enhanced acoustic signals, and an increase in volcanic tremor.
On 12 August the crater lake was pale gray with an indistinct slick over the central vent. The N vent area was not observed. Snow was present almost to the water's edge with no evidence of surging. Lake temperature at Logger Point was 16°C on 12 August. The battery for the ARGOS temperature logger was replaced on 12 August and a lake temperature of 18°C was recorded. The lake had a similar appearance on 27 August, but there was weak upwelling in the N vent area. Rafts of yellow sulfur were stranded on the shoreline. Lake temperature at Outlet was 17°C. In late August, ARGOS temperatures began displaying significant diurnal variation, and were not much higher than at Outlet. This may indicate that either the sensor had drifted closer to the surface or that surface temperature variations penetrated deeper into the lake. Outflow was ~25 l/s during both visits.
Volcanic tremor remained at slightly elevated levels during June, and during July the tremor levels varied. The dominant frequency remained at 2 Hz, implying only one source region but a periodic variation in output strength. Tremor levels were low in early August, but rose slightly during the month. Volcano-seismic activity was last reported on 7 July. . . .
Information Contacts: P. Otway, IGNS Wairakei.
New heating episode in crater lake begins after a burst of acoustic noise
Crater Lake appears to have commenced a new heating episode following a burst of acoustic noise on 25 November, and has been accompanied by a significant increase in volcanic tremor. The last heating episode, in June 1994, was short-lived and apparently not accompanied by eruptions. The crater lake on 7 December was generally pale gray with a blue-green tinge in some places. An area of dark gray water, signifying upwelling, was located over the central vent and streaming NE towards the shore. At least five upwelling cells in the N vents area, one of which was moderately vigorous, were associated with local discoloration and yellow slicks. There was no evidence of surging around the shoreline. Snow around the S half of the lake was discolored by sulfur sublimate stains and newly exposed ash due to recent snow recession.
Lake temperature had increased ~4°C since 27 October: to 21.3°C at Logger Point and 22.0°C at Outlet. Outflow was measured at ~80 l/s in the early afternoon of 7 December, but had increased noticeably since late morning, presumably due to increased snow-melt during daylight. A replacement solar cell was installed at the ARGOS station on Logger Point. The increased voltage on subsequent days was accompanied by a 2-2.5°C increase in recorded temperature, confirming the suspicion that recent temperatures have been in error by this amount. Previously recorded trends, however, are believed by IGNS to be reliable. ARGOS temperatures since 27 October remained low at ~15°C (~17-18°C true) until around 25 November, when a steady temperature rise coincided with a burst of 2-Hz acoustic noise. By 7 December, the temperature had risen 5°C and had reached 25°C (true) by 12 December (0.4°C/day). The manually recorded temperature at Logger Point also rose from 18°C on 27 October to 21.3°C on 7 December.
Volcanic tremor remained at low levels (~200 watts) through October to mid-November. Tremor levels began rising on 17 November, with a peak of 12,600 watts on the 25th. This high level closely followed the peak of 2-Hz acoustic noise. Tremor decreased again in early December.
Information Contacts: P. Otway, IGNS Wairakei.
Small phreatic eruptions in crater lake
Some key descriptive and eruptive data on Ruapehu are summarized on figure 16 and table 5.
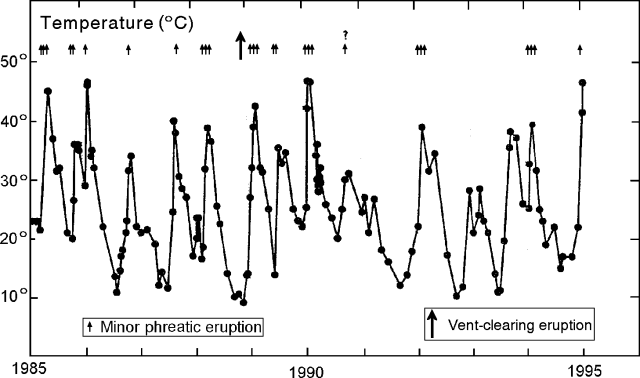 |
Figure 16. Ruapehu Crater Lake activity and surface lake temperature at Outlet, 1985 through January 1995. Courtesy of IGNS. |
Table 5. Summary of Ruapehu crater lake observations, January 1995. Courtesy of IGNS.
| Date | Observations |
| 06 May 1994-13 Jan 1995 | Deformation showed no volcanologically significant distance changes seen (line IJ unmeasurable due to snow). |
| after 25 Nov 1994 | Seismicity generally low except for moderate earthquakes mentioned in text. |
| after 30 Nov 1994 | Tremor generally <=200 Watts at a dominant frequency of about 2 Hz. |
| 07 Dec 1994 | Outflow rate 80 liters/second. |
| 13 Jan 1995 | Lake was battleship gray, steaming vigorously, with sudden, 1-2 m high upwelling. Outlet temperature 41.5°C. Outflow rate 500-600 liters/second. |
| 18 Jan 1995 | Outlet temperature 46.5°C. Outflow rate >600 liters/second. |
"Ruapehu Crater Lake has been in a heating phase since ~25 November with the Outlet temperature rising from 17°C to 46.5°C by 18 January, and the ARGOS [satellite-relayed] temperature (at 20 m depth) rising from 17°C to 47.5°C during 25 November to 12 January. The 6.5°C differential between Outlet and ARGOS temperatures on 12 and 13 January appears to be common during a heating phase. Note that the unusually high outflow of 6m3 heating at a mean rate of 0.7°C/day).
"Small phreatic eruptions have been occurring since ~11 January, or earlier. No associated seismicity or acoustic noise has been recognized, indicating typical open vent conditions."
S. Sherburn reported that there were two weeks in December without seismic data, but between 24 December and 2 January a series of moderate earthquakes took place ~12 km W of the summit (the largest, M 4.3 and 4.4). These earthquakes were not interpreted as related to the activity at Crater Lake. Otherwise seismicity has remained low.
I. Nairn reported that on 13 January Crater Lake was "steaming vigorously both before and after two small phreatic eruptions." The first eruption took place at 1103 and the second ~40 seconds later; both lasted ~10 seconds. The eruptions consisted of a sudden upwelling near the center of the lake, reaching roughly 1-2 m in height. Nairn also noted minor upwelling over several of the N vents. The lake water contained considerable dissolved gas, and bands of ~1- to 2-mm-diameter hollow spherules of sulfur floated along parts of the lake's edge. Large fragments (up to 20 cm across) of vesiculated yellow sulfur both floated at the lake edge and formed a strandline located near Logger Point. The strandline sat 2-3 m from the lake edge and 0.5 m above its surface, and was thought to have resulted from surges due to heavy rainfall (possibly on 11 January). The larger sulfur fragments contained vesicles with very thin walls and diameters mainly in the 1-5 mm range. The vesicles were mostly subspherical, and unconnected except where broken walls touched adjacent vesicles. There were some solid sulfur spheres within the larger fragments as well. Molten sulfur may have detached from a pool at depth. The sulfur may have then been jetted upwards reaching shallower depths where it subsequently degassed and vesiculated. Molten sulfur has a density of 2.07 g/cm3 and a melting temperature of ~113°C.
Information Contacts: P. Otway, S. Sherburn, and I. Nairn, IGNS Wairakei.
Crater lake temperature drops 10°C from 13-year high
The following was extracted from the IGNS Ruapehu Immediate Report (RUA 95/02). Peaks on the crater lake temperature versus time curve have often correlated to small vent-clearing eruptions (see figure 16).
"Crater Lake has been in a heating phase since late November, reaching the highest temperature (55°C) in 13 years by 12 February, but a 10°C decline since then and a reduction in volume suggest this phase has peaked. Minor phreatic eruptions have been occurring since early January but appear to have become infrequent, or may have even ceased, during February. Despite the relatively high heat output, the recent activity has so far followed the cycle of heating and cooling typical of Ruapehu since at least 1985."
There were several reports of steam clouds and other phenomena after 20 January. A hiker on 24 January described the crater lake seen through the clouds as "a seething surface" that made "roaring sounds" lasting 1 to 2 minutes.
Two or more observers on 29 January described the crater lake, which was visible for almost 2 hours, as "pale gray, almost white" and two, 1.5 m (or smaller) upwelling and splashing episodes were seen. The report also mentioned "pure yellow styrofoam-sulfur" littering the Outlet area. The water temperature, measured with two calibrated thermometers, was 51.4°C.
Hikers in cloudy weather on 30 January witnessed a "small hydrothermal eruption up to 10-20 m." Hikers in cloudy weather on 5 February heard sloshing noises from the crater lake followed by two "loud explosions." On 15 February observers saw a 3 km tall, stationary steam plume over the crater lake; on 25 and 27 February observers also saw steam clouds. These clouds were undoubtedly steam, but they may have arisen from "atmospheric enhancement" due to a rise in relative humidity rather than from definite eruptions. Their interpretation thus remains ambiguous. A ground inspection on 2 March failed to confirm any significant surging took place around the shore of Lake Wade.
In the interval 31 January-early March there were few discrete earthquakes and mainly background tremor was detected on the volcano's Dome seismograph. On the other hand, there were short intervals of strong, high frequency tremor, an unusual occurrence for Ruapehu.
Although in the latest crater visit on 2 March all deformation survey stations were accessible and clear of snow, most of the length changes seen since 13 January were insignificant (<= 5 mm). Station I (see map, BGVN 19:12) appeared to have moved 18 mm ENE relative to all other stations since May 1994--a motion consistent with moderate deflation seen in the past 10 months, but also possibly due to displacement by local snow loading or other factors.
Mg and Cl analyses of lake water were made on 18 and 29 January, and on 2 March, but showed relatively change. The Mg/Cl ratio changed only about 4% (shifting downward from an 18 January value of 0.036 to a 2 March value of 0.035). The Mg/Cl ratios were interpreted to indicate that the heating event was driven by convective flow of lake water through the upper portion of the vent. Thus, the heating event was regarded as mainly due to fluid flow rather than heat input from magmatic sources within the edifice.
Information Contacts: P.M. Otway, Institute of Geological and Nuclear Sciences (IGNS), Private Bag 2000, Wairakei, New Zealand.
Several phreatic eruptions from hot Crater Lake
After a period of heating and minor eruptions in January-February, Crater Lake commenced a cooling phase in late February (BGVN 20:01 and 20:04). A new heating phase that began in mid-April was continuing through May. This latest episode has been unusually vigorous, and at least one phreatic eruption (on 25 April) appears to have been larger than the generally minor activity seen during the last decade, with the exception of a vent-clearing eruption in late 1988. Significant changes in the lake chemistry indicated changed vent conditions, and tremor bursts have been particularly strong. The alert level was raised to Stage 2, indicating a significant change in ongoing activity and an increase from the usual weak eruptions.
During a visit by IGNS scientists on 19 April there was no upwelling visible over the central vent, but some upwelling was seen over the N vents and small wisps of steam were rising from the lake surface. Lake level had risen slightly since 2 March, when it was 0.15 m below overflow, resulting in diffuse outflow (~10 l/s).
The 13-year lake surface temperature high of 55°C was recorded on 12 February, but by 19 April it was 31°C. Temperatures measured at 20-m depth (Argos satellite relayed) showed a similar trend, falling to stabilize around 35°C during the first part of April after being above the 47.5°C threshold level prior to 13 March. A slow increase in lake temperature began on 16 April, and became more rapid, though irregular, on the 24th. Low-frequency acoustic noise detected by the Argos system reached one of the highest values recorded in the past several years on 25-26 April, immediately following a temperature jump above 47.5°C. Three phreatic eruptions were reported on 27 April; a burst of medium-frequency noise was also recorded. A period of strong noise on 29-30 April may have indicated another eruption.
When IGNS geologists visited again on 4 May, surface water temperature had risen to 46°C, while the water level had fallen to ~5 cm below overflow. There was also evidence of high flows, and wave erosion that extended to 2.5 m above lake level. Equipment along the shore of the lake had been moved by wave action, possibly caused by an eruption and large wave associated with the acoustic noise on 25-26 April. A small eruption heard on 19 April only caused a small fluctation in the lake level, and moderate noise was recorded by the Argos system. Steam clouds ~500 m above the crater were observed intermittently throughout the first half of May.
Although Mg/Cl levels had declined steadily since 1990, in May they increased abruptly to reach early 1994 levels (table 6). Absolute levels of aqueous Cl have increased by ~12% since December 1994, consistent with the increased discharge of HCl-bearing steam into the lake during the last two heating events. A recent increase in Mg was taken to indicate that either unaltered andesitic material was exposed to the lake water circulating through the vent, or previously equilibrated vent fluids had been expelled during the May-April phase of activity.
Table 6. Ruapehu Crater Lake water analyses and temperatures at Outlet, 7 December 1994-4 May 1995. Courtesy of IGNS.
| Date | Mg (ppm) | Cl (ppm) | Mg/Cl | Outlet Temp (°C) |
| 07 Dec 1994 | 239 | 6451 | 0.037 | 22.0 |
| 13 Jan 1995 | 241 | 6652 | 0.036 | 41.5 |
| 18 Jan 1995 | 237 | 6662 | 0.035 | 46.5 |
| 29 Jan 1995 | 235 | 6719 | 0.035 | 51.4 |
| 02 Mar 1995 | 243 | 7018 | 0.035 | 45.5 |
| 19 Apr 1995 | 226 | 6989 | 0.032 | 31.0 |
| 04 May 1995 | 278 | 7235 | 0.038 | 46.0 |
Volcanic tremor has dominated seismic records since mid-April, and during four episodes lasting as long as 4 days, it was particularly strong and centered around 2 Hz. Owing to its similarity to wind noise, higher frequency tremor has remained difficult to quantify; volcano-tectonic earthquakes remained very rare. A 19 April distance survey carried out under good conditions failed to show volcanically significant deformation.
Information Contacts: P.M. Otway, Institute of Geological and Nuclear Sciences (IGNS), Private Bag 2000, Wairakei, New Zealand.
Large eruptions produce lahars and send plumes to over 10 km altitude
Following noteworthy "vent clearing" eruptions at Ruapehu (figure 17) on 29 June and 3 July, and phreatic eruptions in September, a series of larger eruptions began on 23 September. During the next week Ruapehu discharged plumes that were frequently reported by aviation sources to have reached at least 10 km. The following was compiled from Institute of Geological & Nuclear Sciences (IGNS) reports and aviation notices.
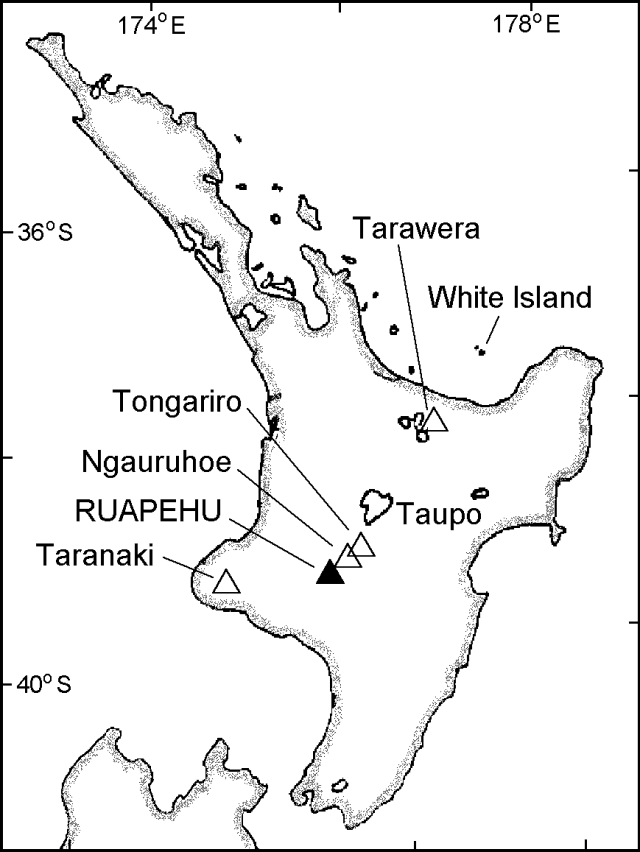 |
Figure 17. Index map of North Island, New Zealand, showing the location of Ruapehu and other volcanic centers. |
Precursory activity and minor eruptions. Many of Ruapehu's frequent small eruptions have been linked to high temperature in the crater lake. Unusually high lake temperatures (as well as other measured changes) also preceded the recent activity. During 1985-95 the surface temperature of Ruapehu's crater lake peaked at >40°C seven times; two of those peaks were in 1995. The early 1995 peak reached 55°C, the highest surface lake temperature recorded in 13 years (BGVN 20:01 and 20:05). The second 1995 peak reached roughly 44°C, the third highest seen in the 1985-95 interval. Key observations, including those from crater lake inspections carried out during visits from 25 May through 23 September (table 7) suggested a build-up in activity.
Table 7. Summary of key observations at Ruapehu, 25 May-23 September 1995. Prior to the larger eruptions observers reported that the lake was generally gray in color, often with sulfur slicks on its shore or surface; the lake began discharging water at Outlet sometime between 4 and 18 July. Courtesy of IGNS (IGNS Immediate Report (25 May-15 Aug 1995); IGNS Science Alert Bulletin (18-21 Sep 1995); Aviation report (23 Sep 1995).
| Date | Crater Lake Data | Other Observations |
| 25 May 1995 | 45.9°C at Outlet; ~0.7 m below overflow. | One very small eruption observed. |
| 16 Jun 1995 | 38.0°C at Outlet; ~1.5 m below overflow. | No evidence of recent eruptions. |
| 26 Jun 1995 | Very strong tremor for a few hours at one station. | -- |
| 29 Jun 1995 | Last ARGOS transmission. | Volcanic earthquake (M 3.2) correlated with an eruption. |
| 03 Jul 1995 | -- | Volcanic earthquake (M 2.4) correlated with an eruption. |
| 04 Jul 1995 | 33.0°C at Outlet; 0.5 m below overflow. | Intense steaming in the lake center. Two very small eruptions observed; evidence of larger eruptions that probably occurred on 29 June and 3 July. Small deformation. |
| 18 Jul 1995 | 31.0°C at Outlet. Discharge of 50 l/s. | Evidence for recent minor eruptions but no observed activity. |
| 15 Aug 1995 | 29.0°C at Outlet. Discharge of 5-10 l/s. | No evidence of recent activity; small deformation. |
| 18 Sep 1995 | Moderate vent-clearing explosive eruption at 0805 from within the lake. | Caused a flood, a lahar, and a small mudflow down the flanks; accompanying volcanic earthquake (ML 3.6). The lahar was the largest down the Whangahu river since 1975. |
| 20 Sep 1995 | 48°C at Outlet. Very large overflow. | New scoria bombs found; 15 small phreatic eruptions witnessed. |
| 20 Sep 1995 | -- | Eruption similar to 18 September, only smaller; accompanying volcanic earthquake (ML 3.2). |
| 20-21 Sep 1995 | Lake water chemistry indicates increased magma-water interaction. | Geodetic data show increased crater diameter. |
| 23 Sep 1995 | Major eruption began; column top reached over 10 km altitude. | -- |
A hydrophone and related acoustical detection components in the crater lake registered unusually high noise levels during late May, consistent with seismic activity. A moderate noise burst took place on 13 June, and relative quiet prevailed through 29 June. These data were communicated via the satellite-relayed ARGOS data system at 2-hour intervals; the last transmission (0800 on 29 June) came just prior to a M 3.2 volcanic earthquake and eruption that destroyed the ARGOS equipment.
Seismicity was at background levels from 15 May until just prior to the 29 June earthquake. The earthquake began at 0802 as a small 2-Hz signal followed by a 1-Hz signal. The main part of the earthquake, which also contained 2-Hz signal, started at 0821, and peaked between 0822 and 0824. After the main part of the earthquake, more signals centered around 1 and 2 Hz prevailed. The 2-Hz signals are common to both volcanic earthquakes and tremor at Ruapehu, suggesting that both may excite the same resonator.
Ruapehu's tremor typically has a dominant frequency of ~2 Hz and occurs almost constantly, often with no clear surface volcanic expression. Although not recorded at all stations, during 1995 and possibly longer, tremor has contained a previously unrecognized dominant frequency of 7 Hz with a consistent amplitude of 1 µm/s. During April, May, and late June, intervals of strong 2-Hz tremor dominated the seismic records. Very strong tremor took place for a few hours on 26 June. Tremor declined thereafter and remained low from early July through much of August.
Lake water increased in Cl and especially Mg ions closer to the eruption. The Mg/Cl ratio rose from values around 0.035 in early 1995 (BGVN 20:05), to the most recently reported value of 0.072 on 15 August (table 8); there was a further increase of unstated magnitude on 20-21 September (table 7). Prior to the eruption, the rise in Mg was thought to represent leaching from unweathered andesites. The increase in Cl, which reached greater levels than seen in at least 9 years, was thought to result from both large-scale evaporation and HCl input. The rise in Mg/Cl ratio represented the largest shifts seen since the large 1971 and 1975 eruptions. Shifts in the concentrations of K, Fe, and SO4 from samples collected on 18 July suggested increased input of SO2 into the vent-lake system rather than a water-rock equilibrium process in the vent. Although provisional, results for SO4 on 18 July suggested a 4.5% increase--the highest ever recorded for the lake.
Table 8. Ruapehu Crater Lake water analyses and temperatures at Outlet, 25 May-4 July 1995. Courtesy of IGNS.
| Date | Mg (ppm) | Cl (ppm) | Mg/Cl | Outlet Temp (°C) |
| 25 May 1995 | 385 | 7603 | 0.051 | 46 |
| 16 Jun 1995 | 427 | 7797 | 0.055 | 38 |
| 04 Jul 1995 | 514 | 7976 | 0.064 | 33 |
| 18 Jul 1995 | 551 | 8014 | 0.069 | -- |
| 15 Aug 1995 | 584 | 8154 | 0.072 | -- |
Deformation surveys on 4 July and 15 August confirmed only small measurable changes. This result suggested little or no magmatic movement in the upper part of the vent, in contrast with much of the other data in the same time interval. The limited deformation may have been a consequence of an open vent that allowed a small amount of magma to escape without measurable deformation. Measurable changes were apparently evident later (20-21 September, table 7).
Larger eruptions in late September. Ruapehu produced a series of larger eruptions during 23-30 September and later, continuing into October. Preliminary estimates suggested the eruption plumes reached 8-12 km heights as reported by aviation sources (table 7 and figure 18). The aviation reports and occasional satellite imagery typically noted plumes possibly extending as far as ~270 km from the summit (from an episode of eruptive bursts that were thought to have been more dense and ash-rich beginning at 1600 on 24 September). This particular series of bursts only initially reached low levels, but ash was said to have been lifted higher by induced cumulus convection, ultimately reaching a reported altitude of ~12 km. On subsequent days, the plume's typical maximum lateral extent was given as roughly 60 km.
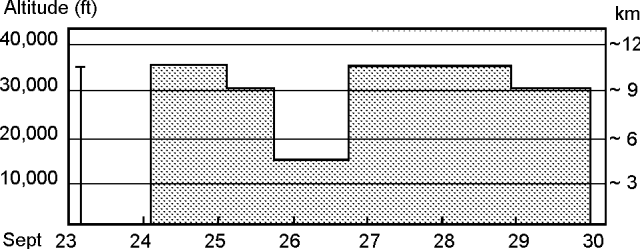 |
Figure 18. Histogram summarizing the height of column tops for Ruapehu eruptions, based on available aviation reports and IGNS Science Alert Bulletins. Courtesy of Nick Heffter, NOAA. |
For the 24-hour interval ending on 24 September (exact times undisclosed) observers at Ruapehu noted both small- and medium-sized steam-rich ash-bearing explosions, the largest of which had plumes that rose from 500 to over 1,500 m. On 24 September medium-sized explosions yielded a distinctive, though modest seismic signature and lesser explosions were not detectible. Near midnight on 24 September the number of volcanic earthquakes rose significantly; strong tremor roughly doubled in intensity compared to that morning; reflected seismic waves from numerous explosions yielded a confused signal.
Reports for 25 September (at 0900, 1700, and a summary the next day) noted that an eruption column had developed from many moderate-sized eruptions. With its top at 8-10 km altitude, the plume was blown into the E quadrant for several tens of kilometers, dropping ash 18 km E (Desert road; total accumulation, 1 mm), 30 km E (the Kaimanawa mountains), and 120 km E (traces at the coast). The ash deposited at Desert Road contained mainly particles of 10-250 µm size; 30-60% of the particles were juvenile. Significant amounts of ash had accumulated in the vent area but large blocks had been ejected less than ~1 km from the vent. Outlet was dry, but based on later observations, the inner crater still contained a lake.
At 0900 on 25 September a lahar flowed down the Whangaehu valley. The valley forms a key drainage that descends ESE from the crater, ultimately curving S and W to encircle Ruapehu's S flank; downstream parts of the Whangaehu Valley cross the Auckland-Wellington rail line near Tangiwai. Later the lahar declined in size, but it was noted as still continuing and sediment-laden at 1630, having eroded a stream bank upstream of the Tangiwai bridge. Another lahar flowed W of the crater down Mangaturuturu Valley.
At 1700 on 25 September, the volcanism during the previous 30 hours was described as episodic, punctuated by two cycles of increasing then decreasing intensity. Based on seismic data, the second cycle was not quite as vigorous as the first. In the night and morning of 25-26 September minor amounts of ash continued to fall over the volcano's E quadrant. Low-to-moderate tremor continued until at least 1700. Occasional explosions were large enough to be recorded seismically but were smaller than those in the morning of the previous day. Although during much of the day visual observations were hampered by cloud cover, at 0600-0700 on 26 September observers saw the plume drifting ESE. The plume was fed by numerous weak explosions and observers noted that minor amounts of ash fell throughout the night. Observers also noted that lahars flowing down the Whangaehu Valley were smaller than on the previous day. A very small lahar, deposited during an earlier event, was noted in the SE-flank Wahionoa Valley.
A SO2 flux measurement at 1600 on 26 September indicated an output of 2,600 +- 400 metric tons/day. Such high fluxes confirmed significant magmatic involvement in the eruption. Although cloud cover limited the visibility on much of 26 September, the low seismic activity during the day suggested explosions of modest size. From about 2300 through early the next morning tremor amplitude fluctuated, increasing up to moderate levels. After 0400 tremor coexisted with many volcanic earthquakes.
Visual observations made after sunrise on 27 September correlated tremor and earthquake increases to moderately vigorous eruptive activity. During this period (0600-0700) the earthquakes reached a size equivalent to those on 25 September. By about 0930 on 27 September, however, the earthquakes stopped and the eruption's size dropped. Earthquakes then remained undetected until at least 1700.
Aerial observers on 27 and 28 September saw that Crater Lake had been greatly reduced in size; although indistinct, the steaming surface had clearly dropped by tens of meters. They also saw a previously concealed terrace formed during the 1945 eruption and recognized a new small lahar deposit in a drainage on the NW flank (in the Whakapapaiti Valley). On 27 September observers reported no water in the upper Whangaehu Valley and viewers the next day stated that downstream at the Tangiwai bridge the water level had returned to normal.
During the 24 hours ending at 0930 on 28 September, moderate levels of seismicity prevailed, and three larger volcanic earthquakes took place in the 0215-0340 interval. These earthquakes may have been associated with discrete explosions. Other volcanic earthquakes at 0736 and 0839 were linked to mild puffs of ash-bearing steam rising from the crater.
Ruapehu's alert status was raised to Level 4 (table 9) on 25 September. As late as early October, there had been no reports of death or injury caused by the eruption. Because of potential hazard to aircraft, aviation and meteorological workers have carefully monitored the eruption, producing forecasts of the plume's transport and dispersal ("VAFTAD" modeling program, see BGVN 19:06) as well as the actual visible observations that have confirmed the height of the plume's top (figure 18).
Table 9. Scientific Volcano Alert Level system for New Zealand volcanoes. Note that the frequently active cone volcanoes of New Zealand (White, Ngāuruhoe, and Ruapehu) require definitions different from all other volcanic systems. Because of this, Alert Levels 1-4 are split into two parts: one for the frequently active cones and the other for reawakening systems. Courtesy of the IGNS.
| Alert Level | Phenomena Observed | Scientific Interpretation (Volc Status) |
| 0 | Typical background surface activity; seismicity, deformation, and heat flow at low levels. | Usual dormant, intra-eruption or quiescent state. |
| 1 | Departure from typical background surface activity. Minor phreatic activity. | Apparent seismic, geodetic, thermal, or other unrest indicators. Signs of volcano unrest. No significant eruption threat. |
| 2 | Increase from a low level of activity, accompanied by changes to monitored indicators. Significant change in level or style of ongoing eruptive activity. | Increase in seismicity, deformation, heat flow and/or other unrest indicators. Indications of intrusive processes. Local eruption threat. |
| 3 | Increased vigour of ongoing activity and monitored indicators. Significant local eruption in progress. | Commencement of minor eruptions at reawakening vent(s). Relatively high and increasing trends shown by unrest indicators. Increasing intrusive trends indicate real possibility of hazardous eruptions. |
| 4 | Significant change to ongoing activity and monitored indicators. Hazardous local eruption in progress. | Establishment of magmatic activity at reawakening vent(s), with acceleration of unrest indicators. Large-scale eruption now appears imminent. |
| 5 | Hazardous large volcanic eruption in progress. Destruction within the Permanent Danger (red) Zone. | Significant risk over wider areas. |
The late September eruption was widely covered in the news. According to Reuters (25 September), "A conservative Australian politician is linking nuclear testing by China and France to a string of earthquakes around the Pacific and volcanic eruptions in Montserrat and New Zealand's Mount Ruapehu." Although this connection was discounted by earth scientists, the accusation did reverberate in the media and parliaments world wide.
Information Contacts: C.J.N. Wilson, B.J. Scott, P.M. Otway, and I.A. Nairn, Institute of Geological & Nuclear Sciences (IGNS), Private Bag 2000, Wairakei, New Zealand; Bureau of Meteorology, Northern Territory Regional Office, POB 735, Darwin NT 0801, Australia; J. Heffter, National Oceanic and Atmospheric Administration (NOAA), Air Resources Laboratory SSMC3, Room 3151, 1315 East West Hwy., Silver Spring, MD 20910 USA; Synoptic Analysis Branch, NOAA/NESDIS, Room 401, 5200 Auth Road, Camp Springs, MD 20746, USA.
Late September-early October eruptions rival those in 1945
Ruapehu's current eruptive period began with a vent-clearing blast on 29 June 1995 and a series of larger eruptions began on 23 September (BGVN 20:09). More recently available information (in Immediate Report RUA 95/06) highlighted 18 and 20 September observations summarized below. These are followed by brief comments on eruptions during October.
Activity during 18-20 September. An eruption at 0805 on 18 September was accompanied by a ML 3.6 earthquake; the eruption produced the largest lahar down the ESE flank since 1975. The ESE drainage is called the Whangaehu River. Two days later, at 0122 on 20 September, another eruption associated with a smaller earthquake (ML 3.2) also sent a smaller lahar down the Whangaehu River.
At roughly 0800 on 18 September the ski field manager heard what he initially thought was wind noise while he was inside a ski lodge building on Ruapehu's flanks, a spot 400 m N of the Whangaehu channel (Aorangi lodge at Tukino). He went closer to the river and saw a 12-18 m deep lahar in the narrow channel.
Later that day, a flood warning gauge 27 km downstream was triggered at 1123, suggesting the lahar moved at an average speed of roughly 2.3 m/s (8.3 km/hour). By around noon at Tukino the lahar was 40-m wide and had covered the snow up to 20-30 m above the Whangaehu valley floor. The lahar's surface rose about 11 m on the outside of one turn. A preliminary estimate of peak flow was >1,000 m3/s; the local velocity, 15 m/s. An early phase of the lahar had cut out 2-3 m of ice and snow formerly filling the valley.
The 18 September lahar arrived at a point 57 km downstream from Crater Lake (Karioi) at 1515, 7 hours after the eruption. Volume of the lahar at this point was estimated (by groups identified as NUWA Wanganui and ECNZ) at ~2 x 10⁵ m3; the peak flow, at ~34 m3/s. The lahar destroyed a hiking bridge, leaving only its 0.2-m-high concrete abutments on either side of the river.
The smaller 20 September lahar arrived at 57 km downstream (Karioi) 8 hours after the eruption; its size there was estimated at ~0.9 x 10⁵ m3; its peak flow, at ~21 m3/s. In an area above ~2,000 m elevation, the 18 and 20 September lahar deposits were separated by an intervening snow layer. Still higher, above ~2,400 m elevation, both lahars had emerged from the upper Whangaehu valley's snow and ice tunnel system. Lahars passing through and over the uppermost part of this system had produced considerable new crevasses and collapse features in the snow and ice. On 20 September, collapsed holes downstream of the large ice cave (located below the crater lake's drainage point at Outlet, figure 19) were filled with non-steaming water that had apparently cooled. The ice cave itself appeared largely intact.
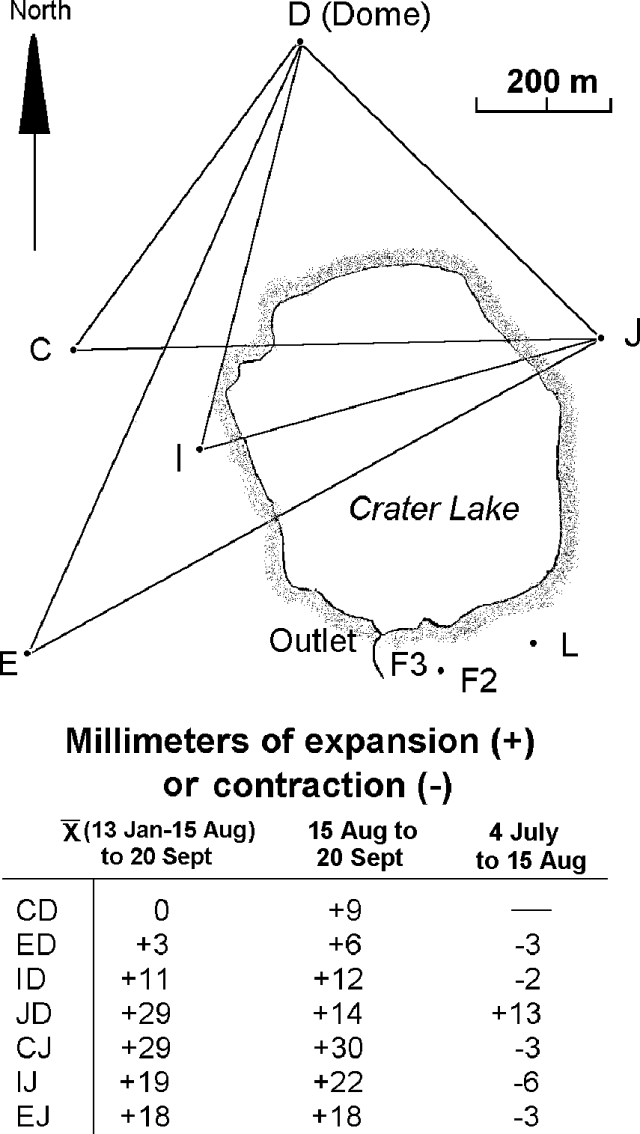 |
Figure 19. (above) Survey points for deformation studies at Ruapehu (prior to the disappearance of Crater Lake). (below) Summary of deformation between stated stations and given time intervals. Courtesy of IGNS. |
A helicopter was used to visit the crater on 20 September. A large column of steam rose from the waterfall immediately below Outlet. A large volume of lake water continued to spill over the waterfall even though recent eruptions through the lake had expelled substantial lahar-forming discharges. Ash from the 18 September eruption was plastered on some steep slopes. Ash from the 20 September eruption was plastered on the new snow around the lake margins. On the E side of the lake there was a N-trending, 100-m-long lobe of ash on the glacier surface. Scoria clasts found near Outlet (the largest, 20-50 cm across) formed a continuous layer trapped behind a low lava ridge. Their distribution suggested they were deposited by a passing surge rather than as impacting ballistics. Absence of snow on the surface of the scoria indicated they had probably arrived during the 20 September eruption and some clasts still had warm interiors. Sampled clasts were black in color, and consisted of an unaltered plagioclase-, augite-, orthopyroxene-bearing andesite. The lack of Fe-Ti oxides makes them similar to 1966 ejecta; in contrast, ejecta from 1971 and 1975 did contain minor amounts of Fe-Ti oxides. Three ash samples collected from within the crater contained lapilli up to 25 mm in diameter and composed of angular lithic material. Ash finer than 2-mm diameter was dominated by gray shiny spheroids and globules of sulfur with lesser amounts of gray comminuted lake bed material.
In the interval 15 August-20 September the deformation of the area about Crater lake was significant and indicated moderate inflation (figures 19 and 20). The deformation survey was hampered by snow and ice, which deeply buried most survey stations. Survey mark D had been bent 70 mm out of position immediately prior to the August survey, but eccentricity corrections enable a valid comparison with all former observations at D. Maximum changes took place in the E-W direction. These changes were similar to those computed by comparing the mean of the five surveys made earlier this year to the September survey (first column, bottom of figure 19).
Non-elastic inflation of the style seen was previously noted as much as 2 weeks prior to eruptions on 8 May 1971 and 24 April 1975. This short-term inflation (lasting weeks) was also seen on 12 occasions during 1980-91; these occasions were tentatively correlated with intense heating and minor eruptions. Still, the relation between inflation magnitude and the corresponding eruption remains uncertain.
The 20 September crater visit yielded the following lake observations. The lake's temperature was 48.5°C (on 15 August it had been roughly 20 degrees C cooler, figure 20). There was a strong smell of SO2. The volume of water escaping at Outlet was estimated visually at 1 m3/s (on 15 August it was only ~50 l/s). This exceptional output was the largest seen in 24 years.
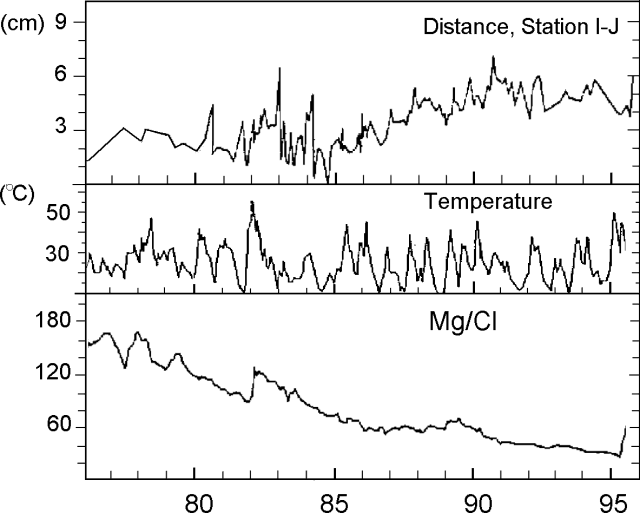 |
Figure 20. Plots of Ruapehu's cross-crater deformation, crater lake temperature, and Mg/Cl ratio for 1976 through late-1995. The cross-crater deformation is approximately E-W (between stations I and J, figure 19). Courtesy of IGNS. |
Lake water sampled on 20 September showed clear increases in the concentrations of Mg, Cl, and SO4 ions, and in the ratio of Mg/Cl (figure 20). The observed concentrations for 15 August and 20 September, respectively, were as follows: Mg, 584 and 713 ppm; Cl, 8,154 and 8,619 ppm; and SO4, 26,600 and 30,600 ppm. Increases in Mg began in May and pointed to dissolution of fresh andesitic material into the hydrothermal system. Although previously it was not clear if the source of Mg was juvenile or older andesites, the increased amounts of Cl and SO4 firmly established the input of fresh magmatic material.
SO4 concentrations stand at the highest levels ever recorded at Ruapehu. In the absence of synchronous increases in K, and noting that Ca continues to be controlled by gypsum solubility, it is clear that the increases in SO4 were not attributable to dissolution of secondary hydrothermal minerals. Instead the SO4 increases indicated greater SO2 flux into the lake. Assuming a lake of 9 x 10⁶ m3, the increase in SO4 from 15 August to 20 September equates to a minimum input of ~700 metric tons/day of SO2 into the lake. This behavior differs from that observed prior to the 1971 eruptions: The indication is that the quantity of magma involved in the current activity is larger than in the 1971. Taken with the rather moderate degree of cross-crater deformation seen, the quantity of SO2 discharged into the lake indicates connection to larger volumes of degassing magma at depth.
Volcanic tremor remained at background from early July until early September; its amplitude was ~1 µm/s for signals centered around 7 Hz, and at this value or slightly lower for signals centered around 2 Hz. During a five day interval starting on 6 September, the amplitude of 2-Hz tremor increased. During the 24 hours prior to the 18 September eruption and earthquake (BGVN 20:09), predominantly 7-Hz tremor occurred, at one point doubling in amplitude. Later, ~80 minutes prior to the eruption and earthquake, tremor again increased by a factor of 2-3, with 2-Hz tremor becoming dominant. Although dramatic, Ruapehu often displays wide-ranging shifts in tremor amplitude and, in retrospect, the increased amplitudes seen would not have been a useful way to predict the eruption.
The 18 September earthquake took place at 0805, continuing for 6 minutes. Analog seismograms from the three local stations (Dome, Chateau, and Ngāuruhoe) were pegged, and the M 3.6 estimate was made based on amplitude recorded by the tremor-monitoring system. After the earthquake, predominantly 2-Hz tremor prevailed, remaining at or above the pre-earthquake amplitude. Later the same day (18 September), strong 1-Hz tremor occurred--for the first time at Ruapehu since the early 1970s.
Further minor earthquakes were recorded during the next few days. On 19 September seismometers registered a ML 2.2 earthquakes as well as four other discrete earthquakes; on 20 September there were ML 3.1 and 3.2 earthquakes followed by another interval of strong 1-Hz tremor until 0900.
October eruptions. At the time of this writing, IGNS reports for October are incomplete, but a brief survey of available "Science Alert Bulletins" and aviation reports suggested that minor eruptions continued and in mid-October moderate ash-rich eruptions took place. On 11 October a plume was seen in satellite imagery; on 12 and 14 October, pilot and associated aviation reports indicated ash to at least ~10 km altitude.
The 11 October eruption was described as near-continuous moderate eruptive activity that included hot ballistic blocks and lightning. Subsequent lower intensity eruptions presumably fed the plume so that its proximal end remained attached to the volcano. The eruption deposited ash in a blanket with a tentative volume between 0.01 and 0.05 km3. Thus, the steam-rich plumes seen in the 3 weeks prior to 11 October gave way to more ash-rich plumes during this eruption. A thin blanket of ash was also deposited during the 14 October eruption.
The absence of a crater lake was confirmed on 14 October. By 17 October, partly impeded views into the crater revealed steam and ash emitted from at least three vents, and a still-dry crater floor. COSPEC measurements around this time suggested the SO2 flux was over 10,000 metric tons/day. A COSPEC flight on 21 October gave viewers their first look at a possible new lava dome, however, there were no subsequent confirmations of the dome in available reports.
Information Contacts: C.J.N. Wilson, B.J. Scott, P.M. Otway, and I.A. Nairn, Institute of Geological & Nuclear Sciences (IGNS), Private Bag 2000, Wairakei, New Zealand; Bureau of Meteorology, Northern Territory Regional Office, P.O. Box 735, Darwin, NT 0801, Australia.
Correction: The most recent analysis indicates that there were 18 hydrothermal eruptions recorded between 0600 and 1640 on 20 September. Table 7 indicated "15 small phreatic eruptions witnessed."
Geochemical analyses of lake water; record glacial retreat continues
No significant eruptions are known to have occurred at Ruapehu since November 1995. During a crater lake inspection on 18 January 1996, in conditions of limited visibility, the crater floor was occupied by a 70-m diameter lake whose surface lay around 80 m below the overflow level. The lake was chiefly green-gray in color; the E part of the lake, beneath Pyramid Peak, was mostly clear. Vigorous fumaroles were present above the lake s W and N shores, and beneath Pyramid Peak. At the Peak s foot, new crater wall exposures revealed 20 m of steep fans composed of ash and deposits tentatively identified as lake sediments. Both of these deposits were being dissected and eroded into mudflows. A zone of 1995 ejecta, 5 m thick, included a scoria-and-block unit (probably erupted on 11 October) and fine-medium ash layers. Glaciers in the crater basin and Whangaehu continued their rapid, and in the experience of the IGNS observers, unprecedented, retreat.
A tilt-leveling survey was conducted using four Dome benchmarks falling along a 45-m-long line radial to the crater. The benchmarks had moved since last measured. Assuming site instability at these benchmarks had developed since the latest pre-eruption survey (April 1994), the Dome s deformation averaged 30 ± 10 µrad deflation.
Both earthquakes and tremor started to decline in mid- October. From 31 October-8 November, long-duration events almost completely ceased, while short-duration events continued unchanged. During the month of November through 18 January, the previously seen 2-Hz tremor ceased, replaced mainly by higher-frequency tremor. This 7-Hz tremor had amplitudes 3-4x higher than seen prior to the commencement of activity in September 1995. Numerous, short-duration high-frequency earthquakes continued to be recorded at the Dome station through December, January, and into February 1996, defining Ruapehu s most recent background seismicity.
Maximum fumarole temperatures in one area (station A, beneath peg I) had fallen from 281°C (December 6, 1995) to 92 °C (18 January). Despite the lower temperatures, the discharges were still vigorous but notably water-rich. H2/Ar temperatures fell only slightly over this period (from 397 to 392°C), suggesting that the cooling reflects near-surface quenching by shallow groundwater.
Analytical results for lake water samples are given in Table 10. These include samples taken on 6 December (by sampler suspended from a helicopter), and on 20 December 1995, and 18 January 1996 (from the lakeshore). A dilution trend with time is evident in the data, but it is not clear whether this represents an artifact of sampling or decreased magmatic input into the lake. So far, ratios of SO4/Cl and Mg/Cl show inconsistent trends. Much of the volcano s discharged heat and gases evaded the lake, to be released instead beyond the lake s NE and SW margins. A COSPEC flight on 31 December measured an SO2 flux of 1,295 ± 160 tons/day; this value was presumed to indicate continuing, steady state, open vent degassing.
Table 10. Lake water temperature and chemical analyses from Ruapehu, 6 and 20 December 1995, and 18 January 1996. Courtesy of IGNS.
| Date | Lake Temp (°C) | Mg | SO4 | Cl | SO4/Cl | Mg/Cl |
| 06 Dec 1995 | 57.7 | 903 | 11400 | 12536 | 0.909 | 0.072 |
| 20 Dec 1995 | 60.0 | 615 | 7070 | 8127 | 0.870 | 0.076 |
| 18 Jan 1996 | 49.6 | 367 | 5780 | 5664 | 1.021 | 0.065 |
Information Contacts: P.M. Otway, S. Sherburn, and I.A. Nairn, Institute of Geological & Nuclear Sciences (IGNS), Private Bag 2000, Wairakei, New Zealand.
Landslides and lahars in the aftermath of the 23 September eruption
After a vent-clearing blast on 29 June 1995, Ruapehu began a series of larger eruptions on 23 September 1995 (BGVN 20:09 and 20:10; Ruapehu Surveillance Group, 1996). Since then considerable effort has gone into the repair of survey stations and monitoring equipment. During the interval 26 February-23 April 1996 volcanic activity generally remained low; however, observers noted mass wasting both in and outside the crater, and within the rising crater lake at the summit they saw new fumaroles and the emergence and later submergence of small islets.
Since last reported in early February, both shallow, high-frequency earthquakes (around 20-60/day increasing after about 25 February) and 7-Hz tremor continued at the Dome station (N of the crater, figure 21). Tremor amplitude averaged around 2 µm/sec. Earthquakes during late February were generally very small, high-frequency ones close to Crater Lake. These events were accompanied by strong surface waves suggesting sources in the upper few hundred meters and their nature requires an origin that involved rock shearing. Their increase in late February was consistent with suspected extrusion of lava in late March.
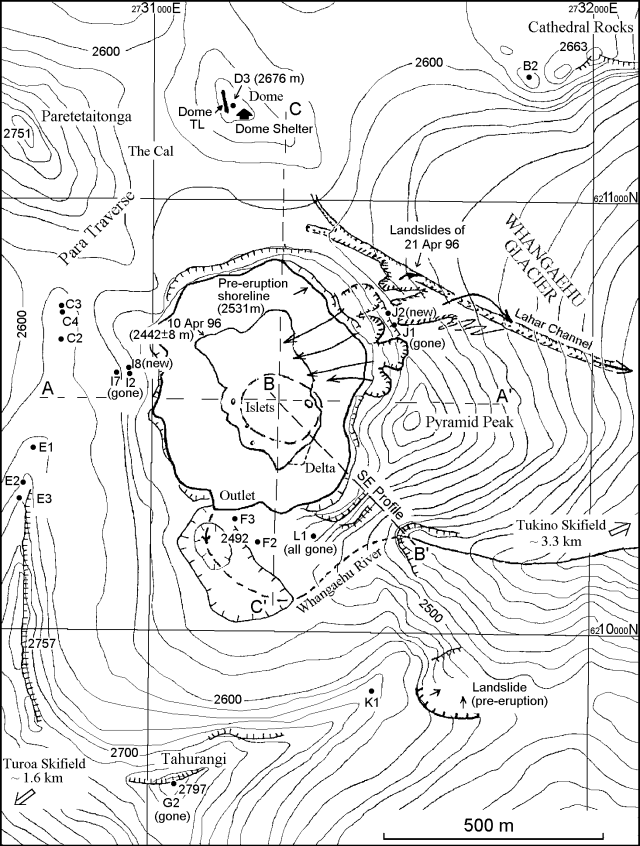 |
Figure 21. Topographic map of Ruapehu's Crater Lake and vicinity showing landslides and associated scarps (arrows and hachured lines) in addition to lahars, lake shore lines and the three profiles on figure 22. Courtesy of IGNS. |
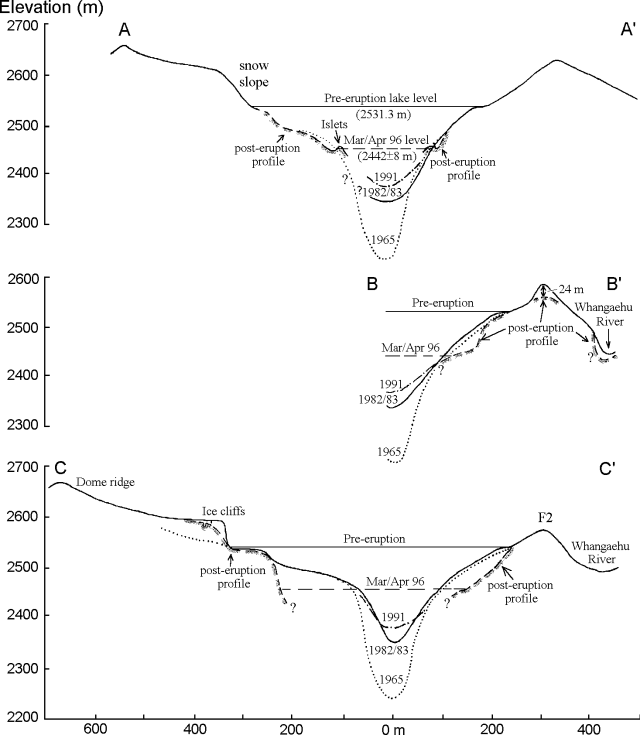 |
Figure 22. Topographic profiles of Ruapehu's crater for areas shown on figure 21. The most recent profiles were constructed from photos taken on 10 April 1996; at that time the bathymetry of the new lake was still unknown and the islets' composition was ambiguous. Courtesy of IGNS. |
The suspected extrusion was first noted as a 6 x 4 m islet within Crater Lake on 21 March photos. Clear weather and a lack of steam on 10 April allowed better photographs. These pictures revealed two new, even smaller islets nearby and another larger one, interpreted as landslide debris, on the opposite side of the lake (profile A-A', figure 22). As of early May, the make-up of these islets remained ambiguous.
The 10 April photo opportunity enabled workers to plot three profiles across the crater (figures 21 and 22). The profiles show the surface of Crater Lake as well as the surrounding crater walls. These profiles were used to make preliminary estimates of the refilling rate for Crater Lake. By assuming similar factors to the 1945-50 interval the lake may completely refill in about 4 years. Post-eruption morphological changes included those on the crater floor and a roughly 24-m drop at the SE crater rim (profile B-B').
After heavy rains and landslides a large secondary lahar was triggered on the NE flank, down the Wahangaehu Glacier and River, about mid-day on 21 April (figure 21). Within the crater, mass wasting raised the lake by ~5 m, covering the islets. About 10 minutes before the lahar was seen at Tukino a M 2.0 seismic signal came from the summit that was unlike any in the past several years. It lasted for ~4 minutes and consisted of two main phases followed by a long coda. This signal was termed a landslide earthquake after researchers concluded that it came from the landslide that generated the lahar.
Figure 21 shows the scarps and landslide paths in the immediate vicinity of the crater, the largest on the NE crater wall was ~40-50 m wide. On the NE, directly outside the crater and immediately E of where station J had been, one failure was ~30-m wide. The material involved in the latter failure consisted mainly of 1995 ejecta. It went well beyond the area shown on figure 21, traveling down the Whangaehu Glacier along a well-developed lahar-cut channel. It then flowed down over the glacier surface, by-passing a sub-glacial tunnel carved by earlier lahars. The lahar entered the Whangaehu River at the glacier's toe. Another landslide on the SE sector (figure 21) apparently began prior to the 1995 eruption but became active again in late February 1995.
Reference. Ruapehu Surveillance Group, 1996, Volcanic eruption at a New Zealand ski resort prompts reevaluation of hazards: Eos, Transactions, American Geophysical Union, v. 77, no. 20, 14 May 1996, p. 189-191.
Information Contacts: P.M. Otway, S. Sherburn, and I.A. Nairn Institute of Geological & Nuclear Sciences (IGNS), Private Bag 2000, Wairakei, New Zealand
Eruption on 17 June sends ash several kilometers above the summit
Between approximately 1430 on 15 June and 0100 on 16 June, volcanic tremor reached the highest levels recorded during the previous six months. There were no reports of volcanic activity accompanying this tremor episode; however, poor weather conditions prevented observations after the start of the tremor. At about 0600 on 17 June the level of volcanic tremor started to increase again. The first of several eruption plumes was seen around 0650; larger pulses were observed at 0710 and 0825. The plumes rose several kilometers, carrying voluminous amounts of coarse ash. Large blocks rising to heights of 400-500 m fell as far as 600-700 m from the vent. The second pulse was accompanied by a small lahar down the [E]-flank Whangaehu River valley (see map in BGVN 21:04). Ashfall was recorded as far N as Turangi, 32 km away, due to the prevailing southerly wind. The Alert Level was raised to 3, indicating a significant local eruption in progress (see BGVN 20:09).
Volcanic tremor continued to increase until about 1100 when it plateaued at levels similar to those during the 11-12 October 1995 eruptions. By about 1330 the level of tremor was starting to decline, and the style of activity changed to discrete explosive events. Around 1500 the volcano started to erupt every 10-15 minutes, sending ash-laden plumes to several kilometers height (figure 23). During an overflight around the same time, observers confirmed a small lahar down the Whangaehu catchment but no evidence for pyroclastic flows out of the summit crater basin. Light ashfalls occurred over much of the zone extending N from the volcano to the Bay of Plenty between the coastal towns of Tauranga and Whakatane. A significant Strombolian eruption during 2100-2200 on 17 June was characterized by loud detonations and sprays of glowing rocks ejected above the crater, and was accompanied by strong seismicity. Through to about 0300 several discrete eruption earthquakes were recorded, but the size and rate decreased through the morning of 18 June.
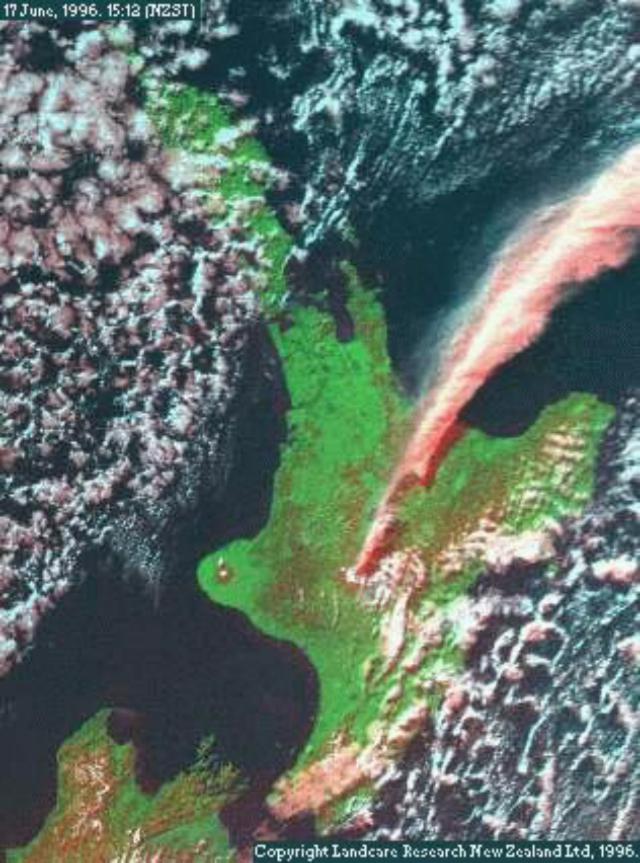 |
Figure 23. Satellite image of the Ruapehu eruption plume, 1512 on 17 June 1996. The ash cloud is rising to about 20 km altitude in clear weather over North Island, New Zealand. The image was created from NOAA-14 data by combining the visible, near infrared, and one thermal infrared wavelength band. Courtesy of Manaaki Whenua Landcare Research. |
Observations made on overflights the morning of 18 June confirmed that the new lake was destroyed and the crater floor was dry. The active vent was in the S part of the crater floor, on which thick deposits of bombs and lapilli had accumulated. The bombs and blocks ejected during the night traveled farther than those erupted on 17 June, to ~1.5 km from the vent. Dome Shelter remained intact, as did the seismic signal from the shelter. On 18 June the active vent was producing weakly ash-charged plumes 1,000-2,000 m above the summit, which were blown downwind, forming a low-level haze at 1,500-3,000 m altitude.
Low-frequency volcanic tremor remained elevated, suggesting that molten material continued to move into the base of the volcano. This eruption was continuing at press time in late June, and had caused significant closures of airspace around the Auckland airport and all of North Island. Additional details will be reported next month.
Information Contacts: B.J. Scott, Institute of Geological & Nuclear Sciences (IGNS), Private Bag 2000, Wairakei, New Zealand; Manaaki Whenua Landcare Research Ltd., P.O. Box 38491, Wellington, New Zealand (URL: https://www.landcareresearch.co.nz/).
Variable intensity eruptions continue
Variable intensity eruptions continued at Ruapehu. Although during 15-16 June volcanic tremor reached the highest levels seen in the past six months (BGVN 21:05), tremor dropped to background levels early on 20 June. Tremor and local earthquakes both remained low until 26 June when they increased slightly. A more definite increase in the intensity of seismicity took place on 27 June. Ruapehu then began larger discrete eruptions (around 0400) followed by ash-bearing eruptions (around 1000).
Airborne observers saw the volcano at 1120-1140 on 27 June and reported weak emissions that rose ~100 m above the crater. There appeared to be two source vents in an area N of the former crater lake's outlet area (on the crater's E side). The westernmost vent produced vivid white fumes; the easternmost vent produced dark gray ash. Ashfall had accumulated on Mitre Peak. Variable eruptions continued and after 1310 they grew larger. A ~6-km-tall ash column developed and ash fell to the E and SE.
The eruption continued the next day (the 28th), but appeared in conjunction with less seismicity and as a relatively gas-rich plume carrying minor ash. Tremor then was described as 5-10% of that recorded during the mid- June peak. Later, at 1144 on 28 June, a dark gray plume rose to over 600 m. Associated seismicity at the Dome station was weak. Weak to moderate ash emissions were detected 100-150 km downwind. Concern was raised about the mobility of near-source ash deposits.
A substantial amount of SO2 escaped from the volcano. Correlation spectrometer (COSPEC) measurements of SO2 flux rose from 4,100 metric tons/day (t/d) on 19 June to 5,100 t/d on 28 June (revised from an original estimate of 3,800 t/d), and remained high on 10 July at 6,000 ± 1,500 t/d.
Predominantly gas-rich plumes were seen from the ground on 1 July. Low seismicity, similar to that of 28 June, prevailed until 0400 on 2 July. At that time there were increases in both low-amplitude, high-frequency emergent events (the sort previously correlated with small ash eruptions) and larger high-frequency impulsive (A-type) events (interpreted as located at shallow depths beneath the summit). Bad weather on 2 July prevented detailed ground observations, but commercial aircraft reported ash-bearing plumes rising up to 600 m above the summit and blowing E.
The next day (2 July) white plumes were seen to 300 m above the summit. The day after (4 July) pilots reported a dark ash plume at ~3 km altitude extending 40 km downwind. At 1520 on 4 July, clouds cleared from the summit and observers saw a dark ash column rising up to 300 m above the summit; it deposited ash on snow in the ski area. On the Dome seismograph a large number of impulsive seismic events (larger than seen in the past few days) appeared to coincide with the ash column.
A report on 5 July stated that only relatively minor emissions had taken place since the last moderate-sized ash eruption (the event of 27 June). Intermittent minor eruptions still continued on 5 and 6 July, but on the later day, calm weather conditions allowed relatively high ash-bearing columns to develop.
An interval of increased seismicity, reaching levels seen in mid-July, began at 2030 on 7 July and preceded discrete inferred eruptions at 0115-0730 on 8 July. These eruptions took place at 2 to 3 minute intervals. An hour-long, intense burst of shallow seismicity ending about 0830 was followed by another interval of discrete explosions that diminished after about 1300. A helicopter flight at 0950-1030 documented an ash-poor plume to about 4.6 km altitude; an afternoon flight at 1330 also took place. Together, these flights confirmed that Strombolian eruptions ejected lava bombs up to 500 m above the vent.
Although seismicity dropped and then fluctuated in the last hours of 8 July, it resumed for intervals on 9 July. Eruptions continued on 9 July but bad weather and decreased, typically low seismicity prevailed during most of the next week.
At 1435-1735 on 16 July the volcano discharged an ash column to over 6-km altitude. Other eruptions followed; from 1735 to 0516 the next day there were 15 large explosive events, most with well-recorded air-wave phases. Tremor of variable amplitude and several hours of elevated seismicity prevailed. Aviation reports noted plumes at 3.3-4.6 km.
On 17 [July] seismicity dropped beginning at about 0330 and remained low for the next several days. Despite the lull in seismicity, in the afternoon on 18 and 19 [July] plumes rose 100-300 m above the summit.
On 20 July Ruapehu produced the largest outbursts since those in mid-June. Early on 20 July the seismicity and tremor again increased significantly; by about 0700 that day the tremor was replaced by small eruption earthquakes with airwave signals. Although pilots noted ash rising to 6.1-7.5 km altitude, some sustained moderate eruptions rose as high as 10.7 km and included bombs thrown 1.4 km above the crater and fire fountaining. Continuing through the next day, the seismic signals included both episodes with 2 to 7 discrete events per hour and episodes with continuous tremor and fewer discrete events. On 21 July the eruption's E-blown plumes, which were brown in color and thought to contain ash but not be ash-rich, ascended as high as 4.3 km.
Information Contacts: Colin Wilson, B.J. Scott, B.F. Houghton, C.J. Bryan, S. Sherburn, T. Thordarson, and I. Nairn, Institute of Geological & Nuclear Sciences (IGNS), Private Bag 2000, Wairakei, New Zealand.
Variable-intensity eruptions continue
Variable-intensity eruptions continued during late July, August, and September after the last report (BGVN 21:06). The Alert Level between 22 July and 5 August remained at 3 (significant local eruption in progress). On 6 August the Alert Level was lowered to 2 (minor eruptive activity).
During 22-23 July, 2-7 discrete events were recorded every hour, and brown or light gray-brown plumes were observed. Pilot reports indicated that plumes reached heights of ~6 km. Minor ashfall was seen in downwind areas. Volcanic activity increased during 1500-2200 on 23 July, with moderate ash eruptions, explosive events, and volcanic tremor. The activity then declined, and only about one volcanic event was recorded each hour until 0600 on 24 July. After that time, tremor levels increased again, and moderate ash eruptions recommenced with some ash plumes rising to altitudes of 5,500-7,600 m. Minor ashfall was observed in Turangi (~35 km N) and Taupo (~70 km N). A COSPEC flight measured a SO2 flux rate of ~9,000 metric tons/day. From 1600 on 24 July to 0200 on 25 July, seismicity suggested 3-7 ash eruptions every hour. After then only weak ash eruptions took place. Detectable ashfall was reported from the Hastings-Naiper area on 25 July.
A ground observation at 0900 on 26 July found that an apparently ash-free gas column rose from the crater. This period of quiescence was ended by a moderate eruption at 1253, which sent an ash column to 9-10 km altitude and was accompanied by very emergent volcanic earthquakes. Ashfall was observed near the volcano. Beginning at 1653, seismicity increased again and discrete ash plumes formed. On 27 July, 3-4 periods of relatively strong seismicity suggested that the eruptive activity continued. There was a white gas plume from the N section of the crater, and weak ash emissions from the S vent of the main crater. Ashfall was observed at Whakapapa in the morning.
On the morning of 28 July, pilots reported weak eruptive plumes up to 4,600 m altitude. A significant local ashfall was reported on the N slope around 0900. On the morning of 29 July, ground observations indicated only a white steam-and-gas plume around the summit area. On 30 July, intermittent tremor increased to low-moderate levels at 0100, then returned to low levels at 0900. This increased tremor accompanied very small ash eruptions with plumes dispersed at low elevations by strong winds. Pilot reports suggested a small amount of ash in the eruption plumes. An ash-bearing plume was also observed from Whakapapa at 1120.
A moderate ash eruption took place at 1930 on 31 July, accompanied by the resumption of moderate-level intermittent tremor. Eruptions also occurred at 2200 on 31 July, and at 0300 and 0630 on 1 August. Strong N winds kept the plumes at low elevations and caused most ash to fall on the S slope of the volcano. Ashfall at the Turoa Skifield from the eruption at 0300 on 1 August resulted in its closing. Moderate gas emissions with intermittent ash eruptions were observed on 1 August. A helicopter inspection at 1100 revealed that the active pit crater in the S of the basin might be deepening as intermittent ash eruptions excavated the tip of the magma column. Jetting onsets of ash emissions ejected blocks vertically; most fell back into the vent. No incandescence could be detected at the base of the eruption column. All these features suggested that the active vent was deep.
Tremor was low after 1100 on 1 August, but elevated during 0100-0600 and 1600-1800 on 3 August, and during 0300-0600 on 4 August, indicating that some minor ash emissions might have taken place. Tremor increased to moderate levels between 2000 on 4 August and 0700 on 5 August and appeared to have accompanied ash emissions. Very light ashfall was observed at Napier on the night of 4 August, and on the Desert Road the next morning (at 1100). A discrete earthquake was recorded at 0604 on 5 August near the Dome station; it appeared similar to the earthquake that resulted from a landslide on 21 April (BGVN 21:04). However, Tranzrail staff reported no sign of a high river level after inspection of the gauge at 1030. Tremor increased to low- moderate levels during 1500-1800 on 5 August, then returned to background.
A minor enhancement of eruptive activity occurred on the evening on 1 September consisting of two short-lived periods. The first was accompanied by an ash eruption that was reported by pilots and personnel at Flight Control Services in Taupo. The eruption plume trailed downwind (E) about 90-100 km. From 2301 to 2330 the second seismic sequence occurred, and an eruption produced minor ashfall over the Turoa Skifield area.
Information Contacts: B.J. Scott, Institute of Geological & Nuclear Sciences (IGNS), Private Bag 2000, Wairakei, New Zealand.
Elevated seismicity in late July
Volcanic tremor recorded during 26-28 July (figure 24) was the first significant seismic activity at Ruapehu since August 1996 (BGVN 21:11). The tremor started gradually at about 0330 on 26 July and increased to a maximum level at 0530. It stayed at that level, more than twice the usual background level, until 1030 on 27 July. A weaker tremor was recorded between 0220 and 0510 on 28 July. Seismicity returned to background levels during the next few days.
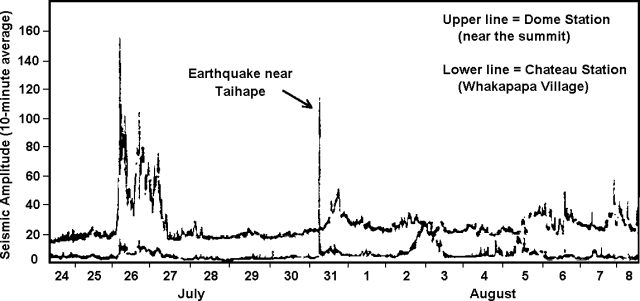 |
Figure 24. Seismic tremor amplitude (10-minute average) recorded at Ruapehu, 24 July-8 August 1997. Ticks along both axes are approximate. Courtesy of IGNS. |
Scientists visited the crater on 30 July and found that the temperature of the water in the crater lake was 64°C, essentially the same temperature as was recorded in mid-June. The lake surface was steaming strongly, and the water was churning and bubbling. Steam vents, recently drowned with the rising lake level, were causing the convection within the lake.
Further enhanced tremor was recorded on 31 July. During 5-8 August volcanic tremor levels fluctuated above typical background values (figure 24). None of the tremor recorded through 8 August was as strong as during 26-27 July. Significant volcanic tremor recommenced again shortly after 0700 on 2 October. Tremor amplitude quickly increased to a level equivalent to that on 25 July and lasted through at least noon. This tremor was similar to that recorded in late July-early August this year, but was weaker than the tremor that preceded the 1996 eruptions.
Information Contacts: Brad Scott, Wairakei Research Center, Institute of Geological and Nuclear Sciences (IGNS), Private Bag 2000, Wairakei, New Zealand (URL: https://www.gns.cri.nz/).
Increased seismicity; small steam eruptions eject mud and blocks
Elevated levels of volcanic tremor started in late July, but there were no eruptions at that time (BGVN 21:08). Increased levels of seismicity began again on 2 October, with fluctuations up to 2x typical background levels. Activity increased on 9 October, when ~30 volcanic earthquakes were recorded and visitors to the summit observed small geyser-like eruptions from the crater lake. The amplitude of the tremor was variable; seismicity peaked at M 2.5-3.0. The crater lake turned muddy gray from a dull green color and large volumes of steam rose from the lake surface. The alert level was increased from one to two (indicating the onset of eruptive activity) after the 9 October earthquake swarm; correspondingly, the size of the warning area around the volcano was increased to a 1-km radius from the crater lake.
Over 95 volcanic earthquakes were recorded during 9-10 October before a period of strong seismicity on the night of 10-11 October, thought to represent gas and magma movement. Volcanic seismicity peaked early on the morning of 11 October and then began declining. Minor steam-driven eruptions occurred within the summit crater during the weekend of 11-12 October. The largest event, at 1430 on 12 October, erupted lake-floor mud and rocks ~150-200 m above the crater lake. Some of the eruptions also generated tall steam columns. There is no evidence that the eruptions, believed to be driven by steam and gas, discharged new lava or ash. Water level in the crater lake dropped due to increased evaporation and the small steam eruptions, uncovering large fumarole vents on the crater floor and allowing more volcanic gas to be released.
Seismic activity was declining on the morning of 13 October, but the level remained above the typical background for Ruapehu. By the afternoon of 13 October volcanic tremor levels had stabilized at 2-3x background. During an overflight from 1234-1250 no eruptive activity was observed. The inner crater basin and Pyramid Peak area were totally coated in dark gray mud and ash from the eruptions on 11-12 October. The discolored zone extended from the crater basin to the W and WNW and down off the cone over Tukino Skifield. Impact craters from blocks tossed out on the afternoon of 12 October were visible in the W wall of Pyramid Peak. The crater lake was dark gray and steaming vigorously. An area of high heat and gas flow had intensified on the W side of the lake.
Information Contacts: Brad Scott, Wairakei Research Center, Institute of Geological and Nuclear Sciences (IGNS), Private Bag 2000, Wairakei, New Zealand (URL: https://www.gns.cri.nz/).
Seismic and volcanic activity decline in late October
The increased seismic and volcanic activity that began on 2 October (BGVN 22:09) had returned to low levels early on 14 October after sporadic small eruptions of mud and rocks on the 12th. Activity continued to decline during the second half of the month. By 31 October the volcanic alert status had been reduced from Level 2 (minor eruptive activity) to Level 1 (signs of volcano unrest) with volcanic tremor remaining above typical background level. The last small eruption, accompanied by a volcanic earthquake, occurred at 2120 on 18 October. There was no geysering or big disturbances on the crater lake surface during the last week of October. The lake temperature in late October was 52-55°C and the water color was light gray. Scientists observed small radial wave patterns on the surface, indicating fluctuating water levels. The N portion of the crater floor was dry and a prominent area of gas and steam vents (fumaroles) had developed in the NW part.
Information Contacts: Brad Scott, Wairakei Research Center, Institute of Geological and Nuclear Sciences (IGNS), Private Bag 2000, Wairakei, New Zealand (URL: https://www.gns.cri.nz/).
Visit on 17 September discloses Crater Lake's passive steaming
On 17 September a group of scientists visited Ruapehu's Crater Lake in response to observed steam plumes and recent increases in volcanic tremor levels. They found the lake a dirty gray color, caused by considerable convective water movement. The lake contained a large amount of suspended material, and sulfur slicks were present on the surface. The group measured a maximum temperature of 58°C, similar to that of 27 August. The steam plumes were therefore consistent with both the morning's clear, cool weather and the warm temperatures of the lake. They saw no evidence of any eruptive activity at the lake.
Volcanic earthquakes and tremor levels have stabilized at levels higher than those prior to the major 1995-96 eruptions. From 1997-99 there have been periods when both volcanic tremor has intensified and minor hydrothermal eruptions have occurred at Crater Lake. Volcanic tremor levels were elevated during 6-21 August, culminating in a sequence of volcanic earthquakes on 21 August, but no eruptive activity. Since 13 September, volcanic tremor levels have risen again.
The elevation of volcanic tremor levels during the first 2-3 weeks of September indicates a slight increase in the probability of further minor activity occurring at Ruapehu, especially in the form of hydrothermal eruptions in the Crater Lake. The Alert Level remains at Level 1.
Information Contacts: Brad Scott, Wairakei Research Center, Institute of Geological and Nuclear Sciences (IGNS), Private Bag 2000, Wairakei, New Zealand (URL: http://www.gns.cri.nz/).
Intermittent periods of increased seismicity; new monitoring system plans
Following increased volcanic tremor levels during the first 2-3 weeks of September 1999 (BGVN 24:08), Ruapehu had about 6 months of low seismic activity. However, on 10 April 2000, a period of moderate volcanic tremor occurred followed by a period of weaker tremors. An increase in seismicity took place during the week ending 28 April. After 28 April, seismic activity remained low until 16 July. At 1232 an intense period of volcanic tremor began and lasted until 0635 on 17 July. Other weak volcanic tremor episodes were recorded during the weeks ending 25 August, 1 September, 22 September, and 29 September. No surface activity was observed during any of these episodes.
Two volcanic earthquakes and steam plumes were recorded during the week ending 8 September, but there was no evidence of eruptive activity. The temperature of the crater lake was measured during this week at 39°C. This is the lowest recorded temperature since late September 1996, when the new lake began to form.
In mid-March a network of 20 seismic stations was installed at Whakapapa skifield on the NE flank of Ruapehu. This network recorded seismic data through mid-May. In addition, plans for a new warning system were announced during the week of 12 May. As part of this warning system, sensors will be placed around the crater rim and along the Whangaehu River to the W of Ruapehu. The Whangaehu River valley was the site of several lahars during eruptions in 1995 and 1996 (BGVN 20:10 and 21:05). Because of concern over a rim collapse as the crater lake fills, these monitors will detect drops in water level at the crater lake. In addition, the new warning system will upgrade the current monitoring system. In the past, it has taken up to two weeks for data to be analyzed after a seismic episode. The new system will use seismic monitors and satellites to create real-time warnings. Ruapehu remains at alert level 1.
Information Contacts: Institute of Geological & Nuclear Sciences (IGNS), Private Bag 2000, Wairakei, New Zealand (URL: http://www.gns.cri.nz/).
Tremor episode peaks on 16 February, lahars predicted for near future
Ruapehu showed no signs of volcanic unrest from the end of September 2000 (described in BGVN 25:09) until mid-January 2001, when small to moderate amounts of volcanic tremor occurred. Ruapehu continued to experience low-level seismic activity, including volcanic earthquakes, through the beginning of February 2001. In mid-February, the Institute of Geological and Nuclear Sciences (IGNS) reported several periods of moderately elevated volcanic tremor. An episode of strong volcanic tremor peaked on 16 February and was the strongest tremor recorded since the 1996 eruptions, but direct observations of the crater revealed a lack of unusual surface activity. By approximately 23 February the tremor had declined to background levels. After the tremor event in February, no eruptive activity occurred, and seismic activity continued at a low level. Ruapehu remained at Alert Level 1 (signs of volcanic unrest) throughout the time period.
According to the New Zealand Herald, Ruapehu's summit crater lake had filled at twice its normal rate over the summer of 2000, causing fears of a catastrophic mudslide in the near future. A massive lahar has been predicted within 6 years from the summer of 2002-2003, with a peak flow 50% larger than the 1953 Christmas Eve disaster that wiped out the Tangiwai rail bridge, killing 151 travelers. A $370,000 early-warning system is planned that would provide 1 hour warning of the lahar's arrival on the Desert Road and 2 hours warning of its arrival at Tangiwai.
Information Contacts: Institute of Geological & Nuclear Sciences (IGNS), Private Bag 2000, Wairakei, New Zealand (URL: http://www.gns.cri.nz/); The New Zealand Herald, PO Box 32, Auckland, New Zealand.
Increased seismicity but no signs of eruptive activity through January 2002
Prior to November 2001, the last notable seismic activity at Ruapehu was moderately elevated tremor during February 2001 (BGVN 26:07). The Institute of Geological & Nuclear Sciences (IGNS) reported that on 21 November at 0218 a moderate-to-large volcanic earthquake was recorded at Ruapehu. The earthquake was followed by ~1 hour of moderate-to-strong volcanic tremor. IGNS did not believe an eruption occurred because no air waves were recorded, and there were no reports of unusual activity. As of 23 November, seismicity continued to be at higher-than-normal levels and weak tremor continued. Clouds obscured the view of Ruapehu.
Ruapehu's crater lake was sampled on 11 September. The lake's temperature was 21°C and its color was blue-green. Further observations during September and November confirmed the color and revealed that the lake had cooled over the previous months.
On 25 November seismic activity decreased to background levels and observations revealed that there were no signs of eruptive activity. Upwelling sediment caused Ruapehu's crater lake to change from its normal blue-green color to dark gray. The temperature of the lake was still relatively low (22°C), which further supported the theory that no eruptive activity occurred after the earthquake.
On 7 December, IGNS reported that two small, long-period earthquakes were recorded beneath the volcano. A visit to the crater lake on 8 January revealed that the temperature had increased since late November 2001 to 36-38°C. There was evidence of convection over the S-central vent area, including minor sulphur slicks, upwelling, and light steaming. Minor volcanic tremor was also recorded.
Steam plumes were emitted from Ruapehu on 11 and 12 January. This activity was believed to be associated with hydrothermal activity in the crater lake. Ruapehu remained at Alert Level 1 ("Initial signs of possible volcano unrest") on a scale of 0-5.
General Reference. Houghton, B.F., Latter, J.H., and Hackett, W.R., 1987, Volcanic hazard assessment for Ruapehu composite volcano, Taupo Volcanic Zone, New Zealand: BV, v. 49, p. 737-751.
Information Contacts: Institute of Geological & Nuclear Sciences (IGNS), Private Bag 2000, Wairakei, New Zealand (URL: http://www.gns.cri.nz/).
Volcanic tremor episodes and Crater Lake temperature variations
Between 6 and 16 September 2002 the Institute of Geological & Nuclear Sciences (IGNS) reported that there were four short-lived episodes of volcanic tremor at Ruapehu. The duration of these episodes ranged from 8 to more than 40 hours. Episodes with similar characteristics were recorded previously in 2002 on 21 February (~12 hours duration), 17 May (~24 hours), 29 May (~18 hours), 17 June (~24 hours), and 15 July (~8 hours). The September events were unusual because there were four tremor episodes in a ten-day period. Another IGNS report on 8 October noted that there had been five short-lived episodes of moderate-strong volcanic tremor since 6 September, with durations of 8 hours to more than 2 days (figure 25). Tremor levels were generally higher than normal background levels starting on 22 September.
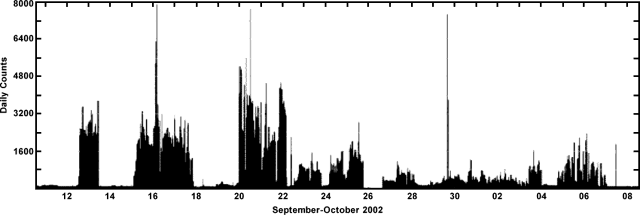 |
Figure 25. Plot of volcanic tremor amplitudes at Ruapehu, 10 September-8 October 2002. Courtesy of IGNS. |
The temperature of Crater Lake during two visits between 16 September and 8 October remained around 19°C, similar to the 19.4°C value measured on 30 August. Intermittent weak seismic tremor continued during November, along with a small number of volcanic earthquakes early in the month. Water temperature of Crater Lake measured during 22-29 November was 24°C, an increase of 5°C from the previous month. Weak tremor continued as of 13 December, accompanied by a small number of minor volcanic earthquakes. Volcanic tremor and earthquakes continued through 19 December, and the water temperature of Crater Lake was reported to be 35°C.
The water temperature measured at Crater Lake at the end of January was 32°C, down 8°C from two weeks earlier (40°C). Minor volcanic tremor continued through February, then steadily declined during 21-28 February to low background levels. On 5 March the temperature measured at Crater Lake had decreased another 2°C to 30°C. The lake was a uniform light gray color with some surface sulfur slicks. Seismic tremor remained at normal levels as of 21 March, but there were periods of moderate tremor on the nights of 14 and 15 March. The temperature of Crater Lake rose to 35°C on 15 March; there were sulfur slicks on the lake surface.
Information Contacts: Institute of Geological & Nuclear Sciences (IGNS), Private Bag 2000, Wairakei, New Zealand (URL: http://www.gns.cri.nz/).
Steam plume issued from warm Crater Lake in May, but no eruption
Since the middle of March 2003 the temperature of Ruapehu's summit Crater Lake had been slowly rising. The lake temperature rose from 30°C on 5 March (BGVN 28:02) to a high of 41.6°C on 15 May (table 11). Similar values were recorded in January 2003 when the lake temperature reached 42°C. This is the fourth time that the temperature of the Crater Lake has risen above 35°C since the start of 2001, and the temperature has been above 30°C since December 2002. It is not unusual for the temperature to cycle over periods of 6-9 months; minor hydrothermal activity can occur in the lake during temperature peaks. Lake temperatures dropped steadily from 41°C after mid-May. However, during the late morning of 26 May a steam plume was observed rising 200-300 m above Crater Lake. No seismicity accompanied this plume, suggesting that it was generated by atmospheric conditions alone (a warm lake and a cold, windless, morning). Steam plumes were also observed on 28 March and 21 April.
Table 11. Lake water temperatures measured at Ruapehu's Crater Lake, 5 March-1 June 2003. Courtesy of IGNS.
| Date | Crater Lake Temperature |
| 05 Mar 2003 | 30°C |
| 28 Mar 2003 | 35°C |
| 11 Apr 2003 | 38°C |
| 29 Apr 2003 | 39.4°C |
| 15 May 2003 | 41.6°C |
| 26 May 2003 | Slightly over 40°C |
| 29 May 2003 | 36°C |
| 01 Jun 2003 | 33°C |
Weak intermittent seismic tremor was recorded through early April, then remained at a constant moderate level during 12-17 April. The following week, 18-24 April, there was an increase in tremor accompanied by discrete volcanic earthquakes. By 2 May volcanic tremor levels had declined, but volcanic earthquakes continued to occur. Levels of volcanic tremor fluctuated during the week of 3-9 May, with several periods of enhanced tremor and small volcanic earthquakes. Tremor had declined by 16 May, and seismicity remained very low through the 30th. The level of volcanic tremor began to increase slightly in early June, but the lake temperature was still declining during the week of 7-13 June. Very low levels of activity continued through the 20th. There were no significant changes observed in the lake water chemistry. The hazard status remained unchanged at Alert Level 1.
Information Contacts: Institute of Geological & Nuclear Sciences (IGNS), Private Bag 2000, Wairakei, New Zealand (URL: http://www.gns.cri.nz/).
Strategy, prediction, and management of crater-lake overflow and powerful lahar
Citing risks about a lahar expected when an ash dam surrounding Ruapehu's crater collapses, the New Zealand government decided that draining, sluicing, or siphoning the volcano's crater lake to reduce the danger was too hazardous, reported Jo-Marie Brown in The New Zealand Times (10, 17, and 19 March 2004). The articles noted that, instead, the government decided to bolster extensive safety measures already in place around the volcano, including improving alarm systems. These new measures should provide warnings of lahar occurrences at least an hour and a half in advance. The government also elected to strengthen bridges and build an embankment to withstand lahars.
The New Zealand Department of Conservation has an extensive outreach to discuss the crater lake-lahar problem (figure 26). They point out that the crater lake on Mt. Ruapehu was refilling after it was emptied by eruptions in 1995 and 1996. This lake lies over the main active vent of the volcano. Before the eruptions, the level of the crater lake was controlled by an outlet that drained water across a sill of lava into the head of the Whangaehu Valley. During the 1995-96 eruptions, this outlet was blocked by 7 m of tephra (fine ash particles and other larger materials ejected by the volcano).
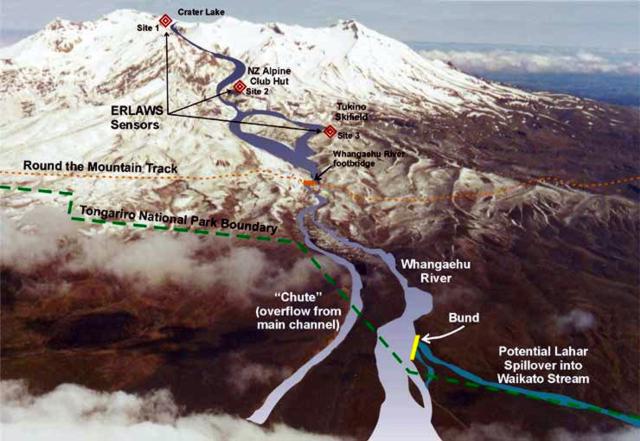 |
Figure 26. This publicly distributed image was created in response to the threat of lahars descending the Whangaehu Valley at Ruapehu in 2004. In addition to local geography, it shows the location of warning sensors, key bridges, and a critical embankment ("bund") to direct the lahars. The associated information discusses warnings of impending lahars on the order of 1-2 hours before they arrive at critical downstream sites. Courtesy of the New Zealand Department of Conservation. |
The Department also noted that since March 1999, the crater lake had risen 52 m and was filling at a rate of 5,300 m3 per day. On 15 March 2004 the lake's surface elevation was reported at 2,527.6 m above sea level. In mid-March 2004 the Department also reported that the lake was then ~ 96% full, a point ~ 2 m below the base of the tephra dam emplaced by the 1995-6 eruptions (the old overflow point). The predicted time for the lake to completely fill was given as early April 2004 to November 2004. An estimated 60 lahars have swept down the mountain's southern side through the Whangaehu Valley in the past 150 years. A lahar in 1953 killed 151 people at Tangiwai. The Department of Conservation reported additional details regarding the crater lake: there was low to normal hydrothermal activity; the water temperature on 15 March 2004 was 35°C; and the lake color was gray.
Information Contacts: The New Zealand Herald, PO Box 32, Auckland, New Zealand (URL: http://www.nzherald.co.nz/); New Zealand Department of Conservation, Private Bag, Turangi, New Zealand (URL: http://www.doc.govt.nz/); Institute of Geological & Nuclear Sciences (IGNS), Private Bag 2000, Wairakei, New Zealand (URL: http://www.gns/cri.nz/).
Minor October 2006 eruption and concern of impending lahar
A moderate volcanic earthquake struck Ruapehu at 2230 on 4 October 2006. The M 2.8 event falsely triggered the lahar warning system. A visit to the crater lake on 7 October revealed evidence that a small hydrothermal eruption had occurred. Wave action reached up to 4-5 m above the lake surface around the basin, but was insufficient to overflow the tephra dam where it might have formed a lahar on the outer slopes. Since the last measurement (date not specified) the lake's temperature rose ~8°C, and the water level increased ~ 1 m. Both of these effects were expected. Seismic activity remained at typical background levels on 7 October 2006.
At about 1300 on 18 March 2007, Crater Lake partly emptied and its runoff traveled rapidly downstream as a powerful lahar. A subsequent issue will discuss that dramatic event and its impact.
Since the last report in February 2004 (BGVN 29:02), from May 2003 to October 2006, there were eight alerts issued by the Institute of Geological & Nuclear Sciences (IGNS, table 12), indicating appreciable changes in both the level of the lake and its temperature; these alerts can be compared with the temperature data (table 13).
Table 12. Institute of Geological & Nuclear Sciences (IGNS) alerts posted for Ruapehu volcano, May 2003 to October 2006. Compiled from IGNS reports.
| Alert Date | Alert Comments |
| 26 May 2003 | Steam plumes, volcanic tremor, Crater Lake temperatures increase |
| 15 Nov 2004 | Volcanic tremor, Crater Lake temperature increase |
| 22 Aug 2005 | Crater Lake temperature increase |
| 13 Sep 2005 | Steam plumes |
| 18 Oct 2005 | Crater Lake temperature decrease |
| 01 Nov 2005 | Crater Lake temperature increase |
| 05 Oct 2006 | Moderate (M 2.8) volcanic earthquake |
| 07 Oct 2006 | Minor hydrothermal eruptions |
Table 13. Lake temperature data recorded at Ruapehu during 2003-2006. Some months have multiple sets of readings. Data were rounded to two significant figures. Compiled from IGNS reports.
| Date | Crater Lake Temperature | Notes |
| Jan 2003 | 42°C | -- |
| 05 Mar 2003 | 30°C | -- |
| 15 May 2003 | 42°C | -- |
| 15 Mar 2004 | 35°C | -- |
| Aug 2004 | 16°C | -- |
| 13 Nov 2004 | 19°C | -- |
| Feb 2005 | 39°C | Peak for heating cycle. |
| 04 Aug 2005 | 23°C | -- |
| 21 Aug 2005 | 32°C | -- |
| 03 Sep 2005 | 39°C | -- |
| 24 Sep 2005 | 34°C | -- |
| 12 Oct 2005 | 30°C | -- |
| 24 and 27 Oct 2005 | 35-36°C | -- |
| Nov 2005-Sep 2006 | 15°C | Unstated date between 27 October 2005 and 5 October 2006. |
| 05 Oct 2006 | 23°C | After earthquake. |
Volcanic tremor was recorded during July 2005 and continued at varying levels. Although tremor is not unusual at Ruapehu, this was the strongest recorded since November 2004. Prominent steam plumes rose above Ruapehu on the morning of 13 September 2005. The crater lake temperature had recently risen from 23°C in August 2005 (table 13) to 39°C in early September 2005. By 12 October 2005 it had fallen to 30°C, indicating the end of the heating cycle. Thereafter, another cycle of lake heating took place in middle to late October 2005. During the period when the lake was at its hottest, steam plumes appeared on several days, but no eruptive activity was observed. Seismic activity continued at about normal levels except for a slight increase in the occurrence of volcanic earthquakes over the previous two weeks.
Lahar hazard. The last report on Ruapehu (BGVN 29:02) reviewed the government of New Zealand's efforts to lessen potential damage and loss of life from the possible collapse of the ash dam surrounding the lake that sits directly within the crater. An illustrative model of the most likely potential lahar was presented in the previous Bulletin (BGVN 29:02). Figure 27 provides more details on the regional geography.
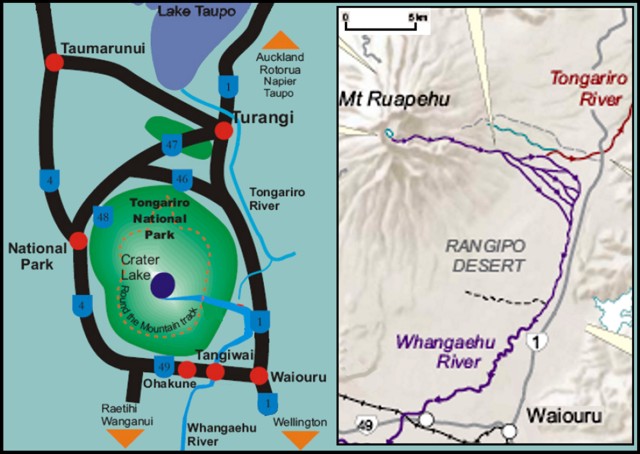 |
Figure 27. Composite maps of the Ruapehu area modified from part of a lahar hazards poster titled "How will the Lahar Affect Me?" The schematic map (at left) shows that the Tongariro river trends N, crosses State Highway 1 two times, and eventually enters Lake Taupo. The shaded relief map (right) of Ruapehu and adjacent flanks along its E-sector. Note the multiple chutes created to divert flood waters and lahars toward the S on the Whangaehu river. These chutes are intended to protect the Tongariro river's headwaters. Courtesy of the NZ Department of Conservation. |
According to IGNS and related government websites, the most likely lahar's path starts from a 7-m-thick tephra dam sitting above bedrock along the low point in Ruapehu's crater rim. This path descends along the Whangaehu valley, a drainage that initially travels radially down the cone to the E. Where the Whangaehu reaches beyond ~ 10 km from the rim (figure 27), the channel curves sharply S and then SW, ultimately crossing Ruapehu's S side. In contrast, just upstream of the above-mentioned bend, the intersecting Tongariro river flows N. At that connection between the two drainages (a divide), engineers added a 300-m-long embankment (a levee or bund), to keep substantial material from entering the Tongariro drainage. Engineers also added one or more chutes to direct some of the Whangaehu river S and away from the critical junction. Protecting the Tongariro river from sudden influx of water and debris protects infrastructure along and downstream of that river. For example, the Tongariro river enters Lake Taupo, a 30 x 40 km caldera lake. Lake Taupo drains to the N along the Waikato river and dams along that river generate hydroelectric power.
According to the Institute of Geological & Nuclear Sciences (IGNS), about 60 lahars have swept down the mountain's southern side in the past 150 years. Lahars are not limited to the Whangaehu valley as eruptive and mass wasting processes can result in sudden influx of water and debris in other drainages as well. Lahar episodes since 1945 appear on figure 28.
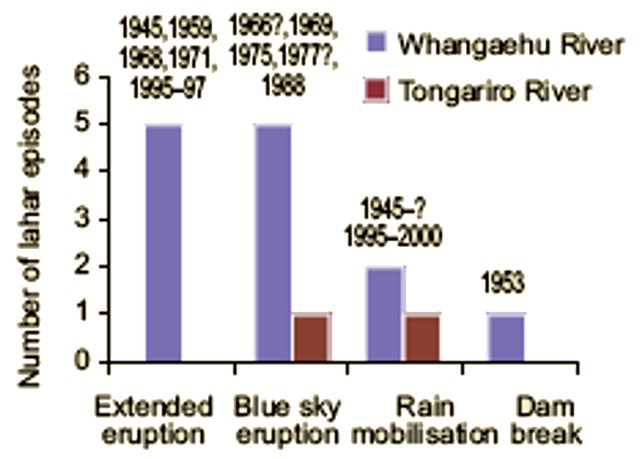 |
Figure 28. Lahar episodes occurring at Ruapehu since 1945, as grouped into four categories. The categories are those associated with an extended eruption, a sudden (blue-sky) eruption, rain mobilization, and dam break or failure. From Harry J. R. Keys (date unknown), Department of Conservation (see Reference, below). |
Figure 29 contains plots of the crater lake's surface elevation during the past several years. The plot is part of a poster available on the Department of Conservation website. The poster also notes the approximate volume of the crater lake, 107 m3. The tephra dam allows lake water to seep through it, considerably complicating estimates of the late-stage-filling rates, and any predicted date of overflow or related failure. Derek Cheng wrote an 8 January 2007 New Zealand Herald news piece stating that the lake then stood ~2.7 m below the dam's top. According to Chang's news story, the tephra dam allowed lake water to seep through it at a rate of ~10 L per second.
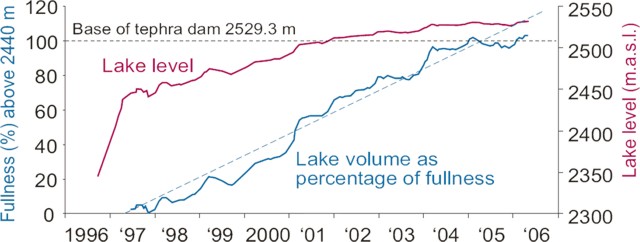 |
Figure 29. A plot of the surface elevation with time (1996 to mid-2006) of Ruapehu's crater lake. Absolute lake elevations in meters above sea-level apply to the curve labeled "Lake level" and correspond to the y-axis scale at the right. Indices of lake fullness (percent above or below the elevation 2,440 m) apply to the curve describing "Lake volume as percent of fullness." This curve corresponds to the y-axis at left (i.e., 0 % full = 2,440 m a.s.l.; 100% full = 2,529.3 m a.s.l.). The dotted horizontal line indicates the elevation of the base of the tephra dam that lies over the rim's low point. This plot came directly from an informative poster on the lahar available online at the Department of Conservation website (Keys, (date unknown), in reference list below). |
Crater Lake observations. Ruapehu's Crater Lake had warmed following periods of volcanic tremor, with heating cycles getting to temperatures ranging from about 15 to 40°C (eg., 39°C during February 2004 and ~36°C during late October 2006; table 13). The IGNS website notes that Ruapehu's heating cycles typically occur every 9-12 months and normally last 1-3 months.
An innovative approach to covering the current lahar hazard status can be found at the Department of Conservation website. As of early February 2007 the reports were "updated every 1-2 weeks depending on weather conditions and [field] site visits."
Reference. Keys, H.J.R., (date unknown), Lahars from Mount Ruapehu—mitigation and management; NZ Dept. of Conservation website (a poster conveyed as a PDF file; creation/publication date unknown) (URL: http://www.doc.govt.nz/templates/summary.aspx?id=42442).
Information Contacts: Institute of Geological & Nuclear Sciences (IGNS), Private Bag 2000, Wairakei, New Zealand (URL: http://www.gns.cri.nz/, https://www.geonet.org.nz/); New Zealand Department of Conservation, Private Bag, Turangi, New Zealand (URL: http://www.doc.govt.nz/).
Crater lake tephra dam bursts on 18 March 2007
A moderate hydrothermal eruption at Ruapehu on 4 October 2006 (BGVN 32:02) renewed concerns about a lahar that could be generated from breakout of the summit crater lake through a weak dam composed of tephra. The dam, ~8 m high, was formed during eruptions in 1995 and 1996. In 1953 a similar dam failed and 151 lives were lost when the resulting lahar destroyed a rail bridge at Tangiwai. As reported by the New Zealand Institute of Geological & Nuclear Sciences (GNS Science), on 18 March 2007 at about 1100 the tephra dam failed and such a lahar was initiated. The resulting discolored region of sediment deposit was visible from space (figure 30).
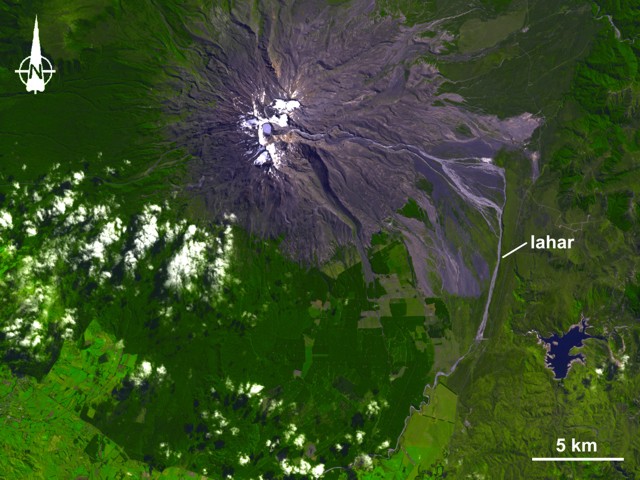 |
Figure 30. The Advanced Spaceborne Thermal Emission and Reflection Radiometer (ASTER) on NASA's Terra satellite captured this image of Mount Ruapehu and the path of its recent lahar on 25 March 2007. In the colored image, green indicates vegetation, dark blue indicates water, and purplish-gray indicates bare rock. The splotches of white at the summit show snow cover, and the billowy white balls nearby are clouds. S of the volcano, straight lines and sharp angles outlining patches of green indicate cultivated crops. The lahar appears as a rivulet of pale grayish-lavender that flows from the summit toward the E, then turns S. Near the base of the volcano, the lahar path separates briefly into two streams. Courtesy of NASA Earth Observatory. |
GNS Science reported that on 18 March 2007 step-wise failure of the dam by headward scarp retreat above seeps in its downstream face was initiated at 1055, followed by catastrophic failure and breaching at 1122. Heavy rain likely played a role in triggering the lahar by raising the surface of Ruapehu's Crater Lake above a critical level. The lake was ~ 1.2 m below the crest of the dam when it failed. A GNS Science fixed camera recorded a time-lapse sequence of images of the dam collapse and the outflow through a 40-m breach in the dam (figure 31). The outflow entered the steep rocky gorge of the upper Whangahu River where it rapidly entrained silt- to boulder-sized particles to become a non-cohesive debris flow within a few kilometers of the lake. The resultant flood (lahar) reached variable stage heights depending on the topography of the 155-km long river system, often exceeding 6-8 m and overtopping the banks. At one point the lahar topped a bridge across the river about 49 km downstream.
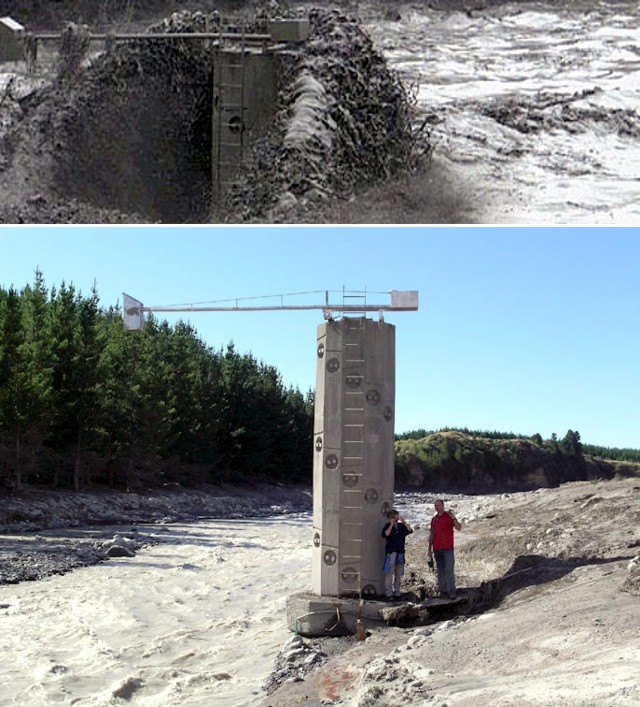 |
Figure 31. Comparative photos of the 6.2-m high OnTrack (New Zealand Railway Corporation) lahar warning tower, located in the Whangaehu river 28 km downstream from Crater Lake. The tower was installed following the 1953 Tangiwai disaster to provide 15-min warning for the railway bridge 11 km downstream. The arm on the tower supports a radar stage gauge to measure flow depth. Images were captured by a Horizon Regional Council web cam. (top) Tower in the path of the lahar flow at 1255 on 18 March 2007. (bottom) Examining lahar deposits on 21 March 2007, with researchers providing scale of the tower and its inscribed scale marks. Courtesy of GNS Science and Vern Manville. |
Lahar chronology. News releases from GNS Science and other agencies were issued on 18 March 2007. Some preliminary derivative reports were sent to us by Roger Matthews. These items provided a chronological series of observations indicating that the dam's failure was initiated at 1045 and climaxed at 1122 on 18 March.
News released at 1203 stated that, prior to the burst, police received indications that the tephra dam confining the Crater Lake was close to overflowing. Alarms from acoustic flow monitors (vibration sensors) installed in the dam at the Crater Lake outlet went off a number of times before the primary dam failure. The three monitoring sites on the crater rim, all activated with the dam failure.
A lahar [called 'moderate' by the New Zealand Department of Conservation (DOC)] was making its way down Mount Ruapehu after Crater Lake dam burst at about 1100 (figure 32). Ruapehu District Council said the lahar was expected to arrive at the Tangiwai road and rail bridges at about 1405 on 18 March. Spokesperson Paul Weetcroft said that the lahar's travel down the Whangaehu River was being monitored, and that the emergency management plan was working well; there were no reports of anyone in danger. He said that at this stage the lahar was expected to travel down the Whangeahu valley and out to sea. Roads were closed in the immediate area and rail transport was stopped. The Minister of Civil Defence, Rick Barker, says the systems set up to warn people about the lahar seem to have worked very well.
 |
Figure 32. A camera installed by GNS Science near the summit of Ruapehu captured the failure of the tephra dam holding back Crater Lake and the lahar's onset. The fixed, digital still camera was installed overlooking the downstream side of the tephra dam in early January 2006. It had been taking pictures at 1-min intervals during daylight. Erosion scarps developed in the downstream face of the dam as a result of seepage through porous tephra layers in early 2007. Growth of these features culminated in dam failure on 18 March 2007. (top) Intact tephra dam at 1101. (middle) Crater Lake waters starting to flood through the breached dam at 1122. (bottom) Crater Lake waters pouring out through the extensive breach in the tephra dam at 1203. Courtesy of GNS Science lahar project, led by Vern Manville. |
The Minister of Conservation stated that the lahar traveled down the predicted path, and the early warning response system worked as planned. An earthen dam (bund, or levee) built to divert the lahar's path toward the S withstood the lahar. As a result, the lahar continued down the Whangaehu valley away from the Tongariro catchment (which drains to the N into Lake Taupo). The lahar also continued safely down the valley and underneath the Tangiwai bridge.
The New Zealand Department of Conservation (DOC) reported at 1545 that the major peak of the lahar had passed. DOC believed the moderate-sized mudflow began when Mt Ruapehu's Crater Lake dam started to collapse between 11 and noon today, releasing the water over a 45-minute period. DOC's Dave Wakelin noted that the water kept within the channels and over the next couple of hours traveled safely down the Whangaehu River and under the Tangiwai bridges. The lahar was almost over by this time (1545), but some material was still moving down the river. No major infrastructure was damaged except for a small DOC footbridge between Tukino Mountain road and Rangipo. The tephra dam which was impounding the new crater lake was fully broken.
Aftermath observations. On 19 March 2007, GNS issued a Science Alert Bulletin concerning increased hydrothermal activity possible at Ruapehu's Crater Lake. Volcanologist Brad Scott of GNS Science said there had been an increase in volcanic earthquakes up to M 1 at the summit following the 18 March partial emptying of Crater Lake. Lowering of the lake could destabilize that hydrothermal system and lead to increased heating and steam-driven eruptions.
Scientists from the Department of Conservation (DOC) and GNS Science visited Mt. Ruapehu's crater lake on 19 March 2007 and confirmed that the tephra dam had eroded back down to the hard rim that formed the pre-1995 lake outlet. Water cascaded across a hard rock rim where once there was a 7.6-m-high dam. Prior to the previous day's collapse, the dam itself was 80-m long. Harry Keys of DOC stated in a press release that the breach was about 50- to 60-m wide at the top and 40-m wide at the hard rock rim, wider than scientists initially thought. The post-lahar lake level was 2,529.4 m elevation, a drop of 6.3 m from the pre-lahar level. The outlet continued to drain and the 'river' was about knee deep. The volume of water lost from the lake was is believed to be in the order of 1.3 x 10⁶ m3. Keys commented further that "One misconception we have heard is that now the lahar has happened there is no longer a Crater Lake! We have now reverted back to pre-1995 conditions with a Crater Lake of about 10x106 m3 that is emptying over its natural outlet on the crater rim into the Whangaehu river." DOC emphasized that conditions either near or on the remains of the tephra dam were unstable and therefore hazardous.
Multi-agency Efforts. The Ruapehu Lahar Emergency Management Plan (Southern) was developed under the leadership of the Ruapehu District Council. Participants included officials from the Southern Ruapehu Lahar Planning Group, New Zealand Department of Conservation, New Zealand Ministry of Civil Defence and Emergency Management, police, and Horizons Regional Council, along with other key agencies including the Army, the New Zealand Fire Service, and GNS Science.
Reference. Keys, H.J.R., (date unknown), Lahars from Mount Ruapehu—mitigation and management; NZ Dept. of Conservation website (a poster conveyed as a PDF file; creation/publication date unknown) (URL: http://www.doc.govt.nz/templates/summary.aspx?id=42442).
Information Contacts: Institute of Geological & Nuclear Sciences (GNS), Private Bag 2000, Wairakei, New Zealand (URL: http://www.gns.cri.nz/, https://www.geonet.org.nz/); Brad Scott, Institute of Geological & Nuclear Sciences (GNS); New Zealand Department of Conservation, Private Bag, Turangi, New Zealand (URL: http://www.doc.govt.nz/); Roger Matthews, North Shore City Council, Private Bag 93500 Takapuna, North Shore City 1331, New Zealand (URL: http://www.northshorecity.govt.nz); The Press (URL: http://www.stuff.co.nz/thepress); National Aeronautics and Space Administration (NASA), Earth Observatory (URL: http://earthobservatory.nasa.gov/).
Follow up on the 18 March 2007 lake burst and lahar
This material supplements our most recent Bulletin report on Ruapehu (BGVN 32:03). There we indicated that the tephra dam at Crater lake burst on 18 March 2007, initiating a lahar. Only a portion of the lake drained, a body that contains ~ 9 x 10⁶ m3 of hot acidic water at 2,530 m elevation (Manville and others, 2007). Recent pictures taken before and after the event show a portion of the lahar channel (figures 33 and 34). This lahar was among the best studied and carefully instrumented to date and may shed light on how volcano dams fail. Vernon Manville coordinated the science response to the lahar and noted that the large boulder that serves as a scale in figures 33 and 34 is "a large chunk of older (probably pre-glacial) lahar deposits. Its long axis is about 10 m, which would give 10-15 m of aggradation in the channel as a result of the 2007 lahar."
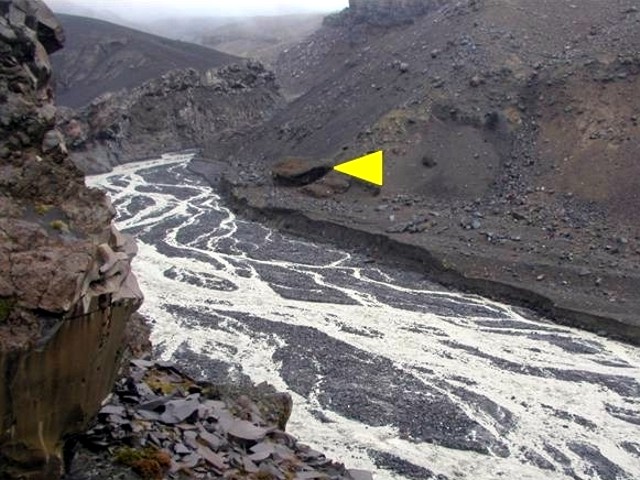 |
Figure 33. Ruapehu's lahar channel just before the collapse of Crater Lake's walls on 18 March 2007. Point of triangle indicates a large boulder to the right of the river channel; it's long axis is ~ 10 m in length. Courtesy of Vern Manville and Rebecca Carey, and the U.S. National Science Foundation. |
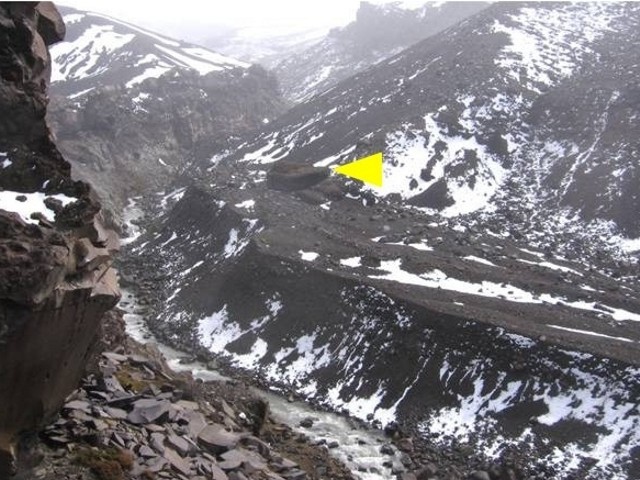 |
Figure 34. Ruapehu's lahar channel just after the collapse of Crater Lake's walls on 18 March 2007. Point of triangle indicates the same boulder as in the previous figure. Courtesy of Vern Manville, Sarah Fagents, and the U.S. National Science Foundation. |
An article in Science (Bohannon, 2007) described the technology used by the New Zealand Department of Conservation to warn of an impending lahar and to predict its path. Prior to the failure, direct current (dc) resistivity surveys were made across the tephra dam in 2005, 2006, and 2007 (Turner and others, 2007). Investigators found the dam's electrical conductivity, which is sensitive to the degree of water saturation, dropped as the lake water level rose and water infiltrated into the tephra dam. The January 2007 measurement found a large increase in conductivity, suggesting that the dam had become close to saturated.
The early warning system included geophones at the lake's rim and on the slopes, a buried wire set to trip when the dam burst, and a meter in the lake to record sudden drops in the lake level. On 18 March, the instruments recorded a breach in the tephra dam and the resulting lahar, which generated an alarm message transmitted automatically to scientists, police, and highway authorities. No one was injured and damage was minor, even though the lahar traveled 155 km to the ocean. According to the article, data indicated that the surging lahar may have produced a soliton, a standing wave that is able to propagate over great distances without losing energy or changing shape.
The Science article also indicated that researchers are developing "before" and "after" landscape images to gain insight into possible future lahar routes. To accomplish this, researchers have collected samples and used Global Positioning System measurements and light detection and ranging (LIDAR) technology to map the composition and distribution of material on the slopes and to develop three-dimensional models of land features.
According to a US National Science Foundation press release (NSF, 2007), a University of Hawaii volcanologist, Sarah Fagents, is using the data from Ruapehu to develop a computer model to simulate the route a future lahar would take and to predict the associated hazards. The model would eventually consider different lahar triggering mechanisms, and incorporate allowances for different locations, to make it widely applicable.
References. Bohannon, J., 2007, Geophysics—Stalking a volcanic torrent: Science v. 316, p. 1562-1563, 15 June 2007 (URL: http://www.sciencemag.org/).
Manville, V.R., Hodgson, K.A., and Nairn, I.A., 2007, A review of break-out floods from volcanogenic lakes in New Zealand: New Zealand Journal of Geology and Geophysics, v. 50, no. 2, p. 131-150.
National Science Foundation, 2007, Geologists Witness Unique Volcanic Mudflow in Action in New Zealand, 13 July 2007: NSF press release 07-077.
Turner, G., Ingham, M., and Bibby, H., 2007, Electrical resistivity monitoring of seepage and stability of the tephra barrier at Crater Lake, Mt Ruapehu, New Zealand: Geophysical Research Abstracts, v. 9, p. 11630.
Information Contacts: Vern Manville, Institute of Geological & Nuclear Sciences (GNS), Wairakei Research Centre, Private Bag 2000, Taupo 2730, New Zealand; Sarah Fagents and Rebecca Carey, School of Ocean and Earth Science and Technology (SOEST), University of Hawaii at Manoa; National Science Foundation, 4201 Wilson Boulevard, Arlington, VA 22230, USA (URL: https://www.nsf.gov/news/news_summ.jsp?cntn_id=109702).
Hydrothermal explosion on 25 September 2007 with plume and lahars
There were no reports of activity at Ruapehu following the lahar initiated by the bursting of the tephra dam at Crater Lake on 18 March 2007 (BGVN 32:06). On 25 September an explosive, relatively small, eruption prompted GeoNet to raise the Alert level to 2 (on a scale of 0-5). The eruption, which was probably emitted from Crater Lake, was accompanied by an earthquake (M 2.9) lasting eight minutes. The earthquake, preceded by about 10 minutes of minor seismicity, was too weak and short in duration to provide any meaningful warning of the eruption. Pilots reported a plume that rose to an altitude below 4.6 km.
On 26 September, aerial observations (figure 35) revealed that the summit area was covered with ash and mud, mostly directed N, and deposits reached 2 km from Crater Lake. The ballistic rockfall apron exceeded the ashfall zone, indicating the force of ejection. Impact craters caused by large falling blocks (more than 1 m in diameter) were also evident. The ballistic rocks, ejected from the bottom of the lake, were of several types: andesitic flows from the 1945 and 1995/1996 eruptions, a variety of tephra, and vent-fill debris. To date, there has been no evidence of fresh magma in the ejecta.
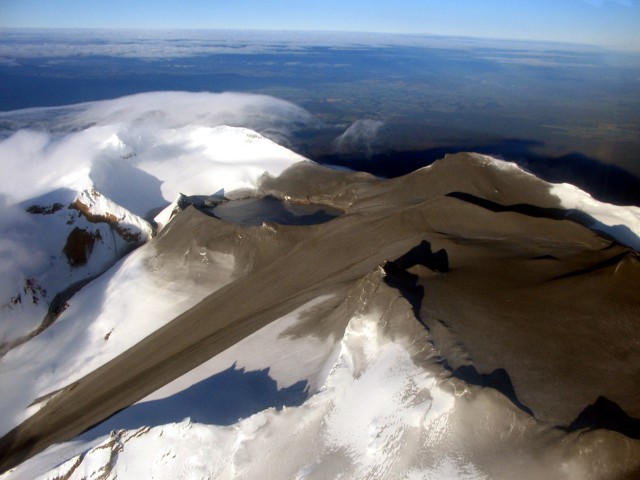 |
Figure 35. Summit of Ruapehu, taken from a plane on 26 September 2007, showing a lahar on the Whangaehu glacier. Courtesy of GeoNet. |
Reports from ski-field operators, the Eastern Ruapehu Lahar Alarm and Warning System (ERLAWS), and scientists from GNS Science and Massey University indicated that at least two eruption-associated lahars occurred. The Whakapapa ski field lahar traveled W approximately 1 km down the ski field, reaching halfway down the far west T-bar to an elevation of about 2,100 m. The deposit is about 30 m wide and consists of gray ashy snow, with fragments of rime ice and scattered rocks. Initial estimates suggest the lahar traveled at 20-30 km/hour.
A snow slurry lahar also traveled E down the Whangaehu River, leaving a deposit about 80 m wide and 1-3 m thick near the Round-the-Mountain-Track Bridge 7 km from Crater Lake. The deposits comprise dirty granular snow with a small percentage of Crater Lake water and mud, and scattered ice fragments and pieces of rock. The deposits thin rapidly downstream, with a thickness of ~ 40 cm at the bund (10 km), 30 cm at the Wahianoa aqueduct (23 km), and 10-20 cm at the Rail gauge (28 km). Data from flow monitoring indicated two depositional and one erosional flow phase.
According to scientists from GNS Science and the Department of Conservation who visited on 27 September, the crater lake was 2-3 m below overflow, indicating that about 500,000 m3 of water was ejected during the eruption. There was a strong upwelling from the northern vent under the lake, and some sulfur slicks and white frothy, gas-rich patches on the lake surface. A much less active discharge was observed over the usually more active southern vent area. The lake was a uniform gray color, being well-mixed. The lake temperature just after the eruption was 19°C, compared to 13°C before the eruption.
There is evidence for hydrothermal sealing of the vent prior to the eruption. A number of sulfur-bearing rocks show evidence of the sulfur having been molten on ejection, indicating vent temperatures at the base of the lake in excess of 119°C.
According to news articles, the eruption prompted evacuations at several ski lodges and caused train service to be temporarily suspended. A boulder crashed through the roof of a hut and injured one person.
On 9 October, the Alert Level at Ruapehu was lowered to 1 because no further eruptions had occurred since the 25 September event.
This eruption was similar to the 1969, 1975 and 1988 eruptions, although it was smaller than the 1969 and 1975 events, and larger than 1988 event. All available evidence to date indicates the eruption was hydrothermal.
Information Contacts: New Zealand GeoNet Project (URL: http://www.geonet.org.nz/); New Zealand Department of Conservation, Private Bag, Turangi, New Zealand (URL: http://www.doc.govt.nz/); Institute of Geological & Nuclear Sciences (IGNS), Private Bag 2000, Wairakei, New Zealand (URL: http://www.gns.cri.nz/); Shane J. Cronin, Volcanic Risk Solutions, Institute of Natural Resources, Massey University, Private Bag 11 222, Palmerston North, New Zealand (URL: http://volcanic.massey.ac.nz/); Natural Hazards Research Centre, University of Canterbury, Private Bag 4800, Christchurch 8140 (URL: http://www.nhrc.canterbury.ac.nz/); Agence France-Presse (URL: http://www.afp.com/).
Additional data on hydrothermal eruption's distribution and damage
A hydrothermal explosion at Ruapehu on 25 September 2007 was previously described (BGVN 32:10), with a plume and lahars discharged from Crater Lake. Since publication, new photos and additional information was provided by Brad Scott of New Zealand's Institute of Geological & Nuclear Sciences. In addition, an article came out on the tephra dam failure and subsequent lahar (Manville and Cronin, 2007). The tephra dam broke in March 2007 (BGVN 32:10) sending a big lahar down the Whangaehu Gorge and River (figure 36).
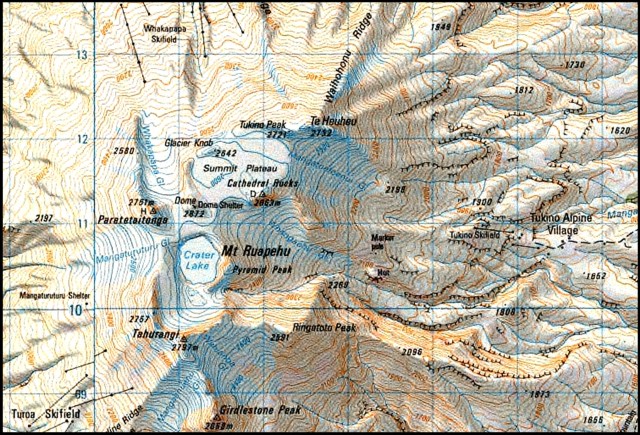 |
Figure 36. Map of Ruapehu oriented with N towards the top, showing glaciers and ski fields (note Whakapapa skifield and the valley of the same name towards the N). Crater Lake's outlet is at the SSE end of that lake, and it pours into the E-trending Whangaehu Gorge. The grid lines are at 1 km spacing; the contour interval is 20 m (100 m between heavy contours). Courtesy of Brad Scott, GNS. |
Photos of hydrothermal and lahar deposits on snow and alpine glacial ice were taken within days of the hydrothermal explosion. By 4 October, the mountain was blanketed in fresh snow, completely masking the recent deposits. Photos such as those included in this report (fresh deposits laid down on ice and snow from erupting high-altitude crater lakes) are comparatively rare.
Dome Shelter, located just N of Crater Lake, was directly in the path of the explosion. It was extensively buried by debris from the explosion and one person inside was badly injured.
Instruments recorded seismic and air-pressure signals associated with the hydrothermal explosion (figure 37). The seismic plot shows a strong wave initially arriving at 2026 NZ local time. The velocity of sound in air is several-fold slower that the velocity of vibrations through rock (seismic waves). In addition, the sound waves were recorded at a station ~ 6 km farther away from the signal source. Consequently the sound signal's first arrival was later.
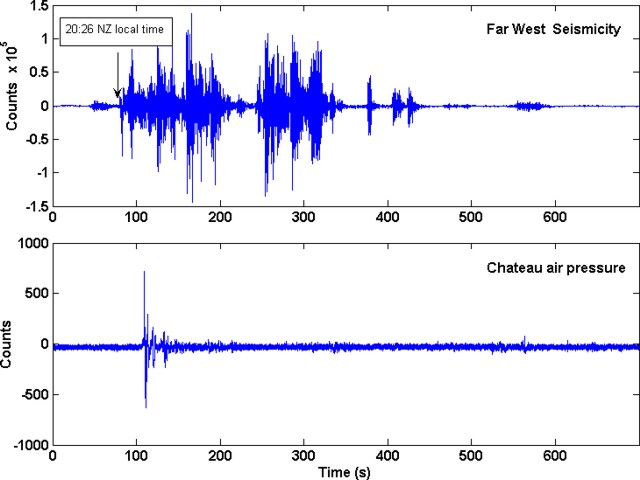 |
Figure 37. Seismic and air pressure plots of the eruption at Ruapehu on 25 September 2007. The seismic data were recorded at the seismic station termed the Far West T-bar, on the N flank of the volcano, ~ 3.1 km from the center of Crater Lake. The air pressure (sound wave) signal was recorded at the Chateau station, 9.1 km from the center of Crater Lake. Courtesy of GeoNet. |
Work is still in progress to understand the complicated lahar dynamics of this event. Three main lahars descended the mountain on 25 September. Two headed roughly E (one via the outlet and associated Whangaehu Gorge, the other, larger, out over the crater walls and down a glacier). Another lahar went N (over the crater walls).
The photo of Ruapehu's summit taken from a plane, shown in figure 35 in BGVN 32:10, was a view from the NE illustrating the scene shortly after the eruption. A similar photo appears here as figure 38, although this photo was taken from the E. In both these photos, the largest (most conspicuous) lahar follows a straight path from the summit area adjacent Crater Lake. It traveled over the Whangaehu glacier.
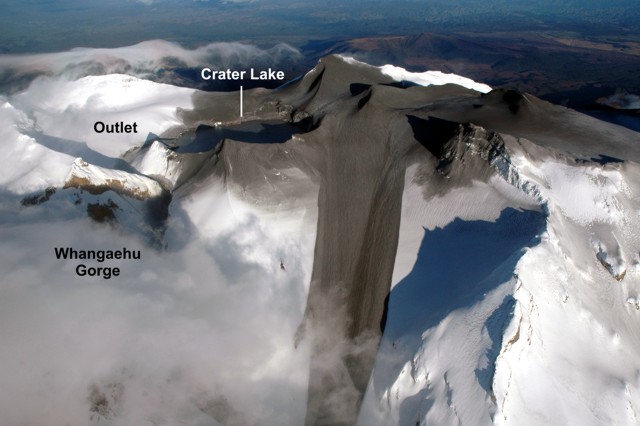 |
Figure 38. Photograph of Ruapehu taken from the E with a view centered on the largest 25 September lahar. That lahar made its descent on the surface of the Whangaehu glacier. The outlet for Crater Lake (upper left) feeds from the Lake's S (left) end, draining down the Whangaehu Gorge. In this photo, the steep sided Gorge becomes shrouded in clouds towards the lower left corner. Courtesy of GeoNet. |
Ejecta apparently accumulated in the N Crater basin (figure 39) before some of it flowed down the Whangaehu glacier. The latter lahar was complex, owing to eruption-blasted water followed by runoff and other possible complexities still under study. The third lahar was small and came down the Ruapehu's N side. It passed near a ski slope (figures 40 and 41).
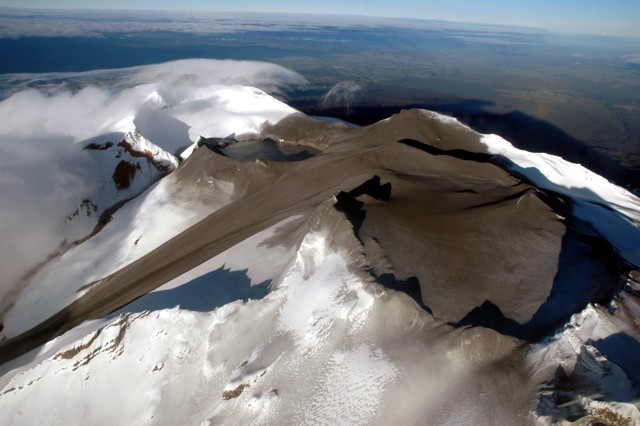 |
Figure 39. A view of Ruapehu taken from the NE. The Whangaehu Gorge (left back) drains from Crater Lake's outlet, containing a narrow, confined lahar there. In the upper center, Crater Lake is surrounded by gray ash. The dark area across the center to left is the large lahar down the Whangaehu Glacier. The large dark circular area at the right is the ash-covered N Crater basin. Courtesy of Brad Scott and GeoNet. |
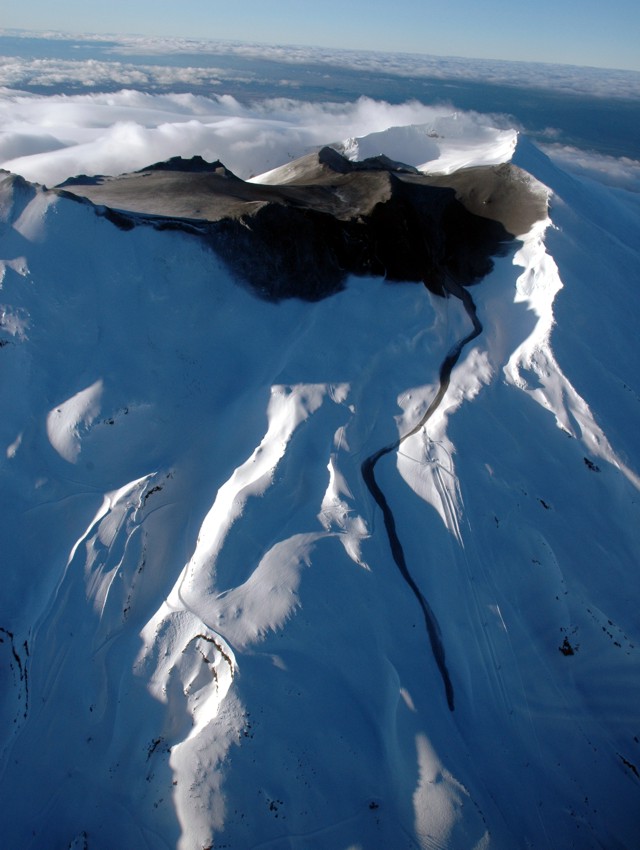 |
Figure 40. This view at Ruapehu was taken from the N and shows a small 25 September lahar down the Whakapapa Valley. The distal end of this lahar descended past the ski slope's Far West T- Bar (a piling for this ski lift is in the right background of the next photo). The prominent ash-covered ridge in the upper center is Dome Ridge, which obscures the view of the lake. Courtesy of GeoNet. |
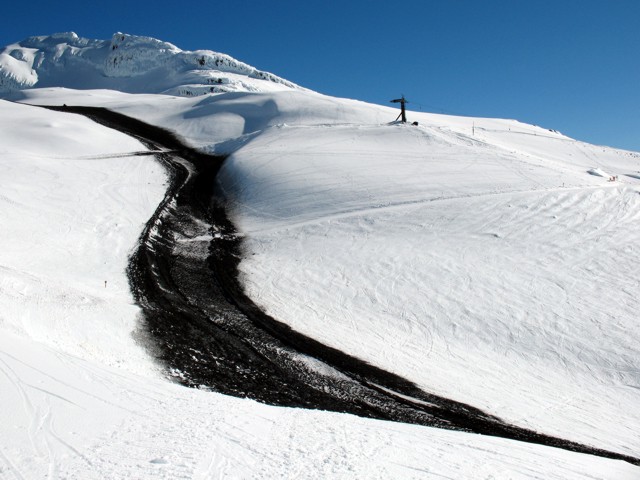 |
Figure 41. A Ruapehu lahar that traveled down the Whakapapa ski field. Levees appear at or near the lahar margins. The snow in this area is firm and groomed for skiing, and the lahar melted it by a few tens of centimeters. Courtesy of GeoNet. |
A view of Crater Lake looking S into the crater from the Dome Shelter (figure 42) shows the strong directionality of the blast to the N (towards Dome Shelter). Numerous small blocks and bombs are visible in the foreground. Near the lake appear some lighter textured deposits on the snow (figure 42). These are rather thin (less than 0.5-1 m thick) and cross some of the darker deposits. Initial field interpretations were that these lighter deposits formed in two ways. One is the deposits mark the absorption of ejected Crater Lake water into the snow pack. The second is that they preserve the aerosol developed on the fringes of a directed blast of steam and water discharged from the Lake. Figure 43 is similar to the previous one, only viewed standing on debris farther to the E, an area where significant runoff formed a long narrow channel, which in the foreground traveled downslope towards the viewer.
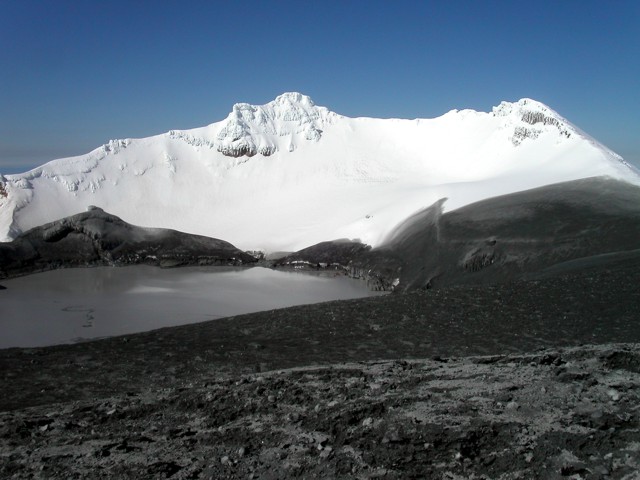 |
Figure 42. Ruapehu's Crater Lake as seen from the N at Dome Shelter. Courtesy of GNS. |
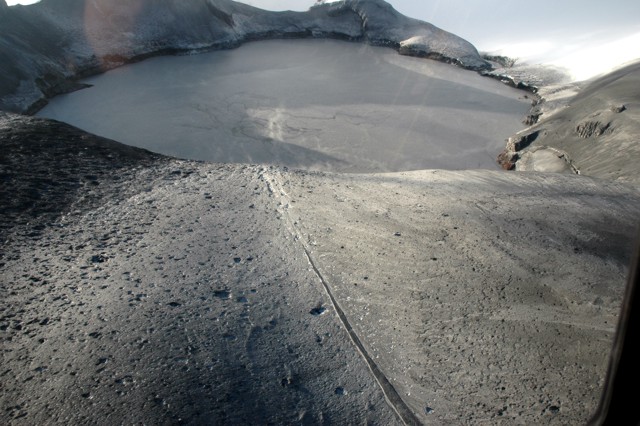 |
Figure 43. A photo of Ruapehu's Crater Lake looking SE from the Whakapapa Glacier showing the outlet (on the Lake's top-right). The lake surface contains disturbances caused by upwelling water and sulfur slicks (dark streaks). Note craters from ballistic ejecta. The long straight line is a runoff channel. Courtesy of GeoNet. |
Dome Shelter and news-reported injury. Dome Shelter was partly buried by typical snow accumulation, over which came the deposits from the hydrothermal eruption, some of which invaded the structure (figure 44). To summarize news stories in the New Zealand Herald and The Sydney Morning Herald, four mountaineers were camped in the Shelter during the explosion. William Pike's left leg was injured and his right leg below the knee was crushed and pinned by deposits. He was rescued and ultimately flown out by helicopter but had suffered severe hypothermia. Doctors said at one point he was very near death, with body temperature in the 25-26°C range. They managed to save him after amputating the lower portion of his right leg. The news also reported that the Shelter was designated for emergency use only (not as a camping shelter).
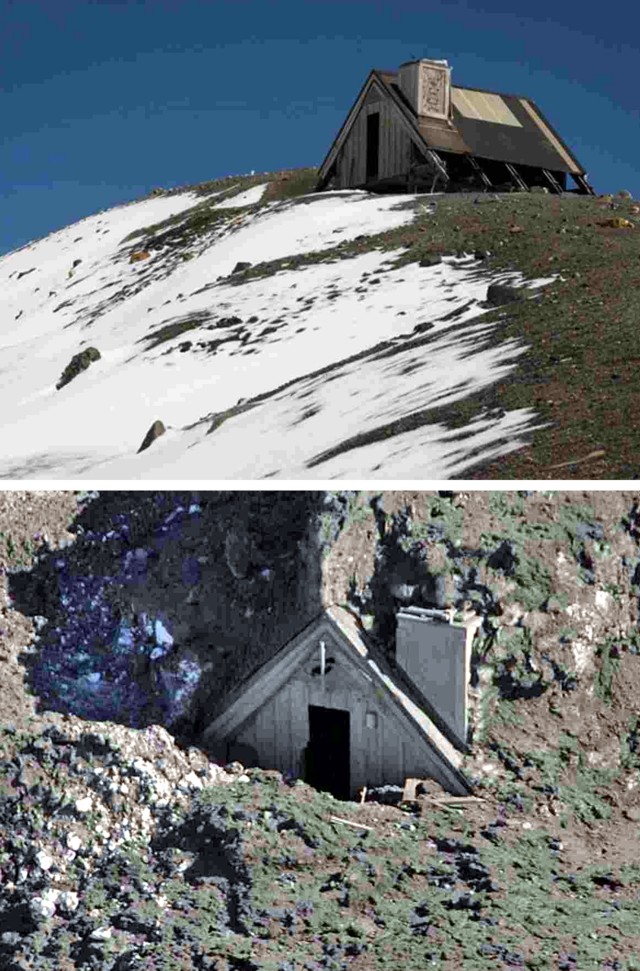 |
Figure 44. Dome Shelter on Ruapehu as seen in relatively snow-free conditions at some point well prior to the eruption (top). Seen from the air after the hydrothermal eruption, the Shelter is covered by seasonal snow followed by mud and debris. Pre-eruption photo credit to Greg Bowker, post-eruption photo credit to Alan Gibson; accessed on the website of the New Zealand Herald. |
GNS noted that the Shelter also houses monitoring instruments, equipment less damaged than initially thought. Data from one of the two seismic systems continued to flow, although the data were rather noisy. Accordingly, GNS began relying on nearby monitoring stations.
Reference. Manville, V., and Cronin, S.J., 2007, Breakout lahar from New Zealand's Crater Lake, Earth Observing Satellite, Transactions, American Geophysical Union, v. 88, no. 43, p. 441-442.
Information Contacts: Brad Scott, Institute of Geological & Nuclear Sciences (IGNS), Private Bag 2000, Wairakei, New Zealand (URL: http://www.gns.cri.nz/); New Zealand GeoNet Project (URL: http://www.geonet.org.nz/); New Zealand Herald (URL: http://www.nzherald.co.nz/); Sydney Morning Herald (URL: http://www.smh.com.au/).
2009-2011: Earthquake triggered shift in lake height; lake heating cycle
New Zealand's GeoNet, a combination of the country's Earthquake Commission and GNS Science, reported that at 1830 on 13 July 2009, there was a small (M 2) volcanic earthquake beneath Ruapehu's crater lake. As a result of a new research project measuring the temperature and level of the lake, instruments documented a sudden 15-cm jump in lake level following the earthquake. The lake temperature remained unchanged at 20°C.
The lake was examined from a helicopter on 14 July 2009. Viewing conditions were very poor, but no obvious changes had occurred since the last visit on 2 July 2009. No eruption had occurred and the lake was overflowing. The preliminary interpretation was that the volcanic earthquake was followed by about 20 x 106 liters of extra water moving into the lake from the hydrothermal system beneath it. A much larger rise in lake level had followed a very small eruption in October 2006, so lake-height adjustments were not unknown at Ruapehu. However, this was the first time that scientists had been able to correlate such a small rise with a single volcanic earthquake. The Volcanic Alert Level remained at Level 1 (a designation signifying a departure from typical background surface activity and signs of unrest).
In October 2010, GeoNet reported that the lake had began a heating cycle, the eighth since the lake was re-established in 2002 after the 1995-1996 eruptions (BGVN 20:09 and 20:10). Later, on 7 March 2011, GeoNet reported the lake temperature at 40°C, the third highest temperature recorded since the re-establishment of the lake (table 14).
Table 14. Summary of reported temperatures in Ruapehu's Crater Lake. Courtesy of GeoNet.
| Date | Crater Lake Temperature | Comments |
| May 2003 | 42.5°C | Highest temperature since re-establishment of lake in 2002 |
| 13 Jul 2009 | 20°C | Low temperature |
| Oct 2010 | -- | Onset of 2010-2011 heating cycle |
| 07 Mar 2011 | 40-41°C | High temperatures |
| 05 Apr 2011 | 38-39°C | Slightly decreased (but still high) temperatures around this time |
| 18 Apr 2011 | 33-34°C | Decreased temperatures |
| 02 May 2011 | 30°C | Further drop in temperature |
Other monitored indicators had shown variable trends in parts of March 2011. Those indicators included gas output, seismicity, lake chemistry, and ground deformation. Such variable trends were like those previously seen during lake heating cycles. GeoNet reported on 5 April 2011 that Ruapehu had undergone a sustained period of high Crater Lake water temperatures. In recent weeks changes also occurred in volcanic gas output, seismic activity and lake water chemistry. These changes suggested unrest above known background levels, hence authorities elevated the Aviation Color Code to Yellow but kept the Volcanic Alert Level at 1. After 4 April there was a general decrease in activity, with lower CO2 gas flux, less seismicity, little change in lake-water chemistry, and cessation of lake overflow accompanying the start of the cooling trend. On 18 April 2011 GeoNet reported decreased lake temperature; other monitored indicators in recent weeks also suggest a slow decrease of activity. On 2 May 2011 authorities lowered the Aviation Color Code to Green, the lowest hazard status. This followed a continued decrease in lake-water temperature and several weeks of slow decreases in other available indicators.
Information Contacts: GeoNet (URL: http://www.geonet.org.nz/).
|
|
||||||||||||||||||||||||||||
There is data available for 64 confirmed eruptive periods.
2007 Sep 25 - 2007 Sep 25 Confirmed Eruption (Explosive / Effusive) VEI: 1
| Episode 1 | Eruption (Explosive / Effusive) | ||||||||||||||||||||||||||||||||||||||||||||||||||||||||||||||||
|---|---|---|---|---|---|---|---|---|---|---|---|---|---|---|---|---|---|---|---|---|---|---|---|---|---|---|---|---|---|---|---|---|---|---|---|---|---|---|---|---|---|---|---|---|---|---|---|---|---|---|---|---|---|---|---|---|---|---|---|---|---|---|---|---|
| 2007 Sep 25 - 2007 Sep 25 | Evidence from Observations: Reported | |||||||||||||||||||||||||||||||||||||||||||||||||||||||||||||||
|
List of 11 Events for Episode 1
|
||||||||||||||||||||||||||||||||||||||||||||||||||||||||||||||||
2006 Oct 4 - 2006 Oct 4 Confirmed Eruption (Explosive / Effusive) VEI: 1
| Episode 1 | Eruption (Explosive / Effusive) | ||||||||||||||||||||||||
|---|---|---|---|---|---|---|---|---|---|---|---|---|---|---|---|---|---|---|---|---|---|---|---|---|
| 2006 Oct 4 - 2006 Oct 4 | Evidence from Observations: Reported | |||||||||||||||||||||||
|
List of 3 Events for Episode 1
|
||||||||||||||||||||||||
1997 Oct 9 - 1997 Oct 18 Confirmed Eruption (Explosive / Effusive) VEI: 1
| Episode 1 | Eruption (Explosive / Effusive) | ||||||||||||||||||||||||||||||||||
|---|---|---|---|---|---|---|---|---|---|---|---|---|---|---|---|---|---|---|---|---|---|---|---|---|---|---|---|---|---|---|---|---|---|---|
| 1997 Oct 9 - 1997 Oct 18 | Evidence from Observations: Reported | |||||||||||||||||||||||||||||||||
|
List of 5 Events for Episode 1
|
||||||||||||||||||||||||||||||||||
1996 Jun 16 - 1996 Sep 1 Confirmed Eruption (Explosive / Effusive) VEI: 3
| Episode 1 | Eruption (Explosive / Effusive) | |||||||||||||||||||||||||||||||||||||||||||||||||||||||||||||||||||||
|---|---|---|---|---|---|---|---|---|---|---|---|---|---|---|---|---|---|---|---|---|---|---|---|---|---|---|---|---|---|---|---|---|---|---|---|---|---|---|---|---|---|---|---|---|---|---|---|---|---|---|---|---|---|---|---|---|---|---|---|---|---|---|---|---|---|---|---|---|---|
| 1996 Jun 16 - 1996 Sep 1 | Evidence from Observations: Reported | ||||||||||||||||||||||||||||||||||||||||||||||||||||||||||||||||||||
|
List of 12 Events for Episode 1
|
|||||||||||||||||||||||||||||||||||||||||||||||||||||||||||||||||||||
[ 1996 Mar 21 (on or before) ] Uncertain Eruption
| Episode 1 | Eruption (Explosive / Effusive) | |||||||||||||||||||||||||||||||||||||||
|---|---|---|---|---|---|---|---|---|---|---|---|---|---|---|---|---|---|---|---|---|---|---|---|---|---|---|---|---|---|---|---|---|---|---|---|---|---|---|---|
| 1996 Mar 21 (on or before) - Unknown | Evidence from Unknown | ||||||||||||||||||||||||||||||||||||||
|
List of 6 Events for Episode 1
|
|||||||||||||||||||||||||||||||||||||||
1995 Jan 11 (?) - 1995 Nov 9 Confirmed Eruption (Explosive / Effusive) VEI: 3
| Episode 1 | Eruption (Explosive / Effusive) | ||||||||||||||||||||||||||||||||||||||||||||||||||||||||||||||||||||||||||||||||||||
|---|---|---|---|---|---|---|---|---|---|---|---|---|---|---|---|---|---|---|---|---|---|---|---|---|---|---|---|---|---|---|---|---|---|---|---|---|---|---|---|---|---|---|---|---|---|---|---|---|---|---|---|---|---|---|---|---|---|---|---|---|---|---|---|---|---|---|---|---|---|---|---|---|---|---|---|---|---|---|---|---|---|---|---|---|
| 1995 Jan 11 (?) - 1995 Nov 9 | Evidence from Observations: Reported | |||||||||||||||||||||||||||||||||||||||||||||||||||||||||||||||||||||||||||||||||||
|
List of 15 Events for Episode 1
|
||||||||||||||||||||||||||||||||||||||||||||||||||||||||||||||||||||||||||||||||||||
[ 1994 Feb 12 - 1994 Apr 1 ] Uncertain Eruption
| Episode 1 | Eruption (Explosive / Effusive) | ||||||||||||||||||||||||||||||||||||||||||||
|---|---|---|---|---|---|---|---|---|---|---|---|---|---|---|---|---|---|---|---|---|---|---|---|---|---|---|---|---|---|---|---|---|---|---|---|---|---|---|---|---|---|---|---|---|
| 1994 Feb 12 - 1994 Apr 1 | Evidence from Unknown | |||||||||||||||||||||||||||||||||||||||||||
|
List of 7 Events for Episode 1
|
||||||||||||||||||||||||||||||||||||||||||||
1992 Feb 8 - 1992 Mar 6 Confirmed Eruption (Explosive / Effusive) VEI: 1
| Episode 1 | Eruption (Explosive / Effusive) | |||||||||||||||||||||||||||||
|---|---|---|---|---|---|---|---|---|---|---|---|---|---|---|---|---|---|---|---|---|---|---|---|---|---|---|---|---|---|
| 1992 Feb 8 - 1992 Mar 6 | Evidence from Observations: Reported | ||||||||||||||||||||||||||||
|
List of 4 Events for Episode 1
|
|||||||||||||||||||||||||||||
1991 Jul 5 (?) - 1991 Jul 14 (?) Confirmed Eruption (Explosive / Effusive) VEI: 1
| Episode 1 | Eruption (Explosive / Effusive) | ||||||||||||||||||||||||||||||||||
|---|---|---|---|---|---|---|---|---|---|---|---|---|---|---|---|---|---|---|---|---|---|---|---|---|---|---|---|---|---|---|---|---|---|---|
| 1991 Jul 5 (?) - 1991 Jul 14 (?) | Evidence from Observations: Reported | |||||||||||||||||||||||||||||||||
|
List of 5 Events for Episode 1
|
||||||||||||||||||||||||||||||||||
1990 Jun 17 - 1990 Sep 8 (on or before) Confirmed Eruption (Explosive / Effusive) VEI: 0
| Episode 1 | Eruption (Explosive / Effusive) | ||||||||||||||||||||||||
|---|---|---|---|---|---|---|---|---|---|---|---|---|---|---|---|---|---|---|---|---|---|---|---|---|
| 1990 Jun 17 - 1990 Sep 8 (on or before) | Evidence from Observations: Reported | |||||||||||||||||||||||
|
List of 3 Events for Episode 1
|
||||||||||||||||||||||||
1990 Jan 7 - 1990 Jan 26 Confirmed Eruption (Explosive / Effusive) VEI: 1
| Episode 1 | Eruption (Explosive / Effusive) | |||||||||||||||||||||||||||||
|---|---|---|---|---|---|---|---|---|---|---|---|---|---|---|---|---|---|---|---|---|---|---|---|---|---|---|---|---|---|
| 1990 Jan 7 - 1990 Jan 26 | Evidence from Observations: Reported | ||||||||||||||||||||||||||||
|
List of 4 Events for Episode 1
|
|||||||||||||||||||||||||||||
1989 Jul 1 - 1989 Sep 20 (?) Confirmed Eruption (Explosive / Effusive) VEI: 1
| Episode 1 | Eruption (Explosive / Effusive) | ||||||||||||||||||||||||
|---|---|---|---|---|---|---|---|---|---|---|---|---|---|---|---|---|---|---|---|---|---|---|---|---|
| 1989 Jul 1 - 1989 Sep 20 (?) | Evidence from Observations: Reported | |||||||||||||||||||||||
|
List of 3 Events for Episode 1
|
||||||||||||||||||||||||
1988 Dec 8 - 1989 Mar 5 (?) Confirmed Eruption (Explosive / Effusive) VEI: 1
| Episode 1 | Eruption (Explosive / Effusive) | ||||||||||||||||||||||||||||||||||||||||||||||||||||||||||||||||
|---|---|---|---|---|---|---|---|---|---|---|---|---|---|---|---|---|---|---|---|---|---|---|---|---|---|---|---|---|---|---|---|---|---|---|---|---|---|---|---|---|---|---|---|---|---|---|---|---|---|---|---|---|---|---|---|---|---|---|---|---|---|---|---|---|
| 1988 Dec 8 - 1989 Mar 5 (?) | Evidence from Observations: Reported | |||||||||||||||||||||||||||||||||||||||||||||||||||||||||||||||
|
List of 11 Events for Episode 1
|
||||||||||||||||||||||||||||||||||||||||||||||||||||||||||||||||
1988 Mar 20 - 1988 May 25 ± 3 days Confirmed Eruption (Explosive / Effusive) VEI: 1
| Episode 1 | Eruption (Explosive / Effusive) | ||||||||||||||||||||||||||||||||||
|---|---|---|---|---|---|---|---|---|---|---|---|---|---|---|---|---|---|---|---|---|---|---|---|---|---|---|---|---|---|---|---|---|---|---|
| 1988 Mar 20 - 1988 May 25 ± 3 days | Evidence from Observations: Reported | |||||||||||||||||||||||||||||||||
|
List of 5 Events for Episode 1
|
||||||||||||||||||||||||||||||||||
1987 Aug 24 - 1987 Aug 30 Confirmed Eruption (Explosive / Effusive) VEI: 1
| Episode 1 | Eruption (Explosive / Effusive) | ||||||||||||||||||||||||||||||||||||||||||||
|---|---|---|---|---|---|---|---|---|---|---|---|---|---|---|---|---|---|---|---|---|---|---|---|---|---|---|---|---|---|---|---|---|---|---|---|---|---|---|---|---|---|---|---|---|
| 1987 Aug 24 - 1987 Aug 30 | Evidence from Observations: Reported | |||||||||||||||||||||||||||||||||||||||||||
|
List of 7 Events for Episode 1
|
||||||||||||||||||||||||||||||||||||||||||||
1986 Feb 8 - 1986 Feb 9 (?) Confirmed Eruption (Explosive / Effusive) VEI: 1
| Episode 1 | Eruption (Explosive / Effusive) | |||||||||||||||||||||||||||||
|---|---|---|---|---|---|---|---|---|---|---|---|---|---|---|---|---|---|---|---|---|---|---|---|---|---|---|---|---|---|
| 1986 Feb 8 - 1986 Feb 9 (?) | Evidence from Observations: Reported | ||||||||||||||||||||||||||||
|
List of 4 Events for Episode 1
|
|||||||||||||||||||||||||||||
1985 Nov 15 - 1985 Nov 15 Confirmed Eruption (Explosive / Effusive) VEI: 1
| Episode 1 | Eruption (Explosive / Effusive) | ||||||||||||||||||||||||
|---|---|---|---|---|---|---|---|---|---|---|---|---|---|---|---|---|---|---|---|---|---|---|---|---|
| 1985 Nov 15 - 1985 Nov 15 | Evidence from Observations: Reported | |||||||||||||||||||||||
|
List of 3 Events for Episode 1
|
||||||||||||||||||||||||
1985 May 21 (on or before) - 1985 Jun 9 (?) Confirmed Eruption (Explosive / Effusive) VEI: 1
| Episode 1 | Eruption (Explosive / Effusive) | |||||||||||||||||||||||||||||
|---|---|---|---|---|---|---|---|---|---|---|---|---|---|---|---|---|---|---|---|---|---|---|---|---|---|---|---|---|---|
| 1985 May 21 (on or before) - 1985 Jun 9 (?) | Evidence from Observations: Reported | ||||||||||||||||||||||||||||
|
List of 4 Events for Episode 1
|
|||||||||||||||||||||||||||||
1984 Oct 25 (?) - 1984 Dec 16 ± 15 days Confirmed Eruption (Explosive / Effusive) VEI: 1
| Episode 1 | Eruption (Explosive / Effusive) | ||||||||||||||||||||||||
|---|---|---|---|---|---|---|---|---|---|---|---|---|---|---|---|---|---|---|---|---|---|---|---|---|
| 1984 Oct 25 (?) - 1984 Dec 16 ± 15 days | Evidence from Observations: Reported | |||||||||||||||||||||||
|
List of 3 Events for Episode 1
|
||||||||||||||||||||||||
1984 Apr 2 Confirmed Eruption (Explosive / Effusive) VEI: 1
| Episode 1 | Eruption (Explosive / Effusive) | ||||||||||||||||||||||||
|---|---|---|---|---|---|---|---|---|---|---|---|---|---|---|---|---|---|---|---|---|---|---|---|---|
| 1984 Apr 2 - Unknown | Evidence from Observations: Reported | |||||||||||||||||||||||
|
List of 3 Events for Episode 1
|
||||||||||||||||||||||||
1981 Oct 25 (?) - 1982 Apr 12 ± 3 days Confirmed Eruption (Explosive / Effusive) VEI: 1
| Episode 1 | Eruption (Explosive / Effusive) | |||||||||||||||||||||||||||||||||||||||||||||||||
|---|---|---|---|---|---|---|---|---|---|---|---|---|---|---|---|---|---|---|---|---|---|---|---|---|---|---|---|---|---|---|---|---|---|---|---|---|---|---|---|---|---|---|---|---|---|---|---|---|---|
| 1981 Oct 25 (?) - 1982 Apr 12 ± 3 days | Evidence from Observations: Reported | ||||||||||||||||||||||||||||||||||||||||||||||||
|
List of 8 Events for Episode 1
|
|||||||||||||||||||||||||||||||||||||||||||||||||
1980 Oct 18 - 1980 Nov 3 Confirmed Eruption (Explosive / Effusive) VEI: 1
| Episode 1 | Eruption (Explosive / Effusive) | |||||||||||||||||||||||||||||
|---|---|---|---|---|---|---|---|---|---|---|---|---|---|---|---|---|---|---|---|---|---|---|---|---|---|---|---|---|---|
| 1980 Oct 18 - 1980 Nov 3 | Evidence from Observations: Reported | ||||||||||||||||||||||||||||
|
List of 4 Events for Episode 1
|
|||||||||||||||||||||||||||||
1980 Jan 15 (?) - 1980 Mar 27 (?) Confirmed Eruption (Explosive / Effusive) VEI: 1
| Episode 1 | Eruption (Explosive / Effusive) | ||||||||||||||||||||||||||||||||||||||||||||
|---|---|---|---|---|---|---|---|---|---|---|---|---|---|---|---|---|---|---|---|---|---|---|---|---|---|---|---|---|---|---|---|---|---|---|---|---|---|---|---|---|---|---|---|---|
| 1980 Jan 15 (?) - 1980 Mar 27 (?) | Evidence from Observations: Reported | |||||||||||||||||||||||||||||||||||||||||||
|
List of 7 Events for Episode 1
|
||||||||||||||||||||||||||||||||||||||||||||
1979 Jun 30 - 1979 Jul 15 Confirmed Eruption (Explosive / Effusive) VEI: 1
| Episode 1 | Eruption (Explosive / Effusive) | |||||||||||||||||||||||||||||
|---|---|---|---|---|---|---|---|---|---|---|---|---|---|---|---|---|---|---|---|---|---|---|---|---|---|---|---|---|---|
| 1979 Jun 30 - 1979 Jul 15 | Evidence from Observations: Reported | ||||||||||||||||||||||||||||
|
List of 4 Events for Episode 1
|
|||||||||||||||||||||||||||||
1977 Jul 16 - 1979 Jan 17 Confirmed Eruption (Explosive / Effusive) VEI: 2
| Episode 1 | Eruption (Explosive / Effusive) | ||||||||||||||||||||||||||||||||||||||||||||||||||||||||||||||||
|---|---|---|---|---|---|---|---|---|---|---|---|---|---|---|---|---|---|---|---|---|---|---|---|---|---|---|---|---|---|---|---|---|---|---|---|---|---|---|---|---|---|---|---|---|---|---|---|---|---|---|---|---|---|---|---|---|---|---|---|---|---|---|---|---|
| 1977 Jul 16 - 1979 Jan 17 | Evidence from Observations: Reported | |||||||||||||||||||||||||||||||||||||||||||||||||||||||||||||||
|
List of 11 Events for Episode 1
|
||||||||||||||||||||||||||||||||||||||||||||||||||||||||||||||||
1976 Sep 12 (on or before) - 1976 Nov 22 (?) Confirmed Eruption (Explosive / Effusive) VEI: 1
| Episode 1 | Eruption (Explosive / Effusive) | |||||||||||||||||||||||||||||||||||||||
|---|---|---|---|---|---|---|---|---|---|---|---|---|---|---|---|---|---|---|---|---|---|---|---|---|---|---|---|---|---|---|---|---|---|---|---|---|---|---|---|
| 1976 Sep 12 (on or before) - 1976 Nov 22 (?) | Evidence from Observations: Reported | ||||||||||||||||||||||||||||||||||||||
|
List of 6 Events for Episode 1
|
|||||||||||||||||||||||||||||||||||||||
1976 Mar 6 - 1976 Mar 6 Confirmed Eruption (Explosive / Effusive) VEI: 1
| Episode 1 | Eruption (Explosive / Effusive) | ||||||||||||||||||||||||||||||||||
|---|---|---|---|---|---|---|---|---|---|---|---|---|---|---|---|---|---|---|---|---|---|---|---|---|---|---|---|---|---|---|---|---|---|---|
| 1976 Mar 6 - 1976 Mar 6 | Evidence from Observations: Reported | |||||||||||||||||||||||||||||||||
|
List of 5 Events for Episode 1
|
||||||||||||||||||||||||||||||||||
1975 Oct 17 (on or before) - 1975 Oct 17 (on or before) Confirmed Eruption (Explosive / Effusive) VEI: 1
| Episode 1 | Eruption (Explosive / Effusive) | |||||||||||||||||||||||||||||
|---|---|---|---|---|---|---|---|---|---|---|---|---|---|---|---|---|---|---|---|---|---|---|---|---|---|---|---|---|---|
| 1975 Oct 17 (on or before) - 1975 Oct 17 (on or before) | Evidence from Observations: Reported | ||||||||||||||||||||||||||||
|
List of 4 Events for Episode 1
|
|||||||||||||||||||||||||||||
1975 Apr 24 - 1975 Apr 27 Confirmed Eruption (Explosive / Effusive) VEI: 2
| Episode 1 | Eruption (Explosive / Effusive) | ||||||||||||||||||||||||||||||||||||||||||||||||||||||||||||||||
|---|---|---|---|---|---|---|---|---|---|---|---|---|---|---|---|---|---|---|---|---|---|---|---|---|---|---|---|---|---|---|---|---|---|---|---|---|---|---|---|---|---|---|---|---|---|---|---|---|---|---|---|---|---|---|---|---|---|---|---|---|---|---|---|---|
| 1975 Apr 24 - 1975 Apr 27 | Evidence from Observations: Reported | |||||||||||||||||||||||||||||||||||||||||||||||||||||||||||||||
|
List of 11 Events for Episode 1
|
||||||||||||||||||||||||||||||||||||||||||||||||||||||||||||||||
1973 Oct 31 - 1974 Oct 25 Confirmed Eruption (Explosive / Effusive) VEI: 1
| Episode 1 | Eruption (Explosive / Effusive) | |||||||||||||||||||||||||||||
|---|---|---|---|---|---|---|---|---|---|---|---|---|---|---|---|---|---|---|---|---|---|---|---|---|---|---|---|---|---|
| 1973 Oct 31 - 1974 Oct 25 | Evidence from Observations: Reported | ||||||||||||||||||||||||||||
|
List of 4 Events for Episode 1
|
|||||||||||||||||||||||||||||
1972 Oct 22 - 1973 Jan 10 Confirmed Eruption (Explosive / Effusive) VEI: 1
| Episode 1 | Eruption (Explosive / Effusive) | ||||||||||||||||||||||||
|---|---|---|---|---|---|---|---|---|---|---|---|---|---|---|---|---|---|---|---|---|---|---|---|---|
| 1972 Oct 22 - 1973 Jan 10 | Evidence from Observations: Reported | |||||||||||||||||||||||
|
List of 3 Events for Episode 1
|
||||||||||||||||||||||||
1971 Apr 3 - 1971 Nov 1 Confirmed Eruption (Explosive / Effusive) VEI: 2
| Episode 1 | Eruption (Explosive / Effusive) | ||||||||||||||||||||||||||||||||||||||||||||||||||||||||||||||||||||||||||
|---|---|---|---|---|---|---|---|---|---|---|---|---|---|---|---|---|---|---|---|---|---|---|---|---|---|---|---|---|---|---|---|---|---|---|---|---|---|---|---|---|---|---|---|---|---|---|---|---|---|---|---|---|---|---|---|---|---|---|---|---|---|---|---|---|---|---|---|---|---|---|---|---|---|---|
| 1971 Apr 3 - 1971 Nov 1 | Evidence from Observations: Reported | |||||||||||||||||||||||||||||||||||||||||||||||||||||||||||||||||||||||||
|
List of 13 Events for Episode 1
|
||||||||||||||||||||||||||||||||||||||||||||||||||||||||||||||||||||||||||
1970 Sep 16 - 1970 Sep 17 Confirmed Eruption (Explosive / Effusive) VEI: 1
| Episode 1 | Eruption (Explosive / Effusive) | ||||||||||||||||||||||||
|---|---|---|---|---|---|---|---|---|---|---|---|---|---|---|---|---|---|---|---|---|---|---|---|---|
| 1970 Sep 16 - 1970 Sep 17 | Evidence from Observations: Reported | |||||||||||||||||||||||
|
List of 3 Events for Episode 1
|
||||||||||||||||||||||||
1969 Jun 22 - 1969 Jun 23 Confirmed Eruption (Explosive / Effusive) VEI: 2
| Episode 1 | Eruption (Explosive / Effusive) | |||||||||||||||||||||||||||||||||||||||||||||||||||||||||||
|---|---|---|---|---|---|---|---|---|---|---|---|---|---|---|---|---|---|---|---|---|---|---|---|---|---|---|---|---|---|---|---|---|---|---|---|---|---|---|---|---|---|---|---|---|---|---|---|---|---|---|---|---|---|---|---|---|---|---|---|
| 1969 Jun 22 - 1969 Jun 23 | Evidence from Observations: Reported | ||||||||||||||||||||||||||||||||||||||||||||||||||||||||||
|
List of 10 Events for Episode 1
|
|||||||||||||||||||||||||||||||||||||||||||||||||||||||||||
1968 Apr 6 - 1968 Jun 10 Confirmed Eruption (Explosive / Effusive) VEI: 2
| Episode 1 | Eruption (Explosive / Effusive) | ||||||||||||||||||||||||||||||||||
|---|---|---|---|---|---|---|---|---|---|---|---|---|---|---|---|---|---|---|---|---|---|---|---|---|---|---|---|---|---|---|---|---|---|---|
| 1968 Apr 6 - 1968 Jun 10 | Evidence from Observations: Reported | |||||||||||||||||||||||||||||||||
|
List of 5 Events for Episode 1
|
||||||||||||||||||||||||||||||||||
1967 Jul 22 - 1967 Oct 4 (?) Confirmed Eruption (Explosive / Effusive) VEI: 1
| Episode 1 | Eruption (Explosive / Effusive) | ||||||||||||||||||||||||
|---|---|---|---|---|---|---|---|---|---|---|---|---|---|---|---|---|---|---|---|---|---|---|---|---|
| 1967 Jul 22 - 1967 Oct 4 (?) | Evidence from Observations: Reported | |||||||||||||||||||||||
|
List of 3 Events for Episode 1
|
||||||||||||||||||||||||
1966 Apr 4 - 1966 Sep 27 Confirmed Eruption (Explosive / Effusive) VEI: 1
| Episode 1 | Eruption (Explosive / Effusive) | ||||||||||||||||||||||||||||||||||
|---|---|---|---|---|---|---|---|---|---|---|---|---|---|---|---|---|---|---|---|---|---|---|---|---|---|---|---|---|---|---|---|---|---|---|
| 1966 Apr 4 - 1966 Sep 27 | Evidence from Observations: Reported | |||||||||||||||||||||||||||||||||
|
List of 5 Events for Episode 1
|
||||||||||||||||||||||||||||||||||
1959 May 21 - 1959 Aug 31 Confirmed Eruption (Explosive / Effusive) VEI: 1
| Episode 1 | Eruption (Explosive / Effusive) | |||||||||||||||||||||||||||||
|---|---|---|---|---|---|---|---|---|---|---|---|---|---|---|---|---|---|---|---|---|---|---|---|---|---|---|---|---|---|
| 1959 May 21 - 1959 Aug 31 | Evidence from Observations: Reported | ||||||||||||||||||||||||||||
|
List of 4 Events for Episode 1
|
|||||||||||||||||||||||||||||
1956 Nov 18 - 1956 Nov 18 Confirmed Eruption (Explosive / Effusive) VEI: 1
| Episode 1 | Eruption (Explosive / Effusive) | |||||||||||||||||||
|---|---|---|---|---|---|---|---|---|---|---|---|---|---|---|---|---|---|---|---|
| 1956 Nov 18 - 1956 Nov 18 | Evidence from Observations: Reported | ||||||||||||||||||
|
List of 2 Events for Episode 1
|
|||||||||||||||||||
1952 Jul 16 ± 15 days Confirmed Eruption (Explosive / Effusive) VEI: 1
| Episode 1 | Eruption (Explosive / Effusive) | ||||||||||||||||||||||||
|---|---|---|---|---|---|---|---|---|---|---|---|---|---|---|---|---|---|---|---|---|---|---|---|---|
| 1952 Jul 16 ± 15 days - Unknown | Evidence from Observations: Reported | |||||||||||||||||||||||
|
List of 3 Events for Episode 1
|
||||||||||||||||||||||||
1951 Mar 19 Confirmed Eruption (Explosive / Effusive) VEI: 1
| Episode 1 | Eruption (Explosive / Effusive) | |||||||||||||||||||
|---|---|---|---|---|---|---|---|---|---|---|---|---|---|---|---|---|---|---|---|
| 1951 Mar 19 - Unknown | Evidence from Observations: Reported | ||||||||||||||||||
|
List of 2 Events for Episode 1
|
|||||||||||||||||||
1950 Jun 26 - 1950 Jun 26 Confirmed Eruption (Explosive / Effusive) VEI: 1
| Episode 1 | Eruption (Explosive / Effusive) | |||||||||||||||||||
|---|---|---|---|---|---|---|---|---|---|---|---|---|---|---|---|---|---|---|---|
| 1950 Jun 26 - 1950 Jun 26 | Evidence from Observations: Reported | ||||||||||||||||||
|
List of 2 Events for Episode 1
|
|||||||||||||||||||
1948 May 1 Confirmed Eruption (Explosive / Effusive) VEI: 1
| Episode 1 | Eruption (Explosive / Effusive) | |||||||||||||||||||
|---|---|---|---|---|---|---|---|---|---|---|---|---|---|---|---|---|---|---|---|
| 1948 May 1 - Unknown | Evidence from Observations: Reported | ||||||||||||||||||
|
List of 2 Events for Episode 1
|
|||||||||||||||||||
1946 Nov 21 - 1947 May 31 Confirmed Eruption (Explosive / Effusive) VEI: 1
| Episode 1 | Eruption (Explosive / Effusive) | |||||||||||||||||||||||||||||
|---|---|---|---|---|---|---|---|---|---|---|---|---|---|---|---|---|---|---|---|---|---|---|---|---|---|---|---|---|---|
| 1946 Nov 21 - 1947 May 31 | Evidence from Observations: Reported | ||||||||||||||||||||||||||||
|
List of 4 Events for Episode 1
|
|||||||||||||||||||||||||||||
1946 Apr - 1946 Jun Confirmed Eruption (Explosive / Effusive) VEI: 2
| Episode 1 | Eruption (Explosive / Effusive) | |||||||||||||||||||||||||||||
|---|---|---|---|---|---|---|---|---|---|---|---|---|---|---|---|---|---|---|---|---|---|---|---|---|---|---|---|---|---|
| 1946 Apr - 1946 Jun | Evidence from Observations: Reported | ||||||||||||||||||||||||||||
|
List of 4 Events for Episode 1
|
|||||||||||||||||||||||||||||
1945 Mar 8 - 1945 Dec Confirmed Eruption (Explosive / Effusive) VEI: 3
| Episode 1 | Eruption (Explosive / Effusive) | |||||||||||||||||||||||||||||||||||||||||||||||||||||||||||
|---|---|---|---|---|---|---|---|---|---|---|---|---|---|---|---|---|---|---|---|---|---|---|---|---|---|---|---|---|---|---|---|---|---|---|---|---|---|---|---|---|---|---|---|---|---|---|---|---|---|---|---|---|---|---|---|---|---|---|---|
| 1945 Mar 8 - 1945 Dec | Evidence from Observations: Reported | ||||||||||||||||||||||||||||||||||||||||||||||||||||||||||
|
List of 10 Events for Episode 1
|
|||||||||||||||||||||||||||||||||||||||||||||||||||||||||||
1944 Oct Confirmed Eruption (Explosive / Effusive) VEI: 2
| Episode 1 | Eruption (Explosive / Effusive) | |||||||||||||||||||
|---|---|---|---|---|---|---|---|---|---|---|---|---|---|---|---|---|---|---|---|
| 1944 Oct - Unknown | Evidence from Observations: Reported | ||||||||||||||||||
|
List of 2 Events for Episode 1
|
|||||||||||||||||||
1942 Aug 10 Confirmed Eruption (Explosive / Effusive) VEI: 2
| Episode 1 | Eruption (Explosive / Effusive) | |||||||||||||||||||
|---|---|---|---|---|---|---|---|---|---|---|---|---|---|---|---|---|---|---|---|
| 1942 Aug 10 - Unknown | Evidence from Observations: Reported | ||||||||||||||||||
|
List of 2 Events for Episode 1
|
|||||||||||||||||||
1940 Apr Confirmed Eruption (Explosive / Effusive) VEI: 2
| Episode 1 | Eruption (Explosive / Effusive) | ||||||||||||||||||||||||
|---|---|---|---|---|---|---|---|---|---|---|---|---|---|---|---|---|---|---|---|---|---|---|---|---|
| 1940 Apr - Unknown | Evidence from Observations: Reported | |||||||||||||||||||||||
|
List of 3 Events for Episode 1
|
||||||||||||||||||||||||
1936 May 9 (?) - 1936 May 13 Confirmed Eruption (Explosive / Effusive) VEI: 2
| Episode 1 | Eruption (Explosive / Effusive) | ||||||||||||||||||||||||
|---|---|---|---|---|---|---|---|---|---|---|---|---|---|---|---|---|---|---|---|---|---|---|---|---|
| 1936 May 9 (?) - 1936 May 13 | Evidence from Observations: Reported | |||||||||||||||||||||||
|
List of 3 Events for Episode 1
|
||||||||||||||||||||||||
1934 Dec - 1935 Feb Confirmed Eruption (Explosive / Effusive) VEI: 2
| Episode 1 | Eruption (Explosive / Effusive) | |||||||||||||||||||
|---|---|---|---|---|---|---|---|---|---|---|---|---|---|---|---|---|---|---|---|
| 1934 Dec - 1935 Feb | Evidence from Observations: Reported | ||||||||||||||||||
|
List of 2 Events for Episode 1
|
|||||||||||||||||||
1934 Aug 11 Confirmed Eruption (Explosive / Effusive) VEI: 2
| Episode 1 | Eruption (Explosive / Effusive) | |||||||||||||||||||
|---|---|---|---|---|---|---|---|---|---|---|---|---|---|---|---|---|---|---|---|
| 1934 Aug 11 - Unknown | Evidence from Observations: Reported | ||||||||||||||||||
|
List of 2 Events for Episode 1
|
|||||||||||||||||||
1925 Jan 22 Confirmed Eruption (Explosive / Effusive) VEI: 2
| Episode 1 | Eruption (Explosive / Effusive) | |||||||||||||||||||||||||||||
|---|---|---|---|---|---|---|---|---|---|---|---|---|---|---|---|---|---|---|---|---|---|---|---|---|---|---|---|---|---|
| 1925 Jan 22 - Unknown | Evidence from Observations: Reported | ||||||||||||||||||||||||||||
|
List of 4 Events for Episode 1
|
|||||||||||||||||||||||||||||
1921 Oct Confirmed Eruption (Explosive / Effusive) VEI: 2
| Episode 1 | Eruption (Explosive / Effusive) | |||||||||||||||||||
|---|---|---|---|---|---|---|---|---|---|---|---|---|---|---|---|---|---|---|---|
| 1921 Oct - Unknown | Evidence from Observations: Reported | ||||||||||||||||||
|
List of 2 Events for Episode 1
|
|||||||||||||||||||
1918 Jun 29 Confirmed Eruption (Explosive / Effusive) VEI: 2
| Episode 1 | Eruption (Explosive / Effusive) | |||||||||||||||||||
|---|---|---|---|---|---|---|---|---|---|---|---|---|---|---|---|---|---|---|---|
| 1918 Jun 29 - Unknown | Evidence from Observations: Reported | ||||||||||||||||||
|
List of 2 Events for Episode 1
|
|||||||||||||||||||
1906 Mar 15 Confirmed Eruption (Explosive / Effusive) VEI: 2
| Episode 1 | Eruption (Explosive / Effusive) | |||||||||||||||||||||||||||||
|---|---|---|---|---|---|---|---|---|---|---|---|---|---|---|---|---|---|---|---|---|---|---|---|---|---|---|---|---|---|
| 1906 Mar 15 - Unknown | Evidence from Observations: Reported | ||||||||||||||||||||||||||||
|
List of 4 Events for Episode 1
|
|||||||||||||||||||||||||||||
1903 Confirmed Eruption (Explosive / Effusive) VEI: 2
| Episode 1 | Eruption (Explosive / Effusive) | |||||||||||||||||||||||||||||
|---|---|---|---|---|---|---|---|---|---|---|---|---|---|---|---|---|---|---|---|---|---|---|---|---|---|---|---|---|---|
| 1903 - Unknown | Evidence from Observations: Reported | ||||||||||||||||||||||||||||
|
List of 4 Events for Episode 1
|
|||||||||||||||||||||||||||||
1895 Mar 10 - 1895 Mar 14 (on or after) Confirmed Eruption (Explosive / Effusive) VEI: 2
| Episode 1 | Eruption (Explosive / Effusive) | |||||||||||||||||||||||||||||||||||||||
|---|---|---|---|---|---|---|---|---|---|---|---|---|---|---|---|---|---|---|---|---|---|---|---|---|---|---|---|---|---|---|---|---|---|---|---|---|---|---|---|
| 1895 Mar 10 - 1895 Mar 14 (on or after) | Evidence from Observations: Reported | ||||||||||||||||||||||||||||||||||||||
|
List of 6 Events for Episode 1
|
|||||||||||||||||||||||||||||||||||||||
1889 May 1 Confirmed Eruption (Explosive / Effusive) VEI: 2
| Episode 1 | Eruption (Explosive / Effusive) | ||||||||||||||||||||||||
|---|---|---|---|---|---|---|---|---|---|---|---|---|---|---|---|---|---|---|---|---|---|---|---|---|
| 1889 May 1 - Unknown | Evidence from Observations: Reported | |||||||||||||||||||||||
|
List of 3 Events for Episode 1
|
||||||||||||||||||||||||
1861 May 16 Confirmed Eruption (Explosive / Effusive) VEI: 2
| Episode 1 | Eruption (Explosive / Effusive) | ||||||||||||||||||||||||||||||||||||||||||||
|---|---|---|---|---|---|---|---|---|---|---|---|---|---|---|---|---|---|---|---|---|---|---|---|---|---|---|---|---|---|---|---|---|---|---|---|---|---|---|---|---|---|---|---|---|
| 1861 May 16 - Unknown | Evidence from Observations: Reported | |||||||||||||||||||||||||||||||||||||||||||
|
List of 7 Events for Episode 1
|
||||||||||||||||||||||||||||||||||||||||||||
1210 ± 150 years Confirmed Eruption (Explosive / Effusive) VEI: 3
| Episode 1 | Eruption (Explosive / Effusive) | Tf5 tephra | |||||||||||||||||||||||
|---|---|---|---|---|---|---|---|---|---|---|---|---|---|---|---|---|---|---|---|---|---|---|---|---|
| 1210 ± 150 years - Unknown | Evidence from Isotopic: 14C (uncalibrated) | |||||||||||||||||||||||
|
List of 3 Events for Episode 1 at Tf5 tephra
|
||||||||||||||||||||||||
5550 BCE ± 2500 years Confirmed Eruption (Explosive / Effusive)
| Episode 1 | Eruption (Explosive / Effusive) | NE flank (Whakapapa) | |||||||||||||||||||||||
|---|---|---|---|---|---|---|---|---|---|---|---|---|---|---|---|---|---|---|---|---|---|---|---|---|
| 5550 BCE ± 2500 years - Unknown | Evidence from Correlation: Tephrochronology | |||||||||||||||||||||||
|
List of 3 Events for Episode 1 at NE flank (Whakapapa)
|
||||||||||||||||||||||||
7590 BCE ± 100 years Confirmed Eruption (Explosive / Effusive)
| Episode 1 | Eruption (Explosive / Effusive) | North flank (Whakapapanui Gorge area) | ||||||||||||||||||||||||||||
|---|---|---|---|---|---|---|---|---|---|---|---|---|---|---|---|---|---|---|---|---|---|---|---|---|---|---|---|---|---|
| 7590 BCE ± 100 years - Unknown | Evidence from Isotopic: 14C (uncalibrated) | ||||||||||||||||||||||||||||
|
List of 4 Events for Episode 1 at North flank (Whakapapanui Gorge area)
|
|||||||||||||||||||||||||||||
7840 BCE (in or before) Confirmed Eruption (Explosive / Effusive) VEI: 4
| Episode 1 | Eruption (Explosive / Effusive) | Upper north flank (Pinnacle Ridge) | ||||||||||||||||||||||||||||
|---|---|---|---|---|---|---|---|---|---|---|---|---|---|---|---|---|---|---|---|---|---|---|---|---|---|---|---|---|---|
| 7840 BCE (in or before) - Unknown | Evidence from Isotopic: 14C (uncalibrated) | ||||||||||||||||||||||||||||
|
List of 4 Events for Episode 1 at Upper north flank (Pinnacle Ridge)
|
|||||||||||||||||||||||||||||
9650 BCE (?) Confirmed Eruption (Explosive / Effusive)
| Episode 1 | Eruption (Explosive / Effusive) | UT2 tephra | |||||||||||||||||||||||
|---|---|---|---|---|---|---|---|---|---|---|---|---|---|---|---|---|---|---|---|---|---|---|---|---|
| 9650 BCE (?) - Unknown | Evidence from Correlation: Tephrochronology | |||||||||||||||||||||||
|
List of 3 Events for Episode 1 at UT2 tephra
|
||||||||||||||||||||||||
9850 BCE (?) Confirmed Eruption (Explosive / Effusive)
| Episode 1 | Eruption (Explosive / Effusive) | UT1 tephra | ||||||||||||||||||
|---|---|---|---|---|---|---|---|---|---|---|---|---|---|---|---|---|---|---|---|
| 9850 BCE (?) - Unknown | Evidence from Isotopic: 14C (calibrated) | ||||||||||||||||||
|
List of 2 Events for Episode 1 at UT1 tephra
|
|||||||||||||||||||
This compilation of synonyms and subsidiary features may not be comprehensive. Features are organized into four major categories: Cones, Craters, Domes, and Thermal Features. Synonyms of features appear indented below the primary name. In some cases additional feature type, elevation, or location details are provided.
Synonyms |
||||
| Ruapahu | ||||
Cones |
||||
| Feature Name | Feature Type | Elevation | Latitude | Longitude |
| Hauhungatahi | Cone | 1521 m | 39° 14' 0.00" S | 175° 36' 0.00" E |
| Iwikau | Vent | |||
| Ohakune | Tuff ring | 893 m | 39° 24' 0.00" S | 175° 25' 0.00" E |
| Pinnacle Ridge | Vent | 2240 m | 39° 15' 0.00" S | 175° 34' 0.00" E |
| Pukeonake | Cone | 1225 m | 39° 9' 0.00" S | 175° 34' 0.00" E |
| Whakapaka | Cone | 1450 m | 39° 13' 0.00" S | 175° 37' 0.00" E |
Craters |
||||
| Feature Name | Feature Type | Elevation | Latitude | Longitude |
| Crater Lake
West Crater Te Wai ā-Moe |
Crater | 2751 m | 39° 17' 0.00" S | 175° 34' 0.00" E |
| East Crater | Crater | 2663 m | 39° 17' 0.00" S | 175° 23' 0.00" E |
| Girdlestone | Crater | 2797 m | 39° 18' 0.00" S | 175° 34' 0.00" E |
| North Crater | Crater | 2755 m | 39° 16' 0.00" S | 175° 34' 0.00" E |
| Rangataua Lakes | Maar | 550 m | 39° 26' 0.00" S | 175° 23' 0.00" E |
| Tama Lakes | Crater | 1400 m | 39° 12' 0.00" S | 175° 37' 0.00" E |
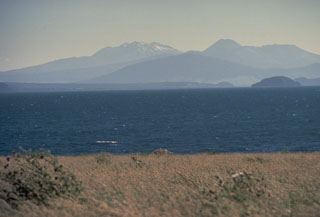 This view looking SW across Lake Taupo, the southernmost major caldera of the Taupo Volcanic Zone, shows several major peaks of Tongariro and Ruapehu. The broad forested peak below the center horizon is the Pleistocene Pihanga volcano. The steep-sided cone on the horizon to its right is Ngāuruhoe, the youngest cone of the Tongariro complex. The broad massif to its right is Tongariro. The snow-capped massif on the left-center horizon is Ruapehu.
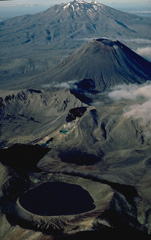 An aerial view from the north shows the Tongariro volcanic centre in the foreground with massive Ruapehu volcano in the background. The Tongariro volcanic centre consists of a dozen or more partially overlapping volcanoes. The 400-m-wide Blue Lake crater, in the foreground, erupted about 9700 years ago. The small Red Crater, at the center, had minor eruptions during the 19th and 20th centuries, and the symmetrical Ngāuruhoe stratovolcano behind it has been one of New Zealand's most frequently active volcanoes during historical time.
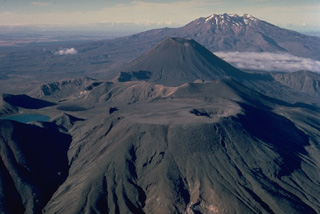 The Tongariro volcanic massif is a complex of more than a dozen composite volcanic cones erupted along a NE-SW line. Flat-topped North Crater in the foreground and conical Ngāuruhoe behind it are the two most prominent Tongariro volcanoes. North Crater's broad, flat top is the surface of a former lava lake; a small explosion crater later punctured its right side. Most historical eruptions of Tongariro have originated from the symmetrical Ngaurohoe stratovolcano. Ruapehu volcano forms the broad massif in the distance to the south.
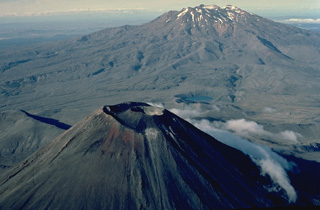 Two New Zealand volcanoes, the symmetrical Ngāuruhoe in the foreground and the massive Ruapehu in the background, are stratovolcanoes with dramatically different profiles. The steep-sided cone of Ngāuruhoe was formed during the past 2500 years by repeated eruptions from a single central conduit. The broad, elongated Ruapehu is a complex volcano that was formed by eruptions over a much longer period of time that constructed at least four overlapping volcanic edifices.
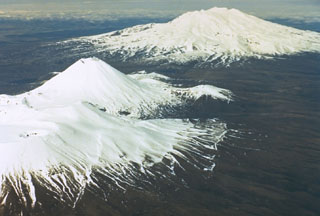 Tongariro, in the foreground, is a cluster of about a dozen cones and craters dominated by the symmetrical Ngāuruhoe cone. Ruapehu, in the background to the south, contains a frequently active crater lake. The two volcanoes have been two of the most frequently active in New Zealand.
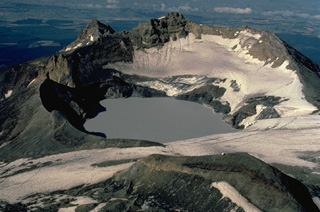 Crater Lake, at the summit of Ruapehu volcano, has produced frequent phreatic explosions during historical time. The depth of the 600-m-wide crater has varied dramatically in recent years, with the maximum depth ranging from 0 to 300 m. Occasionally the lake has been completely drained by explosive eruptions, as occurred most recently in 1996. The 2797-m summit of Ruapehu, Tahurangi Peak, is at the center behind the lake in this view from the north.
 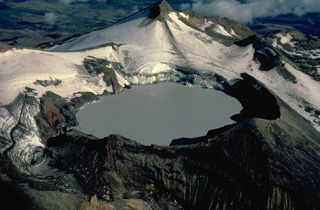 Appropriately named Crater Lake, the historically active summit vent of New Zealand's Ruapehu volcano, is one of the world's most frequently active crater lakes. Nearly 50 explosive eruptions originating from a vent beneath the lake have been recorded during the 20th century. This view from the NW shows the 600-m-wide lake with glacier-clad Mitre Peak in the background.
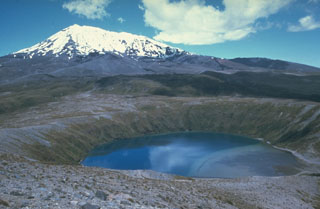 Lower Tama Lake on Tongariro was formed late in a series of eruptions that began about 10,000 years ago. The eruptions included the emplacement of two lava flows from Upper Tama Lake with a combined volume of 0.2 km3 and a smaller lava flow from Lower Tama Lake.
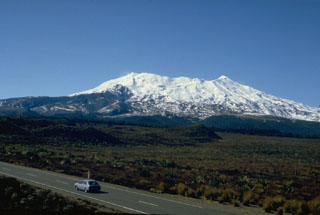 New Zealand's Ruapehu volcano, seen here from the W, has been constructed by incremental growth of partially overlapping volcanic edifices during the past 250,000 years. The compound volcano has a volume of 110 km3, and another 100 km3 of volcaniclastic debris forms a ring plain surrounding Ruapehu. Te Heu Heu and Girdlestone Peaks form the high points at the N and S ends, respectively.
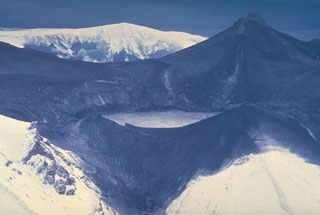 A major phreatomagmatic explosion on 22 June 1969 ejected ash and mud onto the area around Ruapehu's Crater Lake. The hot lake water along with snow melted by pyroclastic surges produced lahars that traveled down the four major valleys below the volcano. At the time, the brief eruption was the largest at Ruapehu since 1945 and lasted two and half hours. Ash-blackened Mitre Peak is at the top right, with the W rim of Crater Lake in the foreground.
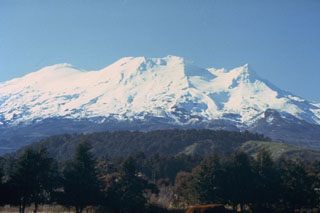 Ruapehu volcano, seen here from the south, forms a massif composed of at least four overlapping volcanic edifices. Located at the southern end of the Taupo volcanic zone, it contains an active crater lake near the summit. Phreatic explosions have produced mudflows that have affected ski areas on the upper flanks and river valleys below the volcano.
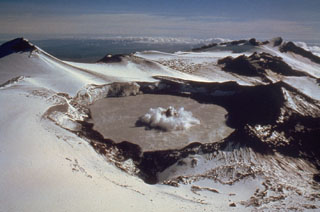 A small phreatic eruption on 29 February 1980, produces a column of ash and steam above Ruapehu's Crater Lake. A darker center plume is surrounded by a white ring produced by pyroclastic surges traveling across the lake surface. This view is from the NW, with Mitre Peak at the upper left. A series of small phreatic explosions had begun on 5 December 1979 and lasted until 15 April the following year.
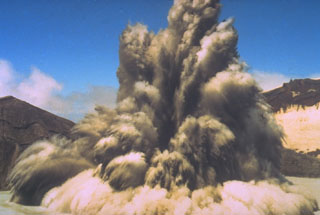 The interaction of magma and water can produce strong phreatic (steam-driven) explosions, such as in this 1980 photo of New Zealand's Ruapehu volcano. Ash and steam trail from large ejected blocks in the eruption column. Pyroclastic surge can be seen traveling radially along the surface of a crater lake. Phreatic or phreatomagmatic explosions are common at submarine volcanoes, crater lakes, and other places where hot magma (or associated gases) encounters surface water or groundwater.
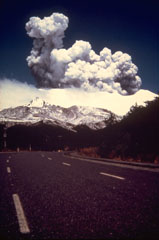 An eruption plume rises above the summit of Ruapehu on 11 November 1977, as seen from 5 km N of the summit on the ski area access road near Whakapapa village. Minor phreatic eruptions began in July and lasted until January 1979. The larger explosions in November produced pyroclastic surges in the summit crater area and a lahar down the Whangaehu River on the E flank.
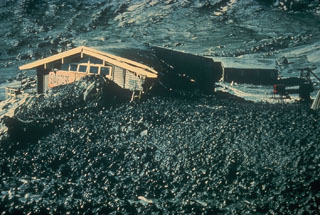 A restaurant at the Whakapapa ski area on the upper flanks of Ruapehu volcano was damaged by a lahar that originated from an explosive eruption on 22 June 1969. The lahar was produced by hot water ejected from the Crater Lake vent and snowpack around the crater that was melted by pyroclastic surges and hot tephra.
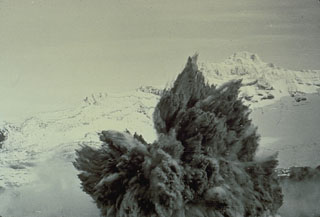 A Surtseyan eruption on 8 May 1971 at Crater Lake at the summit of Ruapehu volcano in New Zealand ejects a dark cock’s tail jet of volcanic ash, mud, and steam. Individual ejected blocks can be seen at the margins of the plume. This type of eruption column is typical of explosions that involve water-magma interactions.
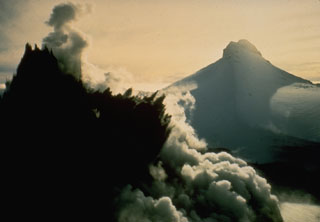 A dark cock's-tail plume is ejected from Crater Lake during the 8 May 1971 eruption of Ruapehu. This view from the NW shows Mitre Peak in the background at the onset of the eruption, which ejected material to 1.5 km above the crater. It was the largest of a series of phreatic and phreatomagmatic eruptions from 3 April to November.
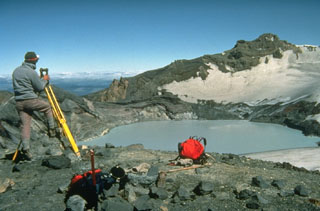 New Zealand volcanologist Brad Scott conducts theodolite (detecting height changes) measurements at Ruapehu’s Crater Lake in 1988. Measurements of the lake height, temperature, and chemistry are made routinely, and along with seismic instrumentation, are used to help forecast future activity of the volcano. Intermittent steam explosions from beneath the lake have produced lahars, which have damaged ski facilities on the upper flanks and structures in valleys below the volcano.
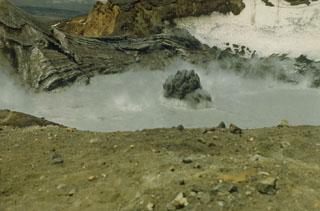 A series of minor phreatic eruptions, such as this one on 21 February 1982, took place from Crater Lake at the summit of Ruapehu volcano from October 1981 until April 1982. This eruption, seen here from the crater rim, is small compared to others that have taken place at Crater Lake.
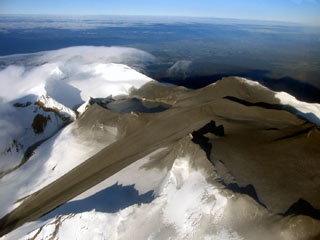 An aerial view of the summit of Ruapehu from the NE on 26 September 2007 show the effect of a brief eruption the previous day. The eruption originated from Crater Lake (left-center), and ejected ash and mud that covered much of the summit area. A large lahar swept down the Whangaehu glacier to the left and a smaller lahar exited the low point on the rim of Crater Lake and descended the narrow gully above the larger lahar.
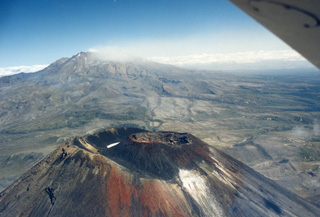 The Ngāuruhoe summit of the Tongariro volcanic complex is in the foreground, while in the background is a weak plume produced during the 1995-96 Ruapehu eruption, dispersing to the SW. The scoria cone within the Ngāuruhoe crater largely formed during the 1954-55 eruption and produced lava flows down the NW to W flanks.
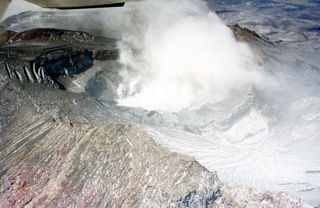 Te Wai ā-Moe (Crater Lake) is seen here within the Ruapehu southern crater with little water remaining during the 1995-96 eruption. Ash and ballistics were deposited onto the glaciers around the summit and much of the crater is exposed. The crater dimensions have changed throughout eruptions, with a 1993 publication noting a lake depth of 134 m. In recent times it typically has a lake volume of 9 million m3 (as of January 2022).
 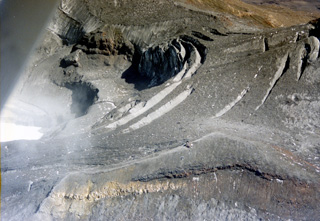 The 1995-96 eruption of Ruapehu ejected much of the water from Te Wai ā-Moe (Crater Lake), with the remaining lake to the left. The lake emptied in 1995 and was reestablished in 1996. Dome Shelter is above the northern crater rim, to the left of the lake in this view, surrounded by ash and other ejecta deposited during the eruption.
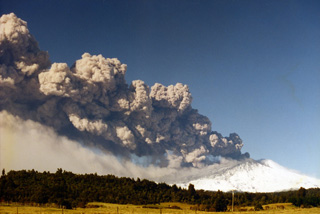 Ruapehu is seen here erupting on 17 June 1996 with a narrow ash plume that rose 8.5 km and extended 200 km NE from the vent. Ash is falling from the plume and is being carried by the wind below it. As well as impacting water, and power supplies, ash from this eruption effected agriculture and caused livestock fatalities.
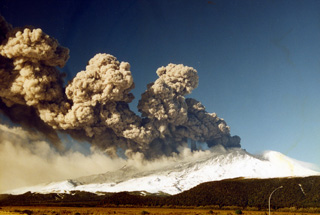 This 17 June 1996 photo shows the eruption of Ruapehu with an ash plume dispersing to the NE. The eruption varied in intensity, causing the differences in plume height with distance from the vent. Ashfall is visible across the flank and a lower plume is from the redispersal of the ash deposit.
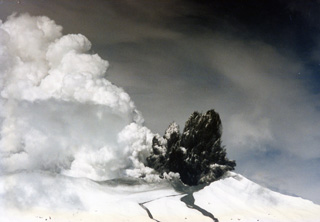 This September 1995 photo shows a Surtseyan plume at Ruapehu during the eruption through Te Wai ā-Moe (Crater Lake), forming the dark cock’s-tail plume above the vent and a gas-and-steam plume to the left from the lake water. Two lahar paths descend the Whakapapa ski field on the northern flank in the foreground. A third lahar traveled down the eastern flank Whangaehu Valley.
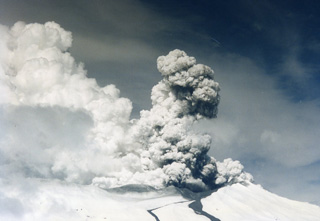 A gas-and-steam plume rises above the Ruapehu Te Wai ā-Moe (Crater Lake) during Surtseyan activity in September 1995 with two lahar deposits down the Whakapapa ski field on the northern flank. By early October almost all of the crater lake water had been removed.
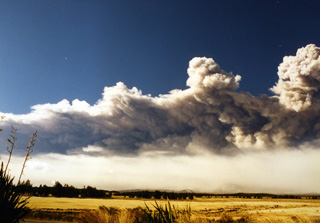 This 17 June 1996 photo shows the ash plume produced during the Ruapehu eruption that extended out to around 200 km, drifting over the Pacific Ocean. Below the main plume is the ash redispersing from the deposit emplaced across a narrow swath NE of the volcano.
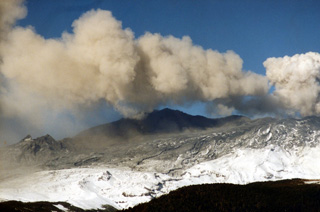 Ash was deposited across several flanks during the 1995-96 Ruapehu eruption. This weak ash plume was dispersed by the wind before it reached a significant height above the crater, with ash falling out of the plume across the dark deposit already covering the snow.
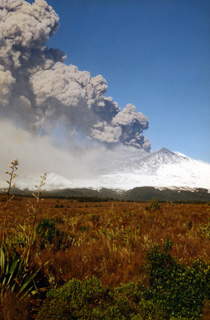 An ash plume erupts from the Ruapehu South Crater during the 1995-96 eruption, depositing ash across the flank. Ash was emplaced across a narrow swath on the NE North Island of New Zealand, out over the Pacific Ocean. This caused disruptions to water and power supplies and damage to the agricultural industry, with a cost of over $130 million New Zealand dollars to the tourism industry.
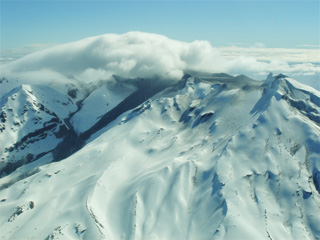 The 25 September 2007 eruption of Ruapehu produced lahars on the N and E flanks from Crater Lake, with the E flank lahar seen here. Two lahar descent paths are visible, the wider one closer to the center down the Whangaehu Glacier, and the narrower path further to the left down the Whangaehu valley. The lahar merged and continued for 200 km along the Whangaehu River.
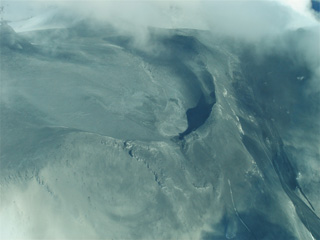 Surtseyan deposits from the 25 September 2007 Ruapehu eruption are seen here across Central Crater and the northern flank. In the lower part of the image is the ballistic apron, where blocks up to 2 m in diameter landed more than 2 km from their source. The northern flank lahar is to the lower right.
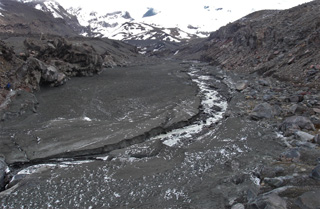 This snow-slurry lahar formed through brief explosions through the acidic Ruapehu Crater Lake, ejecting around 5,700 m3 of acidic water then entraining 60 times this volume in snow. This view looks up the Whangaehu valley towards the Crater Lake area two days after it was emplaced across the valley floor.
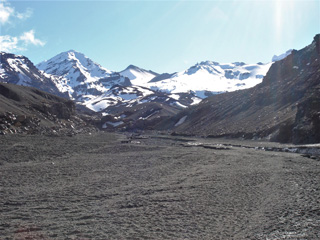 The 25 September 2007 Ruapehu ice-slurry lahar emplaced the deposit across this photo, seen here two days later in the Whangaehu valley on the E flank. The path of the lahar from Crater Lake down the Whangaehu glacier is above it.
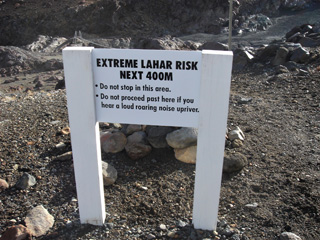 This “extreme lahar risk” sign is on the northern side of the Whangaehu valley on the E flank of Ruapehu with the September 2007 lahar in the background, the second lahar down this path that year. The bridge visible beyond the sign was damaged by the lahars.
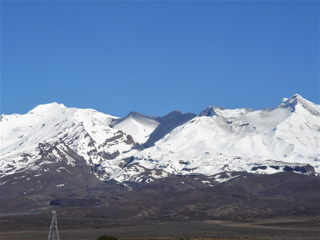 The 25 September 2007 Ruapehu lahar that travelled down the Whangaehu Valley is seen here from the E two days later. The black deposit in the center includes two lahar descent paths that merged, and ash and mud deposits from the explosion that occurred within Crater Lake.
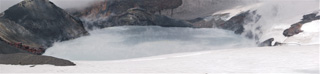 The Ruapehu Crater Lake is seen here on 4 March 2007 from the N, looking towards the tephra dam that failed on the 18th, resulting in 11% of the water draining through lahars down the Whangaehu valley on the E flank and down the N flank. The water temperatures fluctuate through time with geothermal activity below the lake.
There are no samples for Ruapehu in the Smithsonian's NMNH Department of Mineral Sciences Rock and Ore collection.
| Copernicus Browser | The Copernicus Browser replaced the Sentinel Hub Playground browser in 2023, to provide access to Earth observation archives from the Copernicus Data Space Ecosystem, the main distribution platform for data from the EU Copernicus missions. |
| MIROVA | Middle InfraRed Observation of Volcanic Activity (MIROVA) is a near real time volcanic hot-spot detection system based on the analysis of MODIS (Moderate Resolution Imaging Spectroradiometer) data. In particular, MIROVA uses the Middle InfraRed Radiation (MIR), measured over target volcanoes, in order to detect, locate and measure the heat radiation sourced from volcanic activity. |
| MODVOLC Thermal Alerts | Using infrared satellite Moderate Resolution Imaging Spectroradiometer (MODIS) data, scientists at the Hawai'i Institute of Geophysics and Planetology, University of Hawai'i, developed an automated system called MODVOLC to map thermal hot-spots in near real time. For each MODIS image, the algorithm automatically scans each 1 km pixel within it to check for high-temperature hot-spots. When one is found the date, time, location, and intensity are recorded. MODIS looks at every square km of the Earth every 48 hours, once during the day and once during the night, and the presence of two MODIS sensors in space allows at least four hot-spot observations every two days. Each day updated global maps are compiled to display the locations of all hot spots detected in the previous 24 hours. There is a drop-down list with volcano names which allow users to 'zoom-in' and examine the distribution of hot-spots at a variety of spatial scales. |
|
WOVOdat
Single Volcano View Temporal Evolution of Unrest Side by Side Volcanoes |
WOVOdat is a database of volcanic unrest; instrumentally and visually recorded changes in seismicity, ground deformation, gas emission, and other parameters from their normal baselines. It is sponsored by the World Organization of Volcano Observatories (WOVO) and presently hosted at the Earth Observatory of Singapore.
GVMID Data on Volcano Monitoring Infrastructure The Global Volcano Monitoring Infrastructure Database GVMID, is aimed at documenting and improving capabilities of volcano monitoring from the ground and space. GVMID should provide a snapshot and baseline view of the techniques and instrumentation that are in place at various volcanoes, which can be use by volcano observatories as reference to setup new monitoring system or improving networks at a specific volcano. These data will allow identification of what monitoring gaps exist, which can be then targeted by remote sensing infrastructure and future instrument deployments. |
| Volcanic Hazard Maps | The IAVCEI Commission on Volcanic Hazards and Risk has a Volcanic Hazard Maps database designed to serve as a resource for hazard mappers (or other interested parties) to explore how common issues in hazard map development have been addressed at different volcanoes, in different countries, for different hazards, and for different intended audiences. In addition to the comprehensive, searchable Volcanic Hazard Maps Database, this website contains information about diversity of volcanic hazard maps, illustrated using examples from the database. This site is for educational purposes related to volcanic hazard maps. Hazard maps found on this website should not be used for emergency purposes. For the most recent, official hazard map for a particular volcano, please seek out the proper institutional authorities on the matter. |
| IRIS seismic stations/networks | Incorporated Research Institutions for Seismology (IRIS) Data Services map showing the location of seismic stations from all available networks (permanent or temporary) within a radius of 0.18° (about 20 km at mid-latitudes) from the given location of Ruapehu. Users can customize a variety of filters and options in the left panel. Note that if there are no stations are known the map will default to show the entire world with a "No data matched request" error notice. |
| UNAVCO GPS/GNSS stations | Geodetic Data Services map from UNAVCO showing the location of GPS/GNSS stations from all available networks (permanent or temporary) within a radius of 20 km from the given location of Ruapehu. Users can customize the data search based on station or network names, location, and time window. Requires Adobe Flash Player. |
| DECADE Data | The DECADE portal, still in the developmental stage, serves as an example of the proposed interoperability between The Smithsonian Institution's Global Volcanism Program, the Mapping Gas Emissions (MaGa) Database, and the EarthChem Geochemical Portal. The Deep Earth Carbon Degassing (DECADE) initiative seeks to use new and established technologies to determine accurate global fluxes of volcanic CO2 to the atmosphere, but installing CO2 monitoring networks on 20 of the world's 150 most actively degassing volcanoes. The group uses related laboratory-based studies (direct gas sampling and analysis, melt inclusions) to provide new data for direct degassing of deep earth carbon to the atmosphere. |
| Large Eruptions of Ruapehu | Information about large Quaternary eruptions (VEI >= 4) is cataloged in the Large Magnitude Explosive Volcanic Eruptions (LaMEVE) database of the Volcano Global Risk Identification and Analysis Project (VOGRIPA). |
| EarthChem | EarthChem develops and maintains databases, software, and services that support the preservation, discovery, access and analysis of geochemical data, and facilitate their integration with the broad array of other available earth science parameters. EarthChem is operated by a joint team of disciplinary scientists, data scientists, data managers and information technology developers who are part of the NSF-funded data facility Integrated Earth Data Applications (IEDA). IEDA is a collaborative effort of EarthChem and the Marine Geoscience Data System (MGDS). |

