
Based on satellite and wind model data, the Darwin VAAC reported that at 2040 on 6 May a discrete ash plume from Kadovar rose to an altitude of 4.6 km (15,000 ft) a.s.l. and drifted W. The plume had dissipated by 2300.
Source: Darwin Volcanic Ash Advisory Centre (VAAC)
An ash plume and weak thermal anomaly during May 2023
Kadovar is a 2-km-wide island that is the emergent summit of a Bismarck Sea stratovolcano. It lies off the coast of New Guinea, about 25 km N of the mouth of the Sepik River. Prior to an eruption that began in 2018, a lava dome formed the high point of the volcano, filling an arcuate landslide scarp open to the S. Submarine debris-avalanche deposits occur to the S of the island. The current eruption began in January 2018 and has comprised lava effusion from vents at the summit and at the E coast; more recent activity has consisted of ash plumes, weak thermal activity, and gas-and-steam plumes (BGVN 48:02). This report covers activity during February through May 2023 using information from the Darwin Volcanic Ash Advisory Center (VAAC) and satellite data.
Activity during the reporting period was relatively low and mainly consisted of white gas-and-steam plumes that were visible in natural color satellite images on clear weather days (figure 67). According to a Darwin VAAC report, at 2040 on 6 May an ash plume rose to 4.6 km altitude and drifted W; by 2300 the plume had dissipated. MODIS satellite instruments using the MODVOLC thermal algorithm detected a single thermal hotspot on the SE side of the island on 7 May. Weak thermal activity was also detected in a satellite image on the E side of the island on 14 May, accompanied by a white gas-and-steam plume that drifted SE (figure 68).
 |
Figure 67. True color satellite images showing a white gas-and-steam plume rising from Kadovar on 28 February 2023 (left) and 30 March 2023 (right) and drifting SE and S, respectively. Courtesy of Copernicus Browser. |
 |
Figure 68. Infrared (bands B12, B11, B4) image showing weak thermal activity on the E side of the island, accompanied by a gas-and-steam plume that drifted SE from Kadovar on 14 May 2023. Courtesy of Copernicus Browser. |
Information Contacts: Darwin Volcanic Ash Advisory Centre (VAAC), Bureau of Meteorology, Northern Territory Regional Office, PO Box 40050, Casuarina, NT 0811, Australia (URL: http://www.bom.gov.au/info/vaac/); Hawai'i Institute of Geophysics and Planetology (HIGP) - MODVOLC Thermal Alerts System, School of Ocean and Earth Science and Technology (SOEST), Univ. of Hawai'i, 2525 Correa Road, Honolulu, HI 96822, USA (URL: http://modis.higp.hawaii.edu/); Copernicus Browser, Copernicus Data Space Ecosystem, European Space Agency (URL: https://dataspace.copernicus.eu/browser/).
2023: May
2022: April
| August
| September
2021: January
| March
| April
| June
| July
| August
| October
| November
2020: January
| February
| March
| July
| August
| September
| October
| November
| December
2019: February
| April
| August
2018: January
| February
| March
| June
| September
| October
| November
Based on satellite and wind model data, the Darwin VAAC reported that at 2040 on 6 May a discrete ash plume from Kadovar rose to an altitude of 4.6 km (15,000 ft) a.s.l. and drifted W. The plume had dissipated by 2300.
Source: Darwin Volcanic Ash Advisory Centre (VAAC)
Based on satellite and wind model data, the Darwin VAAC reported that on 18 September multiple, discrete, ash plumes from Kadovar rose to an altitude of 1.5 km (5,000 ft) a.s.l. and drifted NW and WNW.
Source: Darwin Volcanic Ash Advisory Centre (VAAC)
Based on satellite and wind model data, the Darwin VAAC reported that on 31 August an ash plume from Kadovar rose to an altitude of 1.2 km (4,000 ft) a.s.l. and drifted NW.
Source: Darwin Volcanic Ash Advisory Centre (VAAC)
Based on satellite and wind model data, the Darwin VAAC reported that on 14 August an ash plume from Kadovar rose to an altitude of 2.1 km (7,000 ft) a.s.l. and drifted NW.
Source: Darwin Volcanic Ash Advisory Centre (VAAC)
Based on satellite and wind model data, the Darwin VAAC reported that on 8 April an ash plume from Kadovar rose to an altitude of 1.5 km (5,000 ft) a.s.l. and drifted SE.
Source: Darwin Volcanic Ash Advisory Centre (VAAC)
Based on satellite and wind model data, the Darwin VAAC reported that on 9 November an ash plume from Kadovar rose to an altitude of 1.5 km (5,000 ft) a.s.l.
Source: Darwin Volcanic Ash Advisory Centre (VAAC)
Based on satellite and wind model data, the Darwin VAAC reported that on 3 and 5 November ash plumes from Kadovar rose to an altitude of 1.5 km (5,000 ft) a.s.l. and drifted W.
Source: Darwin Volcanic Ash Advisory Centre (VAAC)
Based on satellite and wind model data, the Darwin VAAC reported that during 8-9 October ash plumes from Kadovar rose to an altitude of 1.5 km (5,000 ft) a.s.l. and drifted W and NW.
Source: Darwin Volcanic Ash Advisory Centre (VAAC)
Based on satellite and wind model data, the Darwin VAAC reported that on 27 and 30 August ash plumes from Kadovar rose to altitudes of 1.2-1.5 km (4,000-5,000 ft) a.s.l. and drifted W and WNW.
Source: Darwin Volcanic Ash Advisory Centre (VAAC)
Based on satellite and wind model data, the Darwin VAAC reported that on 19 August an ash plume from Kadovar rose to an altitude of 1.2 km (4,000 ft) a.s.l. and drifted NW.
Source: Darwin Volcanic Ash Advisory Centre (VAAC)
Based on satellite and wind model data, the Darwin VAAC reported that on 1 August an ash plume from Kadovar rose to an altitude of 1.5 km (5,000 ft) a.s.l. and drifted W.
Source: Darwin Volcanic Ash Advisory Centre (VAAC)
Based on satellite and wind model data, the Darwin VAAC reported that on 4 July an ash plume from Kadovar rose to an altitude of 1.5 km (5,000 ft) a.s.l. and drifted W.
Source: Darwin Volcanic Ash Advisory Centre (VAAC)
Based on satellite and wind model data, the Darwin VAAC reported that on 19 June ash plumes from Kadovar rose to an altitude of 1.5 km (5,000 ft) a.s.l. and drifted W.
Source: Darwin Volcanic Ash Advisory Centre (VAAC)
Based on satellite and wind model data, the Darwin VAAC reported that on 12 June ash plumes from Kadovar rose to an altitude of 1.2 km (4,000 ft) a.s.l. and drifted W.
Source: Darwin Volcanic Ash Advisory Centre (VAAC)
Based on satellite and wind model data, the Darwin VAAC reported that on 15 April ash plumes from Kadovar rose to an altitude of 1.8 km (6,000 ft) a.s.l. and drifted W.
Source: Darwin Volcanic Ash Advisory Centre (VAAC)
Based on satellite and wind model data, the Darwin VAAC reported that on 11 March ash plumes from Kadovar rose to an altitude of 1.5 km (5,000 ft) a.s.l. and drifted W.
Source: Darwin Volcanic Ash Advisory Centre (VAAC)
Based on satellite and wind model data, the Darwin VAAC reported that during 5-7 January ash plumes from Kadovar rose to altitudes of 1.5-1.8 km (5,000-6,000 ft) a.s.l. and drifted NW and W.
Source: Darwin Volcanic Ash Advisory Centre (VAAC)
Based on satellite and wind model data, the Darwin VAAC reported that on 3 January two ash puffs from Kadovar rose to an altitude of 1.5 km (5,000 ft) a.s.l. and drifted SW.
Source: Darwin Volcanic Ash Advisory Centre (VAAC)
Based on satellite and wind model data, the Darwin VAAC reported that on 18 November ash plumes from Kadovar rose to an altitude of 0.9 km (3,000 ft) a.s.l. and drifted W and NW.
Source: Darwin Volcanic Ash Advisory Centre (VAAC)
Based on satellite data, the Darwin VAAC reported that on 18 October a discrete ash puff from Kadovar rose to an altitude of 1.5 km (5,000 ft) a.s.l. and drifted W.
Source: Darwin Volcanic Ash Advisory Centre (VAAC)
Based on satellite data, the Darwin VAAC reported that during 7-8 October discrete ash puffs from Kadovar rose to an altitude of 1.8 km (6,000 ft) a.s.l. and drifted NW and N.
Source: Darwin Volcanic Ash Advisory Centre (VAAC)
Based on satellite data, the Darwin VAAC reported that on 4 October discrete ash puffs from Kadovar rose to an altitude of 2.1 km (7,000 ft) a.s.l. and drifted NW.
Source: Darwin Volcanic Ash Advisory Centre (VAAC)
Based on satellite data, the Darwin VAAC reported that during 21-22 September ash plumes from Kadovar rose to an altitude of 1.5 km (5,000 ft) a.s.l. and drifted NW.
Source: Darwin Volcanic Ash Advisory Centre (VAAC)
Based on satellite data, the Darwin VAAC reported that on 12 September an ash plume from Kadovar rose to an altitude of 1.8 km (6,000 ft) a.s.l. and drifted W.
Source: Darwin Volcanic Ash Advisory Centre (VAAC)
Based on satellite data, the Darwin VAAC reported that on 26 August an ash plume from Kadovar rose to an altitude of 2.1 km (7,000 ft) a.s.l., drifted WNW, and quickly dissipated.
Source: Darwin Volcanic Ash Advisory Centre (VAAC)
Based on satellite and wind model data, the Darwin VAAC reported that on 16 August an ash plume from Kadovar rose to an altitude of 1.5 km (5,000 ft) a.s.l. and drifted NW.
Source: Darwin Volcanic Ash Advisory Centre (VAAC)
Based on satellite and wind model data, the Darwin VAAC reported that on 30 July an ash plume from Kadovar rose to an altitude of 1.5 km (5,000 ft) a.s.l. and drifted NW. An ash plume rose to 1.2 km (4,000 ft) a.s.l. and drifted NW on 3 August.
Source: Darwin Volcanic Ash Advisory Centre (VAAC)
RVO reported minor eruptive activity at Kadovar during 1-15 July consisting of occasional light gray ash plumes of variable densities rising a few hundred meters above the summit crater. Fluctuating summit incandescence was visible at night. Activity intensified on 5 July as emissions became dark gray and dense. Explosions at 1652 and 1815 generated dense dark gray ash plumes that rose 1 km and drifted W. Loud rumbling accompanied the explosion. Activity subsided later that day but was again more intense during 8-10 July. Explosions recorded at 2045 on 8 July, 1145 and 1400 on 9 July, and at 0950 and 1125 on 10 July produced ash plumes that rose 1 km above the summit.
Source: Rabaul Volcano Observatory (RVO)
Based on satellite and wind model data, the Darwin VAAC reported that on 10 July an ash plume from Kadovar rose to an altitude of 1.8 km (6,000 ft) a.s.l. and drifted NW.
Source: Darwin Volcanic Ash Advisory Centre (VAAC)
Based on satellite and wind model data, the Darwin VAAC reported that during 13-15 March ash plumes from Kadovar rose to an altitude of 1.5 km (5,000 ft) a.s.l. and drifted SE.
Source: Darwin Volcanic Ash Advisory Centre (VAAC)
Based on satellite data and wind model data, the Darwin VAAC reported that on 23 February an ash plume from Kadovar rose to an altitude of 1.5 km (5,000 ft) a.s.l. and drifted E and SE.
Source: Darwin Volcanic Ash Advisory Centre (VAAC)
RVO reported that the eruption at Kadovar continued during 1 January-7 February with frequent (hours to days) Vulcanian explosions from Main Vent at the summit. The explosions ejected rocks and ash plumes that rose 300-400 m above the vent and drifted NE and E. Residents on Blup Blup (15 km N) reported rumbling and nighttime summit incandescence. Volcanic plumes were sometimes observable in Wewak (105 km W). The Darwin VAAC stated that on 6 February an ash plume rose to 2.1 km (7,000 ft) a.s.l. and drifted SE.
Sources: Rabaul Volcano Observatory (RVO); Darwin Volcanic Ash Advisory Centre (VAAC)
Based on satellite data, the Darwin VAAC reported that on 2 February an ash plume from Kadovar rose to an altitude of 1.5 km (5,000 ft) a.s.l. and drifted ESE.
Source: Darwin Volcanic Ash Advisory Centre (VAAC)
Based on satellite data and wind model data, the Darwin VAAC reported that on 19 August an ash plume from Kadovar rose to an altitude of 1.5 km (5,000 ft) a.s.l. and drifted NW.
Source: Darwin Volcanic Ash Advisory Centre (VAAC)
Based on satellite data and wind model data, the Darwin VAAC reported that on 10 April an ash plume from Kadovar rose to an altitude of 1.2 km (4,000 ft) a.s.l. and drifted SE and E.
Source: Darwin Volcanic Ash Advisory Centre (VAAC)
Based on satellite data and wind model data, the Darwin VAAC reported that on 9 April an ash plume from Kadovar rose to an altitude of 1.5 km (5,000 ft) a.s.l. and drifted SE.
Source: Darwin Volcanic Ash Advisory Centre (VAAC)
Based on satellite data and wind model data, the Darwin VAAC reported that on 21 February an ash plume from Kadovar rose to an altitude of 1.8 km (6,000 ft) a.s.l. and drifted ESE.
Source: Darwin Volcanic Ash Advisory Centre (VAAC)
Based on satellite data and wind model data, the Darwin VAAC reported that on 16 February ash plumes from Kadovar rose to an altitude of 1.8 km (6,000 ft) a.s.l. and drifted ESE.
Source: Darwin Volcanic Ash Advisory Centre (VAAC)
According to Brad Scott of GeoNet, the Royal New Zealand Air Force released photos of a plume rising from Kadovar at 1640 on 10 February.
Source: Royal New Zealand Air Force via Brad Scott, GeoNet
Based on satellite data and wind model data, the Darwin VAAC reported that during 27-28 November ash plumes from Kadovar rose to an altitude of 0.9 km (3,000 ft) a.s.l. and drifted SE and E. On 2 December ash plumes rose to 1.2 km (4,000 ft) a.s.l. and drifted WSW and W.
Source: Darwin Volcanic Ash Advisory Centre (VAAC)
The Darwin VAAC reported that discrete, low-level events at Kadovar regularly occurred on 14 November based on satellite data. Ash plumes rose to an altitude of 2.4 km (8,000 ft) a.s.l. and drifted E.
Source: Darwin Volcanic Ash Advisory Centre (VAAC)
According to the Darwin VAAC an ash plume from Kadovar was identified in satellite data on 9 November drifting WNW at an altitude of 1.8 km (6,000 ft) a.s.l.
Source: Darwin Volcanic Ash Advisory Centre (VAAC)
The Darwin VAAC reported that during 29-30 October intermittent ash plumes from Kadovar rose to altitudes of 1.8-2.1 km (6,000-7,000 ft) a.s.l. and drifted SW, S, and SE.
Source: Darwin Volcanic Ash Advisory Centre (VAAC)
According to the Darwin VAAC, ash plumes from Kadovar were visible in satellite images on 21 October drifting NE at an altitude of 2.4 km (8,000 ft) a.s.l.
Source: Darwin Volcanic Ash Advisory Centre (VAAC)
Based on satellite data and wind model data, the Darwin VAAC reported that during 10-12 October ash plumes from Kadovar rose to an altitude of 2.4 km (8,000 ft) a.s.l. and drifted NW and W.
Source: Darwin Volcanic Ash Advisory Centre (VAAC)
RVO reported quiet conditions at Kadovar during 1-20 September with only diffuse white plumes rising from the volcano. Activity increased on 21 September and remained elevated at least through 26 September, the date the last visual observation was received by RVO. During the period if increased activity dense dark gray and brown ash plumes rose several hundred meters above the summit crater (700-800 m) and drifted NW. Intense incandescence from Main Crater, the SE coastal vent, and other areas was visible. Minor amounts of ash fell on Blup Blup island. On 1 October an ash plume rose to 900 m (3,000 ft) a.s.l. and drifted W. An ash plume was visible in satellite images on 3 October drifting W at an altitude of 2.1 km (6,900 ft) a.s.l.
Sources: Rabaul Volcano Observatory (RVO); Darwin Volcanic Ash Advisory Centre (VAAC)
An ash plume from Kadovar was visible in satellite images on 28 September drifting SE at an altitude of 2.1 km (7,000 ft) a.s.l. On 1 October an ash plume rose to 2.7 km (9,000 ft) a.s.l. and drifted W.
Source: Darwin Volcanic Ash Advisory Centre (VAAC)
According to the Darwin VAAC an ash plume from Kadovar identified by a pilot and in satellite images rose to an altitude of 1.8 km (6,000 ft) a.s.l. on 20 June and drifted W.
Source: Darwin Volcanic Ash Advisory Centre (VAAC)
According to the Darwin VAAC a pilot observed an ash plume from Kadovar rising to an altitude of 1.2 km (4,000 ft) a.s.l. on 10 June. The ash plume was not identified in satellite data.
Source: Darwin Volcanic Ash Advisory Centre (VAAC)
RVO reported that the lava dome at Kadovar’s SE Coastal Vent continued to grow, though slowly, with only a 1-m change detected during 10-20 March. Weak incandescence from the Main Crater was visible on 13 March. Bright incandescence from both the Main Crater and the SE Coastal vent was visible on 14 March, coincident with the start of dark gray ash emissions from both vents, lasting until 19 March.
Source: Rabaul Volcano Observatory (RVO)
RVO reported that emissions from Kadovar’s Main Crater were white from 1 March, until an explosion on 1800 on 5 March was followed by gray emissions through 8 March. The gray plumes rose less than 360 m above the vent and drifted SE. Noises were described as roaring and rumbling during 1-2 and 6-8 March, and booming on 5 March. The lava dome at the SE Coastal Vent continued to grow and rose to 7-8 m above sea level on 1 March, 10-11 m on 2 March, and 10-17 m on 8 March. Dark gray ash plumes rose from the dome. Nighttime incandescence was noted from both Main Crater and the SE vent.
Source: Rabaul Volcano Observatory (RVO)
According to the Darwin VAAC a pilot observed an ash plume from Kadovar on 2 March drifting SE at an altitude of 4 km (13,000 ft) a.s.l.
Source: Darwin Volcanic Ash Advisory Centre (VAAC)
RVO reported that lava continued to flow from the SE Coastal Vent resulting in the connection of a reemerged lava island to the coast of Kadovar within a few days of the 1 February collapse. During 14-22 February continuous plumes of white vapor rose from both Main Crater and SE Coastal Vent, punctuated by dense ash emissions from both areas during 16 and 20-22 February and occasional booming noises. Ash plumes rose 370 m above the island and drifted SE, though on 22 February the winds blew the plumes N and NW. Incandescence from both areas was visible on 22 February. A sulfur odor was noticed by residents on Blup Blup (15 km N) on 16 and 22 February.
Source: Rabaul Volcano Observatory (RVO)
RVO reported that on 9 February the lava dome at Kadovar’s SE Coastal Vent collapsed, causing 5-6 minor tsunamis, less than 1 m high, observed by residents on Blup Blup’s E and W coasts. The waves were reported at 1050, before the main collapse of the dome. In a 12 February report RVO noted that activity from Main Crater consisted of white plumes rising 20 m and drifting a few kilometers SE and weak nighttime crater incandescence.
Source: Rabaul Volcano Observatory (RVO)
RVO reported that the eruption at Kadovar continued during 31 January-1 February at a low level. Sulfur dioxide emissions and seismicity had both decreased. Dense white vapor plumes rose 100 m from Main Crater and drifted SE. Continuous but dull glow emanated from the crater. The lava dome at the SE Coastal Vent continued to grow. A new lobe 20-30 m long grew out from the seaward side of the dome boundary, channeled by levees which had developed on the sides of the dome. White steam plumes rose 100 m above the island and drifted SE. At 1830 on 1 February a collapse of the N part of the dome produced a gray plume, vigorous steaming at the collapse site, and nighttime incandescence. The main part of the dome had bulged up, and a valley developed in between the dome and the island’s flank.
Source: Rabaul Volcano Observatory (RVO)
RVO reported that the eruption at Kadovar continued during 23-24 January at levels similar to the previous few days. Main Crater produced light-gray to brown ash plumes that rose at most 100 m and drifted a few tens of kilometers W. Weak incandescence from Main Crater was visible at night. The lava dome at the SE Coastal Vent continued to grow and was an estimated 50 m a.s.l. (the water depth in that area was unknown) and extends out from the coast 150-200 m. The dome glowed red at night. Seismicity was low to moderate, with one high-frequency event, and 12 significant numerous small low-frequency events. Strong sulfur dioxide emissions were detected.
Source: Rabaul Volcano Observatory (RVO)
RVO reported that the eruption at Kadovar continued during 18-19 and 21-22 January. Main Crater produced ash plumes that rose as high as 800 m above the summit and drifted tens of kilometers E, SE, S, and SW. Vulcanian activity was continuous, though no discrete explosions were detected. Steam plumes from the SE Coastal Vent rose 800 m above the island, and a lava dome which strongly and continuously glowed at night slowly extruded from the vent. Strong sulfur dioxide emissions were detected.
Source: Rabaul Volcano Observatory (RVO)
According to Brandon Buser, just after eruption plumes started rising from a vent on the SE side of Kadovar on 5 January boats from a village on the mainland (22 km SW) and from Bam (25 km E) were sent to the island to evacuate residents. The entire population of the island (about 500 people according to a news article citing the Red Cross) was evacuated by the boats and numerous canoes to Blup Blup (15 km N). Activity escalated around midnight. The next day, at a distance of 65 km, Buser and others saw ash emissions rising from Kadovar, and at about 24 km away from the island they experienced ashfall. As they were circling the island a large event sent a large plume hundreds of feet into the air and ejected large boulders into the ocean. During another visit on 8 January Buser noted two new eruptive vents, ashfall covering everything on the village side, and wet falling ash.
RVO reported that activity significantly escalated on 12 January characterized by a large blast of a substantial amount of material and “big” glowing red rocks directed to the S; the report noted that the blast was the only one reported to date. Observers on Blup Blup saw incandescence emanating from either the summit or an area out of view on the S flank. Large amounts of sulfur dioxide had been detected since 8 January, and continued to be emitted. A fracture had previously been reported on 6 January extending from the summit to the coast. When seen on 12 January, the fracture was wider and vigorous steaming was occurring at sea level. Ash plumes drifted tens of kilometers W and NW. RVO noted that the displaced villagers were getting transferred to the mainland, along with islanders from Bam, due to the relatively close proximity to the eruption plus the logistics of supplying them.
Five newly-named vents were observed during an overflight conducted on 13 January: Main Crater, Western vent, and Southern vent (all three are at the summit), the SE Coastal vent, and the Southern Coastal vent. Sometimes voluminous steam and dense gray plumes rose 1 km above the Main Crater. The emissions obscured views of Southern and Western vents. The SE Coastal Vent was very active, emitting dense white steam plumes 600 m a.s.l. A possible lava dome was at the base of the plumes but showed no evidence of incandescence. The Southern Coastal Vent, located where the original fractures entered the sea, was inactive.
Sources: Rabaul Volcano Observatory (RVO); BBC News; Brandon Buser
The first confirmed historical eruption at Kadovar began around mid-day local time on 5 January, according to witnesses. The island is approximately 1.4 km in diameter with very steep slopes, located about 25 km NNE from the mouth of the Sepik River on the New Guinea mainland. The Rabaul Volcanological Observatory (RVO) warned of potential explosive activity, landslides, and resulting possible tsunamis.
Aerial photos and observations from Samaritan Air flights showed dark gray ash and steam plumes rising from a crater on the SE side of the summit. It was estimated that up to 60% of the island was covered in volcanic products, which primarily appeared to be ash along with some pyroclastic flows. Ashfall was reported on Kairiru and Mushu islands (115 km WNW), Mt. Uru in Yangoru (130 km W), and Woginara (140 km W), along with locations along the W coast of the Wewak District.
The NOAA/CIMSS Volcanic Cloud Monitoring system generated an alert for the ash cloud moving WNW, as imaged by S-NPP VIIRS at 0330 UTC on 5 January; Himawari-8 imagery subsequently showed that the eruption began around 0220 UTC. The Darwin VAAC issued a sequence of ash advisories starting on 5 January that noted ash moving W at an altitude of about 2.1 km (7,000 ft) a.s.l., and set the Aviation Color Code to Orange. Both discrete eruptions and continuous ongoing activity was seen in satellite imagery through 9 January, with the plume visible at distances of over 200 km W and WNW.
Although initial news reports regarding the population and evacuation status were unclear, the East Sepik Governor, Allan Bird, told media on 8 January that 591 residents of Kadovar had been evacuated to Blup Blup island (about 10 km N) due to the organizational efforts of village councilors on the two islands.
RVO stated that during 7-8 January ash continued to be emitted, and blown tens of kilometers WNW.
Sources: Rabaul Volcano Observatory (RVO); Loop; Darwin Volcanic Ash Advisory Centre (VAAC); NOAA Cooperative Institute for Meteorological Satellite Studies
Reports are organized chronologically and indexed below by Month/Year (Publication Volume:Number), and include a one-line summary. Click on the index link or scroll down to read the reports.
Expansion of fumarolic area during September-November
Kadovar is a 365-m-high, 1.4 km-diameter volcanic island. A 1700 report of smoke seen briefly there was believed at the time to be a volcanic eruption. Since then no eruptions are known, and no traces of thermal activity remained in early 1976, although there was supposedly some such activity several generations ago. The island has the form of a steep-sided cone 250 m high, with a 600-m-wide crater breached to the SSE. The breach probably extended at least to sea level, but the crater and breach are now occupied by a high-standing, conical lava dome. The island is completely vegetated, and supported a village of more than 300 people built around the crater rim. Most of the village gardens are on the side of the dome.
In early August 1976, the first reports were received of activity there, the precise nature of which has not been clearly established. A summary of events to mid-November, and of investigations so far carried out, follows.
May-June 1976. The precise nature of the early events is not clear. Some sort of disturbance seems to have taken place in the sea just off (50 m?) the S coast, which may have been a small hydrothermal eruption or, more likely, a vigorous ebullition of gas bubbles. Weak earth tremors were felt, apparently during the preceding few days, and an explosive sound was heard. Scum was noticed on the water, persisting for a few days, and reddish coloration appeared on the rocks in the tidal zone at one point on the S coast.
August 1976. An investigation [on 3 August] was made by Rabaul Volcano Observatory (RVO) volcanologists D. Wallace and R. Almond. The only effect of the earlier activity was a 100 m-long reddish zone of iron hydroxide discoloration at sea level, and associated sea discoloration. No thermal activity or other unusual phenomena were observed, and no definite volcano-seismic activity was recorded during 5 hours operation of a portable seismograph.
September 1976. Hot ground was first noticed midway up the side of the lava dome about 16 September. An investigation [on 26 September] was made by volcanologist R. Cooke. The coastal discoloration was more extensive than in August, and ground temperatures up to 49°C were present in this zone. The reported hot ground on the mid-slope of the dome was about 30 m x 15 m in area, and was producing vigorous emissions of SO2 and HCl gases (indicated by Dräger tubes) from one main vent and numerous minor vents, at temperatures up to 99.7°C. The white gas column was visible above the treetops from the boat, but only minor vegetation damage had occurred. A newly formed small, weak patch of hot ground was found 100-200 m upslope of the main fumarole area. No volcano-seismic activity was recorded during 5.5 hours with a portable seismograph.
October 1976. Government officers R. Allen and D. Mahar from Wewak inspected the fumarole area [on 14 October], which had intensified in activity and was about 150 x 50 m in area. The expansion had proceeded principally upslope. [On 23 October] D. Mahar again inspected the fumarole area, which had further enlarged. All vegetation in the area had been killed.
November 1976. An investigation [during 10-12 November] was made by volcanologist V. Dent, physicist D. Norris (University of Papua New Guinea, Port Moresby), and D. Mahar. The main fumarole area had enlarged again and was estimated at about 150 x 70 m, and the area of dead vegetation was more prominent. A second main fumarole vent had developed 20 m downslope of the original main vent of September, but the principal expansion since then had been upslope, and to the E. The maximum temperature measured was again about 99°C. Collections of fumarole gas were made in evacuated glass tubes containing silica gel, and gas condensates were also collected. The maximum ground temperature in the S coast discolored zone was 49.5°C, similar to September. About 50 hours recording by a portable seismograph produced 5-10 very small and close A-type events. A seismic event counter was installed on the island. D. Norris carried out a total magnetic field survey of the island using a proton magnotometer.
It is intended to continue regular inspection visits to the volcano, but a full-time observation post is not planned at this time. Such a post will be established, probably on Blupblup Island, 13 km north of Kadovar, when an eruption is believed to be imminent, or once an eruption has commenced. All residents of Kadovar have been evacuated to Blupblup Island.
Information Contacts: R. Cooke, RVO.
Thermal activity stabilizes
"Since the previous report, five more ground inspections have been made, and a sixth is planned for the last week in April. Complete investigations, including temperature measurement, collection of gases and gas condensates, measurement of magnetic field, and seismic recording, were made during visits on 15-16 December (Cooke, Norris), and 16-18 February (Dent, Norris), and are planned for the forthcoming visit (Cooke, Norris). Partial investigations were made on 3 April (Wallace), when temperatures and gases were investigated, and on 26 January (Mahar) and 14 February (volcanological assistant J. Kuduon), when temperatures were measured. Vertical aerial photographs were taken by a survey firm on 15 November, and aerial obliques were taken during the December inspection. Another aerial inspection was carried out on 7 January, the day after a shallow M 6.5 earthquake about 30 km WSW of Kadovar on 6 January, 0611 GMT (preliminary location by USGS). This earthquake had no apparent affect on the volcano at the time.
"During the period covered by this report, the level of activity seemed to have stabilized. Maximum temperatures have been steady at 99-100°C, marked expansion of the main thermal area has ceased (although weak isolated gas vents are still occasionally found in new areas), and the quantity of gas emitted may even have declined slightly. The thermal area was not as unpleasant to the investigators as it was last November-December, although as some gas samples have not yet been analyzed quantitative information on the changing gas content is not available.
"No significant magnetic field changes have been detected. A few volcano-seismic events were recorded in both November and December, but such events appeared to be absent in February. Felt earthquakes were noted by inhabitants of nearby islands on several occasions, but there is no strong reason to associate these with Kadovar volcano. Unusually high seismic event counts on Kadovar are suspect because of a malfunctioning event counter.
"Although the initiation and early rapid development of this thermal activity led to the belief in a forthcoming Kadovar eruption, the stabilization (or even slight decline) in activity suggests the possibility that the event may be confined to thermal activity. Such purely thermal events have been reported elsewhere. However, the event will continue to be treated as a possible precursor to an eruption, and the former inhabitants will be advised to maintain the evacuation for the present. Only a small number of men are presently living on Kadovar in order to maintain the original gardens, to supply the evacuees on Blupblup Island. It is interesting to speculate that the 6 January earthquake may have been connected with the levelling-off of activity."
Information Contacts: R. Cooke, RVO.
No significant changes in the thermal area
"Three detailed investigations have been made since the March report: 25-28 April (Cooke, Norris) 72 hours of seismic recording, gas condensates collected, temperatures measured, and magnetic field re-surveyed; 7-8 June (Dent) 30 hours seismic recording, temperatures measured, and gas and gas condensates collected; and 7-8 July (Wallace, Norris, Emeleus) 30 hours seismic recording, temperatures measured, gas and gas condensates collected, and magnetic field re-surveyed.
"The main thermal area has been little changed during this period. The original fumarole of last September shows the same degree of activity as it did then. Volcano-seismic activity was virtually nil. Maximum temperatures were still 99-100°C but there may have been slight changes in the magnetic field pattern. The only features presently indicating continued development are weak thermal areas that are still being established in new areas on other parts of the island. Some of the population have returned, contrary to a previous report, but they have established a new settlement in a comparatively safe area, having abandoned their old village site."
Information Contacts: D. Wallace, RVO.
Few changes in the main thermal area; no volcano-seismic activity
"Volcanologists have made three detailed investigations at Kadovar since the report in July. On each occasion, temperatures were measured, gases and gas condensates were collected, and seismic recording was carried out; a magnetic resurvey was made during the most recent inspection. Dates and personnel were: 18-19 August, V.F. Dent; 30 September, C.O. McKee; 13-14 November, C.O. McKee and D. Norris. On 14 September, photographs were taken during an aerial inspection.
"The main thermal area was much the same size as before, apart from some expansion at the SW corner, and spanned about 250 m upslope, and about 130 m maximum around the slope. It is now much more sharply defined and clear because of progressive fall of dead vegetation. Overall vapor emission seemed much less than in earlier periods, and was more concentrated in a few main areas, with fewer of the weak but widespread vents evident in early 1977. The original main fumarole may be a little reduced in intensity, although its temperature has not declined, remaining near 100°C. No measured temperatures exceeded 100°C, although the upper part of the main zone has become hotter, approaching 100°C. Vapor emission was still most profuse in the upper part.
"No volcano-seismic activity has been recorded during the report period, and although significant relative changes in total magnetic field have taken place, no simple pattern is apparent."
Information Contacts: R. Cooke, RVO.
Thermal activity declines slightly
Thermal activity was continuing in late March. An aerial inspection 21 March and a ground inspection the next day revealed that although principal fumaroles remained at the same level of activity as before, a slight decrease of activity in the main (S flank) thermal zone is indicated by minor revegetation. The odor of acid gases was no longer present at several groups of fumaroles and temperatures have dropped slightly (from 100 to 97-97.5°C). However, another area of thermal activity (high on the E side of the lava dome) had produced a significant vegetation kill in the past few months.
Information Contacts: R. Cooke, RVO.
Slow decline in thermal activity continues
Kadovar's thermal activity was continuing as of 20 September, but had shown a further slight decline since March.
Information Contacts: R. Cooke, RVO.
Discolored water
"An area of orange discolouration of the sea at the NE shore was observed during aerial inspections on 6 and 19 March. Previously (1976-77) sea discolouration was present at the S shore and was related to the development of a new thermal area on the S flank of the island. This thermal area was now observed to have been reduced in size by regrowth of vegetation."
Information Contacts: Acting Senior Volcanologist, RVO.
First confirmed historical eruption, ash plumes, and lava flow, January-March 2018
The first confirmed historical eruption at Kadovar began around mid-day local time on 5 January 2018, according to witnesses. The steeply-sloped island is approximately 1.4 km in diameter and is located about 25 km NNE from the mouth of the Sepik River on the mainland of Papua New Guinea (figure 1). This report covers activity from the beginning of the eruption on 5 January through March 2018. Information about the eruption is provided by the Rabaul Volcano Observatory (RVO), the Darwin Volcanic Ash Advisory Center (VAAC), satellite sources, news reports, and local observers. A possible eruption was witnessed by explorers in 1700; no other activity was reported until an outbreak of thermal activity in 1976 (NSEB 01:14-01:11, SEAN 03:09) and a short period of seismic unrest in 2015, according to RVO.
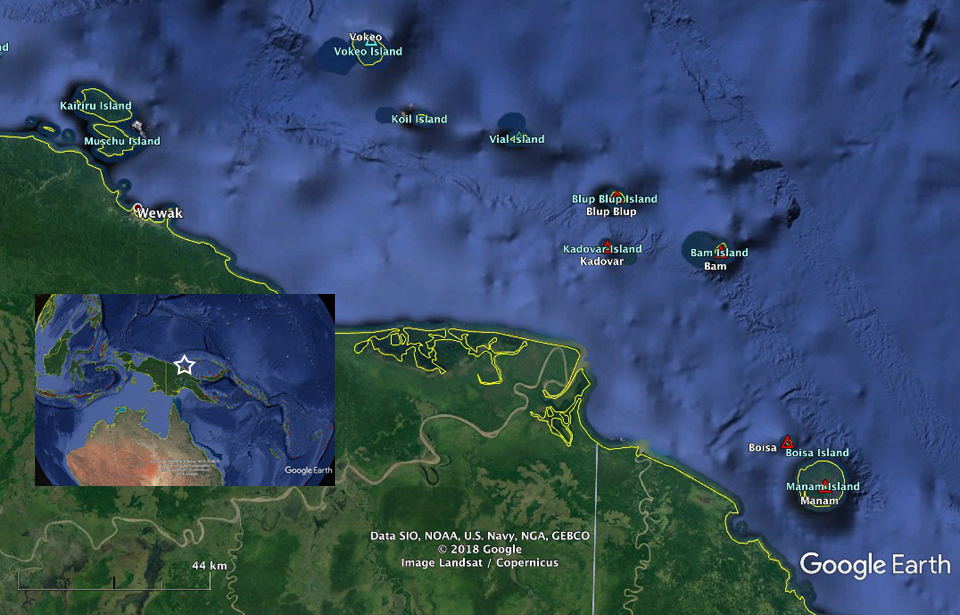 |
Figure 1. Kadovar Island is located about 25 km NNE from the mouth of the Sepik River on the mainland of Papua New Guinea. Nearby active volcanoes include Blup Blup (12 km N) and Bam (21 km W); residents of Kadovar were evacuated initially to Blup Blup before being moved to an area near Wewak, the nearest community on the mainland, about 105 km W. The red triangles are Holocene volcanoes, and the blue (cyan) triangles are Pleistocene volcanoes. Base map courtesy of Google Earth. |
Ash and steam emissions from Kadovar were first reported on 5 January 2018. After about 24 hours, more than half of the island was covered by volcanic debris. Activity intensified over the next two weeks; RVO identified five distinct vents located at the summit and along the SE coast. Dense ash plumes and steam rose from the summit vents, and a slowly-extruding lava flow emerged from a vent near the shoreline on the SE flank. Persistent steam and intermittent ash plumes were produced from the summit vent through the end of March. The lava flow grew outward from the shore for tens of meters before collapsing in early February, but it reappeared a few days later. By the end of the first week of March 2018 the flow was about 17 m above sea level; its growth rate had slowed, adding only one meter by late March.
The NOAA/CIMSS Volcanic Cloud Monitoring system generated an alert for an ash cloud moving WNW, as imaged by S-NPP VIIRS, at 0330 UTC on 5 January 2018; Himawari-8 imagery subsequently showed that the eruption began around 0220 UTC. The Darwin VAAC reported two discrete ash plumes drifting W at 2.1 km altitude during the day. After local reports of the eruption Samaritan Airlines flew administrators from the Wewak district to investigate, enabling photographs of ash and steam emissions (figure 2).
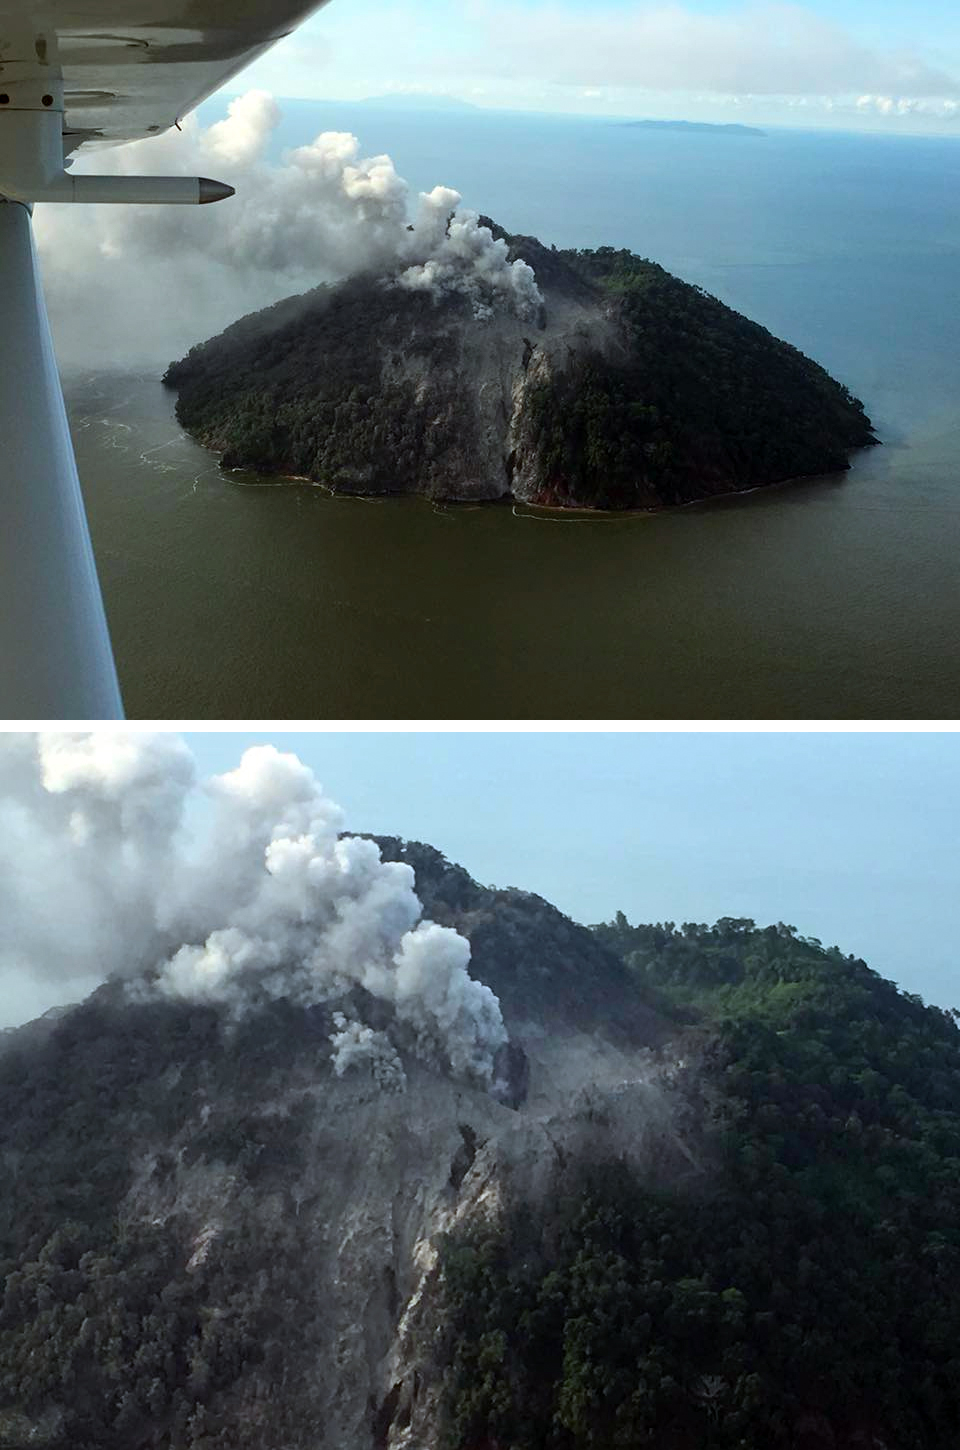 |
Figure 2. Steam and ash emerged from a vent near the summit of Kadovar Island and drifted WNW on 5 January 2018. The view is looking NW with the SE flank of Kadovar in the foreground. In the upper photo, the island in the background is Viai Island about 30 km NW. Photo by Ricky Wobar, administrator of the Wewak district. Courtesy of Samaritan Aviation, posted on Facebook on 5 January 2018. |
The following day, 6 January 2018, photos from a Samaritan Air flight showed that dark gray ash and steam plumes rising from a crater on the SE side of the summit had intensified (figures 3 and 4). It was estimated that 50 or 60% of the island was covered in volcanic debris, which appeared to be primarily ash along with some pyroclastic flows. According to the International Federation of Red Cross and Red Crescent Societies (IFRC), the entire population of Kadovar, about 600 people who lived on the N side of the island, was relocated to nearby Blup Blup Island which is home to about 800 residents. RVO reported minor ashfall on Kairiru and Mushu islands (115 km WNW), and on mainland Papua New Guinea at Mt. Uru in Yangoru (130 km W), Woginara (140 km W), and the Wewak District (100 km W).
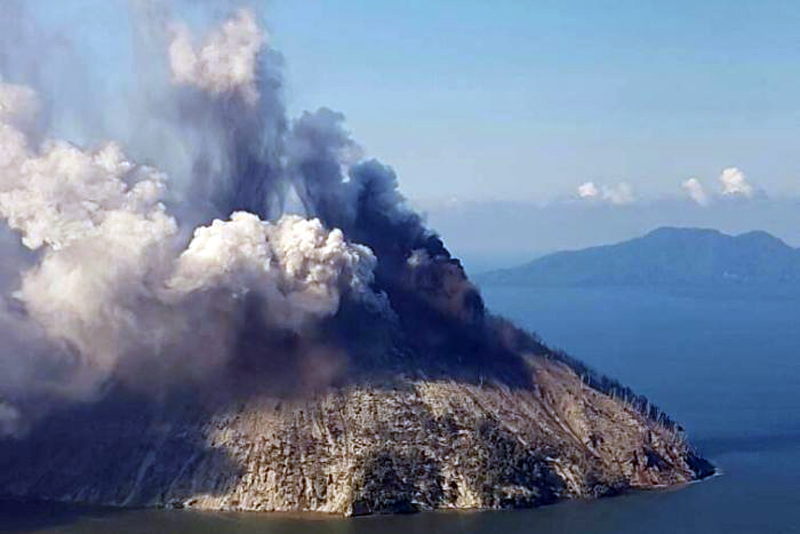 |
Figure 3. Ash and steam plumes rose from distinct vents on the SE side of the summit at Kadovar. View is to the NE, with Blup Blup volcano located about 12 km in the distance. Photo by Ricky Wobar likely taken on 6 January 2018, published by ABC News on 8 January 2018. Courtesy of ABC News. |
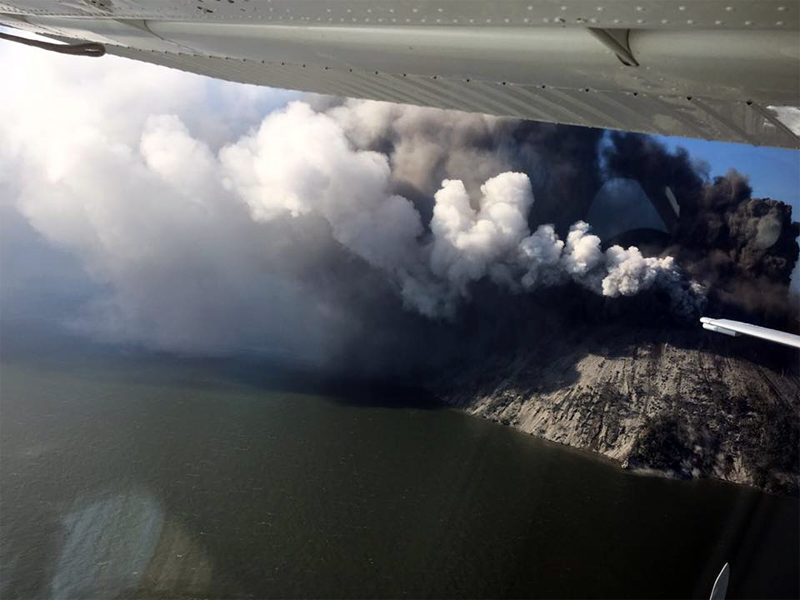 |
Figure 4. Ash and steam emissions intensified from vents at the summit of Kadovar Island on 6 January 2018. Posted on Facebook, 6 January 2018 by Samaritan Aviation. |
Also on 6 January 2018, missionary Brandon Buser set out from Wewak to visit Bam by boat. He observed the steam and ash plumes of Kadovar from about 75 km away. About 25 km W of the island, he felt falling ash. From a few hundred meters offshore he witnessed the ash and steam plumes rising from near the summit as he circled the S and E sides of the island (figures 5-8).
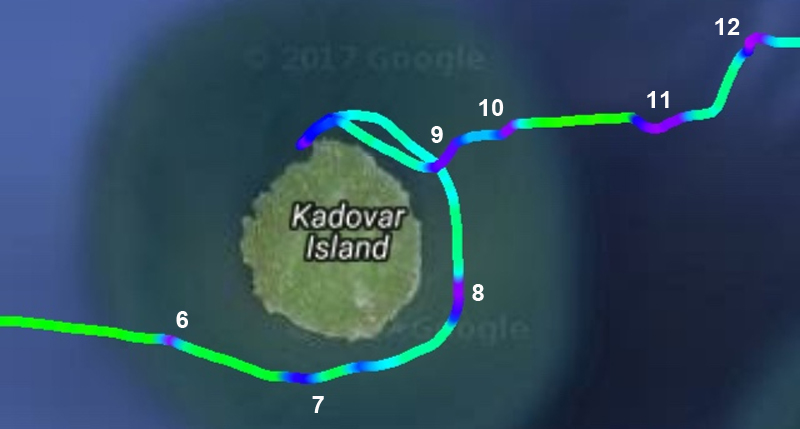 |
Figure 5. Locations of the following photographs of the eruption at Kadovar on 6 January 2018 correspond closely to the purple spots where the boat slowed down on its trip around the island. North is to the top. Numbers indicate approximate locations of the following figures 6-12. Courtesy of Brandon Buser. Base map courtesy of Google Earth. |
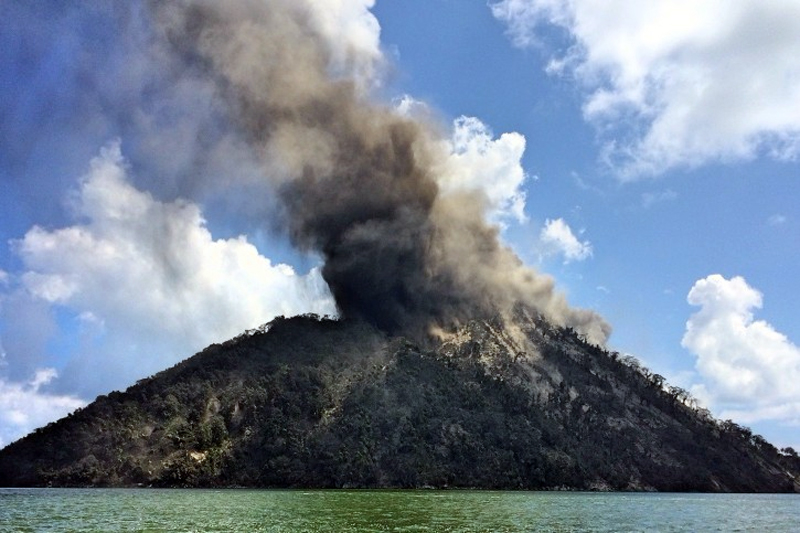 |
Figure 6. An ash plume drifted NW from the summit of Kadovar as viewed from a boat a few hundred meters off the SW flank on 6 January 2018. Courtesy of Brandon Buser. |
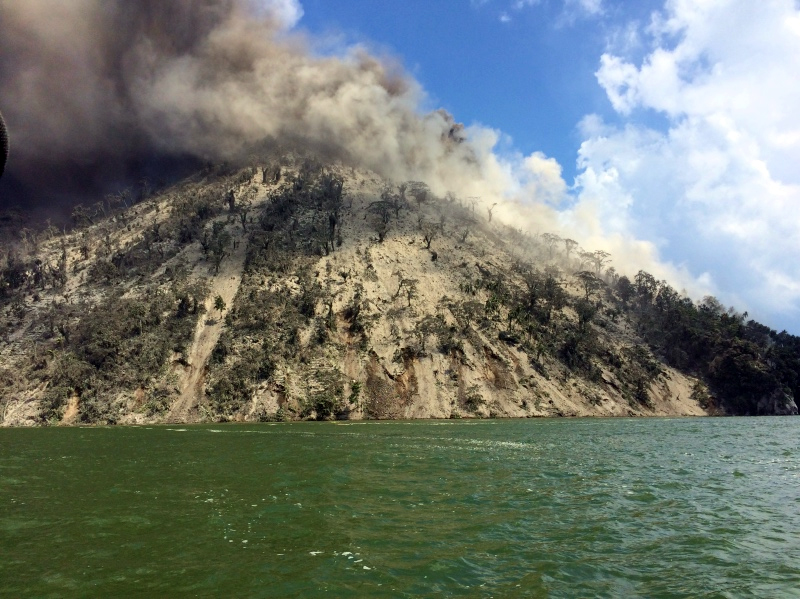 |
Figure 7. Ash drifted WNW from Kadovar and also covered the vegetation on the SSW flank on 6 January 2018 in this view from a boat a few hundred meters off the SSW flank. Courtesy of Brandon Buser. |
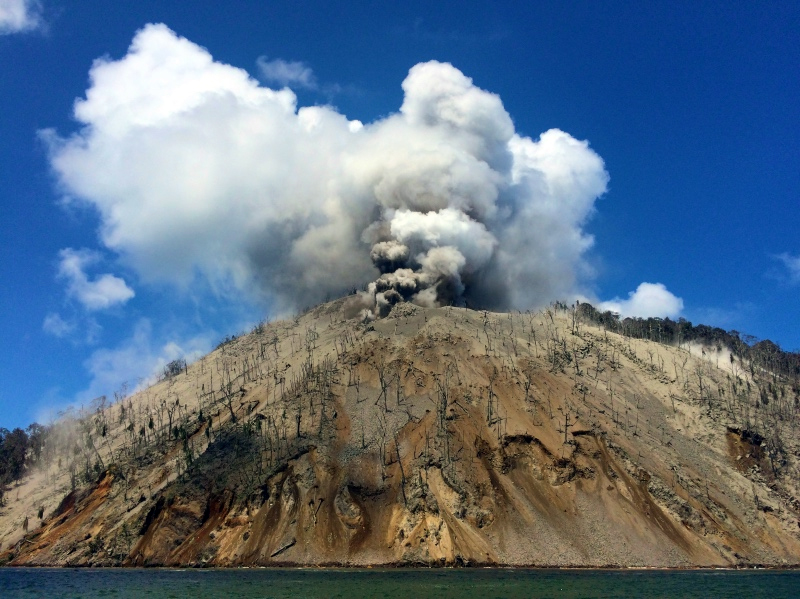 |
Figure 8. Dark ash and white steam both rose from vents at the summit of Kadovar on 6 January 2018. Debris and ashfall killed and denuded the trees on the SE flank, and covered the ground. View is from a boat a few hundred meters off the SE flank. Courtesy of Brandon Buser. |
While preparing to head E to Bam, Buser witnessed an explosion that sent large plumes of ash and steam skyward from the SE flank, and a significant cloud of volcanic debris was ejected outward and down the SE flank; large boulders fell into the ocean. Heading rapidly E away from the eruption, he took additional photographs (figures 9-12).
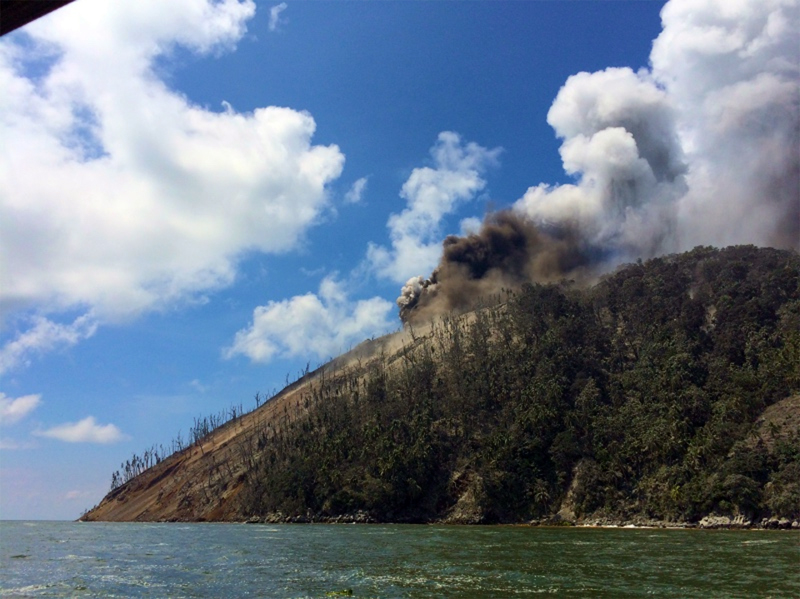 |
Figure 9. Dark gray ash and white steam billowed up from a vent near the summit of Kadovar on 6 January 2018 at the start of an explosion. The denuded vegetation and bare slopes on the SE flank indicated the extent of the recent activity. The view is from a boat a few hundred meters offshore of the NE flank. Courtesy of Brandon Buser. |
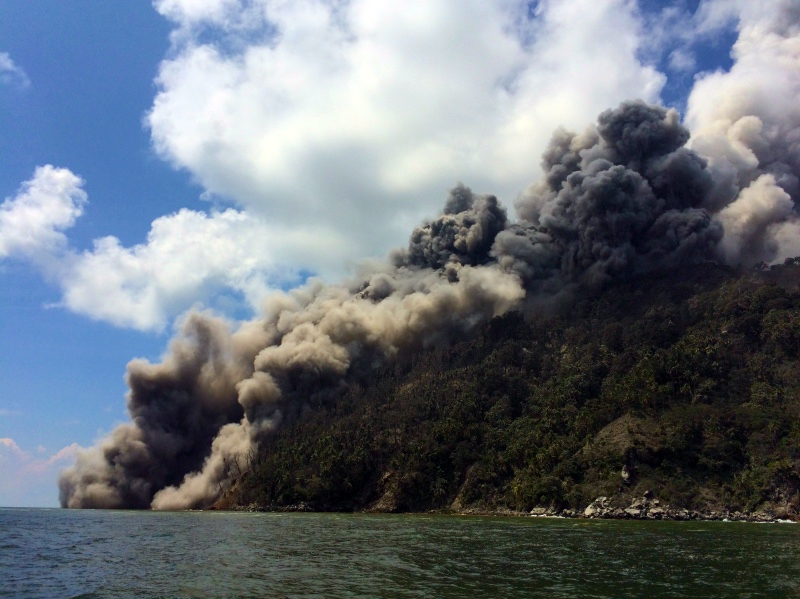 |
Figure 10. An explosion witnessed at Kadovar on 6 January 2018. Steam rose from a vent near the summit (right), dark gray ash billowed up from the SE flank, and brown dust and debris descended the SE flank into the ocean (left) in this view from a few hundred meters off the NE flank. Courtesy of Brandon Buser. |
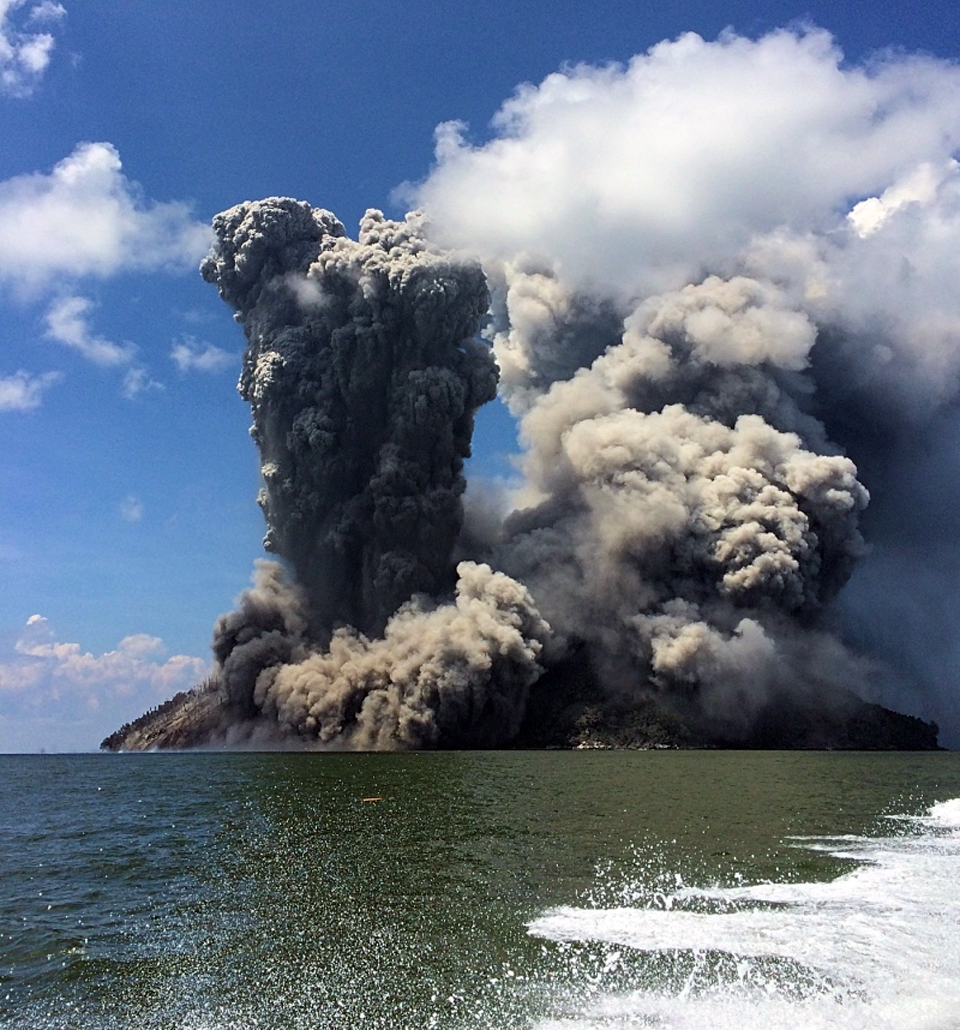 |
Figure 11. A large explosion at Kadovar witnessed on 6 January 2018. Light gray steam and ash rose from near the summit and drifted NW covering the N half of the island in ash; a large eruption of dark gray ash shot upward from a different vent on the SE flank surrounded by dust and debris that traveled outward at its base. Larger debris caused splashing in the water off the SE flank (left). View is from a few kilometers off the NE flank. Courtesy of Brandon Buser. |
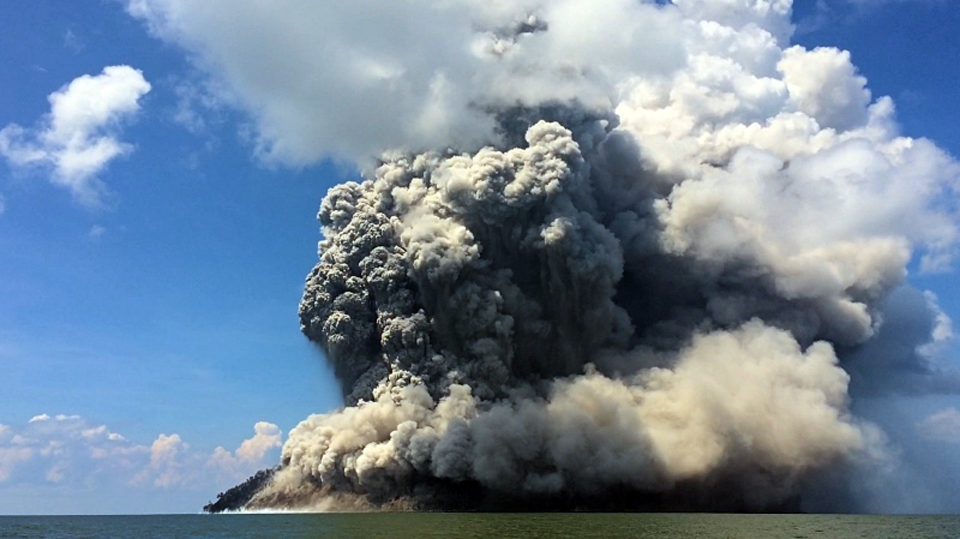 |
Figure 12. The plumes of steam, ash, and debris from the explosion moments earlier at Kadovar on 6 January 2018 rose and began to drift NW covering the island. Blocks landing in the ocean on the SE flank created spray along the shoreline (left). View is from a boat a few kilometers NE of the island. Courtesy of Brandon Buser. |
The Darwin VAAC reported on 6 January 2018 that a continuous ash plume was identifiable in satellite imagery moving W and WNW at 2.1 km altitude. By 7 January, the plume could be identified about 220 km WNW in satellite images (figure 13). During their return trip from Bam on 8 January 2018, the missionaries again circled the island and noted that the eruption seemed to be occurring from different vents. The island was covered in ash, and they became covered with wet ash as they traveled under the drifting ash plume. The Darwin VAAC reported the plume drifting WNW extending about 185 km on 8 January. They also noted that the influence of the sea breeze was also spreading minor ash to the SW. Continuous ash emissions were observed by the Darwin VAAC through 11 January, drifting W and NW at 2.1 km altitude.
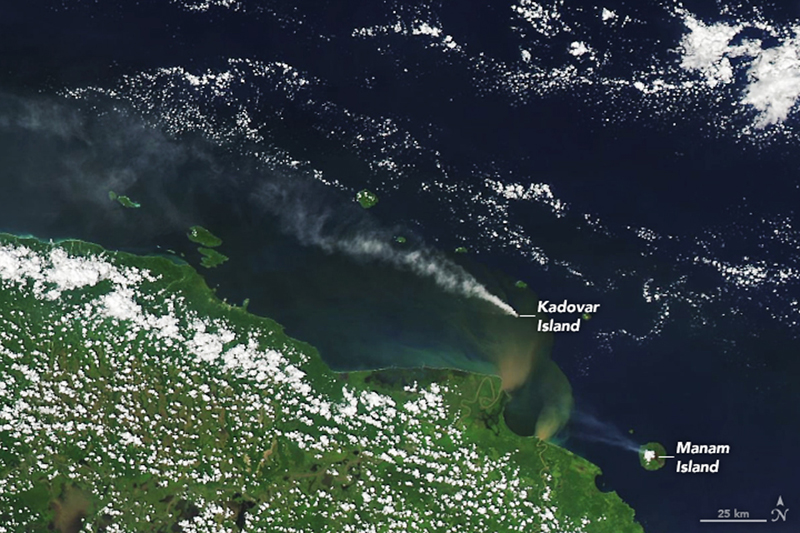 |
Figure 13. The Moderate Resolution Imaging Spectroradiometer (MODIS) on NASA's Aqua satellite captured the eruption of Kadovar that began two days earlier on 7 January 2018 as a plume of ash and steam that streamed NW from its crater. A second smaller plume, also drifting NW, is visible SE of Kadovar from unrelated activity at nearby Manam, one of Papua New Guinea's most active volcanos. Brown-green plumes visible in the water S of Kadovar near the coast of the mainland, are caused by sediment from the Sepik and Ramu rivers on the mainland. Courtesy of NASA Earth Observatory. |
RVO reported a significant escalation in activity during 12-13 January 2018. An explosion during the previous night ejected large incandescent boulders from the fracture on the SE flank. Residents on Blup Blup (15 km N) could see incandescence high on the volcano's flank. During a flyover on 13 January, RVO noted variable steam and gas emissions rising to 1 km above the Main Crater and identified five distinct vents (figure 14). The SE Coastal Vent was very active with dense white steam emissions rising 600 m from the vent (figure 15). A dome of lava was visible at the base of the steam plume, but no incandescence was observed. The Southern Coastal Vent had been vigorously steaming a few days earlier, and RVO interpreted it to be the source of the incandescent blocks in the explosion a few days before.
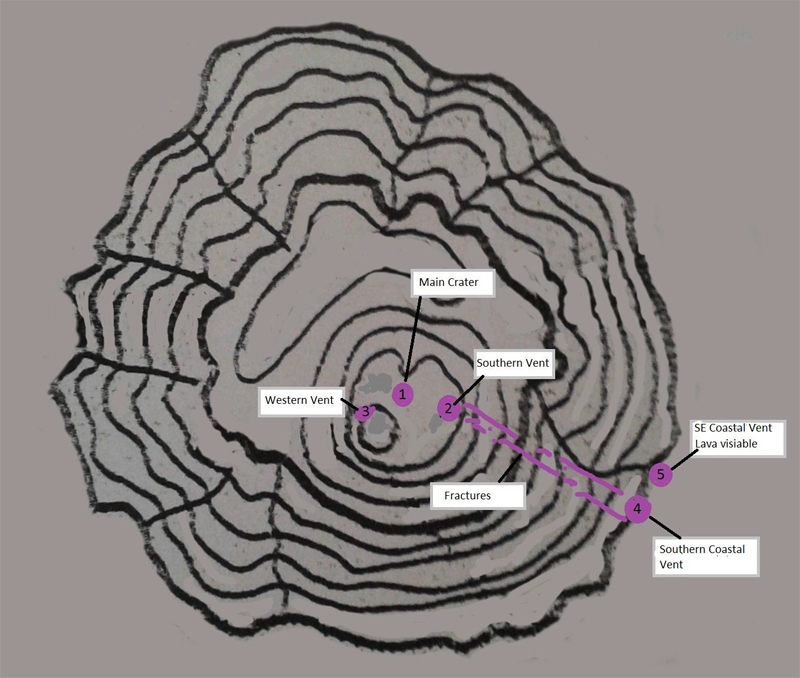 |
Figure 14. A sketch map of the five newly identified vents at Kadovar, 14 January 2018, from an RVO overflight the previous day. Courtesy of RVO (VOLCANO INFORMATION BULLETIN- No. 08 14/01/2018). |
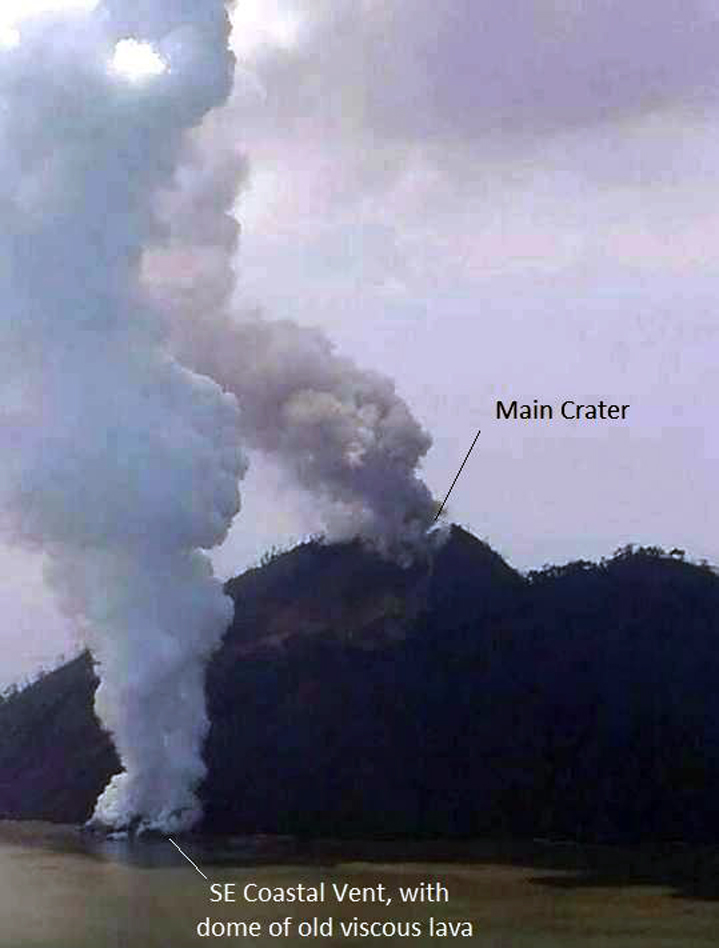 |
Figure 15. A vigorous steam plume rose from the SE Coastal Vent at Kadovar on 13 January 2018 while an ash plume rose from Main Crater at the summit. Photo by the office of Allan Bird, Governor of East Sepik Province. Courtesy of RVO (VOLCANO INFORMATION BULLETIN- No. 08 14/01/2018). |
Reports of continuous ash emissions at 2.1 km altitude drifting WNW from the Darwin VAAC resumed on 16 January. A brief emission to 3.7 km was also noted that day. Pilot reports on 17 and 18 January indicated that ash was still in the area as high as 3-3.7 km altitude drifting W. The reports of emissions from the Darwin VAAC continued through 24 January. Ash emissions were generally continuous at altitudes from 2.4 to 3 km, although low level emissions of primarily steam and gas were observed on 20 January that included intermittent phases of increased ash content. The plume drift direction was variable, with periods when ash drifted S and SE in addition to the generally prevailing NW and W directions.
During 18-22 January 2018, the Main Crater continued to produce moderate to dark gray ash plumes that rose 500-800 m above the summit, drifting locally S and SE, and a continuous steam plume from the SE Coastal Vent rose as high as 800 m above the island. An incandescent lava flow slowly extruded from the SE Coastal Vent. By the last week of January, the ash plumes were only rising about 100 m above the Main Crater and drifting W; weak incandescence was still observed at night. The white steam plume from the SE Coastal Vent rose closer to 400 m above the island. RVO estimated that the lava flow had risen to about 50 m above sea level and extended 150-200 m out from the coast.
In their report on 2 February 2018, RVO noted that the lava flow continued to grow. A distinct lobe had pushed out from the seaward nose of the flow, by about 20-30 m; it appeared to be channeled by levees which had developed at the flow's sides. At 1830 local time on 1 February, a collapse of the side of the flow facing Blup Blup was observed; it resulted in a plume of gray ash and then vigorous steaming at the collapse site, which also was incandescent at night. The main body of the flow significantly bulged upwards, with a distinct 'valley' visible between the bulge and the island's flank.
RVO reported that on 9 February the lava flow at the SE Coastal Vent had collapsed, causing 5-6 minor tsunamis less than 1 m high that were observed by residents on Blup Blup's E and W coasts. The waves were reported at 1050, before the main collapse of the dome. In a 12 February report, RVO noted that activity from Main Crater consisted of white plumes rising 20 m and drifting a few kilometers SE accompanied by weak nighttime crater incandescence. Activity renewed at the SE Coastal Vent shortly after the collapse of the flow on 9 February 2018; lava re-emerged a few days later, connecting a lava island to the coastline again. Continuous steam emissions from both the Main Crater and the SE Coastal Vent were interrupted by dark ash plumes on 16 and 20-22 February, and occasional explosions were heard by residents on nearby islands. Minor ashfall was reported on Blup Blup on 21 and 22 February.
Eruptive activity continued during March 2018, although at a slower rate. The Main Crater generally produced continuous emissions of white steam and intermittent explosions with dark ash plumes; incandescence was usually visible at night from Blup Blup. According to the Darwin VAAC, a pilot reported an ash plume at 3.9 km altitude drifting SE on 2 March; it was not visible in satellite imagery due to meteoric clouds. The lava flow extruding from the SE Coastal Vent continued to grow, creating a dome that grew from 7-8 m above sea level to 10-17 m above sea level by 8 March. Dark ash emissions from the vent and nighttime incandescence were common. The growth rate slowed later in the month, and only one meter of change was observed between 10 and 20 March.
Satellite data. The MIROVA project recorded thermal anomalies from Kadovar in early January and early March 2018 (figure 16). MODVOLC thermal alerts were issued on three days; 15 and 22 January, and 7 February 2018. During January, small SO2 plumes were recorded by NASA satellites on four occasions (figure 17).
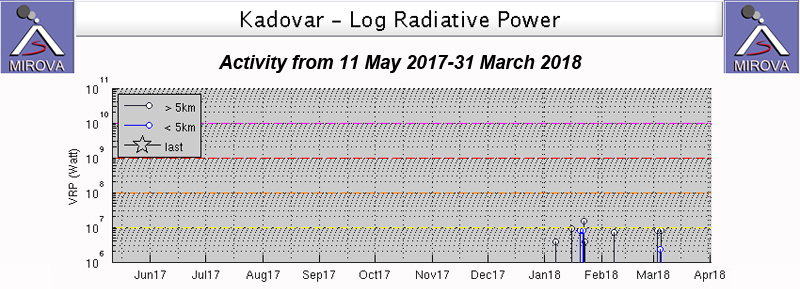 |
Figure 16. The MIROVA project thermal anomaly graph for Kadovar from 11 May 2017 through March 2018. The first anomaly in early January 2018 correlates with observations of the first reported explosion. Courtesy of MIROVA. |
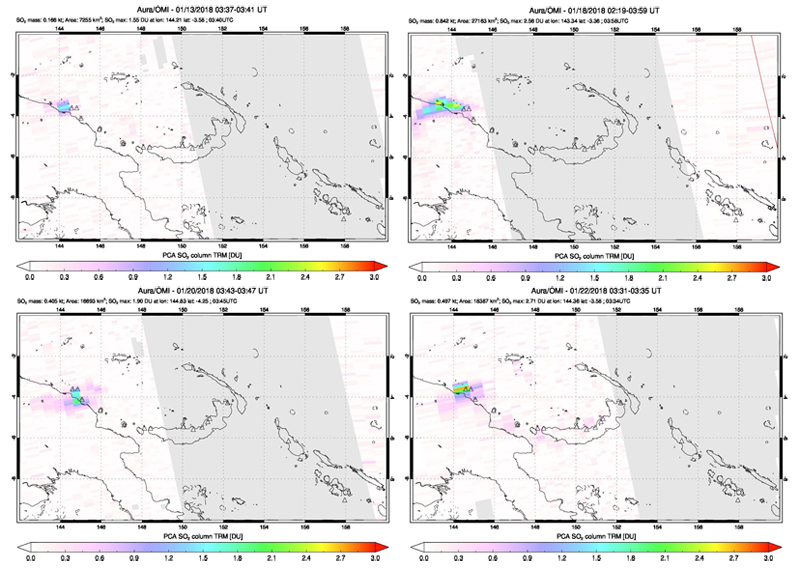 |
Figure 17. SO2 plumes from Kadovar were detected several times during January 2018 by the OMI instrument on NASA's Aura satellite. Courtesy of NASA Goddard Space Flight Center. |
Information Contacts: Rabaul Volcano Observatory (RVO), Geohazards Management Division, Department of Mineral Policy and Geohazards Management (DMPGM), PO Box 3386, Kokopo, East New Britain Province, Papua New Guinea, Contact: steve_saunders@mineral.gov.pg, ima_itikarai@mineral.gov.pg; Darwin Volcanic Ash Advisory Centre (VAAC), Bureau of Meteorology, Northern Territory Regional Office, PO Box 40050, Casuarina, NT 0811, Australia (URL: http://www.bom.gov.au/info/vaac/); NASA Earth Observatory, EOS Project Science Office, NASA Goddard Space Flight Center, Goddard, Maryland, USA (URL: http://earthobservatory.nasa.gov/); NASA Goddard Space Flight Center (NASA/GSFC), Global Sulfur Dioxide Monitoring Page, Atmospheric Chemistry and Dynamics Laboratory, 8800 Greenbelt Road, Goddard, Maryland, USA (URL: https://so2.gsfc.nasa.gov/); NOAA, Cooperative Institute for Meteorological Satellite Studies (CIMSS), Space Science and Engineering Center (SSEC), University of Wisconsin-Madison, 1225 W. Dayton St., Madison, Wisconsin 53706, USA (URL: http://cimss.ssec.wisc.edu/); International Federation of Red Cross and Red Crescent Societies (IFRC) (URL: http://www.ifrc.org/); Samaritan Aviation (URL: http://samaviation.com/, https://www.facebook.com/samaritanaviation/); Brandon Buser (URL: https://ethnos360.org/missionaries/brandon-and-rachel-buser, https://www.facebook.com/brandon.buser.35); ABC News (URL: http://www.abc.net.au/news/2018-01-08/tsunami-warning-for-communities-near-erupting-png-volcano/9311544); Google Earth (URL: https://www.google.com/earth/).
Intermittent ash plumes; thermal anomalies in the crater and Coastal Vent through September 2018
The first confirmed eruption of Kadovar began on 5 January 2018 with dense ash plumes and steam and a lava flow. The eruption continued through February and then slowed during March (BGVN 43:04). This report describes notices of ash plumes from the Darwin Volcanic Ash Advisory Centre (VAAC) and satellite images during April through 1 October 2018.
According to the Darwin VAAC a pilot observed an ash plume rising to an altitude of 1.2 km on 10 June. The ash plume was not identified in satellite data. Another ash plume identified by a pilot and in satellite images rose to an altitude of 1.8 km on 20 June and drifted W. An ash plume was visible in satellite images on 28 September drifting SE at an altitude of 2.1 km. On 1 October an ash plume rose to 2.7 km and drifted W.
Infrared satellite data from Sentinel-2 showed hot spots in the summit crater and at the Coastal Vent along the W shoreline on 10, 15, and 25 April 2018; plumes of brown discolored water were streaming from the western side of the island (figure 18). Similar activity was frequently seen during clear weather in the following months. A steam plume was also often rising from the crater. The Coastal Vent cone was still hot on 8 August, but no infrared anomaly was seen in imagery from 28 August through September.
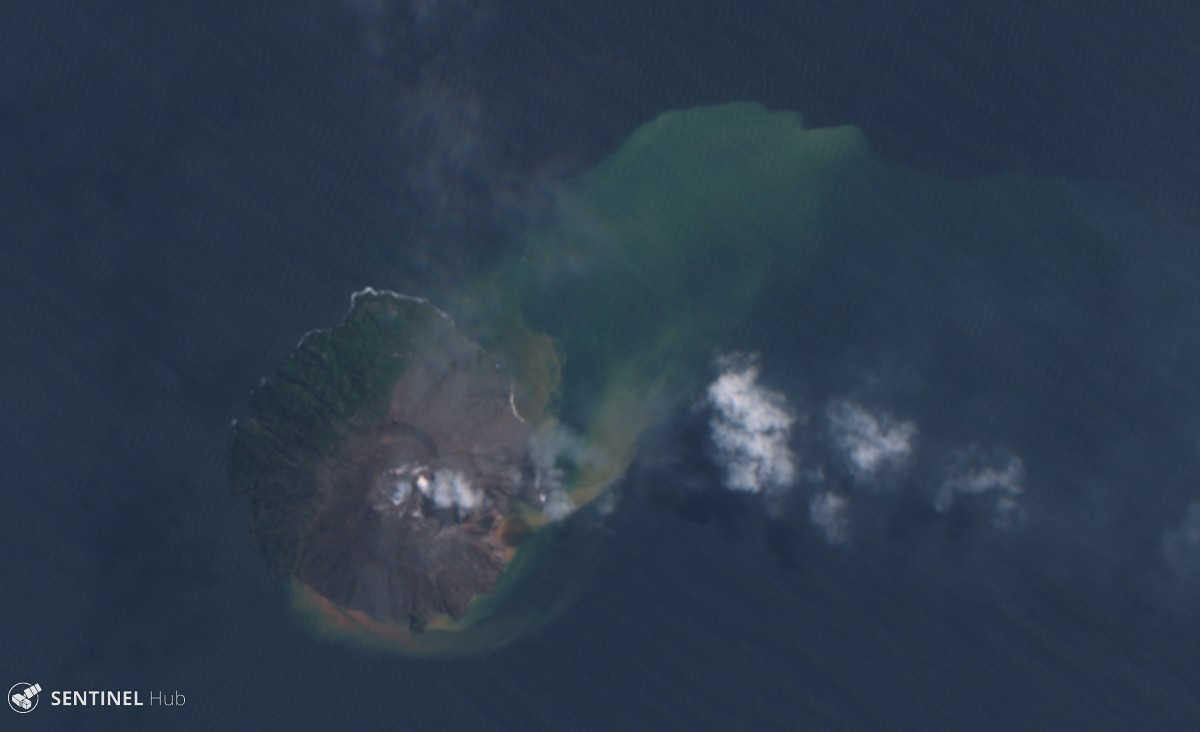 |
Figure 18. Sentinel-2 natural color satellite image of Kadovar on 10 April 2018. The island is about 1.5 km in diameter. Steam can be seen rising from the summit and the Coastal Vent just off the western shore; both locations show thermal anomalies in infrared imagery. Discolored water plumes extend NE from the island. Courtesy of Sentinel Hub Playground. |
Information Contacts: Darwin Volcanic Ash Advisory Centre (VAAC), Bureau of Meteorology, Northern Territory Regional Office, PO Box 40050, Casuarina, NT 0811, Australia (URL: http://www.bom.gov.au/info/vaac/); Sentinel Hub Playground (URL: https://www.sentinel-hub.com/explore/sentinel-playground).
Ash emissions and thermal anomalies during October 2018-April 2019; lava emissions at the E flank coast and summit area
Steeply-sloped Kadovar Island is located about 25 km NNE from the mouth of the Sepik River on the mainland of Papua New Guinea. The first confirmed historical eruption with ash plumes and lava extrusion began in early January 2018, resulting in the evacuation of around 600 residents from the N side of the approximately 1.4-km-diameter island (BGVN 43:03); continuing activity from October 2018 through April 2019 is covered in this report. Information was provided by the Rabaul Volcano Observatory (RVO), the Darwin Volcanic Ash Advisory Center (VAAC), satellite sources, and photos from visiting tourists.
Activity during March-September 2018. After the first recorded explosions with ash plumes in early January 2018, intermittent ash plumes continued through March 2018. A lava flow on the E flank extended outward from the island, extruding from a vent low on the E flank and forming a dome just offshore. The dome collapsed and regrew twice during February 2018; the growth rate slowed somewhat during March. A satellite image from 21 March 2018 was one of the first showing the new dome growing off the E flank with a thermal anomaly and sediment plumes in the water drifting N and E from the area. Thermal anomalies were visible at both the summit vent and the E-flank coastal dome in April and May 2018, along with steam and gas rising from both locations (figure 19).
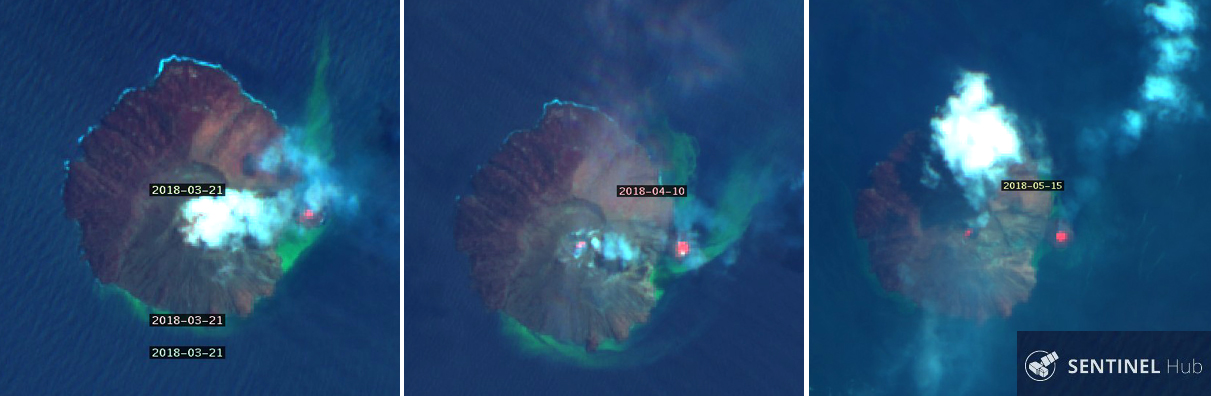 |
Figure 19. Sentinel-2 satellite imagery of Kadovar provided clear evidence of thermal activity at the new E-flank coastal dome during March-May 2018. Sediment plumes were visible drifting N and E in the water adjacent to the coastal dome. The summit crater also had a persistent steam plume and thermal anomaly in April and May 2018. Left: 21 March 2018. Middle 10 April 2018. Right: 15 May 2018. Images all shown with "Geology" rendering using bands 12, 4, and 2. Courtesy of Sentinel Hub Playground. |
A trip to Kadovar by tourists in mid-May 2018 provided close-up views of the dense steam plumes at the summit and the growing E-flank coastal dome (figures 20 and 21). The thermal anomaly was still strong at the E-flank coastal dome in a mid-June satellite image, but appeared diminished in late July. Intermittent puffs of steam rose from both the summit and the coastal dome in mid-June; the summit plume was much denser on 29 July (figure 22). Ash emissions were reported by the Darwin VAAC and photographed by tourists during June (figure 23) and September 2018 (BGVN 43:10), but thermal activity appeared to decline during that period (figure 24).
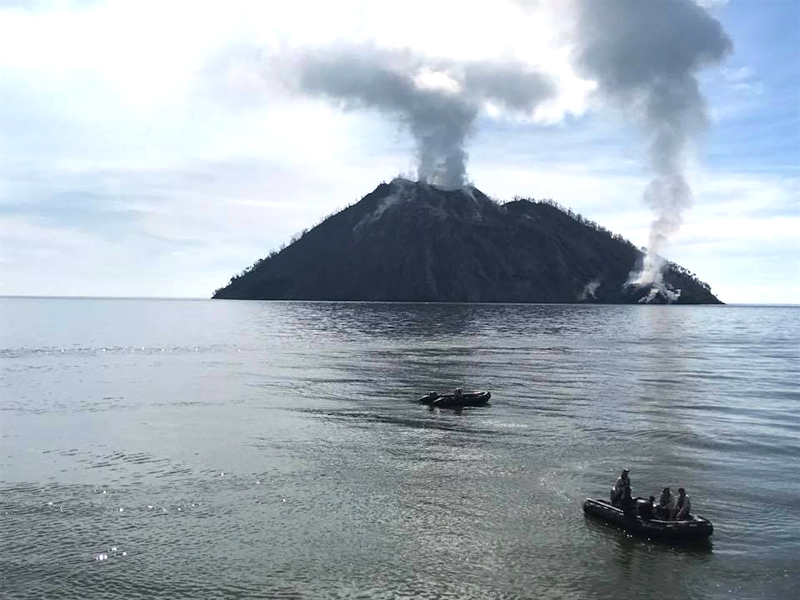 |
Figure 20. A tourist photographed Kadovar and posted it online on 19 May 2018. Steam plumes rose from both the summit and the E-flank coastal dome in this view taken from the SE. Courtesy of Tico Liu. |
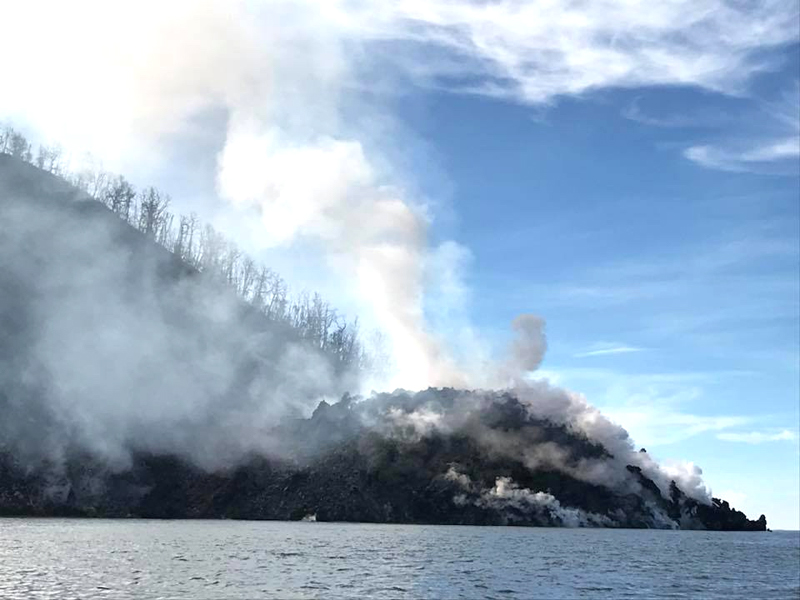 |
Figure 21. A closeup view of the E-flank coastal dome at Kadovar posted online on 19 May 2018 showed steam rising from several places on the dome, and dead trees on the flank of the volcano from recent eruptive activity. Courtesy of Tico Liu. |
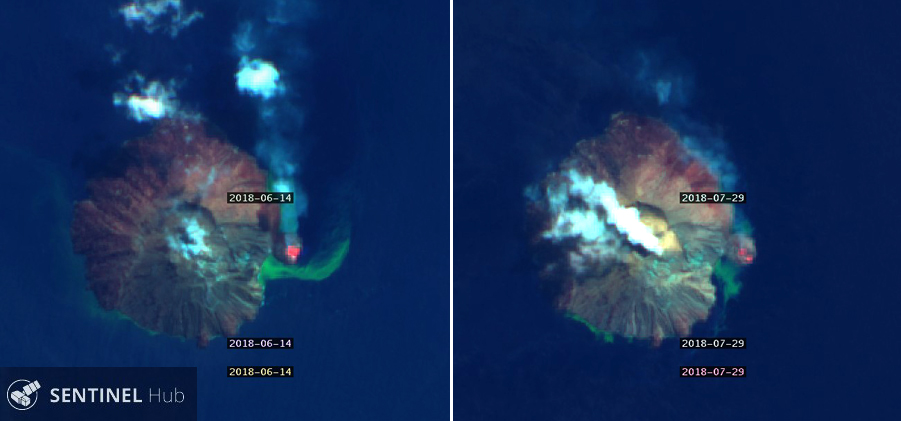 |
Figure 22. The thermal anomaly was still strong at the E-flank coastal dome of Kadovar in a 14 June 2018 satellite image (left), but appeared diminished on 29 July 2018 (right). Intermittent puffs of steam rose from both the summit and the coastal dome on 14 June; the summit plume was much denser on 29 July. Sentinel-2 images both show "Geology" rendering using bands 12, 4, and 2. Courtesy of Sentinel Hub Playground. |
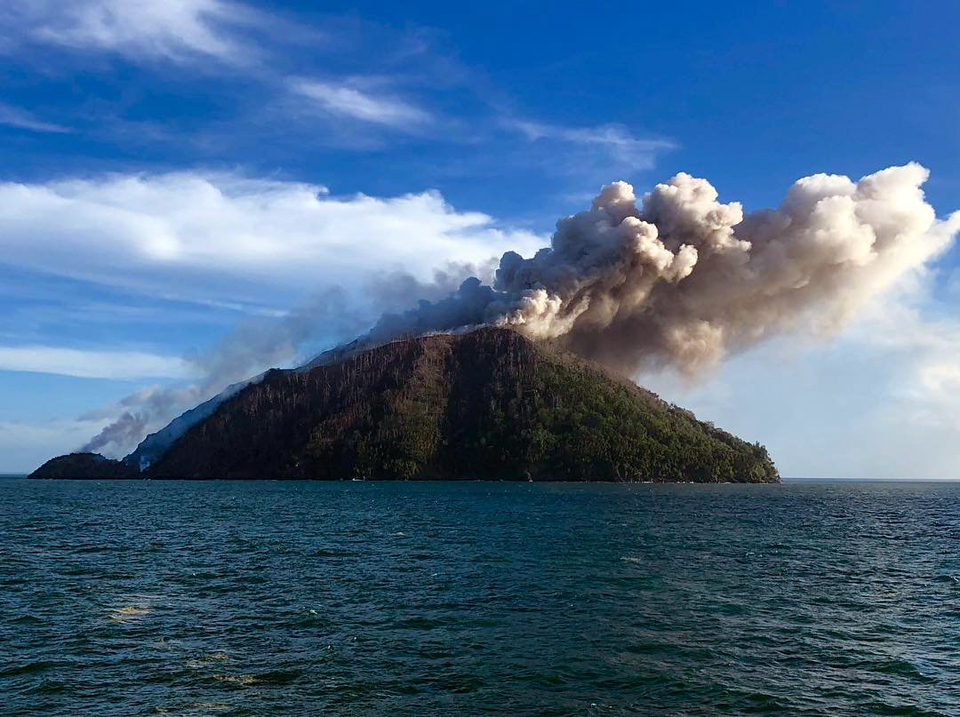 |
Figure 23. An ash plume rose from the summit of Kadovar and drifted W while steam and gas rose from the E-flank coastal dome, posted online 27 June 2018. Courtesy of Shari Kalt. |
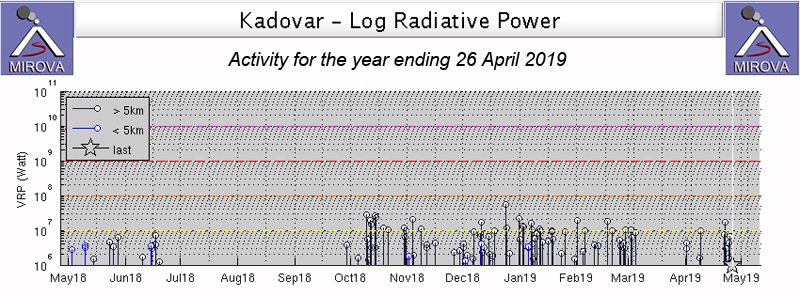 |
Figure 24. Thermal activity at Kadovar for the year ending on 26 April 2019 was consistent from late April 2018 through mid-June 2018; a quiet period afterwards through late September ended with renewed and increased thermal activity beginning in October 2018. All distances are actually within 1 km of the summit of Kadovar, a DEM georeferencing error makes some locations appear further away. Courtesy of MIROVA. |
Multiple satellite images during August and early September 2018 showed little or no sign of thermal activity at the E-flank coastal dome, with only intermittent steam plumes from the summit. A new steam plume on the eastern slope appeared in a 22 September 2018 image (figure 25). The Rabaul Volcano Observatory (RVO) reported explosive activity on the afternoon of 21 September. Noises of explosions were accompanied by dark gray and brown ash clouds that rose several hundred meters above the summit crater and drifted NW. Local reports indicated that the activity continued through 26 September and ashfall was reported on Blupblup island during the period. Ground observers noted incandescence visible from both the summit and the E-flank coastal dome.
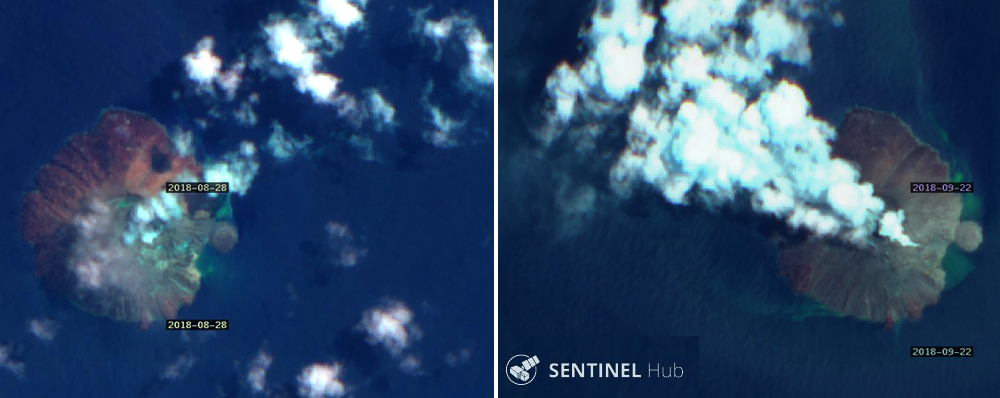 |
Figure 25. Steam plumes were seen in satellite images of Kadovar during August and early September 2018, but no thermal anomalies. Intermittent steam plumes rose from the summit vent on 28 August (left). A new dense steam plume originating mid-way down the E flank appeared on 22 September 2018 (right). Sentinel-2 images both show "Geology" rendering using bands 12, 4, and 2. Courtesy of Sentinel Hub Playground. |
Activity during October-December 2018. Evidence of both thermal and explosive activity reappeared in October 2018 (figure 24). The Darwin VAAC reported intermittent ash plumes rising to 2.7 km altitude and drifting W on 1 October 2018. Low-level continuous ash emissions rising less than a kilometer and drifting W were reported early on 3 October. A higher plume drifted WNW at 2.4 km altitude on 7 October. Intermittent discrete emissions of ash continued daily at that altitude through 16 October, drifting NW or W. Ash emissions drifting NW and thermal anomalies at the summit were visible in satellite imagery on 2 and 12 October (figure 26). A brief ash emission was reported on 21 October 2018 at 2.4 km altitude drifting NE for a few hours. Intermittent ash emissions also appeared on 29 October moving SE at 1.8 km altitude. For the following three days ash drifted SW, W, then NW at 2.1 km altitude, finally dissipating on 1 November; the thermal anomaly at the summit was large and intense in satellite images on 27 October and 1 November compared with previous images (figure 27).
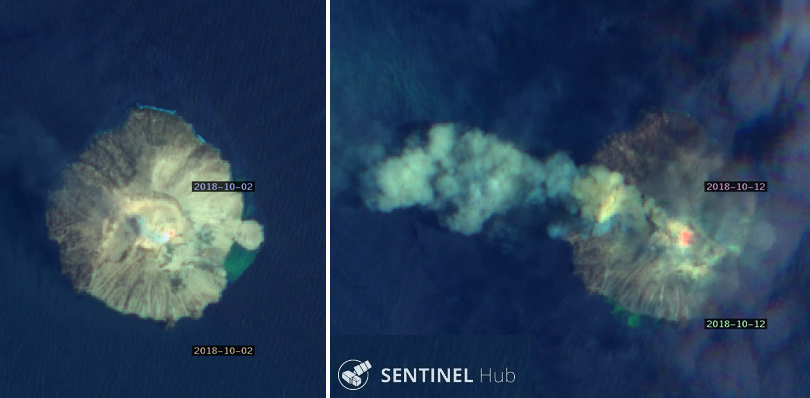 |
Figure 26. Ash emissions drifting NW and thermal anomalies at the summit of Kadovar were visible in satellite imagery on 2 and 12 October 2018; no thermal activity was noted at the E-flank coastal dome. Sentinel-2 images both show "Geology" rendering using bands 12, 4, and 2. Courtesy of Sentinel Hub Playground. |
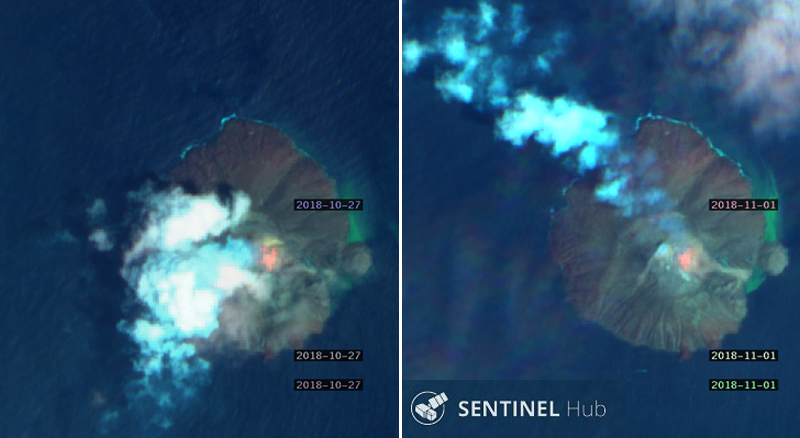 |
Figure 27. Strong thermal anomalies at the summit of Kadovar on 27 October and 1 November 2018 were not concealed by the steam plumes drifting SW and NW from the summit. Sentinel-2 images both show "Geology" rendering using bands 12, 4, and 2. Courtesy of Sentinel Hub Playground. |
An ash explosion was photographed by tourists on a cruise ship on the afternoon of 6 November 2018 (figure 28). After the explosion, a dense steam plume rose from a large dome of lava near the summit at the top of the E flank (figure 29). Continuous ash emissions rising to 1.8 km altitude were reported by the Darwin VAAC beginning on 9 November 2018 moving WNW and lasting about 24 hours. A new ash plume clearly identifiable on satellite imagery appeared on 13 November at 2.4 km altitude moving E, again visible for about 24 hours. Another shipboard tourist photographed an ash plume on 18 November rising a few hundred meters above the summit (figure 30).
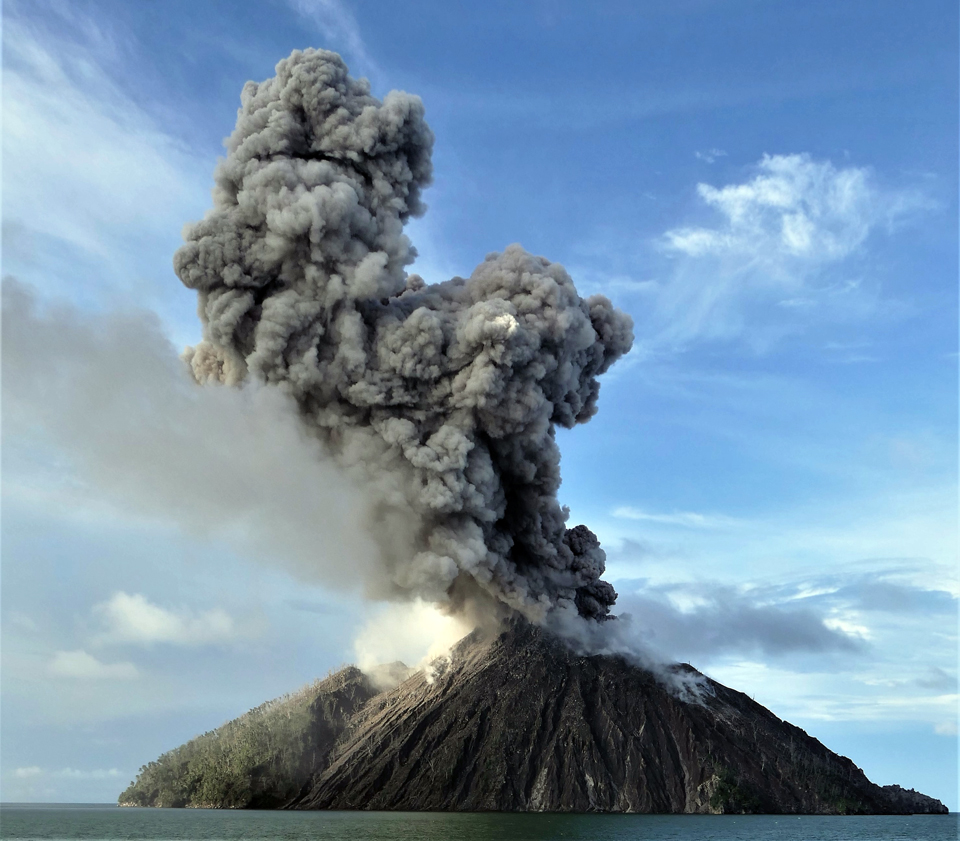 |
Figure 28. An explosion at Kadovar photographed on the afternoon of 6 November 2018 sent a dense gray ash plume hundreds of meters above the summit drifting W; blocks of volcanic debris descended the flanks as well. View is from the S. Courtesy of Coral Expeditions, used with permission. |
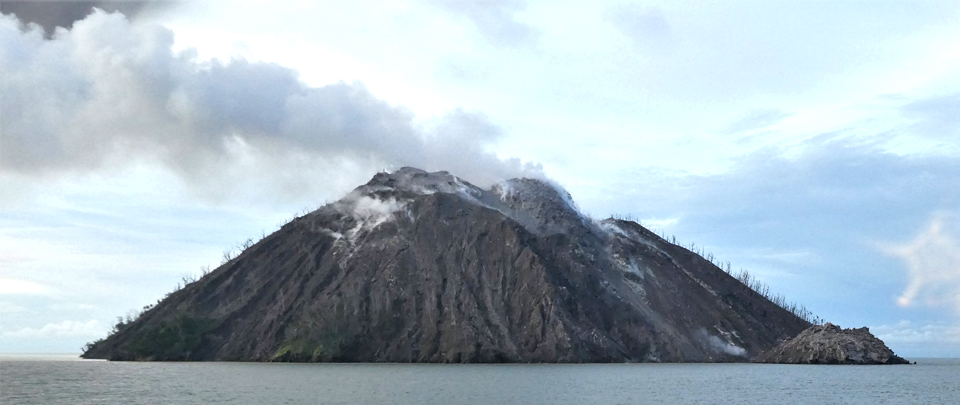 |
Figure 29. Tourists on a cruise ship passed by Kadovar on 6 November 2018 and witnessed a steam plume drifting W from a large dome of lava near the summit at the top of the E flank after an ash explosion. Smaller steam plumes were visible in the middle and at the base of the E flank, but no activity was visible at the coastal dome off the E flank (lower right). View is from the SE. Courtesy of Coral Expeditions, used with permission. |
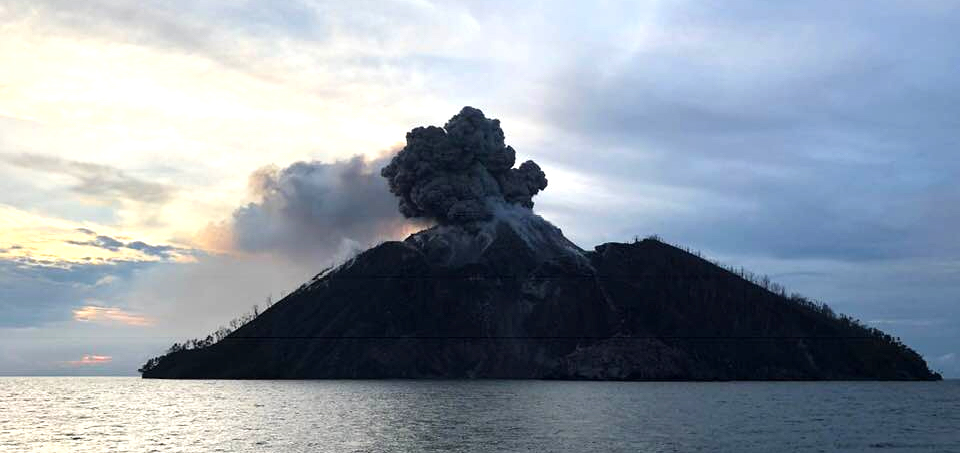 |
Figure 30. An ash plume rose at dusk from the summit of Kadovar and was witnessed by a cruise ship tourist on 18 November 2018. View is from the E; the E-flank coastal dome is a lighter area in the lower foreground. Courtesy of Philip Stern. |
Low-level ash emissions were reported briefly on 28 November at about 1 km altitude moving SE. Intermittent puffs of ash were seen drifting WSW on 2 and 3 December at about 1.2 km altitude. They were the last VAAC reports for 2018. Two thermal anomalies were visible at the summit in satellite imagery on 26 November, they grew larger and more intense through 16 December when multiple anomalies appeared at the summit and on the E flank (figure 31).
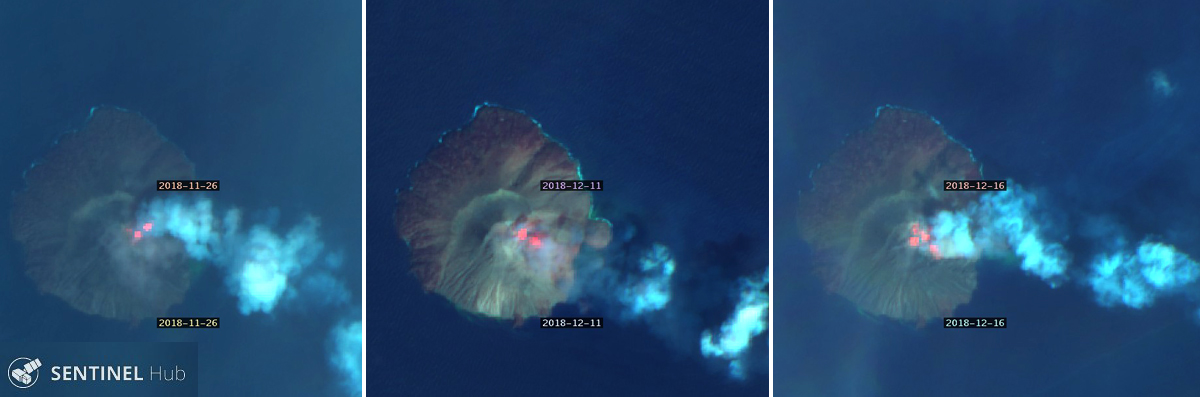 |
Figure 31. Multiple thermal anomalies near the summit of Kadovar grew larger and more intense between 26 November and 16 December 2018. Sentinel-2 images show "Geology" rendering using bands 12, 4, and 2. Courtesy of Sentinel Hub Playground. |
Activity during January-April 2019. Multiple thermal anomalies were still visible at the summit in satellite imagery on 5 January 2019 as regular puffs of steam drifted SE from the summit, leaving a long trail in the atmosphere (figure 32). Additional imagery on 10 and 30 January showed a single anomaly at the summit, even through dense meteorologic clouds. A short-lived ash emission rose to 2.4 km altitude on 11 January 2019 and drifted E; it dissipated the next day. Multiple minor intermittent discrete ash plumes extended WNW at 3.0 km altitude on 18 January; they dissipated within six hours.
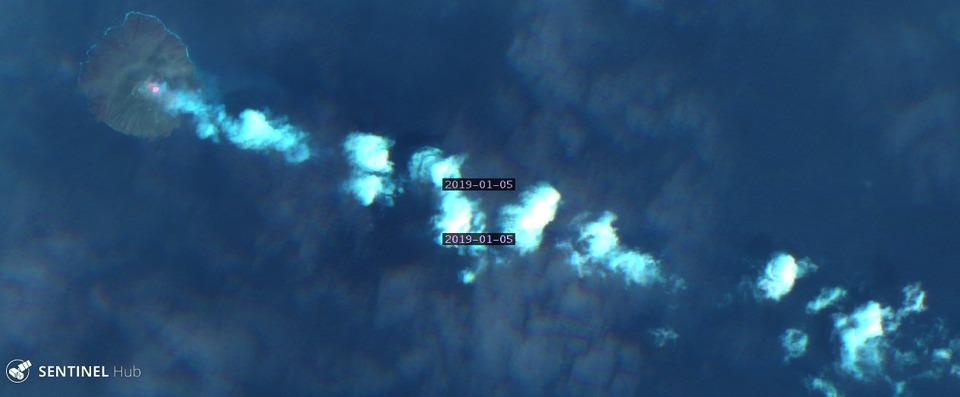 |
Figure 32. Multiple thermal anomalies were visible in satellite imagery of Kadovar on 5 January 2019 as regular puffs of steam drifted SE from the summit. Sentinel-2 image shows "Geology" rendering using bands 12, 4, and 2. Courtesy of Sentinel Hub Playground. |
The Royal New Zealand Air Force released images of eruptive activity on 10 February 2019 (figure 33). Satellite imagery in February was largely obscured by weather; two thermal anomalies were barely visible through clouds at the summit on 14 February. The Darwin VAAC reported an ash emission at 1.8 km altitude drifting ESE on 16 February; a similar plume appeared on 21 February that also dissipated in just a few hours.
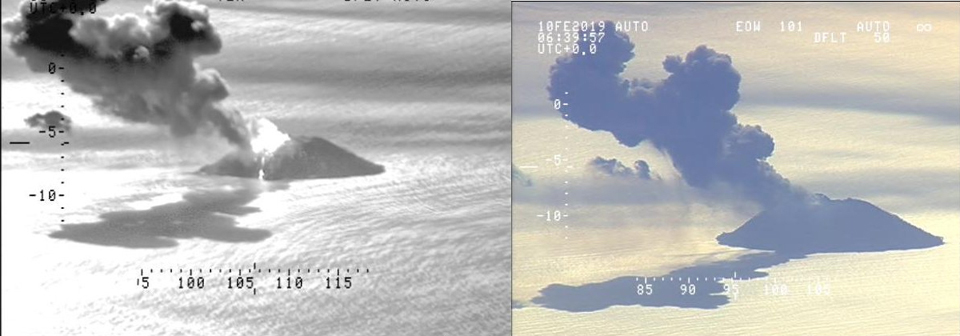 |
Figure 33. The Royal New Zealand Air Force released images of an ash plume at Kadovar on 10 February 2019. Courtesy of Brad Scott. |
Satellite imagery on 1 March 2019 confirmed a strong thermal anomaly from the summit and down the E flank almost to the coast. A month later on 5 April the anomaly was nearly as strong and a dense ash and steam plume drifted N from the summit (figure 34). A tourist witnessed a dense steam plume rising from the summit on 4 April (figure 35). Multiple discrete eruptions were observed in satellite imagery by the Darwin VAAC on 9 April at 1.2-1.5 km altitude drifting SE. The thermal anomaly at the summit persisted in satellite imagery taken on 15 April 2019.
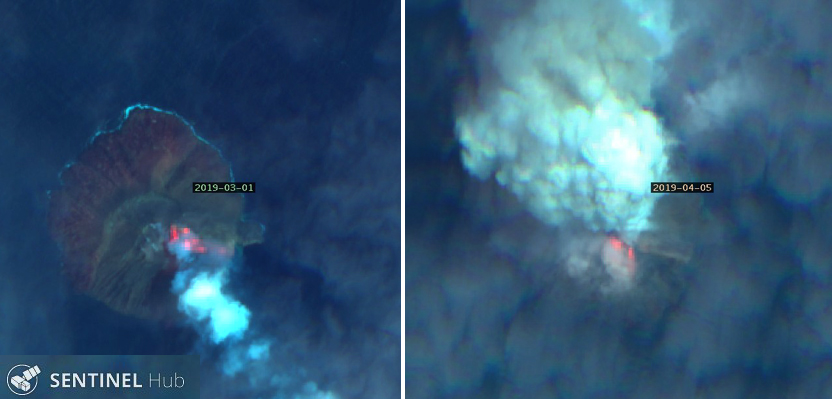 |
Figure 34. A strong thermal anomaly appeared from the summit down the E flank of Kadovar on 1 March 2019 (left). A month later on 5 April the strong anomaly was still present beneath a dense plume of ash and steam (right). Sentinel-2 imagery shows "Geology" rendering with bands 12, 4, and 2. Courtesy of Sentinel Hub Playground. |
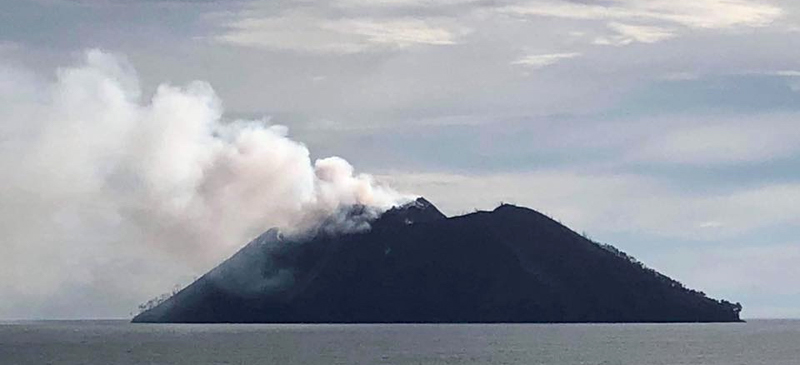 |
Figure 35. A dense steam plume is shown here rising from the summit area of Kadovar, posted online on 4 April 2019. View is from the N. Courtesy of Chaiyasit Saengsirirak. |
Information Contacts: Rabaul Volcano Observatory (RVO), Geohazards Management Division, Department of Mineral Policy and Geohazards Management (DMPGM), PO Box 3386, Kokopo, East New Britain Province, Papua New Guinea; Sentinel Hub Playground (URL: https://www.sentinel-hub.com/explore/sentinel-playground); MIROVA (Middle InfraRed Observation of Volcanic Activity), a collaborative project between the Universities of Turin and Florence (Italy) supported by the Centre for Volcanic Risk of the Italian Civil Protection Department (URL: http://www.mirovaweb.it/); Tico Liu, Hong Kong (Facebook: https://www.facebook.com/tico.liu. https://www.facebook.com/photo.php?fbid=10155389178192793&set=pcb.10155389178372793&type=3&theater); Shari Kalt (Instagram user LuxuryTravelAdvisor: https://www.instagram.com/luxurytraveladviser/, https://www.instagram.com/p/BkhalnuHu2j/); Coral Expeditions, Australia (URL: https://www.coralexpeditions.com/, Facebook: https://www.facebook.com/coralexpeditions); Philip Stern (Facebook: https://www.facebook.com/sternph, https://www.facebook.com/sternph/posts/2167501866616908); Brad Scott, GNS Science Volcanologist at GNS Science, New Zealand (Twitter: https://twitter.com/Eruptn); Chaiyasit Saengsirirak, Bangkok, Thailand (Facebook: https://www.facebook.com/chaiyasit.saengsirirak, https://www.facebook.com/photo.php?fbid=2197513186969355).
Frequent gas and some ash emissions during May-December 2019 with some hot avalanches
Kadovar is an island volcano north of Papua New Guinea and northwest of Manam. The first confirmed historical activity began in January 2018 and resulted in the evacuation of residents from the island. Eruptive activity through 2018 changed the morphology of the SE side of the island and activity continued through 2019 (figure 36). This report summarizes activity from May through December 2019 and is based largely on various satellite data, tourist reports, and Darwin Volcanic Ash Advisory Center (VAAC) reports.
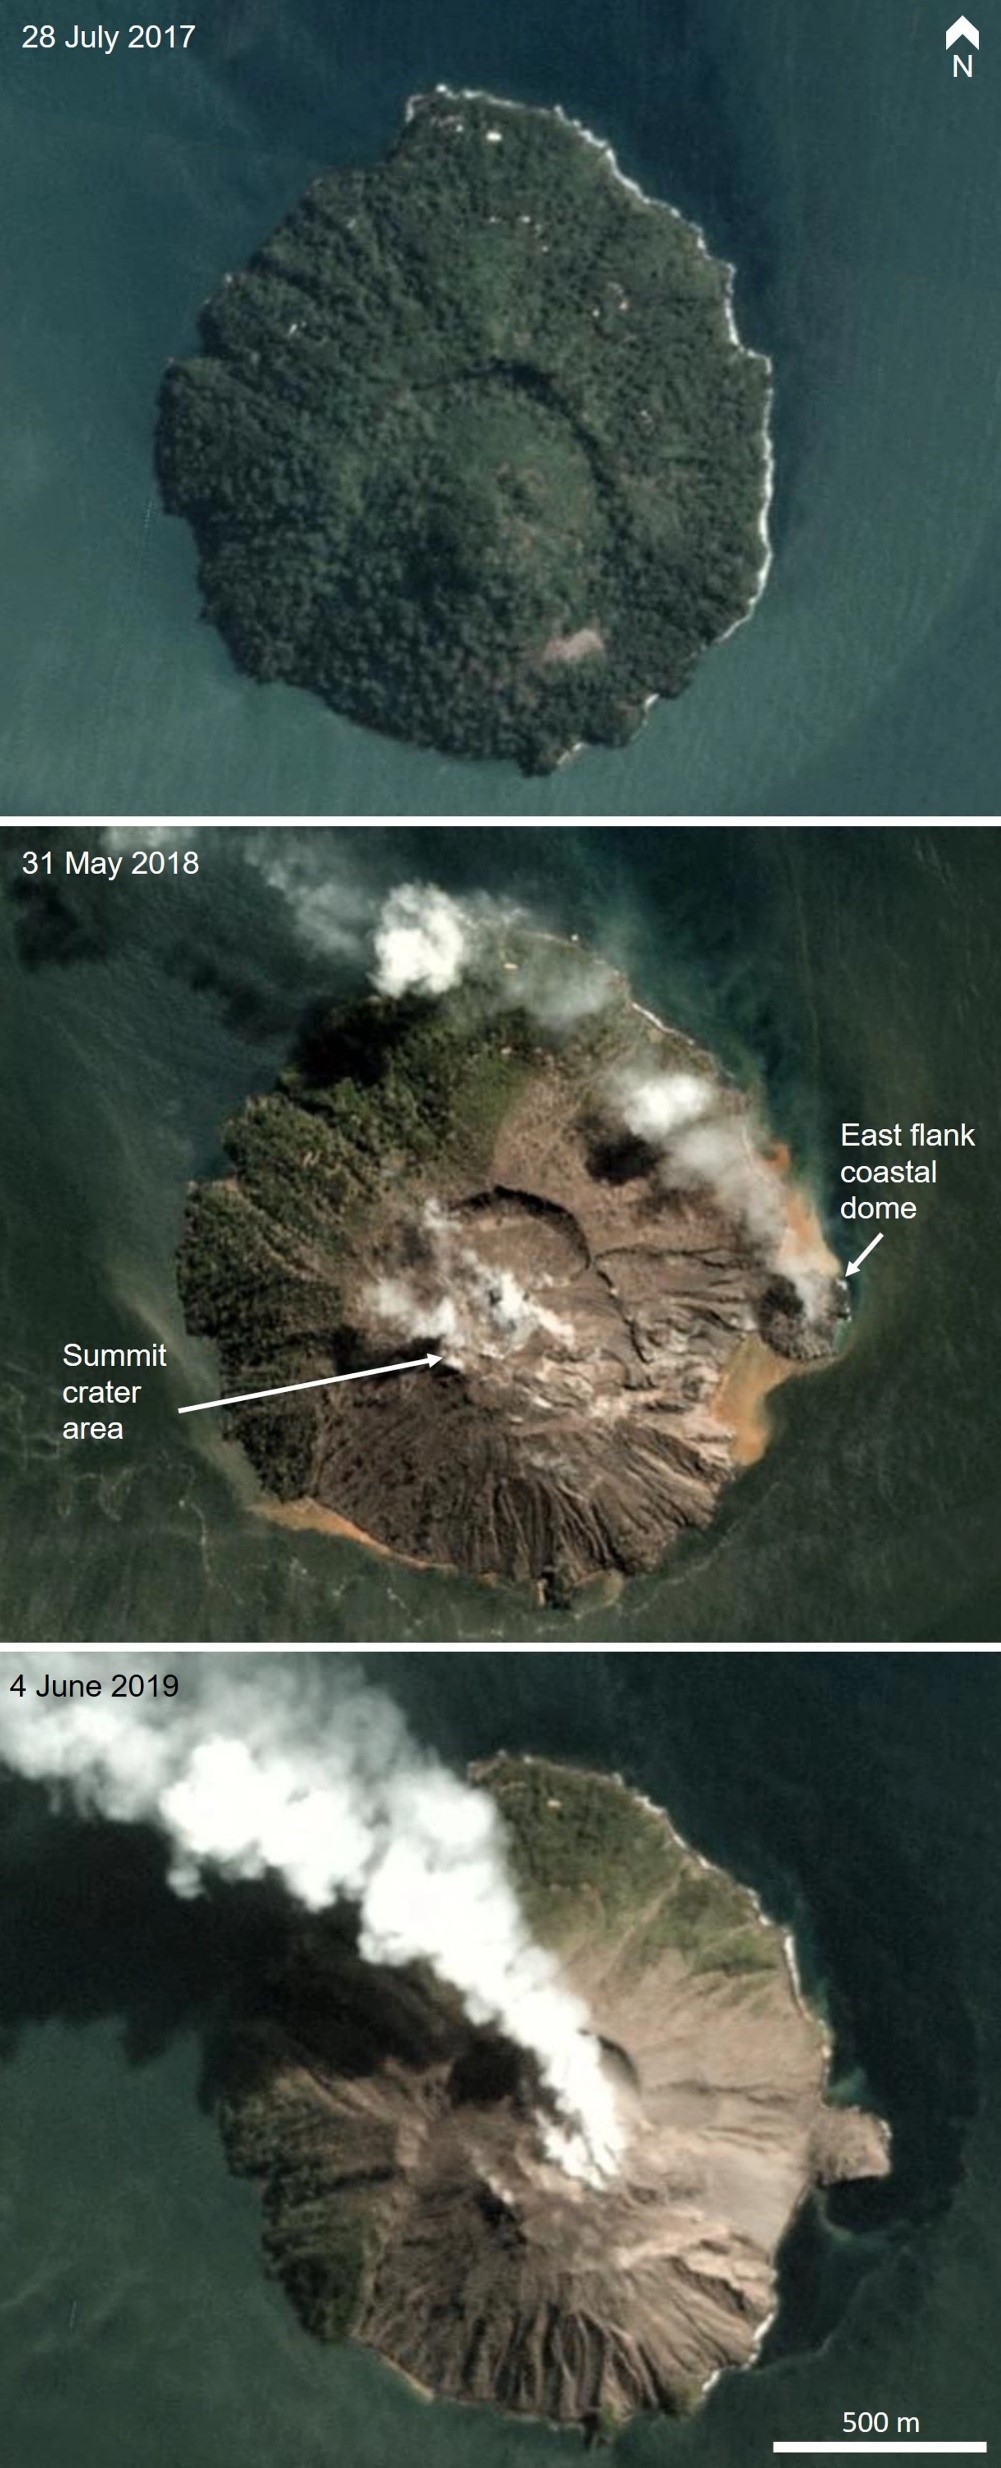 |
Figure 36. The morphological changes to Kadovar from 2017 to June 2019. Top: the vegetated island has a horseshoe-shaped crater that opens towards the SE; the population of the island was around 600 people at this time. Middle: by May 2018 the eruption was well underway with an active summit crater and an active dome off the east flank. Much of the vegetation has been killed and ashfall covers a lot of the island. Bottom: the bay below the SE flank has filled in with volcanic debris. The E-flank coastal dome is no longer active, but activity continues at the summit. PlanetScope satellite images copyright Planet Labs 2019. |
Since this eruptive episode began a large part of the island has been deforested and has undergone erosion (figure 37). Activity in early 2019 included regular gas and steam emissions, ash plumes, and thermal anomalies at the summit (BGVN 44:05). On 15 May an ash plume originated from two vents at the summit area and dispersed to the east. A MODVOLC thermal alert was also issued on this day, and again on 17 May. Elevated temperatures were detected in Sentinel-2 thermal satellite data on 20, 21, and 30 May (figure 38), with accompanying gas-and-steam plumes dispersing to the NNW and NW. On 30 May the area of elevated temperature extended to the SE shoreline, indicating an avalanche of hot material reaching the water.
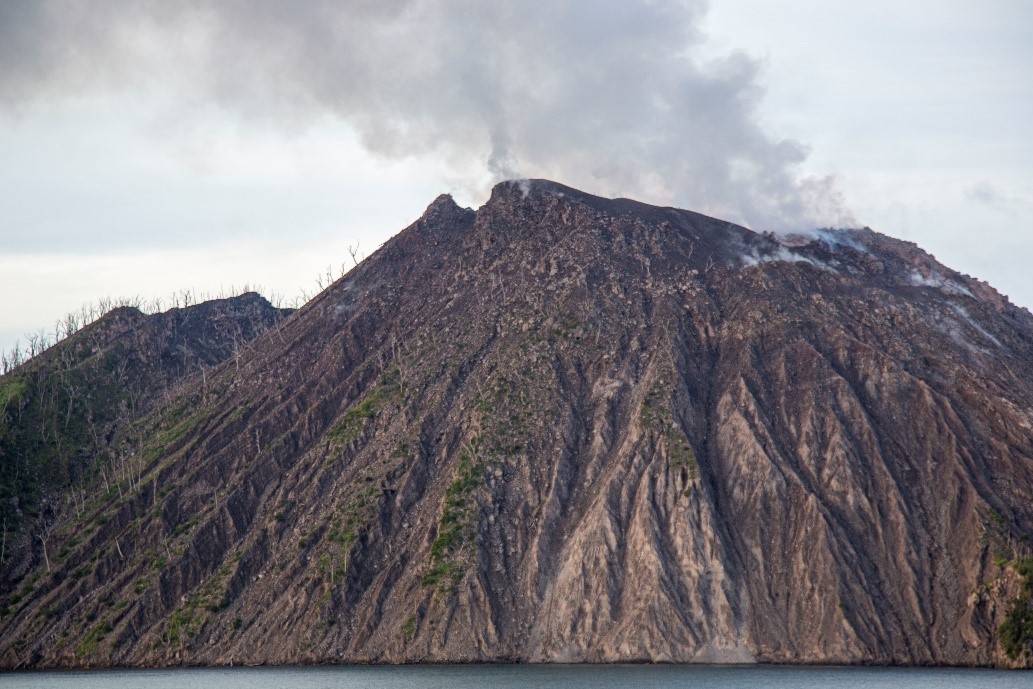 |
Figure 37. The southern flank of Kadovar seen here on 13 November 2019 had been deforested by eruptive activity and erosion had produced gullies down the flanks. Copyrighted photo by Chrissie Goldrick, used with permission. |
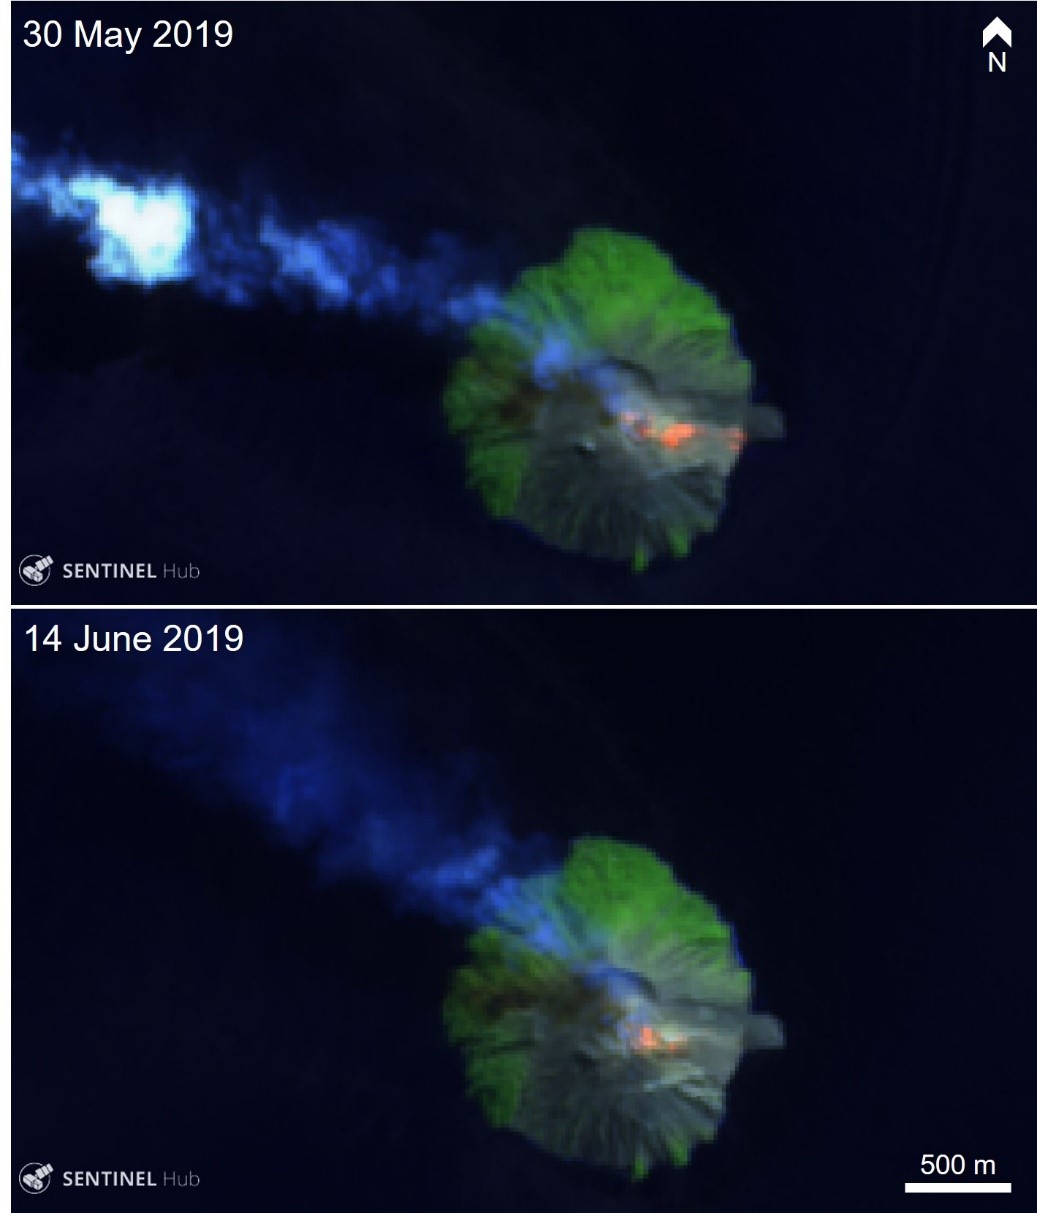 |
Figure 38. Sentinel-2 thermal satellite images show elevated temperatures at the summit area, and down to the coast in the top image. Gas-and-steam plumes are visible dispersing towards the NW. Sentinel-2 false color (urban) satellite image (bands 12, 11, 4) courtesy of Sentinel-Hub Playground. |
Throughout June cloud-free Sentinel-2 thermal satellite images showed elevated temperatures at the summit area and extending down the upper SE flank (figure 38). Gas-and-steam plumes were persistent in every Sentinel-2 and NASA Suomi NPP / VIIRS (Visible Infrared Imaging Radiometer Suite) image. MODVOLC thermal alerts were issued on 4 and 9 June. Similar activity continued through July with gas-and-steam emissions visible in every cloud-free satellite image. Thermal anomalies appeared weaker in late-July but remained at the summit area. An ash plume was imaged on 17 July by Landsat 8 with a gas-and-ash plume dispersing to the west (figure 39). Thermal anomalies continued through August with a MODVOLC thermal alert issued on the 14th. Gas emissions also continued and a Volcano Observatory Notice for Aviation (VONA) was issued on the 19th reporting an ash plume to an altitude of 1.5 km and drifting NW.
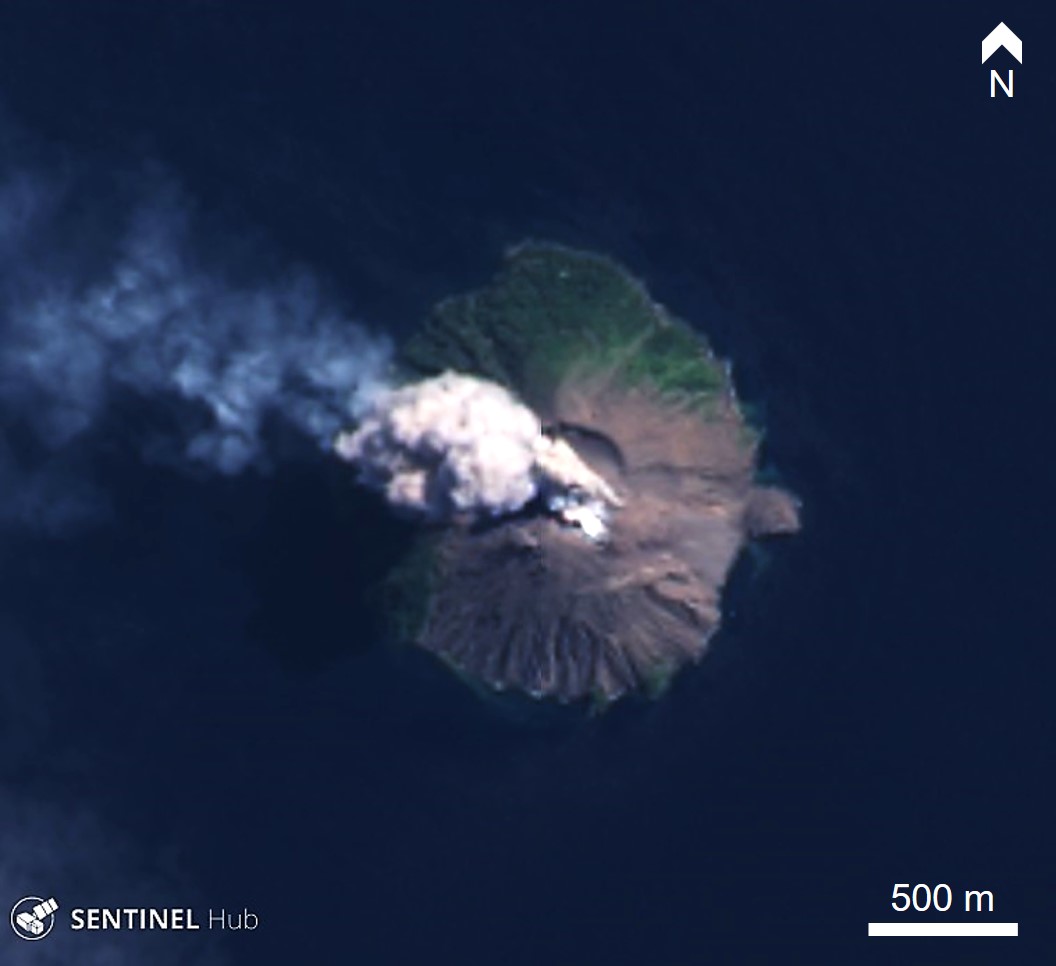 |
Figure 39. An ash plume rising above Kadovar and a gas plume dispersing to the NW on 17 July 2019. Truecolor pansharpened Landsat 8 satellite image courtesy of Sentinel Hub Playground. |
An elongate area extending from the summit area to the E-flank coastal dome appears lighter in color in a 7 September Sentinel-2 natural color satellite image, and as a higher temperature area in the correlating thermal bands, indicating a hot avalanche deposit. These observations along with the previous avalanche, persistent elevated summit temperatures, and persistent gas and steam emissions from varying vent locations (figure 40) suggests that the summit dome has remained active through 2019.
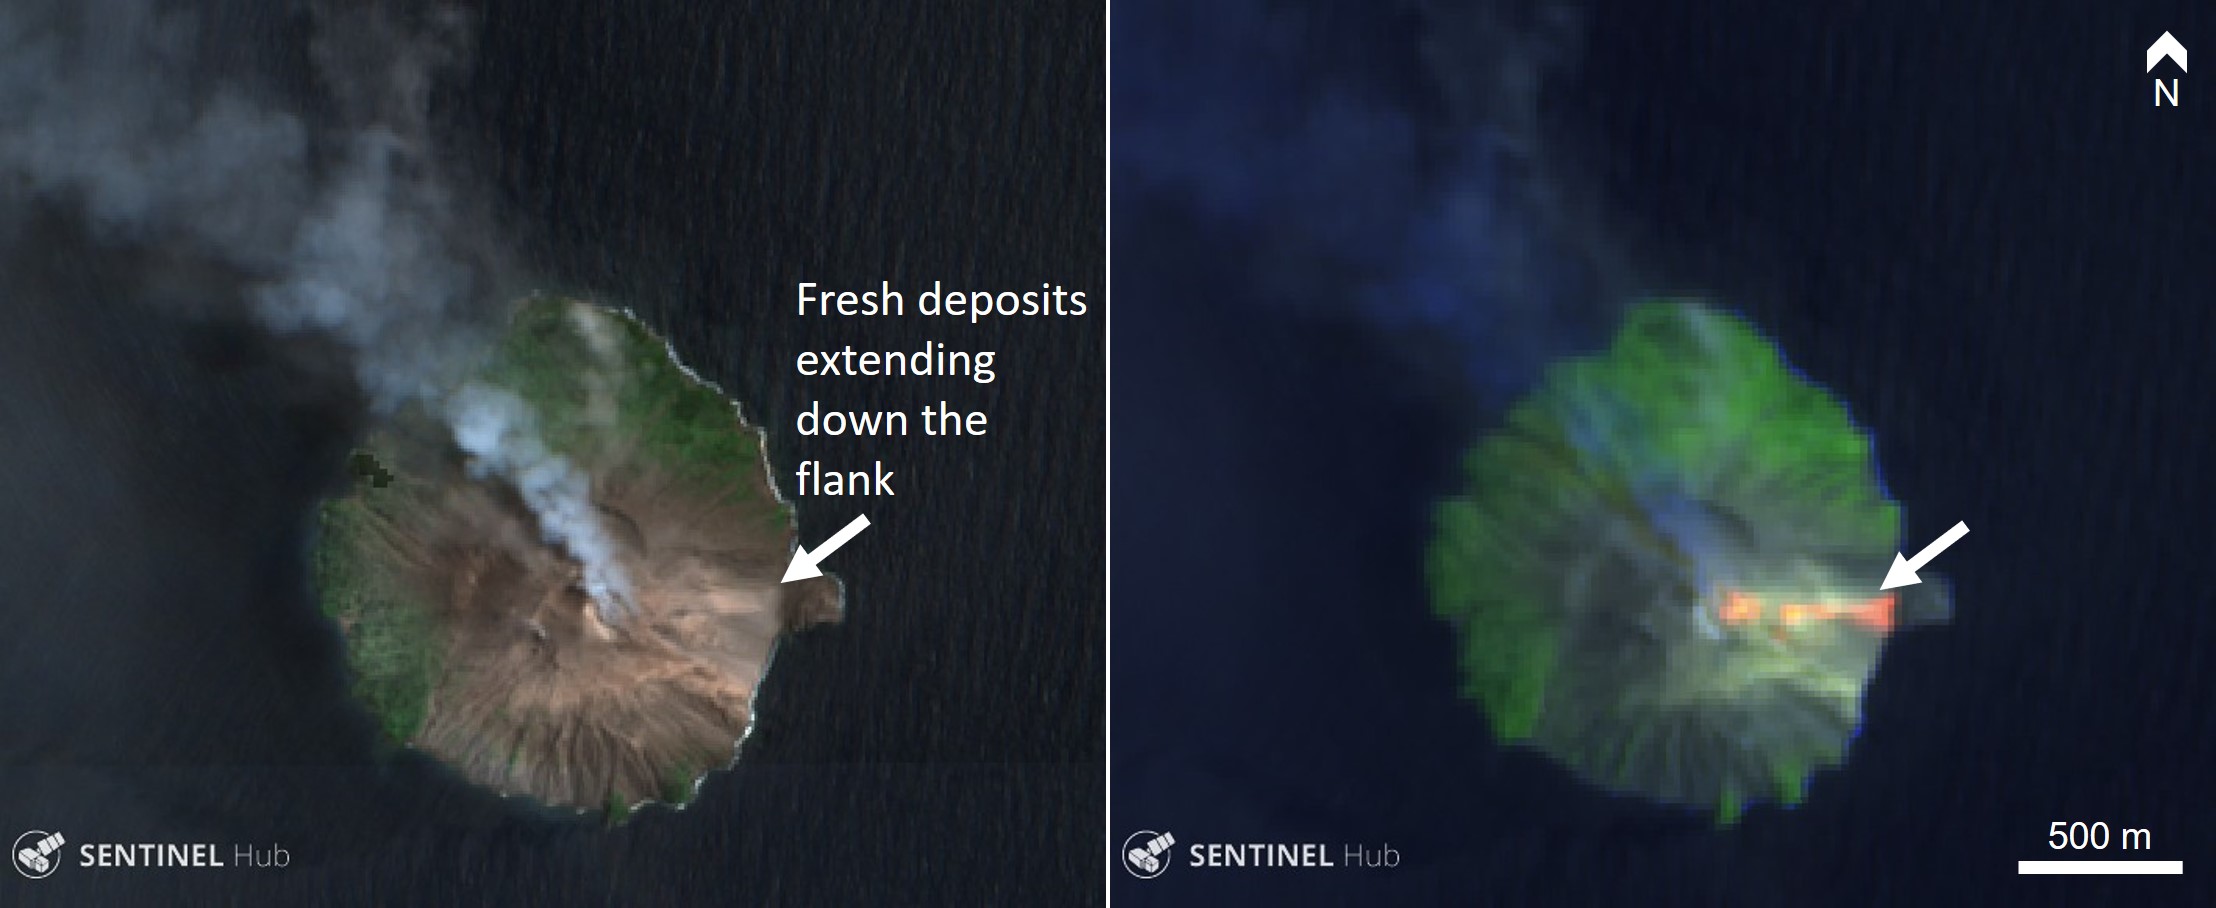 |
Figure 40. Sentinel-2 visible and thermal satellite images acquired on 7 September 2019 show fresh deposits down the east flank of Kadovar. They appear as a lighter colored area in visible, and show as a hot area (orange) in thermal data. Sentinel-2 natural color (bands 4, 3, 2) and false color (urban) satellite image (bands 12, 11, 4) courtesy of Sentinel-Hub Playground. |
Thermal anomalies and emissions continued through to the end of 2019 (figure 41). A tour group witnessed an explosion producing an ash plume at around 1800 on 13 November (figure 42). While the ash plume erupted near-vertically above the island, a more diffuse gas plume rose from multiple vents on the summit dome and dispersed at a lower altitude.
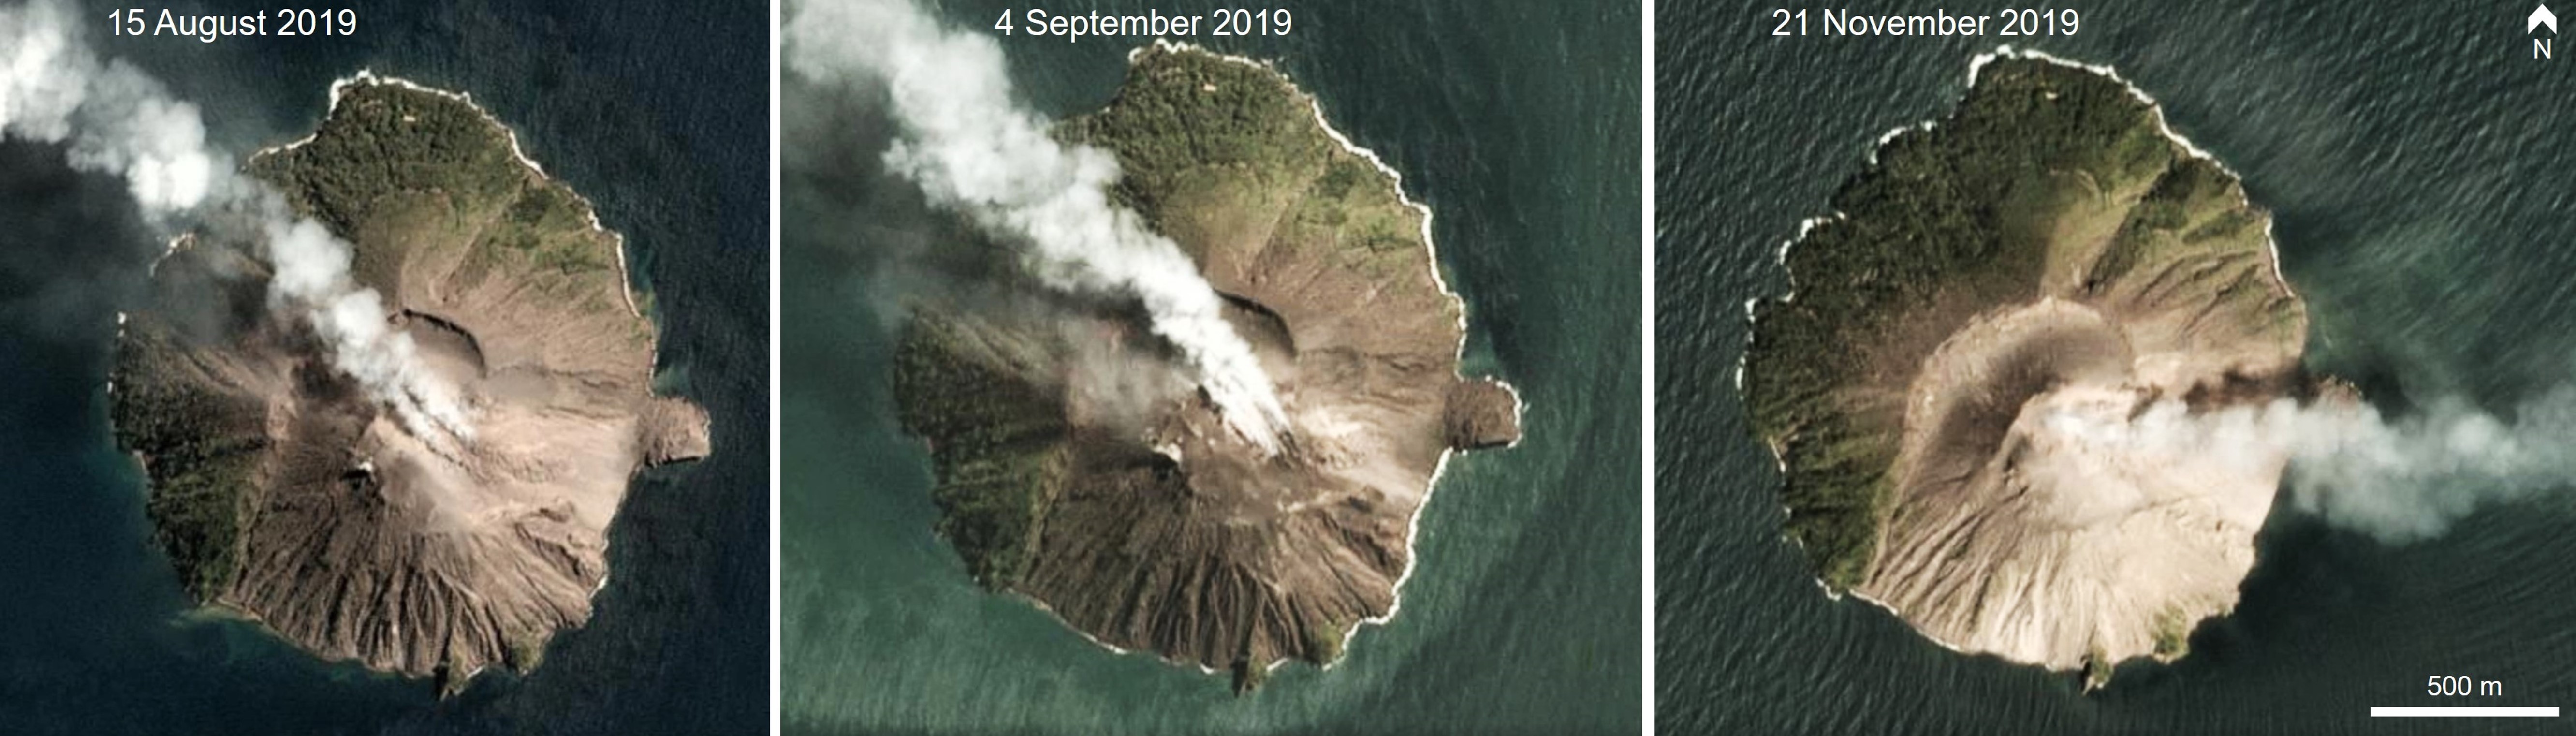 |
Figure 41. The summit area of Kadovar emitting gas-and-steam plumes in August, September, and November 2019. The plumes are persistent in satellite images throughout May through December and there is variation in the number and locations of the source vents. PlanetScope satellite images copyright Planet Labs 2019. |
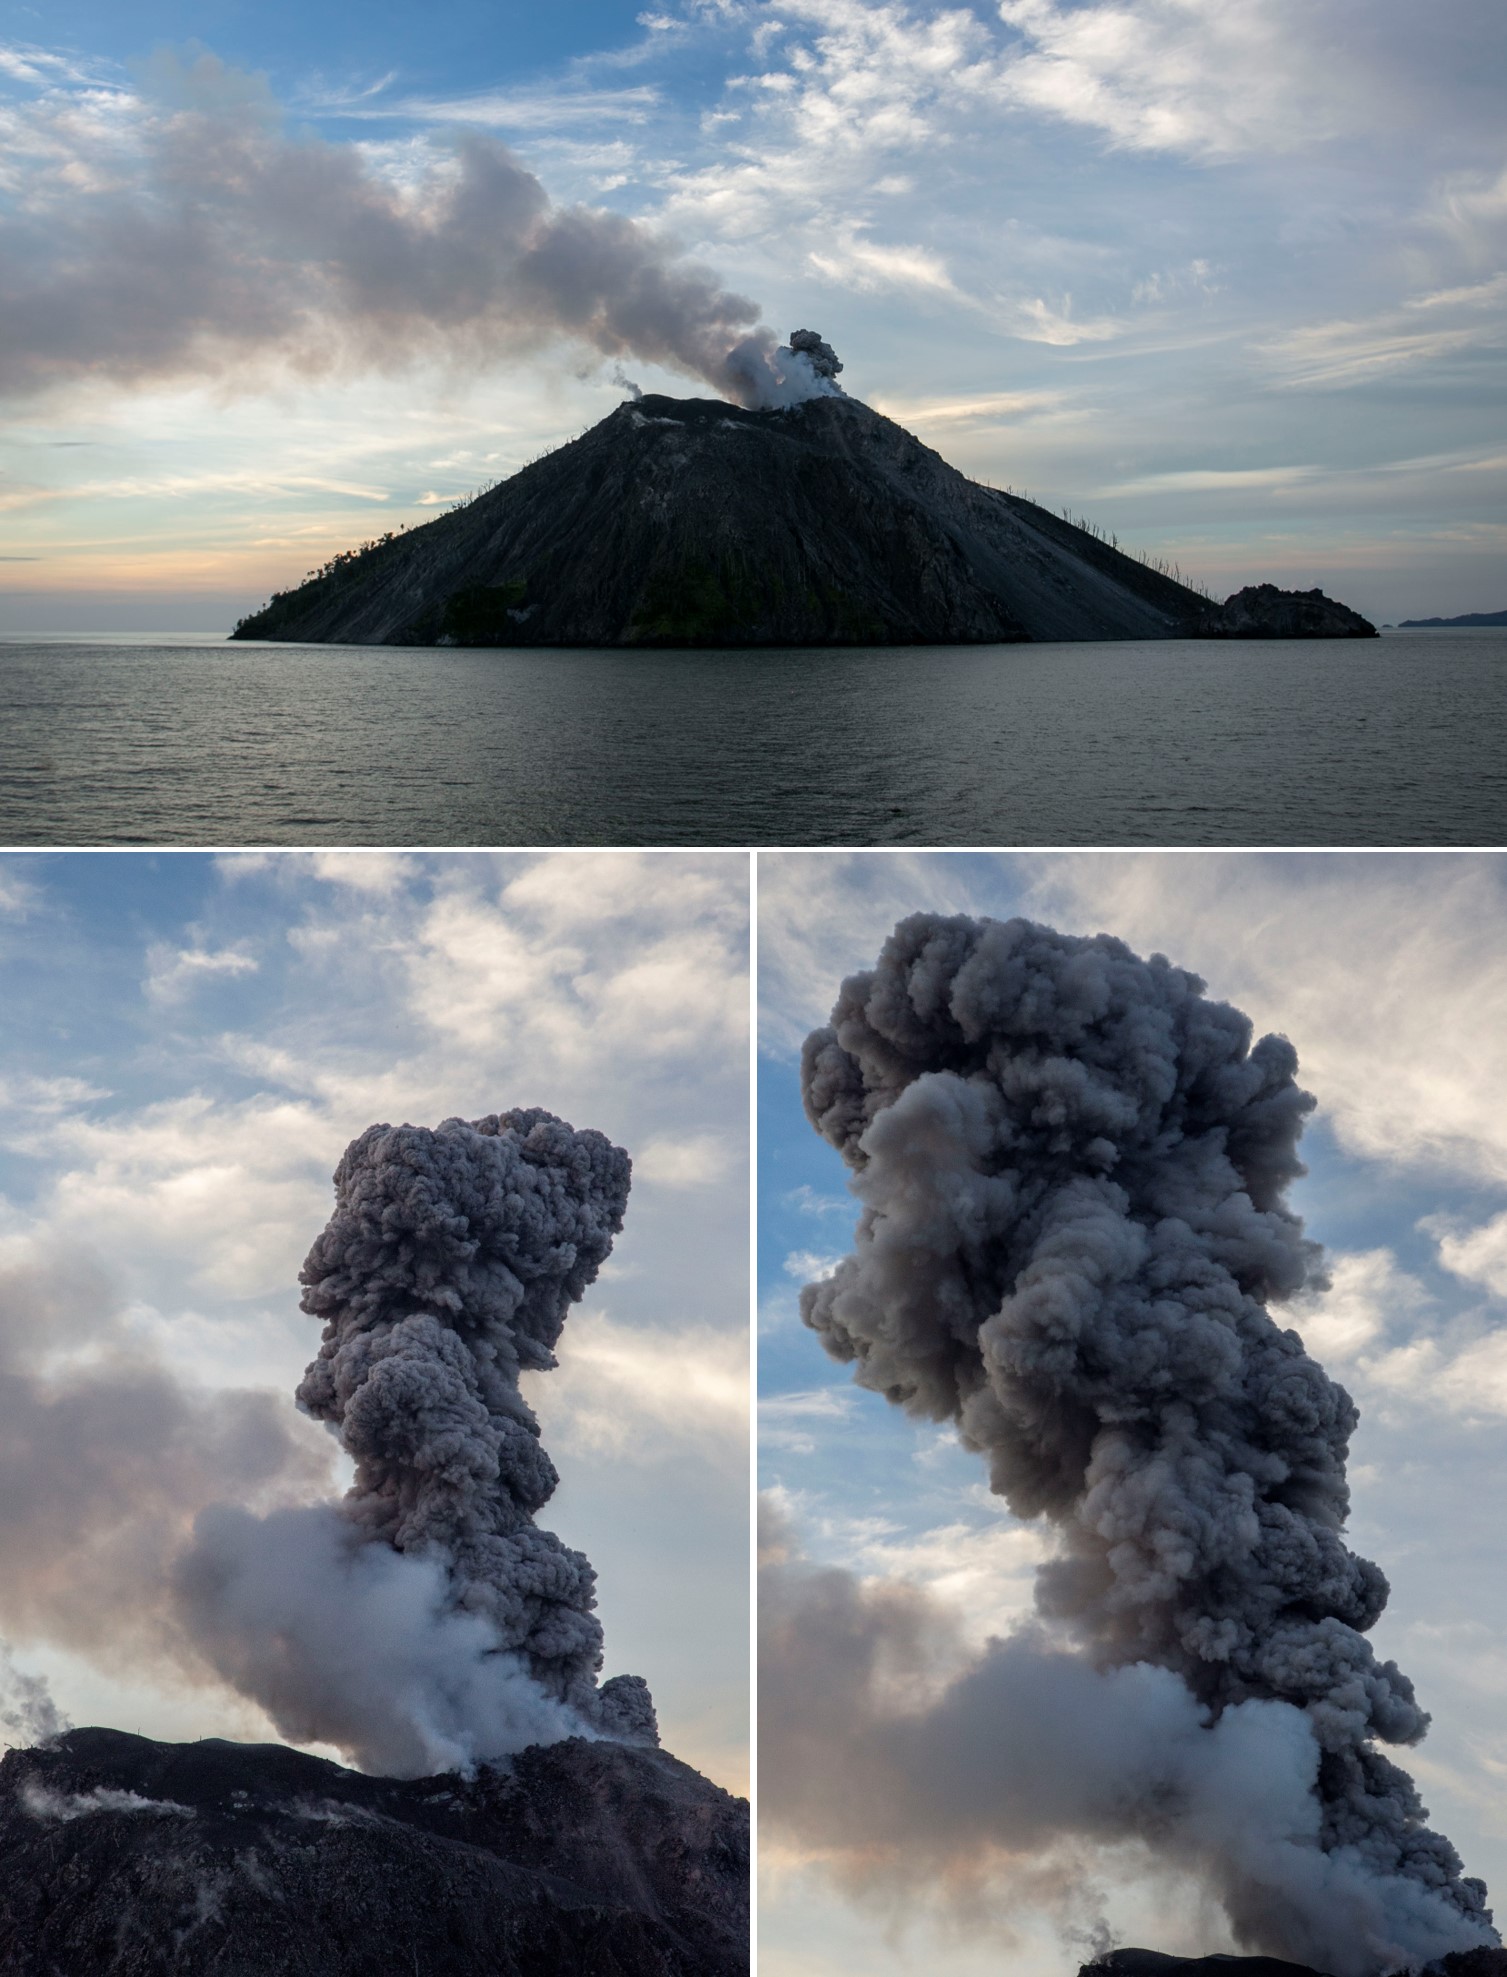 |
Figure 42. An ash plume and a lower gas plume rise during an eruption of Kadovar on 13 November 2019. The summit lava dome is visibly degassing to produce the white gas plume. Copyrighted photos by Chrissie Goldrick, used with permission. |
While gas plumes were visible throughout May-December 2019 (figure 43), SO2 plumes were difficult to detect in NASA SO2 images due to the activity of nearby Manam volcano. The MIROVA thermal detection system shows continued elevated temperatures through to early December, with an increase during May-June (figure 44). Sentinel-2 thermal images showed elevated temperatures through to the end of December but at a lower intensity than previous months.
 |
Figure 43. This photo of the southeast side Kadovar on 13 November 2019 shows a persistent low-level gas plume blowing towards the left and a more vigorous plume is visible near the crater. This is an example of the persistent plume visible in satellite imagery throughout July-December 2019. Copyrighted photo by Chrissie Goldrick, used with permission. |
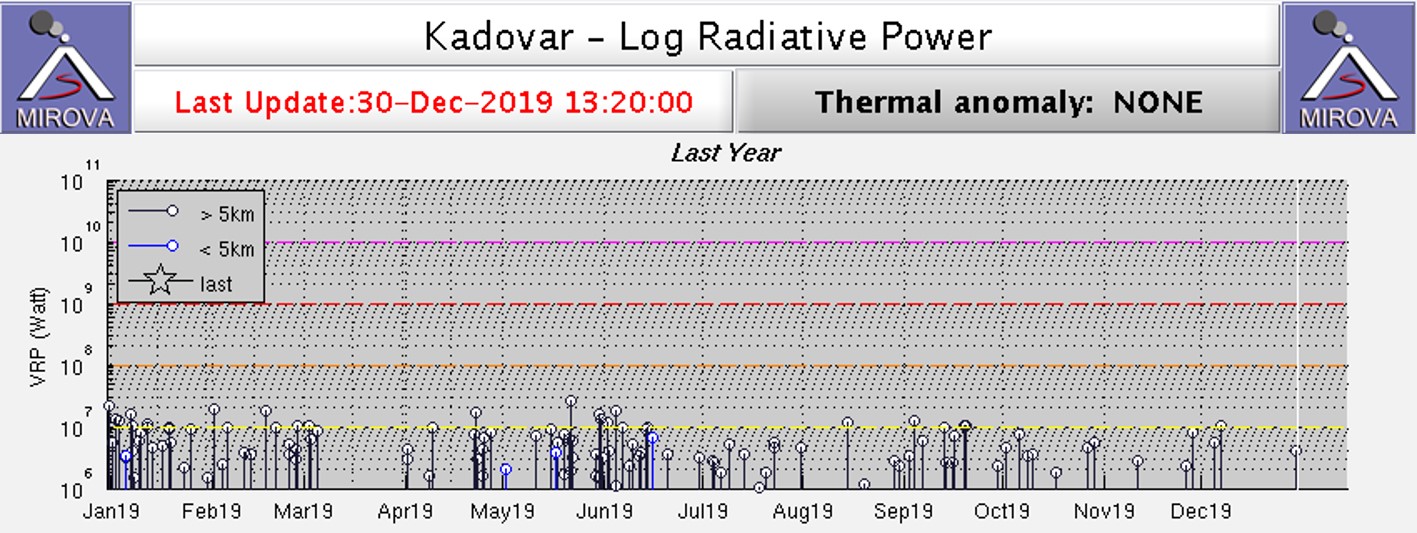 |
Figure 44. The MIROVA plot of radiative power at Kadovar shows thermal anomalies throughout 2019 with some variations in frequency. Note that while the black lines indicate that the thermal anomalies are greater than 5 km from the vent, the designated summit location is inaccurate so these are actually a the summit crater and on the E flank. Courtesy of MIROVA. |
Information Contacts: Hawai'i Institute of Geophysics and Planetology (HIGP) - MODVOLC Thermal Alerts System, School of Ocean and Earth Science and Technology (SOEST), Univ. of Hawai'i, 2525 Correa Road, Honolulu, HI 96822, USA (URL: http://modis.higp.hawaii.edu/); Planet Labs, Inc. (URL: https://www.planet.com/); Sentinel Hub Playground (URL: https://www.sentinel-hub.com/explore/sentinel-playground); NASA Worldview (URL: https://worldview.earthdata.nasa.gov); Chrissie Goldrick, Australian Geographic, Level 7, 54 Park Street, Sydney, NSW 2000, Australia (URL: https://www.australiangeographic.com.au/).
Intermittent ash plumes and persistent summit thermal anomalies, January-June 2020
The steeply sloped 1.4-km-diameter Kadovar Island is located in the Bismark Sea offshore from the mainland of Papua New Guinea about 25 km NNE from the mouth of the Sepik River. Its first confirmed observed eruption began in early January 2018, with ash plumes and lava extrusion resulting in the evacuation of around 600 residents from the N side of the island (BGVN 43:03). A dome appeared at the base of the E flank during March-May 2018 (Planka et al., 2019); by November activity had migrated to a new dome growing near the summit on the E flank. Pulsating steam plumes, thermal anomalies, and periodic ash emissions continued throughout 2019 (BGVN 44:05, 45:01), and from January-June 2020, the period covered in this report. Information was provided by the Rabaul Volcano Observatory (RVO), the Darwin Volcanic Ash Advisory Center (VAAC), satellite sources, and photographs from visitors.
Activity during January-June 2020. Intermittent ash plumes, pulsating gas and steam plumes, and thermal anomalies continued at Kadovar during January-June 2020. MIROVA thermal data suggested persistent low-level anomalies throughout the period (figure 45). Sentinel-2 satellite data confirmed thermal anomalies at the summit on 5 and 25 January 2020, and an ash emission on 20 January (figure 46). Persistent pulsating steam plumes were visible whenever the skies were clear enough to see the volcano.
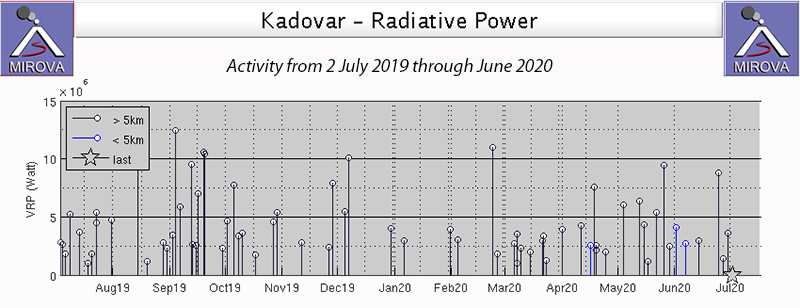 |
Figure 45. Persistent low-level thermal activity at Kadovar was recorded in the MIROVA graph of radiative power from 2 July 2019 through June 2020. The island location is mislocated in the MIROVA system by about 5.5 km SE due to older mis-registered imagery; the anomalies are all on the island. Courtesy of MIROVA. |
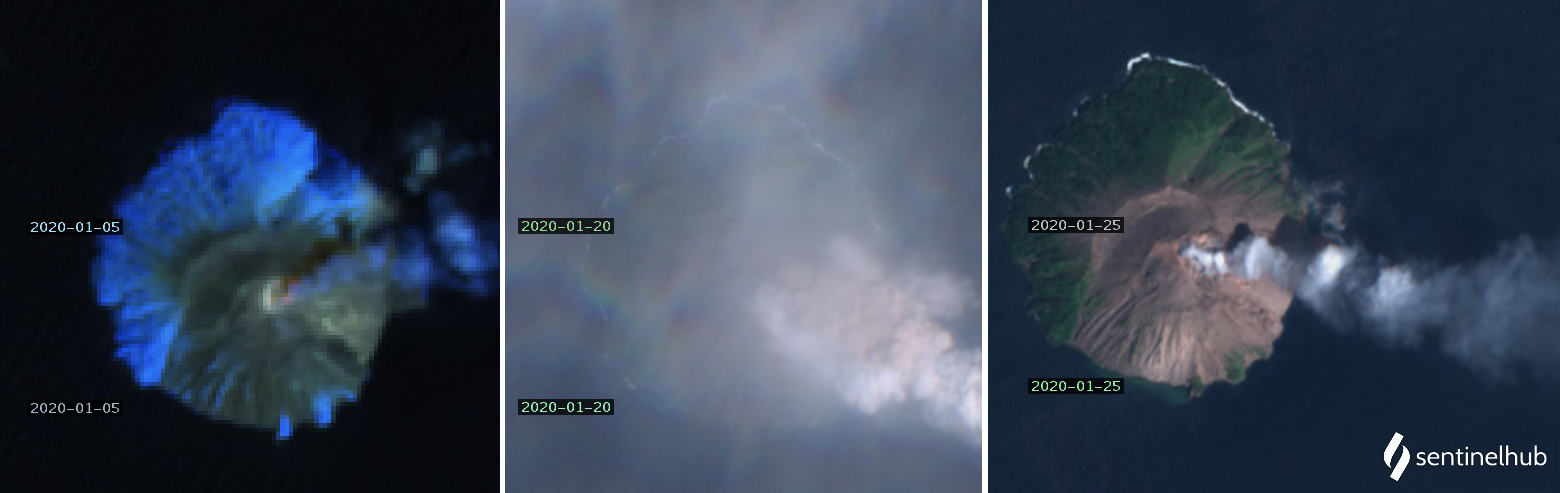 |
Figure 46. Sentinel-2 satellite data confirmed thermal anomalies at the summit of Kadovar on 5 (left) and 25 January 2020, and an ash emission and steam plume that drifted SE on 20 January (center). Pulsating steam-and-gas emissions left a trail in the atmosphere drifting SE for several kilometers on 25 January (right). Left image uses Atmospheric penetration rendering (bands 12, 11, 8a), center and right images use Natural color rendering (bands 4, 3, 2). Courtesy of Sentinel Hub Playground. |
On 2 February 2020 the Darwin VAAC reported a minor eruption plume that rose to 1.5 km altitude and drifted ESE for a few hours. Another plume was clearly discernible in satellite imagery on 5 February at 2.1 km altitude moving SE. RVO issued an information bulletin on 7 February reporting that, since the beginning of January, the eruption had continued with frequent Vulcanian explosions from the Main Vent with a recurrence interval of hours to days. Rocks and ash were ejected 300-400 m above the vent. Rumbling could be heard from Blupblup (Rubrub) island, 15 km E, and residents there also observed incandescence at night. On clear days the plume was sometimes visible from Wewak, on the mainland 100 km W. Additional vents produced variable amounts of steam. The Darwin VAAC reported continuous volcanic ash rising to 1.5 km on 22 February that extended ESE until it was obscured by a meteoric cloud; it dissipated early the next day. A small double ash plume and two strong thermal anomalies at the summit were visible in satellite imagery on 24 February (figure 47).
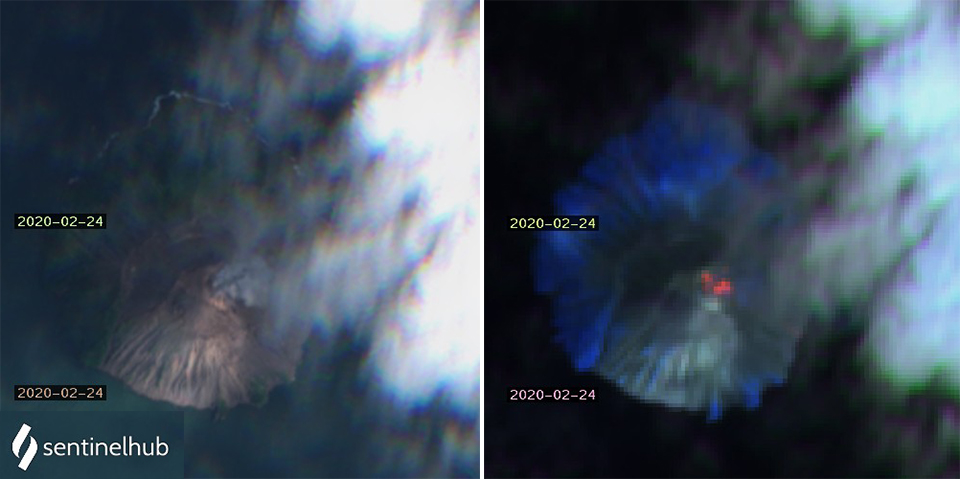 |
Figure 47. Ash emissions and thermal anomalies continued at Kadovar during February 2020. Two small plumes of ash or dense steam rose from the summit on 24 February 2020, seen in this Natural color rendering (bands 4, 3, 2) on the left. The same image rendered in Atmospheric penetration (bands 12, 11, 8a) on the right shows two thermal anomalies in the same locations as the ash plumes. Courtesy of Sentinel Hub Playground. |
The Darwin VAAC reported continuous ash emissions beginning on 13 March 2020 that rose to 1.5 km altitude and drifted SE. The plume was visible intermittently in satellite imagery for about 36 hours before dissipating. During April, pulsating steam plumes rose from two vents at the summit, and thermal anomalies appeared at both vents in satellite data (figure 48). Small but distinct SO2 anomalies were visible in satellite data on 15 and 16 April (figure 49).
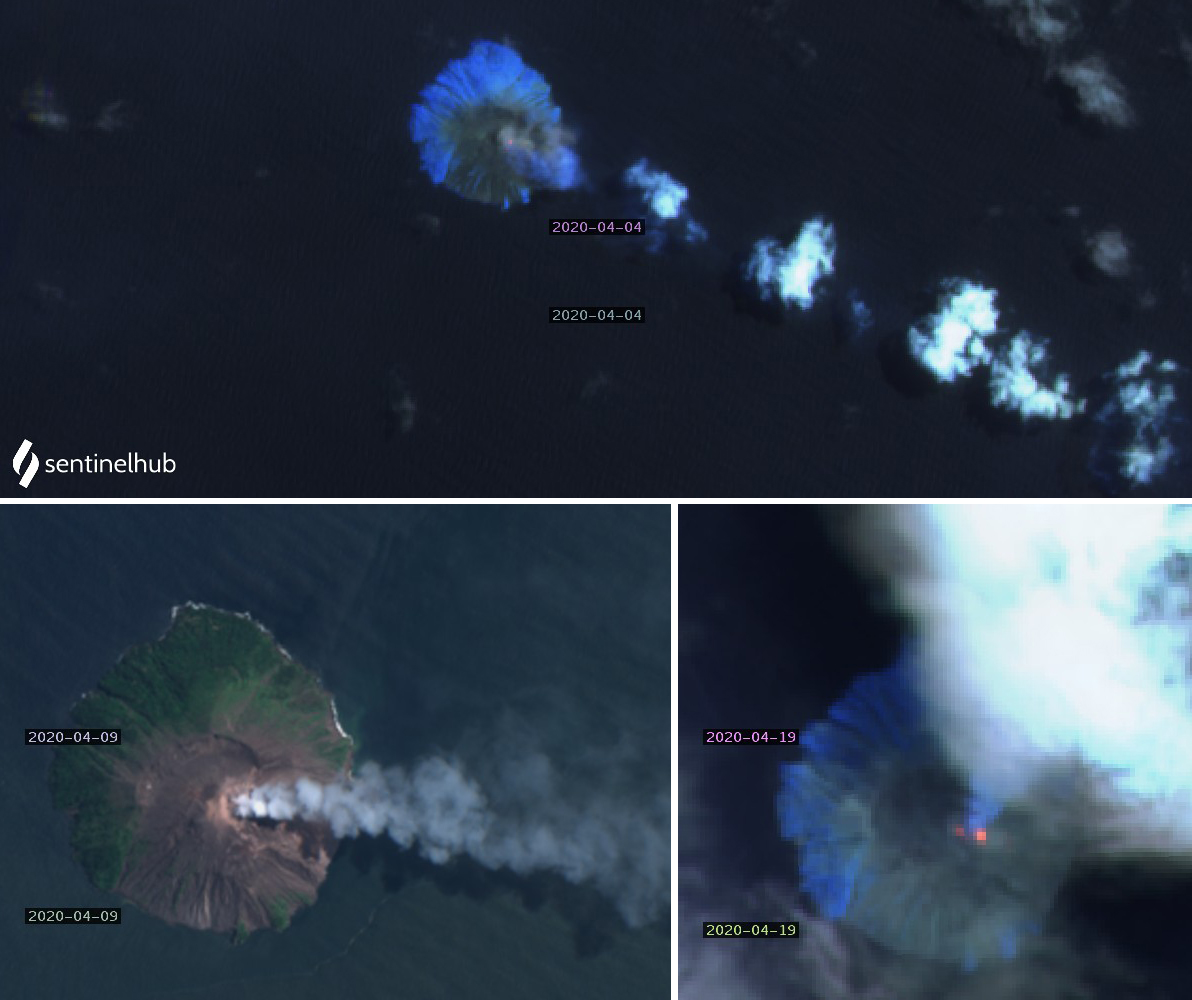 |
Figure 48. Steam plumes and thermal anomalies continued at Kadovar during April 2020. Top: A thermal anomaly at the summit accompanied pulsating steam plumes that drifted several kilometers SE before dissipating on 4 April 2020. Bottom left: Two gas-and-steam plumes drifted E from the summit on 9 April. Bottom right: Two adjacent thermal anomalies were present near the summit on 19 April. Top and bottom right images use Atmospheric penetration rendering (bands 12, 11, 8a), bottom left image uses Natural color rendering (bands 4, 3, 2). Courtesy of Sentinel Hub Playground. |
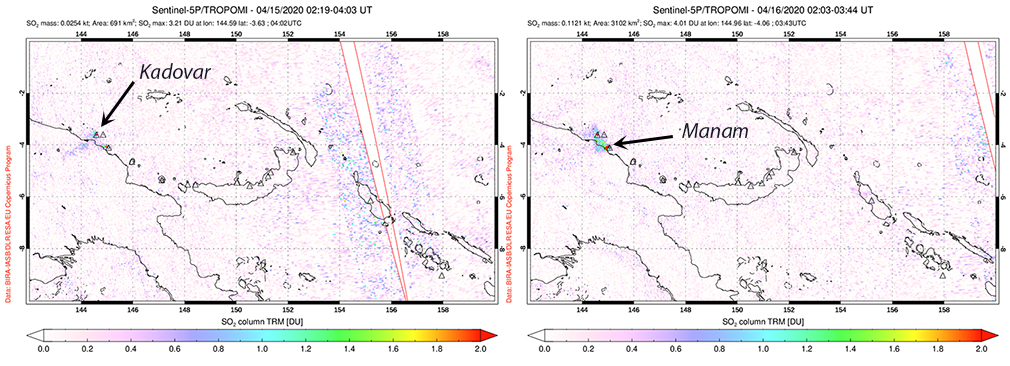 |
Figure 49. Small but distinct SO2 anomalies were detected at Kadovar on 15 and 16 April 2020 with the TROPOMI instrument on the Sentinel-5P satellite. Nearby Manam often produces larger SO2 plumes that obscure evidence of activity at Kadovar. Courtesy of NASA Global Sulfur Dioxide Monitoring Page. |
Two summit vents remained active throughout May and June 2020, producing pulsating steam plumes that were visible for tens of kilometers and thermal anomalies visible in satellite data (figure 50). A strong thermal anomaly was visible beneath meteoric clouds on 8 June.
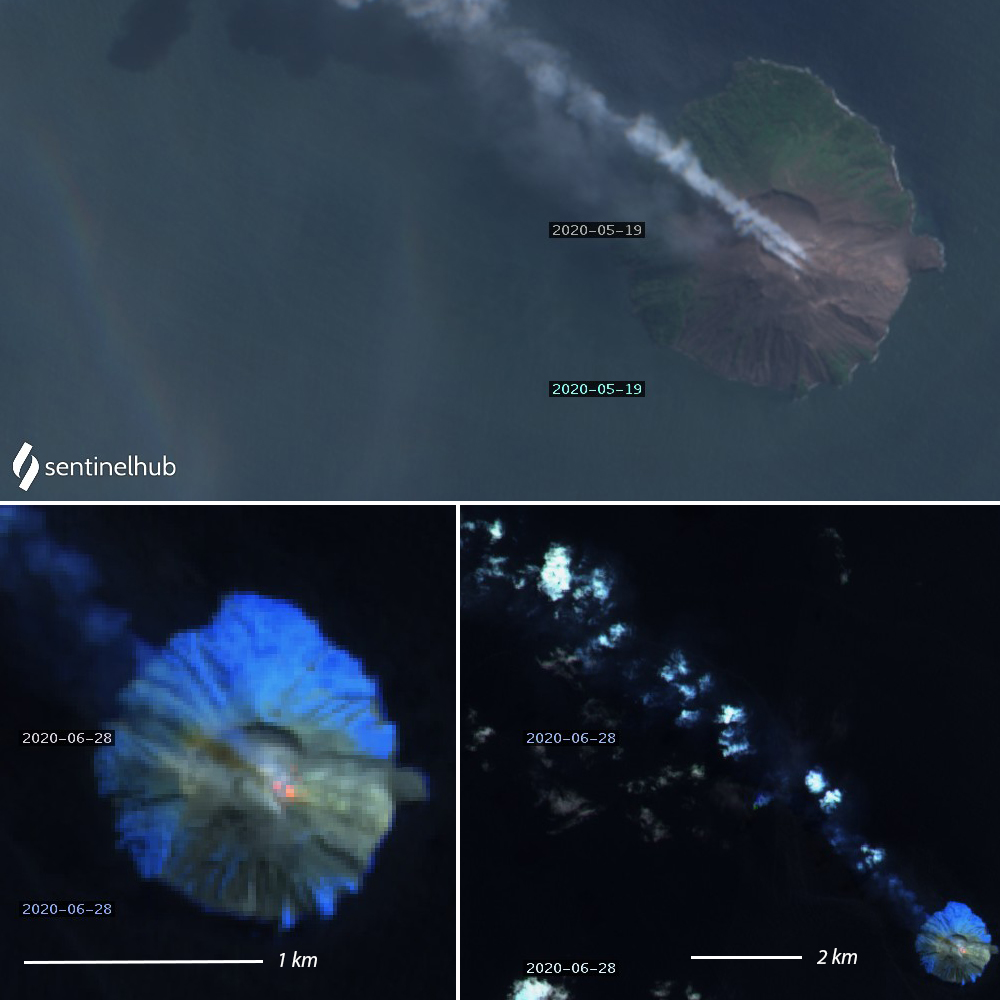 |
Figure 50. During May and June 2020 thermal and plume activity continued at Kadovar. Top: Gas-and-steam plumes drifted NW from two sources at the summit of Kadovar on 19 May 2020. Bottom left: Two thermal anomalies marked the E rim of the summit crater on 28 June 2020. Bottom right: A zoomed out view of the same 28 June image shows pulsating steam plumes drifting 10 km NW from Kadovar. Top image is Natural color rendering (bands 4, 3, 2). Bottom images are Atmospheric penetration rendering (bands 12, 11, 8a) of Sentinel-2 images. Courtesy of Sentinel Hub Playground. |
Visitor observations on 21 October 2019. Claudio Jung visited Kadovar on 21 October 2019. Shortly before arriving on the island an ash plume rose tens of meters above the summit and drifted W (figure 51). From the NW side of the summit crater rim, Jung saw the actively growing dome on the side of a larger dome, and steam and gas issuing from the growing dome (figure 52). The crater rim was covered with dead vegetation, ash, and large bombs from recent explosions (figure 53). The summit dome had minor fumarolic activity around the summit area and dead vegetation halfway up the flank (figure 54) while the fresh blocky lava of the actively growing dome on the E side of the summit produced significant steam and gas emissions. The growing dome produced periodic pulses of dense steam during his visit (figure 55).
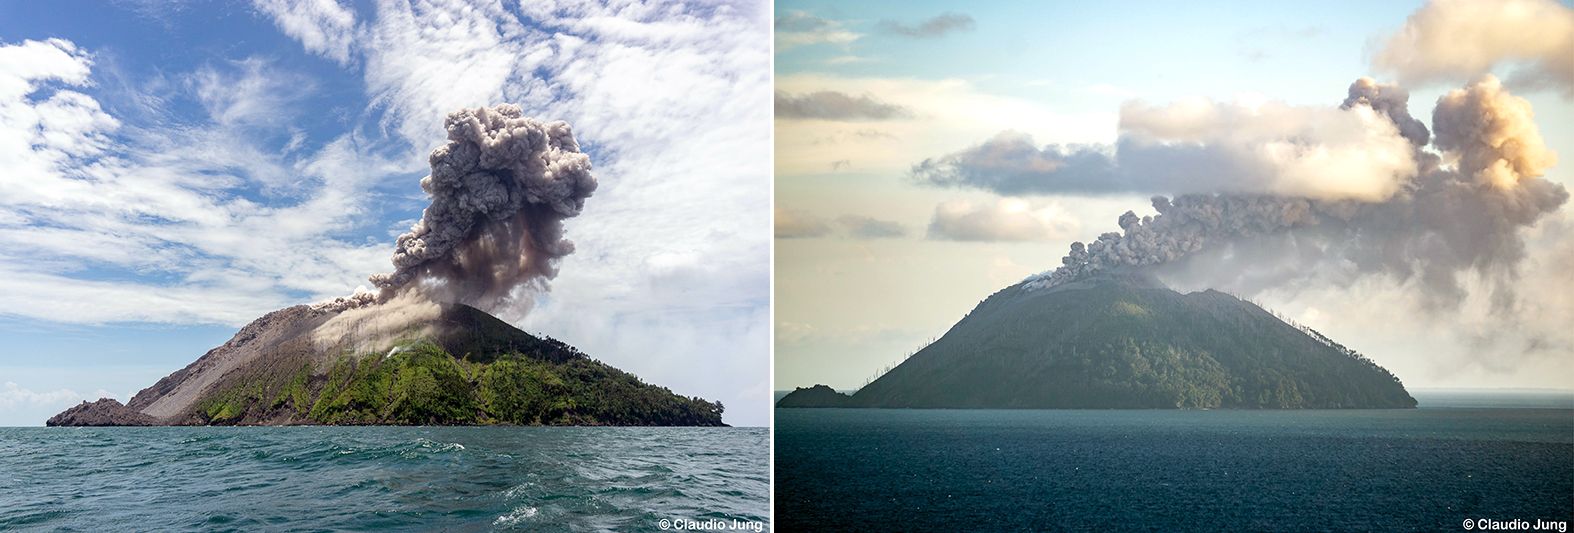 |
Figure 51. Views looking S show the shoreline dome at the base of the E flank of Kadovar that was active during March-May 2018 (left), and an ash plume drifting W from the summit dome located on the E side of the summit crater (right) on 21 October 2019. Copyrighted photos courtesy of Claudio Jung, used with permission. |
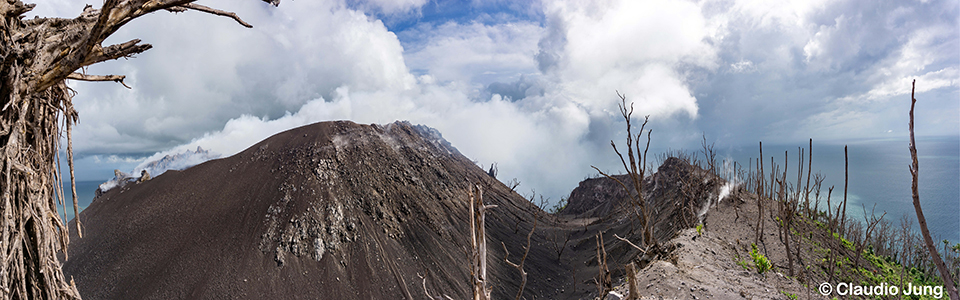 |
Figure 52. A panorama looking SE from the crater rim of Kadovar on 21 October 2019 shows the actively growing dome on the far left with a narrow plume of steam and gas being emitted. A large dome fills the summit crater; the crater rim is visible on the right. Copyrighted photo courtesy of Claudio Jung, used with permission. |
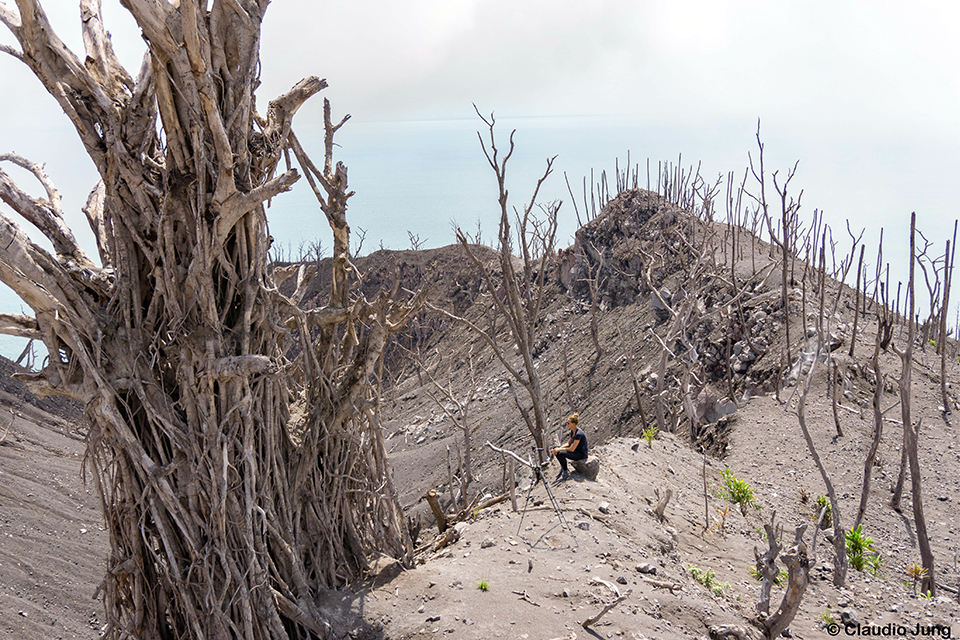 |
Figure 53. The crater rim of Kadovar on 21 October 2019 was covered with dead vegetation, ash, and large bombs from recent explosions. Person is sitting on a large bomb; weak fumarolic activity is visible along the rim. Copyrighted photo courtesy of Claudio Jung, used with permission. |
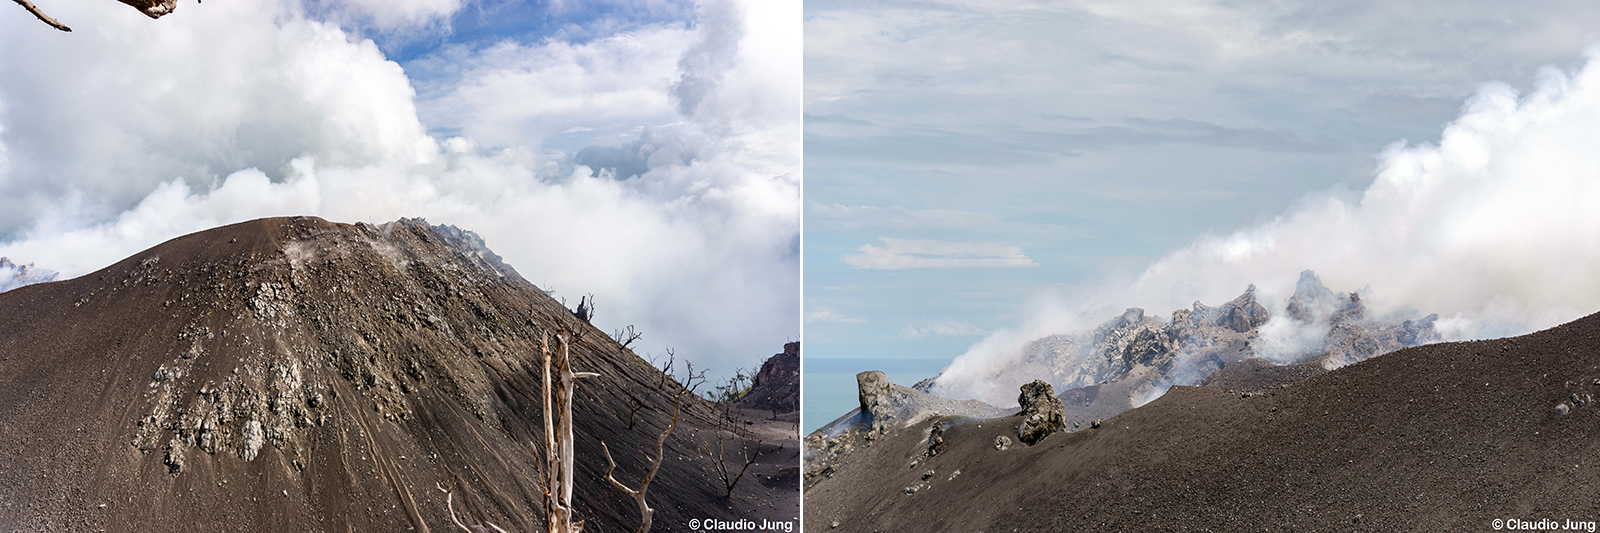 |
Figure 54. The summit dome of Kadovar on 21 October 2019 had minor fumarolic activity around most of its summit and dead vegetation half-way up the flank (left). The dead tree stumps suggest that vegetation covered the lower half of the dome prior to the eruption that began in January 2018. The fresh blocky lava of the actively growing dome on the E side of the summit dome produced significant steam and gas emissions (right). Copyrighted photos courtesy of Claudio Jung, used with permission. |
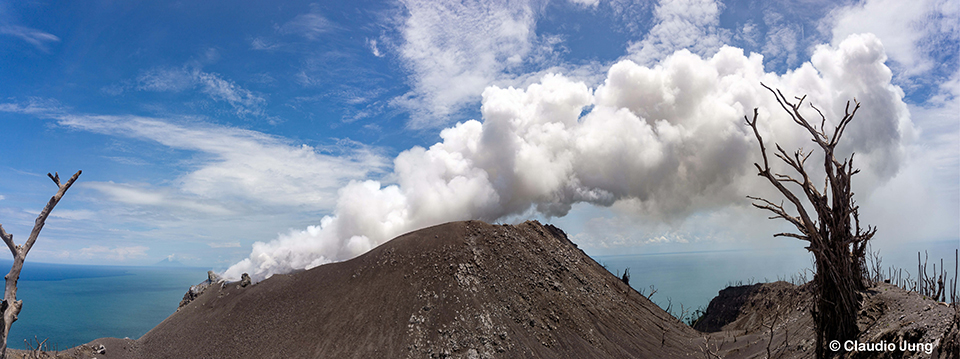 |
Figure 55. Dense steam from the growing dome on the E side of the summit drifted W from Kadovar on 21 October 2019. Copyrighted photo courtesy of Claudio Jung, used with permission. |
Reference: Planka S, Walter T R, Martinis S, Cescab S, 2019, Growth and collapse of a littoral lava dome during the 2018/19 eruption of Kadovar Volcano, Papua New Guinea, analyzed by multi-sensor satellite imagery, Journal of Volcanology and Geothermal Research, v. 388, 15 December 2019, 106704, https://doi.org/10.1016/j.jvolgeores.2019.106704.
Information Contacts: Rabaul Volcano Observatory (RVO), Geohazards Management Division, Department of Mineral Policy and Geohazards Management (DMPGM), PO Box 3386, Kokopo, East New Britain Province, Papua New Guinea; Darwin Volcanic Ash Advisory Centre (VAAC), Bureau of Meteorology, Northern Territory Regional Office, PO Box 40050, Casuarina, NT 0811, Australia (URL: http://www.bom.gov.au/info/vaac/); Sentinel Hub Playground (URL: https://www.sentinel-hub.com/explore/sentinel-playground); MIROVA (Middle InfraRed Observation of Volcanic Activity), a collaborative project between the Universities of Turin and Florence (Italy) supported by the Centre for Volcanic Risk of the Italian Civil Protection Department (URL: http://www.mirovaweb.it/); NASA Global Sulfur Dioxide Monitoring Page, Atmospheric Chemistry and Dynamics Laboratory, NASA Goddard Space Flight Center (NASA/GSFC), 8800 Greenbelt Road, Goddard, Maryland, USA (URL: https://so2.gsfc.nasa.gov/); Claudio Jung (URL: https://www.instagram.com/jung.claudio/).
Occasional ash and gas-and-steam plumes along with summit thermal anomalies
Kadovar is located in the Bismark Sea offshore from the mainland of Papua New Guinea about 25 km NNE from the mouth of the Sepik River. Its first confirmed eruption began in early January 2018, characterized by ash plumes and a lava extrusion that resulted in the evacuation of around 600 residents from the N side of the island (BGVN 43:03). Activity has recently consisted of intermittent ash plumes, gas-and-steam plumes, and thermal anomalies (BGVN 45:07). Similar activity continued during this reporting period of July-December 2020 using information from the Rabaul Volcano Observatory (RVO), the Darwin Volcanic Ash Advisory Center (VAAC), and various satellite data.
RVO issued an information bulletin on 15 July reporting minor eruptive activity during 1-5 July with moderate light-gray ash emissions rising a few hundred meters above the Main Crater. On 5 July activity intensified; explosions recorded at 1652 and 1815 generated a dense dark gray ash plume that rose 1 km above the crater and drifted W. Activity subsided that day, though fluctuating summit crater incandescence was visible at night. Activity increased again during 8-10 July, characterized by explosions detected on 8 July at 2045, on 9 July at 1145 and 1400, and on 10 July at 0950 and 1125, each of which produced a dark gray ash plume that rose 1 km above the crater. According to Darwin VAAC advisories issued on 10, 16, and 30 July ash plumes were observed rising to 1.5-1.8 km altitude and drifting NW.
Gas-and-steam emissions and occasional ash plumes were observed in Sentinel-2 satellite imagery on clear weather days during August through December (figure 56). Ash plumes rose to 1.2 and 1.5 km altitude on 3 and 16 August, respectively, and drifted NW, according to Darwin VAAC advisories. On 26 August an ash plume rose to 2.1 km altitude and drifted WNW before dissipating within 1-2 hours. Similar activity was reported during September-November, according to several Darwin VAAC reports; ash plumes rose to 0.9-2.1 km altitude and drifted mainly NW. VAAC notices were issued on 12 and 22 September, 4, 7-8, and 18 October, and 18 November. A single MODVOLC alert was issued on 27 November.
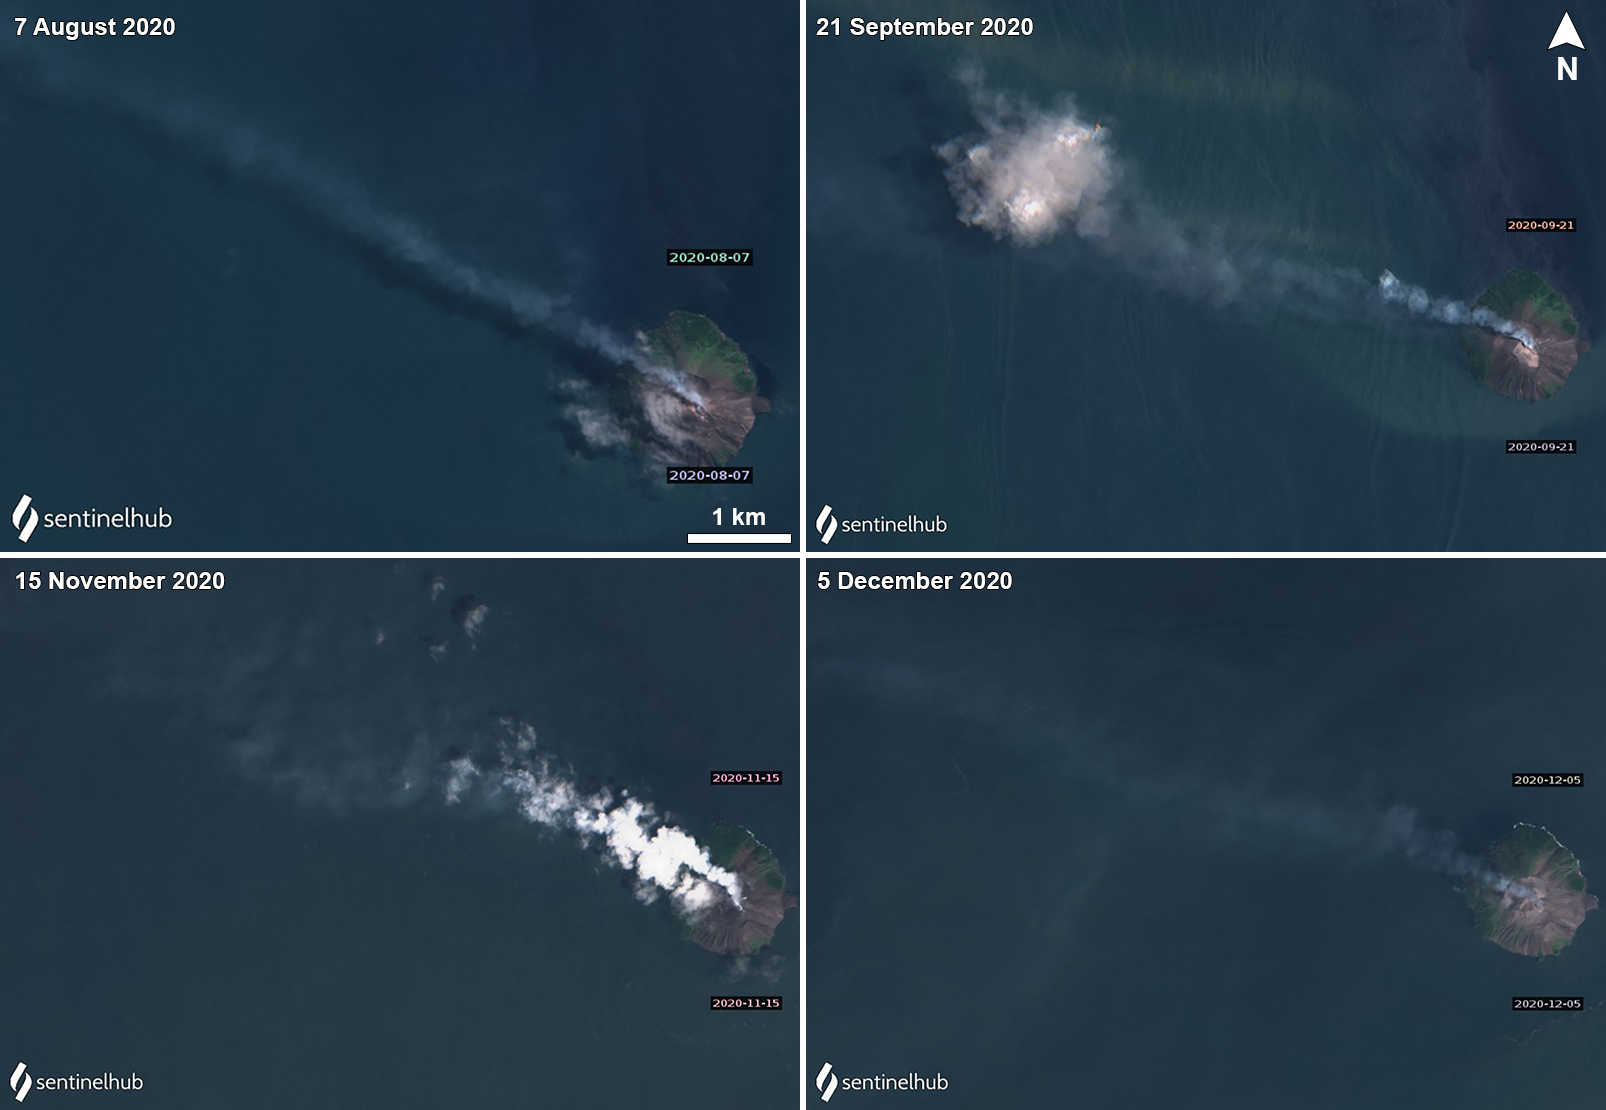 |
Figure 56. Sentinel-2 satellite data showing a consistent gas-and-steam plume originating from the summit of Kadovar during August-December 2020 and drifting NW. On 21 September (top right) a gray plume was seen drifting several kilometers from the island to the NW. Images with “Natural color” (bands 4, 3, 2) rendering; courtesy of Sentinel Hub Playground. |
MIROVA (Middle InfraRed Observation of Volcanic Activity) analysis of MODIS satellite data shows intermittent low-power anomalies during July through December 2020 (figure 57). Some of this thermal activity in the summit crater was observed in Sentinel-2 thermal satellite imagery, accompanied by gas-and-steam emissions that drifted primarily NW (figure 58).
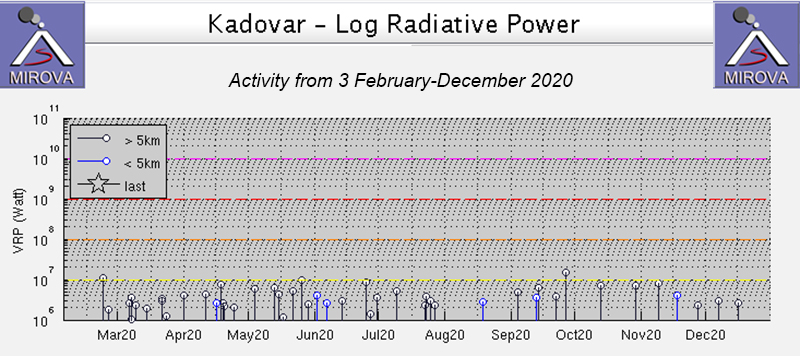 |
Figure 57. Intermittent low-power thermal anomalies at Kadovar were detected in the MIROVA graph (Log Radiative Power) during July through December 2020. The island location is mislocated in the MIROVA system by about 5.5 km SE due to older mis-registered imagery; the anomalies are all on the island. Courtesy of MIROVA. |
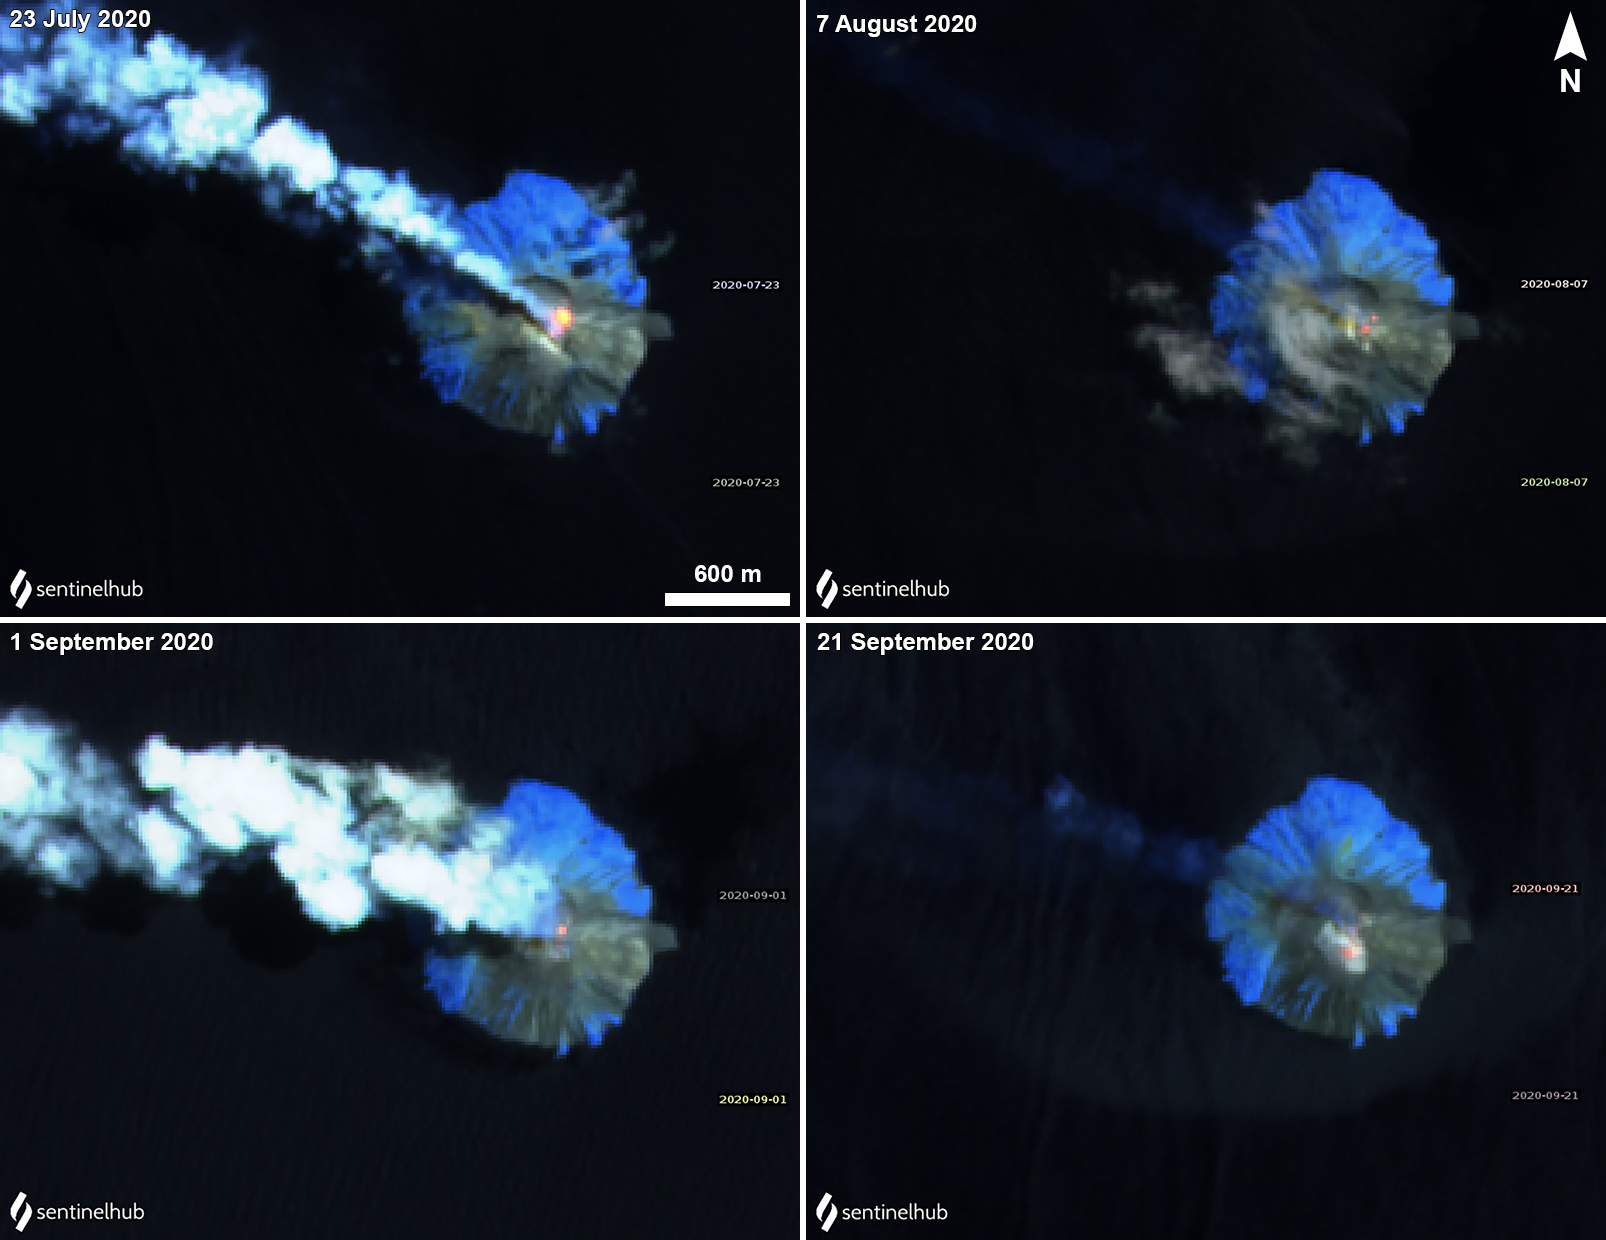 |
Figure 58. Sentinel-2 satellite data showing thermal anomalies at the summit of Kadovar on 23 July (top left), 7 August (top right), 1 September (bottom left), and 21 September (bottom right) 2020, occasionally accompanied by a gas-and-steam plume drifting dominantly NW. Two thermal anomalies were visible on the E rim of the summit crater on 23 July (top left) and 7 August (top right). Images with “Atmospheric penetration” (bands 12, 11, 8A) rendering; courtesy of Sentinel Hub Playground. |
Information Contacts: Rabaul Volcano Observatory (RVO), Geohazards Management Division, Department of Mineral Policy and Geohazards Management (DMPGM), PO Box 3386, Kokopo, East New Britain Province, Papua New Guinea; Darwin Volcanic Ash Advisory Centre (VAAC), Bureau of Meteorology, Northern Territory Regional Office, PO Box 40050, Casuarina, NT 0811, Australia (URL: http://www.bom.gov.au/info/vaac/); MIROVA (Middle InfraRed Observation of Volcanic Activity), a collaborative project between the Universities of Turin and Florence (Italy) supported by the Centre for Volcanic Risk of the Italian Civil Protection Department (URL: http://www.mirovaweb.it/); Hawai'i Institute of Geophysics and Planetology (HIGP) - MODVOLC Thermal Alerts System, School of Ocean and Earth Science and Technology (SOEST), Univ. of Hawai'i, 2525 Correa Road, Honolulu, HI 96822, USA (URL: http://modis.higp.hawaii.edu/); Sentinel Hub Playground (URL: https://www.sentinel-hub.com/explore/sentinel-playground).
Intermittent ash plumes and thermal anomalies during January-August 2021
Kadovar, located in the Bismark Sea offshore from the island of New Guinea about 25 km NNE from the mouth of the Sepik River, has been erupting since January 2018 with intermittent ash and gas-and-steam plumes along with weak summit thermal anomalies (BGVN 46:01). Similar activity continued during this reporting period of January through August 2021 based on information from the Darwin Volcanic Ash Advisory Center (VAAC) and satellite data.
Relatively low activity during this reporting period consisted of primarily weak thermal anomalies in the summit crater and small gas-and-ash emissions (figure 59). On 3 and 7 January discrete ash puffs seen in HIMAWARI-8 satellite images rose to 1.5 km altitude and drifted SW and W, respectively; both dissipated within six hours. Ash plumes on 5 and 6 January rose to 1.8 km altitude and drifted NW. Occasional ash plumes were detected during March, rising to 1.5 km altitude and drifting W, based on satellite imagery. On 15 April an ash plume that rose to 1.8 km altitude and drifted W was accompanied by a small sulfur dioxide plume, according to the TROPOMI instrument on the Sentinel-5P satellite (figure 60). On 12 and 19 June, 4 July, and 1, 19, and 27 August small ash plumes that rose to 1.2-1.5 km altitude drifted W and NW.
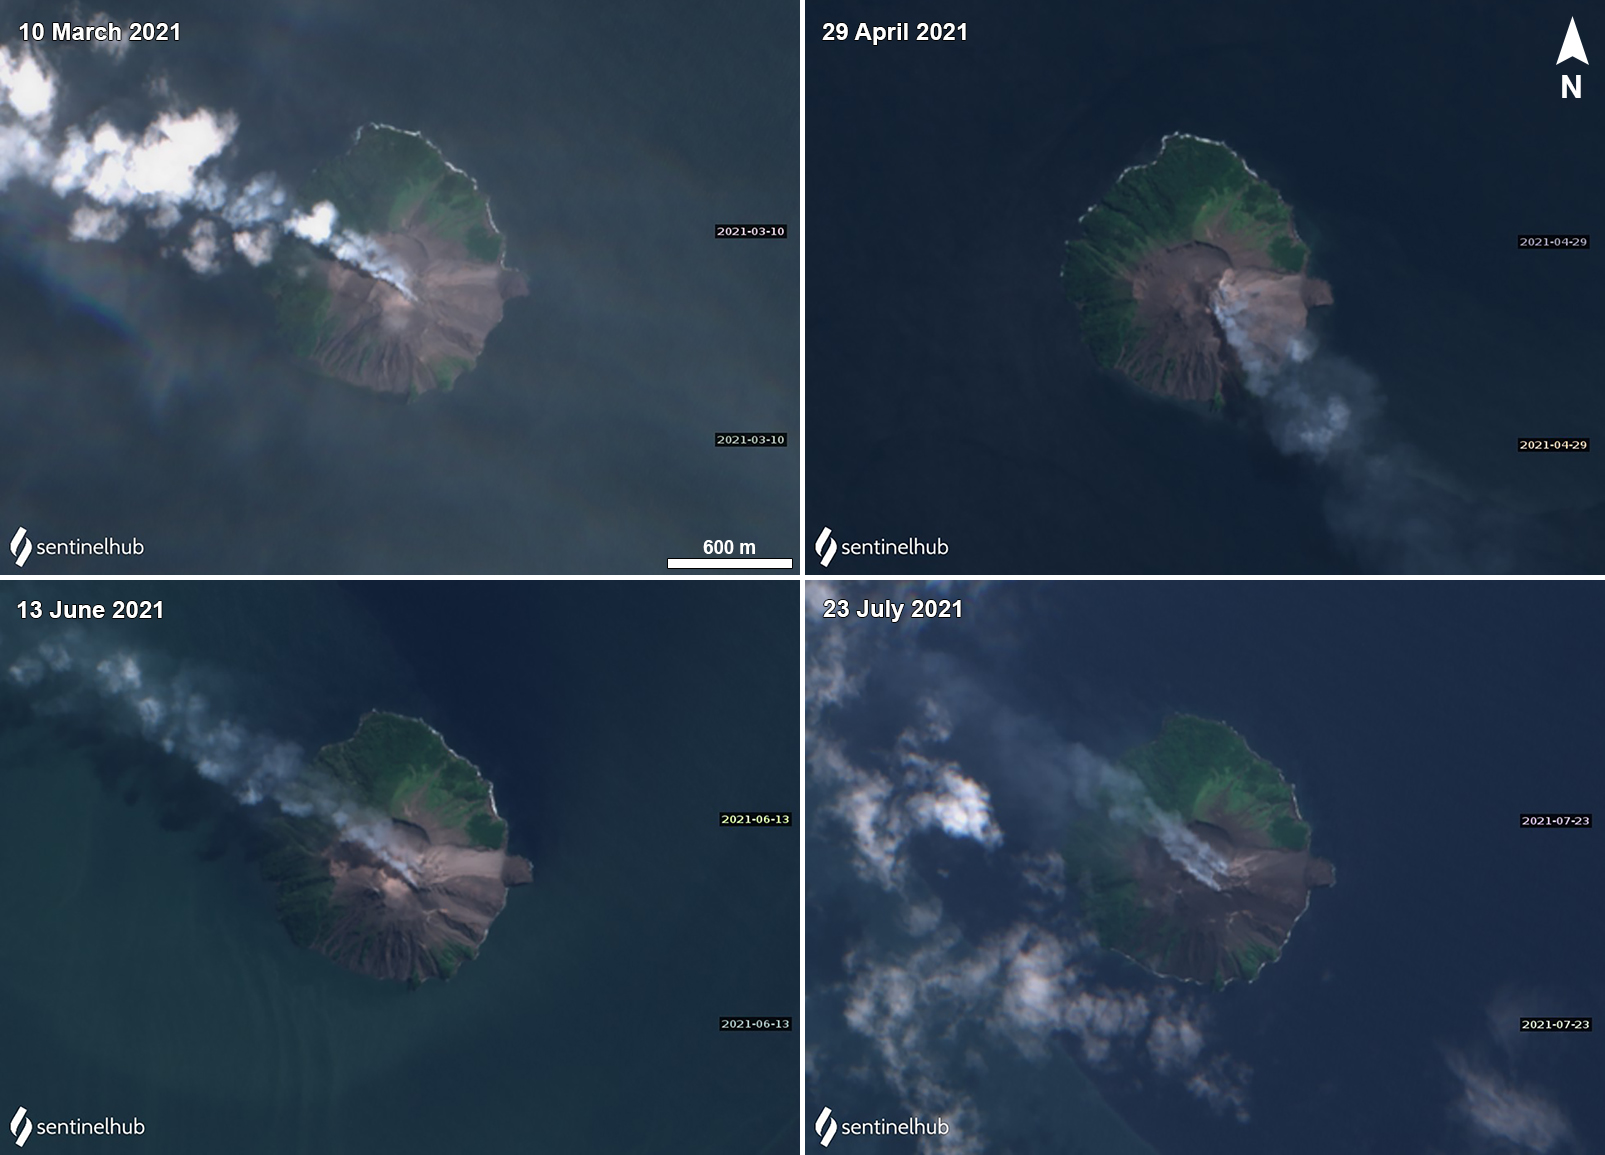 |
Figure 59. Sentinel-2 satellite images showing intermittent gas-and-steam plumes rising from Kadovar and drifting downwind on 10 March (top left), 29 April (top right), 13 June (bottom left), and 23 July (bottom right) 2021. Images with “Natural color” (bands 4, 3, 2) rendering. Courtesy of Sentinel Hub Playground. |
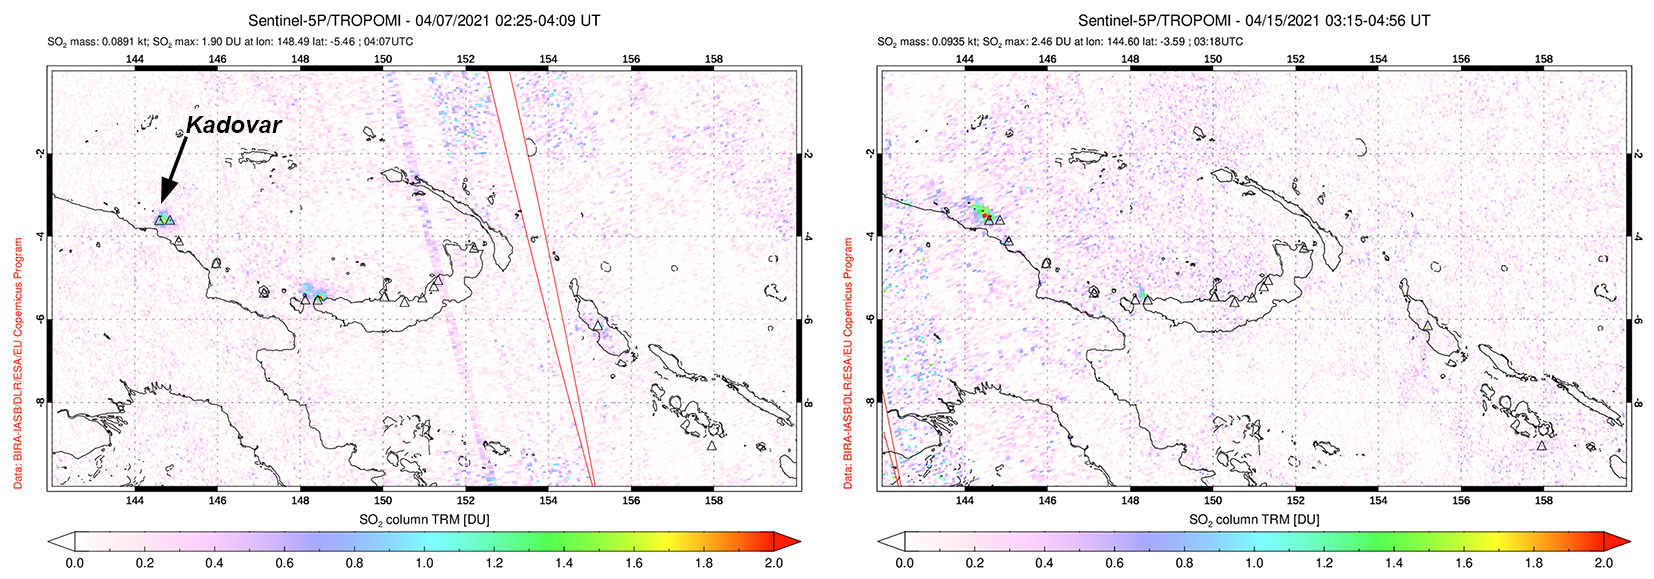 |
Figure 60. Small sulfur dioxide emissions were detected at Kadovar on 7 (left) and 15 (right) April 2021 with the TROPOMI instrument on the Sentinel-5P satellite, accompanying small ash plumes. Courtesy of NASA Global Sulfur Dioxide Monitoring Page. |
MIROVA (Middle InfraRed Observation of Volcanic Activity) analysis of MODIS satellite data shows weak clusters of thermal anomalies during January through March and May through August 2021 (figure 61). Stronger anomalies were detected during July through August, which was also reflected in Sentinel-2 infrared satellite imagery (figure 62).
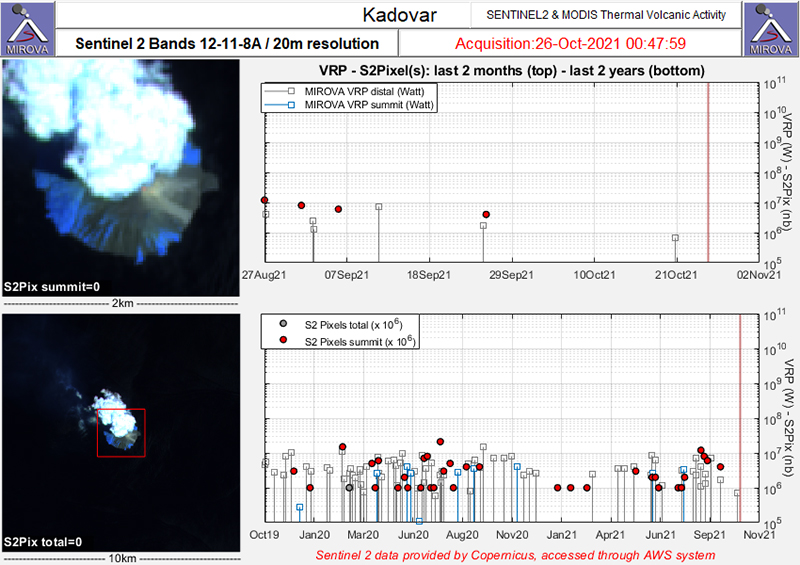 |
Figure 61. Occasional thermal anomalies (red dots) were detected at the summit of Kadovar during January through August 2021, as recorded by the Sentinel-2 MODIS Thermal Volcanic Activity data (bands 12, 11, 8A). A higher concentration of strong anomalies was detected during May and July-August. Courtesy of MIROVA. |
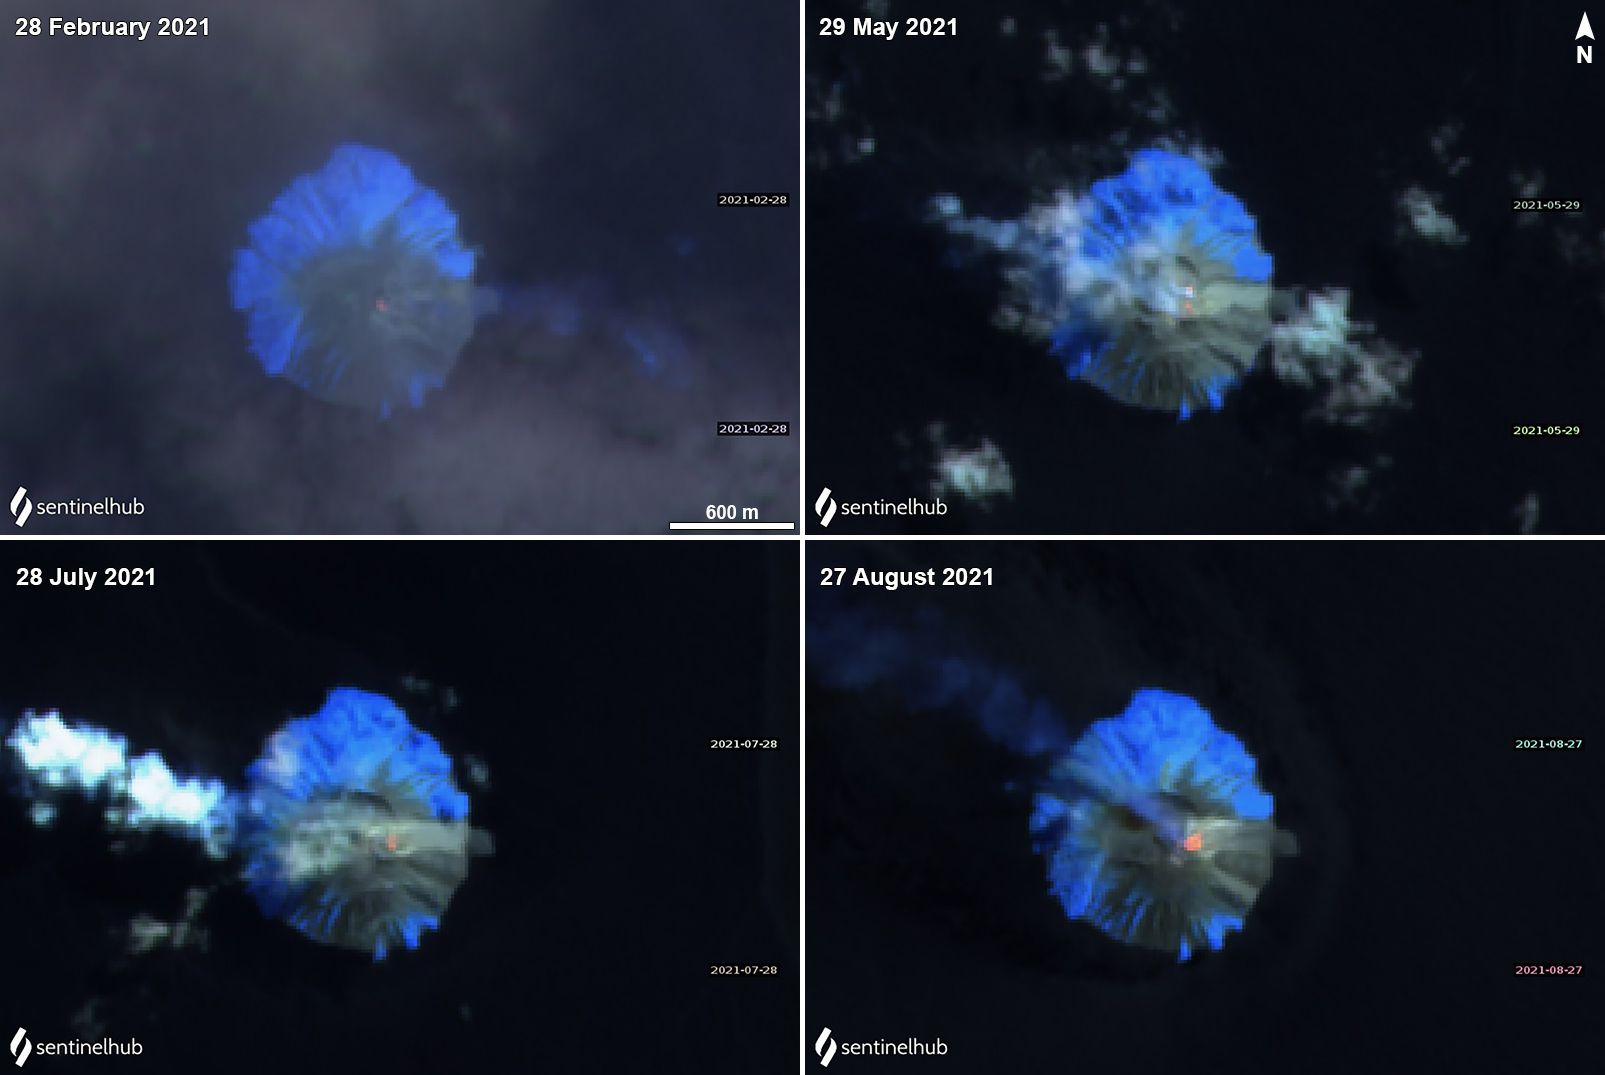 |
Figure 62. Sentinel-2 infrared satellite images showing a weak thermal anomaly in the summit crater of Kadovar on 28 February (top left), 29 May (top right), 29 July (bottom left), and 27 August (bottom right), accompanied by white gas-and-steam emissions that drifted generally SE and W. A significant thermal anomaly was noted on 27 August. Images with “Atmospheric penetration” (bands 12, 11, 8A) rendering. Courtesy of Sentinel Hub Playground. |
Information Contacts: Darwin Volcanic Ash Advisory Centre (VAAC), Bureau of Meteorology, Northern Territory Regional Office, PO Box 40050, Casuarina, NT 0811, Australia (URL: http://www.bom.gov.au/info/vaac/); MIROVA (Middle InfraRed Observation of Volcanic Activity), a collaborative project between the Universities of Turin and Florence (Italy) supported by the Centre for Volcanic Risk of the Italian Civil Protection Department (URL: http://www.mirovaweb.it/); Sentinel Hub Playground (URL: https://www.sentinel-hub.com/explore/sentinel-playground).
Occasional ash plumes and weak thermal anomalies during September 2021-May 2022
Kadovar is a 2-km-wide island located in the Bismarck Sea off the coast of New Guinea about 25 km NNE from the mouth of the Sepik River. The current eruption began in January 2018, which has recently consisted of intermittent ash and gas-and-steam plumes and weak summit thermal anomalies (BGVN 46:09). Similar activity persisted during this reporting period of September 2021 through May 2022 using information from the Darwin Volcanic Ash Advisory Center (VAAC) and satellite data.
Activity during the reporting period was relatively low, although intermittent ash plumes were reported by satellite and wind model data from the Darwin VAAC. Ash plumes rose to 1.5 km altitude on 8-9 October 2021, 3, 5, and 9 November 2021, and 8 April 2022. Occasional white gas-and-steam plumes that drifted in different directions were also visible in Sentinel-2 satellite images on clear weather days throughout the reporting period (figure 63). Thermal activity was generally low; two thermal anomalies were detected on 2 May, according to data from MODVOLC’s infrared satellite data. Sentinel-2 infrared satellite imagery showed an anomaly at the summit, often accompanied by a gas-and-steam plume (figure 64).
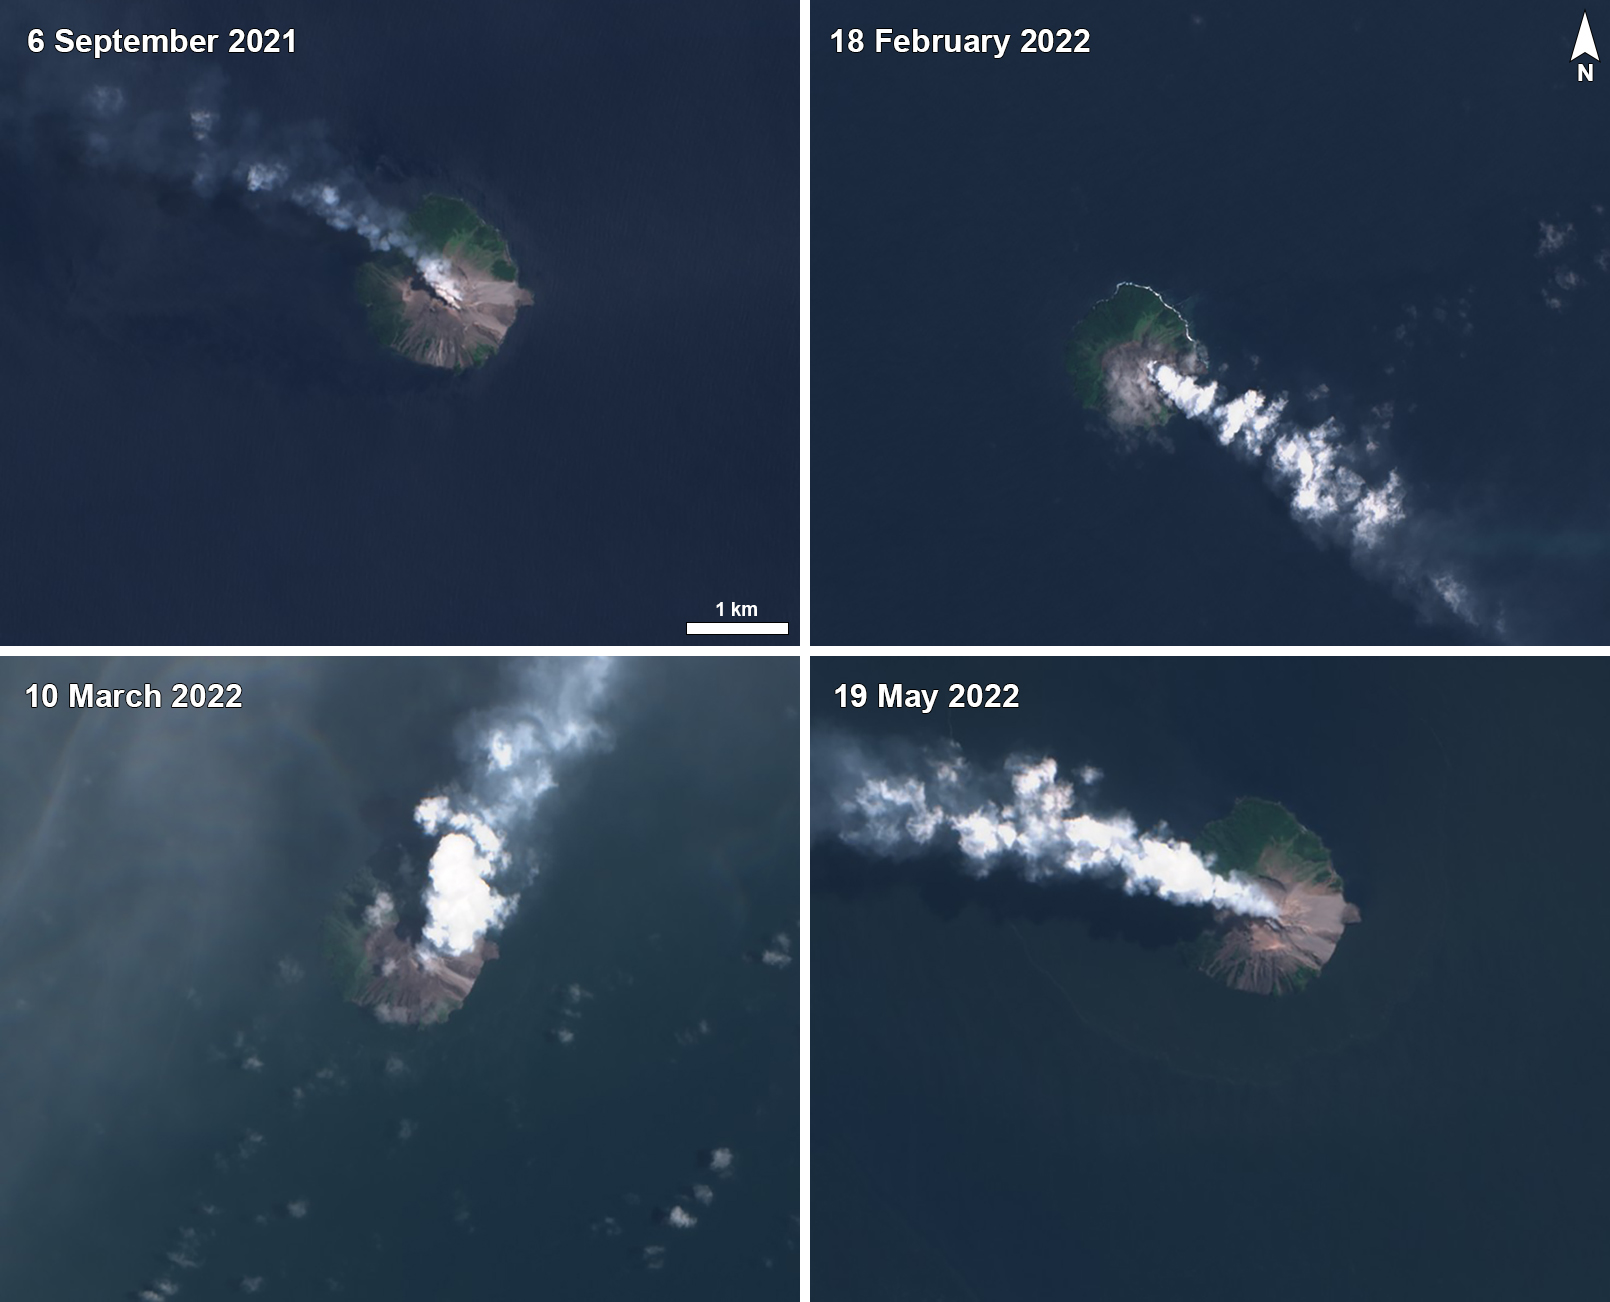 |
Figure 63. Sentinel-2 satellite images showing intermittent white gas-and-steam plumes rising from Kadovar and drifted NW on 6 September 2021 (top left), SE on 18 February 2022 (top right), NE on 10 March 2022 (bottom left), and NE on 19 May 2022 (bottom right). Images with “Natural color” (bands 4, 3, 2) rendering. Courtesy of Sentinel Hub Playground. |
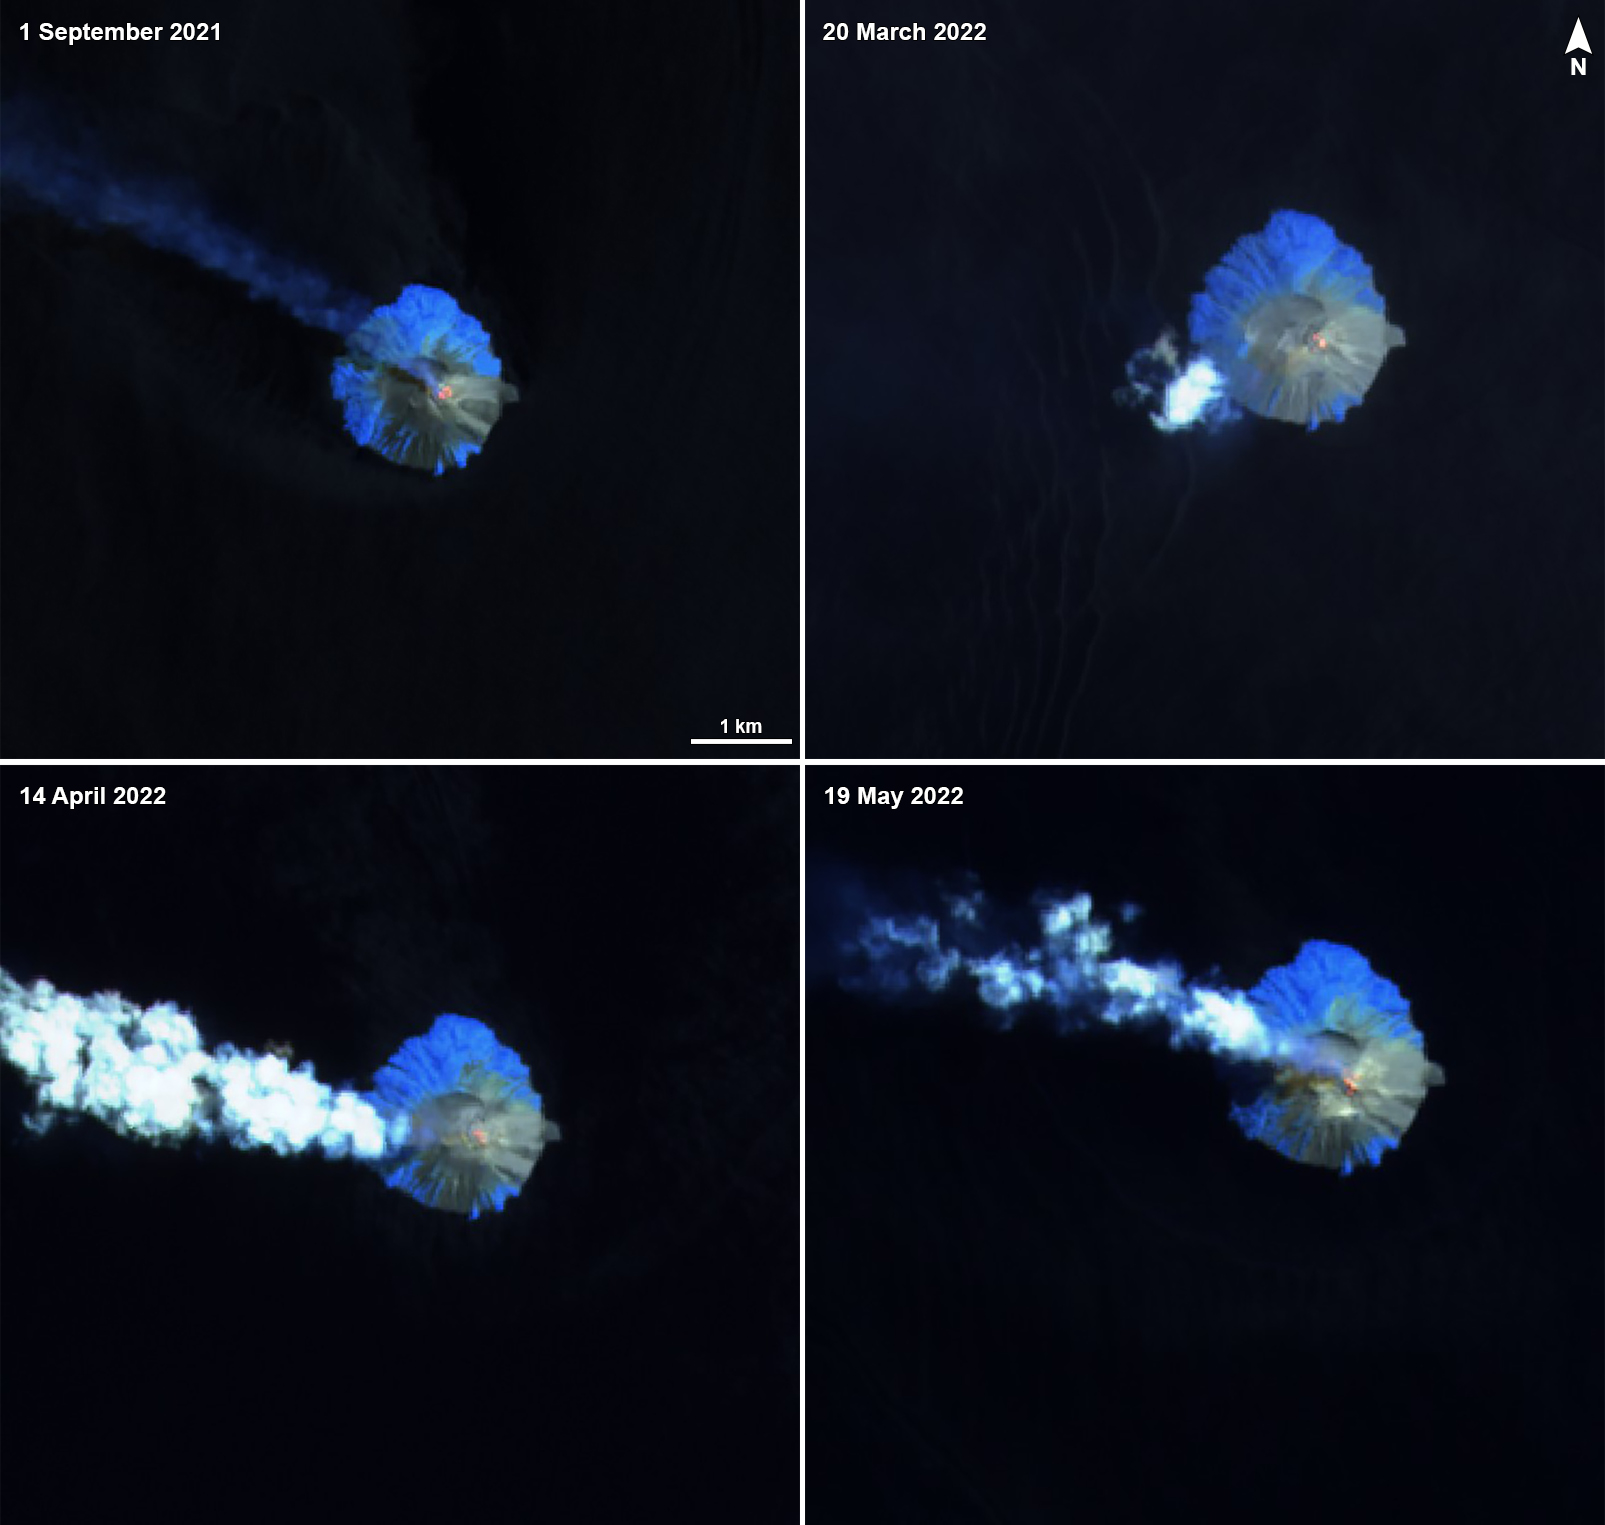 |
Figure 64. Sentinel-2 infrared satellite images showing some thermal activity at the summit crater of Kadovar on 1 September 2021 (top left), 20 March 2022 (top right), 14 April 2022 (bottom left), and 19 May 2022 (bottom right), accompanied by gas-and-steam emissions that drifted generally W. Images with “Atmospheric penetration” (bands 12, 11, 8A) rendering. Courtesy of Sentinel Hub Playground. |
Information Contacts: Darwin Volcanic Ash Advisory Centre (VAAC), Bureau of Meteorology, Northern Territory Regional Office, PO Box 40050, Casuarina, NT 0811, Australia (URL: http://www.bom.gov.au/info/vaac/); Hawai'i Institute of Geophysics and Planetology (HIGP) - MODVOLC Thermal Alerts System, School of Ocean and Earth Science and Technology (SOEST), Univ. of Hawai'i, 2525 Correa Road, Honolulu, HI 96822, USA (URL: http://modis.higp.hawaii.edu/); Sentinel Hub Playground (URL: https://www.sentinel-hub.com/explore/sentinel-playground).
Ash plumes, two weak thermal anomalies, and gas-and-steam plumes during June 2022-January 2023
Kadovar is a 2-km-wide island located in the Bismarck Sea off the coast of New Guinea about 25 km NNE from the mouth of the Sepik River. A period of heightened thermal activity took place in 1976. Prior to 2018, a lava dome formed the high point of the volcano. An eruption began in January 2018 that included lava effusion from vents at the summit and at the E coast. More recent activity has consisted of occasional ash plumes and weak thermal anomalies (BGVN 47:06). Similar activity persisted during this reporting period of June 2022 through January 2023 using information from the Darwin Volcanic Ash Advisory Center (VAAC) and satellite data.
Activity during the reporting period consisted of occasional ash plumes that were reported by satellite observations and wind model data from the Darwin VAAC. Ash plumes rose to 2.1 km altitude on 14 August and 1.2 km altitude on 31 August, both of which drifted NW. During 18-19 September ash plumes rose to 1.5 km altitude and drifted NW and WNW. On 11 December an ash plume rose to 1.5 km altitude and drifted S. On clear weather days, Sentinel-2 infrared satellite imagery showed very small thermal anomalies at the summit crater on 13 June and 8 July 2022 (figure 65). In addition, occasional white gas-and-steam plumes were sometimes visible in Sentinel-2 satellite imagery on clear weather days that drifted generally NW (figure 66). MODIS satellite instruments analyzed using the MODVOLC thermal algorithm detected a single thermal hotspot on the E side of the island on 28 November.
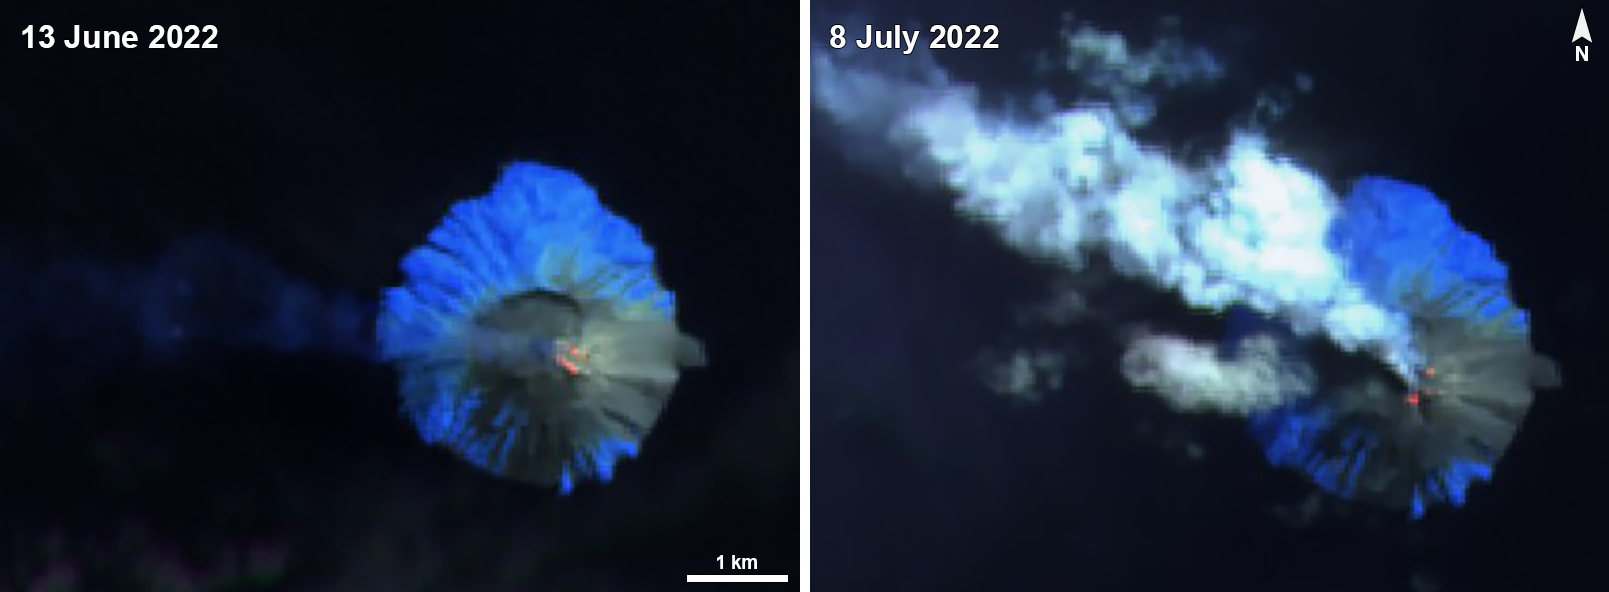 |
Figure 65. Sentinel-2 infrared satellite images showing minor thermal anomalies over Kadovar on 13 June 2022 (left) and 8 July 2022 (right), the latter of which was accompanied by a gas-and-steam plume that drifted NW. Images with “Atmospheric penetration” (bands 12, 11, 8A) rendering. Courtesy of Sentinel Hub Playground. |
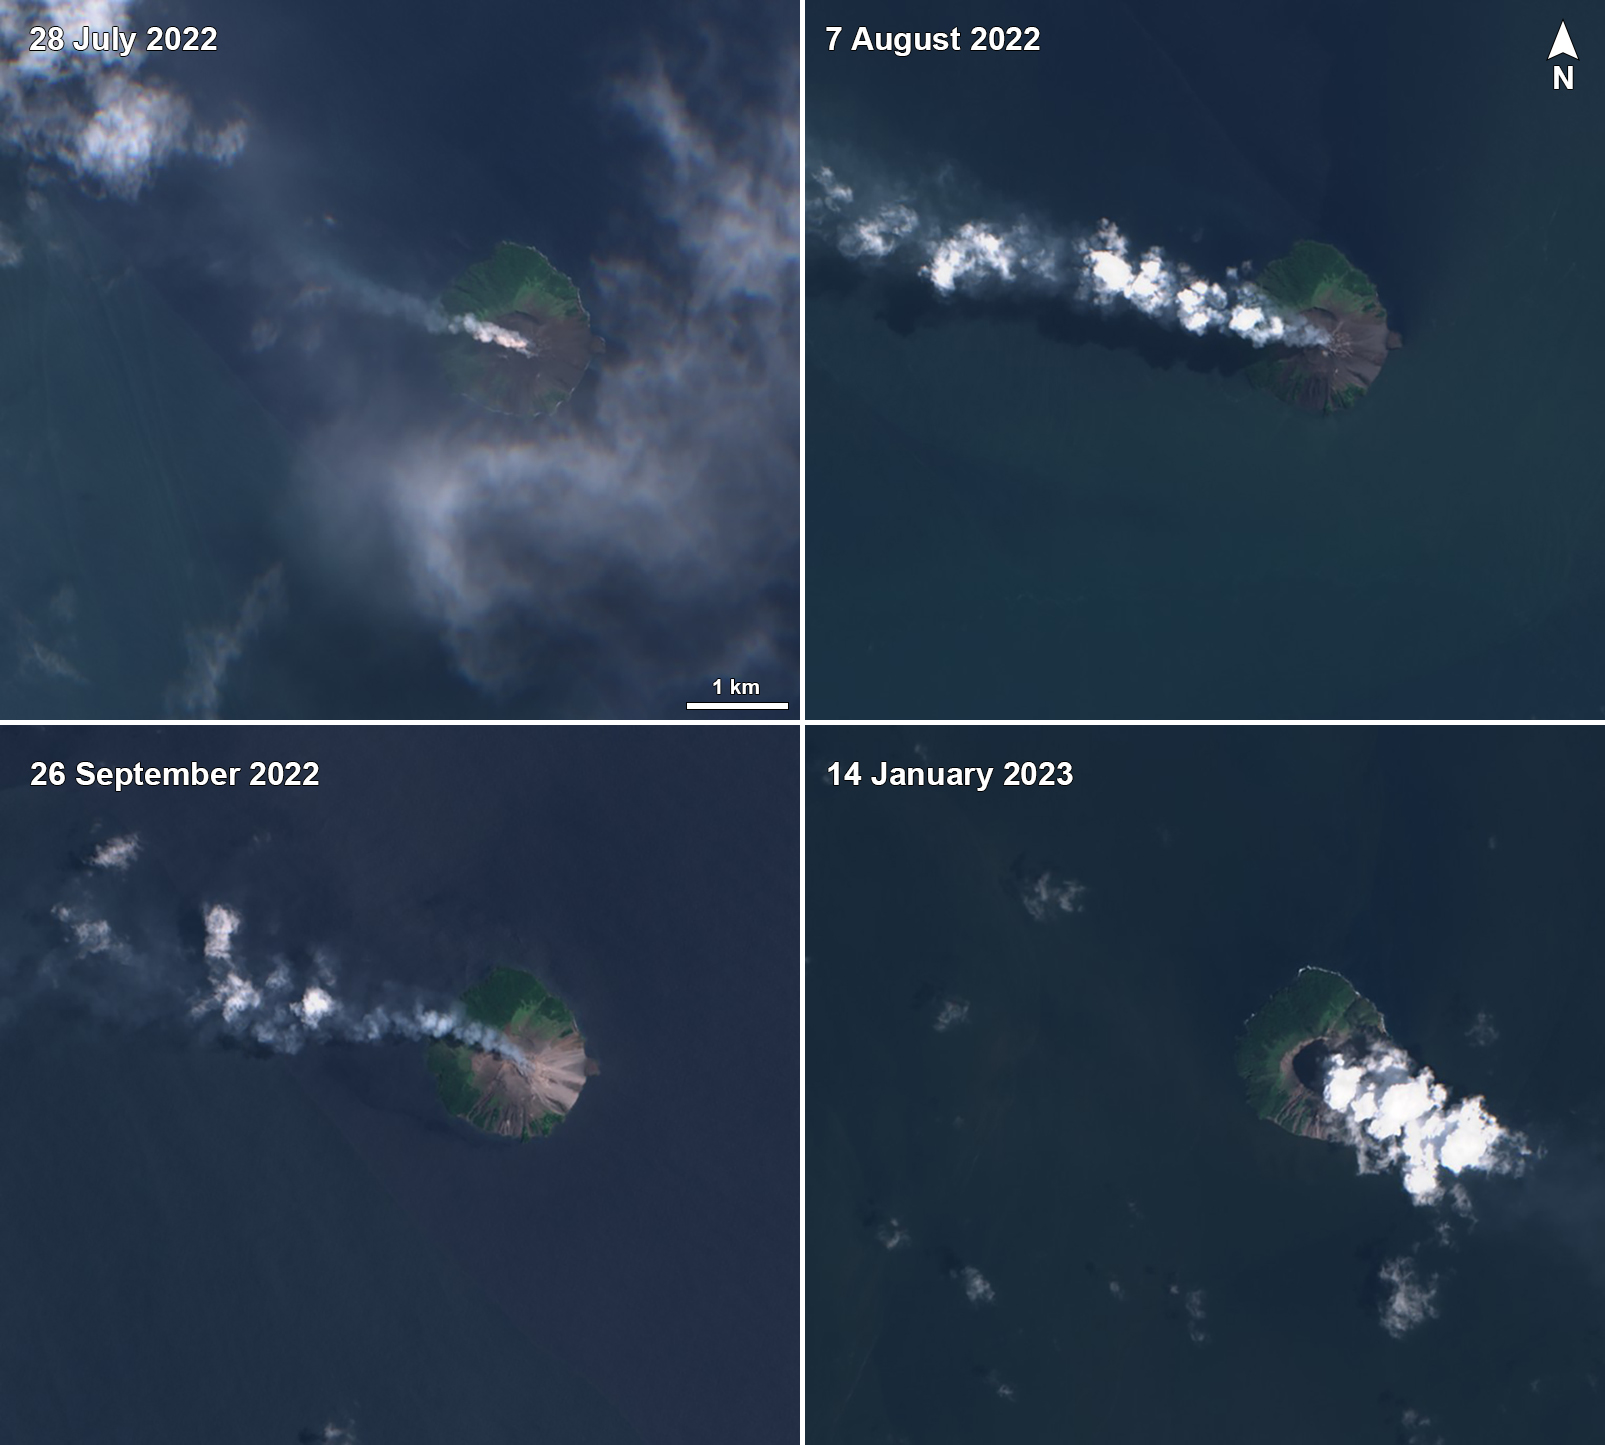 |
Figure 66. Sentinel-2 satellite images showing intermittent gas-and-steam plumes rising from Kadovar that drifted NW on 28 July 2022 (top left), 7 August 2022 (top right), 26 September 2022 (bottom left), and SE on 14 January 2023 (bottom right). Images with “Natural color” (bands 4, 3, 2) rendering. Courtesy of Sentinel Hub Playground. |
Information Contacts: Darwin Volcanic Ash Advisory Centre (VAAC), Bureau of Meteorology, Northern Territory Regional Office, PO Box 40050, Casuarina, NT 0811, Australia (URL: http://www.bom.gov.au/info/vaac/); Hawai'i Institute of Geophysics and Planetology (HIGP) - MODVOLC Thermal Alerts System, School of Ocean and Earth Science and Technology (SOEST), Univ. of Hawai'i, 2525 Correa Road, Honolulu, HI 96822, USA (URL: http://modis.higp.hawaii.edu/); Sentinel Hub Playground (URL: https://www.sentinel-hub.com/explore/sentinel-playground).
An ash plume and weak thermal anomaly during May 2023
Kadovar is a 2-km-wide island that is the emergent summit of a Bismarck Sea stratovolcano. It lies off the coast of New Guinea, about 25 km N of the mouth of the Sepik River. Prior to an eruption that began in 2018, a lava dome formed the high point of the volcano, filling an arcuate landslide scarp open to the S. Submarine debris-avalanche deposits occur to the S of the island. The current eruption began in January 2018 and has comprised lava effusion from vents at the summit and at the E coast; more recent activity has consisted of ash plumes, weak thermal activity, and gas-and-steam plumes (BGVN 48:02). This report covers activity during February through May 2023 using information from the Darwin Volcanic Ash Advisory Center (VAAC) and satellite data.
Activity during the reporting period was relatively low and mainly consisted of white gas-and-steam plumes that were visible in natural color satellite images on clear weather days (figure 67). According to a Darwin VAAC report, at 2040 on 6 May an ash plume rose to 4.6 km altitude and drifted W; by 2300 the plume had dissipated. MODIS satellite instruments using the MODVOLC thermal algorithm detected a single thermal hotspot on the SE side of the island on 7 May. Weak thermal activity was also detected in a satellite image on the E side of the island on 14 May, accompanied by a white gas-and-steam plume that drifted SE (figure 68).
|
Figure 67. True color satellite images showing a white gas-and-steam plume rising from Kadovar on 28 February 2023 (left) and 30 March 2023 (right) and drifting SE and S, respectively. Courtesy of Copernicus Browser. |
|
Figure 68. Infrared (bands B12, B11, B4) image showing weak thermal activity on the E side of the island, accompanied by a gas-and-steam plume that drifted SE from Kadovar on 14 May 2023. Courtesy of Copernicus Browser. |
Information Contacts: Darwin Volcanic Ash Advisory Centre (VAAC), Bureau of Meteorology, Northern Territory Regional Office, PO Box 40050, Casuarina, NT 0811, Australia (URL: http://www.bom.gov.au/info/vaac/); Hawai'i Institute of Geophysics and Planetology (HIGP) - MODVOLC Thermal Alerts System, School of Ocean and Earth Science and Technology (SOEST), Univ. of Hawai'i, 2525 Correa Road, Honolulu, HI 96822, USA (URL: http://modis.higp.hawaii.edu/); Copernicus Browser, Copernicus Data Space Ecosystem, European Space Agency (URL: https://dataspace.copernicus.eu/browser/).
This compilation of synonyms and subsidiary features may not be comprehensive. Features are organized into four major categories: Cones, Craters, Domes, and Thermal Features. Synonyms of features appear indented below the primary name. In some cases additional feature type, elevation, or location details are provided.
Synonyms |
| Blosseville Island | Keruar | Kadowar |
|
|
||||||||||||||||||||||||
There is data available for 1 confirmed Holocene eruptive periods.
2018 Jan 5 - 2023 May 14 Confirmed Eruption Max VEI: 2
| Episode 1 | Eruption Episode | |||||||||||||||
|---|---|---|---|---|---|---|---|---|---|---|---|---|---|---|---|
| 2018 Jan 5 - 2023 May 14 | Evidence from Observations: Reported | ||||||||||||||
|
List of 1 Events for Episode 1
| |||||||||||||||
[ 1700 Apr ] Uncertain Eruption
| Episode 1 | Eruption Episode | ||||||||||||||||||||
|---|---|---|---|---|---|---|---|---|---|---|---|---|---|---|---|---|---|---|---|---|
| 1700 Apr - Unknown | Evidence from Unknown | |||||||||||||||||||
|
List of 2 Events for Episode 1
| ||||||||||||||||||||
[ 1616 ] Discredited Eruption
Sapper (1917) lists Kadovar as being active in 1616, but there is no evidence that the Dutch mariners Schouten and Le Maire saw activity in that year (Johnson, 1990 p.c.), though they did report Manam erupting (Palfreyman and Cooke, 1976).
There is no Deformation History data available for Kadovar.
There is no Emissions History data available for Kadovar.
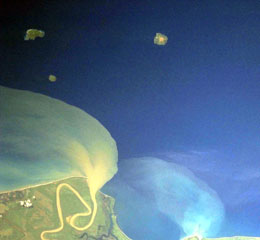 Kadovar is the small circular island at the upper left just above the prominent sediment plume from the Sepik River (lower left) on the mainland of Papua New Guinea. The 2-km-wide island of Kadovar is the emergent summit of a Holocene-age stratovolcano that lacks fringing or offshore reefs. No certain historical eruptions are known, with the latest activity consisting of a period of elevated thermal activity in 1976. Kadovar is part of the Schouten Islands, along with Blup Blup (top left) and Bam (top right).
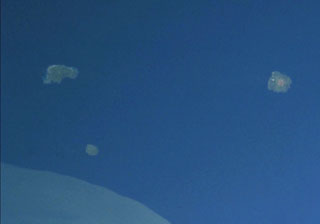 The small island to the upper left is Blup Blup. This 3.5-km-wide forested island contains lava flows with well-defined flow fronts and a weak thermal area is located on the W coast. No historical eruptions have occurred, but the volcano may have been active during the Holocene. It is part of the Schouten Islands, along with Kadovar volcano (the small circular island to the S) and Bam volcano (right).
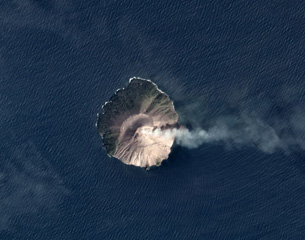 A plume at Kadovar is dispersing to the E in this November 2019 Planet Labs satellite image monthly mosaic (N is at the top). The flanks of the roughly 1.4 x 1.6 km island have been stripped of vegetation due to lava dome formation and collapse at the summit, with recent eruptive activity producing ash plumes and pyroclastic flows. Activity has also recently occurred at the base of the SE flank.
The maps shown below have been scanned from the GVP map archives and include the volcano on this page. Clicking on the small images will load the full 300 dpi map. Very small-scale maps (such as world maps) are not included. The maps database originated over 30 years ago, but was only recently updated and connected to our main database. We welcome users to tell us if they see incorrect information or other problems with the maps; please use the Contact GVP link at the bottom of the page to send us email.
There are no samples for Kadovar in the Smithsonian's NMNH Department of Mineral Sciences Rock and Ore collection.
| Copernicus Browser | The Copernicus Browser replaced the Sentinel Hub Playground browser in 2023, to provide access to Earth observation archives from the Copernicus Data Space Ecosystem, the main distribution platform for data from the EU Copernicus missions. |
| MIROVA | Middle InfraRed Observation of Volcanic Activity (MIROVA) is a near real time volcanic hot-spot detection system based on the analysis of MODIS (Moderate Resolution Imaging Spectroradiometer) data. In particular, MIROVA uses the Middle InfraRed Radiation (MIR), measured over target volcanoes, in order to detect, locate and measure the heat radiation sourced from volcanic activity. |
| MODVOLC Thermal Alerts | Using infrared satellite Moderate Resolution Imaging Spectroradiometer (MODIS) data, scientists at the Hawai'i Institute of Geophysics and Planetology, University of Hawai'i, developed an automated system called MODVOLC to map thermal hot-spots in near real time. For each MODIS image, the algorithm automatically scans each 1 km pixel within it to check for high-temperature hot-spots. When one is found the date, time, location, and intensity are recorded. MODIS looks at every square km of the Earth every 48 hours, once during the day and once during the night, and the presence of two MODIS sensors in space allows at least four hot-spot observations every two days. Each day updated global maps are compiled to display the locations of all hot spots detected in the previous 24 hours. There is a drop-down list with volcano names which allow users to 'zoom-in' and examine the distribution of hot-spots at a variety of spatial scales. |
|
WOVOdat
Single Volcano View Temporal Evolution of Unrest Side by Side Volcanoes |
WOVOdat is a database of volcanic unrest; instrumentally and visually recorded changes in seismicity, ground deformation, gas emission, and other parameters from their normal baselines. It is sponsored by the World Organization of Volcano Observatories (WOVO) and presently hosted at the Earth Observatory of Singapore.
GVMID Data on Volcano Monitoring Infrastructure The Global Volcano Monitoring Infrastructure Database GVMID, is aimed at documenting and improving capabilities of volcano monitoring from the ground and space. GVMID should provide a snapshot and baseline view of the techniques and instrumentation that are in place at various volcanoes, which can be use by volcano observatories as reference to setup new monitoring system or improving networks at a specific volcano. These data will allow identification of what monitoring gaps exist, which can be then targeted by remote sensing infrastructure and future instrument deployments. |
| Volcanic Hazard Maps | The IAVCEI Commission on Volcanic Hazards and Risk has a Volcanic Hazard Maps database designed to serve as a resource for hazard mappers (or other interested parties) to explore how common issues in hazard map development have been addressed at different volcanoes, in different countries, for different hazards, and for different intended audiences. In addition to the comprehensive, searchable Volcanic Hazard Maps Database, this website contains information about diversity of volcanic hazard maps, illustrated using examples from the database. This site is for educational purposes related to volcanic hazard maps. Hazard maps found on this website should not be used for emergency purposes. For the most recent, official hazard map for a particular volcano, please seek out the proper institutional authorities on the matter. |
| IRIS seismic stations/networks | Incorporated Research Institutions for Seismology (IRIS) Data Services map showing the location of seismic stations from all available networks (permanent or temporary) within a radius of 0.18° (about 20 km at mid-latitudes) from the given location of Kadovar. Users can customize a variety of filters and options in the left panel. Note that if there are no stations are known the map will default to show the entire world with a "No data matched request" error notice. |
| UNAVCO GPS/GNSS stations | Geodetic Data Services map from UNAVCO showing the location of GPS/GNSS stations from all available networks (permanent or temporary) within a radius of 20 km from the given location of Kadovar. Users can customize the data search based on station or network names, location, and time window. Requires Adobe Flash Player. |
| DECADE Data | The DECADE portal, still in the developmental stage, serves as an example of the proposed interoperability between The Smithsonian Institution's Global Volcanism Program, the Mapping Gas Emissions (MaGa) Database, and the EarthChem Geochemical Portal. The Deep Earth Carbon Degassing (DECADE) initiative seeks to use new and established technologies to determine accurate global fluxes of volcanic CO2 to the atmosphere, but installing CO2 monitoring networks on 20 of the world's 150 most actively degassing volcanoes. The group uses related laboratory-based studies (direct gas sampling and analysis, melt inclusions) to provide new data for direct degassing of deep earth carbon to the atmosphere. |
| Large Eruptions of Kadovar | Information about large Quaternary eruptions (VEI >= 4) is cataloged in the Large Magnitude Explosive Volcanic Eruptions (LaMEVE) database of the Volcano Global Risk Identification and Analysis Project (VOGRIPA). |
| EarthChem | EarthChem develops and maintains databases, software, and services that support the preservation, discovery, access and analysis of geochemical data, and facilitate their integration with the broad array of other available earth science parameters. EarthChem is operated by a joint team of disciplinary scientists, data scientists, data managers and information technology developers who are part of the NSF-funded data facility Integrated Earth Data Applications (IEDA). IEDA is a collaborative effort of EarthChem and the Marine Geoscience Data System (MGDS). |

