On 8 March the Vanuatu Meteorology and Geohazards Department (VMGD) reported that activity at Yasur continued at a level of “major unrest,” as defined by the Alert Level 2 status (on a scale of 0-5). Recent visual observations and photos taken in the field indicated that explosions continued, though activity was confined to the crater. The report warned that some of the explosions may eject material that falls in and around the crater. The public was reminded to not enter the restricted area within 600 m around the boundaries of the Permanent Exclusion Zone, defined by Danger Zone A on the hazard map.
Source: Vanuatu Meteorology and Geohazards Department (VMGD)
Ongoing summit crater activity with thermal anomalies, explosions, and SO2 plumes through April 2023
Yasur on Tanna Island, the southernmost active volcano in Vanuatu, has been erupting since at least 1774 if not before, with frequent Strombolian explosions and ash and gas plumes from several vents in the 400-m-diameter summit crater (BGVN 47:09). This report summarizes activity during September 2022-April 2023, using information from monthly bulletins of the Vanuatu Meteorology and Geo-Hazards Department (VMGD) and various satellite data. According to VMGD, Yasur has remained on Alert Level 2 (major unrest state, on a scale of 0-5) since 18 October 2016, and VMGD warned the public not to enter the restricted area within a radius of 600 m around the cone.
According to VMGD, low-to-moderate explosions continued through at least April 2023, with ejected bombs falling within the summit crater and emissions of ash, gas, and steam. Some stronger explosions ejected material outside the crater. Strong sulfur dioxide plumes were detected by the TROPOMI instrument on the Sentinel-5P satellite on 3-4 days/month during September-November 2022, but increased to 10-11 days/month in the following months.
Sentinel-2 satellite images showed persistent strong thermal anomalies, often from multiple distinct locations in the summit crater, on days when the volcano was not obscured by weather clouds. MODIS data reported by the MODVOLC thermal alerts system recorded only occasional hotspots for Yasur during the reporting period. The number of days per month with recorded hotspots ranged from one to five, with 3 pixels on 14 November 2022. VIIRS infrared data presented by the MIROVA (Middle InfraRed Observation of Volcanic Activity) system showed frequent hotspots during the recording period, all of low to moderate power (figure 88).
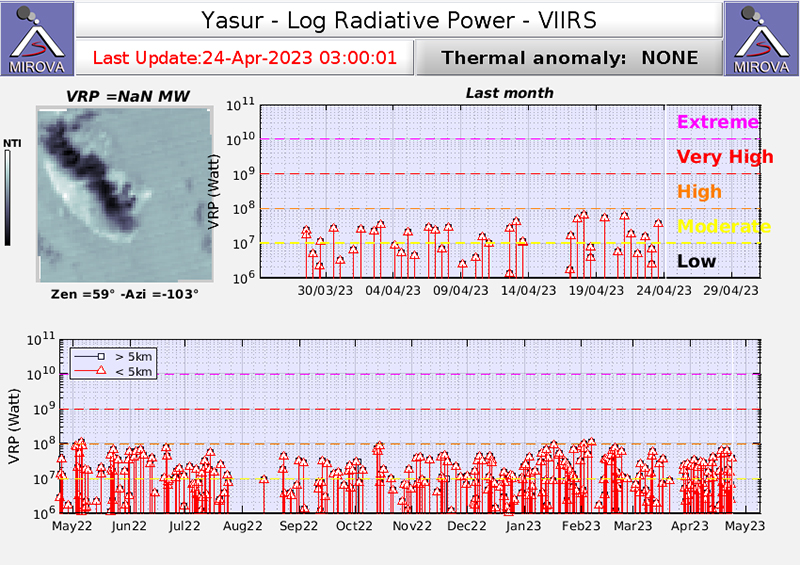 |
Figure 88. MIROVA (Log Radiative Power) graph showing infrared VIIRS satellite data for Yasur during the year ending on 24 April 2023. Moderate power thermal anomalies were frequently detected over most of this period. Courtesy of MIROVA. |
Information Contacts: Geo-Hazards Division, Vanuatu Meteorology and Geo-Hazards Department (VMGD), Ministry of Climate Change Adaptation, Meteorology, Geo-Hazards, Energy, Environment and Disaster Management, Private Mail Bag 9054, Lini Highway, Port Vila, Vanuatu (URL: http://www.vmgd.gov.vu/, https://www.facebook.com/VanuatuGeohazardsObservatory/); MIROVA (Middle InfraRed Observation of Volcanic Activity), a collaborative project between the Universities of Turin and Florence (Italy) supported by the Centre for Volcanic Risk of the Italian Civil Protection Department (URL: http://www.mirovaweb.it/); Hawai'i Institute of Geophysics and Planetology (HIGP) - MODVOLC Thermal Alerts System, School of Ocean and Earth Science and Technology (SOEST), Univ. of Hawai'i, 2525 Correa Road, Honolulu, HI 96822, USA (URL: http://modis.higp.hawaii.edu/); NASA Global Sulfur Dioxide Monitoring Page, Atmospheric Chemistry and Dynamics Laboratory, NASA Goddard Space Flight Center (NASA/GSFC), 8800 Greenbelt Road, Goddard, Maryland, USA (URL: https://so2.gsfc.nasa.gov/); Sentinel Hub Playground (URL: https://www.sentinel-hub.com/explore/sentinel-playground).
2024: January
| March
2023: February
| March
| April
| August
| September
| October
| December
2022: January
| February
| March
| April
| May
| September
| October
| November
| December
2021: January
| May
| August
| September
| October
| November
| December
2020: February
| March
| April
| May
| June
| July
2019: June
| October
2018: March
| April
| May
| June
| August
| November
2017: October
| December
2016: January
| March
| June
| August
| September
| October
| November
2015: April
| November
| December
2013: April
| May
| November
2012: July
2011: May
| June
2010: March
| May
2009: January
2004: March
2002: January
| August
On 8 March the Vanuatu Meteorology and Geohazards Department (VMGD) reported that activity at Yasur continued at a level of “major unrest,” as defined by the Alert Level 2 status (on a scale of 0-5). Recent visual observations and photos taken in the field indicated that explosions continued, though activity was confined to the crater. The report warned that some of the explosions may eject material that falls in and around the crater. The public was reminded to not enter the restricted area within 600 m around the boundaries of the Permanent Exclusion Zone, defined by Danger Zone A on the hazard map.
Source: Vanuatu Meteorology and Geohazards Department (VMGD)
On 31 January the Vanuatu Meteorology and Geohazards Department (VMGD) reported that activity at Yasur continued at a level of “major unrest,” as defined by the Alert Level 2 status (on a scale of 0-5) during the month. Recent satellite observations indicated an increase in steam, gas, and ash emissions from the summit crater. Explosions continued, with some ejecting bombs that landed back in and around the crater. The public was reminded to not enter the restricted area within 600 m around the boundaries of the Permanent Exclusion Zone, defined by Danger Zone A on the hazard map.
Source: Vanuatu Meteorology and Geohazards Department (VMGD)
On 28 December the Vanuatu Meteorology and Geohazards Department (VMGD) reported that activity at Yasur continued during December at a level of “major unrest,” as defined by the Alert Level 2 status (the middle level on a scale of 0-4). Recent satellite observations indicated an increase in steam, gas, and ash emissions from the summit crater. Explosions continued, with some ejecting bombs that landed back in and around the crater. The public was reminded to not enter the restricted area within 600 m around the boundaries of the Permanent Exclusion Zone, defined by Danger Zone A on the hazard map.
Source: Vanuatu Meteorology and Geohazards Department (VMGD)
On 4 December the Vanuatu Meteorology and Geohazards Department (VMGD) reported that activity at Yasur continued at a level of “major unrest,” as defined by the Alert Level 2 status (the middle level on a scale of 0-4) during November. Recent satellite observations indicated an increase in steam, gas, and ash emissions from the summit crater. Explosions continued, with some ejecting bombs that landed back in and around the crater. The public was reminded to not enter the restricted area within 600 m around the boundaries of the Permanent Exclusion Zone, defined by Danger Zone A on the hazard map.
Source: Vanuatu Meteorology and Geohazards Department (VMGD)
The Vanuatu Meteorology and Geohazards Department (VMGD) reported that activity at Yasur continued at a high level of “major unrest,” as defined by the Alert Level 2 status (the middle level on a scale of 0-4) during October. Recent satellite observations indicated an increase in steam, gas, and ash emissions from the summit crater. Explosions continued, with some ejecting bombs that landed back in and around the crater. A significant landslide occurred inside the vent on 10 October. The public was reminded to not enter the restricted area within 600 m around the boundaries of the Permanent Exclusion Zone, defined by Danger Zone A on the hazard map.
Source: Vanuatu Meteorology and Geohazards Department (VMGD)
On 28 September the Vanuatu Meteorology and Geohazards Department (VMGD) reported that activity at Yasur continued at a high level of “major unrest,” as defined by the Alert Level 2 status (the middle level on a scale of 0-4). Recent satellite observations indicated an increase in steam, gas, and ash emissions from the summit crater. Explosions continued, with some ejecting bombs that landed back in and around the crater. The public was reminded to not enter the restricted area within 600 m around the boundaries of the Permanent Exclusion Zone, defined by Danger Zone A on the hazard map.
Source: Vanuatu Meteorology and Geohazards Department (VMGD)
Vanuatu Meteorology and Geohazards Department (VMGD) reported that Yasur emitted a substantial ash cloud during 1400-1700 on 12 September based on reports from nearby observers. The plumes drifted SE; VMGD warned that areas around White Sands, 3 km N, may experience impacts from ashfall and gas. The volcano had returned to normal levels by the next day. The Alert Level remained at 2 (the middle level on a scale of 0-4).
Source: Vanuatu Meteorology and Geohazards Department (VMGD)
On 31 August the Vanuatu Meteorology and Geohazards Department (VMGD) reported that activity at Yasur continued at a high level of “major unrest,” as defined by the Alert Level 2 status (the middle level on a scale of 0-4). Recent satellite observations indicated an increase in steam, gas, and ash emissions from the summit crater. Explosions continued, with some ejecting bombs that landed back in and around the crater. The public was reminded to not enter the restricted area within 600 m around the boundaries of the Permanent Exclusion Zone, defined by Danger Zone A on the hazard map.
Source: Vanuatu Meteorology and Geohazards Department (VMGD)
On 27 April the Vanuatu Meteorology and Geohazards Department (VMGD) reported that activity at Yasur continued at a high level of “major unrest,” as defined by the Alert Level 2 status (the middle level on a scale of 0-4). Recent observations confirmed that low-to-moderate explosions continued, ejecting bombs that landed back into the crater and producing gas-and-ash emissions. The larger explosions occasionally ejected material outside of the crater. The public was reminded to not enter the restricted area within 600 m around the cone, defined by Danger Zone A on the hazard map.
Source: Vanuatu Meteorology and Geohazards Department (VMGD)
According to the Wellington VAAC a pilot saw an ash plume rising from Yasur to an altitude below 3 km (10,000 ft) and drifting W at 1752 on 4 April. Ash was not identified in satellite images.
Source: Wellington Volcanic Ash Advisory Center (VAAC)
On 23 February the Vanuatu Meteorology and Geohazards Department (VMGD) reported that activity at Yasur continued at a high level of “major unrest,” as defined by the Alert Level 2 status (the middle level on a scale of 0-4). Recent observations confirmed that low-to-moderate explosions continued, ejecting bombs that landed back into the crater and producing ash, gas, and steam emissions. The larger explosions occasionally ejected material outside of the crater. The public was reminded to not enter the restricted area within 600 m around the cone, defined by Danger Zone A on the hazard map.
Source: Vanuatu Meteorology and Geohazards Department (VMGD)
On 29 December the Vanuatu Meteorology and Geohazards Department (VMGD) reported that activity at Yasur continued at a high level of “major unrest,” as defined by the Alert Level 2 status (the middle level on a scale of 0-4). Recent observations confirmed continuing low-to-moderate explosions that ejected bombs within the crater and produced ash, gas, and steam emissions. The public was reminded to not enter the restricted area within 600 m around the cone, defined by Danger Zone A on the hazard map.
Source: Vanuatu Meteorology and Geohazards Department (VMGD)
On 24 November Vanuatu Meteorology and Geohazards Department (VMGD) reported that activity at Yasur continued at a high level of “major unrest,” as defined by the Alert Level 2 status (the middle level on a scale of 0-4). Recent observations confirmed continuing low-to-moderate explosions that ejected bombs within the crater and produced ash, gas, and steam emissions. The public was reminded to not enter the restricted area within 600 m around the cone, defined by Danger Zone A on the hazard map.
Source: Vanuatu Meteorology and Geohazards Department (VMGD)
On 27 October Vanuatu Meteorology and Geohazards Department (VMGD) reported that activity at Yasur continued at a high level of “major unrest,” as defined by the Alert Level 2 status (the middle level on a scale of 0-4). Ash-and-gas emissions and low-to-moderate explosions continued to be recorded, with bombs falling in and around the crater. The public was reminded to not enter the restricted area within 600 m around the cone, defined by Danger Zone A on the hazard map.
Source: Vanuatu Meteorology and Geohazards Department (VMGD)
On 31 August Vanuatu Meteorology and Geohazards Department (VMGD) reported that activity at Yasur continued at a high level of “major unrest,” as defined by the Alert Level 2 status (the middle level on a scale of 0-4). Ash-and-gas emissions and loud explosions continued to be recorded, with bombs falling in and around the crater. The public was reminded to not enter the restricted area within 600 m around the cone, defined by Danger Zone A on the hazard map.
Source: Vanuatu Meteorology and Geohazards Department (VMGD)
On 27 May Vanuatu Meteorology and Geohazards Department (VMGD) reported that activity at Yasur continued at a high level of “major unrest,” as defined by the Alert Level 2 status (the middle level on a scale of 0-4). Ash-and-gas emissions and loud explosions continued to be recorded, with bombs falling in and around the crater. The public was reminded to not enter the restricted area within 600 m around the cone, defined by Danger Zone A on the hazard map.
Source: Vanuatu Meteorology and Geohazards Department (VMGD)
On 28 April Vanuatu Meteorology and Geohazards Department (VMGD) reported that activity at Yasur continued at a high level of “major unrest,” as defined by the Alert Level 2 status (the middle level on a scale of 0-4). Ash-and-gas emissions and loud explosions continued to be recorded, with bombs falling in and around the crater. The public was reminded to not enter the restricted area within 600 m around the cone, defined by Danger Zone A on the hazard map.
Source: Vanuatu Meteorology and Geohazards Department (VMGD)
The Wellington VAAC reported that during 9 and 11-12 April ash-and-steam emissions from Yasur were intermittently visible in webcam and satellite images rising 0.9-1.8 km (3,000-6,000 ft) a.s.l. and drifting SE.
Source: Wellington Volcanic Ash Advisory Center (VAAC)
On 31 March the Vanuatu Meteorology and Geohazards Department (VMGD) reported that activity at Yasur continued at a high level of “major unrest,” as defined by the Alert Level 2 status (the middle level on a scale of 0-4). Ash-and-gas emissions and loud explosions continued to be recorded, with bombs falling in and around the crater. The public was reminded not to enter the restricted area within 600 m around the cone, defined by Danger Zone A on the hazard map.
Source: Vanuatu Meteorology and Geohazards Department (VMGD)
The Vanuatu Meteorology and Geohazards Department (VMGD) reported that activity at Yasur continued at a high level of “major unrest,” as defined by the Alert Level 2 status (the middle level on a scale of 0-4). Ash-and-gas emissions and loud explosions continued to be recorded, with bombs falling in and around the crater. The public was reminded not to enter the restricted area within 600 m around the cone, defined by Danger Zone A on the hazard map.
Source: Vanuatu Meteorology and Geohazards Department (VMGD)
The Wellington VAAC reported that on 17 and 19 February ash emissions from Yasur were intermittently visible in webcam and satellite images rising as high as 1.2 km (4,000 ft) a.s.l. and drifting SW.
Source: Wellington Volcanic Ash Advisory Center (VAAC)
The Wellington VAAC reported that during 12-13 February ash emissions from Yasur were visible in webcam and satellite images rising to 900 m (3,000 ft) a.s.l. and drifting S and SW.
Source: Wellington Volcanic Ash Advisory Center (VAAC)
On 2 February the Vanuatu Meteorology and Geo-Hazards Department (VMGD) reported that sulfur dioxide gas emissions from Yasur’s active lava lake were detected drifting NW in satellite images. The Alert Level remained at 2 (on a scale of 0-4) and the public was reminded not to enter the restricted area within 600 m around the cone, defined by Danger Zone A on the hazard map.
Source: Vanuatu Meteorology and Geohazards Department (VMGD)
The Vanuatu Meteorology and Geohazards Department (VMGD) reported that activity at Yasur continued at a high level of “major unrest,” as defined by the Alert Level 2 status. Ash-and-gas emissions and loud explosions continued to be recorded. Alert Level 2 is the middle level on a scale of 0-4. The public was reminded not to enter the restricted area within 600 m around the cone, defined by Danger Zone A on the hazard map.
Source: Vanuatu Meteorology and Geohazards Department (VMGD)
The Wellington VAAC reported that on 15 January intermittent low-level ash plumes from Yasur rose 1.5 km (5,000 ft) a.s.l. and drifted SE. Ashfall was reported in nearby villages. A Sentinel satellite image acquired that same day showed a strip of ash deposits in areas to the NW. Continuous, low-level ash plumes were visible in satellite and webcam images on 17 and 18 January rising to 1.5 km a.s.l. and drifting SE and W, respectively.
Sources: Wellington Volcanic Ash Advisory Center (VAAC); Culture Volcan
The Vanuatu Meteorology and Geohazards Department (VMGD) reported that activity at Yasur continued at a high level of “major unrest,” as defined by the Alert Level 2 status. Ash-and-gas emissions were visible in webcam images at 0845, 0900, 0915 on 7 January rising above the crater rim and drifting NW. Alert Level 2 is the middle level on a scale of 0-4. The public was reminded not to enter the restricted area within 600 m around the cone, defined by Danger Zone A on the hazard map.
Source: Vanuatu Meteorology and Geohazards Department (VMGD)
On 30 December the Vanuatu Meteorology and Geohazards Department (VMGD) reported that activity at Yasur continued at a high level of “major unrest,” as defined by the Alert Level 2 status. Activity consisted of loud explosions, emissions of steam and ash, and the ejection of bombs that fell inside and around the crater area. Alert Level 2 is the middle level on a scale of 0-4. The public was reminded not to enter the restricted area within 600 m around the cone, defined by Danger Zone A on the hazard map.
Source: Vanuatu Meteorology and Geohazards Department (VMGD)
The Wellington VAAC reported that during 27-28 December ash emissions from Yasur were visible in webcam images rising above the crater rim, to 1.5 km (5,000 ft) a.s.l. Plumes containing ash were not visible in satellite images, though they were also confirmed by Vanuatu Meteorology and Geohazards Department (VMGD).
Source: Wellington Volcanic Ash Advisory Center (VAAC)
The Vanuatu Meteorology and Geohazards Department (VMGD) reported that activity at Yasur increased at around 2100 on 18 December. Thirty minutes later webcam images showed deposits of incandescent volcanic bombs that had been ejected from the crater and landed on the flanks. Ash-and-gas plumes were visible at 1015, 1430, and 1545 on 19 December drifting W. The Alert Level remained at 2 (on a scale of 0-4).
Source: Vanuatu Meteorology and Geohazards Department (VMGD)
The Vanuatu Meteorology and Geohazards Department (VMGD) and the Wellington VAAC reported that multiple gas-and-ash emissions at Yasur were visible in webcam images on 27 November rising 1.5-1.8 km (5,000-6,000 ft) a.s.l. and drifting W. Weather clouds prevented satellite observations of the emissions. The Alert Level remained at 2 (on a scale of 0-4).
Sources: Vanuatu Meteorology and Geohazards Department (VMGD); Wellington Volcanic Ash Advisory Center (VAAC)
The Vanuatu Meteorology and Geohazards Department (VMGD) reported that seismic activity slightly increased at Yasur beginning at 1330 on 22 October. Emissions also increased and large, dense ash-and-gas plumes were visible rising from the crater in webcam images at 1445. Increased ash emissions were confirmed during field observations later that day, prompting VMGD to expand the restricted area to a 1-km radius around the cone, defined by Danger Zone B on the hazard map. The Wellington VAAC noted that ash plumes rose as high as 1.2 km (4,000 ft) a.s.l. and drifted SE, E, and N during 22-24 October, based on webcam views and information from VMGD; emissions ceased by 1845 on 24 October. The Alert Level remained at 2 (on a scale of 0-4).
Sources: Vanuatu Meteorology and Geohazards Department (VMGD); Wellington Volcanic Ash Advisory Center (VAAC)
On 30 September the Vanuatu Meteorology and Geo-Hazards Department (VMGD) reported that seismic data and recent visual observations at Yasur confirmed ongoing explosions and gas-and-ash emissions. A few earthquakes were recorded on 28 September. The Alert Level remained at 2 (on a scale of 0-4). VMGD reminded residents and tourists that hazardous areas were near and around the volcanic crater, within a 600-m-radius exclusion zone, and that volcanic ash and gas could reach areas impacted by trade winds.
Source: Vanuatu Meteorology and Geohazards Department (VMGD)
On 26 August the Vanuatu Meteorology and Geo-Hazards Department (VMGD) reported that seismic data and recent visual observations at Yasur confirmed ongoing explosions and gas-and-ash emissions. The Alert Level remained at 2 (on a scale of 0-4). VMGD reminded residents and tourists that hazardous areas were near and around the volcanic crater, within a 600-m-radius exclusion zone, and that volcanic ash and gas could reach areas impacted by trade winds.
Source: Vanuatu Meteorology and Geohazards Department (VMGD)
On 27 May the Vanuatu Meteorology and Geo-Hazards Department (VMGD) reported that seismic data and recent visual observations at Yasur confirmed ongoing explosions and gas-and-ash emissions. The Alert Level remained at 2 (on a scale of 0-4). VMGD reminded residents and tourists that hazardous areas were near and around the volcanic crater, within a 600-m-radius exclusion zone, and that volcanic ash and gas could reach areas impacted by trade winds.
Source: Vanuatu Meteorology and Geohazards Department (VMGD)
Vanuatu Meteorology and Geo-Hazards Department (VMGD) reported that an ash-and-gas emission rose above Yasur’s crater rim at 1734 on 18 January. The Alert Level remained at 2 (on a scale of 0-4). VMGD reminded residents and tourists that hazardous areas were near and around the volcanic crater, and that volcanic ash and gas could reach areas impacted by trade winds.
Source: Vanuatu Meteorology and Geohazards Department (VMGD)
Based on webcam images and satellite data the Wellington VAAC reported that on 19 July ash plumes from Yasur rose to 1.5 km (5,000 ft) a.s.l. Diffuse ash plumes rose to 1.2 km (4,000 ft) a.s.l. and drifted NNE.
Source: Wellington Volcanic Ash Advisory Center (VAAC)
On 25 June the Vanuatu Meteorology and Geo-Hazards Department (VMGD) reported that seismic data and recent visual observations at Yasur confirmed ongoing explosions and gas-and-ash emissions. The Alert Level remained at 2 (on a scale of 0-4). VMGD reminded residents and tourists that hazardous areas were near and around the volcanic crater, within a 600-m-radius exclusion zone, and that volcanic ash and gas could reach areas impacted by trade winds.
Source: Vanuatu Meteorology and Geohazards Department (VMGD)
On 28 May the Vanuatu Meteorology and Geo-Hazards Department (VMGD) reported that recent visual observations at Yasur confirmed ongoing explosions and gas-and-ash emissions. The report noted that some of the explosions could be intense and eject bombs outside of the summit crater. The Alert Level remained at 2 (on a scale of 0-4). VMGD reminded residents and tourists that hazardous areas were near and around the volcanic crater, within a 600-m-radius exclusion zone, and that volcanic ash and gas could reach areas impacted by trade winds.
Source: Vanuatu Meteorology and Geohazards Department (VMGD)
Based on webcam images and satellite data the Wellington VAAC reported that on 19 May a brief low-level ash emission from Yasur rose to an altitude of 2.1 km (7,000 ft) a.s.l. and drifted SE.
Source: Wellington Volcanic Ash Advisory Center (VAAC)
On 30 April the Vanuatu Meteorology and Geo-Hazards Department (VMGD) reported that recent visual observations at Yasur confirmed that gas-and-ash emissions were ongoing. The report noted that some of the explosions could be intense and eject bombs outside of the summit crater. Data from the seismic network indicated a decrease in activity as compared to March data. The Alert Level remained at 2 (on a scale of 0-4). VMGD had increased the radius of the permanent exclusion zone to 600 m in mid-March and that remained in effect; residents and tourists were reminded that volcanic ash and gas could reach areas impacted by trade winds.
Source: Vanuatu Meteorology and Geohazards Department (VMGD)
Based on webcam images and information from the Vanuatu Meteorology and Geo-Hazards Department (VMGD), the Wellington VAAC reported that during 2-3 April low-level ash plumes from Yasur rose to an altitude of 1.5 km (5,000 ft) a.s.l. and drifted N and SE. Ashfall was confirmed on the SSW parts of the island.
Sources: Wellington Volcanic Ash Advisory Center (VAAC); Vanuatu Meteorology and Geohazards Department (VMGD)
On 27 March the Vanuatu Meteorology and Geo-Hazards Department (VMGD) reported that activity at Yasur continued to be elevated with ongoing ash and/or gas emissions. The Alert Level remained at 2 (on a scale of 0-4). VMGD reminded residents and tourists that hazardous areas were near and around the volcanic crater, within a 395-m-radius permanent exclusion zone, and that volcanic ash and gas could reach areas impacted by trade winds.
Source: Vanuatu Meteorology and Geohazards Department (VMGD)
Based on webcam images and satellite data the Wellington VAAC reported that during on 13 and 17 March low-level ash plumes from Yasur rose to an altitude of 1.5 km (5,000 ft) a.s.l. and drifted N and SE.
Source: Wellington Volcanic Ash Advisory Center (VAAC)
Based on webcam images, satellite data, and pilot observations the Wellington VAAC reported that during 2-3 March low-level ash plumes from Yasur rose to an altitude of 1.5 km (5,000 ft) a.s.l. and drifted W and NW.
Source: Wellington Volcanic Ash Advisory Center (VAAC)
On 31 October the Vanuatu Meteorology and Geo-Hazards Department (VMGD) reported that recent observations and data from Yasur’s seismic network confirmed ongoing sometimes strong explosions. The Alert Level remained at 2 (on a scale of 0-4). VMGD reminded residents and tourists that hazardous areas were near and around the volcanic crater, within a 395-m-radius permanent exclusion zone, and that volcanic ash and gas could reach areas impacted by trade winds.
Source: Vanuatu Meteorology and Geohazards Department (VMGD)
On 27 June the Vanuatu Meteorology and Geo-Hazards Department (VMGD) reported that recent observations and data from Yasur’s seismic network confirmed ongoing sometimes strong explosions. The Alert Level remained at 2 (on a scale of 0-4). VMGD reminded residents and tourists that hazardous areas were near and around the volcanic crater, within a 395-m-radius permanent exclusion zone, and that volcanic ash and gas could reach areas impacted by trade winds.
Source: Vanuatu Meteorology and Geohazards Department (VMGD)
On 15 November the Vanuatu Meteorology and Geo-hazards Department (VMGD) reported that ongoing explosions at Yasur were sometimes strong during October and November, based on visual observations and seismic data. The Alert Level remained at 2 (on a scale of 0-4). VMGD reminded residents and tourists that hazardous areas were near and around the volcanic crater, within a 395-m-radius permanent exclusion zone, and that volcanic ash and gas could reach areas impacted by trade winds.
Source: Vanuatu Meteorology and Geohazards Department (VMGD)
The Vanuatu Meteorology and Geo-hazards Department reported that ongoing explosions at Yasur were sometimes strong during August. The Alert Level remained at 2 (on a scale of 0-4). VMGD reminded residents and tourists that hazardous areas were near and around the volcanic crater, within a 395-m-radius permanent exclusion zone, and that volcanic ash and gas could reach areas impacted by trade winds.
Source: Vanuatu Meteorology and Geohazards Department (VMGD)
The Vanuatu Meteorology and Geo-hazards Department reported some stronger explosions at Yasur during 27-28 June. Based on webcam images the Wellington VAAC reported that on 29 June intermittent, low-level ash plumes rose to an altitude of 1.8 km (6,000 ft) a.s.l. and drifted NW. The Alert Level remained at 2 (on a scale of 0-4). VGO reminded residents and tourists that hazardous areas were near and around the volcanic crater, within a 395-m-radius permanent exclusion zone, and that volcanic ash and gas could reach areas impacted by trade winds.
Sources: Vanuatu Meteorology and Geohazards Department (VMGD); Wellington Volcanic Ash Advisory Center (VAAC)
Based on webcam images and local visual observations the Wellington VAAC reported that during 20-21 June intermittent, low-level ash plumes from Yasur rose to an altitude of 1.5 km (5,000 ft) a.s.l. and drifted SE.
Source: Wellington Volcanic Ash Advisory Center (VAAC)
Based on webcam images, satellite data, and local visual observations the Wellington VAAC reported that during 14-15 and 17-18 June intermittent, low-level ash plumes from Yasur rose to altitudes of 0.9-1.2 km (3,000-4,000 ft) a.s.l. and drifted SW, W, and N.
Source: Wellington Volcanic Ash Advisory Center (VAAC)
Based on webcam images and model data, the Wellington VAAC reported that during 5-6 June intermittent, low-level ash plumes from Yasur rose to an altitude of 1.5 km (5,000 ft) a.s.l. and drifted NW. Ash was not identified on satellite imagery.
Source: Wellington Volcanic Ash Advisory Center (VAAC)
On 25 April the Vanuatu Meteorology and Geo-hazards Department (VMGD) reported that ongoing explosive activity at Yasur was confined to the crater. The Alert Level remained at 2 (on a scale of 0-4). VGO reminded residents and tourists that hazardous areas were near and around the volcanic crater, within a 395-m-radius permanent exclusion zone, and that volcanic ash and gas could reach areas impacted by trade winds.
Source: Vanuatu Meteorology and Geohazards Department (VMGD)
Based on visual observations and satellite data, the Vanuatu Geohazards Observatory reported on 19 March that explosions at Yasur remained strong. The Alert Level remained at 2 (on a scale of 0-4). VGO reminded residents and tourists that hazardous areas were near and around the volcanic crater, within a 395-m-radius permanent exclusion zone, and that volcanic ash and gas could reach areas impacted by trade winds.
Source: Vanuatu Meteorology and Geohazards Department (VMGD)
On 7 December the Vanuatu Geohazards Observatory stated that the Alert Level for Yasur remained at 2 (on a scale of 0-4) and that, based on seismic data and visual observations, explosions continued to be intense. VGO reminded residents and tourists that hazardous areas were near and around the volcanic crater, within a 395-m-radius permanent exclusion zone, and that volcanic ash and gas could reach areas impacted by trade winds.
Source: Vanuatu Meteorology and Geohazards Department (VMGD)
On 31 October the Vanuatu Geohazards Observatory stated that the Alert Level for Yasur remained at 2 (on a scale of 0-4) and that, based on seismic data, explosions continued to be intense. VGO reminded residents and tourists that hazardous areas were near and around the volcanic crater, within a 395-m-radius permanent exclusion zone, and that volcanic ash and gas could reach areas impacted by trade winds.
Source: Vanuatu Meteorology and Geohazards Department (VMGD)
On 11 November the Vanuatu Geohazards Observatory stated that the Alert Level for Yasur remained at 2 (on a scale of 0-4) and that explosions continued to be intense. VGO reminded residents and tourists that hazardous areas were near and around the volcanic crater, within a 395-m-radius permanent exclusion zone, and that volcanic ash and gas could reach areas impacted by trade winds.
Source: Vanuatu Meteorology and Geohazards Department (VMGD)
On 15 October the Vanuatu Geohazards Observatory stated that the Alert Level for Yasur was raised to 3 (on a scale of 0-4), noting that explosions could become more intense. The Alert Level was lowered back to 2 on 18 October. VGO reminded residents and tourists that hazardous areas were near and around the volcanic crater, within a 600-m-radius permanent exclusion zone, and that volcanic ash and gas could reach areas impacted by trade winds.
Source: Vanuatu Meteorology and Geohazards Department (VMGD)
On 10 October the Vanuatu Geohazards Observatory stated that the Alert Level for Yasur remained at 2 (on a scale of 0-4) and that explosions continued to be intense. VGO reminded residents and tourists that hazardous areas were near and around the volcanic crater, within a 600-m-radius permanent exclusion zone, and that volcanic ash and gas could reach areas impacted by trade winds.
Source: Vanuatu Meteorology and Geohazards Department (VMGD)
On 9 September the Vanuatu Geohazards Observatory stated that the Alert Level for Yasur remained at 2 (on a scale of 0-4) and that explosions continued to be intense. VGO reminded residents and tourists that hazardous areas were near and around the volcanic crater, within a 600-m-radius permanent exclusion zone, and that volcanic ash and gas could reach areas impacted by trade winds.
Source: Vanuatu Meteorology and Geohazards Department (VMGD)
On 2 August the Vanuatu Geohazards Observatory stated that the Alert Level for Yasur remained at 2 (on a scale of 0-4) and that explosions continued to be intense. VGO reminded residents and tourists that hazardous areas were near and around the volcanic crater, within a 600-m-radius permanent exclusion zone, and that volcanic ash and gas could reach areas impacted by trade winds.
Source: Vanuatu Meteorology and Geohazards Department (VMGD)
On 28 June the Vanuatu Geohazards Observatory stated that the Alert Level for Yasur remained at 2 (on a scale of 0-4) and that explosions continued to be intense. VGO reminded residents and tourists that hazardous areas were near and around the volcanic crater, and that volcanic ash and gas could reach areas impacted by trade winds.
Source: Vanuatu Meteorology and Geohazards Department (VMGD)
On 27 May the Vanuatu Geohazards Observatory stated that the Alert Level for Yasur remained at 2 (on a scale of 0-4) and that explosions continued to be intense. VGO reminded residents and tourists that hazardous areas were near and around the volcanic crater, and that volcanic ash and gas could reach areas impacted by trade winds.
Source: Vanuatu Meteorology and Geohazards Department (VMGD)
On 31 March, the Vanuatu Geohazards Observatory stated that the Alert Level for Yasur remained at 2 (on a scale of 0-4) and that explosions were intense. VGO reminded residents and tourists that hazardous areas were near and around the volcanic crater, and that volcanic ash and gas could reach areas impacted by trade winds.
Source: Vanuatu Meteorology and Geohazards Department (VMGD)
On 14 January, the Vanuatu Geohazards Observatory stated that the Alert Level for Yasur remained at 2 (on a scale of 0-4) and that explosions had become more intense. VGO reminded residents and tourists that hazardous areas were near and around the volcanic crater, and that volcanic ash and gas could reach areas impacted by trade winds.
Source: Vanuatu Meteorology and Geohazards Department (VMGD)
On 15 December, the Vanuatu Geohazards Observatory stated that the Alert Level for Yasur remained at 2 (on a scale of 0-4) and that explosions had become more intense. VGO reminded residents and tourists that hazardous areas were near and around the volcanic crater, and that volcanic ash and gas could reach areas impacted by trade winds.
Source: Vanuatu Meteorology and Geohazards Department (VMGD)
On 13 November, the Vanuatu Geohazards Observatory stated that activity at Yasur had increased with more intense explosions. The Alert Level was raised to 2 (on a scale of 0-4). VGO reminded residents and tourists that hazardous areas were near and around the volcanic crater, and that volcanic ash and gas could reach areas impacted by trade winds.
Source: Vanuatu Meteorology and Geohazards Department (VMGD)
On 27 April, the Vanuatu Geohazards Observatory stated that Yasur continued in a state of unrest; the Alert Level remained at 1 (on a scale of 0-4). VGO reminded residents and tourists that hazardous areas were in proximity to and around the volcanic crater, and in volcanic ash and gas prone areas exposed to trade winds.
Source: Vanuatu Meteorology and Geohazards Department (VMGD)
On 19 November, the Vanuatu Geohazards Observatory reported that a new phase of ash emissions from Yasur began on 3 November. The intensity of the explosive activity remained low; therefore the Alert Level remained at 1 (on a scale of 0-4).
Source: Vanuatu Meteorology and Geohazards Department (VMGD)
On 28 May, the Vanuatu Geohazards Observatory reported that activity at Yasur continued to increase slightly, and bombs fell around the summit area, the tourist walk, and the parking area. Ash venting and dense white plumes from the crater were observed. Photos included in the report showed ash emissions and ashfall on 5 and 8 May, and dense white plumes on 23 and 24 May. The Alert Level remained at 2 (on a scale of 0-4).
Source: Vanuatu Meteorology and Geohazards Department (VMGD)
On 7 April, the Vanuatu Geohazards Observatory reported that explosive activity from Yasur had increased beginning on 2 April; explosions had become stronger and more frequent. Bombs fell around the summit area, the tourist walk, and the parking area. Moderate ash venting occurred on 2, 4, and 5 April, and possibly continued. The Alert Level was lowered to 2 (on a scale of 0-4).
Source: Vanuatu Meteorology and Geohazards Department (VMGD)
Following an assessment during 7-12 July, the Geohazards Observatory team concluded that explosive activity at Yasur had slightly increased, becoming stronger and more frequent, and shifting from Strombolian to sub-Plinian. Bombs ejected from the vents fell in the crater, around the summit area, and on the tourist walk and parking area. The explosions were heard, felt, and observed from nearby villages and schools. Activity at all three volcanic vents was characterized by degassing, ash emissions, and ejection of bombs. On 13 July the Alert Level was raised to 3 (on a scale of 0-4).
Source: Vanuatu Meteorology and Geohazards Department (VMGD)
On 13 June, the Vanuatu Geohazards Observatory reported that activity from Yasur decreased during the previous week after a brief period of high activity with significant explosions and ashfall. Even though Strombolian activity occasionally ejected bombs that fell around the crater, explosions had become slightly weaker and less frequent. The Alert Level was lowered to 2 (on a scale of 0-4).
Source: Vanuatu Meteorology and Geohazards Department (VMGD)
On 1 June, the Vanuatu Geohazards Observatory raised the Alert Level for Yasur to 3 (on a scale of 0-4) following increasing explosive activity during May. Access to the volcano was closed and a 500-m zone around the volcano was restricted. The Geohazards team noted strong explosions from all three active vents along with ash emissions and bomb ejections during 31 May-3 June. Bombs fell around the crater rim and explosions were heard and observed from nearby villages.
Source: Vanuatu Meteorology and Geohazards Department (VMGD)
On 12 May, the Vanuatu Geohazards Observatory reported that, based on information collected by the Vanuatu Meteorology and Geohazards Department, satellite imagery showed strong degassing from Yasur during the previous week. Residents living close to the volcano reported persistent strong explosions that were heard and felt on 12 May. The Vanuatu Volcano Alert Level (VVAL) remained at 2 (on a scale of 0-4).
Source: Vanuatu Meteorology and Geohazards Department (VMGD)
The Vanuatu Geohazards Observatory reported that the Vanuatu Volcano Alert Level (VVAL) for Yasur was increased to 3 (on a scale of 0-4) on 27 May. Recent activity was characterized by moderate to large eruptions with strong explosions, ejected bombs that fell on the visitor viewing area, and significant ashfall in nearby villages. Visitors were not allowed to enter a restricted zone, within about 500 m around the volcano. Activity had been escalating since January 2010. According to a news article, an eruption plume on 1 June rose to an altitude of 1.8 km (6,000 ft) a.s.l. and spread over 340 square kilometers, canceling or delaying some flights in and out of New Caledonia (about 430 km WSW).
Sources: Vanuatu Meteorology and Geohazards Department (VMGD); Agence France-Presse (AFP); Notimex
On 11 May the Vanuatu Geohazards Observatory reported that, following an assessment of Yasur during 26-27 April, activity from the volcano remained high. Strong degassing and ash emissions from all three active vents were noted. Ash fell on the E and W parts of the island. New bombs were deposited around the crater rim and in areas near the vents. Explosions were heard and seen from surrounding villages. Satellite imagery and seismic data confirmed strong degassing and explosive activity. The Vanuatu Volcano Alert Level (VVAL) remained at 2 (on a scale of 0-4).
Source: Vanuatu Meteorology and Geohazards Department (VMGD)
On 12 March, Vanuatu Geohazards Observatory reported that thermal anomalies from Yasur were detected in satellite imagery during 8 December 2009-8 March 2010. They also noted an increase in activity since January 2010. Satellite images from 21 January showed significant sulfur dioxide gas emissions. Bombs were ejected sometime during the week of 1 March. Observations on 8 March and analyses of seismic data also indicated increased activity, and all three vents were active. The Vanuatu Volcano Alert Level (VVAL) was raised to 2 (on a scale of 0-4).
Source: Vanuatu Meteorology and Geohazards Department (VMGD)
Based on a pilot observation, the Wellington VAAC reported that an ash plume from Yasur rose to an altitude of 4 km (13,000 ft) a.s.l. and drifted SE. Ash was not identified on satellite imagery.
Source: Wellington Volcanic Ash Advisory Center (VAAC)
According to a report from John Seach, eruptive activity at Yasur continued at "normal" levels during March, with an average of 500 explosions occurring per day.
Source: Volcano Live
An increase in activity at Yasur since October 2001 and the occurrence of a M 6 volcanic earthquake on 29 August at 1500 led scientists to increase the Alarm Level at Yasur to 3. This was the largest earthquake recorded at Yasur since seismic stations were installed in October 1992. Access to the volcano was prohibited and no evacuations were ordered.
Source: IRD Noumea via European Volcanological Society
An eruption occurred at Yasur on 25 January around 1300. A pilot reported that an ash cloud rose ~2 km a.s.l. and slowly drifted S. The ash cloud was not visible on satellite imagery, possibly due to heavy meteorological cloud cover.
Source: Wellington Volcanic Ash Advisory Center (VAAC)
Scientists were on alert for heightened volcanic activity at Yasur following a M 7.2 earthquake on 3 January at 0430 near Vanuatu. The earthquake produced landslides in Vanuatu's capital, Port Vila, and damaged buildings and bridges in the city, but there were no deaths or serious injuries. During 5 January to at least 16 January Yasur was active with ash falling on the population of Tanna Island, polluting water sources. The week of 6 January the Vanuatu government restricted access to the volcano's crater citing an increased risk of a large eruption since the 3 January earthquake. Authorities are prepared to evacuate residents from near the volcano if a large eruption occurs.
Source: ReliefWeb
Reports are organized chronologically and indexed below by Month/Year (Publication Volume:Number), and include a one-line summary. Click on the index link or scroll down to read the reports.
Frequent small Strombolian explosions
"[On 4 March] there were three aligned craters, perhaps 300 m apart . . ., heavy fumarolic activity occurred from the northernmost crater. Frequent noisy Strombolian activity ejected tephra to heights of tens of meters from the other two craters. Tephra did not rise above the volcano's summit."
Information Contacts: R. Stoiber, Dartmouth College.
Centuries-long Strombolian eruption continues from four vents
The following is a report from I.A. Nairn.
". . . The gas and ash plume discharged from the volcano is carried by the prevailing SE trade winds across the central parts of the island. During 1987 and 1988, vegetation in areas downwind from the volcano has been affected by gas, ash, and acid rain from the plume, causing damage to residents' gardens and coffee plantings in the centre of the island. The volcanic damage added to and accentuated that caused by a succession of three cyclones in 1987-88. Werner Giggenbach, Ian Nairn, and Bradley Scott of the New Zealand DSIR visited Tanna for two weeks in September 1988. The investigation was coordinated and funded by the New Zealand Ministry of Foreign Affairs.
"Although frequently visited by tourists, eruptive activity at Yasur has not been studied in detail since a 1959 seismic study by Blot and Tazieff. Activity between 1959 and 1978 was briefly described by Carney and Macfarlane (New Hebrides Government Geological Survey Regional Report, 1979).
"Explosive eruptions were frequent at Yasur during our 6-14 September observation period, with four vents active in the three main subcraters, and continuous steam emission from a 5th vent high on the W crater wall. This steam vent had formed since the last available aerial photography in September 1986. A gas plume was continuously emitted from a small active lava lake in the central subcrater, with intermittent gas discharges during explosive eruptions from the other three vents. All these gas discharges combined to produce a continuous and voluminous gas plume that extended downwind from the volcano. Discussions with local people, observations made by tourists in past years, and comparisons with published and unpublished photographs have indicated that eruptive activity was at a relatively high level during our inspection, probably with more frequent explosions from more active vents than was usual prior to 1987. The volcanic plume also now appears to be larger and more constant than typical of earlier dry seasons.
"Eruption observations (including video camera recordings) correlated with our seismic recordings have enabled the seismicity to be used as a continuous record of eruptive activity, and provide the only quantitative data on comparative activity and gas discharge. During an inspection in April-May 1959, Blot and Tazieff recorded an average of 5 explosion earthquakes/hour, at a time when Yasur was fairly quiet. During our September 1988 observations, an average rate of 21.5 explosion earthquakes/hour was recorded. Each explosion results from the discharge of volcanic gas, while the high level of recorded volcanic tremor is correlated with the continuous gas discharge through the lava lake. We infer that the gas discharge was considerably higher in September 1988 than in 1959. Many of the explosions occurred as sharp detonations, often preceded by 'flashing arcs' (atmospheric shock waves) visible in the steam and gas haze within the crater, and felt as a sharp slap by observers on the crater rim.
"The present subcraters are deep (estimated at ~250 m below the S crater rim by parallax bar heighting of aerial photographs, and angle/distance measurements to the central lava lake) with near-vertical walls. Although the most violent explosions threw bombs high above the crater rim, these were on near-vertical trajectories, so that nearly all the bombs fell back into the crater.
"During earlier periods of increased eruptive activity, such as in 1975, many bombs were thrown over the crater rim, probably due to a shallower and more gently sloping crater configuration. The frequent explosions now occurring may also be less violent due to greater gas discharge and magma convection rates maintaining higher temperatures, and thus lower viscosities and yield strengths in the uppermost parts of the magma columns. The only bomb observed to be thrown over the crater rim was sampled while still hot, and has a composition similar to that of bombs ejected in 1934 and 1975. This suggests that no major change in magma composition has accompanied the recent volcanic gas damage problems.
"Gas samples collected from the plume crossing Yasur crater rim contained SO2 and HCl gases at concentrations between 3 and 9 ppm. The mass discharge rate of volcanic gases was not measured but our visual comparison of plume size with other volcanoes suggests that the Yasur discharge rate was between 400 and 800 tons/day SO2. This output and gas composition are typical of other volcanoes around the Pacific rim. SO2 and HCl are removed from volcanic plumes by rainout of condensing steam within the plume, rainfall through the plume, and adsorbed onto ash falling from the plume. Studies elsewhere have shown that damage to vegetation is most likely to have resulted from acids dissolved in water, most effectively applied to foliage as light rain or mist and accentuated by the presence of fine ash particles. These mechanisms appear to have caused the vegetation damage.
"Radiocarbon samples collected from Yasur pyroclastic fall deposits downwind... suggest that... continuous small-scale Strombolian activity has been in progress for the last 800 years, with at least two discrete subplinian scoria fall eruptions occurring between 1,400 and 800 years BP."
References.
Blot, C., Chaigneau, M., and Tazieff, H., 1960, Nouvelles-Hebrides (Mars-Mai 1959): BV, v. 23, p. 207-210.
Geology of Tanna, Aneityum, Futuna and Aniwa. 1978: 1:100,000 New Hebrides Geological Survey Sheet 11.
Information Contacts: I. A. Nairn, NZGS Rotorua.
Incandescent tephra ejection; small lava lakes; strong SO2 emission
The Vanuatu arc was visited by an ORSTOM mission 5-18 September. The following is modified from their report in the LAVE Bulletin.
Volcanic activity, consisting of block and ash emissions, and bubbling lava lakes, seemed slightly decreased since visits during 1988. The configuration of the main crater and its three principal sub-craters (A,B,C; figure 1) remained relatively unchanged. The depth from the summit to the base of the crater was estimated at >350 m, placing activity at or below sea level.
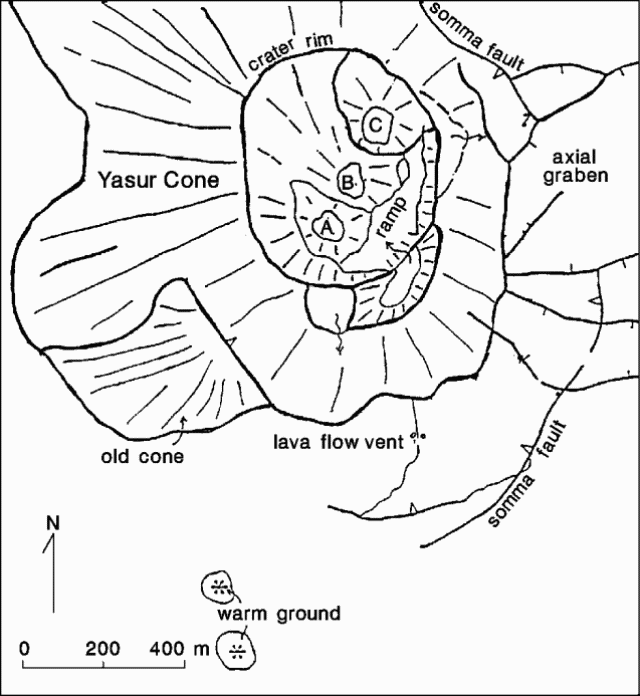 |
Figure 1. Sketch map of Yasur showing the locations of the principal craters and sub-craters (from Nairn and others, 1988). |
In sub-crater A, a new lava lake (~20-25 m in length) was visible; strong turbulence in the lake due to rising gas bubbles caused lava to move N-S. Explosions at other vents (notably one in the S part of sub-crater B) corresponded with increased intensity of lava lake activity. Two other vents in sub-crater A had explosions that ejected ash and incandescent blocks. The blocks had loud detonations on impact.
Projectiles and night glow were visible from a lava lake in sub-crater B, hidden from view by a ridge. Explosions were identified from at least three vents, with frequencies of 1 explosion/5 minutes to 1/hour. Sub-crater C was less active, occasionally emitting puffs of ash or gas following explosions in sub-crater B. There were no visible shock waves or ejecta being deposited outside of the crater, as there were in 1988, suggesting a decrease in the intensity of activity.
Concentrations of 5-10 ppm SO2 were measured in the plume, 1 ppm from the ash plain below the plume, and 0.5 ppm, 3 km from the volcano. The SO2 flux was estimated to be 1,200 ± 600 t/d, based on the measured concentrations and a visual estimate of the plume volume. This is greater than the flux usually registered at other volcanoes in the Vanuatu arc (100-600 t/d). During 1987-88, vegetation in areas downwind from the volcano was affected by gas, ash, and acid rain, causing damage to gardens and coffee plantings.
Reference. Nairn, I.A., Scott, B.J., and Giggenbach, W.F., 1988, Yasur volcano investigations, Vanuatu, Sept. 1988: New Zealand Geological Survey Report, no. G134, 74 p.
Further Reference. Eissen, J.P., Monzier, M., Robin, C., Picard, C., and Douglas, C., 1990, Report on the volcanological field work on Ambrym and Tanna Islands (Vanuatu) from 2 to 25 September 1990: Rapport Missions Sci Terre Geologie-Geophysique - ORSTOM (Noumea), no. 22, p. 1-22.
Information Contacts: M. Lardy, ORSTOM, New Caledonia; B. Marty, CNRS, France; LAVE.
Continued block and ash emissions; small episodic lava lakes
"Activity remained unchanged during 1990-91, with block and ash emissions and small episodic lava lakes."
Information Contacts: C. Robin and M. Monzier, ORSTOM, New Caledonia; M. Lardy and C. Douglas, ORSTOM, Vanuatu; C. Mortimer, Dept of Geology, Mines, and Rural Water Supply, Vanuatu; J. Eissen, ORSTOM, France.
Strombolian activity and/or small lava lakes at four vents
The following is from a report by Gérard Granger on activity observed from the summit's main crater rim on 17 and 18 August (LAVE Bulletin, no. 34, Paris, France, p. 2-3).
Active lava lakes and/or Strombolian activity were visible at four vents (A, B, B', and B''; figure 2) within the large pit crater located at the center of the main crater. The fifth summit vent (C), NE of the central pit crater, appeared inactive.
 |
Figure 2. Sketch map of the summit of Yasur, 17-18 August 1991. Courtesy of G. Granger. |
Vent A is located within a deep cylindrical pit, with a 100-m-high nearly vertical S wall. Although the lava surface was not visible, continuous lava fountaining ejected material several meters above the rim. Rare explosions (two on 17 August during 9 hours of observations, and one during 6 hours the next day) threw lava clots 50-80 m above the rim.
Strombolian activity occurred at a small ash cone (vent B), just below the E rim of the central pit crater. Several tens of explosions occurred/hour, occasionally with 7-8 explosions in rapid succession. The narrow eruptive plume rose above the rim of the main summit crater, obscuring the view of vents B' and B'' from the SW rim (point N).
Located within a cinder cone at the NW base of the central pit-crater wall, the 10-m-wide vent B' was the site of the most intense activity. On 17 August, a small, continuously bubbling lava lake was periodically visible within the cone. By the following day, the surface level of the lake had dropped, and it was no longer visible. Approximately one explosion was heard/second, accompanied by ejections of fluid lava. Several (usually ~10) times/hour, a large explosion sent a fountain to 100 m height.
Vent B'' is located within a continuously incandescent crater, 80 m below the top of the NE wall of the central pit crater, where it joins crater C. Loud explosions occurred at a rate of 3 or 4/hour, dropping ballistics onto the pit crater rim. Large quantities of ash were emitted following the explosions.
Information Contacts: G. Granger, LAVE.
Ash-laden explosions and gas emission
Observations from the W part of the crater rim on 28 October 1992 revealed low-level activity in Zone A, (S section of the crater) and substantial gas emission with faint explosions in Zone B (central section). Significant activity was observed in Zone C (N section) with large explosions and lava ejections reaching the rim. Explosions were heavily ash-laden and an ash cloud was clearly visible from the NW side of the volcano. Steam emission decreased through October because of low rainfall. A total of 21 earthquakes were recorded in 3 hours during 28 October fieldwork. The surface area of Lake Siwi had retreated by about one-third since the beginning of October and the river which feeds it had dried up.
On 8 November no significant explosive activity was observed. Small explosions with white gas emissions were observed in Zone A. No activity was observed in Zone B. There were heavy ash-laden gas emissions in Zone C. A continuous loud noise was heard from one of the vents, possibly in Zone C, which appeared to act as an escape valve, perhaps explaining the lack of significant explosive activity. Explosive activity resumed on 10 and 11 November, but was much less frequent and intense than in April, May, and October.
Information Contacts: M. Lardy and D. Charley, LAVE.
Frequent bomb ejections continue; increased activity during 1994
During October 1993, a telemetered surveillance station registered variations in the seismicity at Yasur. The station is located 2 km from the crater on the ashflow plain (figure 3). Seismicity (detected at five stations) generally increased from October 1993 to January 1994, corresponding to renewed eruptive activity. Very strong activity from January 1994 to January 1995 (comparable to 1976-77) ejected bombs in a radius of ~400 m from the crater rim (figure 4). Ashfall measured at the surveillance station totaled ~12 cm during January-October 1994. Seismicity remained high throughout 1994, then declined after January 1995.
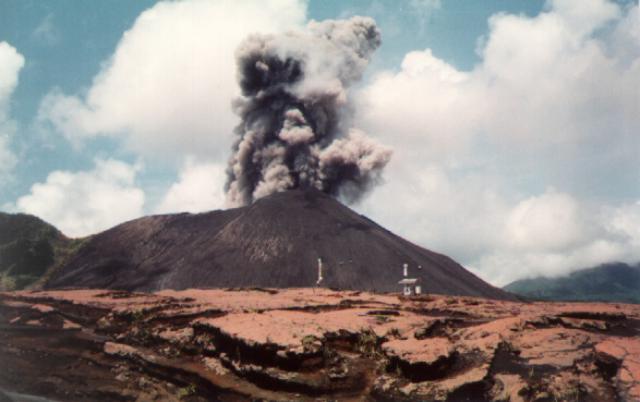 |
Figure 3. Photograph of an explosion at Yasur on 17 March 1994. The ARGOS-linked monitoring station is in the foreground. View is approximately to the W. Photo by M. Lardy, courtesy of ORSTOM. |
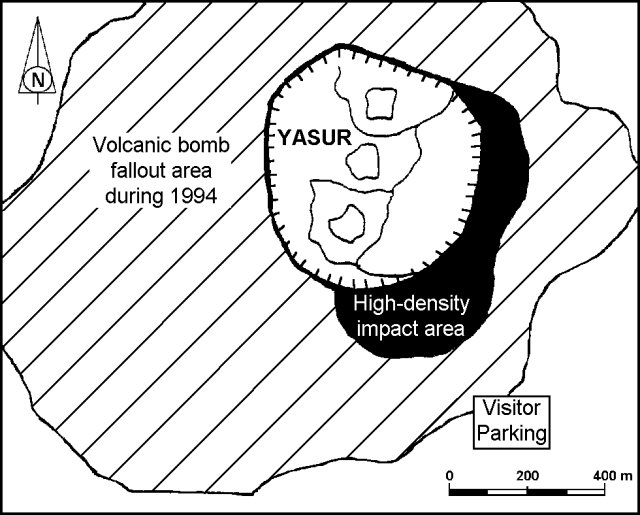 |
Figure 4. Sketch map of Yasur showing the area of volcanic bomb fallout during 1994. Courtesy of ORSTOM. |
Because Yasur is very accessible, it has been promoted as a tourist destination, resulting in a greater number of visitors and greater risk of accidents. In mid-January 1994 and early February 1995, when activity began to decline, there were two accidents with three victims. In one incident, two visitors on the crater rim died when they were struck by a 15 kg bomb ejected from the vent. Although there is little danger when the volcano is having regular explosions at intervals of a few minutes to tens of minutes, the local authorities want to better inform visitors of the constant danger. In January 1994, ORSTOM began publishing a series of booklets to inform the general public of the volcanic risks. Risks discussed include bombs falling near the crater, modifications of the crater topography (raising of the floor, migration of the vent, etc.). In addition, the 200-m distance between the observation site and the active vents, and the very frequent bomb ejections at speeds of 100-300 m/second that have rendered approaching the crater rim dangerous.
Information Contacts: M. Lardy and D. Charley, Centre ORSTOM, Port Vila, Vanuatu, and Department des Mines et de la Geologie et des Ressources en Eaux; J. Tabbagh, Centre de Teleobservation Informatise des Volcans, Garchy, France; J-P. Eissen, Centre ORSTOM de Brest, France; C. Robin and M. Monzier, Centre ORSTOM, Quito, Ecuador.
Continued Strombolian eruptions ejecting bombs at ~150 m/second
The very intense activity recorded throughout 1994 (BGVN 20:08) decreased in 1995. Observations during a visit on 7 November 1995 showed that the volcano had returned to a "normal" level of activity, consisting of explosions, lava fountaining, and ash emissions. Approaching Yasur is always dangerous because the trajectories of volcanic bombs are unpredictable; acoustic and optical measurements have revealed that some bombs have initial ejection velocities of ~150 m/second.
A permanent telemetered seismic monitoring station located 2 km from the summit has been in operation since 1993. The majority of recorded signals correspond directly to volcanic explosions. High seismicity corresponding to the elevated level of volcanism during 1994 (figure 5) decreased throughout 1995.
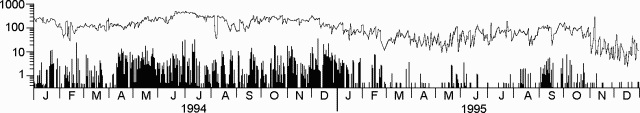 |
Figure 5. Daily seismicity at Yasur recorded by the seismometer 2 km from the summit, 1994-95. The upper line shows all events with a seismograph displacement greater than 12 µm. The bars indicate the number of larger events, those with a displacement greater than 60 µm. Note that the scale is logarithmic. Courtesy of ORSTOM. |
Information Contacts: M. Lardy and D. Charley, Centre ORSTOM, BP 76, Port Vila, Vanuatu, and Départment des Mines et de la Géologie et des Ressources en Eaux; J. Tabbagh, Centre de Téléobservation Informatisé des Volcans, CNRS-CRG, Garchy, France; S. Vergniolle, Institut de Physique du Globe, Paris, France; J-P. Eissen, Centre ORSTOM de Brest, BP 70, 29280 Plouzane, France; C. Robin and M. Monzier, Centre ORSTOM, Apartado 17-11-6596, Quito, Ecuador.
Strombolian activity during July from three summit craters within the main crater
Although very intense activity was recorded during 1994, volcanism decreased in 1995 and was at normal levels (explosions, lava fountaining, and ash emissions) in November 1995. After a period of significant increase in the number and intensity of explosions during June 1996, activity returned to a quieter, but sustained, level (figure 6).
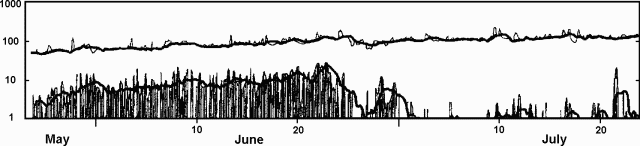 |
Figure 6. Seismicity at Yasur recorded every 4 hours by the seismometer 2 km from the summit, 24 May-23 July 1996. The upper line shows all events with a seismograph displacement greater than 12 µm. The vertical bars on the bottom of the graph indicate the number of larger events, those with a displacement greater than 60 µm. Thick lines are an 8-measurement (32-hour) running mean. Note that the scale is logarithmic. Courtesy of ORSTOM. |
Observations made during 3-5 July showed that explosive Strombolian activity was fairly significant. Heavy ash-and-steam plumes, visible from surrounding villages, frequently rose several hundreds of meters above the volcano, accompanied by loud rumbling/roaring noises. The summit crater is ~250 m deep, and is occupied by three smaller active craters (figure 7). During observation the explosive activity and intense degassing came from six vents (one in Crater A; three in Crater B; two in Crater C).
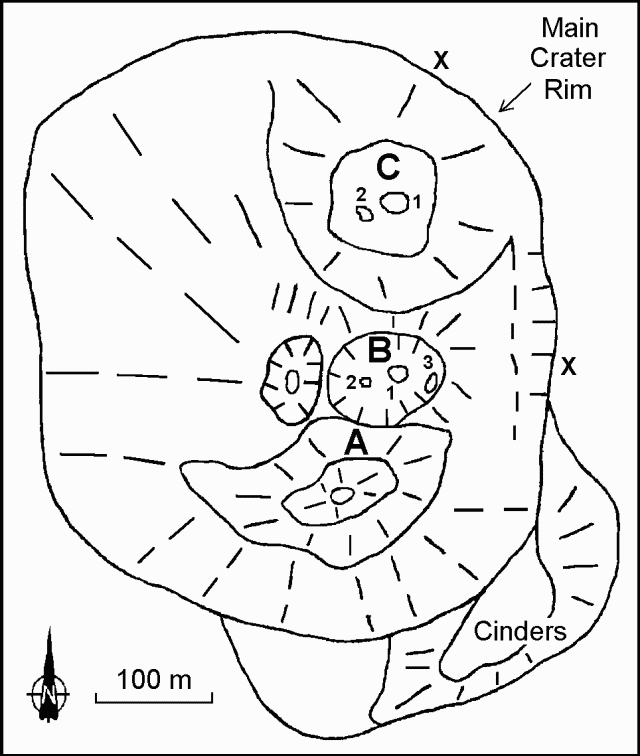 |
Figure 7. Sketch map showing the summit craters at Yasur, 3-5 July 1996. Observation points are indicated by an "X". Courtesy of Henry Gaudru, SVE. |
Crater A was a pit with a S vertical wall ~100 m high. On the morning of 3 July between 1130 and 1330 the activity was principally characterized by frequent and intermittent explosions that generated ejections of magma fragments to several dozens of meters above the vent, sometimes surpassing the upper rim of the crater. A steam-and-ash plume regularly followed the explosive activity.
Crater B, smaller than A and separated from it by a small wall, had more sustained explosive activity from several vents, of which two (B1-B2) were particularly active with strong degassing. Bombs were regularly ejected >300 m vertically, often surpassing the highest point on the crater rim. The most active vent (B1) showed activity phases of continuous, very violent jets that lasted between 1 and 5 minutes, notably between 1930 and 2230 on 3 July. Pressurized gas intermittently generated a blue-orange flame. Good-sized magma fragments projected several meters above this vent were accompanied by strong detonations and intense degassing. Based on calculations made following several hours of observations, the ejection speed was estimated at 230-250 m/second. A third vent (B3) near the E rim was also very active but in a less violent and frequent manner. Two other vents, more westward, visible for an instant, showed mainly intense degassing sometimes accompanied by magma ejections to some meters above the red glow.
Crater C is a large depression with a lava lake in its center, usually agitated by surface movements. Violent explosions sent heavy gray-black ash plumes several hundreds of meters above the crater. Weak magma ejections also occurred from a glowing zone SW of the main lava lake. On the night of 3-4 July an intermittent flame came from the interior of this pit. Several times during the night, Strombolian explosions occurred simultaneously in these two areas.
A count of magma-ejecting explosions made over three 1-hour periods showed that Crater B was consistently more active. On 3 July between 1800 and 1900 a total of 63 explosions were distributed as follows: Crater A, 10; Crater B, 33; Crater C, 20. On 3 July between 2030 and 2130 a total of 51 explosions were distributed as follows: Crater A, 8; Crater B, 26; Crater C, 17. On 4 July between 1000 and 1100 a total of 54 explosions were distributed as follows: Crater A, 10; Crater B, 28; Crater C, 16.
On 5 July between 1430 and 1600, activity was much less frequent than the previous days, with explosions followed by long minutes of silence. The lava lake was quite visible in Crater C. During this period craters A and C were more active than B. At 1545 a larger explosion from Crater B generated some bomb falls at the extreme edge of the crater.
Information Contacts: Henry Gaudru, C. Pittet, C. Bopp, and G. Borel, Société Volcanologique Européenne, C.P. 1, 1211 Genève 17, Switzerland (URL: http://www.sveurop.org/); Michel Lardy, Centre ORSTOM, B.P. 76, Port Vila, Vanuatu.
Mid-August visit discloses ongoing Strombolian eruptions from six vents
On 13 August 1997, Steve O'Meara and Robert Benward climbed Yasur from the NE (the Sulphur Bay side); they camped for two evenings on the volcano's summit at the E lip of the main crater (figures 8, 9, and 10). On 16 and 17 August they hiked on the S side of the volcano up to 150 m from the summit where they watched the eruptions for two hours each night. They shot video footage of dramatic, night-time intracrater activity abundant molten bombs hurling inside the crater, with many sticking to the steep crater walls. Reported explosion heights were determined by timing the fall of a fragment from the apex of its curve and using the equation x = 1/2 gt2.
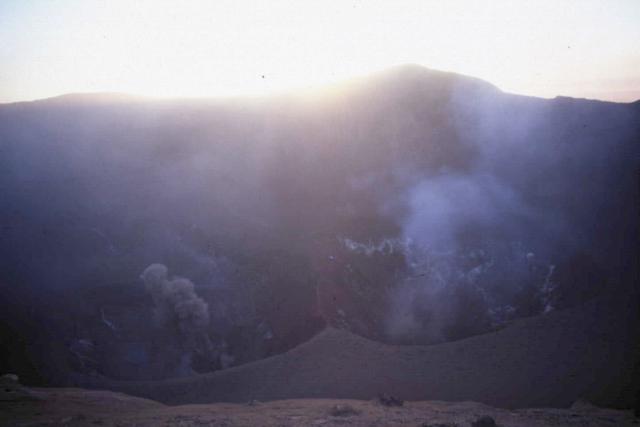 |
Figure 8. Photograph of Yasur showing a dual ash eruption from the S and N craters; sunset, 13 August 1997. View is from the E. Courtesy of Stephen and Donna O'Meara. |
 |
Figure 9. Photograph of Yasur showing a thin 150-m-high explosion in the N crater; early morning, 14 August 1997. View is from the E along the Jupiter trail. Courtesy of Stephen and Donna O'Meara. |
 |
Figure 10. Photograph of Yasur showing a wide-angle view of the summit with Strombolian activity in the N crater; dusk, 14 August 1997. View is from the E. Courtesy of Stephen and Donna O'Meara. |
The interior of the crater sloped sharply inward to a depth of ~70 m, where it intercepted a broad platform of ash punctuated by two roughly equally sized, oval-shaped craters, each ~70 m in diameter and 70 m deep. The craters were aligned N-S, and separated by an E-W trending ridge of ash. Each crater had three erupting vents.
North Crater observations. The active vent on the far E floor continuously spewed lava fragments 10-20 m high with coughing and splashing sounds. Occasionally a web-like bubble of lava rose out of the vent and burst as it expanded. Small puffs of steam and ash accompanied some of the more forceful discharges of gas. Several times during 13-15 August Strombolian explosions shot lava fragments 100-170 m into the air. One of the strongest explosions, on 15 August, directed ENE, showered the summit with volcanic bombs. One football- sized bomb fell ~30 m from the observers who collected it and donated it to the Smithsonian Institution. This explosion was followed by a sequence of blasts at intervals varying between 15 minutes and a few hours. As a qualitative measure of the explosions' intensity the observers reported that some of the strongest ones shook the ground, and they could feel the shock waves pound against their chests.
Two other vents were located on the SE and SW parts of the crater floor. These issued sporadic, small columns of ash rising to heights of ~100 m before dispersing in the high winds at the summit.
On the night of 16 August the N crater was still continuously spattering. The following night two blasts threw fragments ~200 m above the crater.
South Crater observations. This crater produced ash clouds from three vents, (two in the E- central section and one on the W side of the crater's floor). On 13 August the emissions were almost continuous; the central vents appeared to be filled with ash and the eruptions started as a boiling up of ash that sent ripples out from the center. As the ash column formed, a shower of incandescent rocks rose within it to a height of ~15 m before the fragments rained back down into the vent. In general these eruptions were relatively silent, sounding like sand being dumped from a truck, followed by the thudding of rocks as they hit the ground. Distinct snapping sounds occurred ~ 2 seconds after the incandescent rocks began rushing up the ash column, possibly due to static discharge. Within the next 24 hours the W vent became gradually less active, and the two central vents merged into a single larger vent.
During the two observation periods on 16 and 17 August the S crater was extremely active with explosions every 10 to 15 minutes. The sounds rivaled those of the strong Strombolian explosions from the N crater.
Information Contacts: Stephen O'Meara, Donna O'Meara, and Robert Benward, Volcano Watch International, Nature *Stock, PO Box 218, Volcano, HI 96785, USA.
Strombolian eruptions; decreasing seismic activity since March 1997
ORSTOM reported in late November that there has been little change in the appearance of Yasur's crater since February 1997. During this interval only craters B and C (figure 11) were active; crater A was quiet. Crater B produced a few explosions and small ash plumes; occasionally small lava bombs (a few tens of centimeter in diameter) reached the lip of the crater.
 |
Figure 11. Sketch of the summit crater area at Yasur. Labels A, B, and C correspond to named craters. The sketch was based on photographs taken on 28 February 1997. Drawn by Alfreda Mabonlala; provided courtesy of P. Gineste, ORSTOM. |
Seismic signals in 1997 (figure 12), with frequencies of 1-7 Hz, were related to Strombolian explosions and correlated with surface phenomena (Nabyl and others, 1997). All signals were recorded 2 km from the crater (figure 13), relayed to an ARGOS satellite, and then to the receiving station. Regional seismicity accounted for a small percentage of signals and thus had negligible effect on event counts.
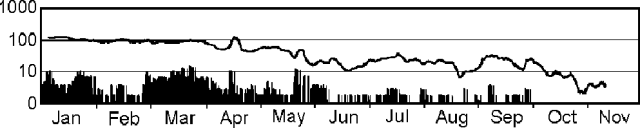 |
Figure 12. Daily seismicity and smoothed average seismicity recorded at Yasur during January through early November 1997. The solid line depicts smoothed averages of 25 recording periods; the averages were made to the number of events with vertical displacements reaching over 12 µm. The histogram shows the number of events with vertical displacements over 60 µm; these stronger events were absent during October and early November 1997. Such quiet intervals were common during early 1996 and much of 1995. Courtesy of ORSTOM. |
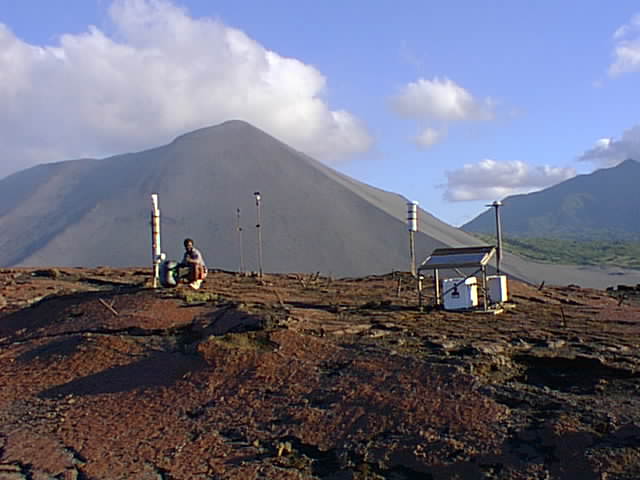 |
Figure 13. The ARGOS-linked monitoring station with Yasur to the N in the background, 2 November 1997. Courtesy of Pascal Gineste, ORSTOM. |
Continuous seismic monitoring since March 1997 (figure 12) revealed a general decrease in Strombolian activity over time. Still, some powerful explosions were recorded during August 1997 (BGVN 22:08). These powerful events occurred only a few times per day and had vertical displacements greater than 60 µm; their scarcity was taken as a further indication of decreased activity. Since October 1993, seismic monitors recorded periods of high activity during December 1993-March 1995 and during May 1996-April 1997; slightly elevated activity occurred during August-October 1995. It was also reported by ORSTOM that an undisclosed radiometric technique suggested that fresh magma entered the system in May 1996.
During 29 July-4 August 1997 a team from the Soci't' de Volcanologie GenŠve (SVG) visited Yasur and made visual and other observations, including some temperature estimates of lavas using an optical pyrometer. The team saw small but almost continuous Strombolian activity in the N vents area. The continuous activity was interrupted by stronger explosions every 1-1.5 hours; the explosions threw lava fragments in all directions. The fragments fell mainly inside the crater but sometimes fell on the NE part of the outside rim; in one instance, a bomb ~1 m in diameter was found still hot on the rim. The stronger phases of the eruption were accompanied by ground vibrations. Small convulsing ash clouds sometimes issued from another part of the vent area, indicating that at least two separate vents were active.
At the S vents area, the SVG team observed gas, ash, and old material suddenly and noisily emitting from different vents during the beginning of their visit; a few to no red lava fragments were projected during these emissions. The activity sounded like a jet engine and caused gases to ignite. Towards the end of their visit, the team observed that the quantity of ash emitted had increased; the eruptions created ash clouds that were easily seen from the volcano's foot.
The SVG team measured temperatures with an infrared (1.55 µm wavelength) optical pyrometer (Optix-G, Keller GMBH., Ibbenburen-Lagenbeck). At an opening in the N vents area, a maximum temperature of 581°C was obtained on a weakly incandescent area. Strong degassing was present around the target at the time of the measurement (2 August).
 |
Figure 14. Photograph of Yasur looking N on 2 November 1997. Courtesy of Pascal Gineste, ORSTOM. |
 |
Figure 15. Photograph looking N towards Yasur with a dry lake bed in the foreground, 2 November 1997. In 1975 there was a landslide of 50,000 m3 of material, leaving a detachment scar 100 m wide that can be seen in this photo. Courtesy of Pascal Gineste, ORSTOM. |
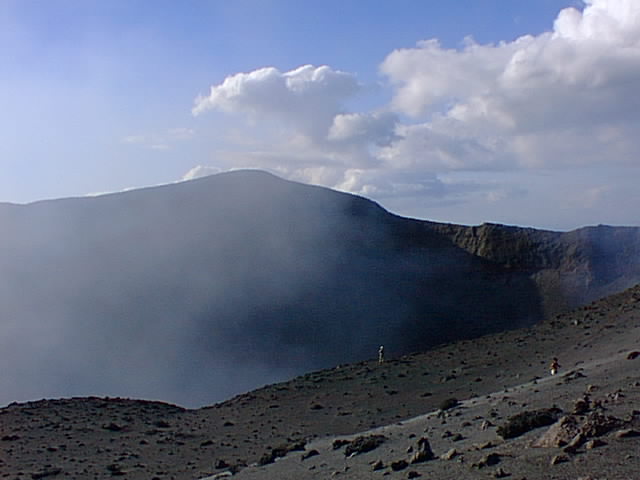 |
Figure 16. Photograph looking S at the crater rim of Yasur during a period of quiet activity, 2 November 1997. Courtesy of Pascal Gineste, ORSTOM. |
Reference. Nabyl, A., J. Dorel, and M. Lardy, 1997, A comparative study of low frequency seismic signals recorded at Stromboli (Italy) and Yasur (Vanuatu), New Zealand Journal of Geol. and Geophys. (December issue).
Information Contacts: M. Lardy, D. Charley, and P. Gineste, Centre ORSTOM, BP 76, Port Vila, Vanuatu, and Départment des Mines et de la Géologie et des Resources en Eaux; J. Tabbagh, Centre de Téléobservation Informatisé des Volcans, CNRS-CRG, Garchy, France; A. Nabyl and J. Dorel, OPG, Centre de recherches volcaniques (CRV), Clermont Ferrand, France; Mf. le Cloarec, Centre des faibles radioactivités CFR, Gif sur Yvette, France; P. Vetch and S. Haefeli, Société de Volcanologie Genève (SVG), C.P. 298, CH-1225, Chene-bourg, Switzerland.
Ongoing eruption, felt earthquake, and fresh glass chemical analysis
On 9 September 1998, an earthquake was felt in a village 3 km from Yasur; simultaneously, loud explosions were heard from the volcano. When the summit was visited by John Seach during 10-11 September, five craters inside the main summit crater in the pyroclastic cone were found to be active. Crater A, large and on the S, displayed quiet explosions followed by brown ash emission. Other craters were quiet with only gas emissions. These included the smaller Crater B, in the center of the main crater; the larger Crater C, on the N; the small Crater D located W of Crater B; and Crater E, on the SW wall of the main crater.
During 4 hours of observation on 10 September, 51 explosions were observed from four craters: Crater A, 25 explosions; Crater B, 9; Crater C, 13; and Crater D, 4. Bombs thrown from Craters B, C, and D fell back into the vent or onto the crater wall. Some larger explosions, every 20-30 minutes, threw bombs 350 m high. During the night, bombs thrown onto the crater wall glowed for up to 6 minutes. The explosions and shaking were felt up to 3 km away.
A fresh bomb collected in August 1997 (BGVN 22:08) was recently analyzed by microprobe (table 1).
Table 1. Major element analysis of Yasur glass taken from an average of five analyses on fresh glass bomb collected in August 1997. All iron is shown as FeO. Microprobe analysis courtesy of Timothy O'Hearn; sample courtesy of Steve and Donna O'Meara, and Robert Benward.
| Component | Weight % |
| SiO2 | 58.61 |
| TiO2 | 0.95 |
| Al203 | 15.07 |
| FeOt | 8.68 |
| MnO | 0.25 |
| MgO | 2.49 |
| CaO | 5.44 |
| Na2O | 3.52 |
| K2O | 3.78 |
| P2O5 | 0.66 |
| Total | 99.46 |
Information Contacts: John Seach, P.O. Box 16, Chatsworth Island, N.S.W. 2469, Australia; Tim O'Hearn, Department of Mineral Sciences, Smithsonian Institution, Washington, DC 20560-0119 USA.
Cyclical eruptive activity documented during 1994-98
Five years of seismic monitoring at Yasur (figure 17) suggests cycles of several months duration. Long periods of vigorous Strombolian and associated seismic activity have been followed by shorter periods of lower activity. Specifically, as seen in the upper part of figure 17, more vigorous eruptions and seismic activity prevailed from January 1994 to February 1995; this was followed by a sustained period of lower intensity activity during April-August 1995. More vigorous Strombolian eruptions and seismicity returned during May 1996-June 1997; this was followed by a quieter period during July-December 1997 (middle part of figure 17). Next, intense eruptive and seismic activity again prevailed during January-May 1998 (bottom part of figure 17); limited explosive behavior occurred from June 1998 to May 1999. The latter interval included the explosions seen during 9-10 September 1998 (BGVN 23:09), events that in the broad overview of Yasur's behavior ranked as comparatively modest.
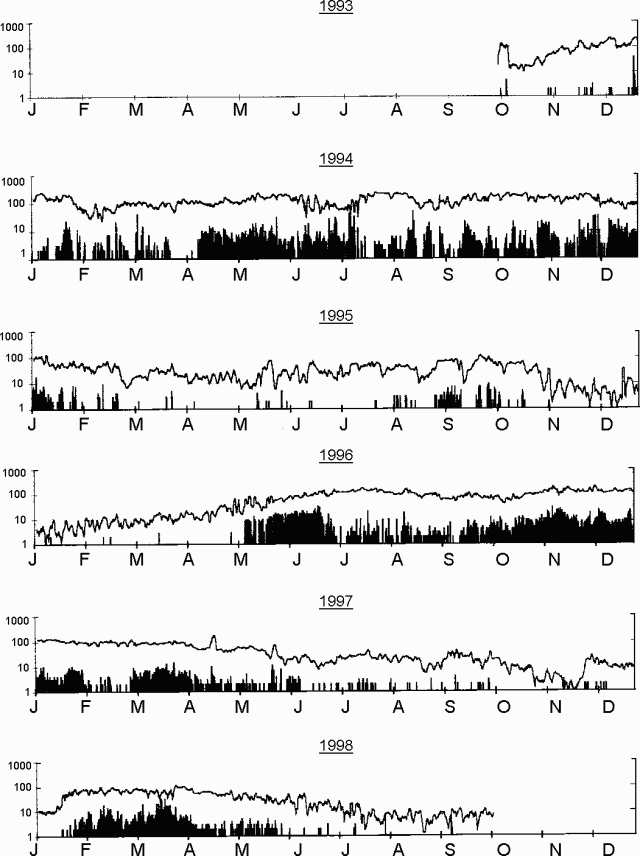 |
Figure 17. Daily seismicity recorded 2 km from Yasur during January 1994 through October 1998. The lines represent total counts for events with seismograph displacements greater than 12.5 µm; note that the lines are plotted on a logarithmic vertical scale. Data after October 1998 were not available. Courtesy of IRD. |
A large bomb ejected during January 1998 landed in a relatively flat spot more than 300 m from the crater's E rim (figure 18, bold star). Figure 19 shows a photo of the bomb and its impact crater taken after the bomb cooled. The bomb's size and the distance from the crater attests to the danger of approaching the vents and working on the volcano.
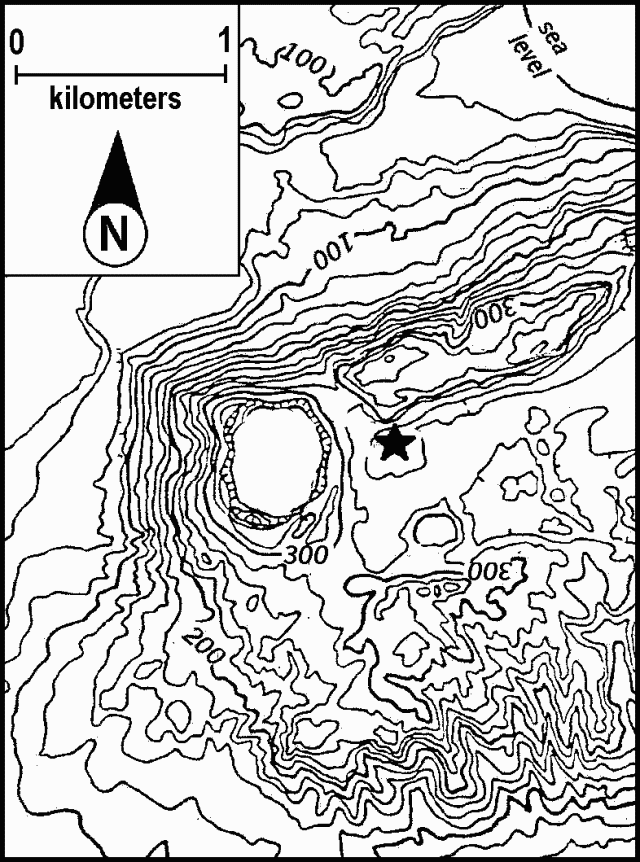 |
Figure 18. A topographic map of Yasur's crater and vicinity (N Tanna Island) showing the point where a large bomb struck (bold star to E of crater) in January-February 1998. Contours indicate elevations in meters (20 m contour interval). The sea lies on the map's upper right corner. Courtesy of Michel Lardy, IRD. |
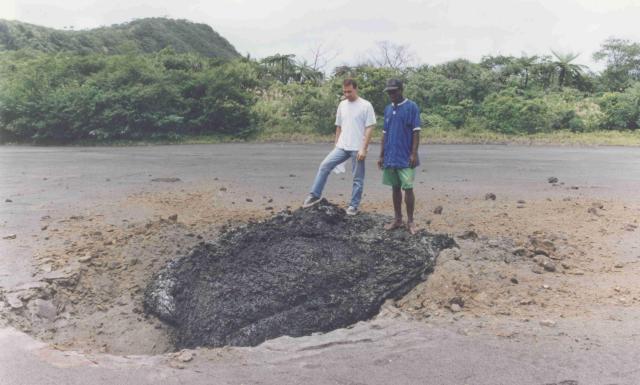 |
Figure 19. Bomb ejected from Yasur found ~ 300 m from the E rim. The photograph was taken in January 1998. Courtesy IRD. |
An artist's rendering (figure 20) depicts the crater configuration in March 1998; this morphology was established following the high-activity period of 1994. Only two crater-like vents remained, B and C ("A" was gone; BGVN 20:08, 21:08, 21:09, 22:08, and 22:11). Few if any subsequent changes occurred between March 1998 (when the sketch was made) and mid-May 1999; similarly, structural changes were also absent in this interval.
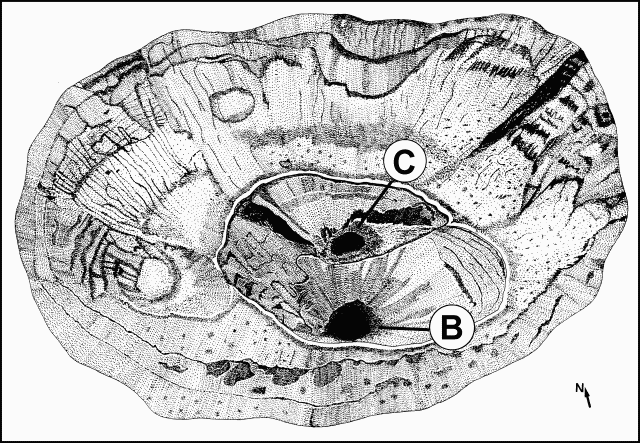 |
Figure 20. Yasur crater (Tanna Island) as it appeared in March 1998; the crater stretches ~ 700 m in the NE-SW direction by ~ 400 m in the NW-SE direction. Labels B and C correspond to named craters. The sketch was made from a photograph; courtesy of Alfréda Mabonlala and IRD. |
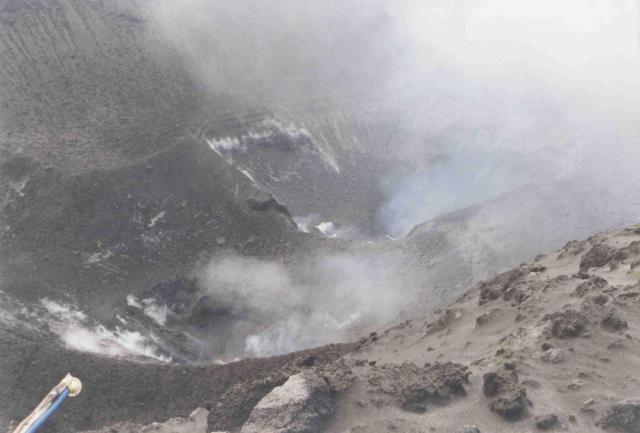 |
Figure 21. Yasur's two active intracrater vents, B (foreground) and C (farther back), as shot looking to the N in March 1998. The tube in the left foreground holds a filter for collecting samples for Polonium lab analysis. Courtesy of Michel Lardy, IRD. |
Information Contacts: Michel Lardy, Institut de recherche pour le développement (IRD), P.O. Box 76, Port Vila, Vanuatu; Jeannette Tabbagh, CRG-CNRS,58150 Garchy, France; Douglas Charley, Department of Geology, Mines and Water Resources, PMB 01, Port Vila, Vanuatu.
Relatively quiet interval ends May 1999; bombs ejected up to 600 m beyond rim
From April 1998 to April 1999 the activity of Yasur remained very low, but in May 1999 there was renewed strong activity. From the beginning of June until mid-July ejecta (with andesitic bombs up to meter size) was thrown to distances up to 600 m from the nearest edge of the crater (figure 22). This long-range dispersal reflected a change in the direction of the eruptive vents.
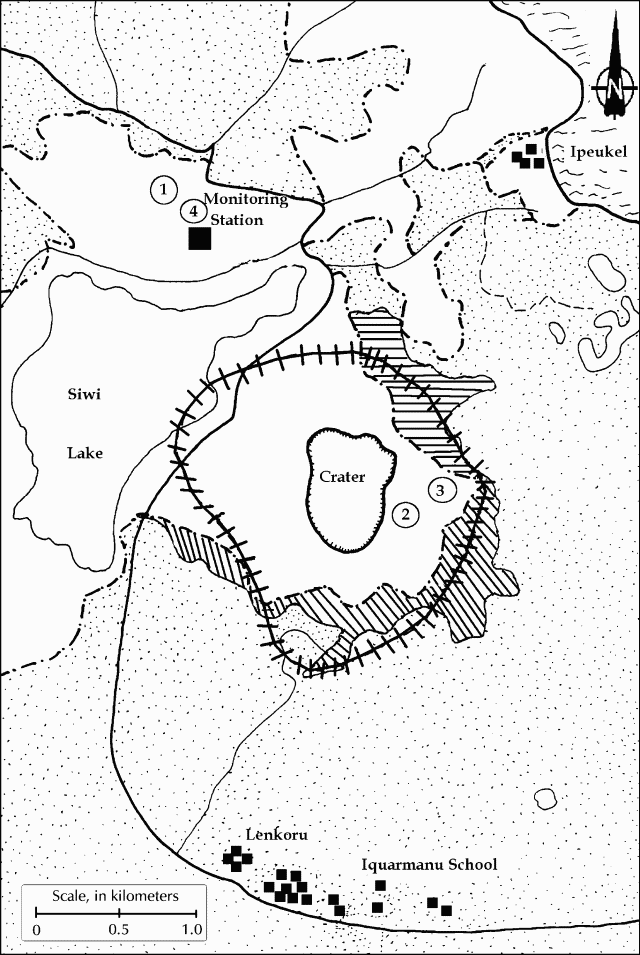 |
Figure 22. A sketch map of Yasur's crater area showing the limit of bomb impacts (the elliptical cross-hatched line), 15 June - 17 July 1999. Vegetation is shown by stipples (dense) and a lined pattern (scattered). Courtesy of Michel Lardy and Douglas Charley. Original base map by A. Mabonlala, IRD. |
The explosive activity was greater than at the beginning of 1994. Based on observations made over the past few years (BGVN 24:04), the emissions of intermittent ash associated with the on-going high explosive activity could continue for a period of months. In early June, half-day-long ashfalls accumulating to 3 mm thickness were noted at distances of up to 2 km from the crater, and in July ashfall occurred to the extreme N of the island.
The activity remains at Type 2, defined as periods of more explosive activity lasting for weeks or months which result in the ejection of bombs in the area surrounding the crater and minor ashfalls which are distributed by the trade winds to the NW and sometimes towards the central part of the island or to the W coast. During such periods access to the crater edge and its surroundings is prohibited due to the frequent, intense fall of bombs.
Information Contacts: Michel Lardy, Institut de Recherche pour le Développment (IRD), P.O.Box 76, Port Vila, Vanuatu; Douglas Charley, Department of Geology, Mines and Water Resources, PMB 01, Port Vila, Vanuatu.
Typical explosive activity observed in February
Yasur volcano was visited during 18-20 February by John Seach, Geoff Mackley, and a film crew from the United Kingdom. There was a lower level of activity than in June and July 1999 (BGVN 24:07). "Level 1" activity predominated, defined as normal activity where bombs generally fall within the cone area. The three main craters within the cone, A, B, and C, are aligned S to N.
On 18 February Crater A silently emitted small amounts of white vapor tinged with blue. The following day observers saw emission of brown ash but again heard no noise from the crater. Crater B was also silent and only emitted a small amount of white vapor. Two smaller craters E of Craters A and B were continually full of vapor. Crater C exhibited the main activity. There were two active vents at the N and S ends of the crater. The inside crater wall was strongly fumarolic. Over a 2-hour period Crater C produced four explosions from the N vent and three from the S vent. Incandescent bombs were thrown to a height of 120 m. Some bombs glowed for 30 minutes after dark.
On 19 February observers lowered themselves 50 m to the floor of the Yasur cone from the SE using ropes. Ground temperature 15 m S of Crater C was 96°C. The floor was littered with black bombs up to 1.5 m in diameter and covered with ash. Explosions threw lava to a height of 250 m. Bombs were either thrown straight up or directed towards the NW edge of the cone. Explosions occurred ten times per hour and were accompanied by ground shaking and sometimes shockwaves. Degassing was heard every few seconds between explosions. Inside the cone a number of earthquakes were felt which were not accompanied by explosions or degassing; these earthquakes were not felt by observers on the crater rim, 100 m away. Inside the cone there was a strong sulfur smell and fumes irritated eyes.
On 20 February activity increased. Incandescent lava was ejected every few seconds. Larger explosions about 8 times per hour sent lava to 300 m elevation and 100 m away from the vent. The active vents glowed orange after dark.
The NW flanks of Yasur cone down to Lake Siwi were littered with large bombs from the 1999 activity. Black bombs to 3 m in diameter were observed at the base of the cone. Approaching Yasur remains dangerous at any time for visitors. Vehicles can be driven to within 20 m of the cone and this encourages tourists to visit the crater edge. Unpredictable trajectories of bombs and variable eruptive activity pose threats to visitors. It should be noted that three deaths occurred on Yasur in 1994-95 during a period of low activity (BGVN 20:08).
Information Contacts: John Seach, PO Box 16, Chatsworth Island, N.S.W. 2469, Australia.
Still erupting despite 10-fold tremor decrease beginning November 1999
Since the end of Yasur's recent very active period during June-November 1999 (BGVN 24:07), volcanic tremor underwent an abrupt drop (figure 23). IRD seismologists define tremor amplitudes at "level 3" for signals 12-60 um and "level 4" for signals over 60 um. As figure 23 shows, the number of tremors at level 3 recorded between January 2000 and November 2001 was ten-times lower than that recorded each year between 1995 and 1998. In that same 22-month period, only a few dozen seismic events of over 60 µm amplitude were recorded (BGVN 24:04).
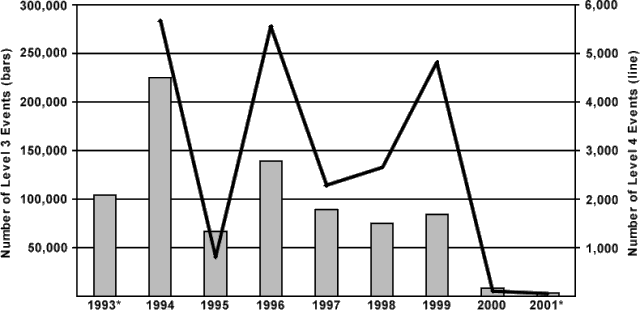 |
Figure 23. Tremor recorded at Yasur during late January 1993 through November 2001. Bars relate to the left-hand scale and show the yearly number of level 3 events (amplitudes of 12-60 µm). Points connected by lines relate to the right-hand scale and show the yearly number of level 4 events (amplitudes over 60 µm). Asterisks indicate years with incomplete data, as follows: (a) for 1993, only level 3 data were available for the entire year; and (b) the 2001 data shown only extends through 1 November 2001. Courtesy Michel Lardy, Janette Tabbagh, Douglas Charley, and Sandrine Wallez. |
The eruptive activity observed at vent A, in the southern part of the crater (figures 24, 25, and 26), shifted following a violent event that affected the northern part of the crater at areas B and C in October 1999. Since this event, the explosive activity has remained mild, and limited to vent C, the northernmost vent of the crater.
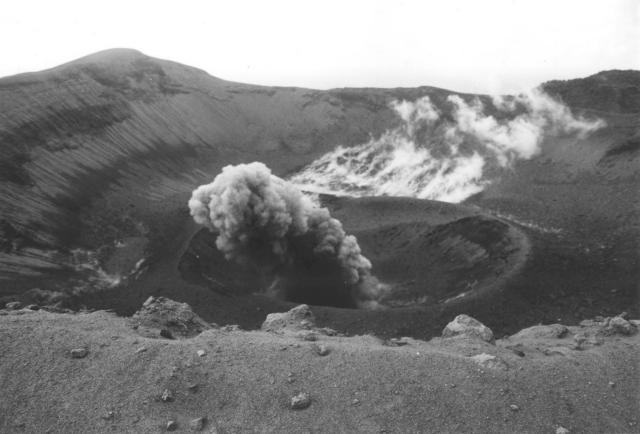 |
Figure 24. A view of the crater of Yasur on 2 October 1999, taken facing N while on the southern edge. Copyrighted photo courtesy of Michel Lardy, IRD. |
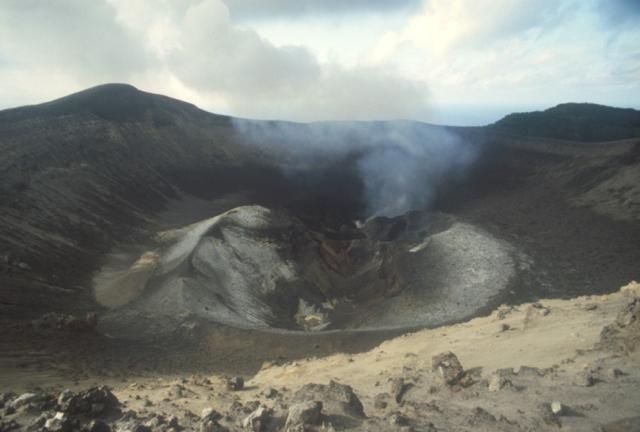 |
Figure 25. A view of the crater of Yasur on 9 September 2001, taken facing N while on the southern edge. Copyrighted photo courtesy of Michel Lardy, IRD. |
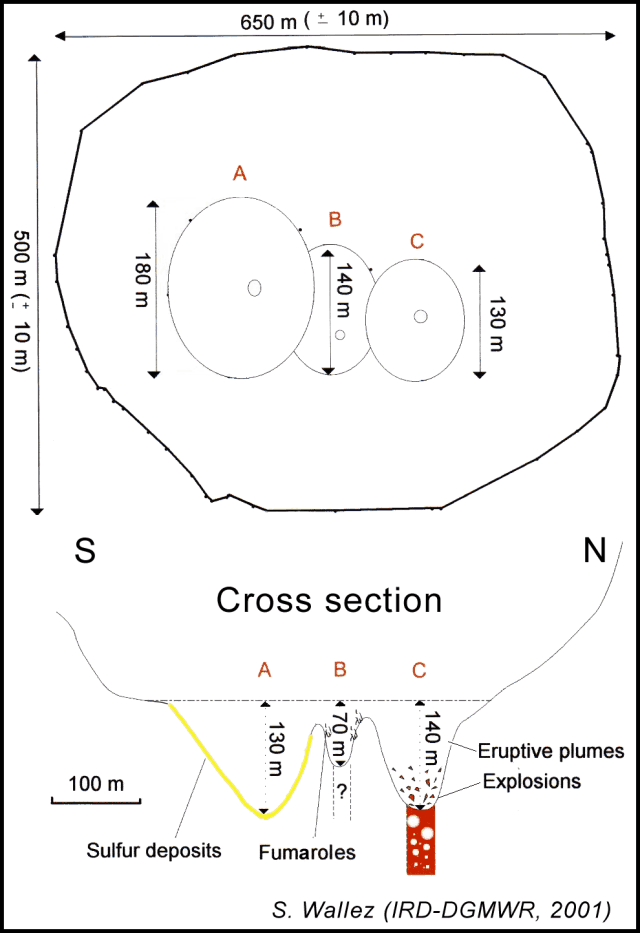 |
Figure 26. A September 2001 visit to Yasur's summit craters with GPS and laser telemetry resulted in this sketch map and N-S cross section. Courtesy of Douglas Charley and Sandrine Wallez (Vanuatu Department of Geology, Mines and Water Resources), and Michel Lardy (IRD). |
A comparison of photographs taken from the southern crater rim in October 1999 (figure 24) and in September 2001 (figure 25) revealed no profound difference in crater morphology. However, during September 2001 vents A and B were plugged and only vent C was active, with ejecta being sent 170 m above the bottom of the crater.
During September 2001, Douglas Charley, Michel Lardy, and Sandrine Wallez undertook a detailed survey of the craters. They used GPS positioning and laser telemetry to produce a map and cross-section showing crater topography and nomenclature (figure 26).
Observations on 12 October 2000. Jeff and Raine Williams, sailing aboard the S/Y Gryphon, visited Yasur on 12 October 2000. From ~8 km away a thick plume of steam and smoke could be seen rising from the peak. The route carried the visitors close to the base of the volcano and across the ash plain that stretches for nearly 1.5 km in each direction from the N flank of the mountain. A narrow stream cuts through the plain at its lowest point, and until recently a freshwater lake had filled the lower basin. Heavy rains earlier in the year resulted in the destruction of the lake's natural dam and left eroded ravines. Their guide drove up through the jungle to the steepest part of the unvegetated cinder cone. From there they hiked ~400 m to the crater rim, a ridge with a sheer 90-120 m drop to the crater floor. Only one of the crater pits was active, producing a constant pillar of steam and smoke. Occasionally the wind would blow strong enough to clear the crater floor, allowing views of the lava glow. Every five or ten minutes the volcano would "cough" or "bark" while throwing red-hot cinders hundreds of feet in the air, tracing red arcs back to the sides of the crater where they glowed for several more minutes. One explosion sent ejecta as high as the rim, but away from the observers. As night fell, red light from the crater was illuminating the pit and the rising steam.
Information Contacts: Janette Tabbagh, Université Paris VI, UMR 7619, Coordination des recherches Volcanologiques (CRV), 4 Place Jussieu, 75252 Paris Cedex 05, France; Michel Lardy, Institut de Recherche pour le développement (IRD), CRV, BP A 5 Nouméa, Nouvelle Calédonie; Sandrine Wallez and Douglas Charley, Department of Geology, Mines and Water Resources, PMB 01, Port-Vila, Vanuatu; Jeff and Raine Williams, P.O. Box 729, Funkstown, MD 21734, USA.
Mild eruptive phase ends and leads to a vigorous phase in December 2001; seismic data
Following 22 months of mild eruptive activity (BGVN 26:11), at the end of October 2001 on-site volcanologists observed the beginning of a more vigorous eruptive phase. The phase's progressive onset was also monitored seismically, which revealed an initial cycle of substantial activity that developed during the first half of December (figure 27). This was followed by a calmer interval, 14-25 December, after which a new burst of activity took place.
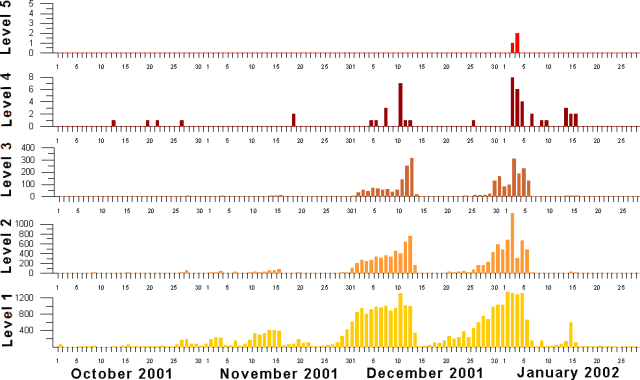 |
Figure 27. Seismicity recorded at Yasur during 1 October 2001 through 31 January 2002. Levels 1-5 have been defined by a signal-processing algorithm (see text). The units on the vertical axes are counts at the various levels. The two level-5 events correspond to large tectonic earthquakes. Courtesy of Michel Lardy, IRD. |
The seismic counts at Yasur (figure 27) can be explained as follows. A geophone is connected to an amplifier that generates signals in response to rapid vertical ground-movements. When the system's output signal (1-20 Hz) crosses a predefined threshold 8 times, the contents of the memory of the counter keyed to that particular threshold are increased by one. For a new count to begin, there has to be an interruption of the signal of at least 2 seconds. The permanent apparatus installed at Yasur for measurement of seismic variation is set to measure across 5 such thresholds, corresponding to an amplitude of just a few micrometers (level 1) to over 300 µm (level 5). The first four thresholds (levels) variously reflect Yasur's state of Strombolian activity.
At levels 1 and 2, one can observe hundreds, sometimes thousands, of seismic counts per day. During periods of high activity, paradoxically, one notes a lessening of the number of these counts, either because the counters are saturated, or because the background noise remains above the set threshold. In contrast, level 3, gives a representative idea of the volcano's daily activity: A count in the two-digit range indicates low activity; a daily count in the hundreds indicates high or even very high activity. For level 4, a few counts per day indicates high activity (a status of type 2 on the local hazard map), and when in excess of 10 counts per day, very high activity.
Regarding level 5-from the time since recording began in October 1993 to date-only major regional earthquakes have generated such high-amplitude signals. The counts for large earthquakes do not fully represent the assigned momement-magnitudes. That is the case here, for the main shock of the large tectonic earthquake on 2 January (M 7.2) attained fewer counts than the aftershock (M 6.6, figure 27).
A visit to the crater area on 31 December revealed that the majority of ash emission and ballistic projectiles were limited to area C (see map in BGVN 26:11) and that a vent of 20-30 m diameter, dormant at the time of earlier visits, had formed in area A (figure 28).
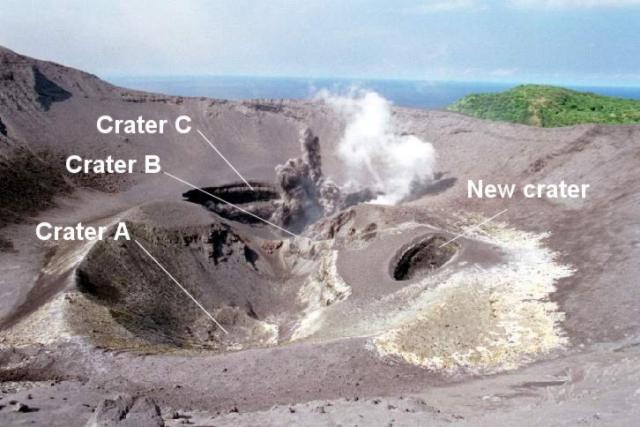 |
Figure 28. A picture taken of the area within Yasur's main crater showing smaller inner craters ("areas") A, B, C, and a new crater, as seen 31 December 2001. Note the small plumes coming from crater C. Copyrighted photo by S. Wallez. |
Observers witnessed Strombolian eruptions on 29, 30, and 31 December 2001 (figure 29). This activity was accompanied by considerable ash falling in a narrow band over the NE coastal area of the island. Close to a thousand residents suffered the effects of the ashfall, which also negatively impacted subsistence agriculture and the local collection of rainfall as a source of fresh water.
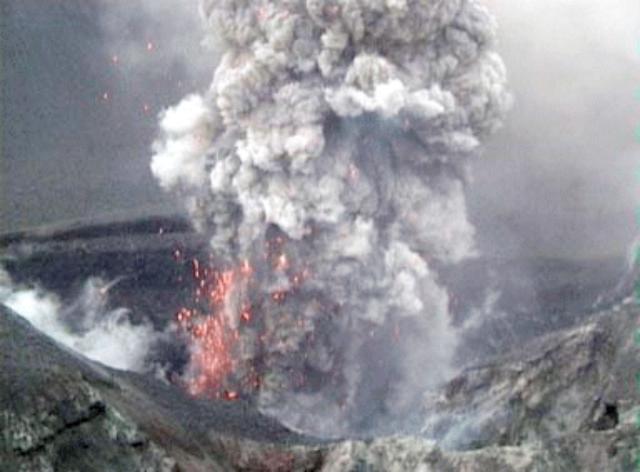 |
Figure 29. Details of an explosion in Yasur's area C on 31 December 2001. This photo is one of a series taken at half-second intervals. Copyrighted photo by S. Wallez. |
High-magnitude earthquakes. On 2 and 3 January 2002 large tectonic earthquakes struck over 200 km N of Tanna Island (Mw 7.2 and 6.6 respectively). They were felt by the population of Tanna, and recorded by the seismic monitoring station at level 5 (figure 27). Subsequent records showed a considerable weakening of volcanic activity a few days following the earthquake, similar to the pattern observed after the (1-14 December 2001 cycle). It is common for high-magnitude earthquakes (M > 6) near the center of the Vanuatu island group to be felt in Tanna, over 200 km away. To date, after 8 years of continuous monitoring (BGVN 26:11), no connection has been observed between such earthquakes and shifts towards more hazardous behavior at Yasur.
Information Contacts: Janette Tabbagh, Université Paris VI, UMR 7619, Coordination des Rechershes Volcanologiques (CRV), 4 Place Jussieu, 75252 Paris Cedex 05, France; Michel Lardy, Institut de Recherche pour le Développement (IRD), CRV, BP A 5 Nouméa, Nouvelle Calédonie; Sandrine Wallez and Douglas Charley, Department of Geology, Mines and Water Resources, PMB 01, Port-Vila, Vanuatu.
Eruptive activity from the summit crater continued through 2002
Eruptive activity has continued at Yasur since a more vigorous phase began in October 2001 that lasted at least into January 2002 (BGVN 27:01). This report includes details for a period of mild activity during 24-28 July 2000 (not previously included in the Bulletin). Since that time visitors noted activity continuing in October 2000 and September 2001 (BGVN 26:11), as well as October and December 2001 (BGVN 27:01). Accounts are provided below of activity during January, August, November, and December 2002. Finally, MODIS thermal-alert data confirm intermittent lower level activity in 2001, and an increase in vigor beginning in August 2002.
Observations during July 2000. Roberto Carniel, Douglas Charley, and Marco Fulle arrived on Tanna Island on 24 July 2000 and camped at the base of the E slope of the cone. The lake that used to fill part of the surrounding Ash Plain had disappeared after heavy rains during the rainy season caused the overflow of the lake, damaging several houses in the village of Sulphur Bay. In the active crater, three smaller craters were distinguished, named A, B, and C, from left to right as seen from the E rim, where local guides bring tourists. This spot lies no more than 150 m from the most active C vents (figure 30). During the visit Crater B was slightly active, while Crater A appeared dormant.
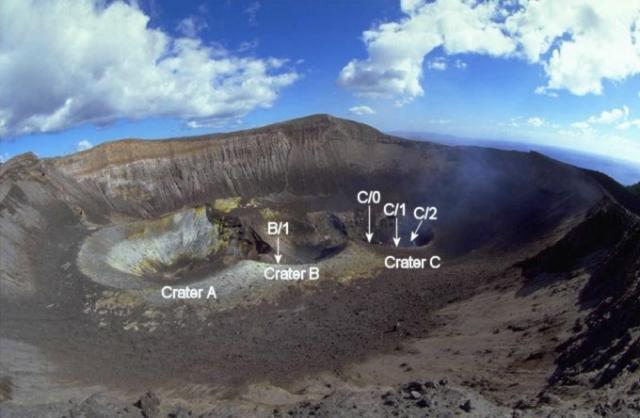 |
Figure 30. Photo showing the three subcraters within the active summit crater of Yasur, 24 July 2000. The N end of the island of Tanna and the Pacific Ocean can be seen in the right background. Courtesy of Marco Fulle. |
On the afternoon of 24 July the activity was moderate to high. Between 1620 and 1640 frequent spattering was observed by Carniel at the C/1 and C/2 vents. Between 1640 and 1820 eight eruptions were observed at vent C/0, with another 10 eruptions at vent C/1. On average the latter vent exhibited the bigger eruptions, in one case accompanied by gray emissions.
During the morning of 25 July the activity was again quite intense; observations were sometimes disturbed by a strong wind. Between 0825 and 0910 the explosions were mostly concentrated in the C/0 vent (six eruptions). Some of them were accompanied by the emission of brown ash at the end. During this period three silent explosions with only brown ash emitted were observed at vent B/1, completely inactive the previous day. C/1 showed only one eruption. After 20 minutes with no eruptions, from 0930 to 1130 the activity was mostly concentrated in the C/1 vent, where 17 eruptions were observed, some ended by a brown ash emission. The vent also showed about ten minutes of frequent spattering around 1120; during the same period B/1 vent produced two more silent ash eruptions and a brief spattering was observed at a vent, C/2, that looked different from C/1 but did not show any other activity after this. After 0930 vent C/0 did not show any activity.
During the afternoon, new visual observations were made by Carniel. From 1700 to 1725 very low activity was observed. Two successive silent brown ash eruptions from vent B/1 accompanied the start of a more intense phase for vent C/1. This vent erupted 15 times between 1725 and 1855, sometimes also showing continuous spattering and glow. Again no activity was seen at vent C/0.
During the morning of 26 July visual observations were made between 0835 and 1125. The first ten minutes were characterized by continuous and loud spattering at vent C/1, which showed a total of 18 explosions, some of them extremely loud and/or accompanied by the emission of gray ash. Vent C/0 showed only three eruptions, but all very loud and followed by a brown ash emission. One single silent ash eruption was observed at vent B/1 at 0945.
Carniel made other visual observations between 1700 and 1750 on the afternoon of 26 July, when the activity was characterized by a variable level of continuous spattering from vent C/1, which also showed 10 eruptions. During this period vent C/0 showed a single eruption at 1736. No activity was observed in crater B.
After a morning characterized by rain, Carniel and Fulle climbed the volcano again on the afternoon of 27 July. The air was still humid and gas stayed over the craters. The volcano was very quiet between the eruptions, with no sounds and no spattering at any vent. Between 1630 and 1730 there were 14 eruptions observed at vent C/1, but most of them were gas-rich emissions with very few bombs reaching the vent rim. Only two eruptions slightly bigger than spattering were observed at vent C/0.
On the morning of 28 July 2000, before leaving the volcano, the team made their last visual observations. Activity was moderate and visibility not very good. Many eruptions were very loud and they could be ascribed to C/1 from the sound alone, even when not visible. At 0920 a rockfall was heard from the S side of the caldera rim.
Observations during January 2002. The International Federation of Red Cross and Red Crescent Societies noted on 16 January 2002 that scientists were on alert for heightened volcanic activity at Yasur following a M 7.2 earthquake on 3 January. The earthquake produced landslides in Vanuatu's capital, Port Vila on Efate Island, and damaged buildings and bridges in the city, but there were no deaths or serious injuries. During 5 January to at least 16 January ash fell on Tanna Island, polluting water sources. The week of 6 January the Vanuatu government restricted access to the volcano's crater citing an increased risk of an eruption since the 3 January earthquake.
The Volcanic Ash Advisory Center in Wellington notified aviators of an eruption on 25 January around 1300. A pilot reported that the ash cloud rose to ~2 km altitude and slowly drifted S. The ash cloud was not visible on satellite imagery, possibly due to heavy meteorological cloud cover.
Observations during August 2002. The European Volcanological Society posted a report from the Institut de Recherche pour le Développement (IRD) on 3 September 2002. At that time the increasing level of activity at Yasur since October 2001 and the M 6 earthquake of 29 August 2002 had prompted IRD to upgrade the hazard status to Alarm Level 3, closing access to the volcano. The earthquake was strongly felt by residents of the entire district around the volcano. This was the first time since the seismic station was installed in October 1992 that a shock of such magnitude was recorded. Elders of the Yasur district confirmed that such an earthquake had not been experienced within living memory. The installation of two new seismological monitoring stations is planned, to complement the existing alarm system installed 2 km from Yasur and the Isangel station.
Observations during November 2002. On 22 November 2002 a group of passengers from the Zegrahm Expeditions cruise ship Clipper Odyssey visited the summit area. They observed Strombolian activity from one crater and heard thunderous whooshing sounds followed by thick yellow and white smoke from another.
Observations during December 2002. John Seach visited to the volcano on 7 December 2002, approaching by 4WD vehicle across the dry bed of Lake Siwi, which drained in 2000 after a collapse of the natural dam on the N end of the ash plain. Reports from Sulphur Bay village indicated that many houses were destroyed by the flooding. Flowing water from the lake eroded a 5-m-deep section of ground at the location of the dam (figure 31).
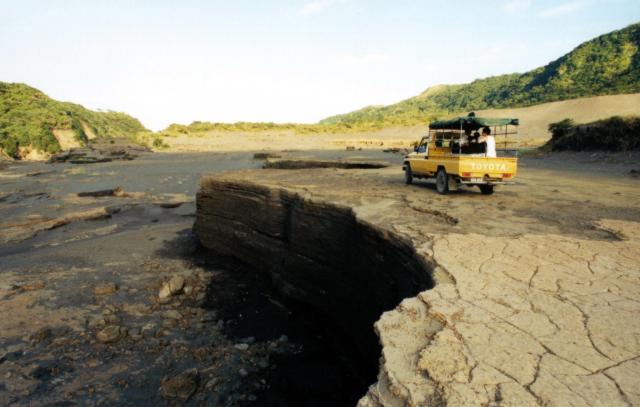 |
Figure 31. Erosion channel at the N end of the ash plain at Yasur caused by draining of Lake Siwi. Courtesy of John Seach. |
Three fumaroles were active on the caldera wall near the parking area at the summit. The crater rim was climbed from the SE and observations made from 1700 to 1930. Yasur showed a high level of activity with up to three vents erupting simultaneously inside the main crater. Eruptions occurred every one or two seconds during the 2.5-hour stay at the summit. Most eruptions were Strombolian with glowing bombs sent up to 150 m above the crater (figure 32). Projectiles generally fell back inside the crater, but the northern-most vent occasionally sent glowing lava bombs over the N and NE crater rims. Mild Vulcanian eruptions occurred at times with ash ejected to 100 m above the crater. Bombs were ejected as either glowing orange blobs of lava or black crusted material. Eruptions were accompanied by loud explosions and ground shaking. Bombs impacting on the ash made a sound like raindrops.
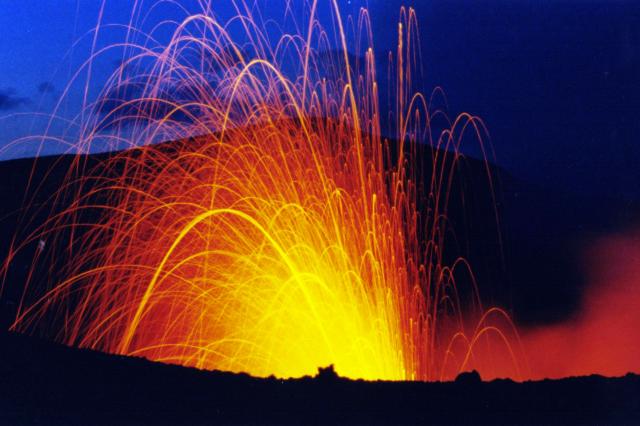 |
Figure 32. Time-lapse nigh photo of a Strombolian eruption from Yasur (southern vent) on 7 December 2002. Courtesy of John Seach. |
Seismic counts made by the Institute of Research and Development (Noumea) showed an increase in eruptive activity at Yasur in the beginning of December 2002 with Level 3 events increasing from 10 to 40 per hour (see BGVN 27:01 for description of seismic count data). Seismic counts remained elevated until the end of January 2003 when activity reduced to pre-December 2002 levels.
MODVOLC Thermal Alerts, 2001-2002. MODIS alerts occurred only three times in 2001 but increased in frequency, size, and alert ratio during 2002 (figure 33). The alerts that occurred in 2001, on 10 March, 4 April, and 31 August, were characterized by a single alert-pixel with very low alert ratio. Ground reports for this period noted mild eruptive activity, with vigorous Strombolian activity beginning in late December 2001 (BGVN 26:11 and 27:01). From 31 January 2002 MODIS indicates quasi-continuous activity throughout the year, which was at its most intense in the two months beginning 29 August 2002 (2210 local time). This followed the M 6 volcanic earthquake at 1500. A map of alert-pixel coordinates places them consistently E of the crater, but this may be a geolocation error rather than being indicative of a new vent.
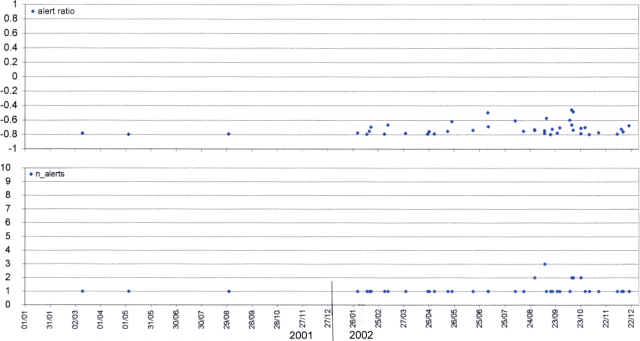 |
Figure 33. MODIS thermal alerts on Yasur during 2001-2002. Courtesy of Diego Coppola and David Rothery, The Open University. |
Information Contacts: Roberto Carniel, Università di Udine, Italy (URL: http://www.swisseduc.ch/stromboli/); Douglas Charley, Département de la Géologie, des Mines et des Ressources en eau, Vanuatu; Marco Fulle, Osservatorio Astronomico, Trieste, Italy (URL: http://www.swisseduc.ch/stromboli/); Diego Coppola and David A. Rothery, Department of Earth Sciences, The Open University, Milton Keynes, MK7 6AA, United Kingdom; John Seach, PO Box 16, Chatsworth Island, NSW 2469, Australia (URL: http://www.volcanolive.com/); Jeff and Cynthia Gneiser, Zegrahm & Eco Expeditions, 192 Nickerson Street ##200, Seattle, WA 98109, USA (URL: https://www.zegrahm.com/); International Federation of Red Cross and Red Crescent Societies, PO Box 372, CH-1211 Geneva 19, Switzerland (URL: http://www.ifrc.org/); Wellington Volcanic Ash Advisory Center (VAAC), MetService, PO Box 722, Wellington, New Zealand (URL: http://vaac.metservice.com/); Michel Lardy, Institut de Recherche pour le Développement (IRD), CRV, BP A 5 Nouméa, Nouvelle Calédonie; Société Volcanologique Européenne, C.P. 1, 1211 Geneva 17, Switzerland (URL: http://www.sveurop.org/).
500 explosions/day in March 2004; MODIS thermal alerts average about one per month
Activity from the summit crater at Yasur continued through 2002 (BGVN 28:01). While similar comprehensive reports are not available for 2003, MODIS data (table 2) indicated activity continuing over the year to 16 March 2004. No corroborative reports of activity have been received from the Rabaul Volcano Observatory or the Darwin Volcanic Ash Advisory Centre.
Table 2. Nights on which MODIS thermal alerts were recorded for Yasur during the year ending 16 March 2004. Data courtesy HIGP MODIS Thermal Alert System.
| Month | Days with Thermal Alerts |
| Mar 2003 | 23 |
| Apr 2003 | 15 |
| May 2003 | 3, 10 |
| Jun 2003 | 4 |
| Sep 2003 | 8, 17 |
| Oct 2003 | 17, 24, 26 |
| Nov 2003 | 5, 10, 12 |
| Mar 2004 | 13 |
John Seach reported continued eruptions at Yasur during March 2004. He suggested that there was an average of about 500 explosions per day, which is typical of the volcano's normal state of activity.
Information Contacts: HIGP MODIS Thermal Alert System, Hawaii Institute of Geophysics and Planetology, School of Ocean and Earth Science and Technology, University of Hawaii at Manoa (URL: http://modis.higp.hawaii.edu/); John Seach, PO Box 4025, Port Vila, Vanuatu (URL: http://www.volcanolive.com/).
Intermittent activity detected by satellite after June 2003
Activity consistently identified in MODVOLC thermal alerts through most of 2002 (BGVN 28:01) continued to 4 June 2003, but at lower levels (figure 34). There was usually only one alert pixel on each detection, barely above the detection threshold, with the highest alert ratio of -0.74. After a brief respite, activity was detected several times during 17 September through October 2003. No subsequent activity was detected until 15 March, 10 April, and 28 May 2004. These three alerts each triggered one alert pixel and had low alert ratios, about -0.8, just above the detection threshold. It seems likely that activity continued throughout the period, but was below the MODVOLC threshold most of the time and did not trigger an alert. There were no other reports of activity for this period.
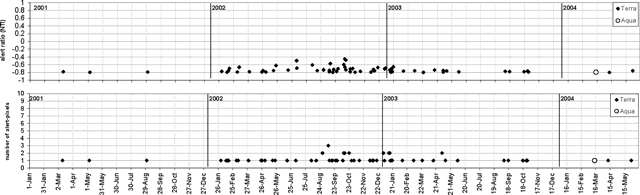 |
Figure 34. MODIS thermal alerts from Yasur for 1 January 2001-31 May 2004. Thermal alerts collated by Charlotte Saunders and David Rothery; data courtesy of the Hawaii Institute of Geophysics and Planetology's MODIS thermal alert team. |
Data acquisition and analysis. Reports from Diego Coppola and David A. Rothery provided analyses of MODIS thermal alerts during 2001 and 2002 (using the MODVOLC alert-detection algorithm) extracted from the MODIS Thermal Alerts website (http://modis.hgip.hawaii.edu/) maintained by the University of Hawaii HIGP MODIS Thermal Alerts team (BGVN 28:01). Rothery and Charlotte Saunders provided updates to 31 May 2004. MODVOLC data are now routinely available from the Aqua satellite (equator crossing times 0230 and 1430 local time) in addition to the original Terra satellite (equator crossing times 1030 and 2230 local time).
Information Contacts: David A. Rothery and Charlotte Saunders, Department of Earth Sciences, The Open University, Milton Keynes, MK7 6AA, United Kingdom.
Elevated seismic and eruptive activity after March 2004; emissions from three vents
At the end of June 2004, Yasur volcano started a new cycle of high activity, the fifth since continuous monitoring began in 1993. This cycle is expected to last several months. Having reached a climax in 2002, a lessening of activity had been observed throughout 2003. A return of elevated activity was noted in March 2004, heralding the cycle that began toward the end of June (figure 35). The bulk of the seismic record (over 95%) measured by a station located 2 km from the crated represented vertical ground-movement greater than 60 mm. The increase-decrease cycle is clearly visible. Unfortunately, problems with the power supply of the station's transmitter interrupted the flow of data at the time of onset of high activity.
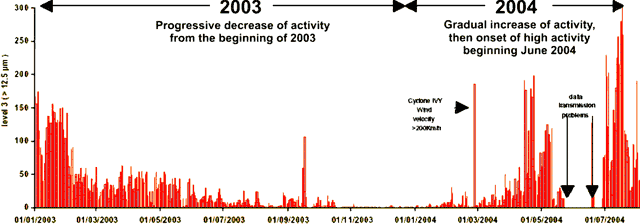 |
Figure 35. Evolution of activity seen and measured at Yasur volcano from 1 January 2003 to 21 July 2004. The horizontal scale uses the convention of day, month, and year; the vertical scale shows upward increasing 'level 3' seismicity, which is defined as ground displacements of over 12.4 micrometers (µm). The histogram bars were based on seismic measurements recorded by a station located 2 km from the crater and transmitted via the satellites of the Argos system. The text explains various aspects of the data and volcanism. Courtesy of Michel Lardy and Philipson Bani, IRD. |
The new cycle of high activity that began in late June 2004 was accompanied by ash ejection. Ash fall reached several millimeters in thickness at distances up to 4 km from the vents. The cycle was linked to the reopening of the three main channels feeding vents A, B, and C, and the consequent re-emergence of emissions at all three vents.
Fieldwork was conducted on Tanna Island during 10-15 July 2004. Vent A exhibited large ash plumes and low-intensity explosions (figures 36 and 37), with lava bombs ejected toward an area NW of the crater. Strombolian activity was observed at vent B (figure 38). This was the most explosive of the vents, with lava bombs projected vertically more than 300 m above the crater rim. The plume's bluish color was quite visible, confirming the presence of SO2. A wall of scoria at vent C, present now for several years, separates this vent from vents A and B. Lava ejections from vent C did not extend beyond the lip of the vent. Very dense ash plumes were emitted, but their intensity decreased after 10-11 July. From 11 to 15 July, the scientists measured SO2 concentration using a Mini Doas spectrometer and calculated a daily output of SO2 of around 1,000 metric tons per day, twice the amount measured in April 2004.
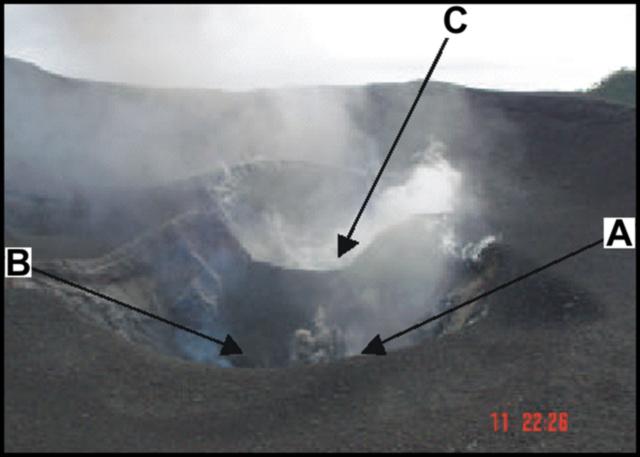 |
Figure 36. An overview of Yasur's crater on 11 July 2004. Vents are labeled and show typical activity seen during the visit. Copyrighted photo credited to M. Lardy, IRD. |
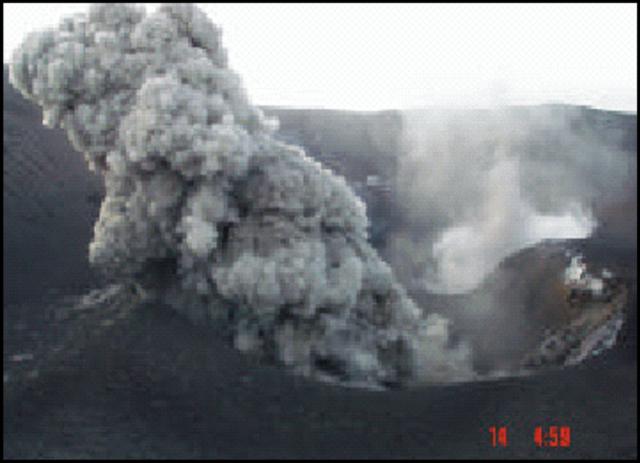 |
Figure 37. Yasur's vent A in the midst of a dense emission of bombs and ash. A light- colored plume sits over vent C (to the right and in the background). The shot was taken during the fieldwork of 10-15 July 2004. Copyrighted photo credited to M. Lardy, IRD. |
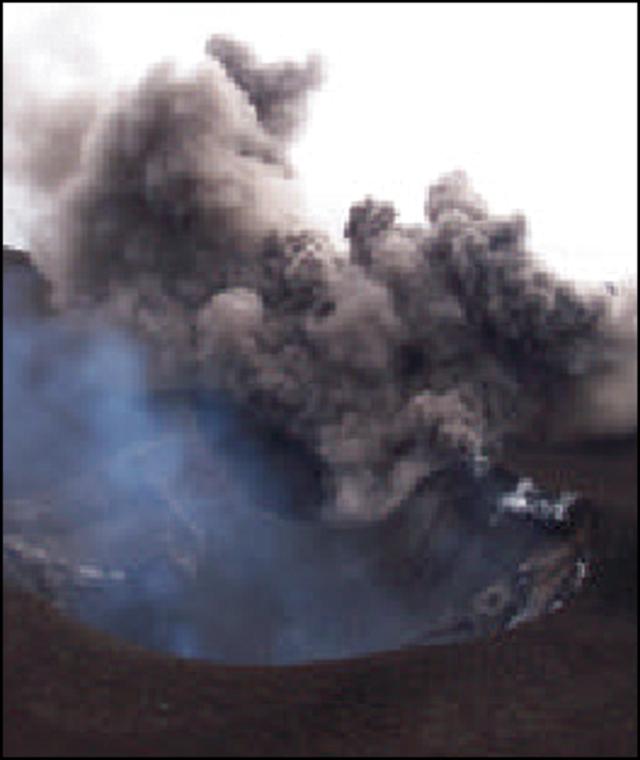 |
Figure 38. Yasur's vents B (in front), showing blueish emissions, as well as vent C (farthest back), emitting a taller, dense plume. The shot was taken during the fieldwork of 10-15 July 2004. Copyrighted photo credited to P. Bani, IRD. |
Information Contacts: Michel Lardy and Philipson Bani, IRD (Institut de Recherche pour le Développement) UMR Magmas et Volcans, BP A5 98848 Nouméa Cedex, New Caledonia; Jeanne Tabbagh, DGA (Département de Géophysique Appliquée), Université Paris VI, 4 Place Jussieu 75252, Paris Cedex 05, France; Esline Garaebiti, Department of Geology, Mines and Water Resources (DGMWR), PMB 01, Port- Vila, Vanuatu.
Increased activity during the first half of 2010; continued eruptions since 2004
Yasur has a record of at least several hundred years of near-constant eruptions from several vents. A period of increased activity in June 2004 (BGVN 29:07) included Strombolian behavior, low intensity explosions with lava bombs, dense ash plumes, and elevated SO2 levels. Located on Tanna Island (figure 39), this volcano is a major tourist attraction due to an access road to an overlook point (figure 40). Regular activity has continued since mid-2004 through mid-2010. MODVOLC alerts based on infrared imagery detected by satellite have occurred in every month since the previous report in 2004.
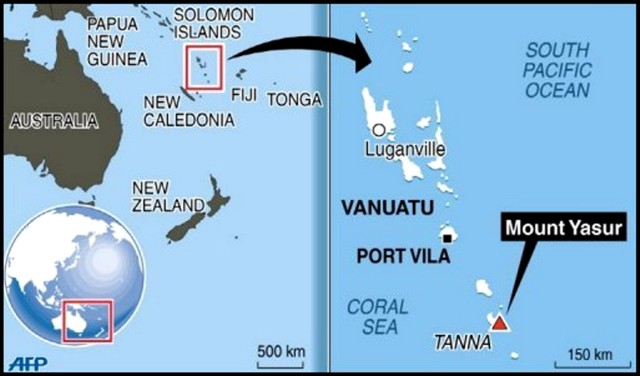 |
Figure 39. Maps indicating the locations of the nation of Vanuatu, Tanna Island, and Yasur volcano. Courtesy of Agence France-Presse. |
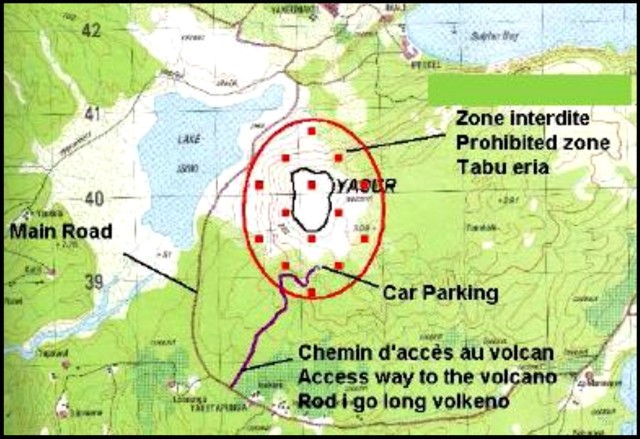 |
Figure 40. Web map of Yasur volcano in July 2010 showing the prohibited zone, the parking lot and other features. Courtesy of Vanuatu Geohazards Observatory (VGO). |
Although scientific reports have not been available, visitors to the volcano often post photographs on internet sites. For example, a quick review of Flickr images showed Strombolian ejections from multiple vents, and small ash explosions, that were taken in November 2005, May, September, and December 2006, January and September 2007, May, June, August, and September 2008. Similar activity was documented during March, May, June, and July 2009. An aerial photograph taken on 12 June 2009 showed a mostly white plume rising just above the summit (figure 41).
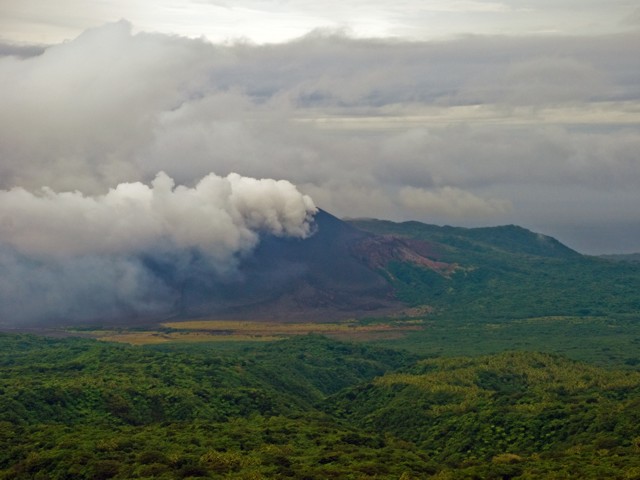 |
Figure 41. Photograph showing a plume from Yasur being blown downwind on 12 June 2009. The plume appears mostly white, with some possible ash. The day is overcast with darker rain clouds overhead. Courtesy of PhillipC (Creative Commons license). |
During January 2010 activity began to increase. A report from the Wellington Volcanic Ash Advisory Centre (VAAC) noted that on 11 January 2009 a plume had risen to an altitude of 4 km and drifted SE. Volcanic ash was not identifiable from satellite data. On 21 January, OMI satellite images indicated a significant increase in sulfur dioxide gas emissions (at least 2,000 metric tons/day).
According to the Vanuatu Geohazards Observatory (VGO), during the first week of March 2010 bombs were ejected. Observations on 8 March and analyses of seismic data both indicated increased emissions at all three vents. According to VGO, Yasur maintained its high activity during April and most of May 2010, with strong degassing and ash emissions from all three active vents. Ash fell on most parts of the island. Fresh volcanic bombs fell around the crater rim, and a few reached the ash plain and the parking area. A photo showed an elongate, ~ 1.5-m-long bomb that fell on 23 April lying on the ash plain. Explosions could be heard and viewed from nearby villages. OMI satellite data did not disclose elevated SO2 levels on 9 May 2010.
Activity increased again in late May; according to VGO, activity included moderate-to-large eruptions with strong explosions, ejected bombs that fell on the visitor viewing area, and significant ashfall in nearby villages. Visitors were not allowed to approach within about 500 m of the volcano. According to the Wellington VAAC, ash plumes rose to an altitude of 1.8 km every day between 29 May and 10 June 2010. Volcanic ash was not identifiable from satellite data except for 30 and 31 May. According to a news article, the plume on 1 June spread over 340 km2, canceling or delaying some flights in and out of New Caledonia (~ 430 km WSW).
In early June, activity decreased. Explosions became less frequent, but Strombolian activity continued with occasional ejections of lava bombs.
Heightened activity recurred in early July 2010. The VGO noted strong degassing and ash emissions from all the three active vents. Ashfall primarily occurred over the western portion of the island and fresh volcanic bombs fell around the crater rim. Some explosions could be heard and viewed from nearby villages. Visitor photos showed continuing Strombolian activity at the vents on 26 July and 7 August 2010.
Information Contacts: Vanuatu Geohazards Observatory, Geo-Hazard Section, Department of Geology, Mines and Water Resources, PMB 01, Port Vila, Vanuatu (URL: http://www.vmgd.gov.vu/vmgd/); Wellington Volcanic Ash Advisory Centre (VAAC), Meteorological Service of New Zealand Ltd (MetService), PO Box 722, Wellington, New Zealand (URL: http://www.metservice.com/vaac/, http://vaac.metservice.com/); Hawai'i Institute of Geophysics and Planetology (HIGP) Thermal Alerts System, School of Ocean and Earth Science and Technology (SOEST), Univ. of Hawai'i, 2525 Correa Road, Honolulu, HI 96822, USA (URL: http://modis.higp.hawaii.edu/); Flickr.com (Photographer: PhillipC, http://www.flickr.com/photos/flissphil/); Agence France-Presse (URL: http://www.afp.com/); Radio New Zealand International (URL: http://www.rnzi.com/).
Explosion induced ash falls, strong degassing during late May-early June 2011
On 12 May 2011, Yasur's crater (figure 42), which has undergone near-continuous eruption for over 200 (possibly 800) years, emitted persistent strong explosions that could be heard and felt by nearby residents. Satellite images (OMI and MODIS) and seismic data collected from the volcano's monitoring station also confirmed strong degassing and stronger than typical explosive activity since the beginning of May 2011. The volcano sits on Tanna Island in the island nation called the Republic of Vanuatu (formerly New Hebrides; ~2,200 km N off of New Zealand's coast and ~2,100 km NE off of Australia's coast). As seen on the map in the Gaua report in this issue (BGVN 36:05), Tanna island lies near the S end of the Republic. Figure 42 presents information about Vanuatu's tectonic setting and Yasur volcano's location and shape.
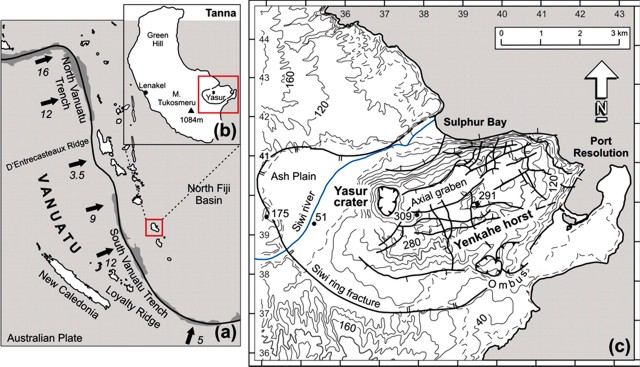 |
Figure 42. (a) Map showing the Vanuatu arc in the SW Pacific, the position of the 6-7 km deep Vanuatu trench, convergence rates (indicated by arrows in cm/yr), and the location of Tanna volcanic island, which rises from a 1-km-deep plateau (redrawn from Pelletier and others, 1998 and Calmant and others, 2003). (b) Schematic map of Tanna island with the locations of the main volcanic centers (redrawn from Carney and MacFarlane, 1979). In its long dimension (N-S), Tanna island stretches ~40 km; its width is ~19 km. (c) Map of southeastern Tanna showing the Yasur crater and Yenkahe horst, bounded by the Siwi ring fracture (redrawn from Nairn and others, 1988 and Allen, 2005). From Métrich and others (2011). |
An assessment conducted by the Vanuatu Geohazards Observatory (VGO) during 30 May-3 June 2011 found Yasur's crater in a state of high activity with strong explosions and bomb emissions from all of the three active vents. Fresh volcanic bombs fell around the crater rim, and some reached ~500 m S to the parking area, landing there about once per minute. Residents heard and viewed explosions from their villages.
Observations and assessments made by VGO during 11-12 June 2011 indicated a decrease in eruptive vigor and a return to more typical conditions. Explosions became both slightly weaker and less frequent. Constant Strombolian activity with occasional ejections of lava bombs still occured around the volcano.
On 7-8 July 2011 the VGO reported that Yasur volcano was at a high level of activity with strong degassing and ash emissions from all three active vents. The ash falls were mostly over the W part of the island. Fresh volcanic bombs had fallen around the crater rim. Some explosions could be heard and viewed from the villages, a pattern locals had noticed since the beginning of the year.
Hazard terminology and levels. The operative hazards scale for Yasur spans from 0 to 4, with larger values indicating greater hazards. It is called the VVAL (Vanuatu Volcano Alert Level).
Level 2 is defined as "Moderate eruptions, danger close to the volcano vent, within parts of Volcanic Hazards Map Red Zone" (see map in BGVN 35:04).
Level 3 is defined as "Large eruption, danger in specific areas within parts of Volcanic Hazards Map Red and Yellow Zones."
In the early phases of the upsurge in vigor, the VVAL for Yasur remained at Level 2 with the note that the risk area for volcanic projectiles remained in areas near the volcano crater and vicinity.
Associated with the assessed late-May to early June behavior, the VVAL stepped up to Level 3. A zone surrounding the summit became strictly prohibited (see visitor's map, BGVN 35:04).
Associated with the 11-12 June 2011 observations of decreasing vigor, the VVAL dropped to Level 2.
Background. Métrich and others (2011) point out that Siwi caldera is a volcanic complex containing both persistent eruptive activity of basaltic-trachyandesite composition (Yasur volcano) and rapid block resurgence (Yenkahe horst). They note that available data suggested that Yasur volcano releases, on average, over 134 x 103 tons/day of H2O and 680 tons/day of SO2. Measurements also indicated other gas fluxes: 840 tons/day of CO2, 165 tons/day of HCl, and 23 tons/day of HF.
References. Allen, S.R., 2005, Complex spatter- and pumice-rich pyroclastic deposits from an andesitic caldera forming eruption: The Siwi pyroclastic sequence, Tanna, Vanuatu, Bulletin of Volcanology, v. 67, pp. 27-41.
Calmant, S., Pelletier, B., Lebellegard, P., Bevis, M., Taylor, F.W., and Phillips, D.A., 2003, New insights on the tectonics along the New Hebrides subduction zone based on GPS results, Journal of Geophysical Research, v. 108, no. B6, pp. 2319-2339.
Carnay, JN., and MacFarlane, A, 1979, Geology of Tanna, Aneityum, Futuna and Aniva, New Hebrides Geological Survey Report 1979, pp. 5-29.
Métrich, N., Allard, P., Aiuppa, A., Bani, P., Bertagnini, A., Shinohara, H., Parello, F., Di Muro, A., Garaebiti, E., Belhadj, O., and Massare, D., 2011, Magma and Volatile Supply to Post-collapse Volcanism and Block Resurgence in Siwi Caldera (Tanna Island, Vanuatu Arc), Journal of Petrology, v. 52, no. 6, pp. 1077-1105; DOI: 10.1093/petrology/egr019.
Nairn, I.A., Scott, B.J., and Giggenbach, W.F., Yasur volcanic investigations, Vanuatu September 1988, New Zealand Geological Survey Report 1988, pp.1-74.
Pelletier, B., Calmant, S., and Pillet, R., 1998, Current tectonic of the Tonga-New Hebrides region, Earth and Planetary Science Letters, v. 164, pp. 263-276.
Information Contacts: Vanuatu Geohazards Observatory, Department of Geology, Mines and Water Resources of Vanuatu (URL: http://www.geohazards.gov.vu); NASA Earth Observatory (URL: http://earthobservatory.nasa.gov/); MODIS/MODVOLC Thermal Alerts System, Hawai'i Institute of Geophysics and Planetology (HIGP), School of Ocean and Earth Science and Technology (SOEST), Univ. of Hawai'i, 2525 Correa Road, Honolulu, HI 96822, USA (URL: http://modis.higp.hawaii.edu/); Wellington Volcanic Ash Advisory Centre (VAAC), Meteorological Service of New Zealand Ltd (MetService), PO Box 722, Wellington, New Zealand (URL: http://www.metservice.com/vaac/, http://vaac.metservice.com/).
Explosive activity continued into at least early 2013
In BGVN 36:05, we reported that on 12 May 2011, the Vanuatu Geohazards Observatory (VGO) reported, based on information collected by the Vanuatu Meteorology and Geohazards Department, that a OMI (ozone monitoring instrument) satellite image showed strong degassing of SO2 from Yasur volcano during the previous week (see map of this island volcano in figure 42 of BGVN 36:05). On 1 June 2011, the Vanuatu Volcano Alert Level (VVAL) was raised from 2 to 3, following increasing explosive activity during May, then lowered to 2 on 13 June (table 3).
Table 3. The Vanuatu Volcanic Alert Level (VVAL) scale for the six volcanoes monitored by Vanuato Geohazard Observatory (Yasur, Lopevi, Ambrym, Aoba, Gaua, and Suretamatai). Courtesy of Vanuatu Geohazards Observatory.
| VVAL | Description |
| Lvl. ? | Insufficient monitoring to make assessment. |
| Lvl. 0 | Normal low-level activity. |
| Lvl. 1 | Increased activity, danger near crater only. |
| Lvl. 2 | Moderate eruptions, danger close to the volcano vent, within parts of Volcanic Hazards Map Red Zone. |
| Lvl. 3 | Large eruption, danger in specific areas within parts of Volcanic Hazards Map Red and Yellow Zones. |
| Lvl. 4 | Very large eruption, island-wide danger (including areas within Red Yellow and Green Zones). |
During the week of 7-12 July 2012, VGO observed that explosive activity at Yasur became stronger and more frequent, and shifted from Strombolian to sub Plinian. Bombs ejected from the vents fell in the crater, around the summit area, and on the tourist walk and parking area (within the red zone, figure 43). The explosions were heard, felt, and observed from nearby villages and schools. Activity at all three volcanic vents was characterized by degassing, ash emissions, and ejection of bombs. On 13 July 2012, the Alert Level was raised to 3.
VGO reported an OMI satellite image on 1 April 2013 showed diffuse SO2 from Yasur. Explosive activity increased on 2 April 2013, with explosions becoming stronger and more frequent, and continued to slightly increase through 28 May. Bombs again fell around the summit area, the tourist walk, and the parking area. Moderate ash emissions and ashfall occurred on 2, 4, and 5 April, and 5 and 8 May 2013. Photos included in the report showed dense white plumes on 23 and 24 May. The Alert Level remained at 2 (on a scale of 0 4).
Volcano Ash Advisory Centre (VAAC) reports on Yasur. In many cases the VAAC lacked any satellite data and in cases where they did have data they frequently were unable to detect the plume or in other cases could not detect ash in the plume (table 4).
Table 4. Yasur volcano aviation reports (VAAs, Volcanic Ash Advisories) for the time interval 11 January 2009 to 10 June 2010. In many cases the information sources were the Vanuatu Geohazard Observatory (VGO). On 11 January the source was an AIREP, an aircraft report. Data provided courtesy of the Wellington Volcanic Ash Advisor Centre (VAAC).
| Date (time UTC) | Info Source (type of observation) | Details | Altitude (km) | Drift or cited wind direction |
| 11 Jan 2009 | AIREP | Plume sighted over volcano by aircraft (to ~4 km altitude, drifting SE). Ash not seen by VAAC analysts in satellite data. | ~4km | SE |
| 29 May 2010 | VGO | Observatory reported plume, however no satellite image was made. | ~2km | Winds NE |
| 30 May 2010 | VGO | Observatory reported plume, and a volcanic ash cloud was captured with a Modis image. | ~2km | Winds E |
| 31 May 2010 | VGO | Observatory reported plume, and a volcanic ash cloud obscured the satellite image. | ~2km | Winds NE |
| 01 Jun 2010 | VGO | Observatory reported plume, and a volcanic ash cloud obscured the satellite image. | ~2km | Winds N |
| 02 Jun 2010 | VGO | Observatory reported plume, and a volcanic ash cloud was unidentifiable on satellite image. | ~2km | Winds N |
| 03 Jun 2010 | VGO | Observatory reported plume, and a volcanic ash cloud was unidentifiable on satellite image. | ~2km | Winds E/NE |
| 04 Jun 2010 | VGO | Observatory reported plume, and a volcanic ash cloud was unidentifiable on satellite image. | ~2km | Winds NE |
| 05 Jun 2010 | VGO | Observatory reported a plume, and a volcanic ash could was unidentifiable on satellite image. A remark was made suggesting volcanic eruption may be easing. | ~2km | Winds NW |
| 06 Jun 2010 | VGO | Observatory reported a plume,and a volcanic ash cloud was unidentifiable on satellite image. | ~2km | Winds NW |
| 07 Jun 2010 | VGO | Observatory reported a plume, and satellite image was unavailable. | ~2km | Winds NW |
| 08 Jun 2010 | VGO | Observatory reported a plume, and satellite image was unavailable. | ~2km | Winds NW |
| 09 Jun 2010 | VGO | Observatory reported a plume, and satellite image was unavailable. | ~2km | Winds |
| 10 Jun 2010 | VGO | Observatory reported a plume, and that no volcanic ash was visible on satellite image. | ~2km | Winds NE |
Satellite Thermal Alerts. The MODIS/MODVOLC satellite thermal alert system has shown least 1 to 10 alerts each month over Yasur since the beginning of 2011. A lava lake has existed at Yasur for many years.
References. Allen, S.R., 2005, Complex spatter and pumice rich pyroclastic deposits from an andesitic caldera forming eruption:The Siwi pyroclastic sequence, Tanna, Vanuatu, Bulletin of Volcanology, v. 67, pp. 27 41.
Calmant, S., Pelletier, B., Lebellegard, P., Bevis, M., Taylor, F.W., and Phillips, D.A., 2003, New insights on the tectonics along the New Hebrides subduction zone based on GPS results, Journal of Geophysical Research, v. 108, no. B6, pp. 2319 2339.
Carnay, JN., and MacFarlane, A, 1979, Geology of Tanna, Aneityum, Futuna and Aniva, New Hebrides Geological Survey Report 1979, pp. 5 29.
Métrich, N., Allard, P., Aiuppa, A., Bani, P., Bertagnini, A., Shinohara, H., Parello, F., Di Muro, A., Garaebiti, E., Belhadj, O., and Massare, D., 2011, Magma and Volatile Supply to Post collapse Volcanism and Block Resurgence in Siwi Caldera (Tanna Island, Vanuatu Arc), Journal of Petrology, v. 52, no. 6, pp. 1077 1105; DOI: 10.1093/petrology/egr019.
Nairn, I.A., Scott, B.J., and Giggenbach, W.F., 1988, Yasur volcanic investigations, Vanuatu September 1988, New Zealand Geological Survey Report 1988, pp.1 74.
Pelletier, B., Calmant, S., and Pillet, R., 1998, Current tectonic of the Tonga New Hebrides region, Earth and Planetary Science Letters, v. 164, pp. 263 276.
Information Contacts: Vanuatu Geohazards Observatory, Department of Geology, Mines and Water Resources of Vanuatu (URL: http://www.geohazards.gov.vu); NASA Earth Observatory (URL: http://earthobservatory.nasa.gov); MODIS/MODVOLC Thermal Alerts System, Hawai'i Institute of Geophysics and Planetology (HIGP), School of Ocean and Earth Science and Technology (SOEST), Univ. of Hawai'i, 2525 Correa Road, Honolulu, HI 96822, USA (URL: http://modis.higp.hawaii.edu/); and Wellington Volcanic Ash Advisory Centre (VAAC), Meteorological Service of New Zealand Ltd (MetService), PO Box 722, Wellington, New Zealand (URL: http://www.metservice.com/vaac/, URL: http://vaac.metservice.com/).
Explosive activity during May, August, and November 2013
Our previous report from May 2013 (BGVN 38:05) noted Strombolian activity, including volcanic bombs in July 2012 and ashfall and volcanic bombs in April and May 2013. The Vanuatu Geohazards Observatory (VGO) bulletin from 28 May 2013 noted that Yasur's explosive activity had increased slightly, compared to the recent past. The activity included Strombolian explosions (figure 43) and ash and steam plumes. This report discusses activity from June 2013 through February 2014, along with photographs taken in May 2013. A map of Vanuatu and nearby countries was provided in BGVN 35:06.
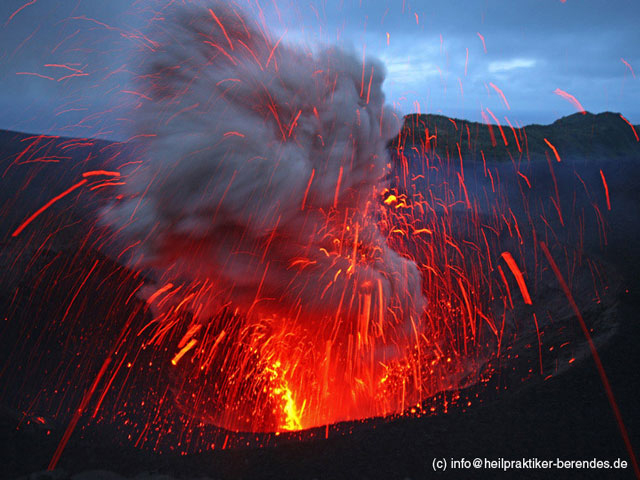 |
Figure 43. Strombolian activity from Yasur recorded during May 2013. Courtesy of Volcano Discovery (Dietmar Berendes). |
Observations and seismic data from early to mid-August 2013 suggested that explosive activity of the volcano had decreased slightly during that time. Explosions were weaker and less frequent. Therefore, on 29 August 2013, the VGO decreased the Alert Level from 2, where it had been since early April 2013, to 1. Level 1 (on a scale of 0-4) indicates "increased activity [but] danger near crater only". From 29 August 2013 until at least February 2014, the Alert Level has remained at 1.
Hazard zones at Yasur are indicated in figure 44. VGO has warned visitors that ejected volcanic bombs could hit the summit area, the tourist walk, and parking area.
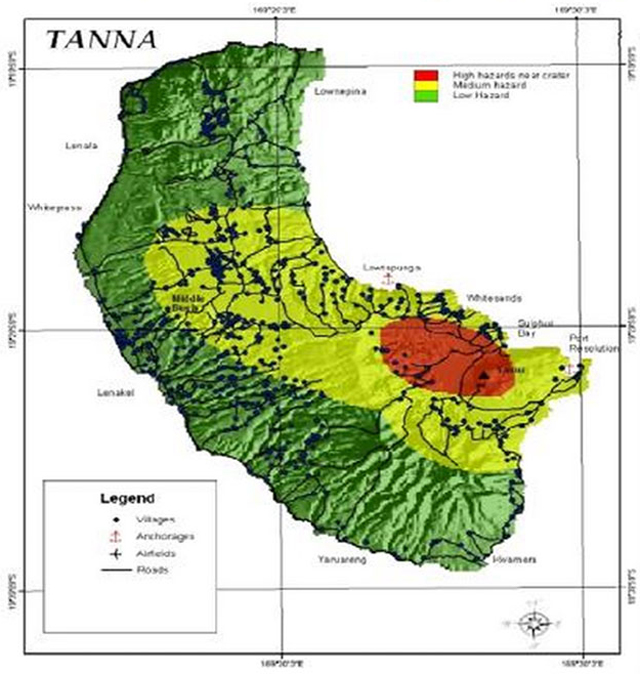 |
Figure 44. This danger map ('Denja Map') of Tanna Island containing Yasur volcano shows Red, Yellow, and Green zones to warn visitors and civilians of ashfall and other hazards. Yasur volcano is near the eastern end of the red, highest-risk zone. Map key and title are in a language with phonetic similarities to English that evolved with contact from traders (a lingua franca) but many other languages also remain in use in Vanuatu. Ash could likely fall well W of Yasur due to trade winds from the ESE. This image is of low to moderate resolution and some symbols are illegible. Courtesy of Vanuatu Geohazards Observatory. |
Observations and seismic data from early to mid-August 2013 suggested that explosive activity of the volcano had decreased slightly during that time. Explosions were weaker and less frequent. Therefore, on 29 August 2013, the VGO decreased the Alert Level from 2, where it had been since early April 2013, to 1. Level 1 (on a scale of 0-4) indicates "increased activity [but] danger near crater only". From 29 August 2013 until at least February 2014, the Alert Level has remained at 1.
According to John Search, who has led tours of the volcano since 1998, activity increased beginning October 2013. A large ash emission caused widespread damage to vegetation on Tanna Island, and ashfall was reported on Erromango Island, 150 km N of Yasur. On the evening of 3 November 2013, Search witnessed large Strombolian explosions. These explosions ejected volcanic bombs, up to 4 m in diameter, 250 m from the vent, putting visitors at risk. According to Search, the explosions were some of the largest at Yasur since 1995.
On 19 November 2013, VGO reported that a new phase of ash emissions began on 3 November. The explosive intensity remained low.
Information Contacts: Vanuatu Geohazards Observatory, Department of Geology, Mines and Water Resources of Vanuatu (URL: http://www.geohazards.gov.vu); John Seach, Volcanolive.com (URL: Volcanolive.com/Yasur.html); and Volcano Discovery (www.volcanodiscovery.com).
Frequent explosions and thermal anomalies continue through October 2016
A previous report on Yasur (also called Tanna) from November 2013 (BGVN 38:11) noted weak explosions with ash and steam emissions during several months of 2013. This report discusses activity from December 2013 through October 2016. No reports about Yasur from the Vanuatu Geohazards Observatory (VGO) for 2014 are known.
A report from VGO on 27 April 2015 noted that the volcano continued in a state of unrest, and the Alert Level remained at 1 (on a scale of 0-4). VGO reminded residents and tourists that areas near the crater and areas prone to ash and gas as carried by the trade winds should be avoided. On 13 November VGO reported that activity had increased, with more intense explosions. The Alert Level was raised to 2. On 15 December 2015, VGO again reported that explosions had become more intense.
On 14 January 2016 VGO reported that explosions had become more intense, but the baseline level or previous reference day for that evaluation was not specified. Tour operator John Seach (Volcano Live), who makes frequent trips to the summit craters, described the continuing eruption in January 2016 as mildly Strombolian. VGO noted that explosions remained intense in reports from 31 March, 27 May, 28 June, 2 August, 9 September, and 10 October 2016. VGO reminded residents and tourists to avoid the permanent Exclusion Zone within 600 m of the crater (figure 45); the Alert Level remained at 2.
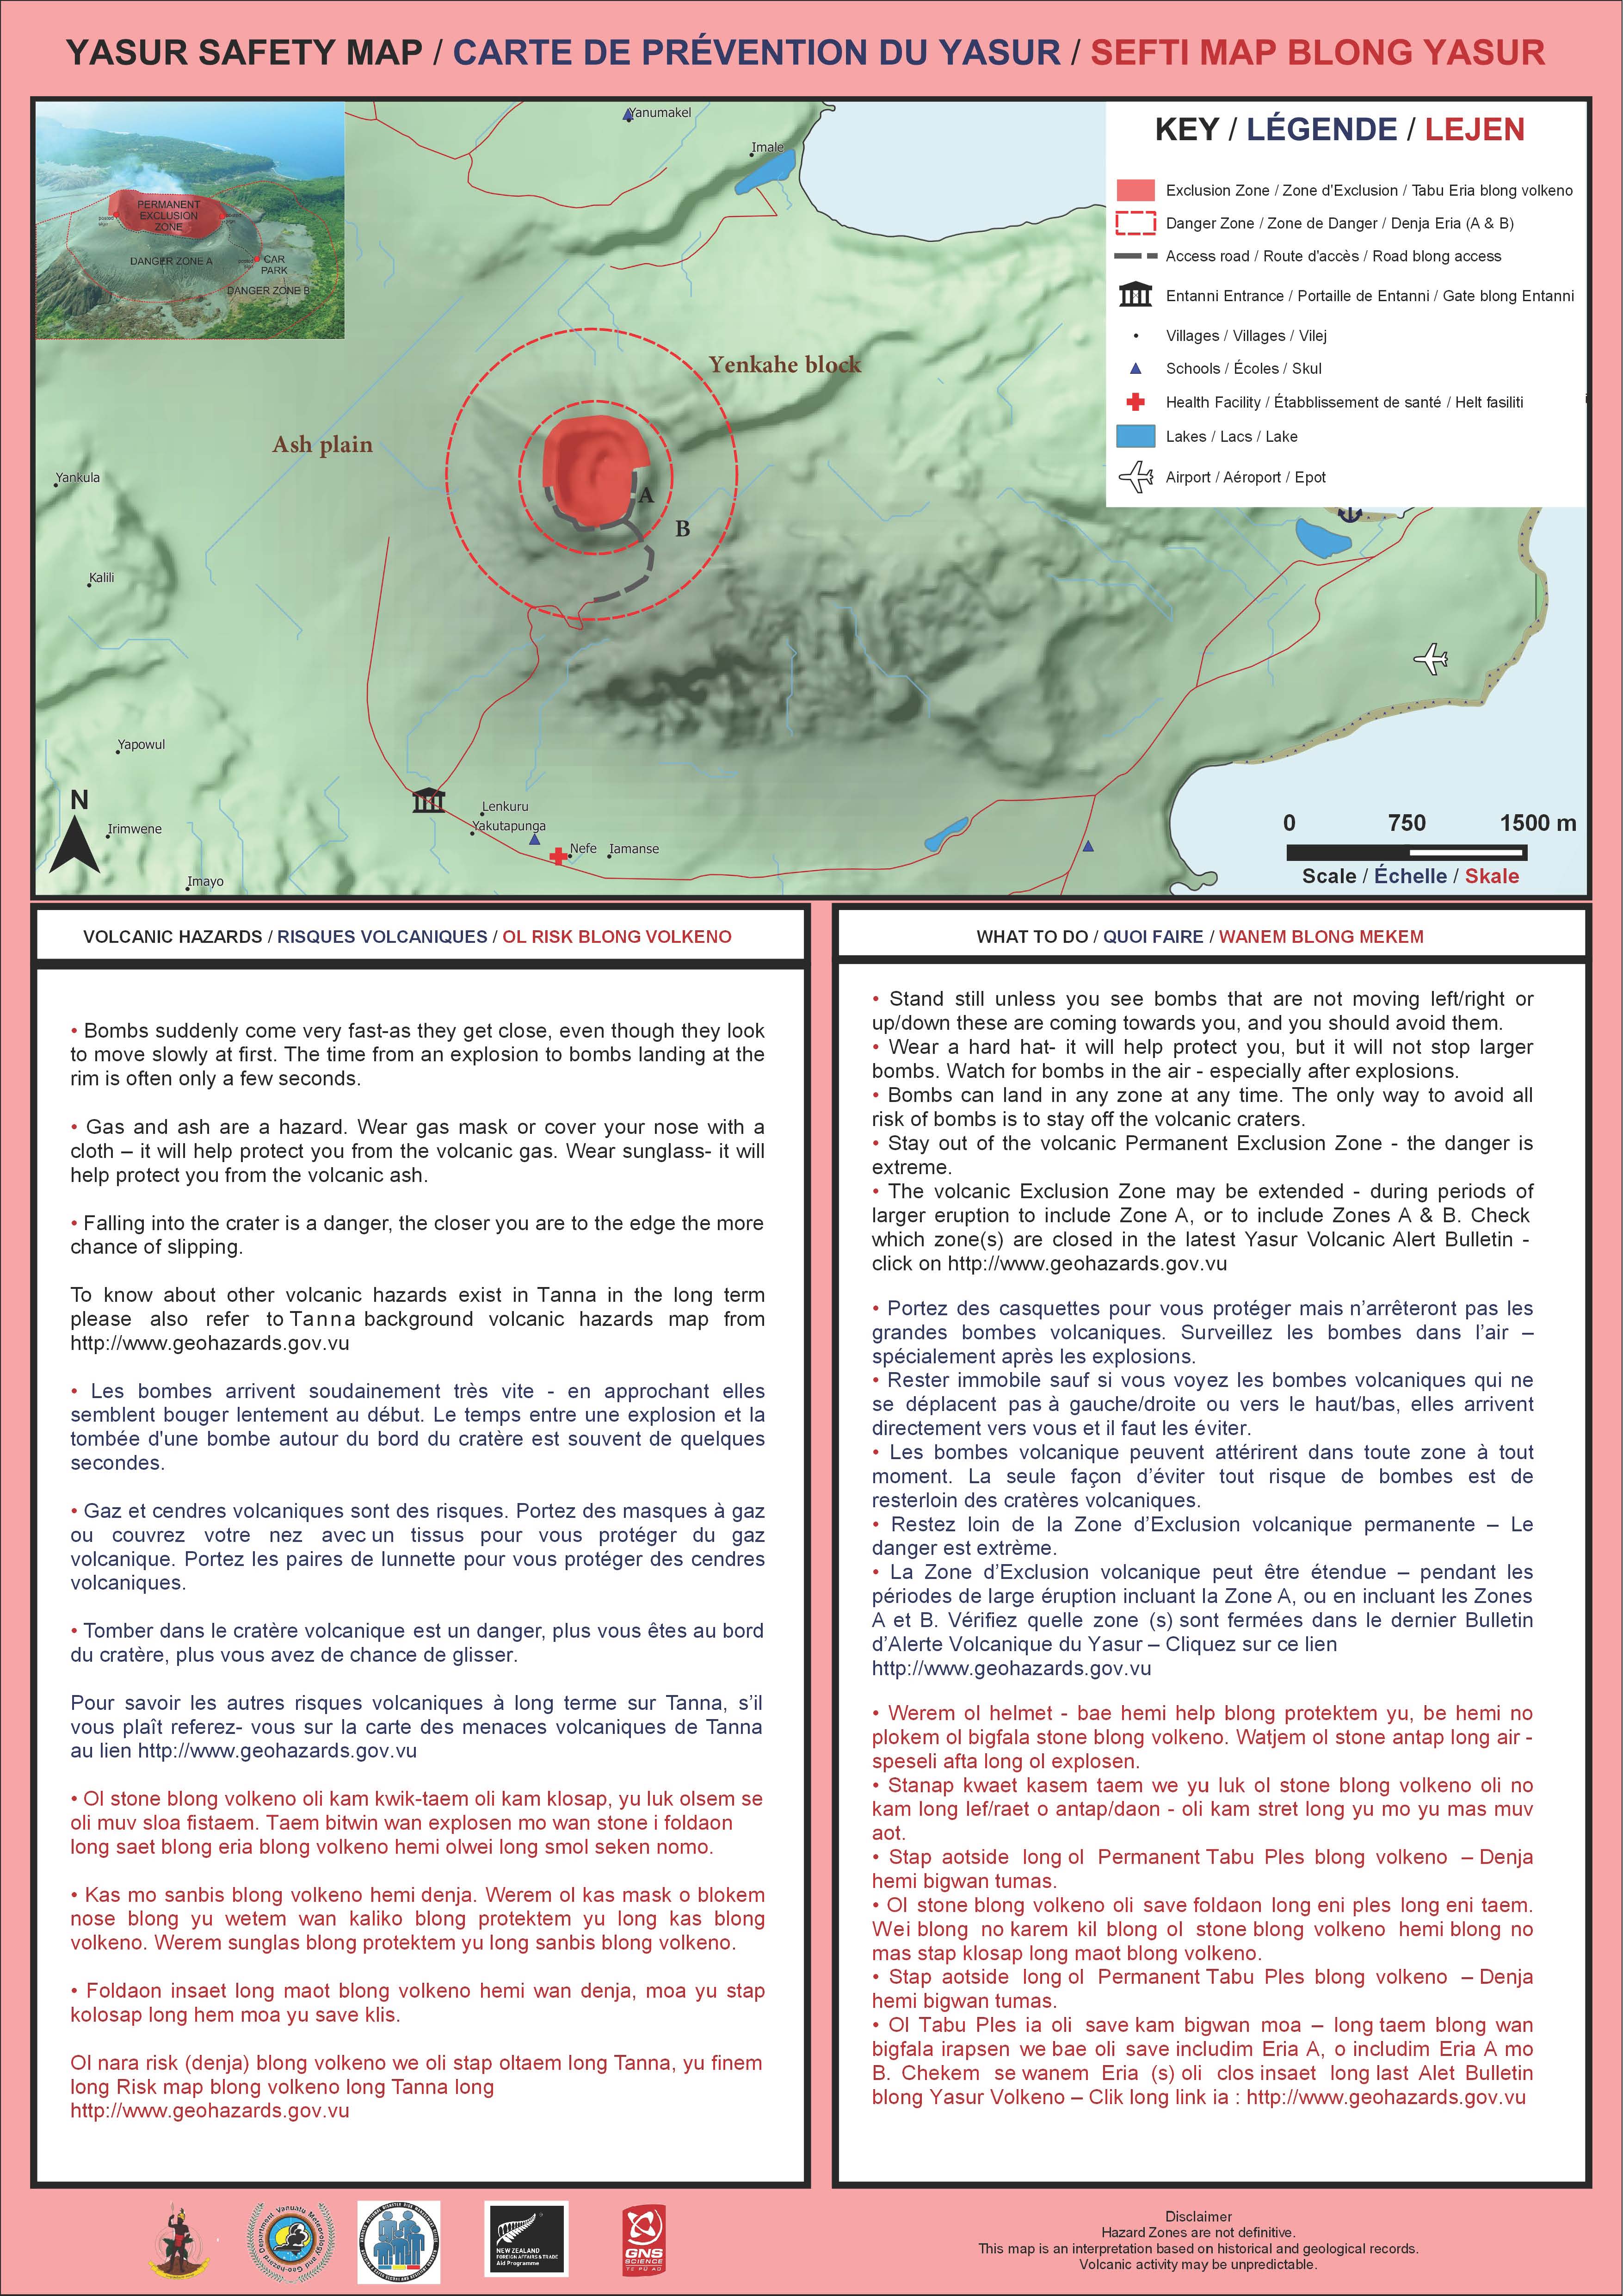 |
Figure 45. Yasur Safety Map showing the hazard zones and nearby infrastructure. Courtesy of the Vanuatu Geohazards Observatory. |
MODIS/MODVOLC thermal anomalies were numerous during the reporting period, with at least one every month. The MIROVA (Middle InfraRed Observation of Volcanic Activity) volcano hotspot detection system, also based on analysis of MODIS data, detected almost continuous anomalies during October 2015-September 2016; the radiative power of the hotspots were all in the low or moderate range.
Information Contacts: Vanuatu Geohazards Observatory (VGO), Department of Geology, Mines and Water Resources of Vanuatu (URL: http://www.vmgd.gov.vu/vmgd/); John Seach, Volcano Live (URL: http://volcanolive.com/index.html); Hawai'i Institute of Geophysics and Planetology (HIGP) MODVOLC Thermal Alerts System, School of Ocean and Earth Science and Technology (SOEST), Univ. of Hawai'i, 2525 Correa Road, Honolulu, HI 96822, USA (URL: 2/12/2016http://modis.higp.hawaii.edu/); MIROVA (Middle InfraRed Observation of Volcanic Activity), a collaborative project between the Universities of Turin and Florence (Italy) supported by the Centre for Volcanic Risk of the Italian Civil Protection Department (URL: http://www.mirovaweb.it/).
Strong explosions reported through mid-June 2017, with ongoing thermal anomalies
The almost continuous eruption at Yasur, possibly over the previous 800 years, remained active through October 2016 (BGVN 41:12). The Vanuatu Geohazards Observatory (VGO) has maintained the hazards status at Volcano Alert Level 2 (major unrest - danger around the crater rim and specific area, notable/large unrest, considerable possibility of eruption and also chance of flank eruption) through mid-June 2017.
Volcano Alert Bulletins posted by the VGO on 19 April, 22 May, and 22 June 2017 indicated ongoing strong explosive activity. Satellite-detected MODIS thermal anomalies identified by MODVOLC were numerous during the reporting period, with at least one every month except during November 2016. The MIROVA system also detected nearly continuous thermal anomalies during the year ending on 12 June 2017 (figure 46), though activity decreased in the last few months of 2016 and was somewhat more intermittent in the first half of 2017 compared to July-September 2016.
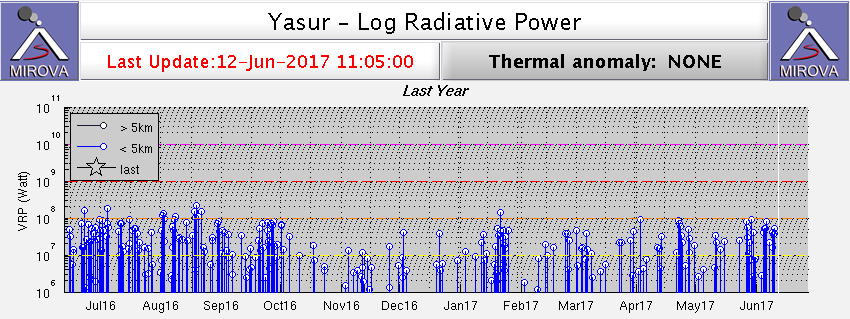 |
Figure 46. Thermal anomalies detected in MODIS data by the MIROVA system (log radiative power) at Yasur for the year ending 12 June 2017. Courtesy of MIROVA. |
Information Contacts: Vanuatu Geohazards Observatory, Department of Geology, Mines and Water Resources of Vanuatu (URL: http://www.vmgd.gov.vu/vmgd/, http://www.vmgd.gov.vu/vmgd/index.php/geohazards/volcano); Hawai'i Institute of Geophysics and Planetology (HIGP) - MODVOLC Thermal Alerts System, School of Ocean and Earth Science and Technology (SOEST), Univ. of Hawai'i, 2525 Correa Road, Honolulu, HI 96822, USA (URL: http://modis.higp.hawaii.edu/); MIROVA (Middle InfraRed Observation of Volcanic Activity), a collaborative project between the Universities of Turin and Florence (Italy) supported by the Centre for Volcanic Risk of the Italian Civil Protection Department (URL: http://www.mirovaweb.it/).
Typical ongoing eruptive activity and thermal anomalies through January 2018
Regular monitoring reports about Yasur from the Vanuatu Meteorology and Geo-Hazards Department (VMGD) indicated that the centuries-long eruptive activity continued from mid-June 2017 through January 2018. VMGD volcano bulletins on 21 July, 30 August, 29 September, 31 October, and 8 December 2017, and 30 January 2018, stated that major unrest was continuing, and the Alert Level remained at 2 (on a scale of 0-4). Based on seismic data, explosions continued to be intense. Visitors were reminded of the closed 395-m-radius Permanent Exclusion Zone (figure 47) and that volcanic ash and gas could impact other areas near the volcano due to trade winds.
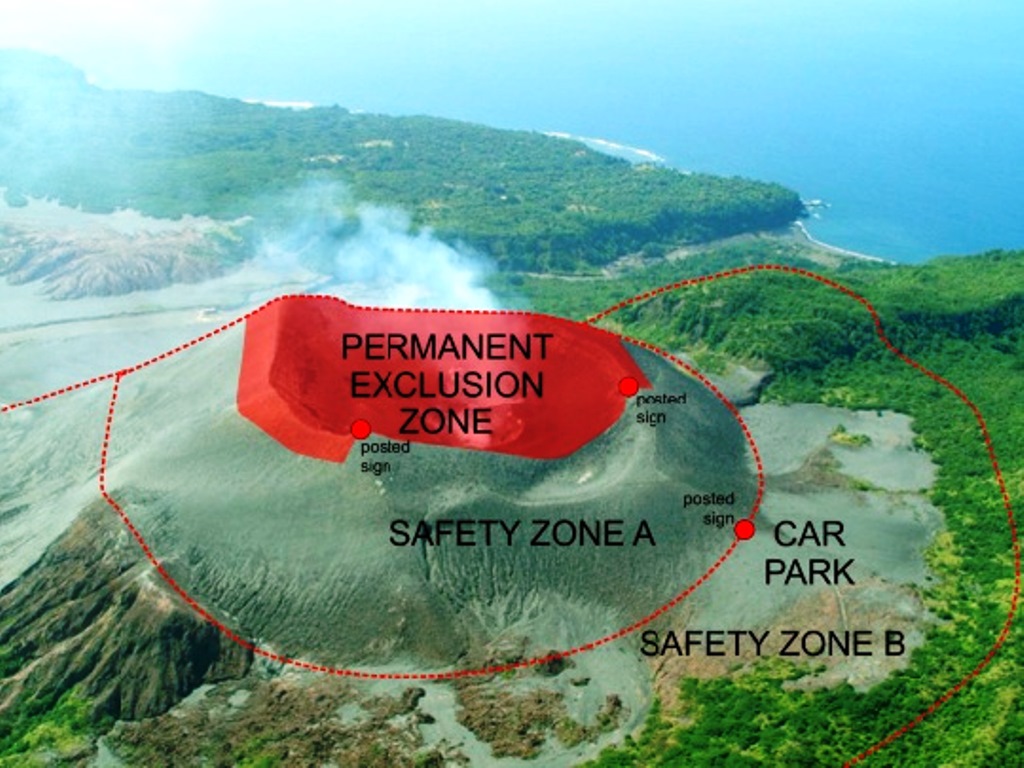 |
Figure 47. Oblique aerial photograph of Yasur with an overlay of designated hazard zones that may be closed depending on the level of eruptive activity. Courtesy of Vanuatu Meteorology and Geo-Hazards Department. |
During the reporting period thermal anomalies based on MODIS satellite instruments analyzed using the MODVOLC algorithm were numerous every month. The MIROVA (Middle InfraRed Observation of Volcanic Activity) system also detected numerous hotspots every month (figure 48).
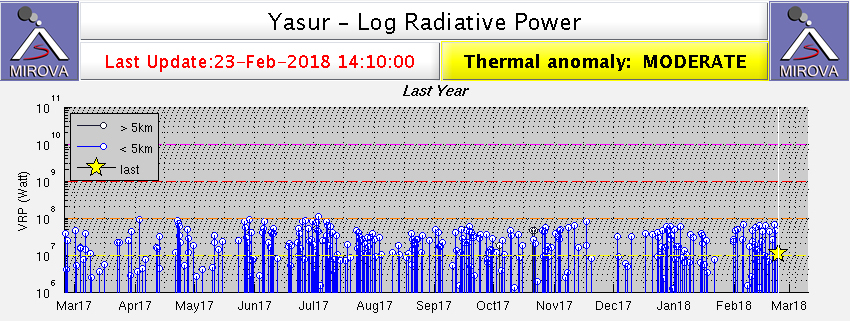 |
Figure 48. Thermal anomalies detected in MODIS data by the MIROVA system (log radiative power) at Yasur for the year ending 23 February 2018. Courtesy of MIROVA. |
Information Contacts: Geo-Hazards Division, Vanuatu Meteorology and Geo-Hazards Department, Ministry of Climate Change Adaptation, Meteorology, Geo-Hazards, Energy, Environment and Disaster Management, Private Mail Bag 9054, Lini Highway, Port Vila, Vanuatu (URL: http://www.vmgd.gov.vu/, https://www.facebook.com/VanuatuGeohazardsObservatory/); Radio New Zealand (URL: https://www.radionz.co.nz); Hawai'i Institute of Geophysics and Planetology (HIGP) - MODVOLC Thermal Alerts System, School of Ocean and Earth Science and Technology (SOEST), Univ. of Hawai'i, 2525 Correa Road, Honolulu, HI 96822, USA (URL: http://modis.higp.hawaii.edu/); MIROVA (Middle InfraRed Observation of Volcanic Activity), a collaborative project between the Universities of Turin and Florence (Italy) supported by the Centre for Volcanic Risk of the Italian Civil Protection Department (URL: http://www.mirovaweb.it/).
Centuries-long eruption continues during February-July 2018
The persistent centuries-long eruption at Yasur continued between February and July 2018. According to the Vanuatu Meteorology and Geo-Hazards Department (VMGD), activity consists of ongoing explosions, some of which are strong. The activity is confined to the crater.
Based on visual observations and satellite data, VMGD reported on 19 March 2018 that explosions remained strong. Using information from webcam images, satellite data, model data, and local visual observations, the Wellington Volcanic Ash Advisory Centre (VAAC) reported that during 5-6 June, 14-15 June, 17-18 June, and 20-21 June, intermittent, low-level ash plumes rose to altitudes of 0.9-1.5 km and drifted in various directions. During the 5-6 June episode, ash was not identified on satellite imagery.
Satellite imagery during clear weather on 25 June showed two distinct heat sources in the crater and a diffuse gas plume blowing NW (figure 49). VMGD reported some stronger explosions during 27-28 June. Based on webcam images the Wellington VAAC reported that on 29 June intermittent, low-level ash plumes rose to an altitude of 1.8 km and drifted NW.
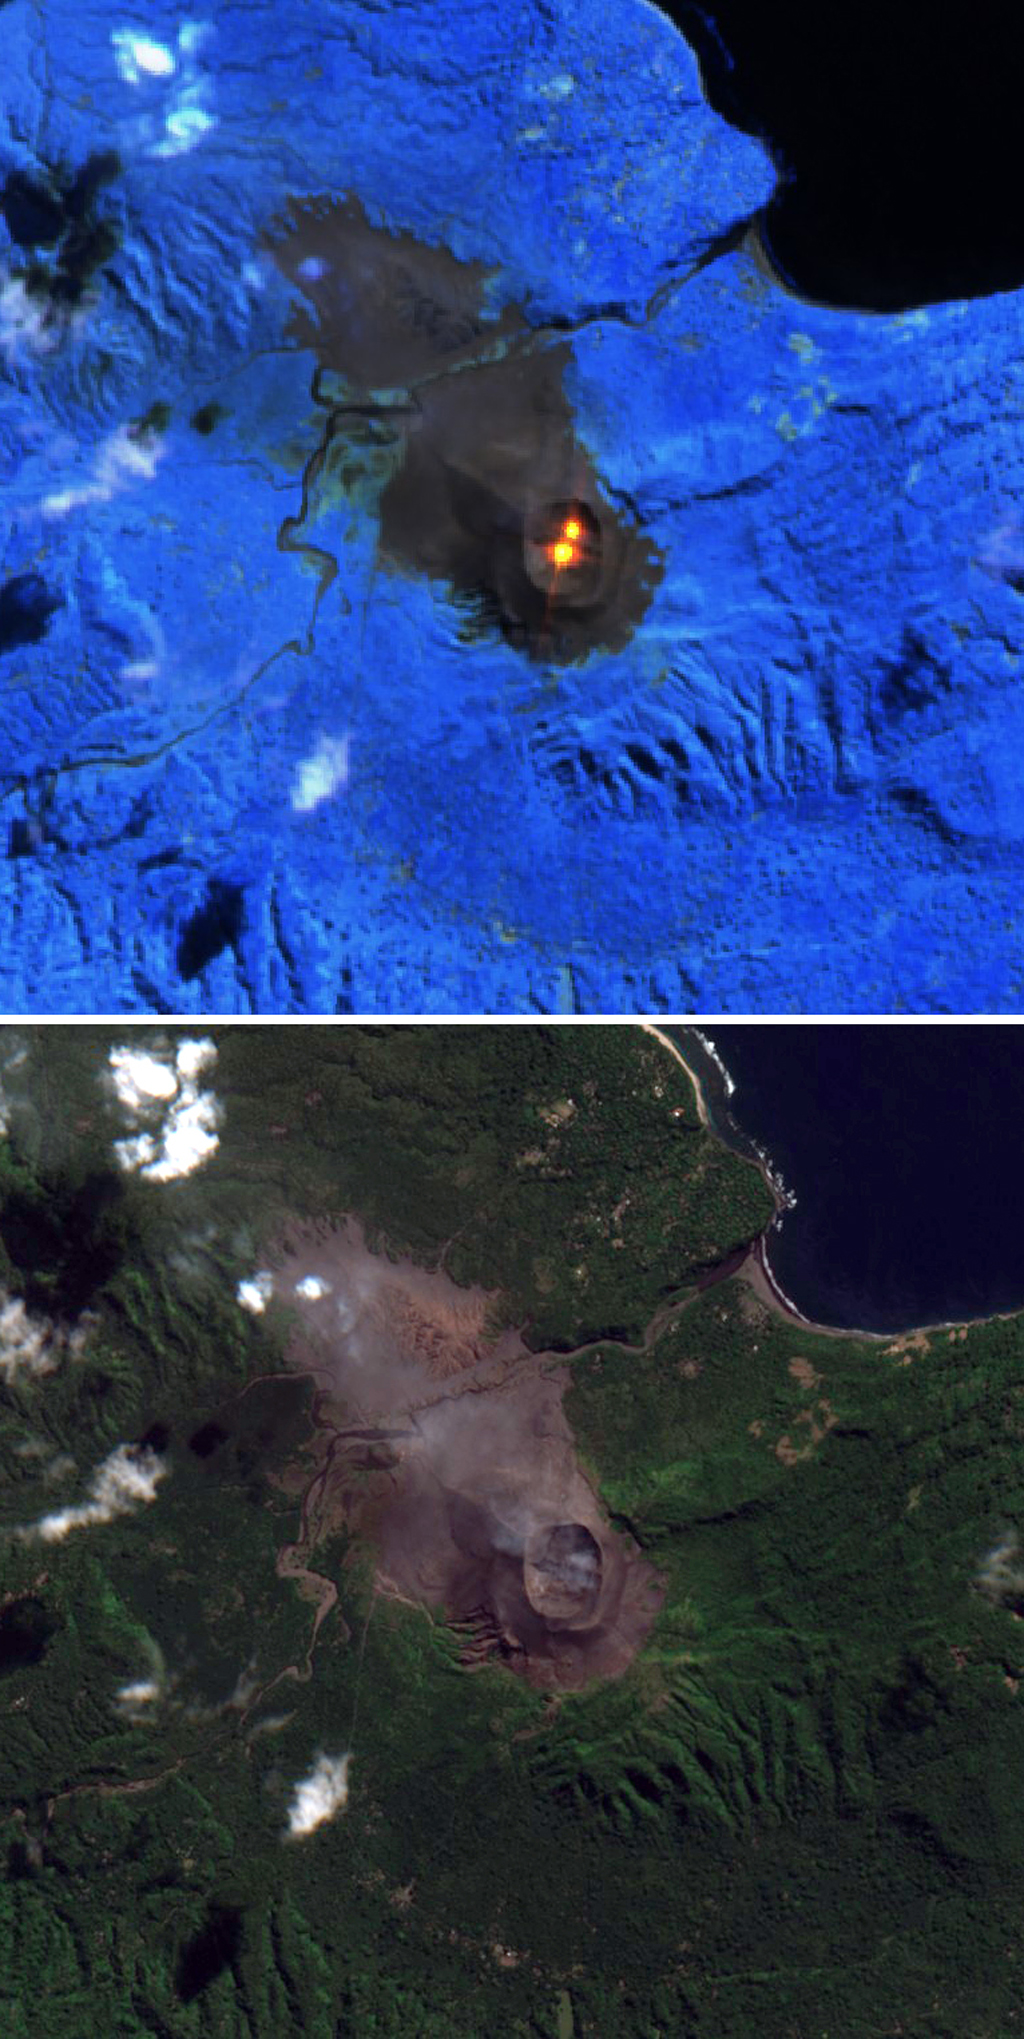 |
Figure 49. Sentinel-2 satellite images of Yasur on 25 June 2018. The top image uses the Atmospheric Penetration filter, which clearly shows two closely spaced hotspots in the crater. The bottom natural color image (with minor color adjustments) shows a thin, faint plume emanating from the crater and blowing NW. Courtesy of Sentinel Hub. |
The Alert Level remained at 2 (on a scale of 0-4) throughout the reporting period. VMGD reminded residents and tourists that hazardous areas were near and around the volcanic crater, within a 395-m-radius permanent exclusion zone (shown in figure 48 of BGVN 43:02), and that volcanic ash and gas could reach areas impacted by trade winds.
During the reporting period, MODIS satellite instruments using the MODVOLC algorithm recorded thermal anomalies between 4 and 16 days per month, many of which had multiple pixels. May 2018 had the greatest number of days with hotspots (16), while the lowest number was recorded during April (4). The MIROVA (Middle InfraRed Observation of Volcanic Activity) volcano hotspot detection system, also based on analysis of MODIS data, recorded numerous hotspots every month during the reporting period. Almost all recorded MIROVA anomalies were within 3 km of the volcano and of low or moderate radiative power.
Information Contacts: Geo-Hazards Division, Vanuatu Meteorology and Geo-Hazards Department, Ministry of Climate Change Adaptation, Meteorology, Geo-Hazards, Energy, Environment and Disaster Management, Private Mail Bag 9054, Lini Highway, Port Vila, Vanuatu (URL: http://www.vmgd.gov.vu/, https://www.facebook.com/VanuatuGeohazardsObservatory); Wellington Volcanic Ash Advisory Centre (VAAC), Meteorological Service of New Zealand Ltd (MetService), PO Box 722, Wellington, New Zealand (URL: http://www.metservice.com/vaac, http://www.ssd.noaa.gov/VAAC/OTH/NZ/messages.html); Hawai'i Institute of Geophysics and Planetology (HIGP) - MODVOLC Thermal Alerts System, School of Ocean and Earth Science and Technology (SOEST), Univ. of Hawai'i, 2525 Correa Road, Honolulu, HI 96822, USA (URL: http://modis.higp.hawaii.edu/); MIROVA (Middle InfraRed Observation of Volcanic Activity), a collaborative project between the Universities of Turin and Florence (Italy) supported by the Centre for Volcanic Risk of the Italian Civil Protection Department (URL: http://www.mirovaweb.it/); Sentinel Hub Playground (URL: https://www.sentinel-hub.com/explore/sentinel-playground).
Eruption continues with ongoing explosions and multiple active crater vents, August 2018-January 2019
According to the Vanuatu Meteorology and Geo-Hazards Department (VMGD), which monitors Yasur, the volcano has been in essentially continuous Strombolian activity since Captain Cook observed ash eruptions in 1774, and undoubtedly before that time. VMGD reported that, based on visual observations and seismic data, activity continued through January 2019, with ongoing, sometimes strong, explosions. The Alert Level remained at 2 (on a scale of 0-4). VMGD reminded residents and tourists to remain outside the 395-m-radius permanent exclusion zone and warned that volcanic ash and gas could reach areas influenced by trade winds.
Thermal anomalies, based on MODIS satellite instruments analyzed using the MODVOLC algorithm, were recorded 6-15 days per month during the reporting period, sometimes with multiple pixels. The MIROVA (Middle InfraRed Observation of Volcanic Activity) volcano hotspot detection system, also based on analysis of MODIS data, detected numerous hotspots every month. Active crater vents were also frequently visible in Sentinel-2 satellite imagery (figure 50).
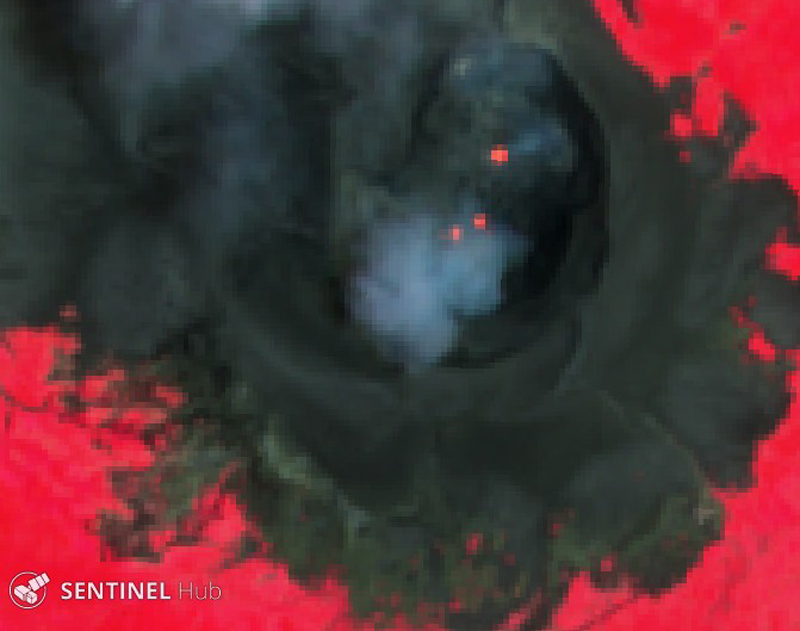 |
Figure 50. Sentinel-2 satellite color infrared image (bands 8, 4, 3) of Yasur on 17 November 2018 showing at least three distinct heat sources in the crater. Courtesy of Sentinel Hub Playground. |
Information Contacts: Geo-Hazards Division, Vanuatu Meteorology and Geo-Hazards Department, Ministry of Climate Change Adaptation, Meteorology, Geo-Hazards, Energy, Environment and Disaster Management, Private Mail Bag 9054, Lini Highway, Port Vila, Vanuatu (URL: http://www.vmgd.gov.vu/, https://www.facebook.com/VanuatuGeohazardsObservatory); Hawai'i Institute of Geophysics and Planetology (HIGP) - MODVOLC Thermal Alerts System, School of Ocean and Earth Science and Technology (SOEST), Univ. of Hawai'i, 2525 Correa Road, Honolulu, HI 96822, USA (URL: http://modis.higp.hawaii.edu/); MIROVA (Middle InfraRed Observation of Volcanic Activity), a collaborative project between the Universities of Turin and Florence (Italy) supported by the Centre for Volcanic Risk of the Italian Civil Protection Department (URL: http://www.mirovaweb.it/); Sentinel Hub Playground (URL: https://www.sentinel-hub.com/explore/sentinel-playground).
Strong thermal activity with incandescent ejecta continues, February-May 2019
Yasur volcano on Tanna Island has been characterized by Strombolian activity with large incandescent bombs, frequent explosions, lava fountaining, and ash emissions for much of its known eruptive history. Melanesians from nearby islands are believed to have settled Tanna in about 400 BCE; it is now part of the nation of Vanuatu, independent since 1980. The Kwamera language (or Tannese) spoken on the SE coast of the island is thought to be the source of the name of the island. No known oral history describes volcanic activity; the first written English-language documentation of activity dates to 5 August 1774, when Captain James Cook saw "a great fire" on Tanna Island. Cook realized that it "was a Volcano which threw up vast quantities of fire and smoak and made a rumbling noise which was heard at a good distance" (The Captain Cook Society) (figure 51).
 |
Figure 51. Incandescence, steam, and dark ash from Yasur fill the sky in this sketch representing Captain James Cook's landing in the 'Resolution' at Tanna Island on 5 August 1774. The form of the volcano is behind the ship, the incandescence is in the upper right next to the ship's masts. "Landing at Tanna" by William Hodges, 1775-1776, National Maritime Museum, Greenwich, London. The Maritime Museum noted that this is one of a group of panel paintings produced by Hodges of encounters with islanders during the voyage, in which the European perception of each society at the time is portrayed. Image taken from Wikimedia Commons. |
Based on numerous accounts from ships logs and other sources, volcanic activity has been continuous since that time. During periods of higher activity, multiple vents within the summit crater send ejecta 100 m or more above the crater rim, with large bombs occasionally landing hundreds of meters away. Continued activity during February-May 2019 is covered in this report with information provided by the Geo-Hazards Division, Vanuatu Meteorology and Geo-Hazards Department (VMGD) which monitors the volcano and satellite data; photographs from tourists also provide valuable information about this remote location.
VMGD has maintained Alert Level 2 at Yasur since October 2016, indicating that it is in a major state of unrest. There is a permanent exclusion zone within 395 m of the eruptive vents where access is prohibited due to multiple hazards, primarily from large incandescent bombs up to 4 m in diameter which have been ejected from the vents onto the crater rim in the past, resulting in fatalities (BGVN 20:08).
Satellite and ground based information all support high levels of thermal activity during February -May 2019. MODVOLC thermal alerts were issued 11 times in February, 27 times in March, and 20 times each in April and May. The MIROVA graph also indicated the ongoing consistently high levels of thermal energy throughout the period (figure 52). Plumes of SO2 emissions are common from Vanuatu's volcanoes; newer higher resolution data available beginning in 2019 reveal a persistent stream of SO2 from Yasur on a near-daily basis (figure 53).
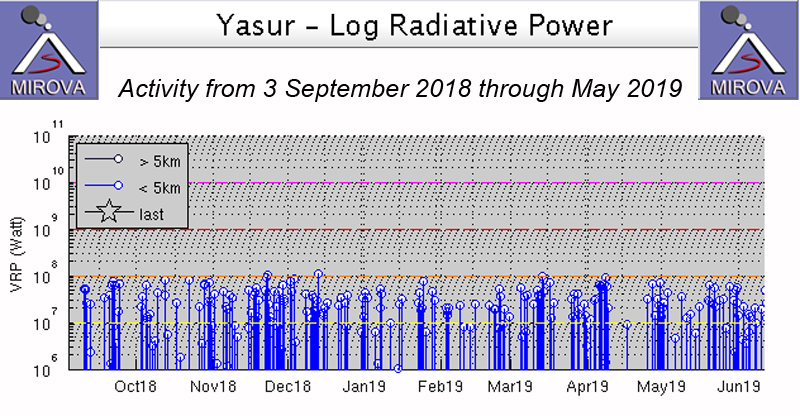 |
Figure 52. The MIROVA graph of thermal energy at Yasur from 3 September 2018 through May 2019 indicates the ongoing activity at the volcano. Courtesy of MIROVA. |
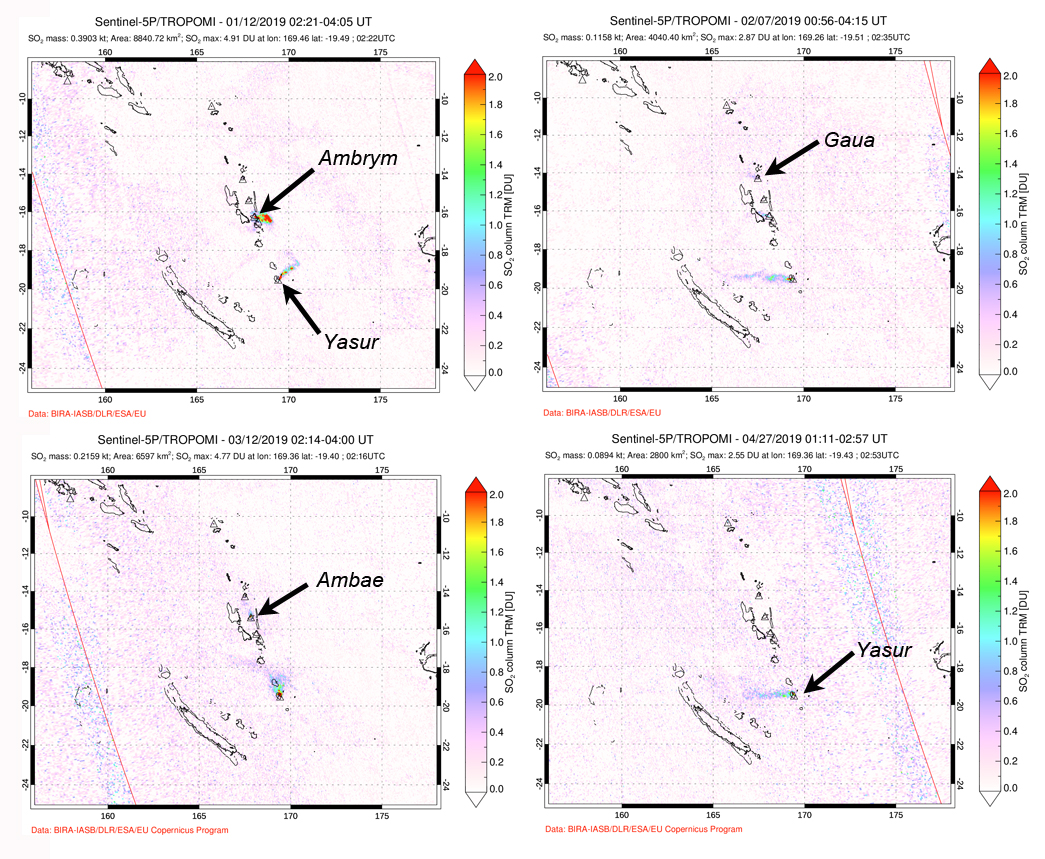 |
Figure 53. The SO2 plumes from Yasur were persistent during January-May 2019 when they were visible many days of each week throughout the period. Top left: On 12 January plumes were visible drifting E from both Ambrym (top) and Yasur (bottom). Top right: Plumes drifted W from three Vanuatu volcanoes on 7 February, Gaua (top), Ambrym (middle) and Yasur (bottom). Bottom left: On 12 March N drifting plumes could be seen from Ambae (top) and Yasur (bottom). On 27 April, only Yasur had an SO2 plume drifting W. Courtesy of Goddard Space Flight Center. |
Satellite imagery confirmed that the heat sources from Yasur were vents within the summit crater of the pyroclastic cone. Both northern and southern vent areas were active. On 7 March 2019 the N vent area had a strong thermal signal. Ten days later, on 17 March, similar intensity thermal anomalies were present in both the N and S vent areas (figure 54). On 6 April the S vent area had a stronger signal, and gas emissions from both vents were drifting N (figure 55). Satellite imagery from 21 May 2019 indicated a strong thermal signal inside the crater in the area of the vents, and included a weaker signal clearly visible on the inside E crater rim. Strong Strombolian activity or spatter sending large incandescent bombs as far as the crater rim are a likely explanation for the signal (figure 56), underscoring the hazardous nature of approaching the crater rim.
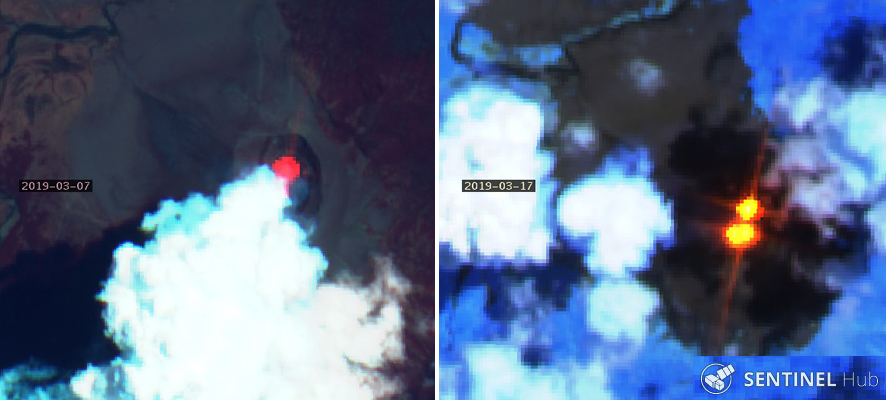 |
Figure 54. Strong thermal anomalies from the crater of Yasur's pyroclastic cone seen in satellite images confirmed the ongoing high level of activity. Left: 7 March 2019, a strong thermal anomaly from the N vent area, shown with "Geology" rendering (bands 12, 4, 2). Right: 17 March 2019, thermal anomalies at both the N and S vent areas, shown with "Atmospheric Penetration" rendering (bands 12, 11, 8A). The crater is about 500 m in diameter. Sentinel-2 satellite imagery courtesy of Sentinel Hub Playground. |
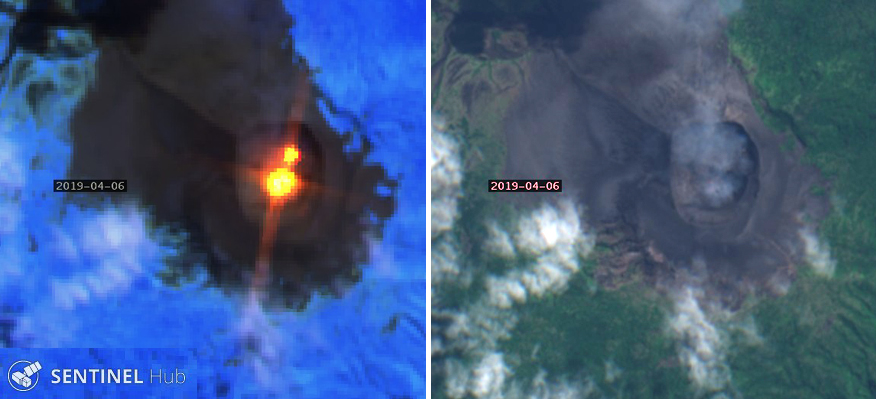 |
Figure 55. Strong thermal anomalies (left) and gas emissions (right) at Yasur were captured with different bands in the same Sentinel-2 satellite image on 6 April 2019. Left: The thermal anomaly in the S vent area was stronger than in the N vent area, "Atmospheric Penetration" rendering (bands 12, 11, 8A). Right: Gas plumes drifted N from both vent areas, "Natural color" rendering (bands 4, 3, 2). The crater is about 500 m in diameter. Sentinel-2 satellite imagery courtesy of Sentinel Hub Playground. |
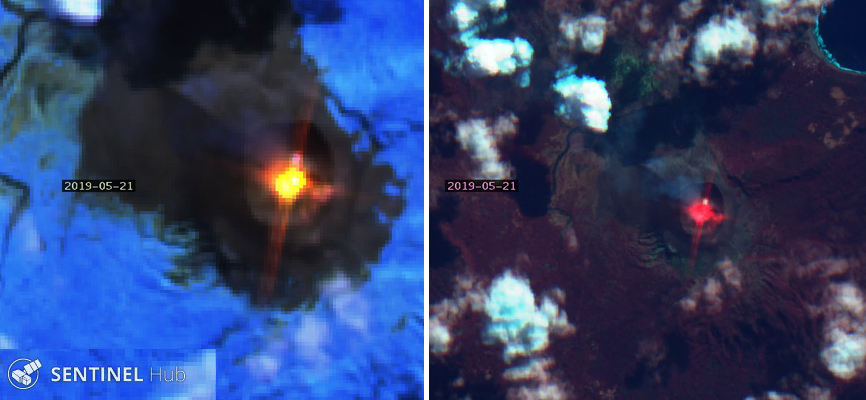 |
Figure 56. Thermal activity from the crater of Yasur on 21 May 2019 produced a strong thermal signal from the center of the crater and a weaker signal on the inside E crater rim, likely the result of hazardous incandescent bombs and ejecta, frequent products of the activity at Yasur. Left: "Atmospheric Penetration" rendering (bands 12, 11, 8A). Right: "Geology" rendering (bands 12, 4, 2). The crater is about 0.5 km in diameter. Sentinel-2 satellite imagery courtesy of Sentinel Hub Playground. |
Tourists visit Yasur on a regular basis. A former lake on the N side of Yasur has left ripples in the sand deposits over older volcanic rocks on the N side of the volcano (figure 57) since it drained in 2000 (BGVN 28:01). Visitors are allowed to approach the S rim of the crater where incandescence from both the N and S vents is usually visible (figure 58). Incandescent spatter from the convecting lava in the vents is highly dangerous and unpredictable and often covers the inner slopes of the rim as well as sending bombs outside the crater (figure 59).
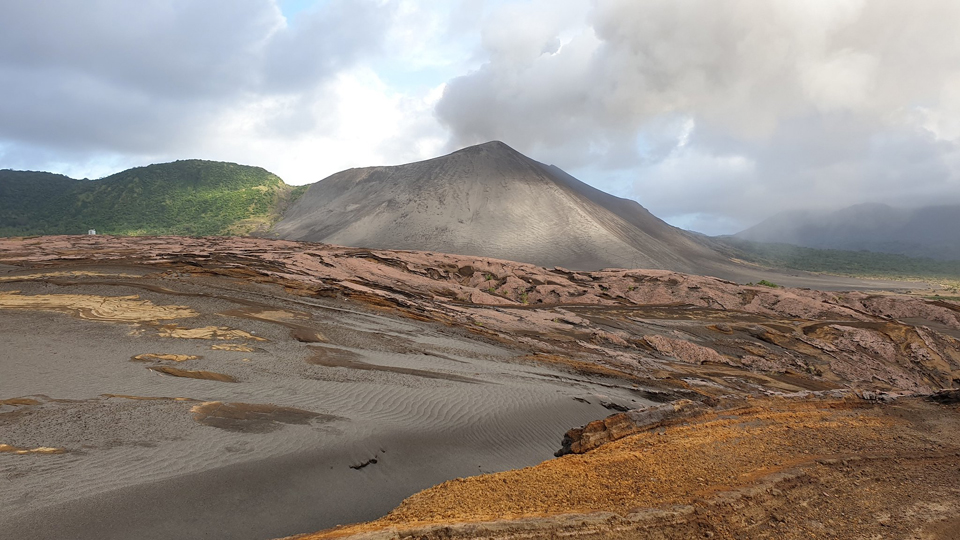 |
Figure 57. The pyroclastic cone of Yasur viewed from the north on 6 May 2019. Ripples in volcaniclastic sand in the foreground are remnants of a lake that was present on the N side of the volcano until a natural dam breached in 2000. Copyrighted photo by Nick Page, used with permission. |
 |
Figure 58. Two glowing vents were visible from the south rim of Yasur on 6 May 2019. The S vent area is in the foreground, the N vent area is in the upper left. Copyrighted by Nick Page, used with permission. |
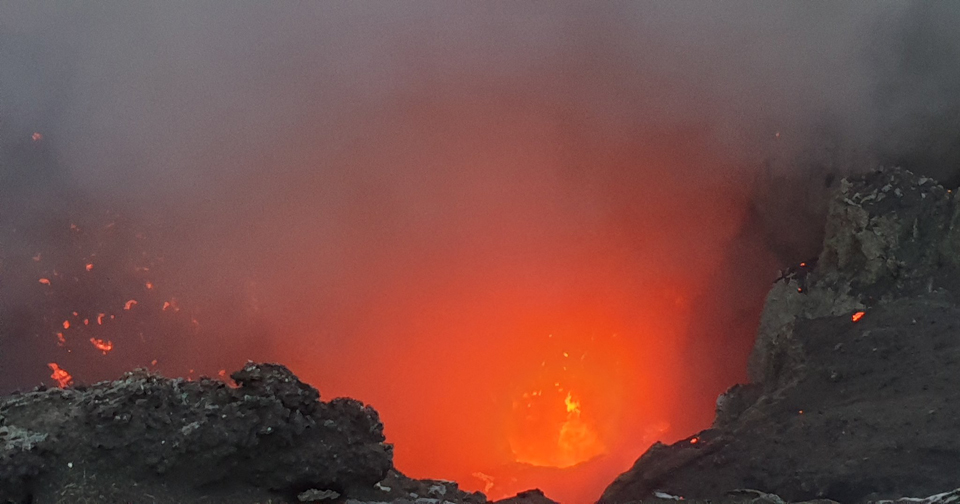 |
Figure 59. Incandescent spatter at Yasur on 6 May 2019 sent fragments of lava against the inside crater wall and onto the rim. The convecting lava in the vent can be seen in the lower foreground. Copyrighted photo by Nick Page, used with permission. |
Information Contacts: Geo-Hazards Division, Vanuatu Meteorology and Geo-Hazards Department (VMGD), Ministry of Climate Change Adaptation, Meteorology, Geo-Hazards, Energy, Environment and Disaster Management, Private Mail Bag 9054, Lini Highway, Port Vila, Vanuatu (URL: http://www.vmgd.gov.vu/, https://www.facebook.com/VanuatuGeohazardsObservatory/); Hawai'i Institute of Geophysics and Planetology (HIGP) MODVOLC Thermal Alerts System, School of Ocean and Earth Science and Technology (SOEST), Univ. of Hawai'i, 2525 Correa Road, Honolulu, HI 96822, USA (URL: http://modis.higp.hawaii.edu/); MIROVA (Middle InfraRed Observation of Volcanic Activity), a collaborative project between the Universities of Turin and Florence (Italy) supported by the Centre for Volcanic Risk of the Italian Civil Protection Department (URL: http://www.mirovaweb.it/); Sentinel Hub Playground (URL: https://www.sentinel-hub.com/explore/sentinel-playground); Global Sulfur Dioxide Monitoring Page, Atmospheric Chemistry and Dynamics Laboratory, NASA Goddard Space Flight Center (NASA/GSFC), 8800 Greenbelt Road, Goddard, Maryland, USA (URL: https://so2.gsfc.nasa.gov/); The Captain Cook Society (URL: https://www.captaincooksociety.com/home/detail/225-years-ago-july-september-1774); Royal Museums Greenwich (URL: https://collections.rmg.co.uk/collections/objects/13383.html); Wikimedia Commons, (URL: https://commons.wikimedia.org/wiki/File:The_Landing_at_Tana_one_of_the_New_Hebrides,_by_William_Hodges.jpg); Nick Page, Australia,Flickr: (URL: https://www.flickr.com/photos/152585166@N08/).
Strombolian activity continues during June 2019 through February 2020
Yasur has remained on Alert Level 2 (on a scale of 0-4) since 18 October 2016, indicating "Major Unrest; Danger Zone remains at 395 m around the eruptive vents." The summit crater contains several active vents that frequently produce Strombolian explosions and gas plumes (figure 60). This bulletin summarizes activity during June 2019 through February 2020 and is based on reports by the Vanuatu Meteorology and Geo-Hazards Department (VMGD), visitor photographs and videos, and satellite data.
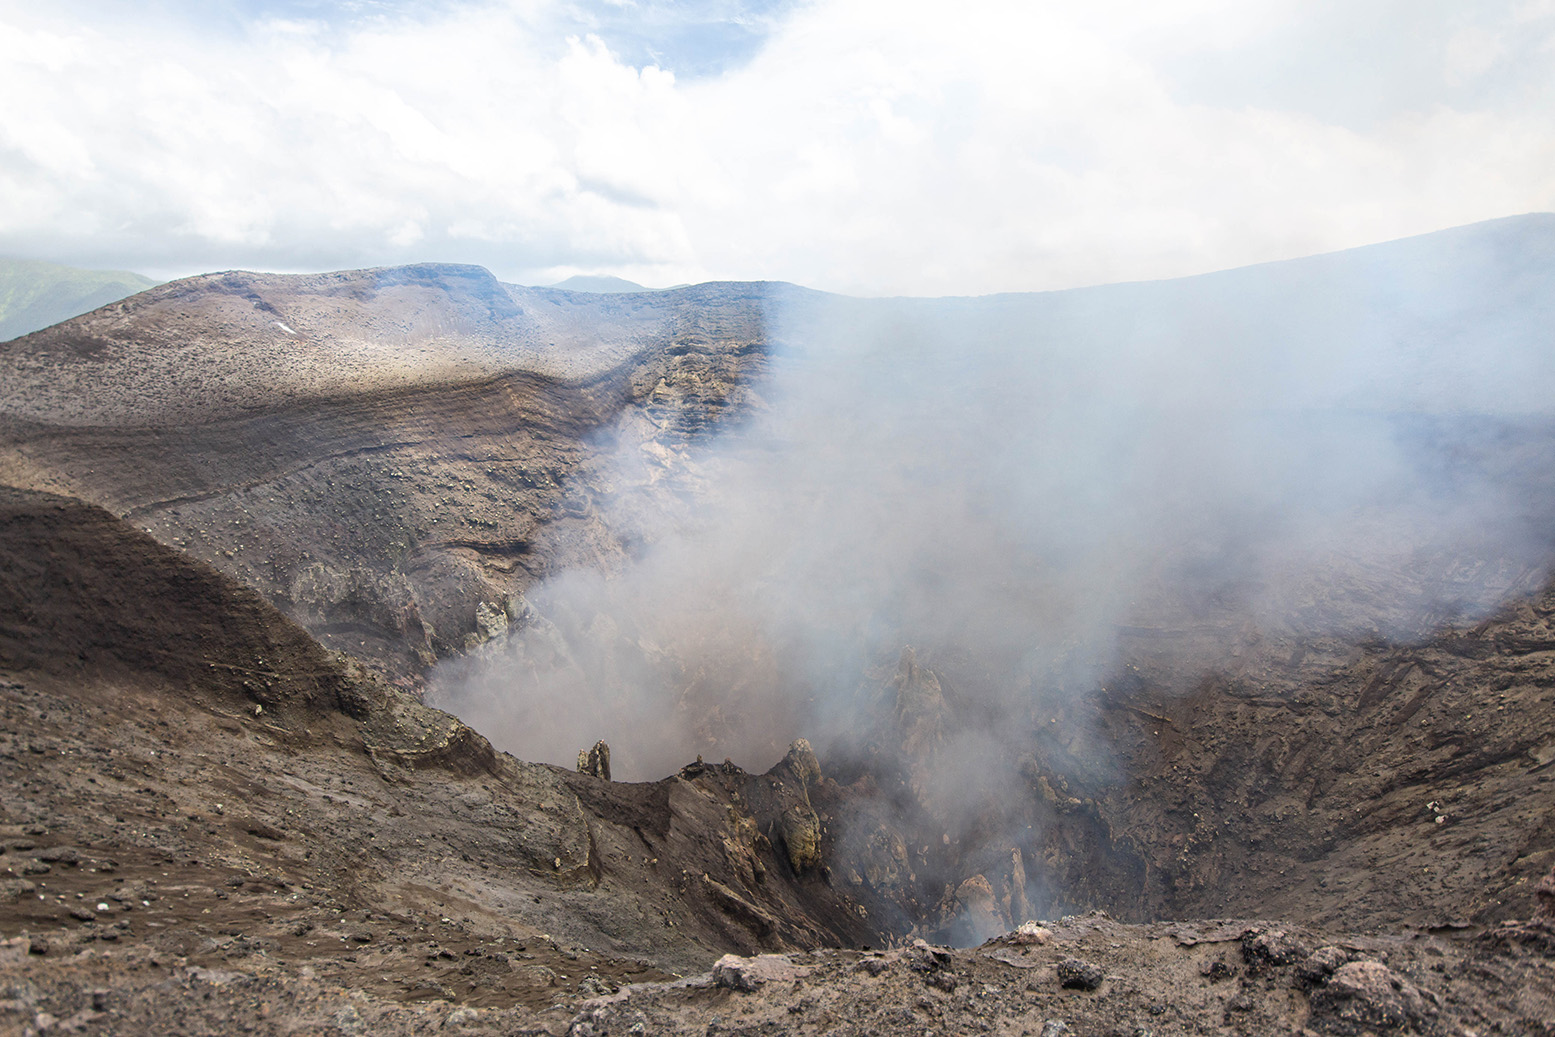 |
Figure 60. The crater of Yasur contains several active vents that produce gas emissions and Strombolian activity. Photo taken during 25-27 October 2019 by Justin Noonan, used with permission. |
A VMGD report on 27 June described ongoing Strombolian explosions with major unrest confined to the crater. The 25 July report noted the continuation of Strombolian activity with some strong explosions, and a warning that volcanic bombs may impact outside of the crater area (figure 61).
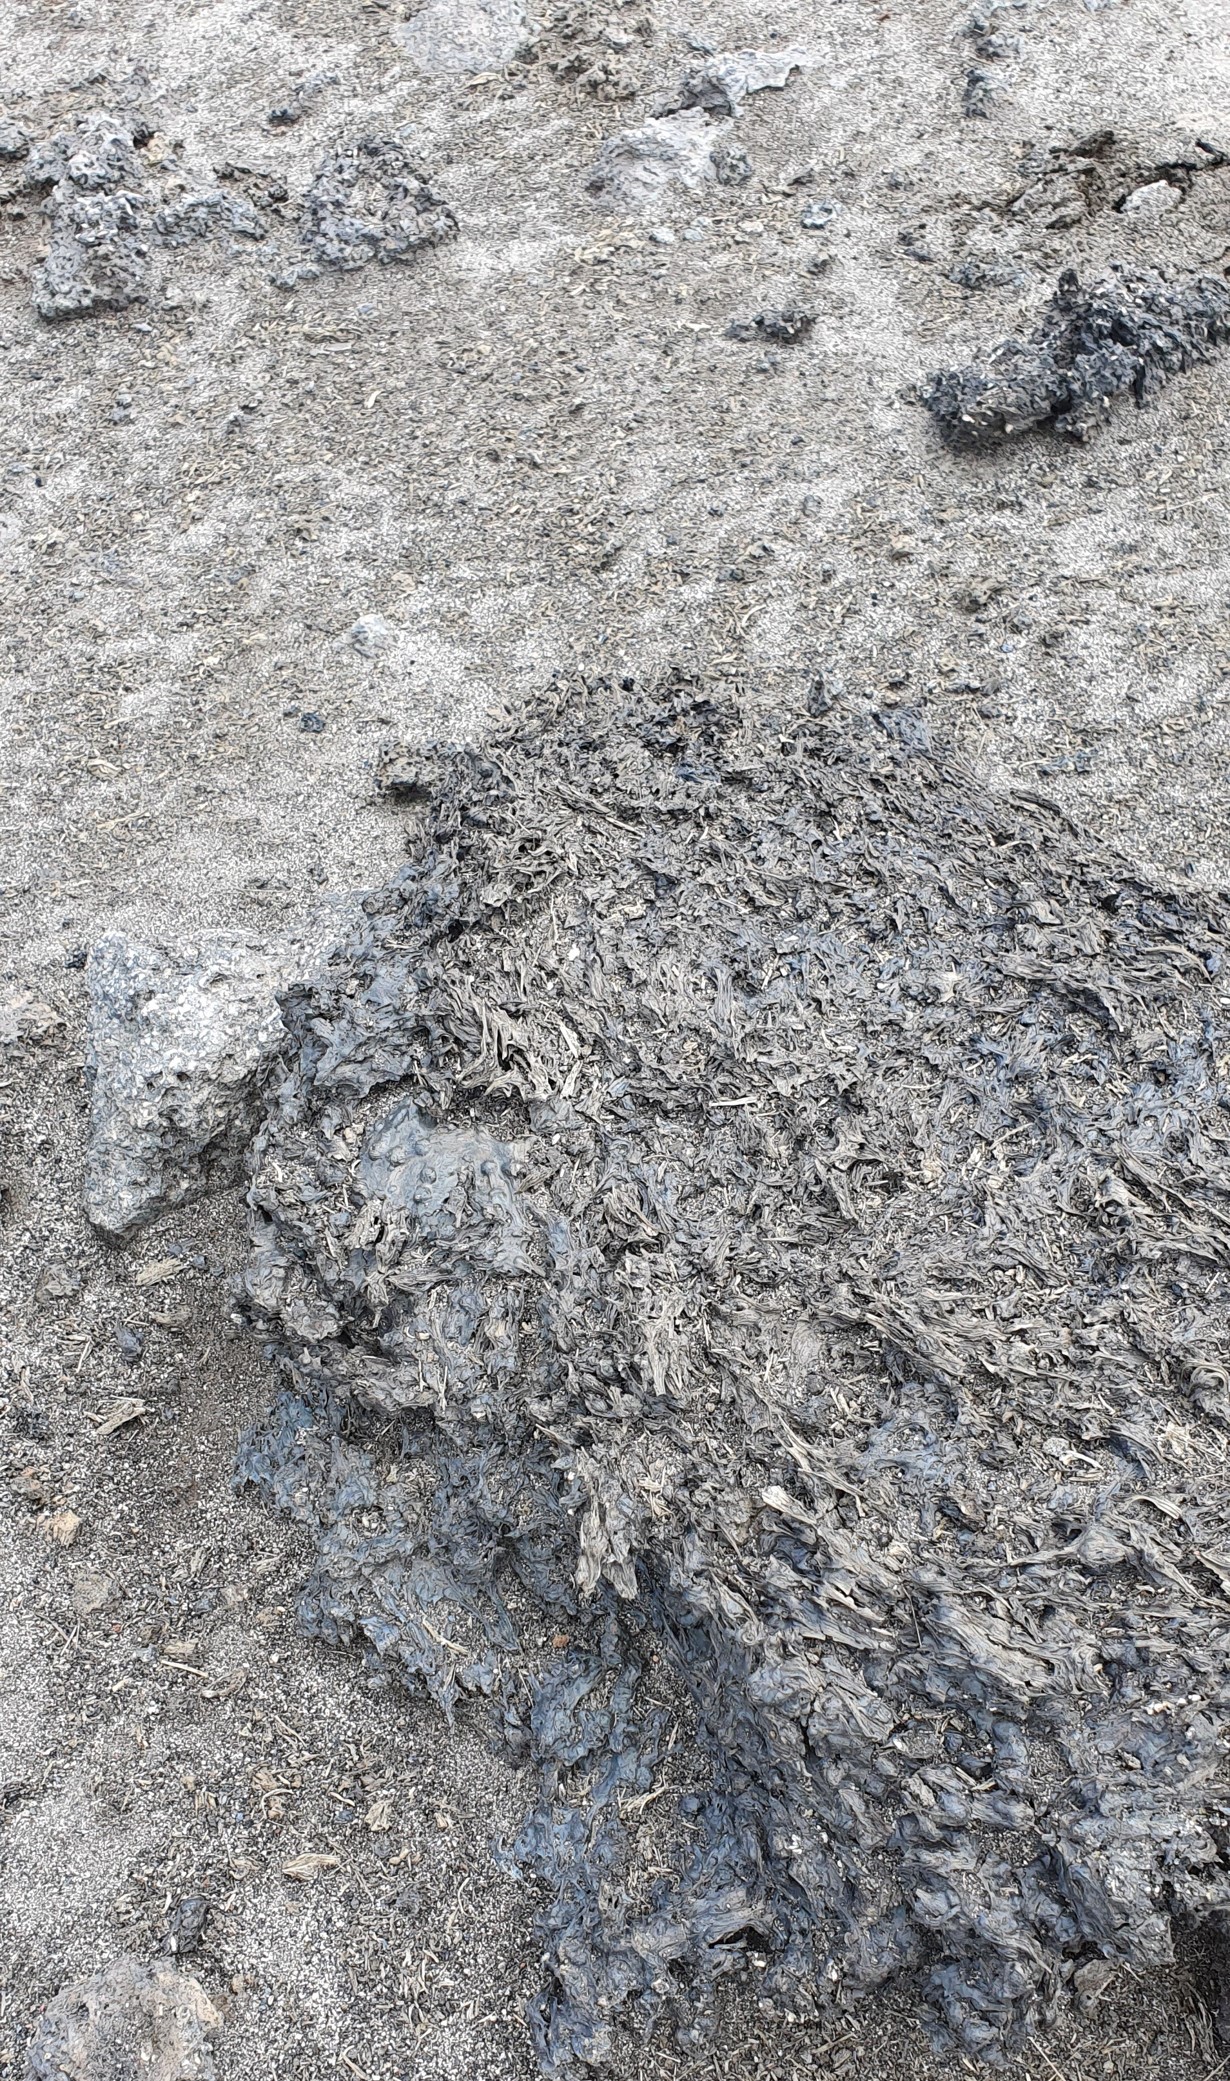 |
Figure 61. A volcanic bomb (a fluid chunk of lava greater than 64 mm in diameter) that was ejected from Yasur. The pattern on the surface shows the fluid nature of the lava before it cooled into a solid rock. Photo taken during 25-27 October 2019 by Justin Noonan, used with permission. |
No VMGD report was available for August, but Strombolian activity continued with gas emissions and explosions, as documented by visitors (figure 62). The eruption continued through September and October with some strong explosions and multiple active vents visible in thermal satellite imagery (figure 63). Strombolian explosions ejecting fluid lava from rapidly expanding gas bubbles were recorded during October, and likely represented the typical activity during the surrounding months (figure 64). Along with vigorous degassing producing a persistent plume there was occasional ash content (figure 65). At some point during 20-29 October a small landslide occurred along the eastern inner wall of the crater, visible in satellite images and later confirmed to have produced ashfall at the summit (figure 66).
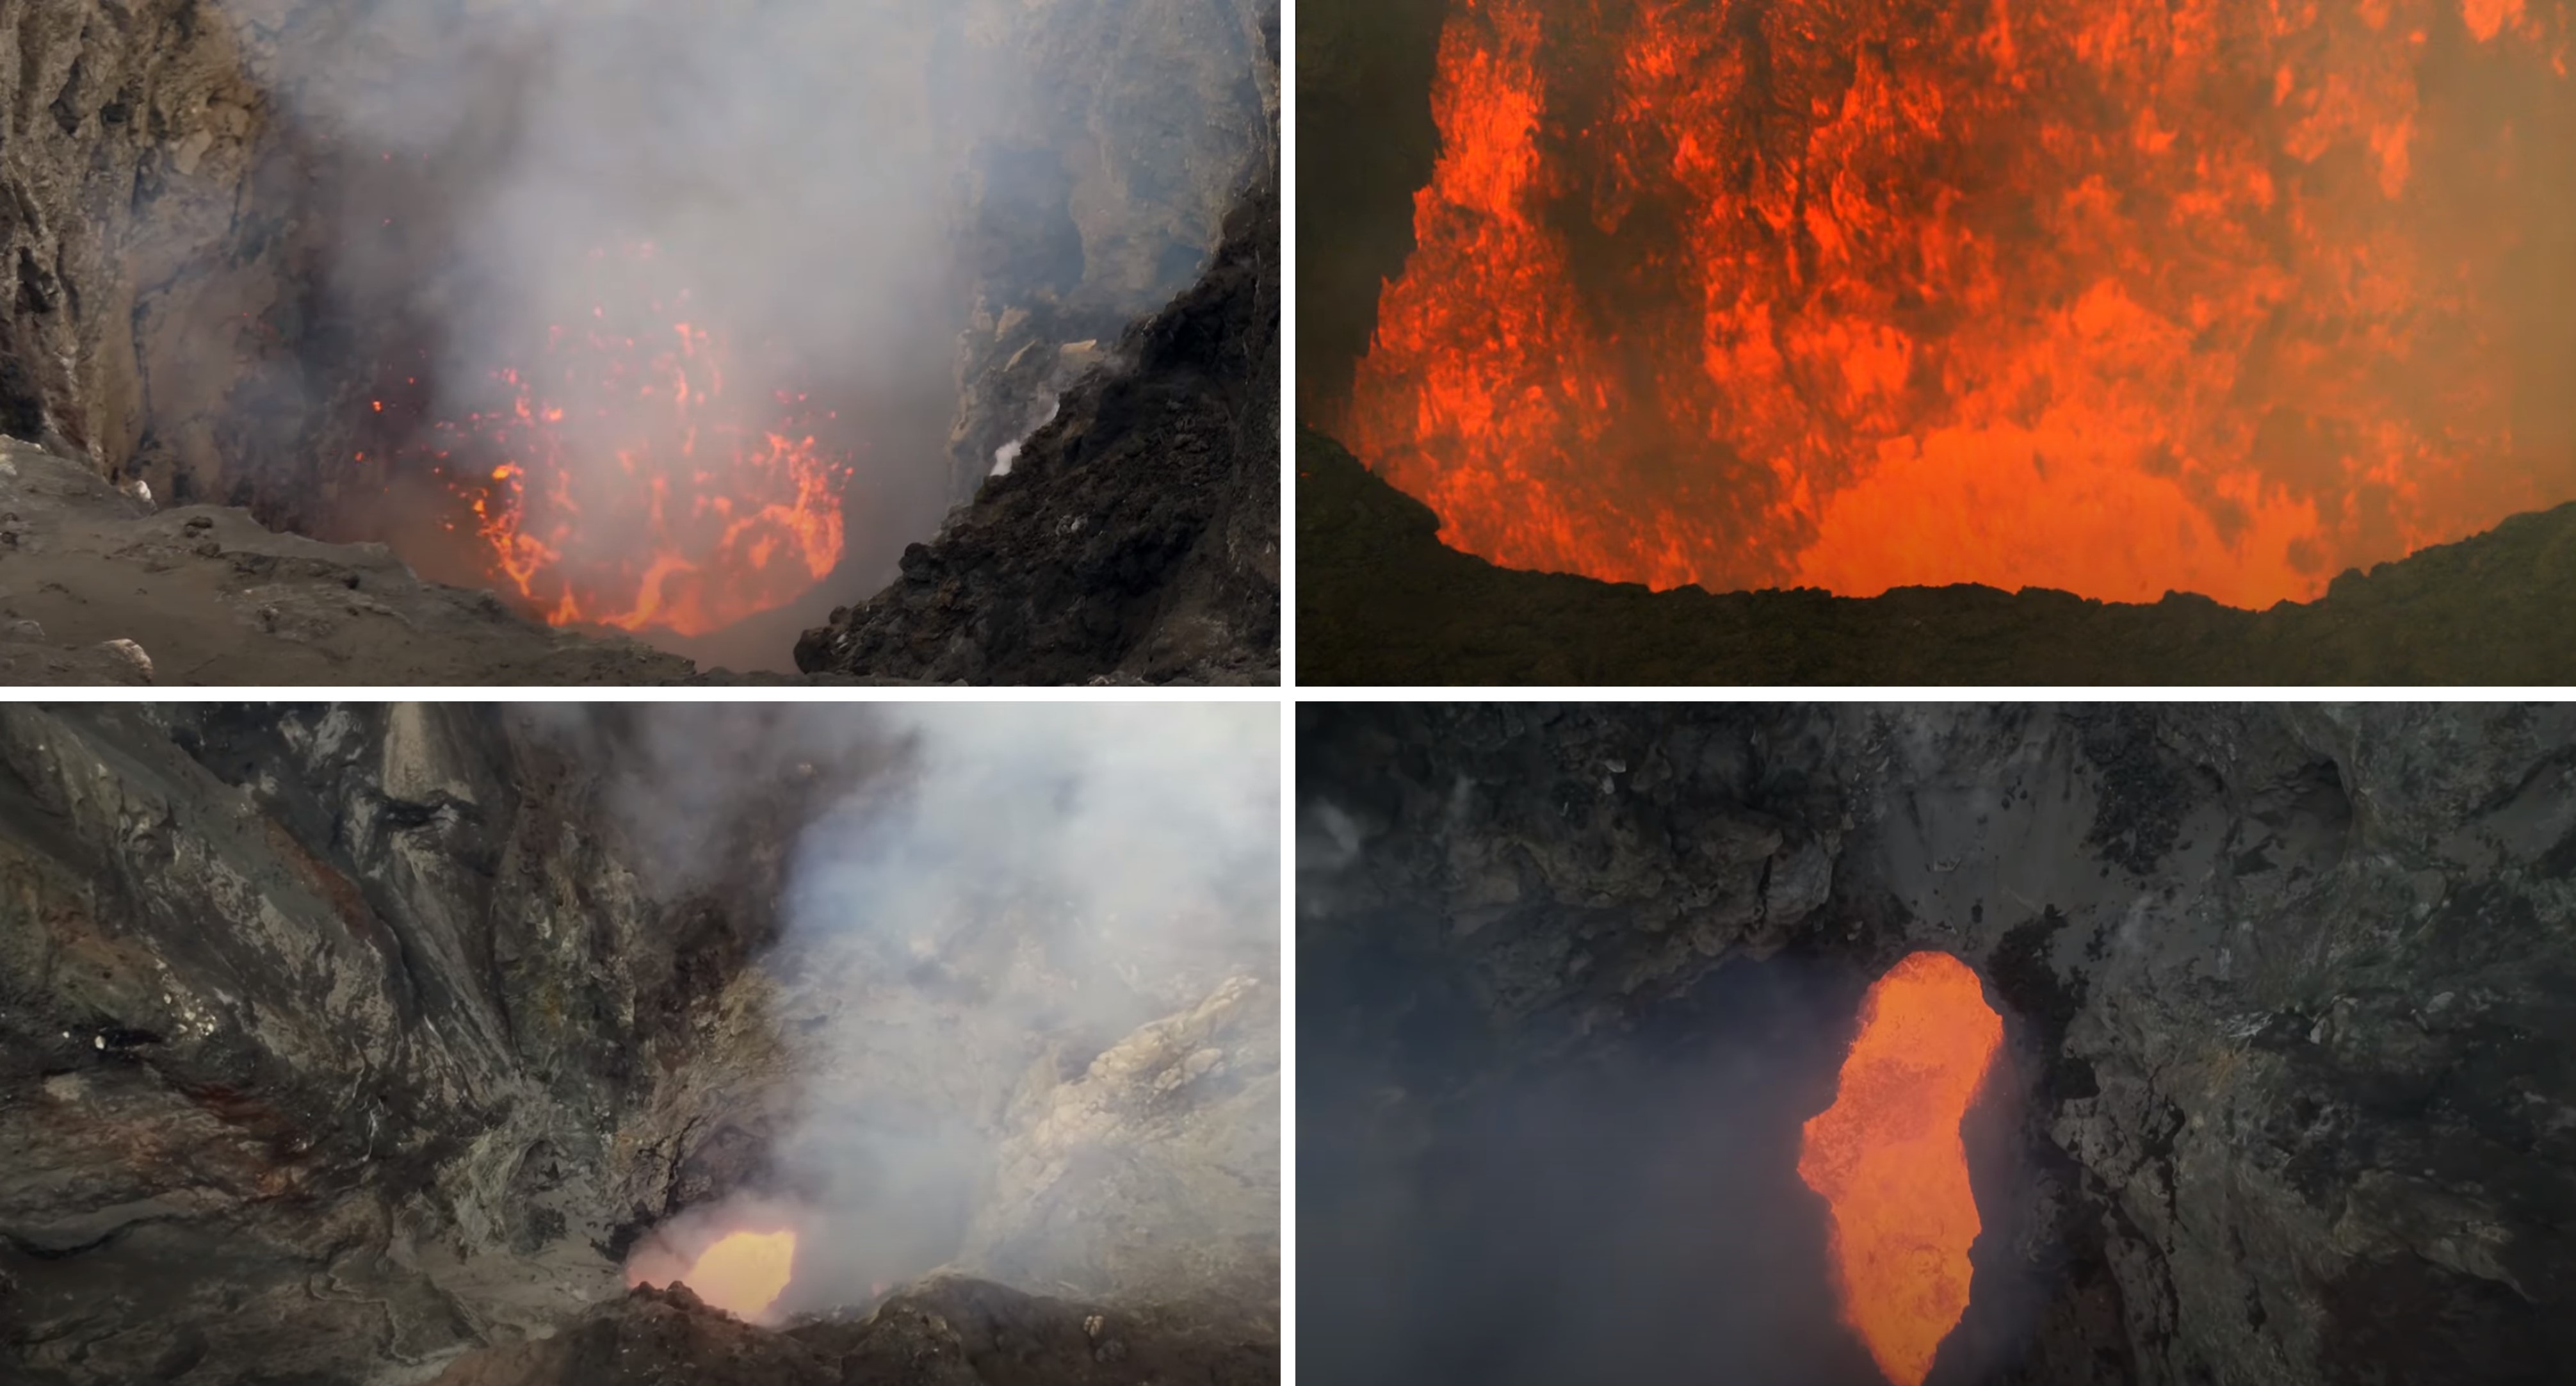 |
Figure 62. Different views of the Yasur vents on 7-8 August 2019 taken from a video. Strombolian activity and degassing were visible. Courtesy of Arnold Binas, used with permission. |
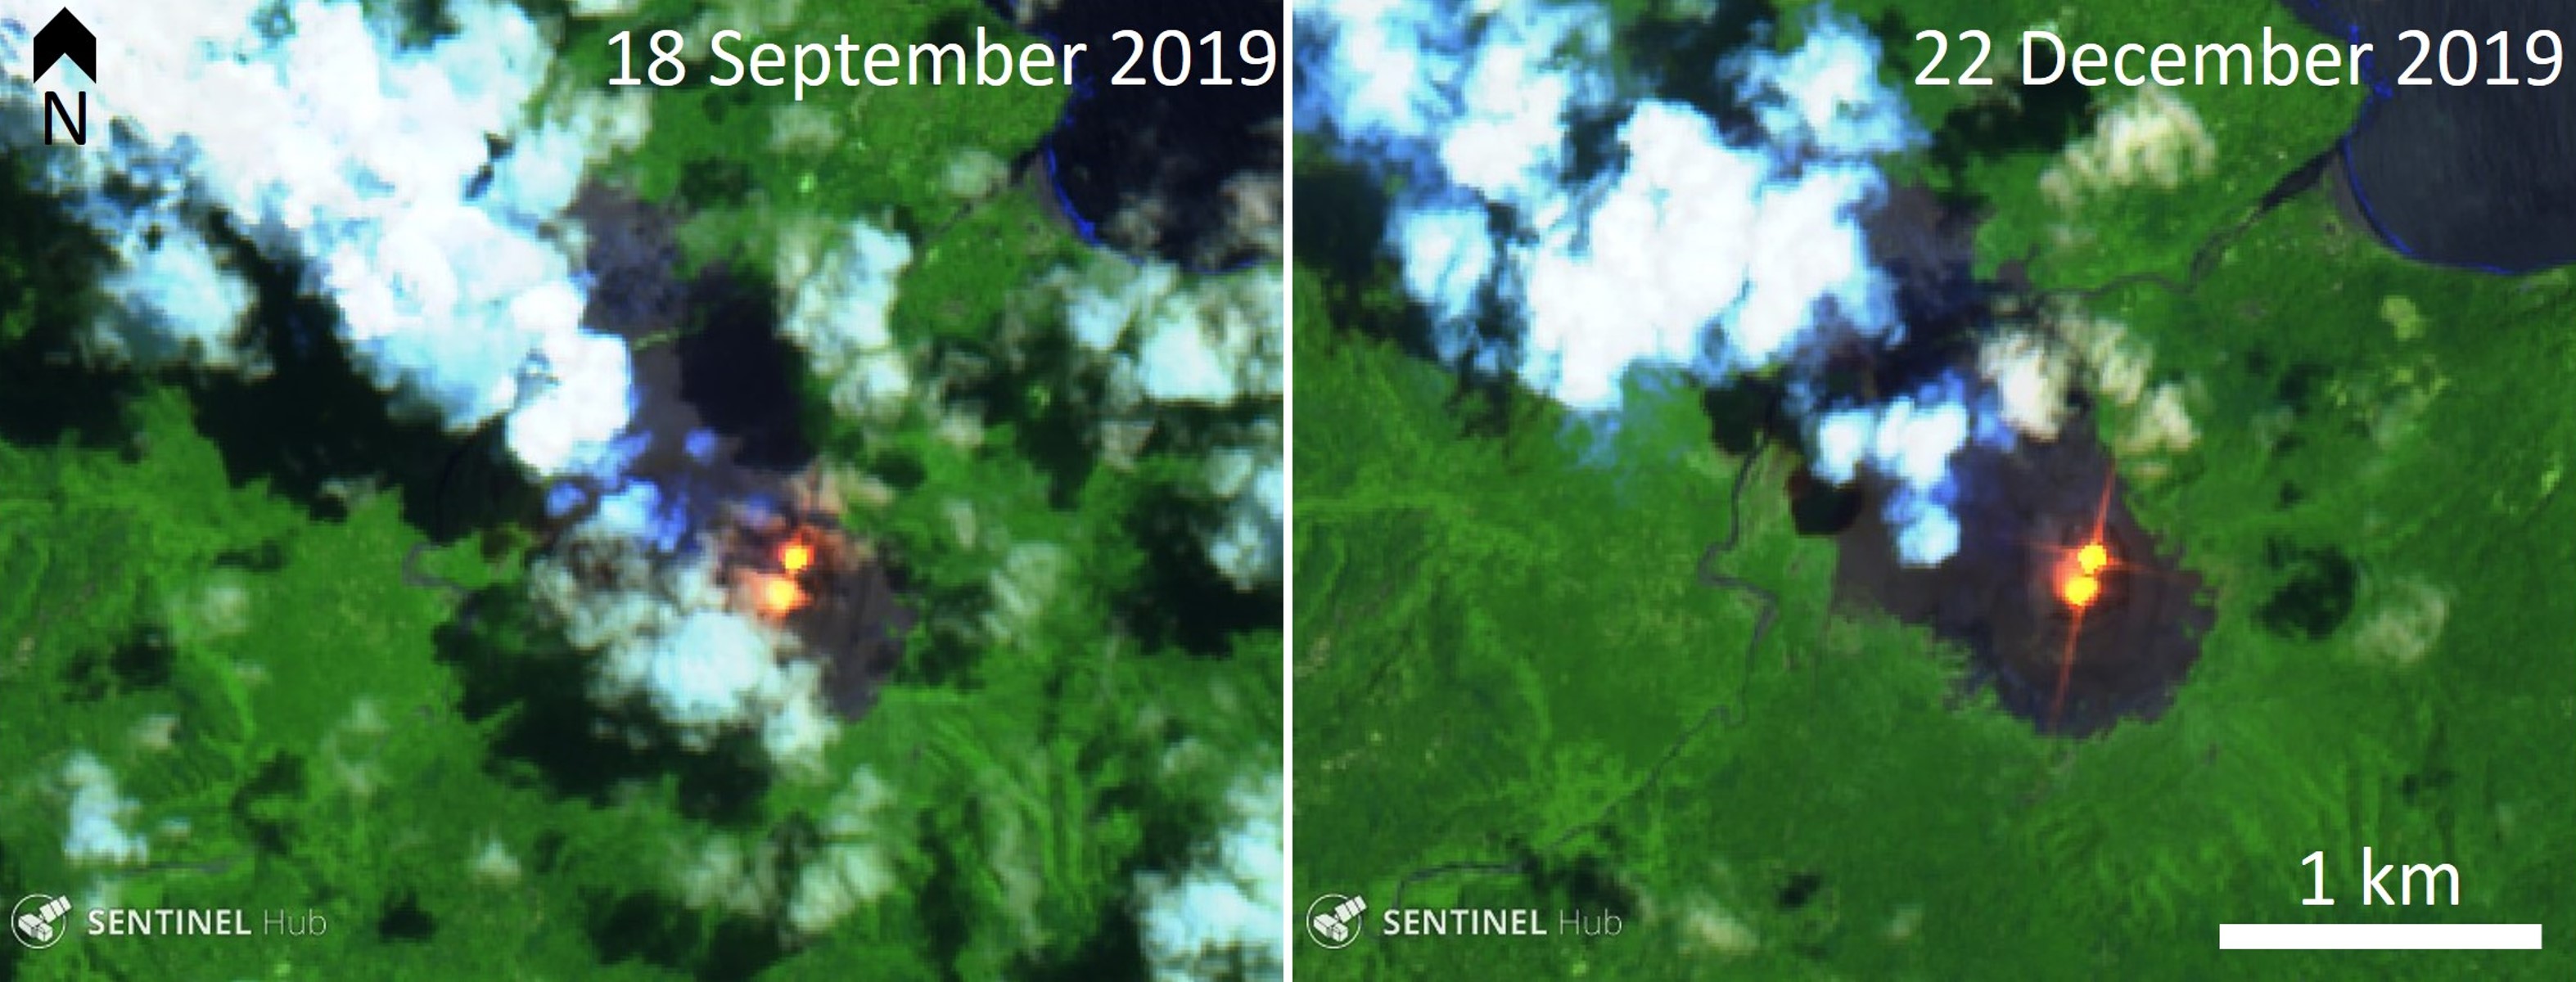 |
Figure 63. Sentinel-2 thermal satellite images show variations in detected thermal energy emitting from the active Yasur vents on 18 September and 22 December 2019. False color (bands 12, 11, 4) satellite images courtesy of Sentinel Hub Playground. |
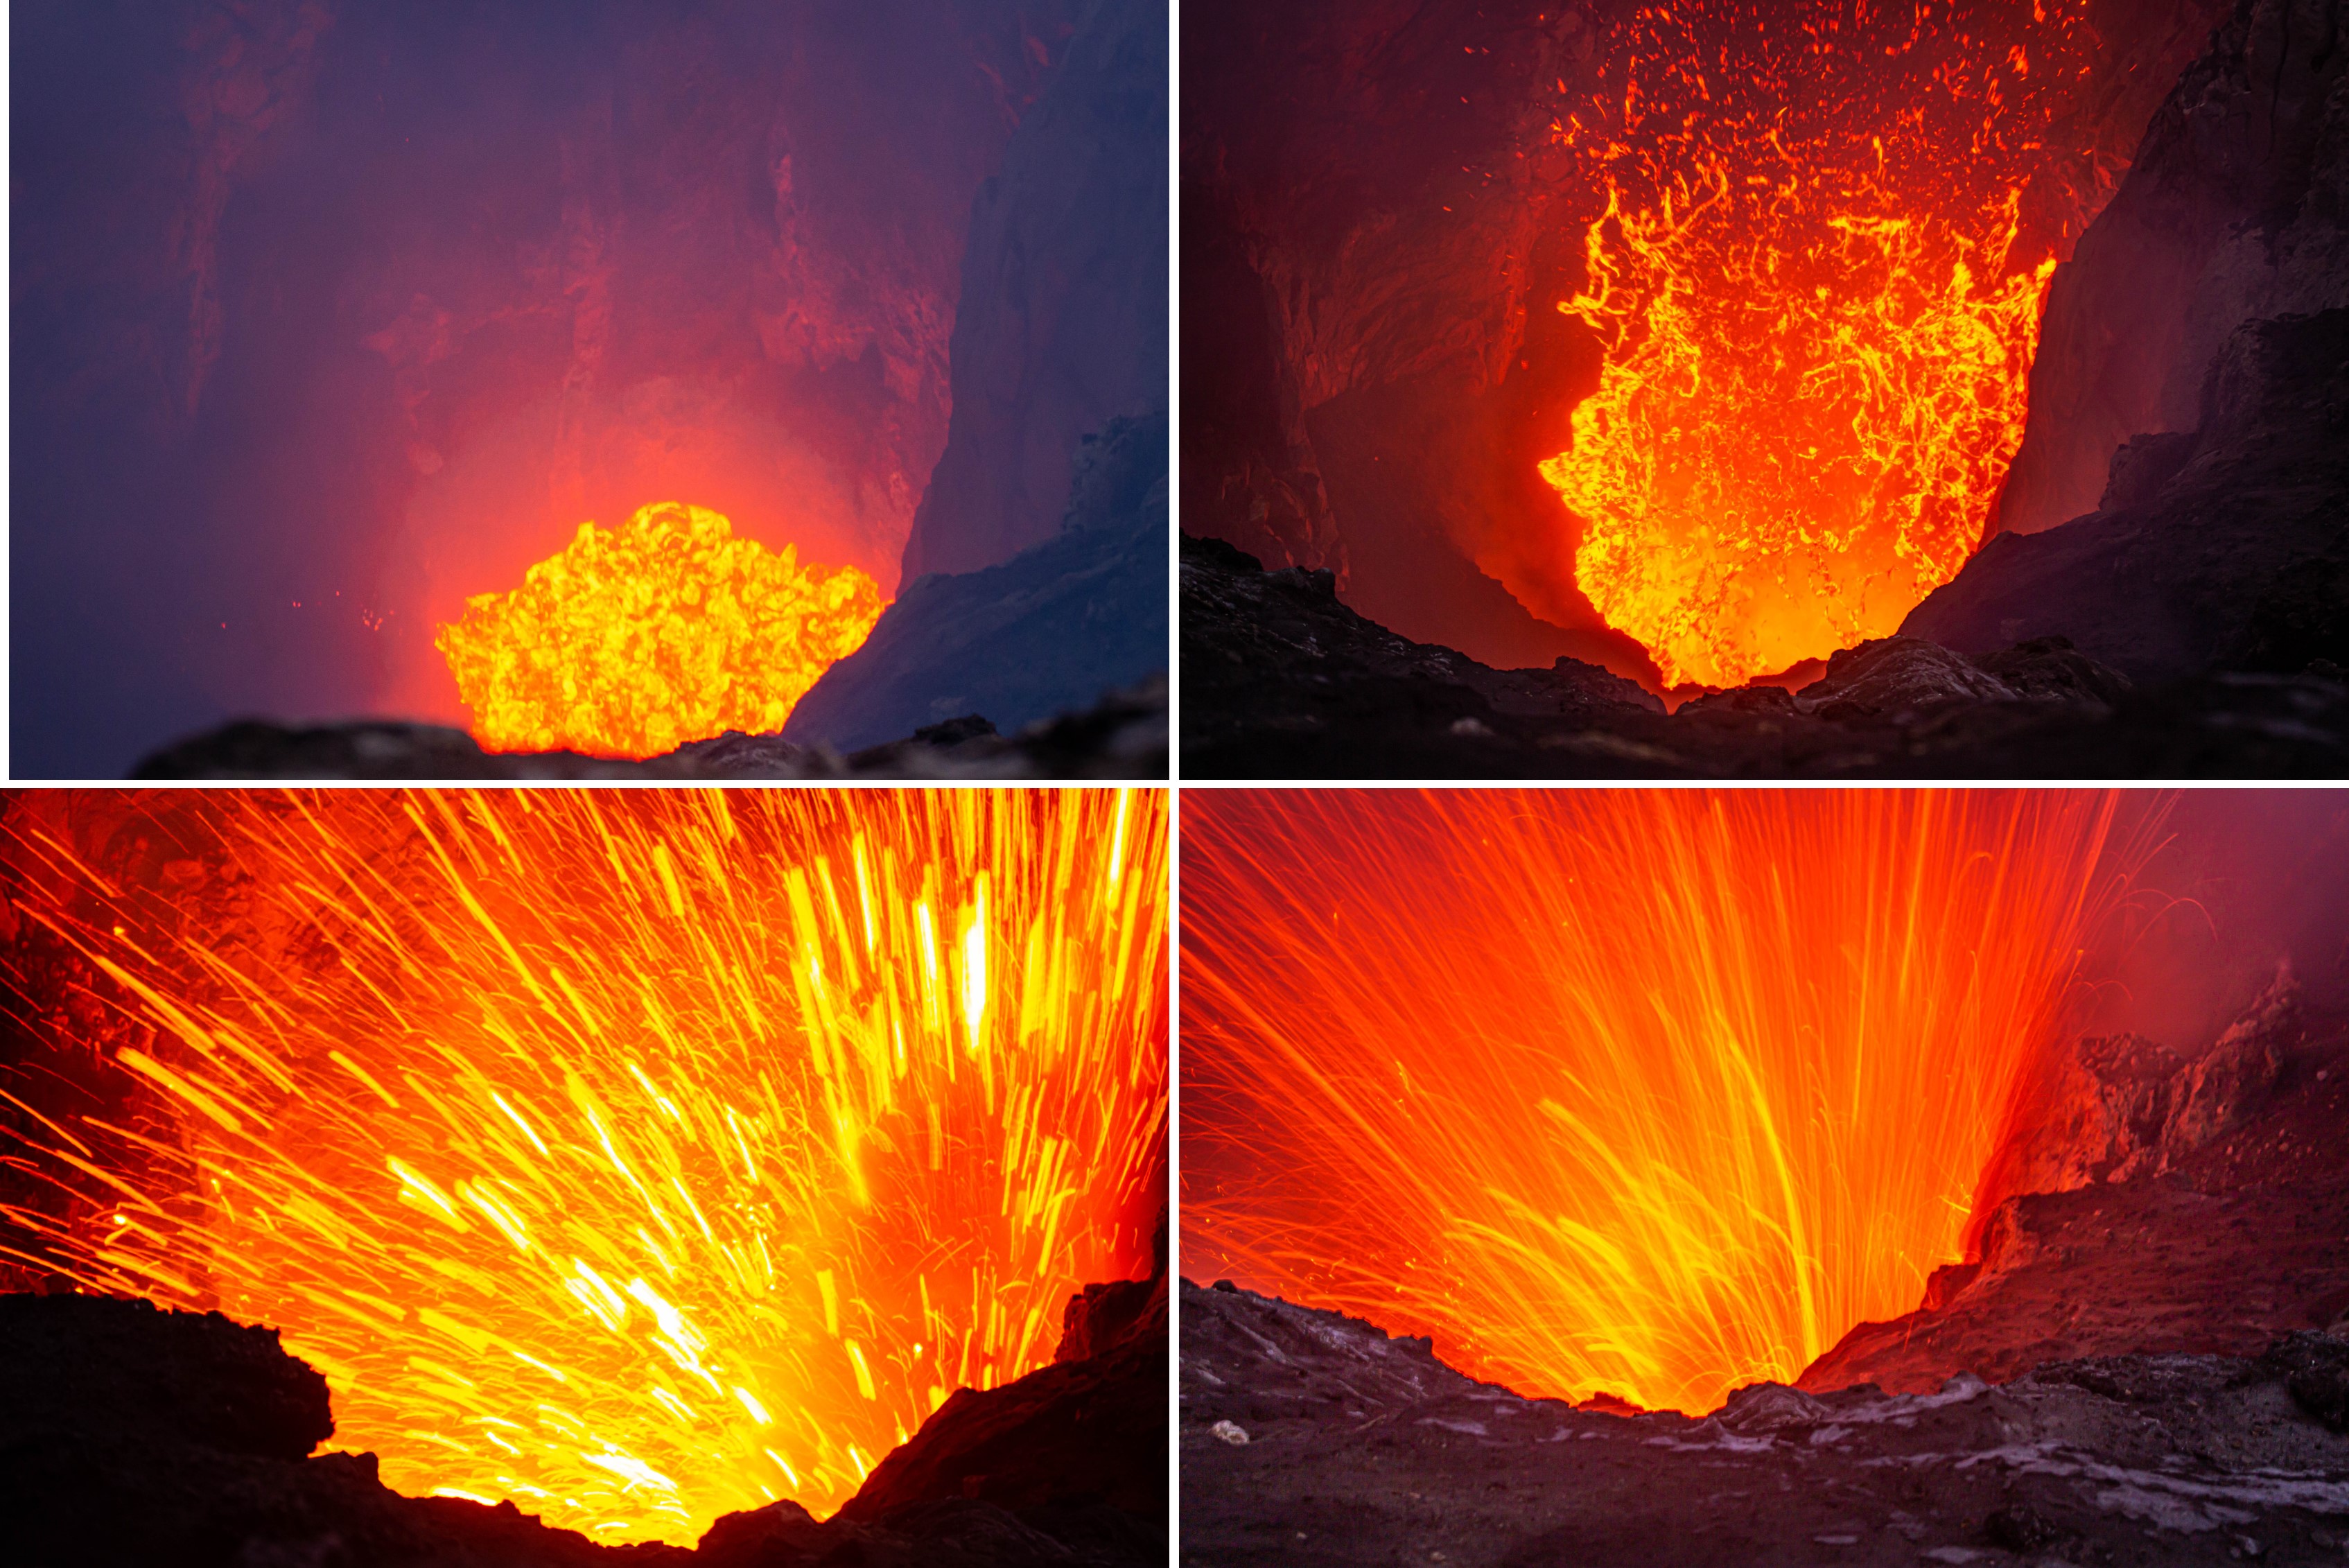 |
Figure 64. Strombolian explosions at Yasur during 25-27 October 2019. Large gas bubbles rise to the top of the lava column and burst, ejecting volcanic bombs – fluid chunks of lava, out of the vent. Photos by Justin Noonan, used with permission. |
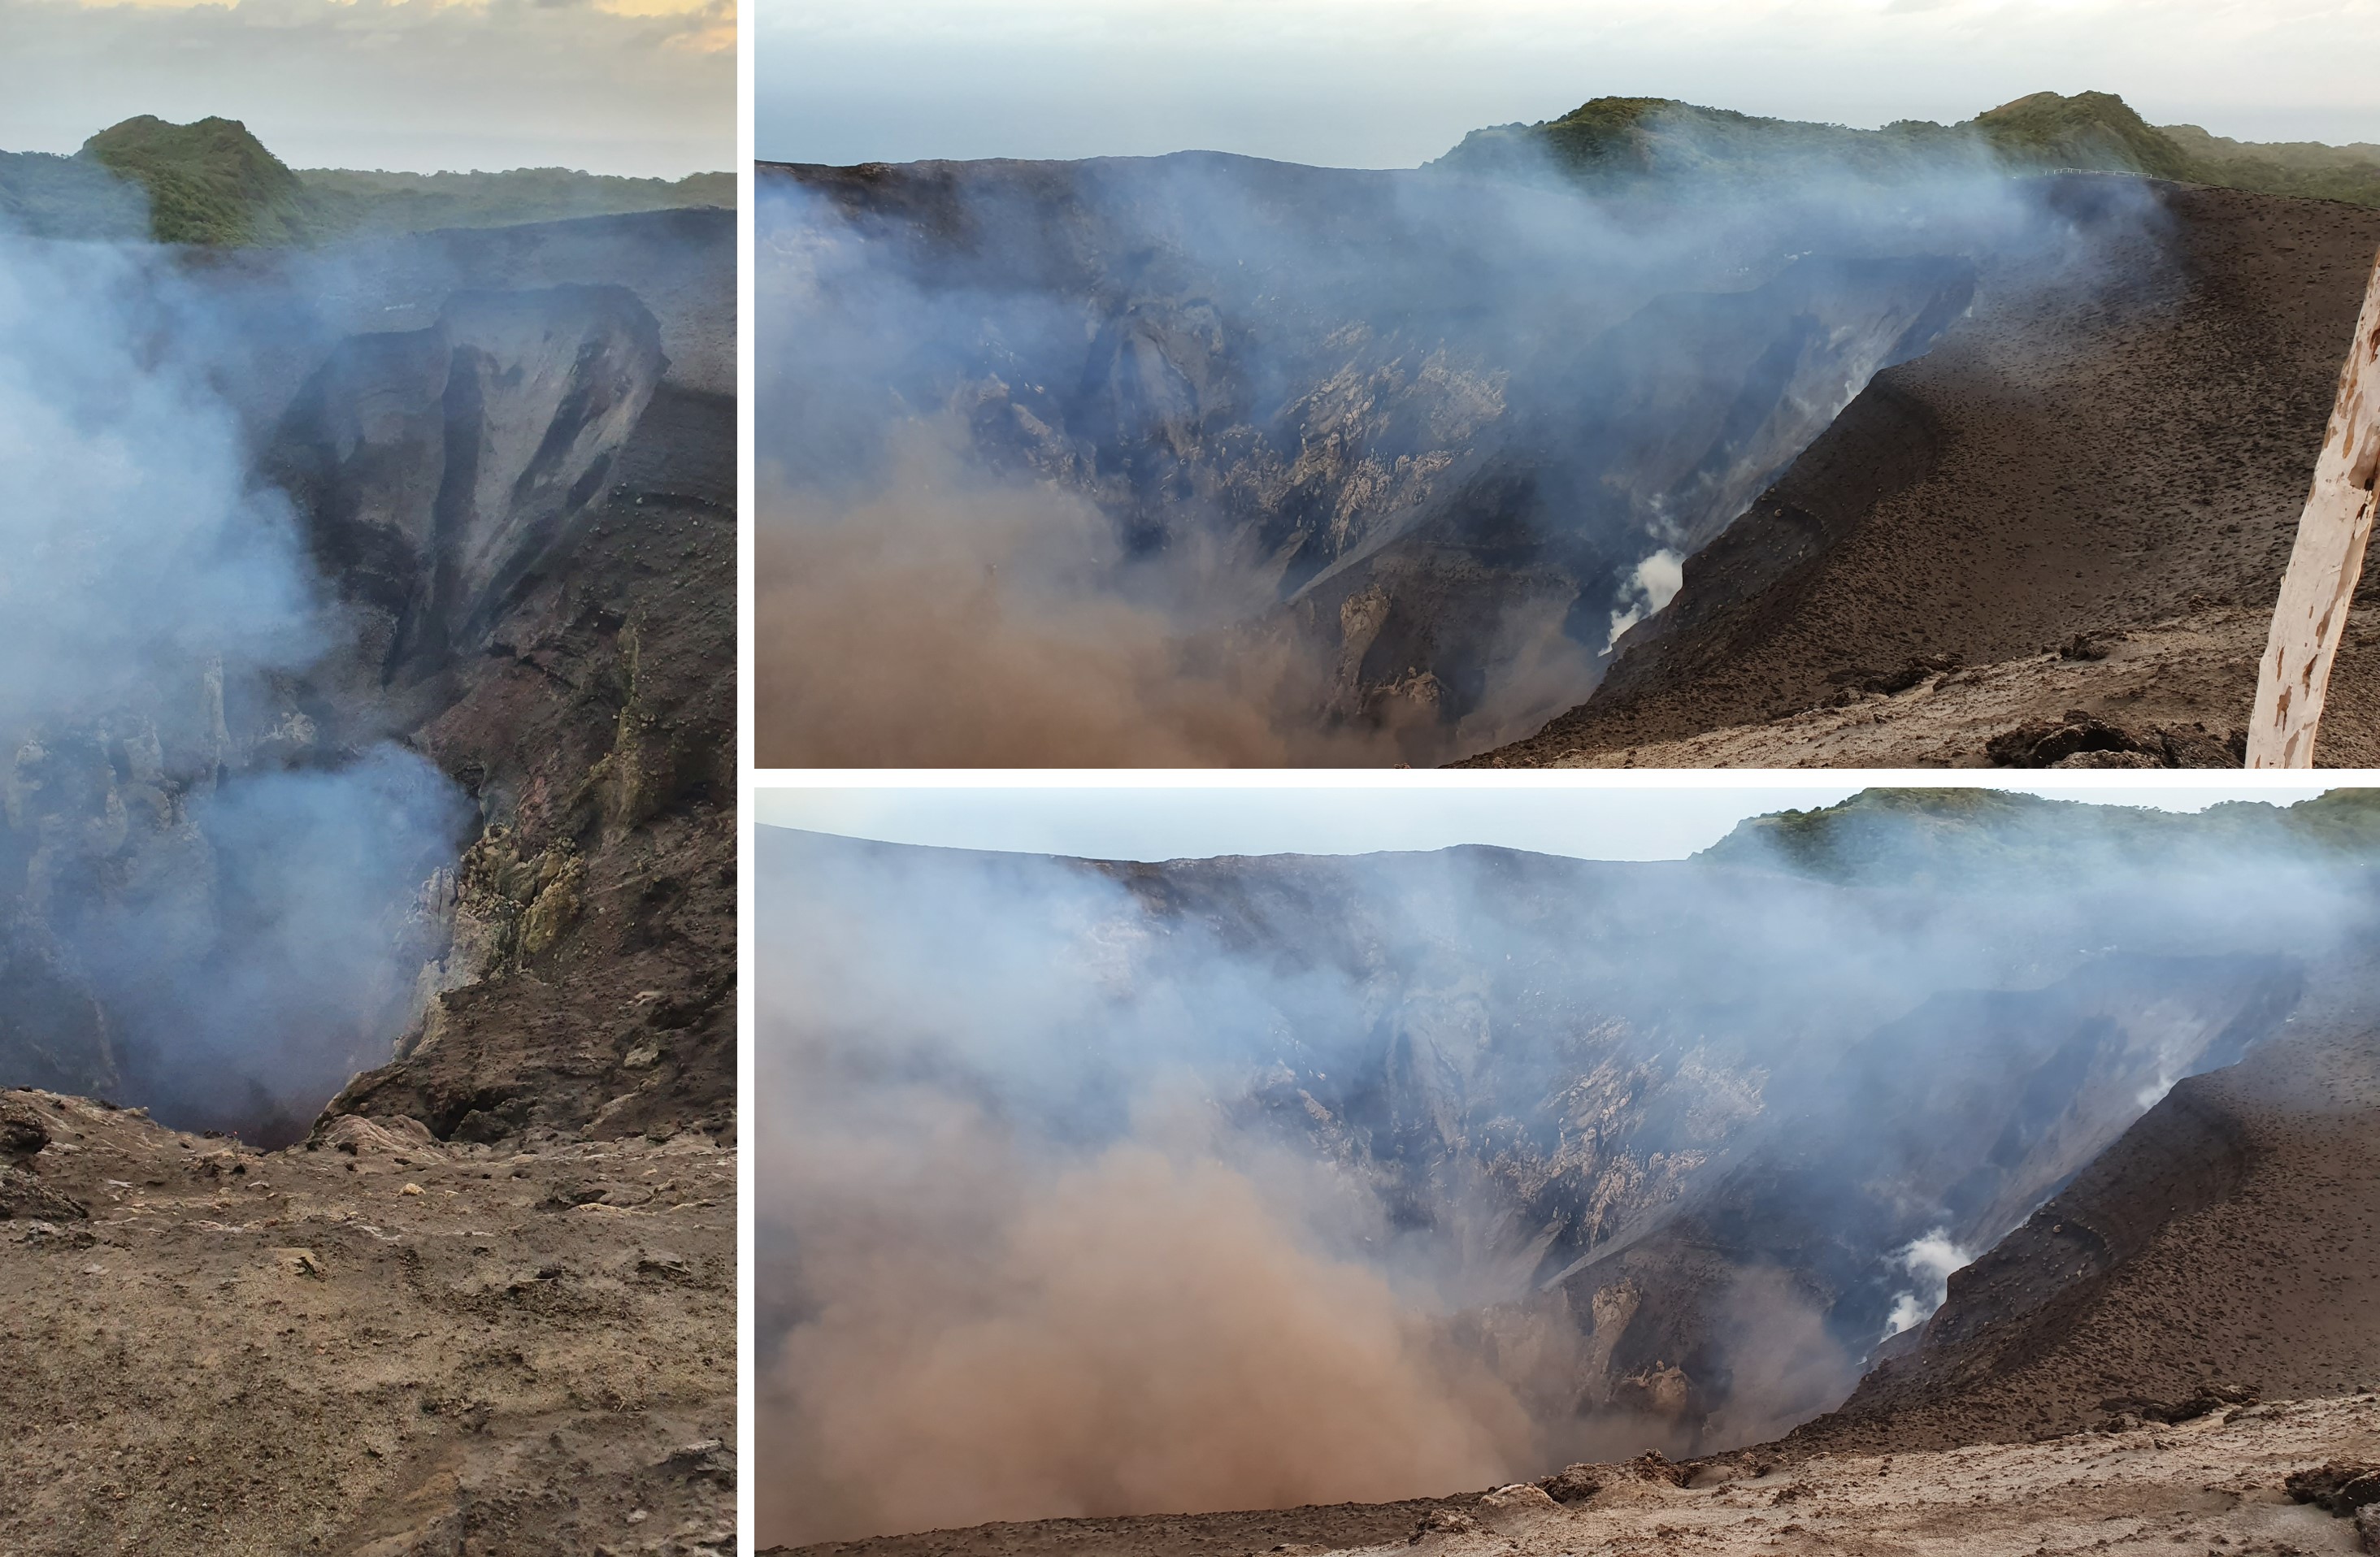 |
Figure 65. Gas and ash emissions rise from the active vents at Yasur between 25-27 October 2019. Photos by Justin Noonan, used with permission. |
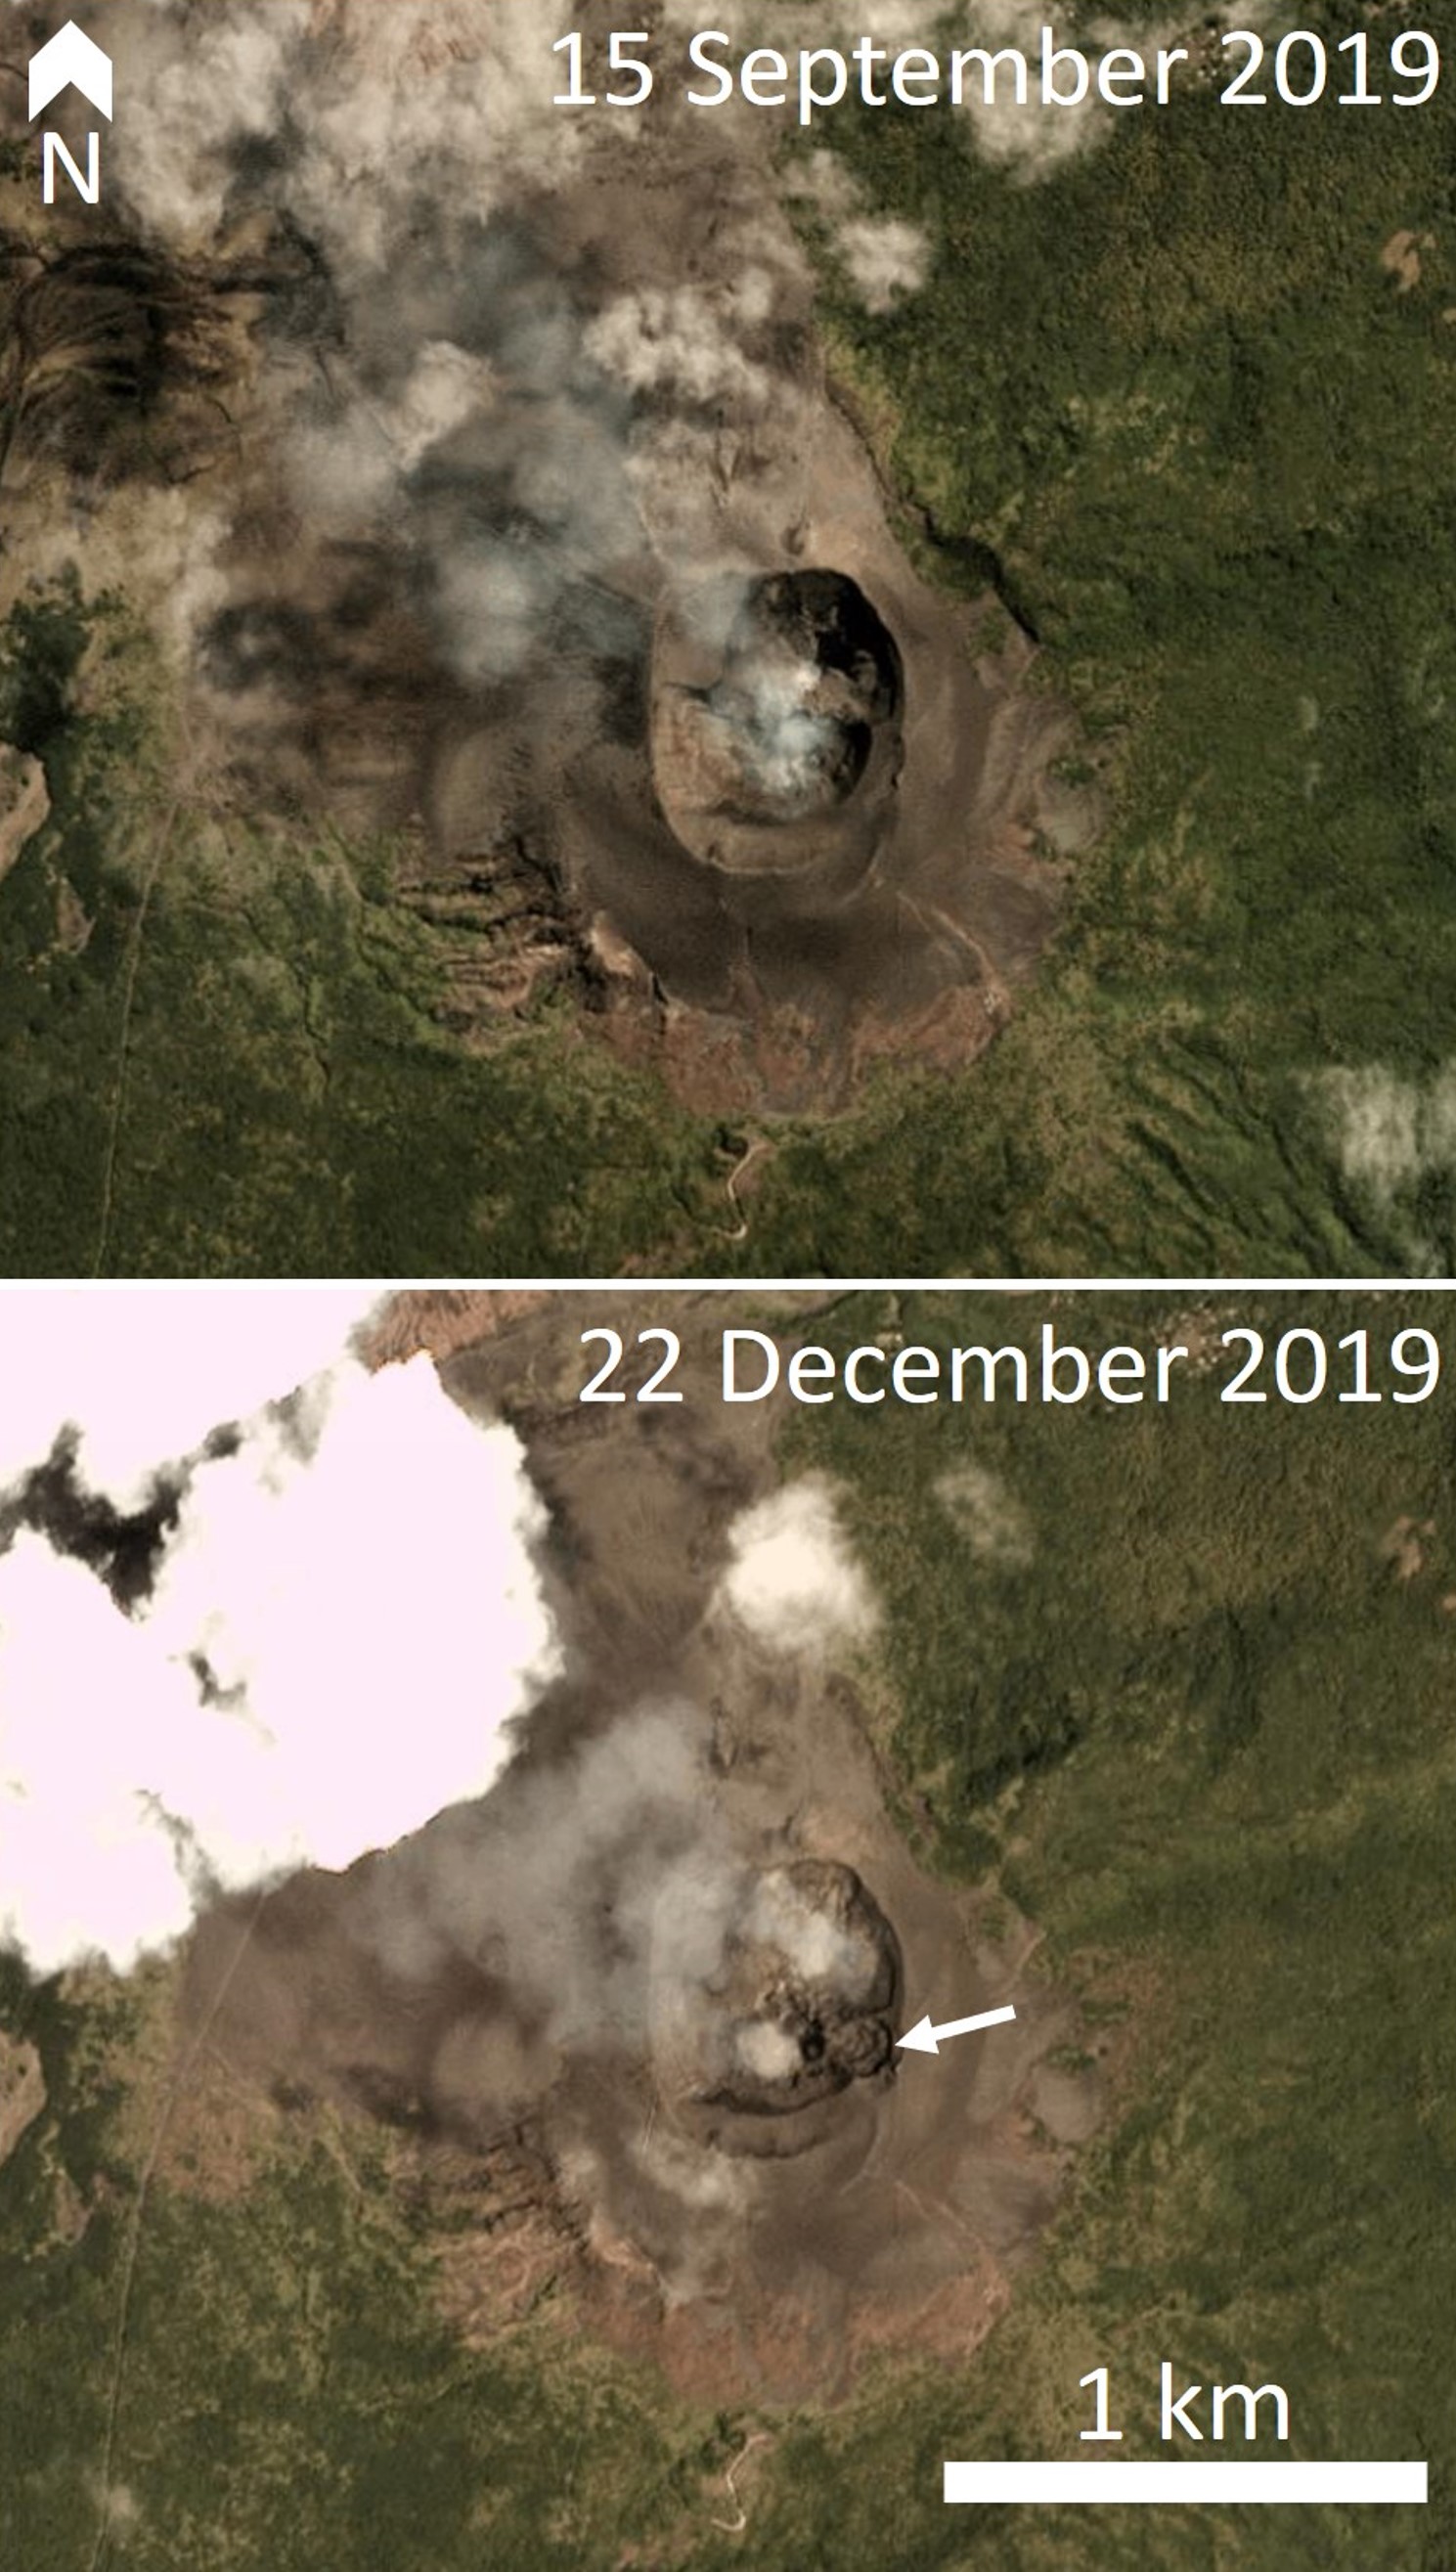 |
Figure 66. Planet Scope satellite images of Yasur show a change in the crater morphology between 20 and 29 October 2019. Copyright of Planet Labs. |
Continuous explosive activity continued in November-February with some stronger explosions recorded along with accompanying gas emissions. Gas plumes of sulfur dioxide were detected by satellite sensors on some days through this period (figure 67) and ash content was present at times (figure 68). Thermal anomalies continued to be detected by satellite sensors with varying intensity, and with a reduction in intensity in February, as seen in Sentinel-2 imagery and the MIROVA system (figures 69 and 70).
 |
Figure 67. SO2 plumes detected at Yasur by Aura/OMI on 21 December 2019 and 31 January 2020, drifting W to NW, and on 14 and 23 February 2020, drifting W and south, and NWW to NW. Courtesy of Global Sulfur Dioxide Monitoring Page, NASA. |
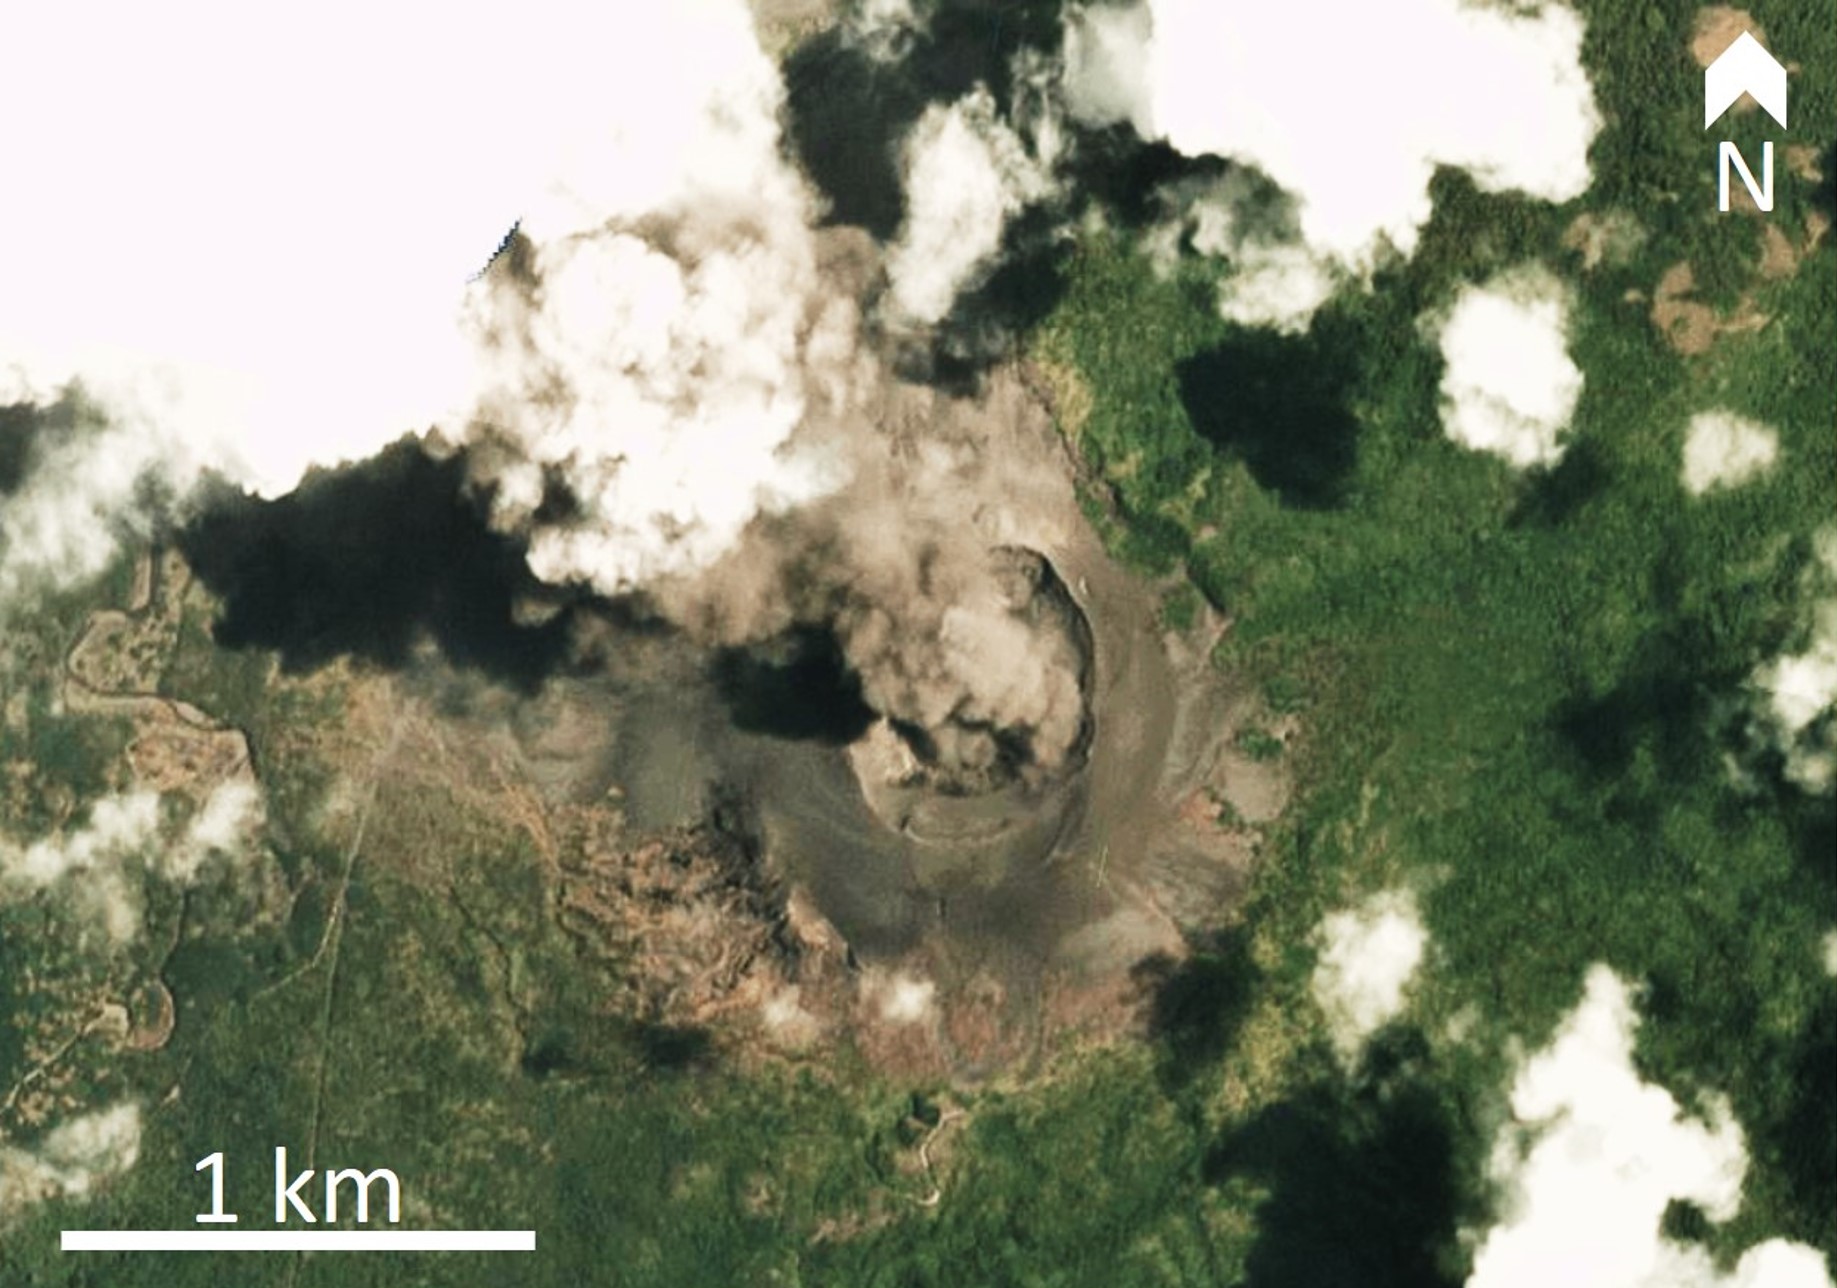 |
Figure 68. An ash plume erupts from Yasur on 20 February 2020 and drifts NW. Courtesy of Planet Labs. |
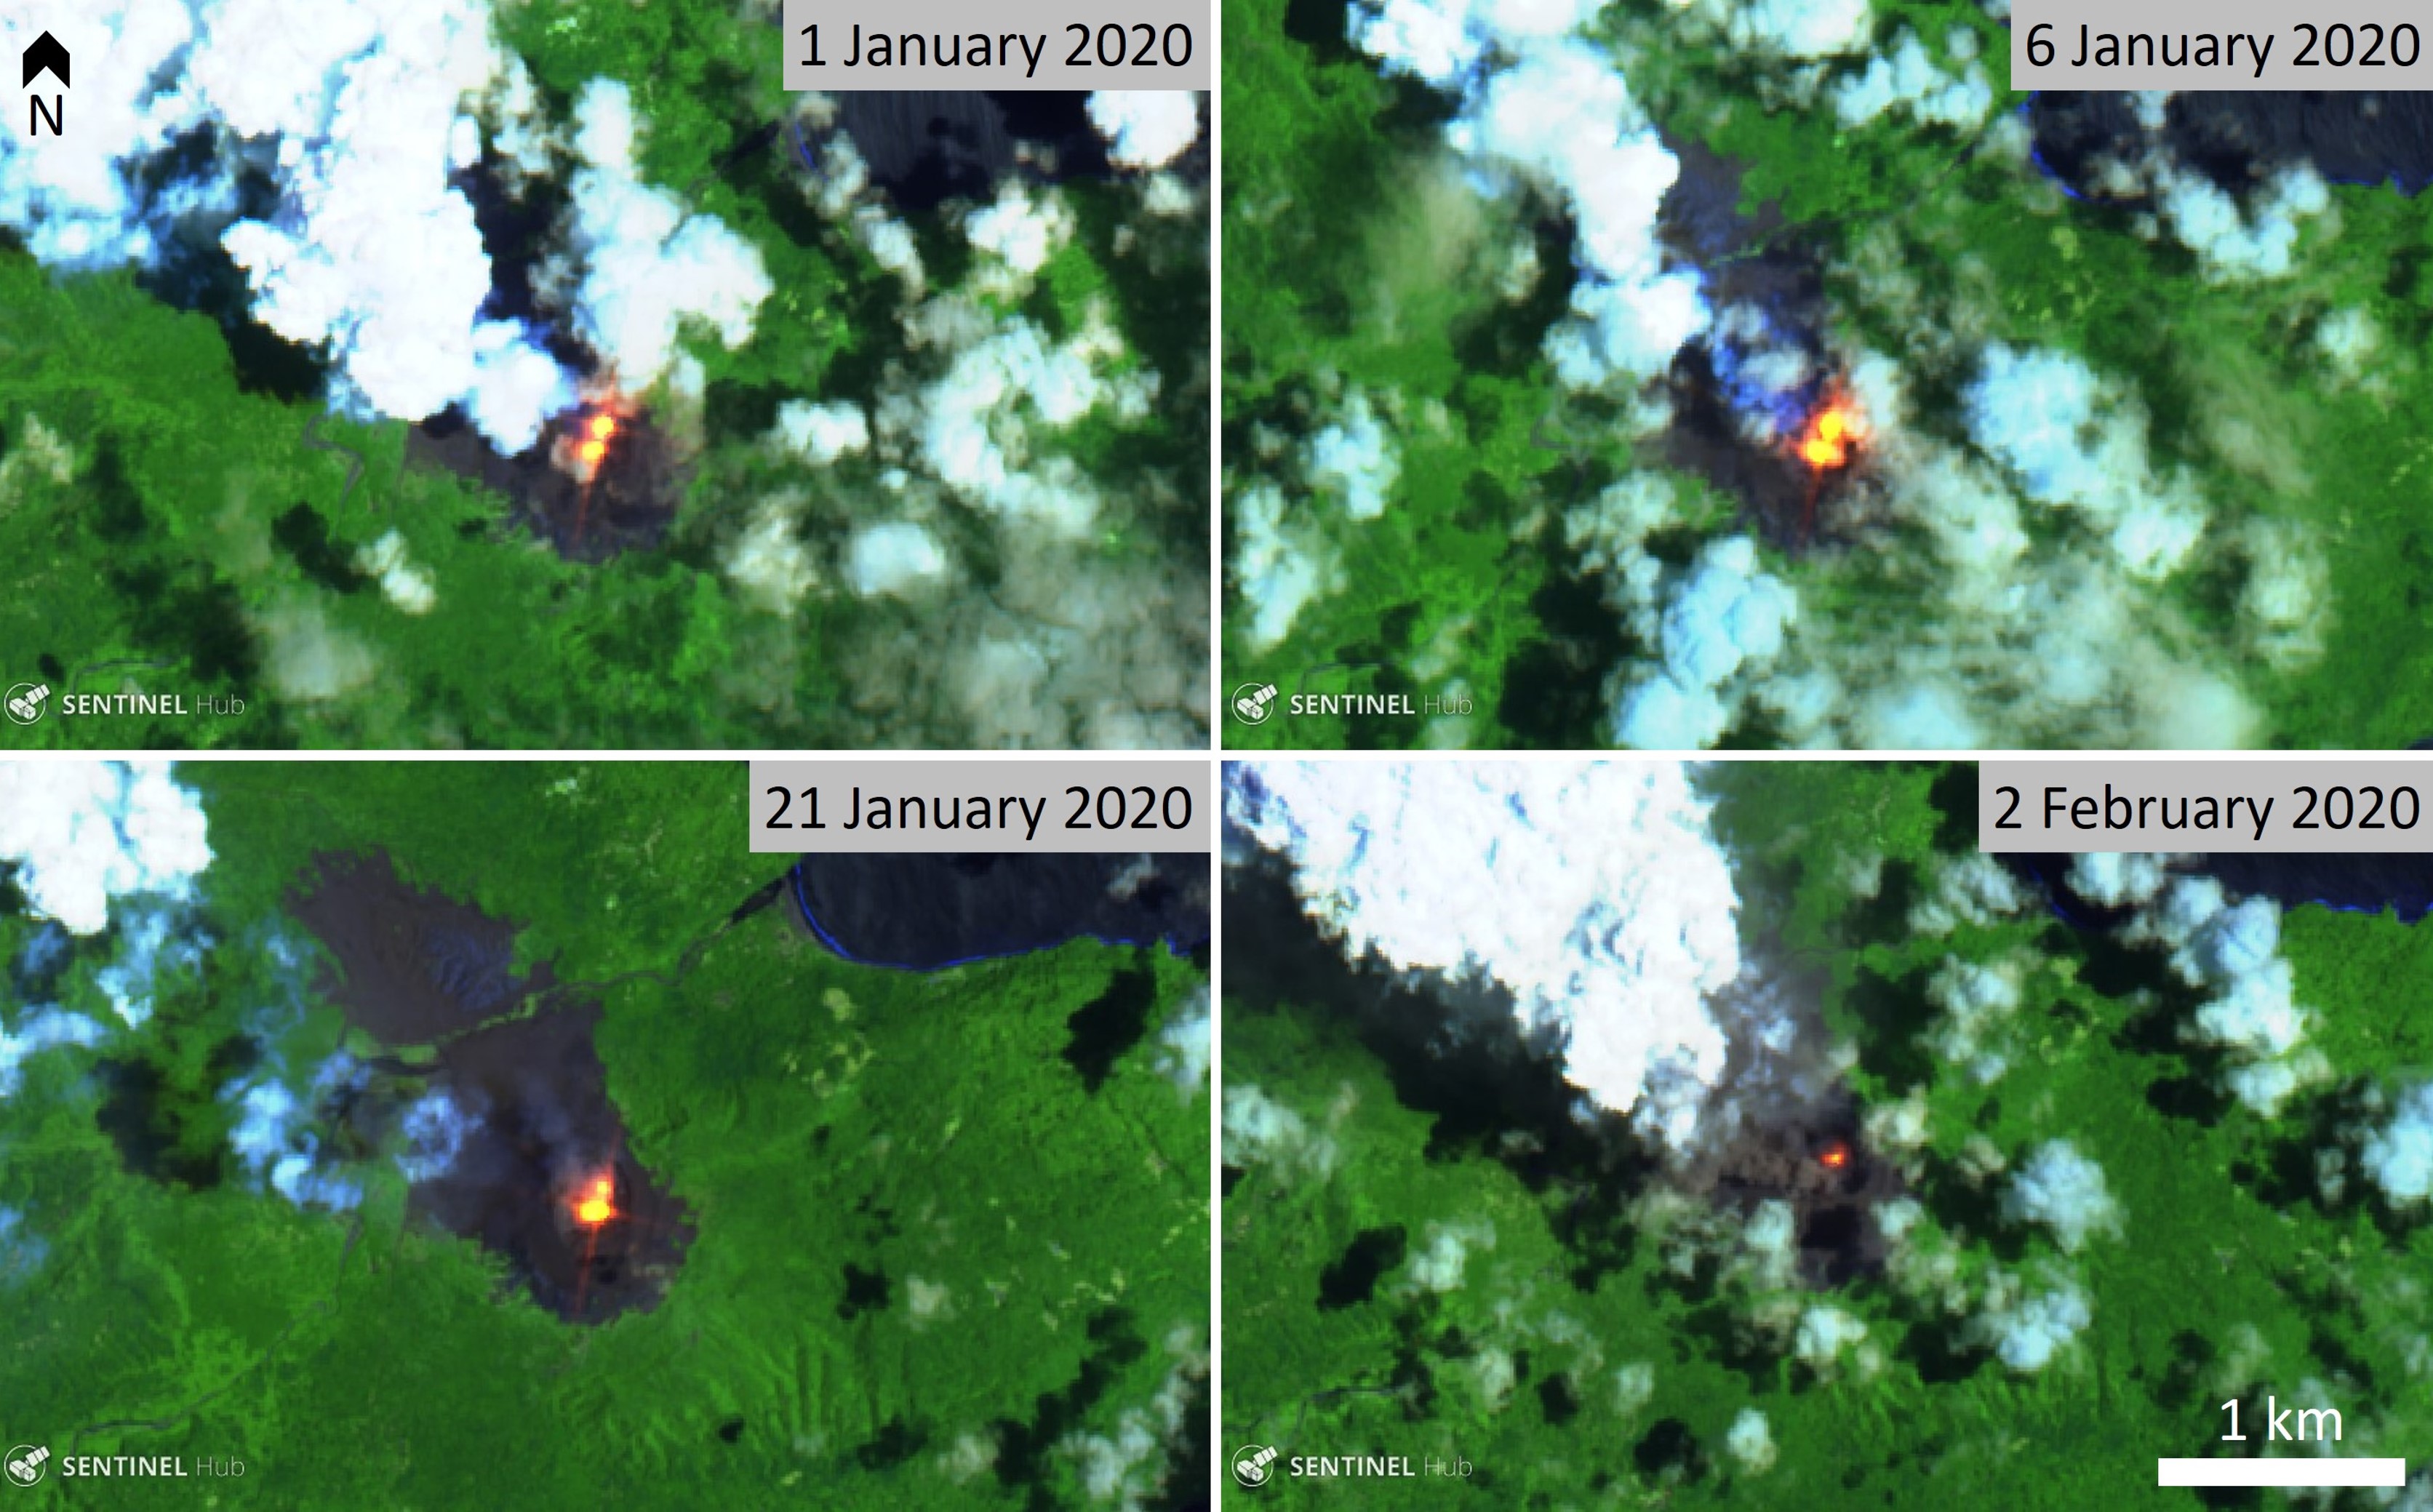 |
Figure 69. Sentinel-2 thermal satellite images show variations in detected thermal energy in the active Yasur vents during January and February 2020. False color (bands 12, 11, 4) satellite images courtesy of Sentinel Hub Playground. |
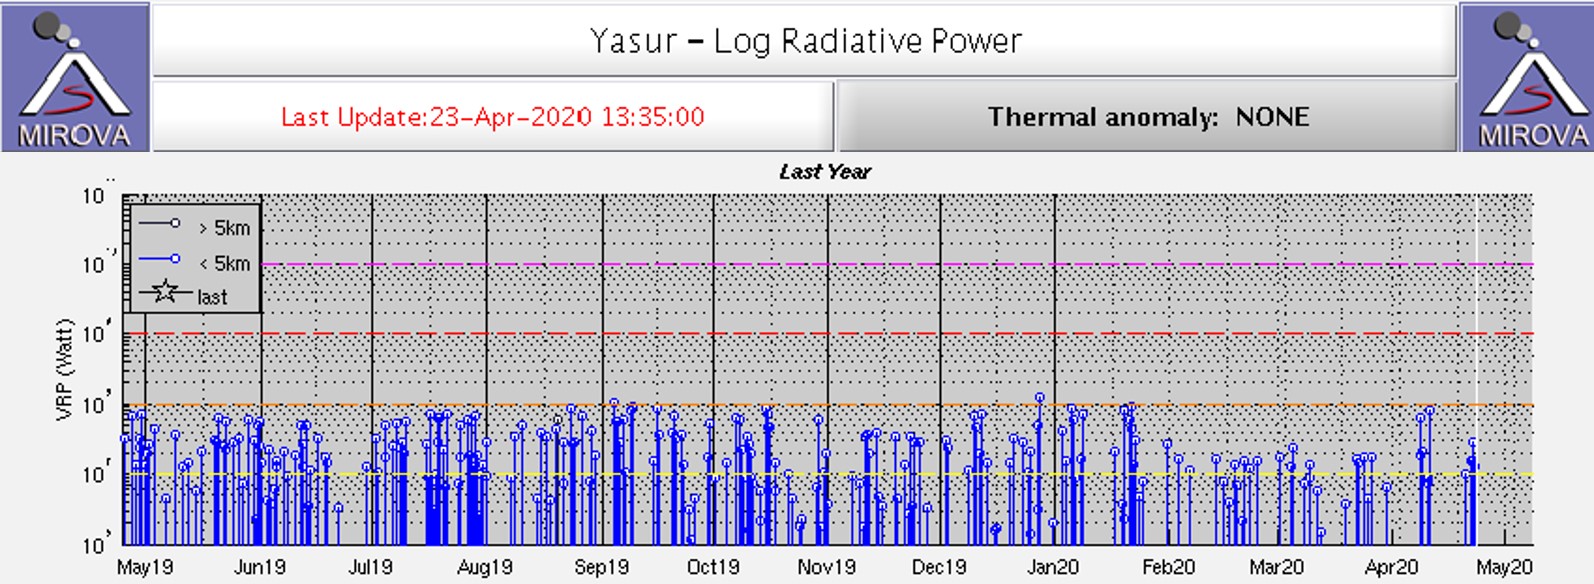 |
Figure 70. The MIROVA thermal detection system recorded persistent thermal energy emitted at Yasur with some variation from mid-May 2019 to May 2020. There was a reduction in detected energy after January. Courtesy of MIROVA. |
Information Contacts: Geo-Hazards Division, Vanuatu Meteorology and Geo-Hazards Department (VMGD), Ministry of Climate Change Adaptation, Meteorology, Geo-Hazards, Energy, Environment and Disaster Management, Private Mail Bag 9054, Lini Highway, Port Vila, Vanuatu (URL: http://www.vmgd.gov.vu/, https://www.facebook.com/VanuatuGeohazardsObservatory/); MIROVA (Middle InfraRed Observation of Volcanic Activity), a collaborative project between the Universities of Turin and Florence (Italy) supported by the Centre for Volcanic Risk of the Italian Civil Protection Department (URL: http://www.mirovaweb.it/); Sentinel Hub Playground (URL: https://www.sentinel-hub.com/explore/sentinel-playground); Planet Labs, Inc. (URL: https://www.planet.com/); Global Sulfur Dioxide Monitoring Page, Atmospheric Chemistry and Dynamics Laboratory, NASA Goddard Space Flight Center (NASA/GSFC), 8800 Greenbelt Road, Goddard, Maryland, USA (URL: https://so2.gsfc.nasa.gov/); Justin Noonan (URL: https://www.justinnoonan.com/, Instagram: https://www.instagram.com/justinnoonan_/); Doro Adventures (Twitter: https://twitter.com/DoroAdventures, URL: http://doroadventures.com/).
Ash and gas explosions continue through August 2020
Recent activity at Yasur, which has been erupting since July 1774, includes frequent Strombolian explosions, along with ash and gas plumes from several vents in the summit crater (BGVN 44:02, 45:03). This report summarizes activity during March through August 2020, using information from monthly bulletins of the Vanuatu Meteorology and Geo-Hazards Department (VMGD) and various satellite data. The volcano has remained on Alert Level 2 (major unrest state, on a scale of 0-5), where it has been since 18 October 2016, according to VMGD.
During the current reporting period, VMGD reported that explosive activity continued at an elevated level, with ongoing ash and gas emissions (figure 71). Some of the more intense explosions ejected bombs outside the summit crater. During 2-3, 13, and 17 March, 2-3 April, and 19 July, the Wellington Volcanic Ash Advisory Center (VAAC) identified low-level ash plumes that reached an altitude of 1.5 km and drifted in multiple directions; the ash plume during 2-3 April resulted in ashfall on the SSW part of the island. On 19 May an ash plume rose to a maximum altitude of 2.1 km and drifted SE.
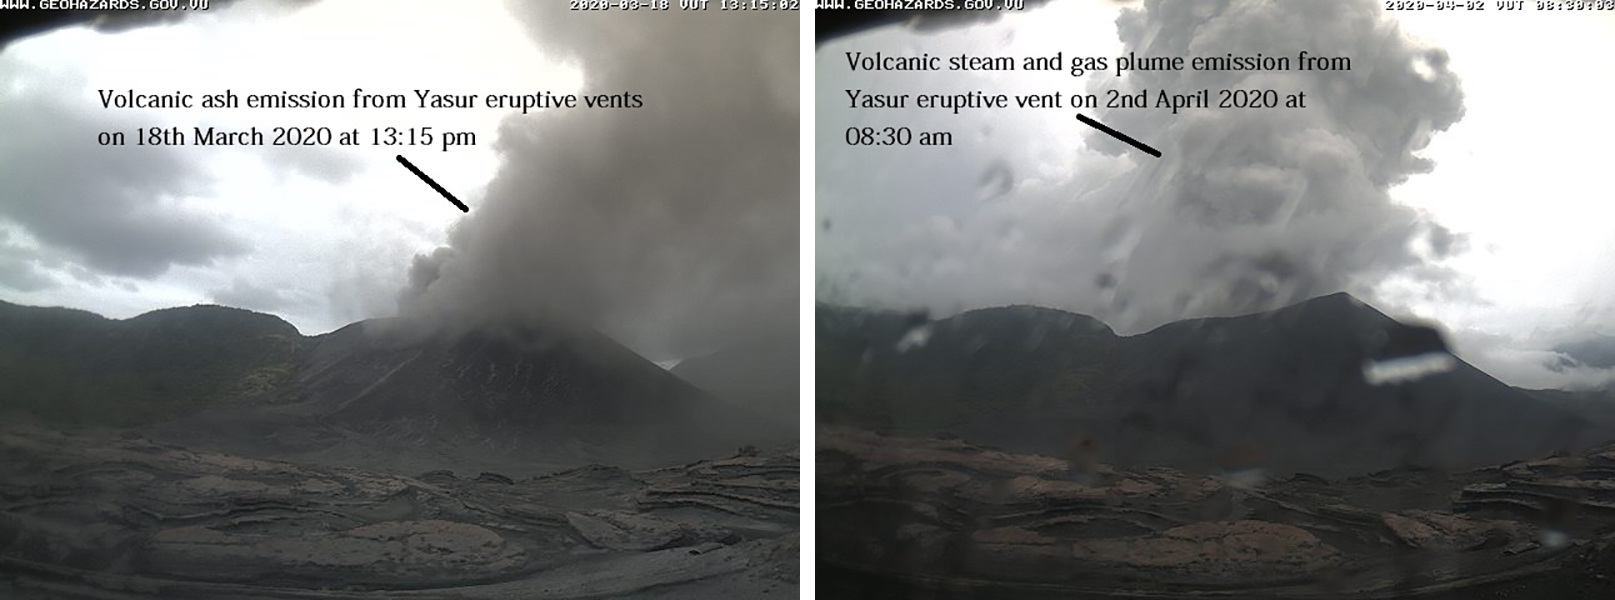 |
Figure 71. Webcam photos of ash emissions from Yasur on 18 March (left)and gas-and-steam emissions on 2 April (right) 2020. Courtesy of VMGD. |
During the reporting period, the MODVOLC thermal algorithm using MODIS satellite data detected a total of 55 thermal hotspots during three days in April, nine days in May, six days in June and August, and four days in July. A maximum of four pixels were recorded on a single day during 26 May, 6 June, and 20 July. The MIROVA (Middle InfraRed Observation of Volcanic Activity) analysis of MODIS satellite data detected numerous hotspots from 16 September 2019 through August 2020, with a slight increase in power and frequency during May (figure 72). Satellite images from Sentinel-2 detected a strong thermal anomaly within the summit crater on 10 May, accompanied by ash and gas emissions (figure 73).
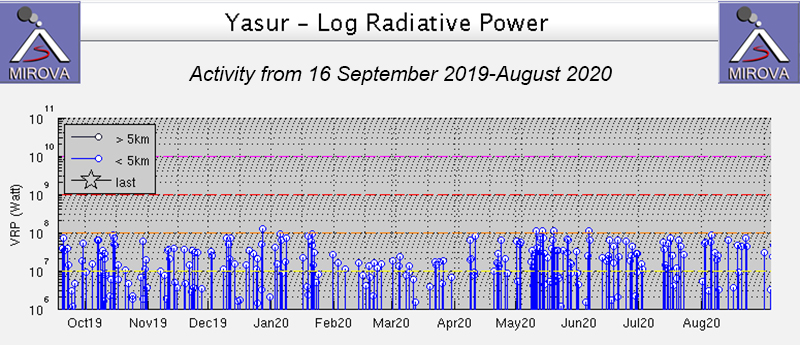 |
Figure 72. Persistent low to moderate thermal activity at Yasur occurred from the summit area from 16 September 2019 through August 2020, as shown in this MIROVA graph (Log Radiative Power). Courtesy of MIROVA. |
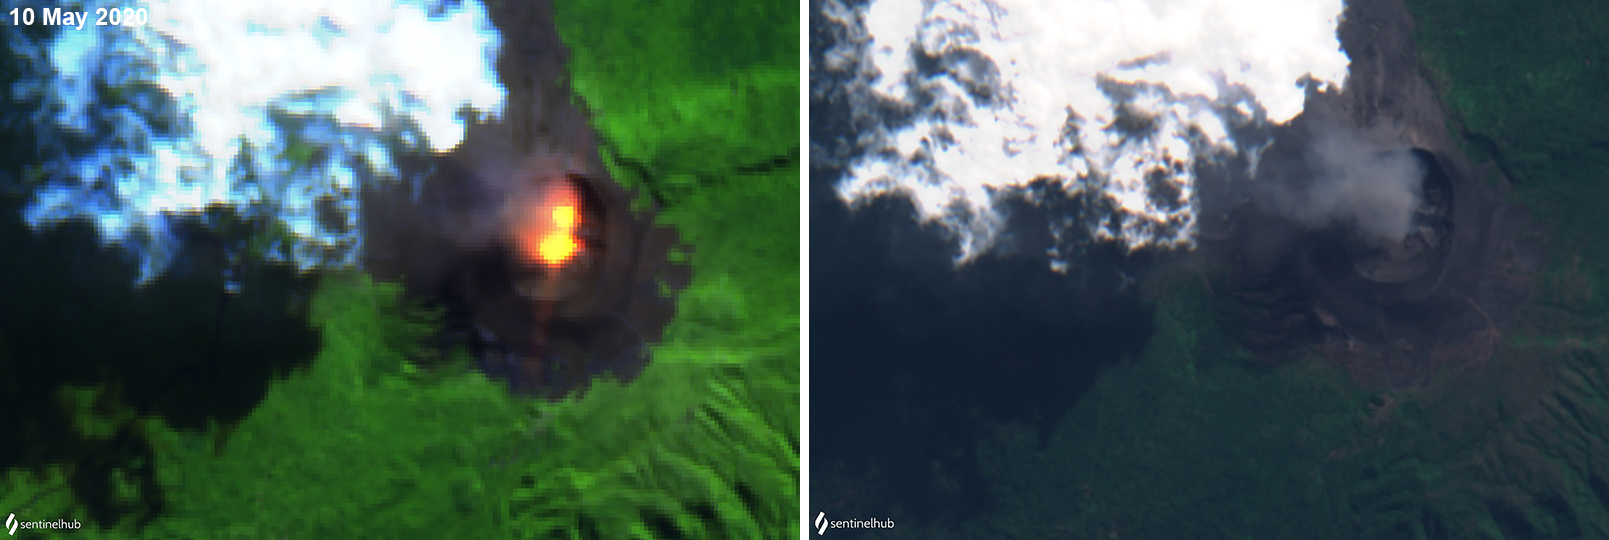 |
Figure 73. Sentinel-2 images of Yasur on 10 May 2020 showing a strong thermal anomaly from the summit crater (left) and a gas emission that appears to contain some ash (right). The thermal anomaly in the S vent area was stronger than in the N vent, an observation also noted in March and April 2019 (BGVN 44:06). The volcano was usually obscured by clouds during March through August. The left image is in false color (bands 12, 11, 4) rendering, the right image is in natural color (bands 4, 3, 2) rendering; courtesy of Sentinel Hub Playground. |
High-resolution satellite sensors commonly recorded moderate sulfur dioxide levels drifting in multiple directions from the volcano. High sulfur dioxide levels were also occasionally observed, especially during March (figure 74).
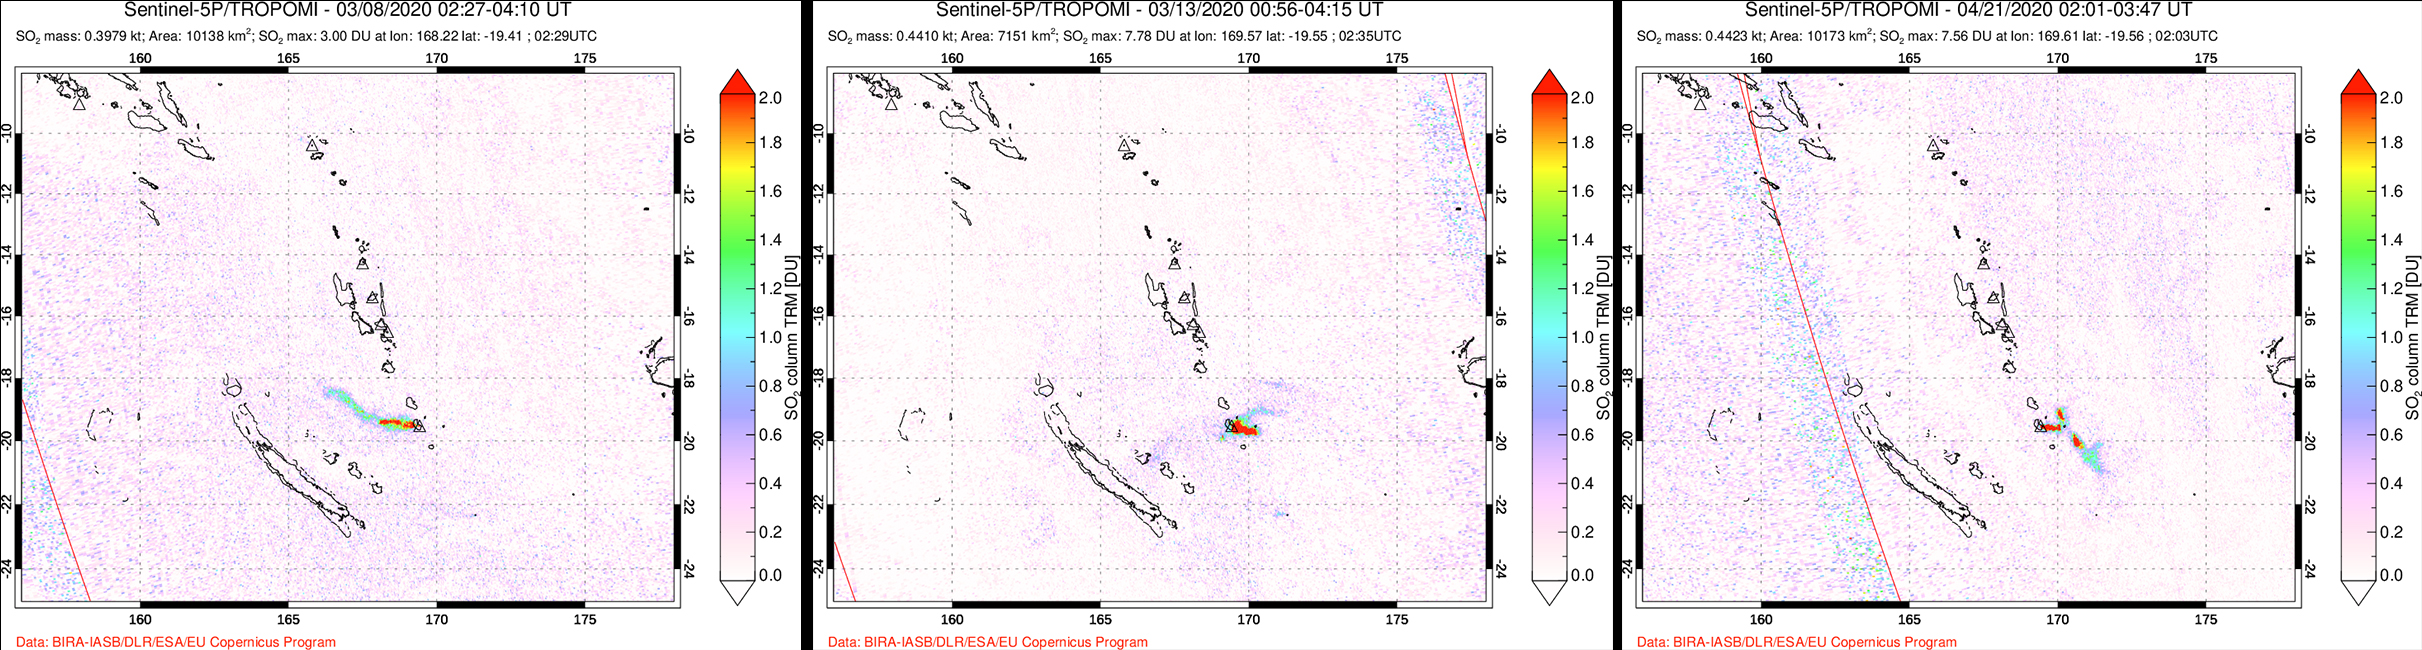 |
Figure 74. High-density SO2 emissions streaming from Yasur during 8 (left) and 13 (middle) March and 21 April (right) 2020, were observed using the TROPOMI imaging spectrometer on the Sentinel-5P satellite. The plume drifted W on 8 March and E on both 13 March and 21 April. Courtesy of NASA Global Sulfur Dioxide Monitoring Page. |
Information Contacts: Geo-Hazards Division, Vanuatu Meteorology and Geo-Hazards Department (VMGD), Ministry of Climate Change Adaptation, Meteorology, Geo-Hazards, Energy, Environment and Disaster Management, Private Mail Bag 9054, Lini Highway, Port Vila, Vanuatu (URL: http://www.vmgd.gov.vu/, https://www.facebook.com/VanuatuGeohazardsObservatory/); Wellington Volcanic Ash Advisory Centre (VAAC), Meteorological Service of New Zealand Ltd (MetService), PO Box 722, Wellington, New Zealand (URL: http://vaac.metservice.com/index.html); Hawai'i Institute of Geophysics and Planetology (HIGP) MODVOLC Thermal Alerts System, School of Ocean and Earth Science and Technology (SOEST), Univ. of Hawai'i, 2525 Correa Road, Honolulu, HI 96822, USA (URL: http://modis.higp.hawaii.edu/); MIROVA (Middle InfraRed Observation of Volcanic Activity), a collaborative project between the Universities of Turin and Florence (Italy) supported by the Centre for Volcanic Risk of the Italian Civil Protection Department (URL: http://www.mirovaweb.it/); Sentinel Hub Playground (URL: https://www.sentinel-hub.com/explore/sentinel-playground); Global Sulfur Dioxide Monitoring Page, Atmospheric Chemistry and Dynamics Laboratory, NASA Goddard Space Flight Center (NASA/GSFC), 8800 Greenbelt Road, Goddard, Maryland, USA (URL: https://so2.gsfc.nasa.gov/).
Gas-and-ash emissions, SO2 plumes, and thermal anomalies during September 2020-February 2021
Yasur, located at the SE tip of Tanna Island, contains a 400-m-wide summit crater within the small Yenkahe caldera. Its current eruption has been ongoing since at least 1774 and has consisted of Strombolian and Vulcanian activity. More recently, Strombolian activity and gas-and-ash explosions have been reported (BGVN 45:03 and 45:09). This report covers activity from September 2020 through February 2021 that is characterized by ongoing explosions, gas-and-ash emissions, SO2 plumes, and thermal anomalies. Information primarily comes from monthly bulletins of the Vanuatu Meteorology and Geo-Hazards Department (VMGD) and various satellite data.
VMGD reported that ongoing explosions and gas-and-ash emissions continued at an elevated level throughout this reporting period, based on ground observations and seismic data. On clear weather days these emissions were captured by Sentinel-2 satellite imagery (figure 75). Some of the more intense explosions may result in larger ejecta falling in or around the summit crater. On 18 January 2021 a webcam image captured a gas-and-ash emission rising above the crater rim at 1500 (figure 76).
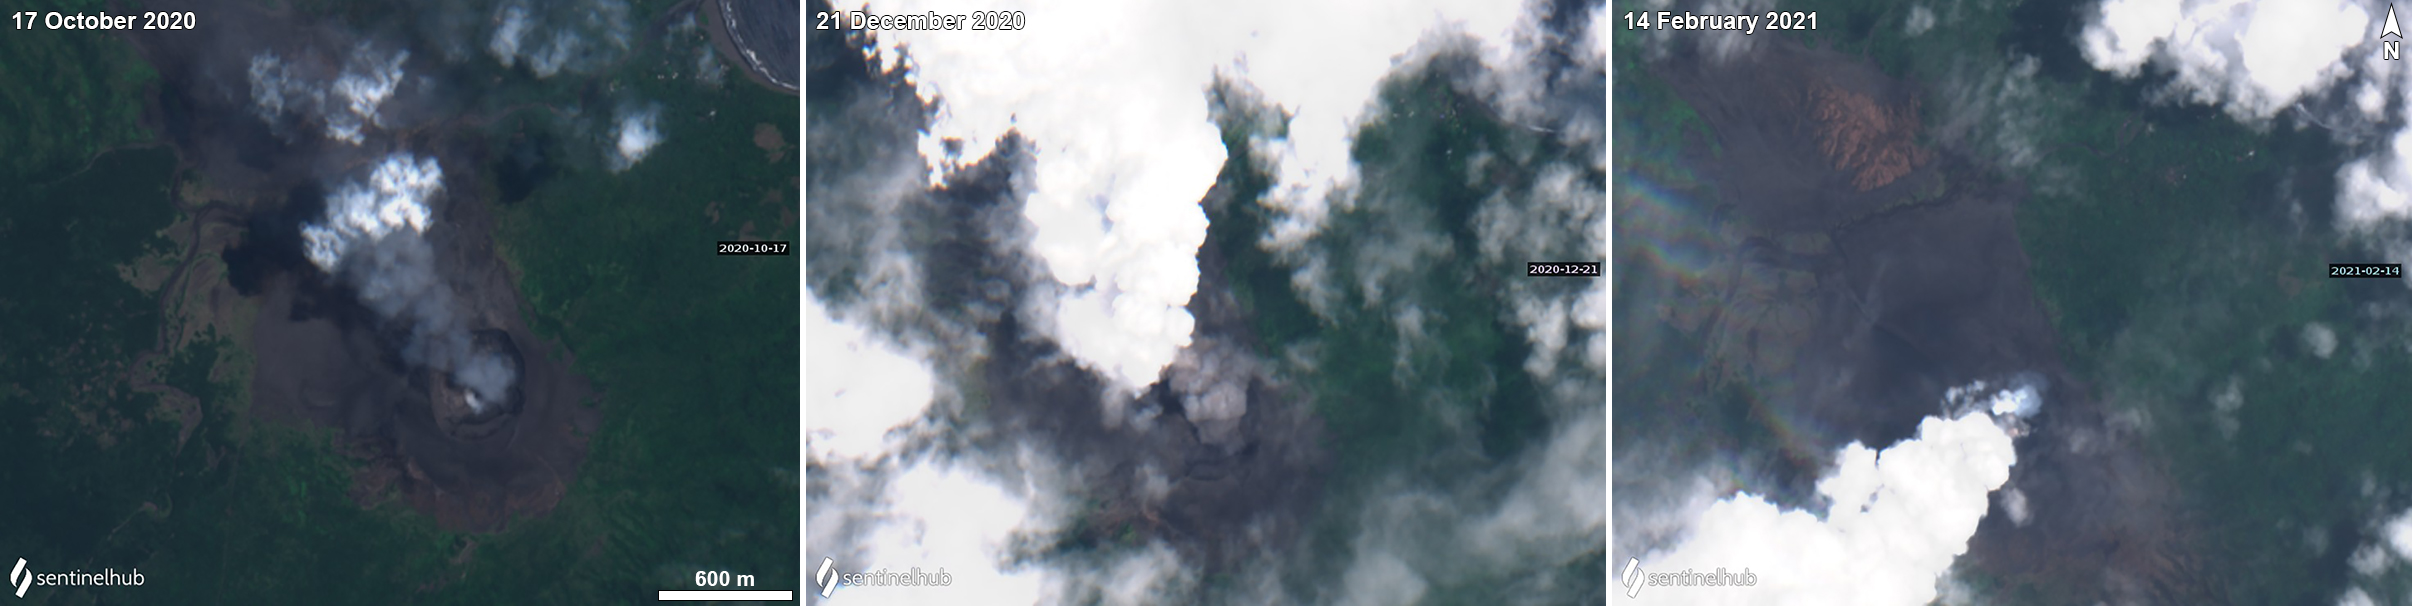 |
Figure 75. Sentinel-2 satellite images showing gas-and-ash emissions rising from the summit crater of Yasur on clear weather days. Ash is visible during 17 October (left) and 21 December 2020 (middle), while white gas-and-steam emissions are observed on 14 February 2021 (right). Sentinel-2 satellite images with “Natural Color” (bands 4, 3, 2) rendering. Courtesy of Sentinel Hub Playground. |
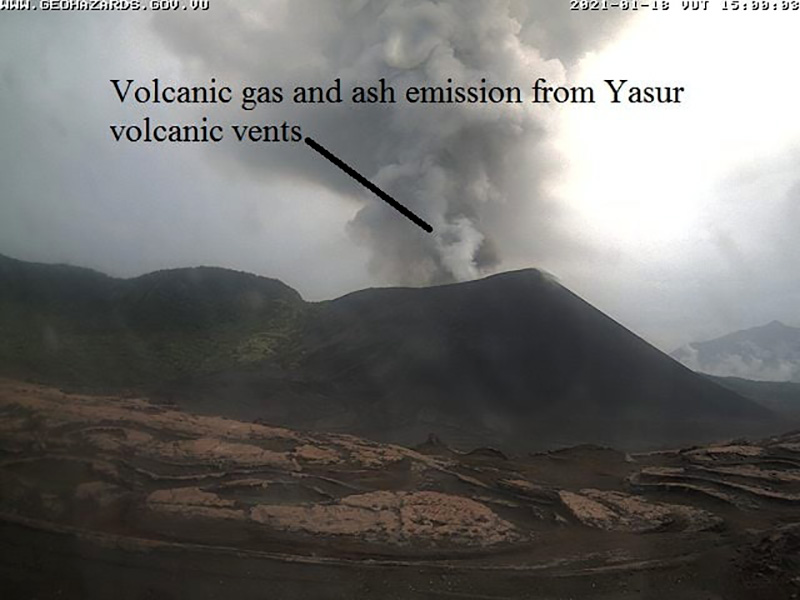 |
Figure 76. Webcam photo of a gas-and-ash emission rising from Yasur on 18 January 2021 taken at 1500. Courtesy of VMGD. |
Sulfur dioxide emissions were measured using the Sentinel-5P/TROPOMI satellite instrument for multiple days each month from September through February 2021 (figure 77). The density and drift direction of these SO2 plumes varied. During 17-19 January relatively dense SO2 plumes were detected consecutively, and drifted SE (figure 78).
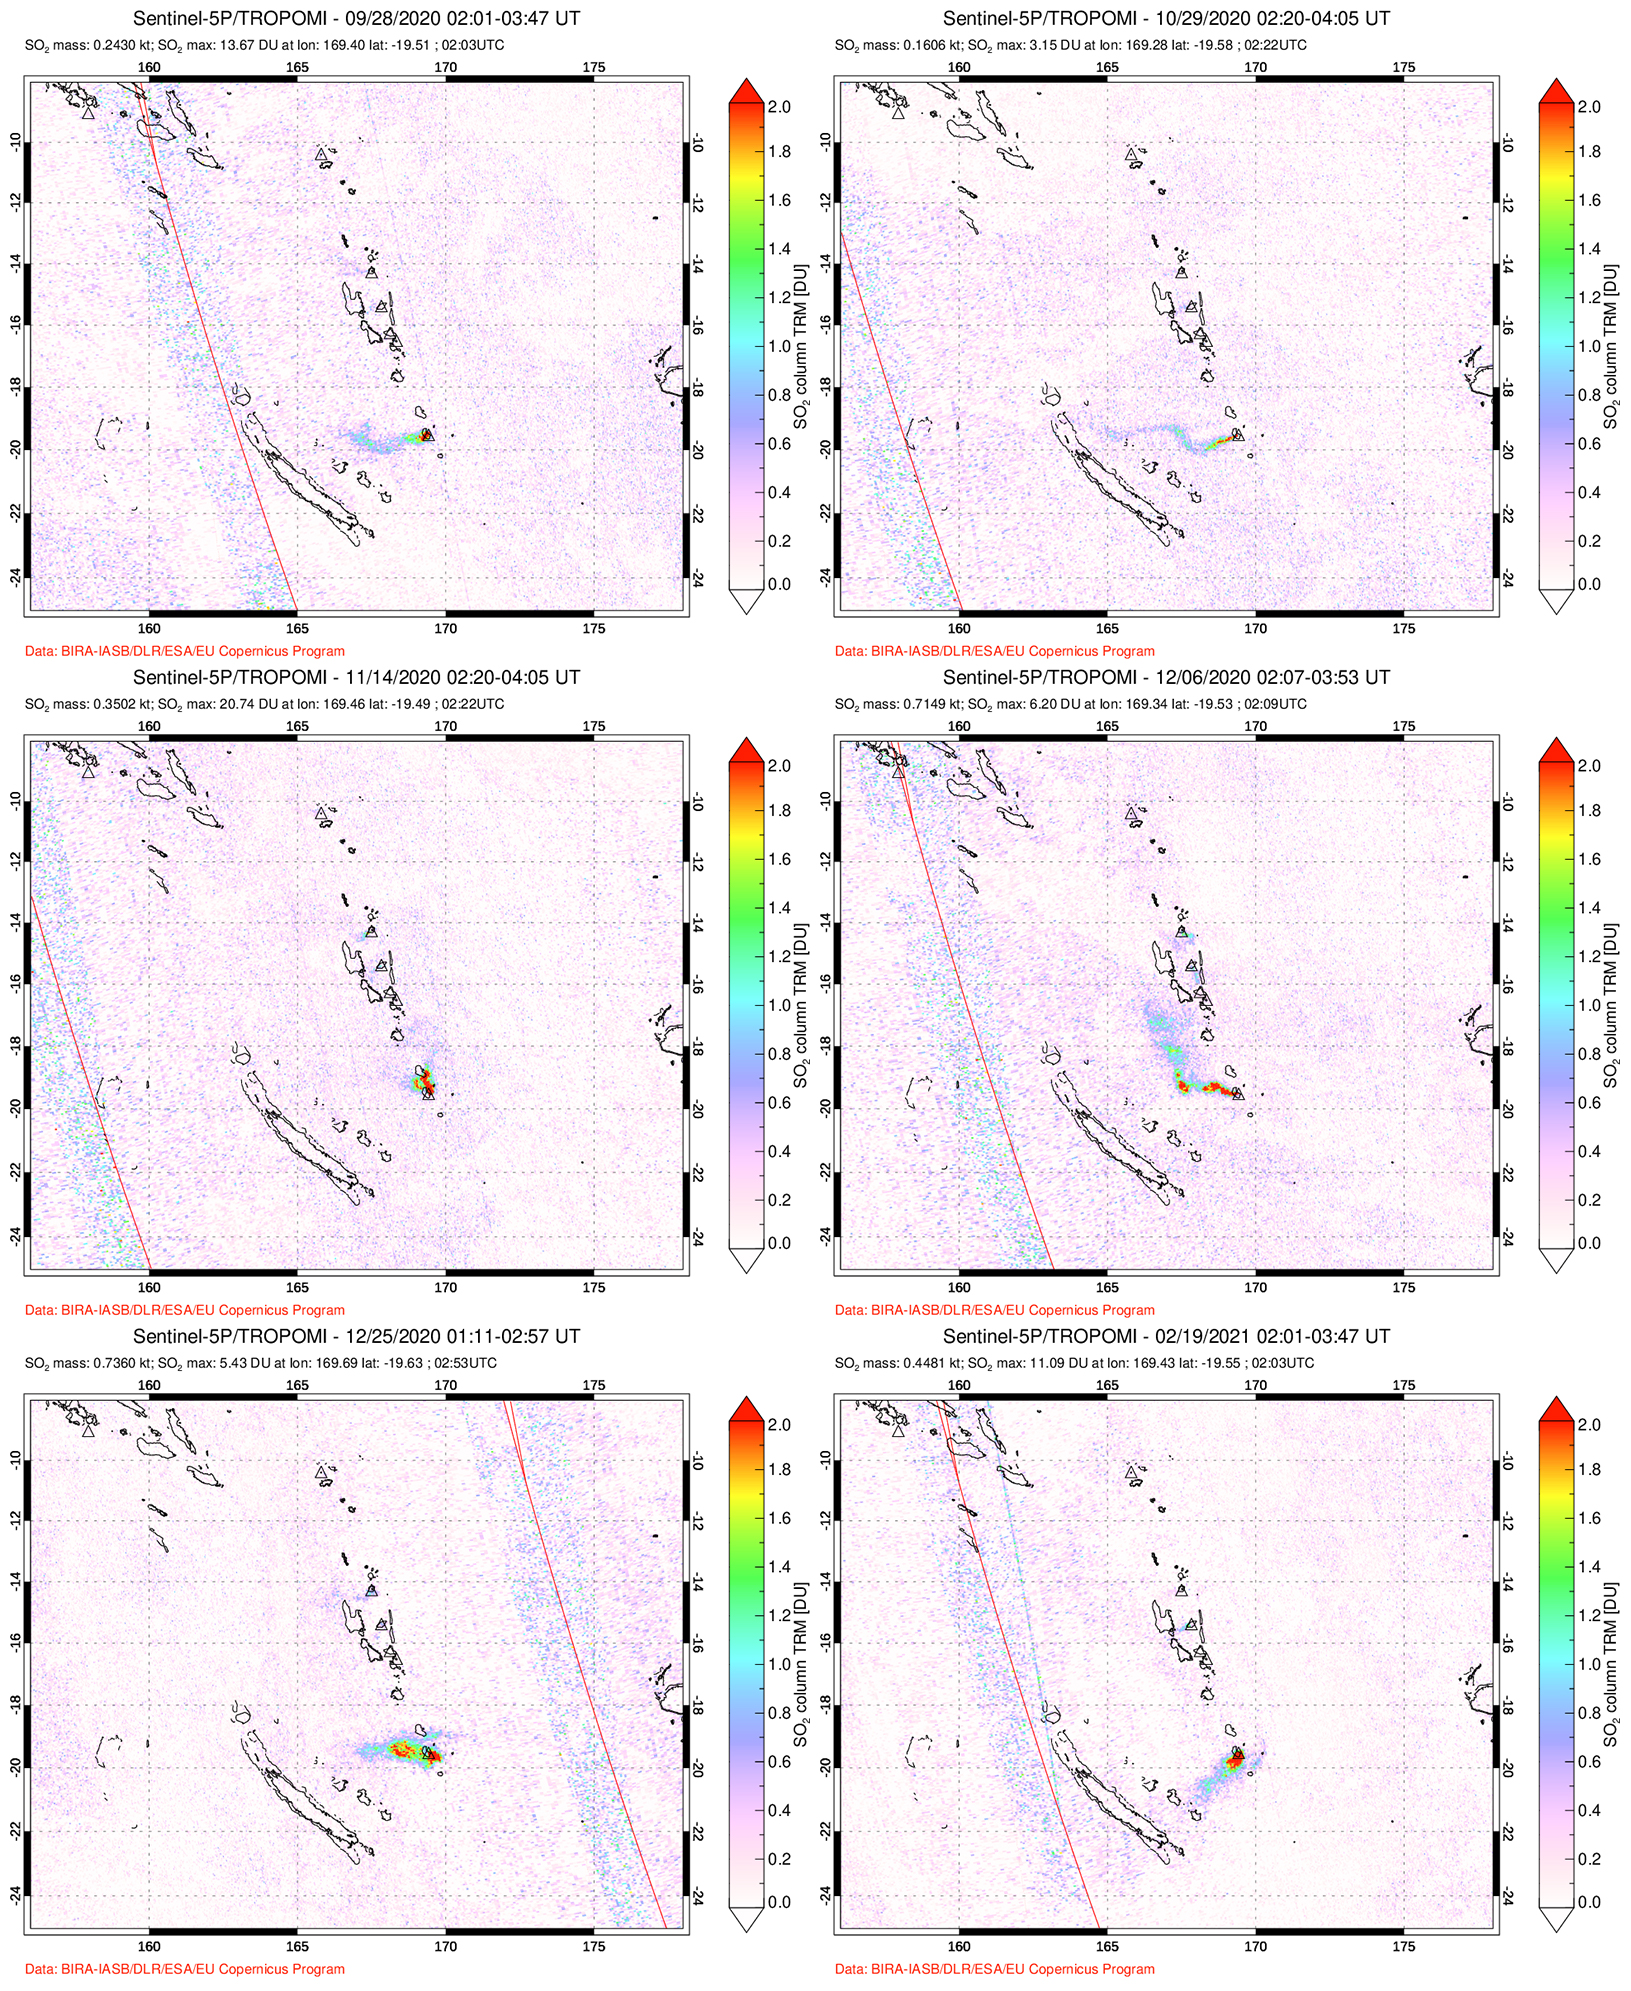 |
Figure 77. Occasional SO2 plumes of varying densities were observed from Yasur during each month of September 2020 through February 2021. Plumes drifted generally W on 28 September (top left), 29 October (top right), 6 December (middle right), 25 December 2020 (bottom left), slightly N on 14 November (middle left), and SW on 19 February 2021 (bottom right). Courtesy of NASA Global Sulfur Dioxide Monitoring Page. |
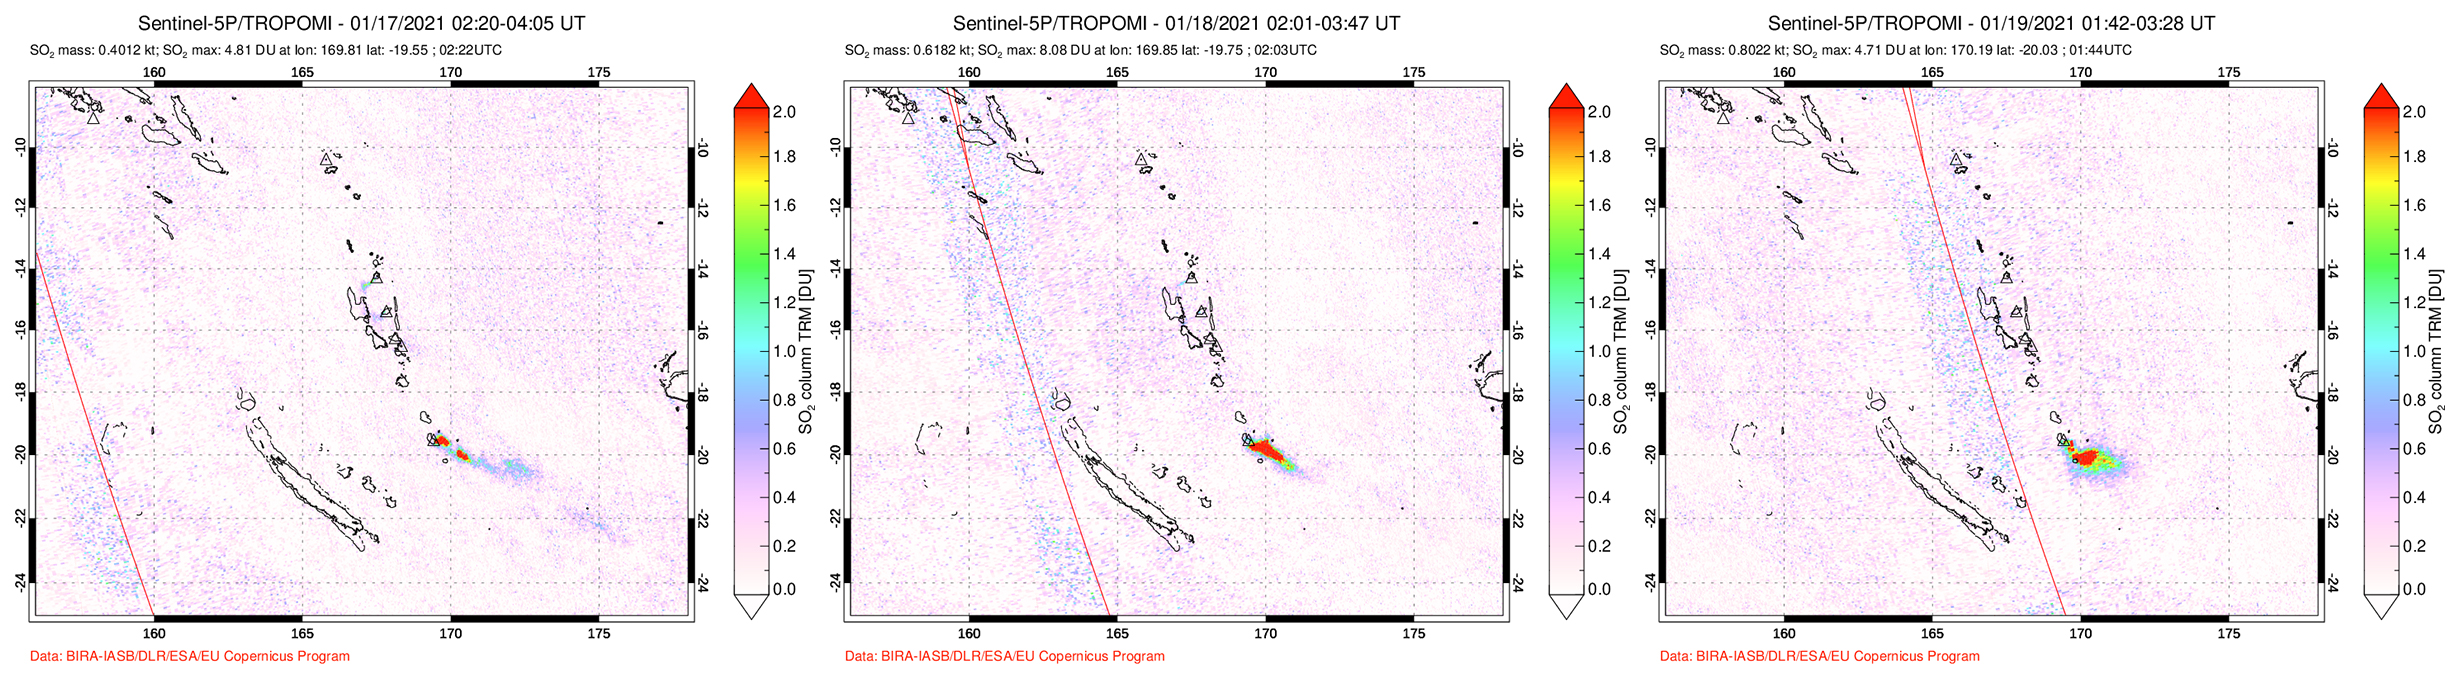 |
Figure 78. Relatively high-density SO2 plumes from Yasur during 17 (left), 18 (middle), and 19 (right) January 2021 were observed consecutively using the TROPOMI imaging spectrometer on the Sentinel-5P satellite. The plumes drifted SE on each of the days. Courtesy of NASA Global Sulfur Dioxide Monitoring Page. |
Intermittent thermal anomalies recorded by the MIROVA (Middle InfraRed Observation of Volcanic Activity) system during September 2020 through February 2021 were low to moderate in power (figure 79). Brief noticeable break in activity occurred during early December 2020 and for much of January 2021. The MODVOLC thermal alert data recorded 41 thermal signatures primarily within the summit crater over a total of 25 different days during September 2020-February 2021. Some of these thermal anomalies were also captured in Sentinel-2 thermal satellite imagery; thermal anomalies were visible in the N and S vents in the summit crater (figure 80).
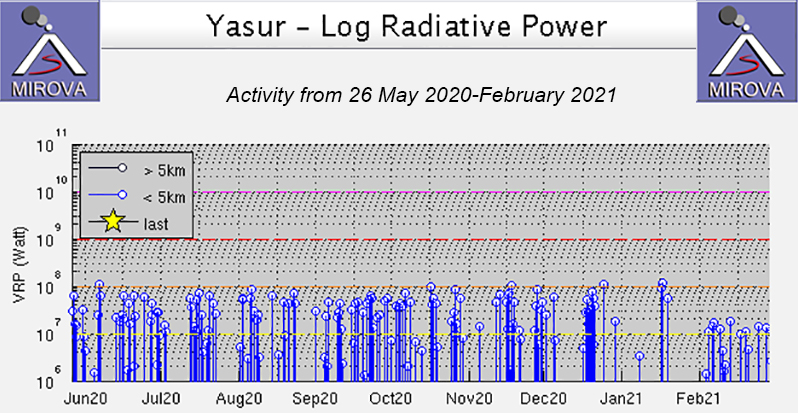 |
Figure 79. MIROVA (Log Radiative Power) thermal data for Yasur from 26 May 2020 through February 2021 showed persistent low to moderate thermal activity. A brief but noticeable break in activity occurred during early December, early January, and late January. Courtesy of MIROVA. |
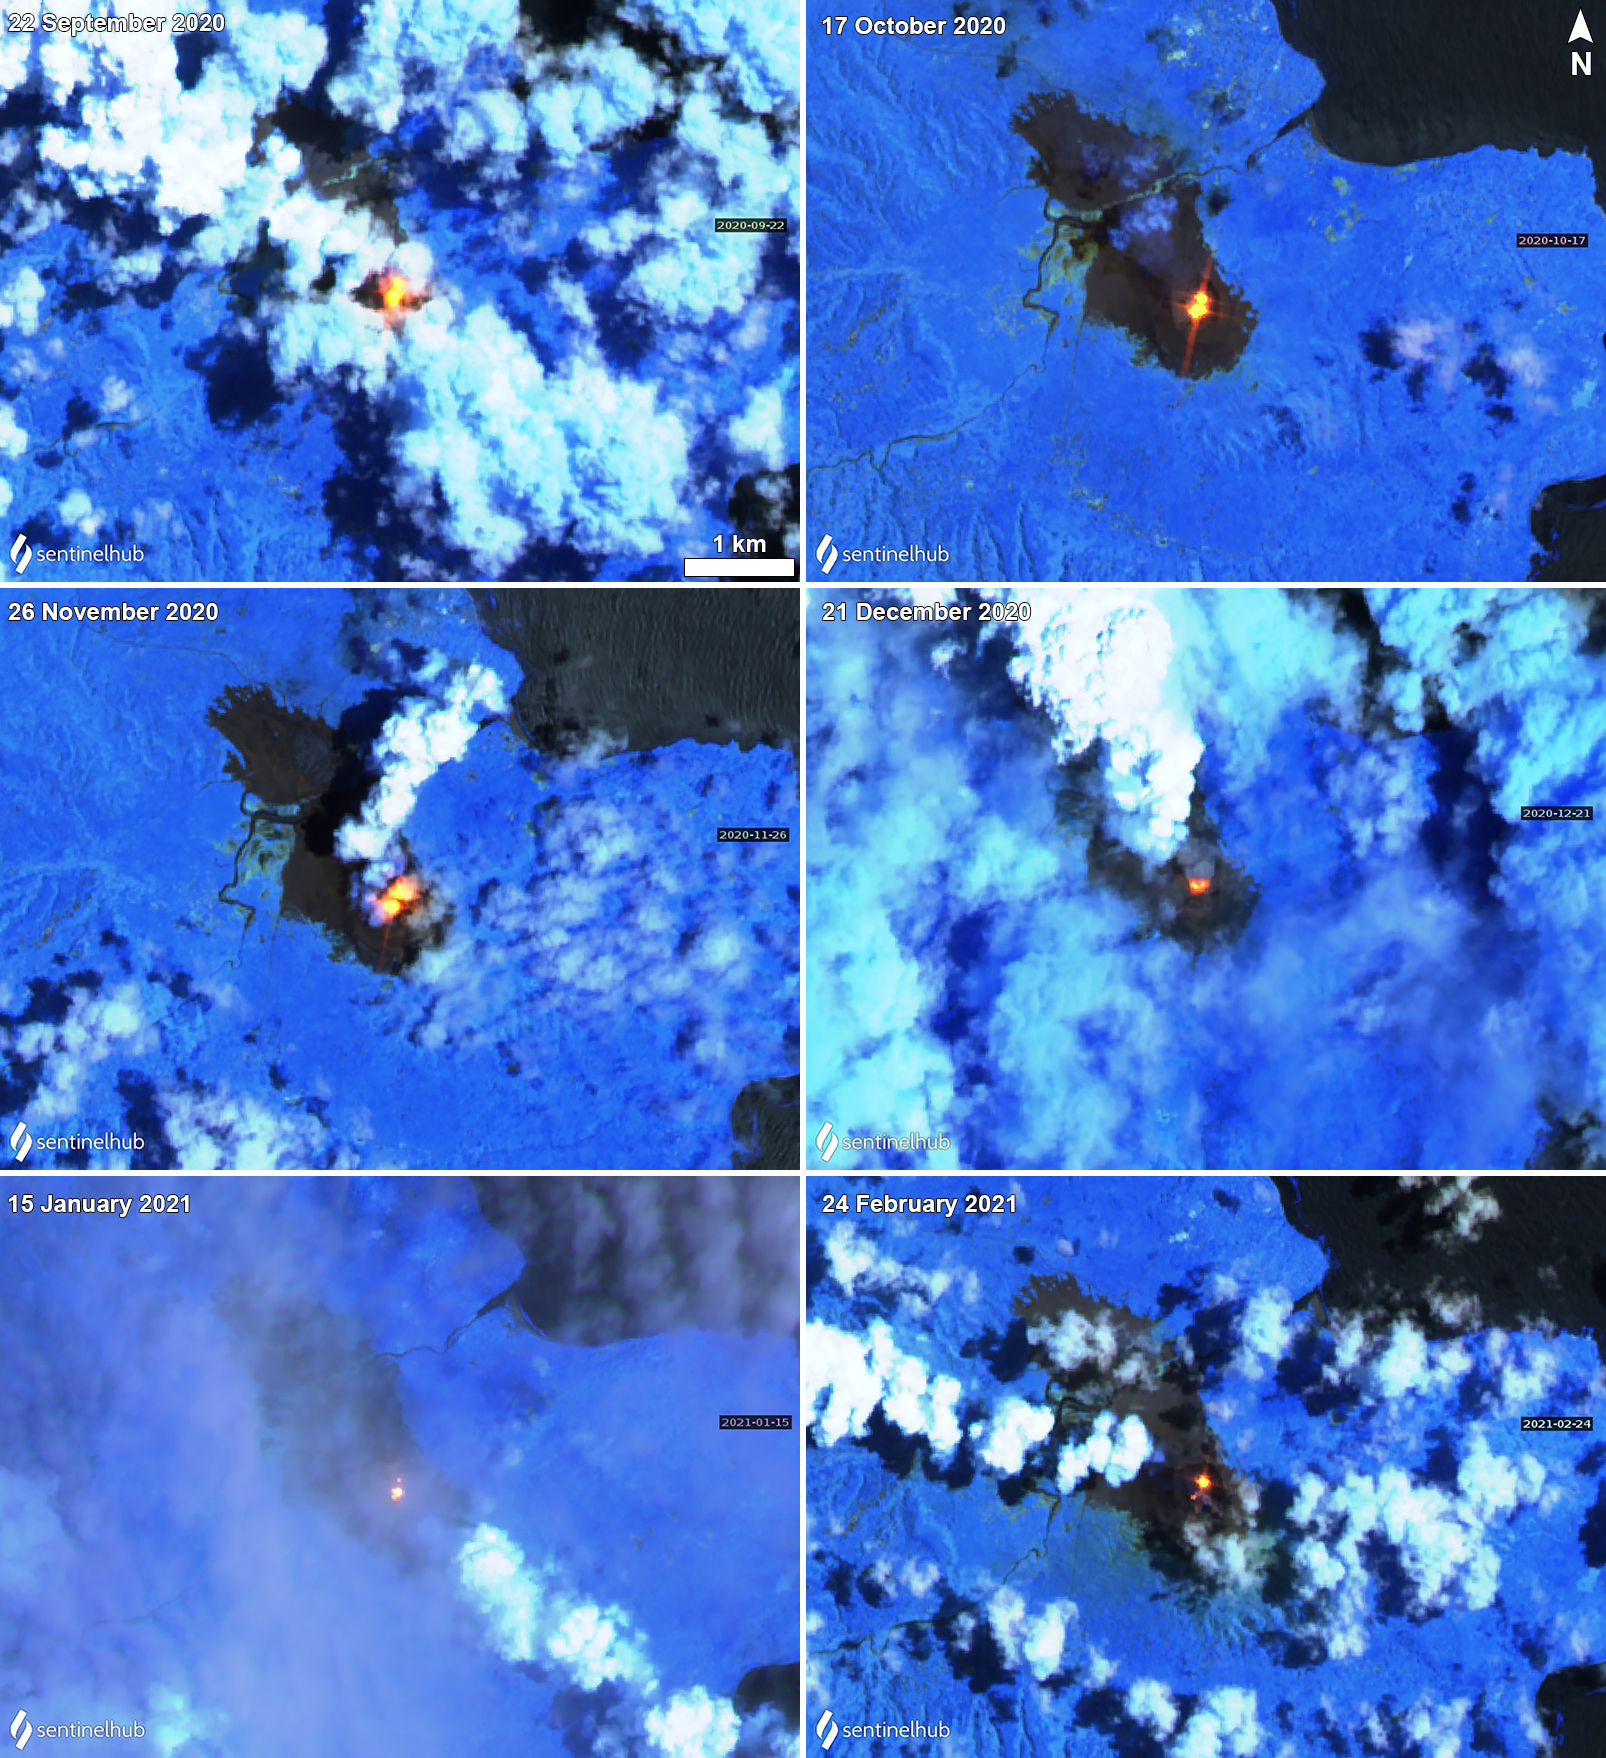 |
Figure 80. Sentinel-2 thermal satellite images showing strong thermal anomalies (yellow-orange) in the N and S vents of the summit crater at Yasur each month from September 2020 through February 2021. During 22 September (top left), 17 October (top right), and 26 November (middle left), the two thermal anomalies in the crater were roughly the same intensity. On 21 December (middle right) the anomaly was accompanied by a small, gray ash plume. On 15 January (bottom left) and 24 February (bottom right) the intensity of the anomaly in the N vent and then the S vent had decreased slightly. Sentinel-2 satellite images with “Atmospheric penetration” (bands 12, 11, 8A) rendering. Courtesy of Sentinel Hub Playground. |
Information Contacts: Geo-Hazards Division, Vanuatu Meteorology and Geo-Hazards Department (VMGD), Ministry of Climate Change Adaptation, Meteorology, Geo-Hazards, Energy, Environment and Disaster Management, Private Mail Bag 9054, Lini Highway, Port Vila, Vanuatu (URL: http://www.vmgd.gov.vu/, https://www.facebook.com/VanuatuGeohazardsObservatory/); MIROVA (Middle InfraRed Observation of Volcanic Activity), a collaborative project between the Universities of Turin and Florence (Italy) supported by the Centre for Volcanic Risk of the Italian Civil Protection Department (URL: http://www.mirovaweb.it/); Hawai'i Institute of Geophysics and Planetology (HIGP) - MODVOLC Thermal Alerts System, School of Ocean and Earth Science and Technology (SOEST), Univ. of Hawai'i, 2525 Correa Road, Honolulu, HI 96822, USA (URL: http://modis.higp.hawaii.edu/); NASA Global Sulfur Dioxide Monitoring Page, Atmospheric Chemistry and Dynamics Laboratory, NASA Goddard Space Flight Center (NASA/GSFC), 8800 Greenbelt Road, Goddard, Maryland, USA (URL: https://so2.gsfc.nasa.gov/); Sentinel Hub Playground (URL: https://www.sentinel-hub.com/explore/sentinel-playground).
Gas-and-ash explosions, SO2 plumes, and thermal anomalies during March-August 2021
Yasur is located at the SE tip of Tanna Island and contains a 400-m-wide summit crater within the small Yenkahe caldera. The current eruption has been ongoing since at least 1774 and has been characterized by Strombolian and Vulcanian activity. More recent activity has consisted of Strombolian activity and gas-and-ash emissions (BGVN 46:04), which continues during this reporting period of March through August 2021. Information primarily comes from monthly bulletins of the Vanuatu Meteorology and Geo-Hazards Department (VMGD) and various satellite data. The Volcano Alert Level remained at a 2 (on a scale of 0-4) during this reporting period.
VMGD reported that seismic data and recent visual observations confirmed ongoing explosions and gas-and-ash emissions during the reporting period. Sulfur dioxide emissions occasionally accompanied those explosions and were measured using the Sentinel-5P/TROPOMI satellite instrument for multiple days each month from March through August (figure 81). The density and drift direction varied.
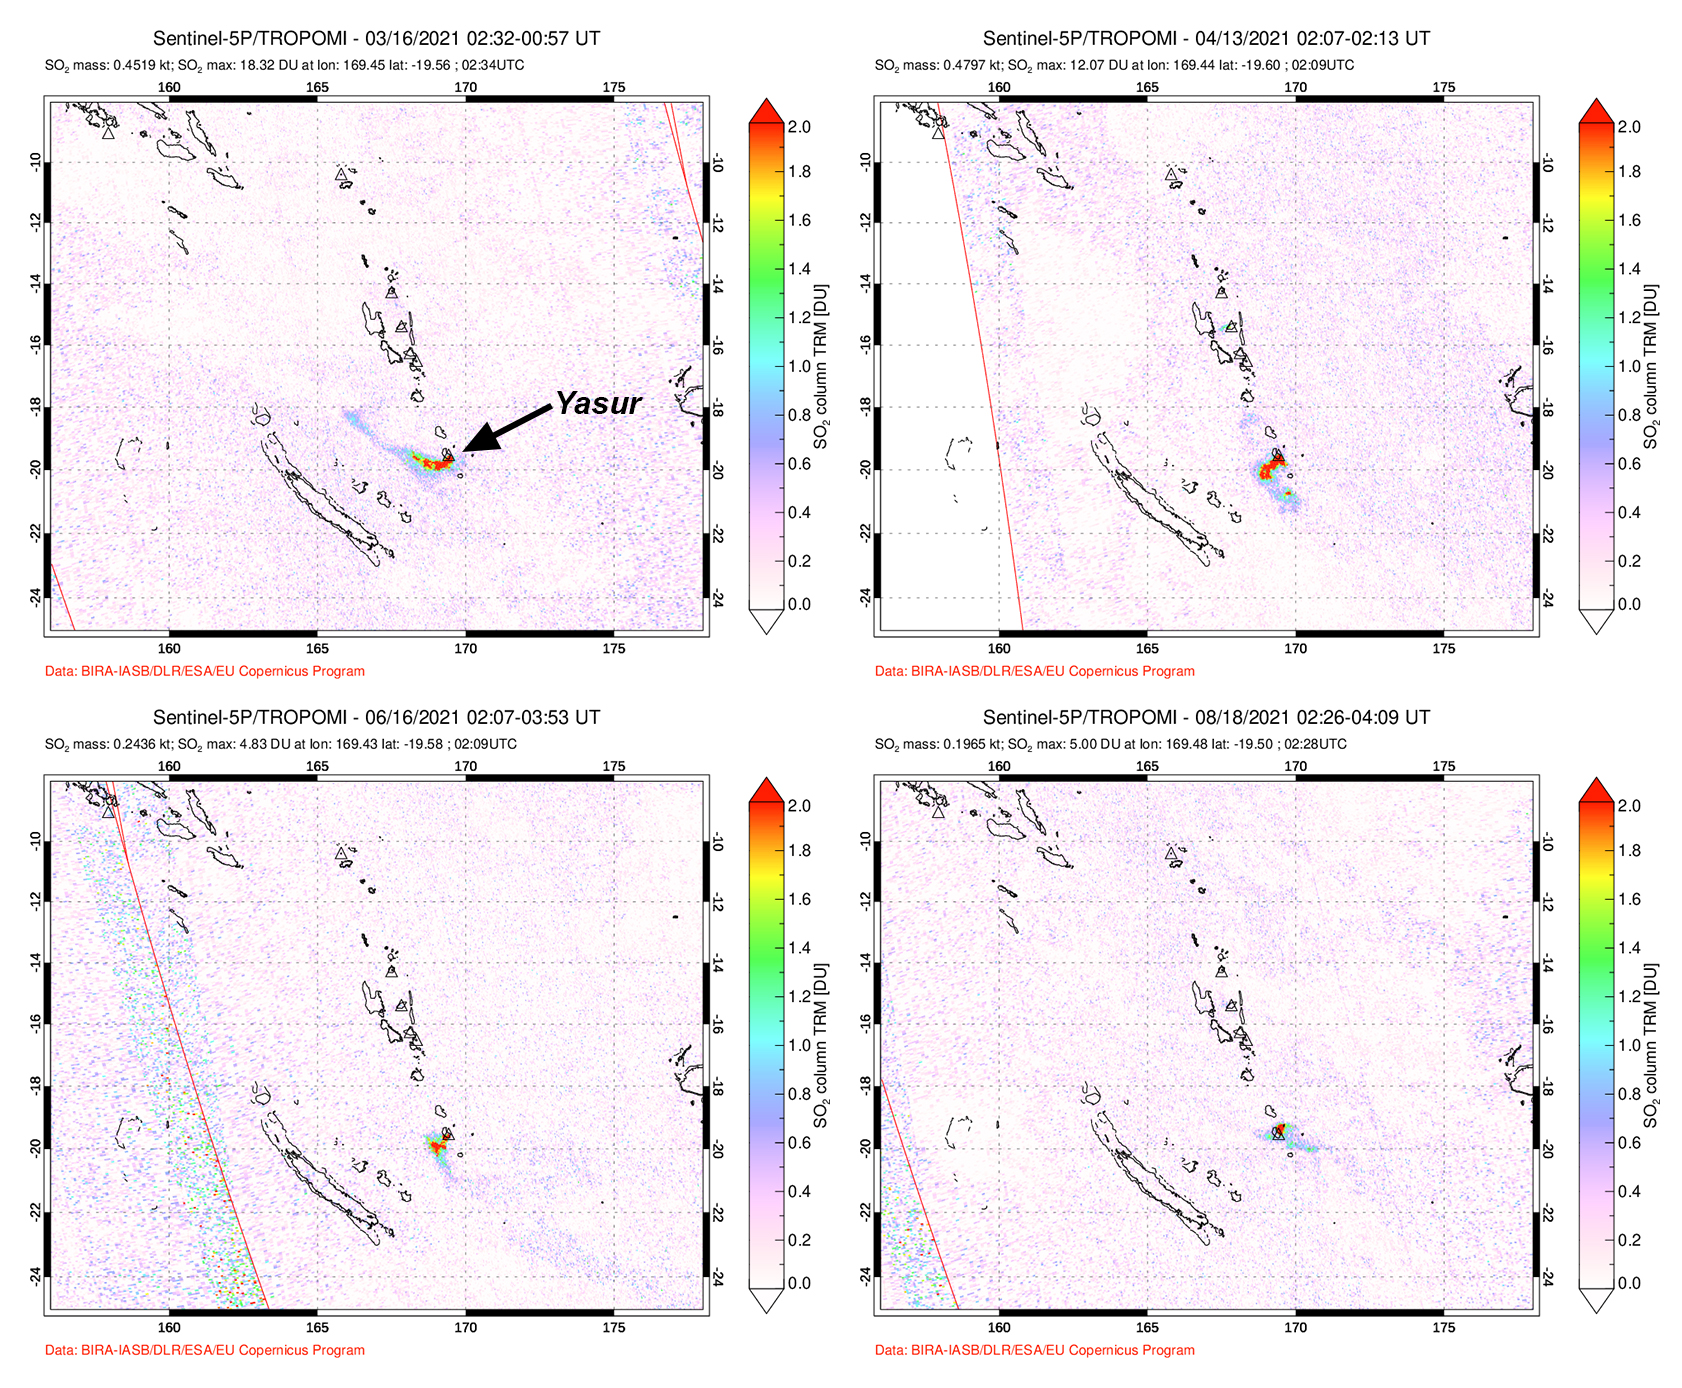 |
Figure 81. Occasional SO2 plumes of varying intensities up to 2 DUs (Dobson Units) were observed from Yasur throughout March-August 2021. Plumes drifted generally W on 16 March (top left), SW on 13 April (top right), and 16 June (bottom left), and above the volcano on 18 August (bottom right) 2021. Courtesy of NASA Global Sulfur Dioxide Monitoring Page. |
Intermittent thermal anomalies recorded by the MIROVA (Middle InfraRed Observation of Volcanic Activity) system during March through August were of moderate intensity, though brief periods of low activity were observed during April and late June to early July (figure 82). A total of twelve thermal alerts were detected by the MODVOLC thermal algorithm on 1 (1) and 28 (2) March, 11 April (1), 26 May (1), 3 (1) and 11 (1) June, 28 (1) and 30 (1) July, and 10 (1) and 15 (2) August. On clear weather days, as many as three thermal anomalies at the summit crater (occupying both the N and S vents) were also seen in Sentinel-2 infrared satellite images (figure 83).
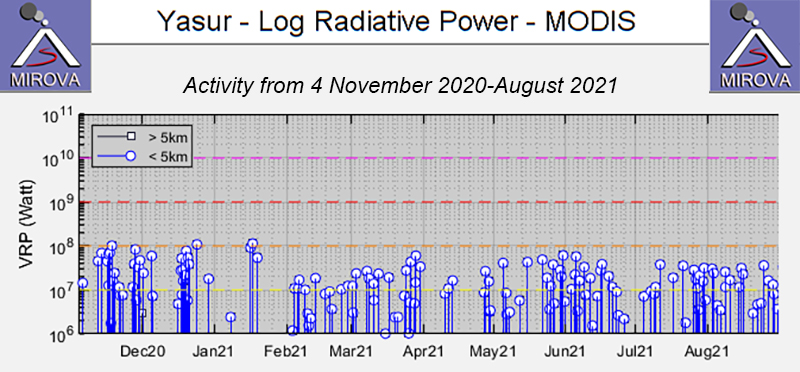 |
Figure 82. MIROVA (Log Radiative Power) thermal data for Yasur during March-August 2021 showed consistent low- to moderate- thermal activity, with brief periods of rest and declining strength during April and late June to early July. Courtesy of MIROVA. |
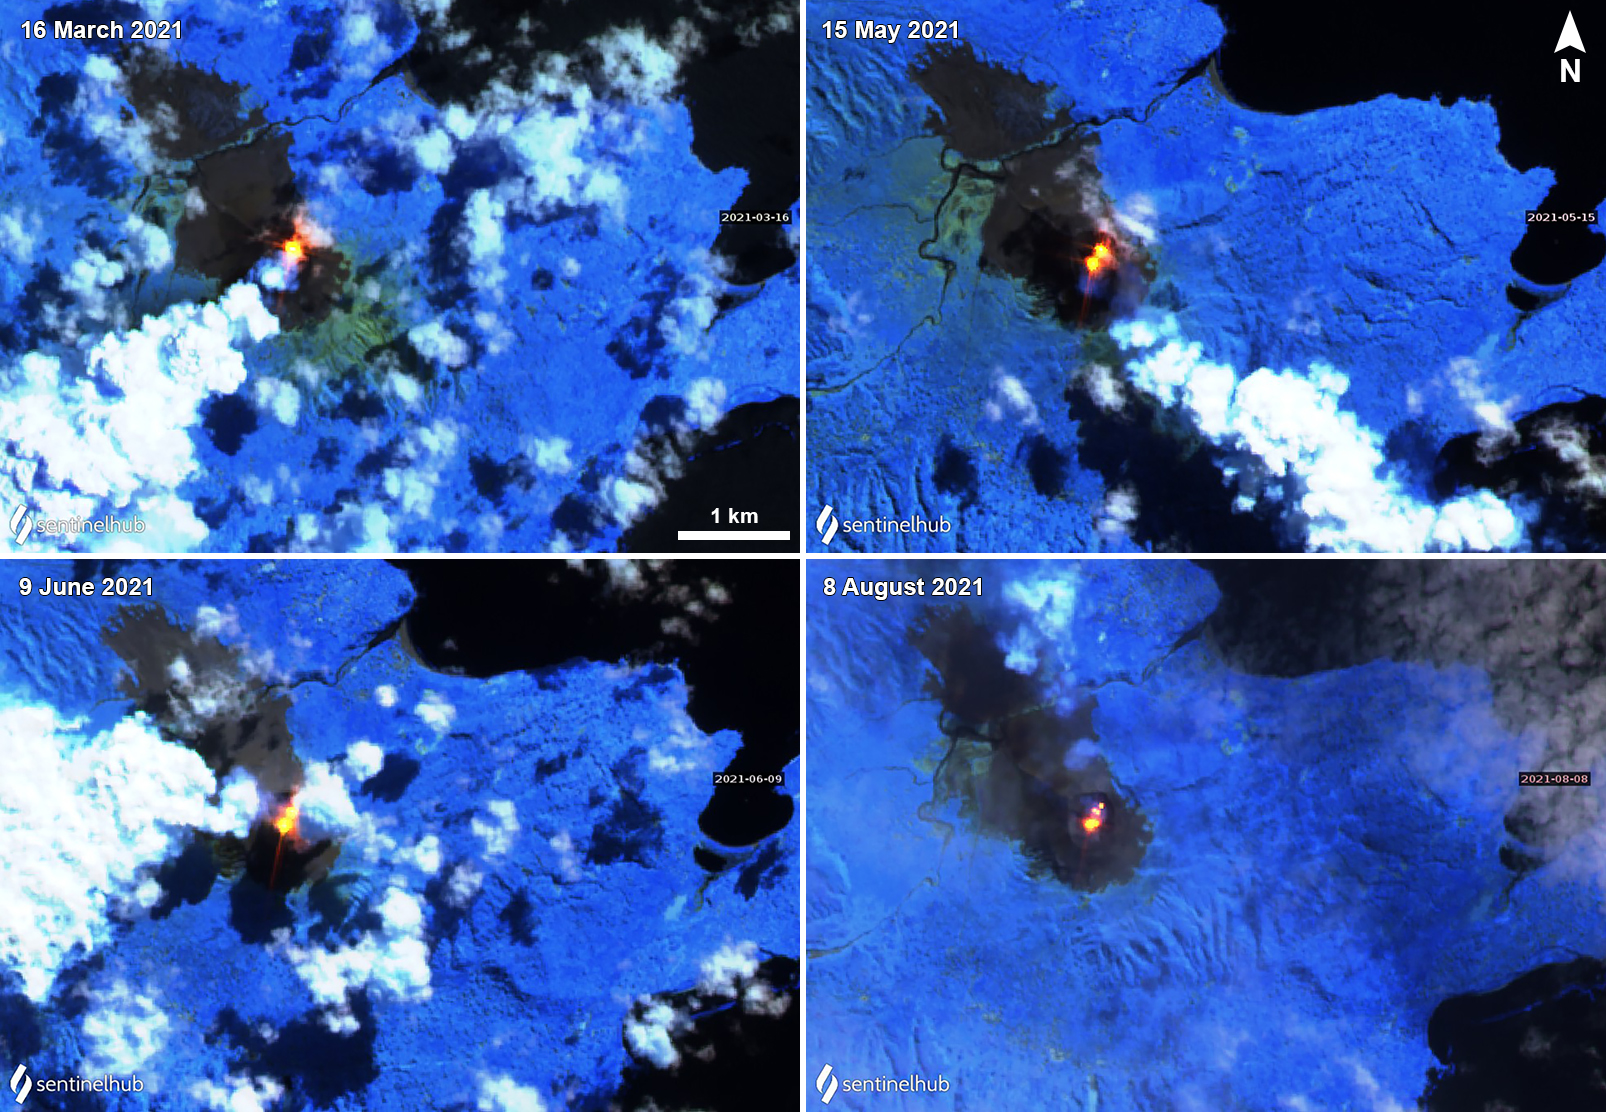 |
Figure 83. Sentinel-2 infrared satellite images showing thermal anomalies (yellow-orange) of differing intensities in the N and S vents of the summit crater at Yasur on 16 March (top left), 15 May (top right), 9 June (bottom left), and 8 August (bottom right) 2021. During 16 March, 15 May, and 9 June, the two thermal anomalies in the crater were roughly the same intensity. By 8 August, the intensity of the anomaly in both vents had decreased slightly. Occasional gas-and-steam emissions accompanied the thermal activity. Sentinel-2 satellite images with “Atmospheric penetration” (bands 12, 11, 8A) rendering. Courtesy of Sentinel Hub Playground. |
Information Contacts: Geo-Hazards Division, Vanuatu Meteorology and Geo-Hazards Department (VMGD), Ministry of Climate Change Adaptation, Meteorology, Geo-Hazards, Energy, Environment and Disaster Management, Private Mail Bag 9054, Lini Highway, Port Vila, Vanuatu (URL: http://www.vmgd.gov.vu/, https://www.facebook.com/VanuatuGeohazardsObservatory/); MIROVA (Middle InfraRed Observation of Volcanic Activity), a collaborative project between the Universities of Turin and Florence (Italy) supported by the Centre for Volcanic Risk of the Italian Civil Protection Department (URL: http://www.mirovaweb.it/); Hawai'i Institute of Geophysics and Planetology (HIGP) - MODVOLC Thermal Alerts System, School of Ocean and Earth Science and Technology (SOEST), Univ. of Hawai'i, 2525 Correa Road, Honolulu, HI 96822, USA (URL: http://modis.higp.hawaii.edu/); NASA Global Sulfur Dioxide Monitoring Page, Atmospheric Chemistry and Dynamics Laboratory, NASA Goddard Space Flight Center (NASA/GSFC), 8800 Greenbelt Road, Goddard, Maryland, USA (URL: https://so2.gsfc.nasa.gov/); Sentinel Hub Playground (URL: https://www.sentinel-hub.com/explore/sentinel-playground).
Ongoing thermal anomalies, gas-and-ash explosions, and SO2 plumes through August 2022
Recent activity at Yasur, which has been erupting since at least 1774 and possibly the past 750 years, includes frequent Strombolian explosions and ash and gas plumes from several vents in the 400 m-diameter summit crater (BGVN 44:02, 45:03). This report summarizes activity during September 2021-August 2022, using information from monthly bulletins of the Vanuatu Meteorology and Geo-Hazards Department (VMGD), the Wellington Volcanic Ash Advisory Center (VAAC), and various satellite data. According to VMGD, Yasur (also called Tanna, after the island on which it is located) has remained on Alert Level 2 (major unrest state, on a scale of 0-5), since 18 October 2016, and VMGD reminded the public not to enter the restricted area within a radius of 600 m around the cone (1 km radius 22 October-24 November 2021).
VMGD reported that seismic data and visual observations confirmed ongoing strong explosions with gas and/or ash plumes during the reporting period, with bombs falling in and around the crater, and infrequently on the flanks (figures 84-85). According to VMGD and the Wellington VAAC, emissions generally rose 1.2-1.8 km in altitude (0.8-1.4 km above the crater), sometimes depositing ash on nearby villages. The intensified activity caused VMGD to expand the restricted area to a 1-km radius around the cone. The heightened emissions had ceased by 1845 on 24 October.
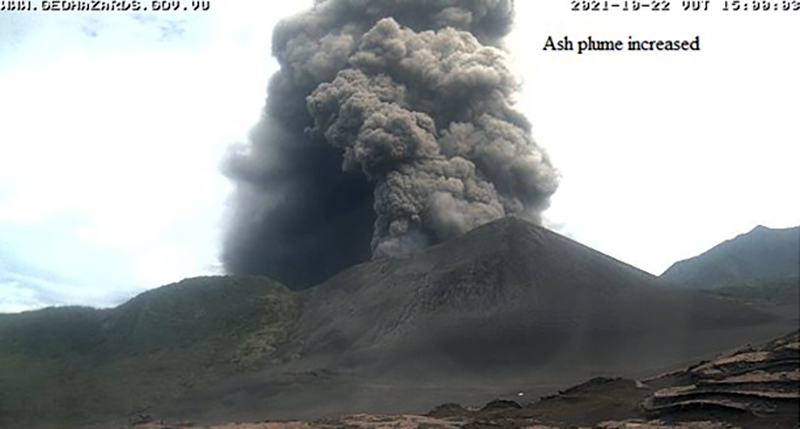 |
Figure 84. Webcam image of Yasur on 22 October 2021 showing an ash plume rising as high as 800 m above the summit. Courtesy of VMGD. |
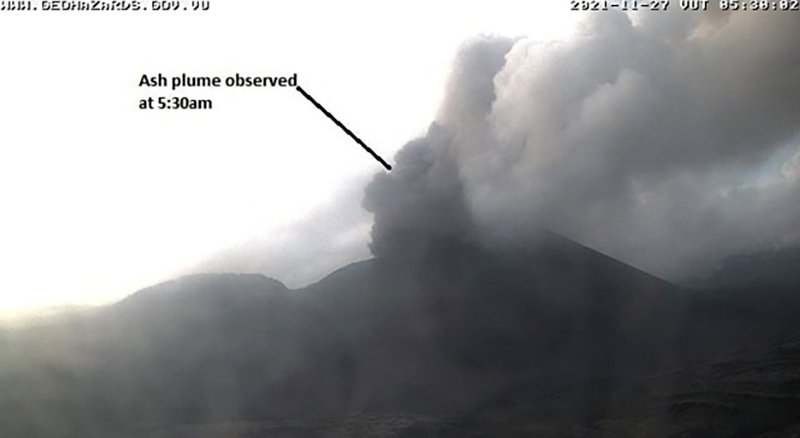 |
Figure 85. Webcam image of Yasur on 27 November 2021. According to VMGD and the Wellington VAAC, multiple gas-and-ash emissions that day rose to 1.5-1.8 km altitude and drifted W. Courtesy of VMGD. |
Sentinel-2 satellite images showed persistent strong thermal anomalies in the summit crater during the few days of the reporting period the volcano was not obscured by weather clouds (figure 86). The MODIS-MODVOLC thermal alerts system recorded only occasional hotspots for Yasur during the reporting period. The number of days with recorded hotspots ranged from 0 (October and November 2021; January, March, and July 2022) to 3 to 6 during other months. A high of 4 pixels was recorded on 12 April. In contrast, the MIROVA (Middle InfraRed Observation of Volcanic Activity) system recorded numerous hotspots during the year beginning in February 2022 (figure 85).
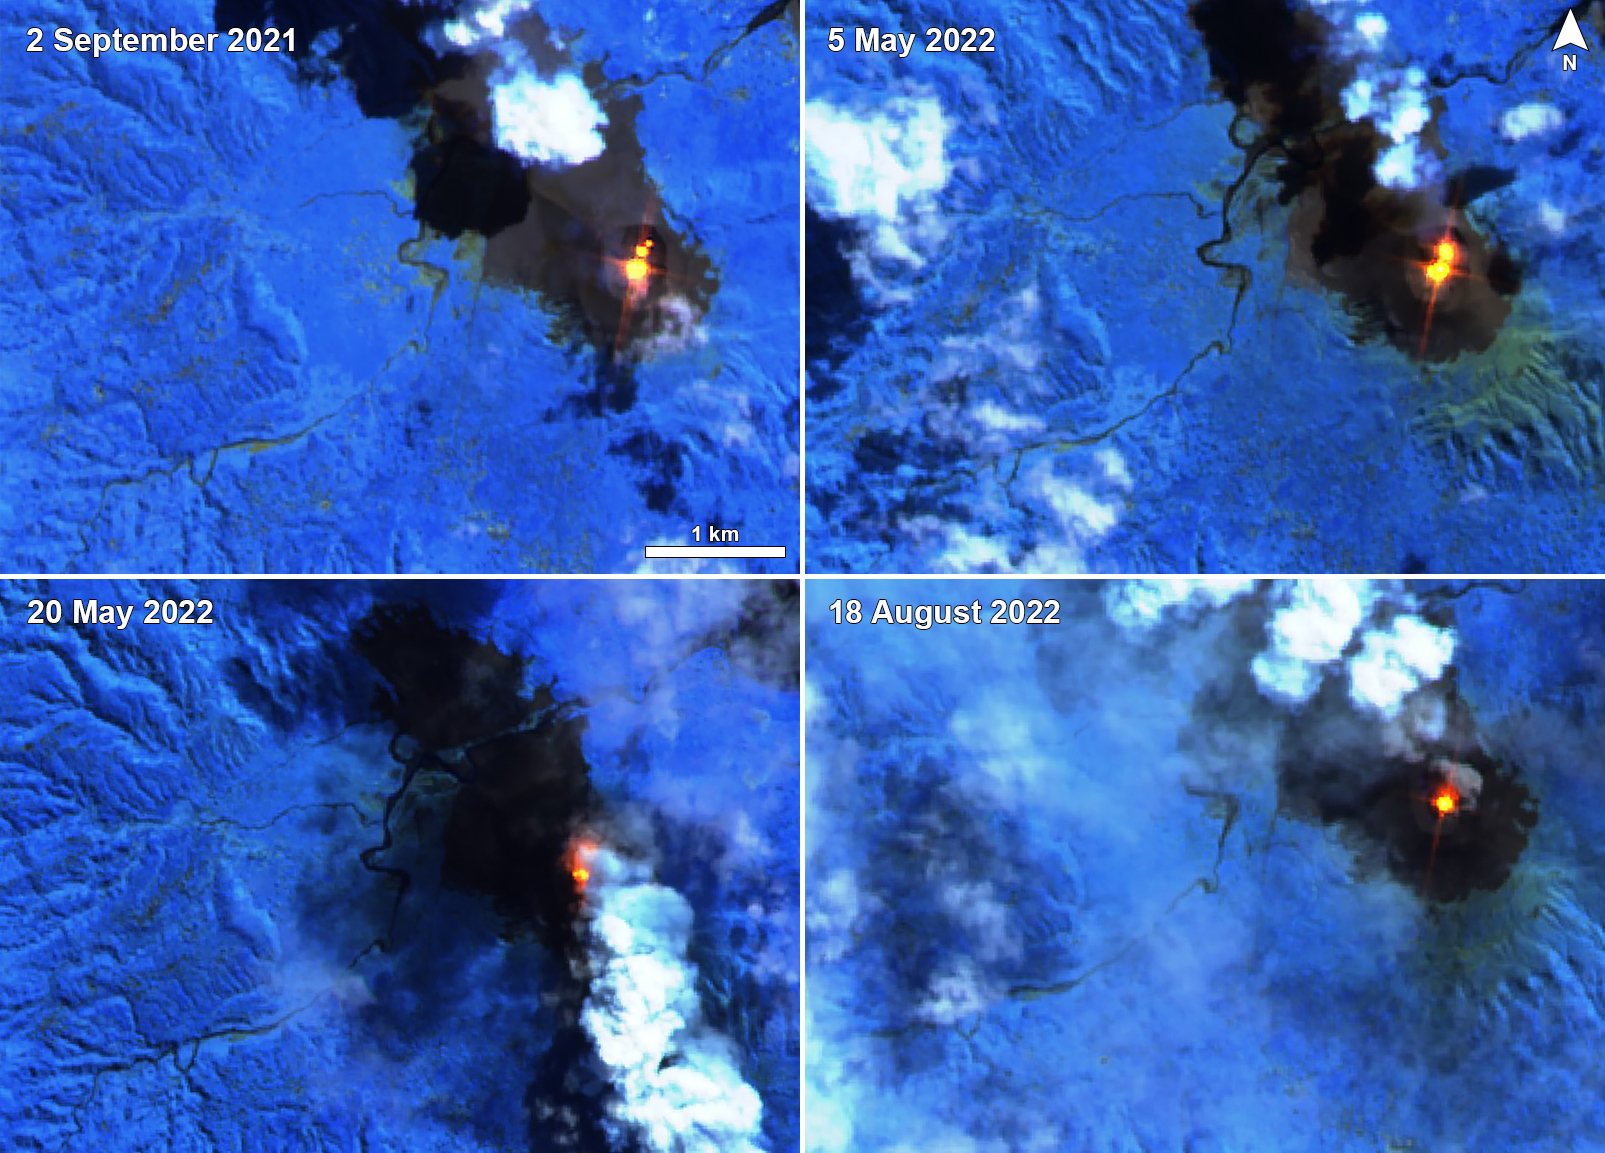 |
Figure 86. Sentinel-2 infrared satellite images of Yasur showing various configurations of the thermal anomalies in the summit crater during September 2021-May 2022. Images use Atmospheric penetration rendering (bands 12, 11, 8A). Courtesy of Sentinel Hub Playground. |
Strong sulfur dioxide plumes were often detected by the TROPOMI instrument (figure 87) on the Sentinel-5P satellite (i.e., those plumes exceeding 2 Dobson Units). The number of days with plumes was highest during November and December 2021 (most days) but dropped to one day each for July and August 2022.
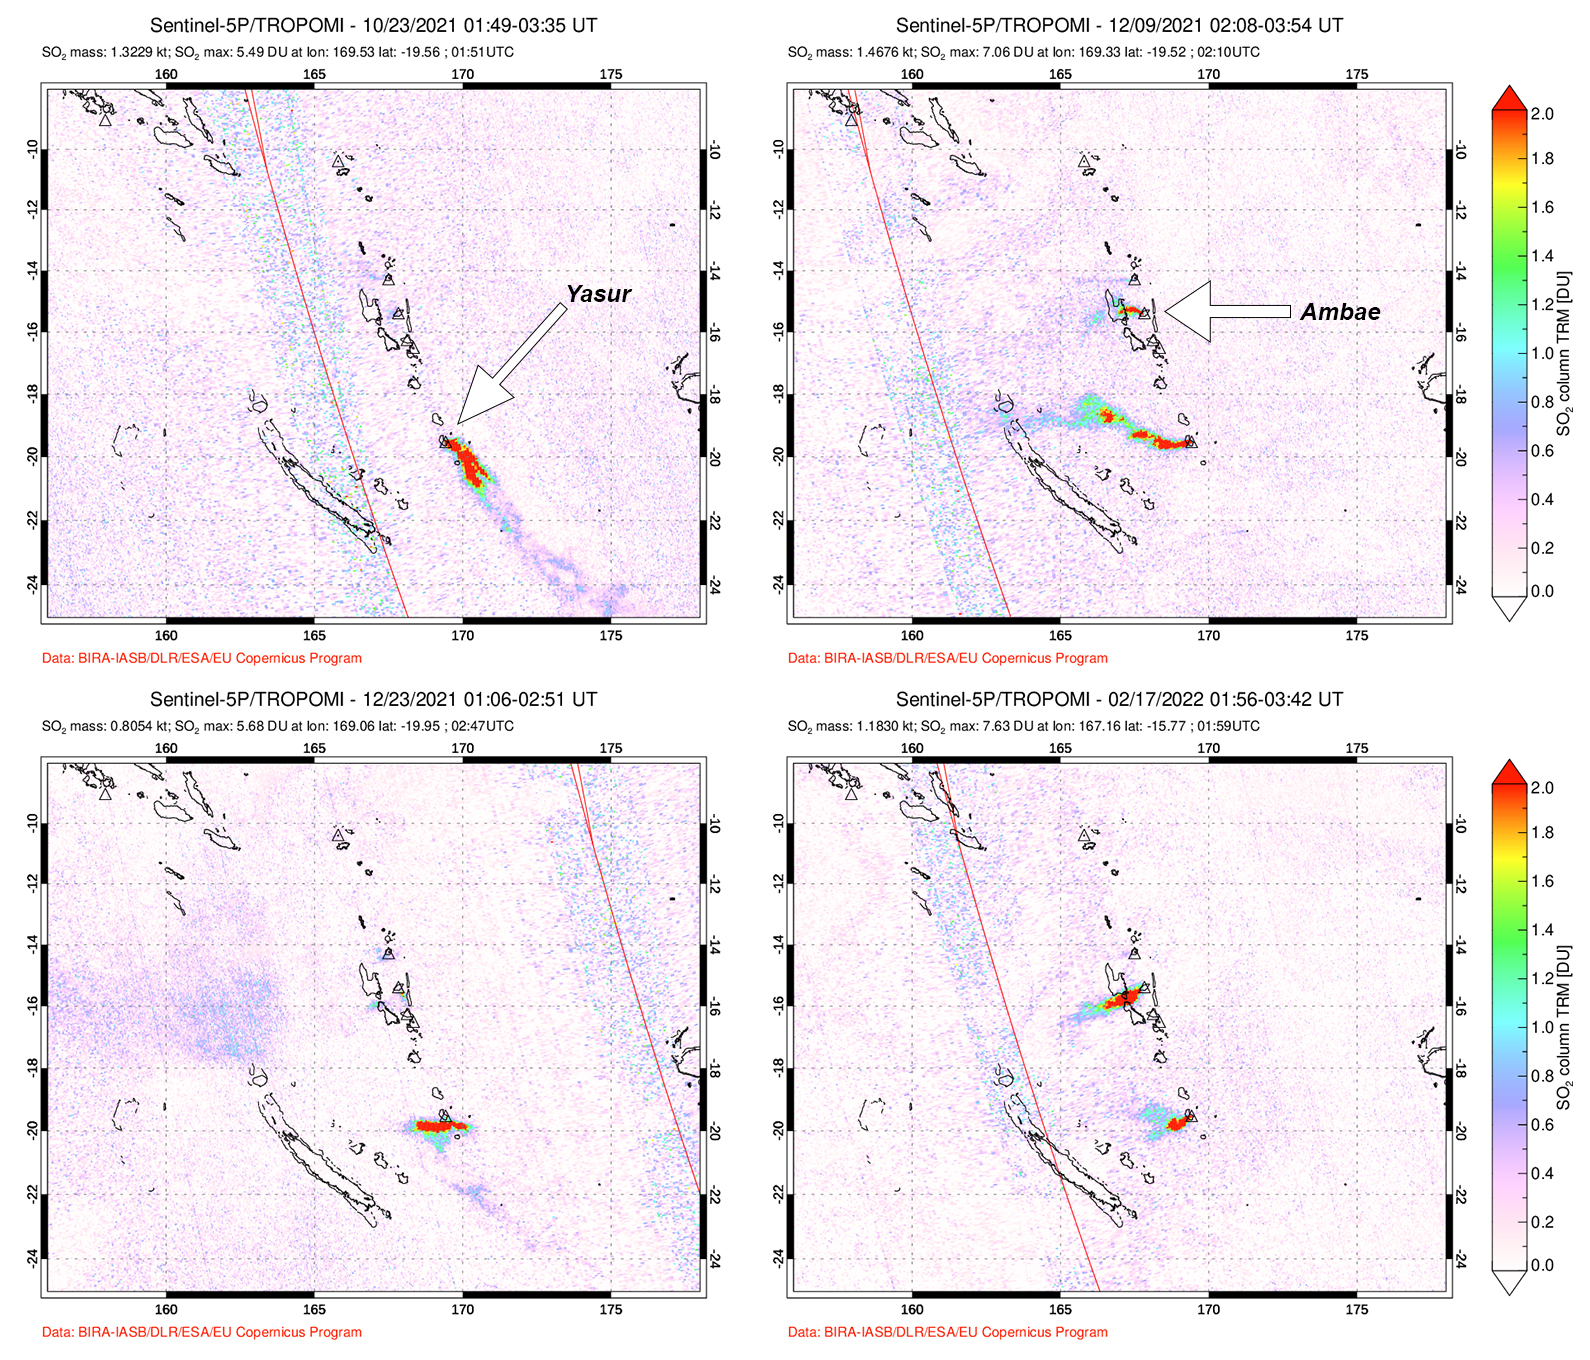 |
Figure 87. Strong sulfur dioxide plumes from Yasur were frequently detected, as seen here in representative images on 23 October, 9 December, and 23 December 2021, and 17 February 2022. The southern plumes on 9 December and 17 February are from Yasur, and the northern plumes originated from Ambae. Courtesy of NASA Global Sulfur Dioxide Monitoring Page. |
Information Contacts: Geo-Hazards Division, Vanuatu Meteorology and Geo-Hazards Department (VMGD), Ministry of Climate Change Adaptation, Meteorology, Geo-Hazards, Energy, Environment and Disaster Management, Private Mail Bag 9054, Lini Highway, Port Vila, Vanuatu (URL: http://www.vmgd.gov.vu/, https://www.facebook.com/VanuatuGeohazardsObservatory/); Wellington Volcanic Ash Advisory Center (VAAC), MetService, PO Box 722, Wellington, New Zealand (URL: http://vaac.metservice.com/); MIROVA (Middle InfraRed Observation of Volcanic Activity), a collaborative project between the Universities of Turin and Florence (Italy) supported by the Centre for Volcanic Risk of the Italian Civil Protection Department (URL: http://www.mirovaweb.it/); Hawai'i Institute of Geophysics and Planetology (HIGP) - MODVOLC Thermal Alerts System, School of Ocean and Earth Science and Technology (SOEST), Univ. of Hawai'i, 2525 Correa Road, Honolulu, HI 96822, USA (URL: http://modis.higp.hawaii.edu/); NASA Global Sulfur Dioxide Monitoring Page, Atmospheric Chemistry and Dynamics Laboratory, NASA Goddard Space Flight Center (NASA/GSFC), 8800 Greenbelt Road, Goddard, Maryland, USA (URL: https://so2.gsfc.nasa.gov/); Sentinel Hub Playground (URL: https://www.sentinel-hub.com/explore/sentinel-playground).
Ongoing summit crater activity with thermal anomalies, explosions, and SO2 plumes through April 2023
Yasur on Tanna Island, the southernmost active volcano in Vanuatu, has been erupting since at least 1774 if not before, with frequent Strombolian explosions and ash and gas plumes from several vents in the 400-m-diameter summit crater (BGVN 47:09). This report summarizes activity during September 2022-April 2023, using information from monthly bulletins of the Vanuatu Meteorology and Geo-Hazards Department (VMGD) and various satellite data. According to VMGD, Yasur has remained on Alert Level 2 (major unrest state, on a scale of 0-5) since 18 October 2016, and VMGD warned the public not to enter the restricted area within a radius of 600 m around the cone.
According to VMGD, low-to-moderate explosions continued through at least April 2023, with ejected bombs falling within the summit crater and emissions of ash, gas, and steam. Some stronger explosions ejected material outside the crater. Strong sulfur dioxide plumes were detected by the TROPOMI instrument on the Sentinel-5P satellite on 3-4 days/month during September-November 2022, but increased to 10-11 days/month in the following months.
Sentinel-2 satellite images showed persistent strong thermal anomalies, often from multiple distinct locations in the summit crater, on days when the volcano was not obscured by weather clouds. MODIS data reported by the MODVOLC thermal alerts system recorded only occasional hotspots for Yasur during the reporting period. The number of days per month with recorded hotspots ranged from one to five, with 3 pixels on 14 November 2022. VIIRS infrared data presented by the MIROVA (Middle InfraRed Observation of Volcanic Activity) system showed frequent hotspots during the recording period, all of low to moderate power (figure 88).
|
Figure 88. MIROVA (Log Radiative Power) graph showing infrared VIIRS satellite data for Yasur during the year ending on 24 April 2023. Moderate power thermal anomalies were frequently detected over most of this period. Courtesy of MIROVA. |
Information Contacts: Geo-Hazards Division, Vanuatu Meteorology and Geo-Hazards Department (VMGD), Ministry of Climate Change Adaptation, Meteorology, Geo-Hazards, Energy, Environment and Disaster Management, Private Mail Bag 9054, Lini Highway, Port Vila, Vanuatu (URL: http://www.vmgd.gov.vu/, https://www.facebook.com/VanuatuGeohazardsObservatory/); MIROVA (Middle InfraRed Observation of Volcanic Activity), a collaborative project between the Universities of Turin and Florence (Italy) supported by the Centre for Volcanic Risk of the Italian Civil Protection Department (URL: http://www.mirovaweb.it/); Hawai'i Institute of Geophysics and Planetology (HIGP) - MODVOLC Thermal Alerts System, School of Ocean and Earth Science and Technology (SOEST), Univ. of Hawai'i, 2525 Correa Road, Honolulu, HI 96822, USA (URL: http://modis.higp.hawaii.edu/); NASA Global Sulfur Dioxide Monitoring Page, Atmospheric Chemistry and Dynamics Laboratory, NASA Goddard Space Flight Center (NASA/GSFC), 8800 Greenbelt Road, Goddard, Maryland, USA (URL: https://so2.gsfc.nasa.gov/); Sentinel Hub Playground (URL: https://www.sentinel-hub.com/explore/sentinel-playground).
This compilation of synonyms and subsidiary features may not be comprehensive. Features are organized into four major categories: Cones, Craters, Domes, and Thermal Features. Synonyms of features appear indented below the primary name. In some cases additional feature type, elevation, or location details are provided.
Synonyms |
||||
| Yasour | Tanna | Tana | Iahu | Iasur | Yosua | Asur | Port Resolution | Yosur | Yasowa | Iahul | Iahue | ||||
Cones |
||||
| Feature Name | Feature Type | Elevation | Latitude | Longitude |
| Ombus | Pyroclastic cone | 19° 33' 0" S | 169° 28' 0" E | |
| Tukosmeru | Stratovolcano | 1084 m | 19° 35' 0" S | 169° 23' 0" E |
| Yenkahe Main Cone | Stratovolcano | 362 m | 19° 31' 0" S | 169° 28' 0" E |
Craters |
||||
| Feature Name | Feature Type | Elevation | Latitude | Longitude |
| Yenkahe | Caldera | |||
|
|
||||||||||||||||||||||||||
There is data available for 3 confirmed Holocene eruptive periods.
1270 ± 110 years - 2024 Apr 19 (continuing) Confirmed Eruption Max VEI: 3
Virtually continuous Strombolian or Vulcanian activity has been reported since it was seen by Captain Cook in 1774. Radiocarbon dates and stratigraphic correlations show that this style of activity has persisted for more than 800 years, since around 1270 CE or earlier. Separate episodes are used to distinguish these differing methods used to determine the overall eruptive period.
| Episode 1 | Eruption Episode | |||||||||||||||
|---|---|---|---|---|---|---|---|---|---|---|---|---|---|---|---|
| 1270 ± 110 years - 1774 | Evidence from Isotopic: 14C (calibrated) | ||||||||||||||
| Using stratigraphy and tephra accumulation calculations of the Lake Siwi sequence correlated with 14C dates from Lownsumem, Firth et al. (2014) determined that the current style of eruptive activity has been persistent since about 1270 CE. | |||||||||||||||
|
List of 1 Events for Episode 1
| |||||||||||||||
| Episode 2 | Eruption Episode | |||||||||||||||||||||||||||||||||||||||||||||||||||||||||||||||||||||||||||||||||||||||||||||||
|---|---|---|---|---|---|---|---|---|---|---|---|---|---|---|---|---|---|---|---|---|---|---|---|---|---|---|---|---|---|---|---|---|---|---|---|---|---|---|---|---|---|---|---|---|---|---|---|---|---|---|---|---|---|---|---|---|---|---|---|---|---|---|---|---|---|---|---|---|---|---|---|---|---|---|---|---|---|---|---|---|---|---|---|---|---|---|---|---|---|---|---|---|---|---|---|
| 1774 Jul 2 ± 182 days - 2024 Apr 19 (continuing) | Evidence from Observations: Reported | ||||||||||||||||||||||||||||||||||||||||||||||||||||||||||||||||||||||||||||||||||||||||||||||
| Continuous Strombolian or Vulcanian activity has been reported since it was seen by Captain Cook in 1774. Violent eruptions were reported in 1878 and other culminations of activity, lasting for several weeks or months, occurred in 1968, 1972, 1974-75, and 1977 (Carney and Macfarlane, 1979). Five eruptive vents, some of which contained lava lakes, were noted in 1991 (Robin et al.,1993). | |||||||||||||||||||||||||||||||||||||||||||||||||||||||||||||||||||||||||||||||||||||||||||||||
|
List of 17 Events for Episode 2
| |||||||||||||||||||||||||||||||||||||||||||||||||||||||||||||||||||||||||||||||||||||||||||||||
0708 ± 169 years - 1273 ± 111 years Confirmed Eruption
| Episode 1 | Eruption Episode | |||||||||||||||
|---|---|---|---|---|---|---|---|---|---|---|---|---|---|---|---|
| 0708 ± 169 years - 1273 ± 111 years | Evidence from Isotopic: 14C (calibrated) | ||||||||||||||
| An eruptive period with higher-magnitude, lower-frequency, activity relative to the recent ongoing activity was described by Firth et al. (2014), who found a series of five decimeter-thick coarse ash-lapilli beds in the White Sands sequence that correlated with the Lownasunen sequence of Nairn et al. (1988). Calibrated 14C dates, provided by Firth et al. (2014) of Nairn et al. (1988) uncalibrated data, indicate that this eruptive sequence began began around 700 CE and ended around 1270 CE. | |||||||||||||||
|
List of 1 Events for Episode 1
| |||||||||||||||
0434 ± 90 years Confirmed Eruption
| Episode 1 | Eruption Episode | |||||||||||||||
|---|---|---|---|---|---|---|---|---|---|---|---|---|---|---|---|
| 0434 ± 90 years - Unknown | Evidence from Isotopic: 14C (calibrated) | ||||||||||||||
| An eruptive period with more variable activity (style and frequency) spanned least 200 years, ending prior to ~700 CE (Firth et al., 2014). Stratigraphy described by Firth et al. (2014) from White Sands showed coarse-grained lapilli-fall deposits interspersed with thick beds of very fine ash, and indications of breaks in eruptive activity. | |||||||||||||||
|
List of 1 Events for Episode 1
| |||||||||||||||
There is no Deformation History data available for Yasur.
There is no Emissions History data available for Yasur.
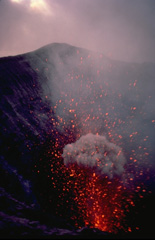 Clots of incandescent magma ejected from a vent on the floor of the summit crater of Yasur volcano rise to the height of the crater rim. The more-or-less continual low-level eruptive activity of Yasur, which has been occurring since it was first observed by Captain Cook in 1774, has drawn visitors to the island of Tanna. Mild strombolian eruptions are occasionally punctuated by more violent explosions.
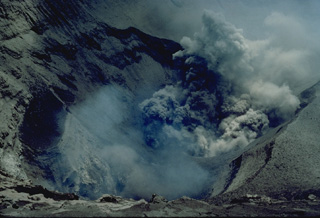 An ash column is ejected from one of several vents on the floor of the summit crater of Yasur volcano in 1982. The frequent eruptions of this volcano have drawn visitors to Tanna Island.
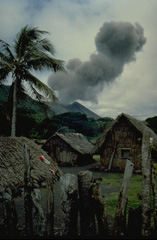 An ash cloud rising above the summit crater of Yasur volcano is seen from a village on Tanna Island in 1982. Yasur, the best-known and most frequently visited of the Vanuatu volcanoes, has been in more-or-less continuous strombolian activity since Captain Cook observed ash eruptions in 1774.
 Yasur, the best-known and most frequently visited of the Vanuatu volcanoes, has been in more-or-less continuous strombolian activity since Captain Cook observed ash eruptions in 1774. This style of activity may have continued for the past 800 years. Yasur is seen here from the west across windswept Lake Siwi. Frequent ash ejection has kept the 361-m-high pyroclastic cone mostly unvegetated.
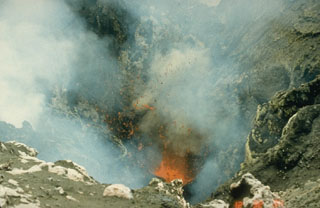 Incandescent spatter is ejected from a vent in the summit crater of Yasur volcano on 8 September 1988. The volcano has produced continuous Strombolian or Vulcanian activity since at least 1774. The mild activity seen here is occasionally interrupted by more violent explosive activity, such as during 1878, 1968, 1972, 1974-75, and 1977.
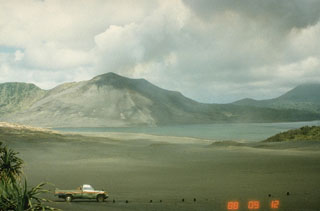 A plume rises above the summit crater of Yasur, seen here from the west across Lake Siwi in 1988. Yasur has produced near-continuous Strombolian activity since at least 1774 and this style of activity may have continued for the past 800 years. The mostly-unvegetated cone is has a 400-m-wide summit crater.
The maps shown below have been scanned from the GVP map archives and include the volcano on this page. Clicking on the small images will load the full 300 dpi map. Very small-scale maps (such as world maps) are not included. The maps database originated over 30 years ago, but was only recently updated and connected to our main database. We welcome users to tell us if they see incorrect information or other problems with the maps; please use the Contact GVP link at the bottom of the page to send us email.
The following 1 samples associated with this volcano can be found in the Smithsonian's NMNH Department of Mineral Sciences collections, and may be availble for research (contact the Rock and Ore Collections Manager). Catalog number links will open a window with more information.
| Catalog Number | Sample Description | Lava Source | Collection Date |
|---|---|---|---|
| NMNH 117130 | Volcanic Bomb | YENKAHE CALDERA | -- |
| Copernicus Browser | The Copernicus Browser replaced the Sentinel Hub Playground browser in 2023, to provide access to Earth observation archives from the Copernicus Data Space Ecosystem, the main distribution platform for data from the EU Copernicus missions. |
| MIROVA | Middle InfraRed Observation of Volcanic Activity (MIROVA) is a near real time volcanic hot-spot detection system based on the analysis of MODIS (Moderate Resolution Imaging Spectroradiometer) data. In particular, MIROVA uses the Middle InfraRed Radiation (MIR), measured over target volcanoes, in order to detect, locate and measure the heat radiation sourced from volcanic activity. |
| MODVOLC Thermal Alerts | Using infrared satellite Moderate Resolution Imaging Spectroradiometer (MODIS) data, scientists at the Hawai'i Institute of Geophysics and Planetology, University of Hawai'i, developed an automated system called MODVOLC to map thermal hot-spots in near real time. For each MODIS image, the algorithm automatically scans each 1 km pixel within it to check for high-temperature hot-spots. When one is found the date, time, location, and intensity are recorded. MODIS looks at every square km of the Earth every 48 hours, once during the day and once during the night, and the presence of two MODIS sensors in space allows at least four hot-spot observations every two days. Each day updated global maps are compiled to display the locations of all hot spots detected in the previous 24 hours. There is a drop-down list with volcano names which allow users to 'zoom-in' and examine the distribution of hot-spots at a variety of spatial scales. |
|
WOVOdat
Single Volcano View Temporal Evolution of Unrest Side by Side Volcanoes |
WOVOdat is a database of volcanic unrest; instrumentally and visually recorded changes in seismicity, ground deformation, gas emission, and other parameters from their normal baselines. It is sponsored by the World Organization of Volcano Observatories (WOVO) and presently hosted at the Earth Observatory of Singapore.
GVMID Data on Volcano Monitoring Infrastructure The Global Volcano Monitoring Infrastructure Database GVMID, is aimed at documenting and improving capabilities of volcano monitoring from the ground and space. GVMID should provide a snapshot and baseline view of the techniques and instrumentation that are in place at various volcanoes, which can be use by volcano observatories as reference to setup new monitoring system or improving networks at a specific volcano. These data will allow identification of what monitoring gaps exist, which can be then targeted by remote sensing infrastructure and future instrument deployments. |
| Volcanic Hazard Maps | The IAVCEI Commission on Volcanic Hazards and Risk has a Volcanic Hazard Maps database designed to serve as a resource for hazard mappers (or other interested parties) to explore how common issues in hazard map development have been addressed at different volcanoes, in different countries, for different hazards, and for different intended audiences. In addition to the comprehensive, searchable Volcanic Hazard Maps Database, this website contains information about diversity of volcanic hazard maps, illustrated using examples from the database. This site is for educational purposes related to volcanic hazard maps. Hazard maps found on this website should not be used for emergency purposes. For the most recent, official hazard map for a particular volcano, please seek out the proper institutional authorities on the matter. |
| IRIS seismic stations/networks | Incorporated Research Institutions for Seismology (IRIS) Data Services map showing the location of seismic stations from all available networks (permanent or temporary) within a radius of 0.18° (about 20 km at mid-latitudes) from the given location of Yasur. Users can customize a variety of filters and options in the left panel. Note that if there are no stations are known the map will default to show the entire world with a "No data matched request" error notice. |
| UNAVCO GPS/GNSS stations | Geodetic Data Services map from UNAVCO showing the location of GPS/GNSS stations from all available networks (permanent or temporary) within a radius of 20 km from the given location of Yasur. Users can customize the data search based on station or network names, location, and time window. Requires Adobe Flash Player. |
| DECADE Data | The DECADE portal, still in the developmental stage, serves as an example of the proposed interoperability between The Smithsonian Institution's Global Volcanism Program, the Mapping Gas Emissions (MaGa) Database, and the EarthChem Geochemical Portal. The Deep Earth Carbon Degassing (DECADE) initiative seeks to use new and established technologies to determine accurate global fluxes of volcanic CO2 to the atmosphere, but installing CO2 monitoring networks on 20 of the world's 150 most actively degassing volcanoes. The group uses related laboratory-based studies (direct gas sampling and analysis, melt inclusions) to provide new data for direct degassing of deep earth carbon to the atmosphere. |
| Large Eruptions of Yasur | Information about large Quaternary eruptions (VEI >= 4) is cataloged in the Large Magnitude Explosive Volcanic Eruptions (LaMEVE) database of the Volcano Global Risk Identification and Analysis Project (VOGRIPA). |
| EarthChem | EarthChem develops and maintains databases, software, and services that support the preservation, discovery, access and analysis of geochemical data, and facilitate their integration with the broad array of other available earth science parameters. EarthChem is operated by a joint team of disciplinary scientists, data scientists, data managers and information technology developers who are part of the NSF-funded data facility Integrated Earth Data Applications (IEDA). IEDA is a collaborative effort of EarthChem and the Marine Geoscience Data System (MGDS). |

