According to the Washington VAAC, INGEOMINAS reported a seismic event from Nevado del Huila on 11 November consistent with a potential ash emission. A possible ash plume detected in satellite imagery drifted 25 km WSW. A subsequent notice stated that seismicity returned to background levels and the plume was no longer visible. INGEOMINAS reported that during 10-16 November whitish-colored gas plumes seen through the Tafxnú and Maravillas (12 km SE) web cameras rose 2 km above the crater. The Alert Level had been lowered to III (Yellow; "changes in the behavior of volcanic activity") on 12 October, and remained at that level during the reporting period.
Sources: Servicio Geológico Colombiano (SGC), Washington Volcanic Ash Advisory Center (VAAC)
Dome growth and displaced glacier in 2009; decreasing activity during 2010-2012
Lava dome emplacement occurred at Nevado del Huila's Pico Central (central peak) in late 2008, and was accompanied by seismic unrest and significant sulfur dioxide (SO2) emissions (BGVN 37:10). Extrusion continued between November 2008 and November 2009. Ash plumes were frequently observed by webcameras during late 2008 to December 2009, and satellite imagery reviewed by the Washington Volcanic Ash Advisory Center (VAAC) detected intermittent ash emissions between October 2009 and April 2011. From January 2009 to December 2012, the Instituto Colombiano de Geología y Minería (INGEOMINAS) reported persistent emissions from the lava dome and dramatic changes to the perched glacier as the lava dome expanded across the E and W flanks. Activity generally decreased in November 2010 through 2012.
In this report, we focus on the time period of December 2008-December 2012 and also discuss monitoring efforts overseen by INGEOMINAS with collaborators such as the Colombian Air Force (FAC), the Washington VAAC, and the Sulfur Dioxide Group's Ozone Monitoring Instrument (OMI). The following subsections review webcamera and aerial observations, thermal-camera imaging, satellite images of volcanic plumes, seismicity, SO2 measurements (DOAS, Flyspec, and OMI), acoustic flow monitoring, and new tilt data. The local monitoring network was expanded during this reporting period, adding two infrasound monitoring stations in 2009 and 2012, two webcameras in 2010 and 2012, and instrumentation at the Caloto site that included a broadband seismometer and an electronic tilt station in 2012.
Web-camera observations. From December 2008 to December 2009, the Tafxnú web-camera (located ~15 km S of the volcanic edifice) frequently recorded gas-and-ash plumes rising higher than 2,000 m above the active dome (figure 26). In 2009, plumes (frequently ash-and-gas, but in some cases gas without ash) rose to maximum heights above the dome as follows: 1,000-2,000 m in June; 1,000-2,500 m in November; and 2,000-5,000 m in December.
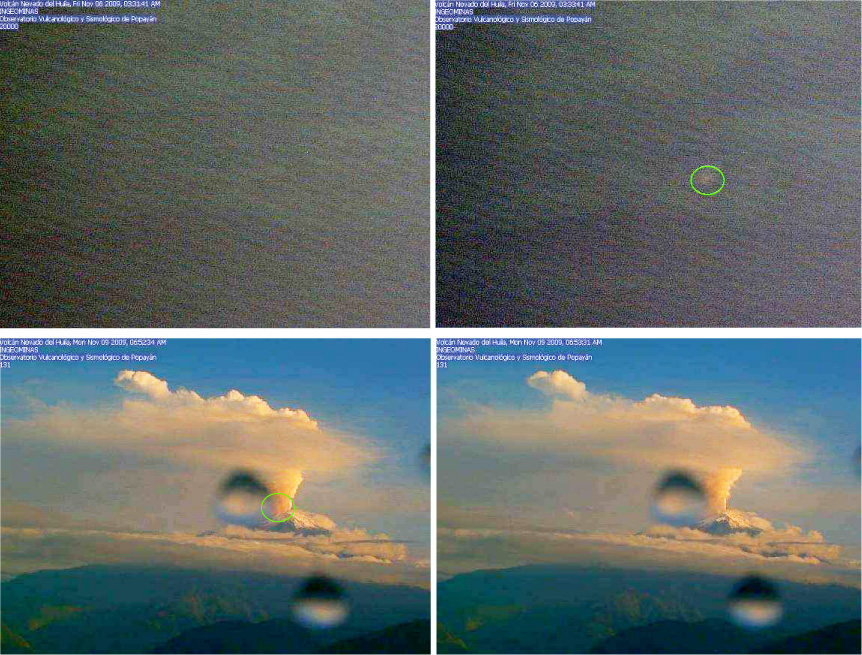 |
Figure 26. On 6 and 9 November 2009, summit activity from Nevado del Huila was observed by INGEOMINAS' N-looking Tafxnú web-camera. Accelerated dome growth was noted by INGEOMINAS that month (discussed in text below), and they annotated this image to circle the location of incandescence and summit activity. Note that these images have been altered from the originals; GVP staff increased the brightness and contrast in order to better distinguish the peaks of the Huila complex. (Top images) Incandescence on 6 November was absent at 0331 (left image) but appeared at 0333 within the green circled region (right image). INGEOMINAS suggested this incandescence resulted from dome collapse events exposing hot rock. The darker peak centered in the foreground is Pico Sur, while the active Pico Central is located higher and to the right of that peak in these images. (Bottom images) Plumes of ash and gas drifting NW from Pico Central were observed on 9 November at 0652 (left image) and 0653 (right image). The green circled region in the left-hand image corresponds to the same location circled in the image from 0333 on 6 November. Two water droplets on the camera lens created the local circular distortions. Courtesy of INGEOMINAS. |
An additional camera was brought online in July 2010, located in the town of Maravillas (~10 km SE). A third camera, located at the Caloto site (~4 km SSW of the active dome) came online in July 2012 (figures 27 and 28).
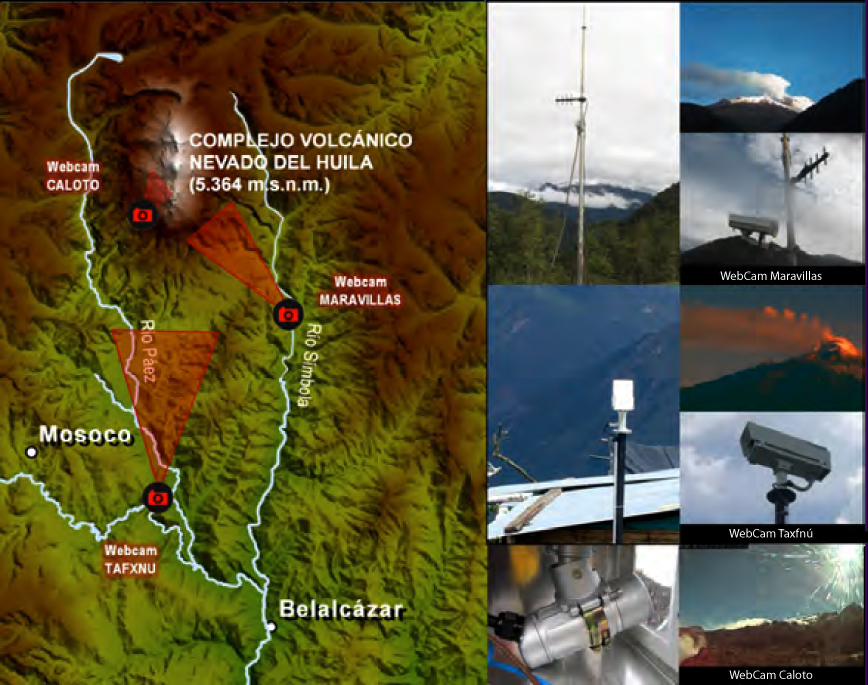 |
Figure 27. This composite image shows, at left, a map view of the three Nevado del Huila webcamera locations and the extent of their viewsheds. Photos at right show camera installation sites. The newest monitoring station (Caloto) was installed on 19 May 2012 on the SW flank. Courtesy of INGEOMINAS. |
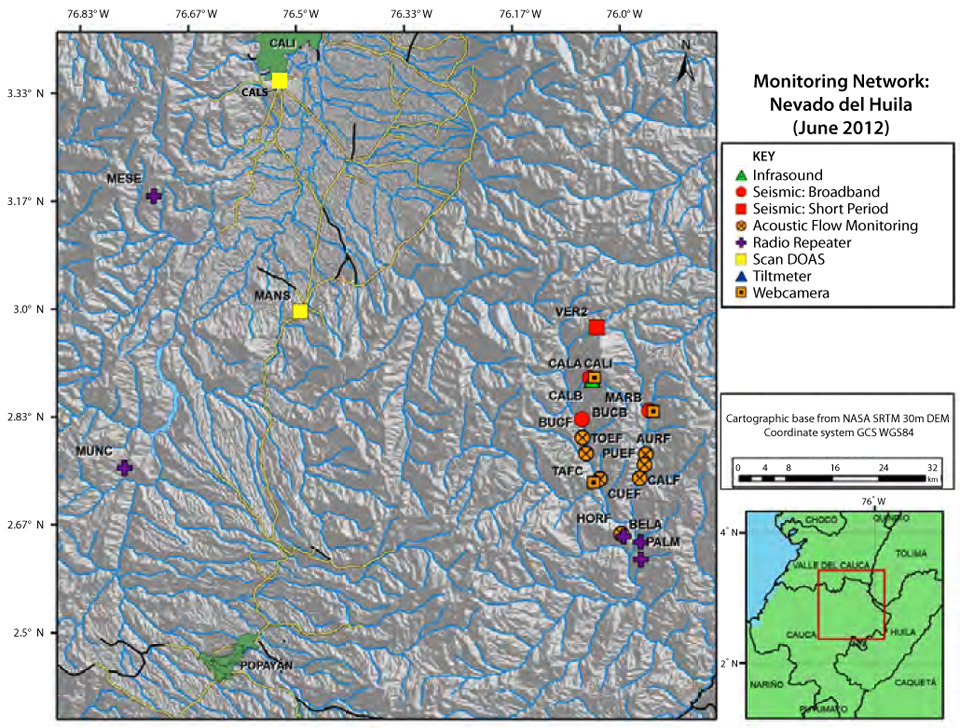 |
Figure 28. A map of monitoring stations for Nevado del Huila from June 2012 included locations of webcameras and seismic, geochemical, and geophysical instruments. The summit of Pico Central is located approximately beneath the text BUCB. Note that yellow and black lines represent major and minor roads, respectively, and blue lines represent rivers. Courtesy of INGEOMINAS. |
Observations of dome growth and summit activity during 2009-2010. With support from the Colombian Air Force (FAC) during 2009-2012, INGEOMINAS monitored dome growth and geomorphological changes at Huila by conducting aerial observations with helicopters.
During February 2009 and June-December 2009, INGEOMINAS reported numerous episodes of tremor that were likely associated with ash emissions, but cloud cover and nightfall sometimes precluded direct observations. Notable ash plumes were observed on 11 February, 23 July, 3 August, 16-23 October, and 3, 9, 12, 13 and 15 November; ashfall was noted by observers on all days except 11 February. A crack that had formed along the N face of Pico Central in 2007 continued to steam during this time period.
During three overflights conducted in January 2009, INGEOMINAS determined that the Pico Central lava dome had grown since November 2008. With repeat aerial photography, scientists calculated a total dome volume of 52 x 106 m3 with dimensions of 1,000 m N-S and 250 m E-W. The fresh dome rock continuously degassed (figure 29). Tafxnú webcamera images also showed that gas emissions frequently rising above Pico Central were often blue-colored. Due to continued unrest at Nevado del Huila (note that this name is shortened to 'Huila' during the remainder of this report), especially seismicity and active dome growth at Pico Central, INGEOMINAS maintained Orange Alert (Alert Level II; the second highest Alert Level on a 4-color scale from Green/IV-Yellow/III-Orange/II-Red/I) during January-February 2009.
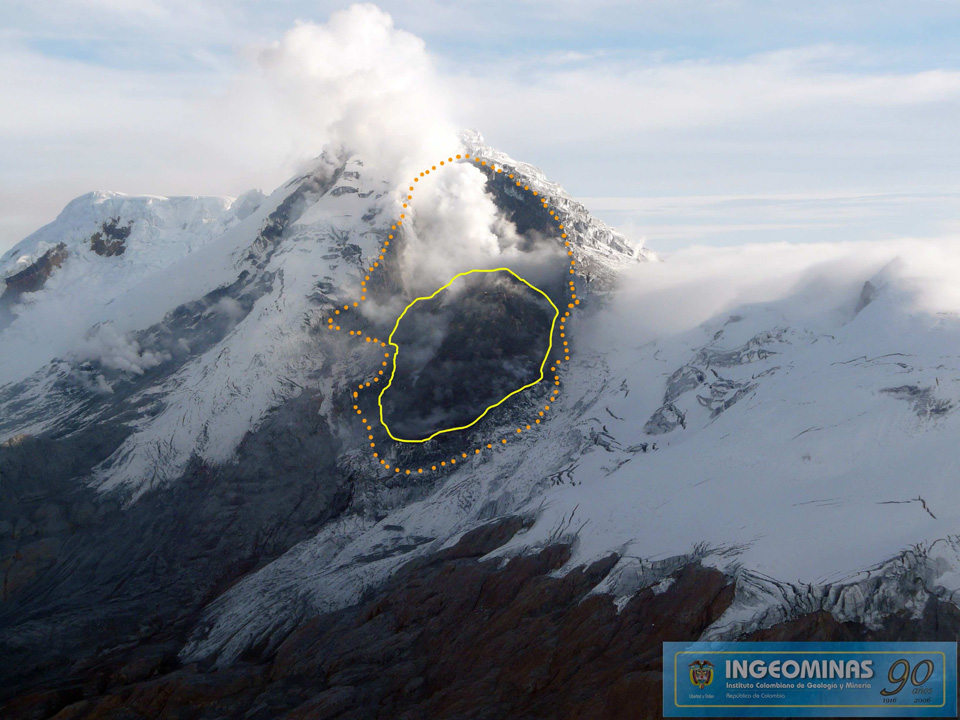 |
Figure 29. On 28 January 2009, the FAC facilitated observations of Nevado del Huila's growing lava-dome. In this view, the SW flank (centered) emitted a small gas column. This image highlights the zone of active lava dome growth (outlined in yellow) and the perimeter of the crater (outlined in orange). Courtesy of FAC and INGEOMINAS. |
On 11 February 2009, a small pulse of tremor was accompanied by an ash plume discharged at Pico Central which was captured by the Taxfnú webcamera during 0745-0751. During that time period, INGEOMINAS noted a small pulse of tremor. On 23 February, an INGEOMINAS passenger on a commercial aircraft saw diffuse gas escaping from both the crater that hosts the dome and from the N-flank crack. During March, the webcamera frequently showed degassing from the crater and the lava dome. Clear conditions enabled observers on commercial flights to observe a white plume rising from Pico Central in the morning of 10 March. INGEOMINAS noted that both seismicity and remote observations of dome growth indicated decreased activity since February. Accordingly, on 31 March 2009, INGEOMINAS reduced the Alert Level to Yellow (II).
Aerial observations in April highlighted the presence of ash covering the S glacier, confirming the ongoing eruption. Elevated temperatures were concentrated at the extreme high and low points of the dome and degassing continued from the higher-elevation portion of the crater (figure 30).
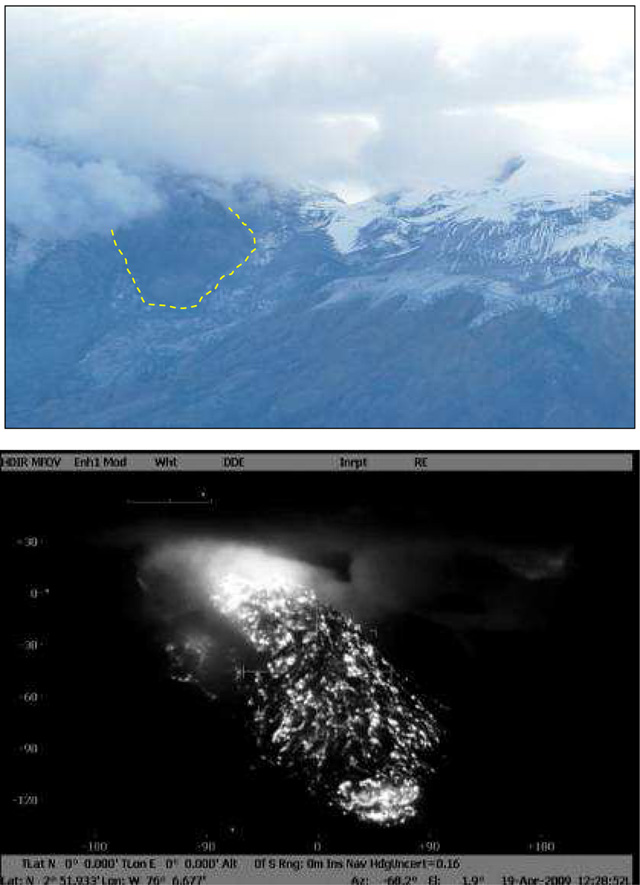 |
Figure 30. Photos taken on 19 April 2009 showed Nevado del Huila's active dome and the adjacent ash-covered and locally disturbed glacier. (top) In this visible-light view, the active lava dome has extended down the SW flank of Pico Central (yellow line). Cloud cover obscures the upper peaks of Pico Central (left) and Pico Sur (right). The glacier around Pico Central is difficult to distinguish due to ash cover and cracking attributed to dome emplacement. (bottom) This image is a close-up of the lava dome's SW flank with a forward-looking infrared (FLIR) camera which disclosed higher thermal flux from the dome's upper and lower regions. Gas emissions had been more concentrated from the higher region of the dome, however, the bright glow in this image may also be due to the reflective cloud-cover seen in the visible-spectrum image (top). Courtesy of FAC and INGEOMINAS. |
During May and June 2009, the dome's surface continued to produce thermal anomalies, and dome growth was inferred based on the observable fragmentation of dome rock and a wider distribution of fresh material. INGEOMINAS noted that the color of the extruded material in the higher region of the dome had changed to a red-brown color (earlier dome rock was distinctively gray).
On 23 July ashfall was reported at the local military base in Santo Domingo and José Jair Cuspian (Caloto). They reported ashfall in the NW sector of the volcanic edifice. INGEOMINAS reported that this ash event coincided with a pulse of tremor registered that day at 0442.
On 3 August there was a pulse of tremor at 0036 and INGEOMINAS received reports of ashfall in the municipalities of Toribío and Santander de Quilichao (~30 km and ~50 km W of the edifice, respectively). Aerial observations on 16 August established that the crater had grown wider.
During September 2009 there were no major changes observed via webcam. On 16 and 23 October, reports of widespread ashfall came from various municipalities of N Cauca, Valle del Cauca, and in the foothills around the volcano (departments of Cauca, Valle, Tolima, and Huila) (figure 31). There were also reports of sulfur odors from the most proximal communities.
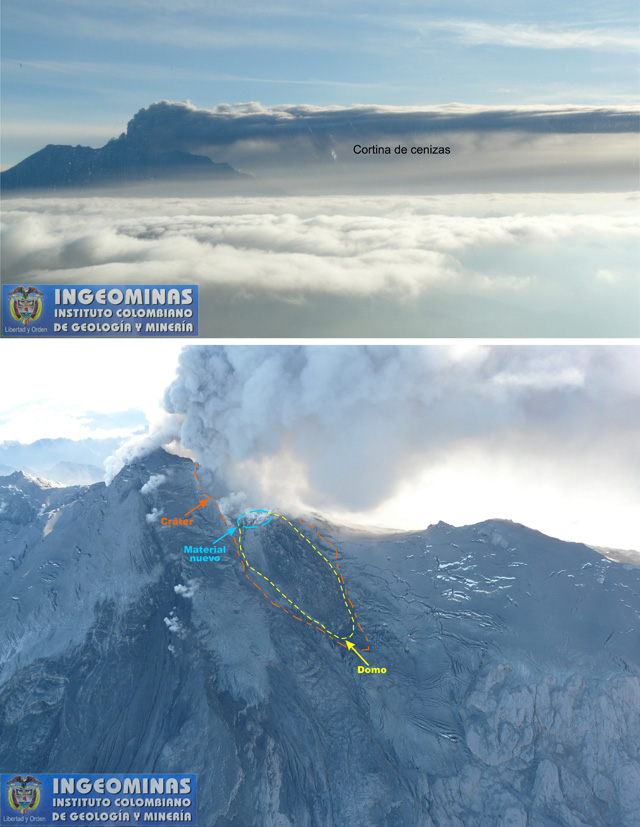 |
Figure 31. An ash plume from Nevado del Huila's newly-formed crater and fumarolic sites was observed from aircraft on 23 October 2009. (top) A dark curtain of ash ("Cortina de cenizas") drifted SE from Pico Central that day; the plume height was ~1,000 m above the crater. The Washington VAAC reported ash in satellite images at 1015 that day, and noted that the ash plume rose to 6 km altitude, was ~46 km long, and drifting SE at 5 m/s. (bottom) A closer view of the W flank highlights gas-and-ash plumes rising from the upper crater (orange outline) while isolated sites released white plumes, including the site on the N flank of Pico Central (at left) where steam from a fissure had been observed consistently since November 2007. The accumulation of newly erupted material was typically observed from the upper region of the dome (circled in blue); the extent of the dome is outlined with yellow. Ashfall had covered the snow and glaciers of Huila; however, cracks in the glacier remained visible as jagged black and white lines, particularly on Pico Sur (right-hand edge of photo). Courtesy of FAC and INGEOMINAS. |
At 0541 on 16 October 2009, the webcamera captured images of an ash plume rising in pulses from Pico Central and drifting E. Accordingly, the Alert Level was raised from Yellow (III) to Orange (II), where it stayed until 5 January 2010. An overflight on 23 October provided views of both intense fumarolic activity from the dome and a column of ash that reached up to 1,000 m above the crater. The summit and glaciers were covered by ashfall, lava extrusion was continuing from the upper region of the crater, and there were thermal anomalies where gas emissions were concentrated. An 11-minute-long episode of tremor that began at 0200 on 28 October was thought to signify dome rock extrusion.
Based on observations during overflights on 30 October and 2 November, INGEOMINAS calculated that the dome volume had increased by ~9 x 10⁶ m3 since the previous estimate in January 2009. Aerial observers saw ash emitted in pulses.
Rapid dome growth occurred in November as witnessed during five aerial investigations (2, 4, 6, 10, and 25 November). On 3 November, an explosion was heard and ashfall was reported by the communities of Inzá, Mosoco, Jambaló y Belalcázar, and other communities SW of the volcano. New layers of ash had accumulated around the summits of Huila, often appearing brown-red as opposed to the gray material deposited in previous months (figure 32). A weekly INGEOMINAS report announced that by 10 November 2009, the dome volume had increased by ~16 x 106 m3 since the previous estimate, more than doubling the amount of growth that had occurred during January-October 2009.
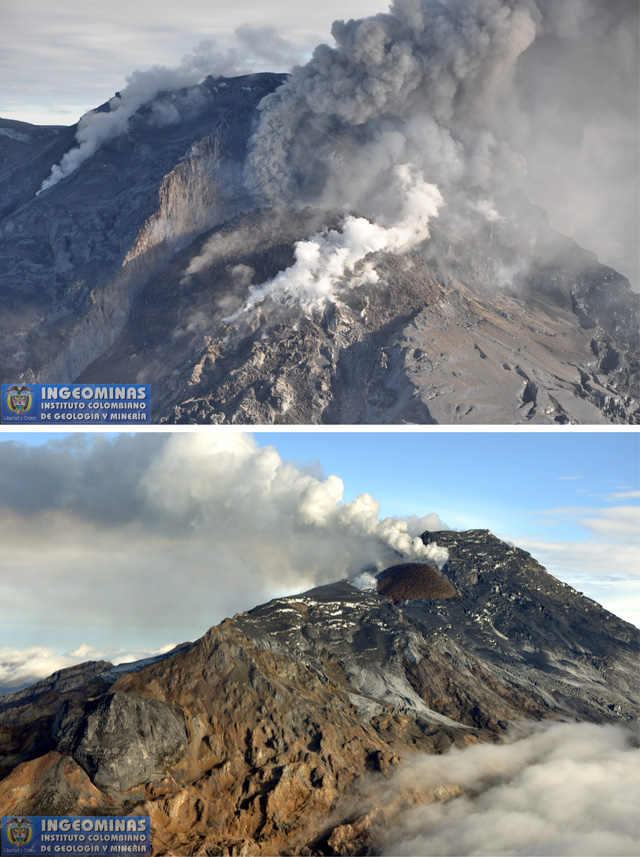 |
Figure 32. Aerial photos from November 2009 documented rapid changes on Nevado del Huila's Pico Central. (top) On 4 November INGEOMINAS observed additional ejecta surrounding the lava dome and elevated ash emissions. In this photo of the S face of Pico Central, steam and ash rise from the crater, and brown-red ash and blocks cover the glacier that surrounds the active dome. Dome rock extends from the center of Pico Central to lower elevations on the W flank. (bottom) This view of Nevado del Huila's SE flank on 25 November 2009 reveals the increased size of the lava dome which towers above Pico Sur, the rugged-looking peak centered in this view. Ash covered snow and glacial ice surrounds the immediate region of the dome while plumes of gas drift westerly. The dark gray, rounded peak to the lower left is Cerro Negro, the location of a seismic station that remained offline during this reporting period. Courtesy of FAC and INGEOMINAS. |
Gas emissions were observed by the webcamera at Tafxnú and during four overflights in December 2009; however, fumarolic activity dropped during the first week of December. Aerial observations determined that 2008 dome rock was being covered by 2009 lava that contained fewer large blocks; the 2008 dome material was distinctively more gray and blocky. During an overflight on 29 December, clear weather allowed INGEOMINAS scientists to observe minor dome collapse events, new cracks in the glacier along the lower E dome contact, and additional dome rock extending down the E flank.
In January 2010, dome growth continued and notably expanded the dome E by ~50 m, further displacing portions of the Pico Central glacier. Gray ash continued to be deposited in the area, covering the glacier surfaces. White plumes were observed this month during overflights and from the webcamera. On 5 January, INGEOMINAS reduced the Alert Level from Orange (II) to Yellow (III); this status was maintained until 15 June 2010.
On 22 February 2010, scientists on board an FAC helicopter noted displaced glacial ice, some steaming along the dome edge, and the surface textures of the 2008 and 2009 lava domes persisted (blocky vs. smaller clast sizes, respectively; figure 33). Based on aerial observations, INGEOMINAS calculated a total dome volume of at least 70 x 106 m3.
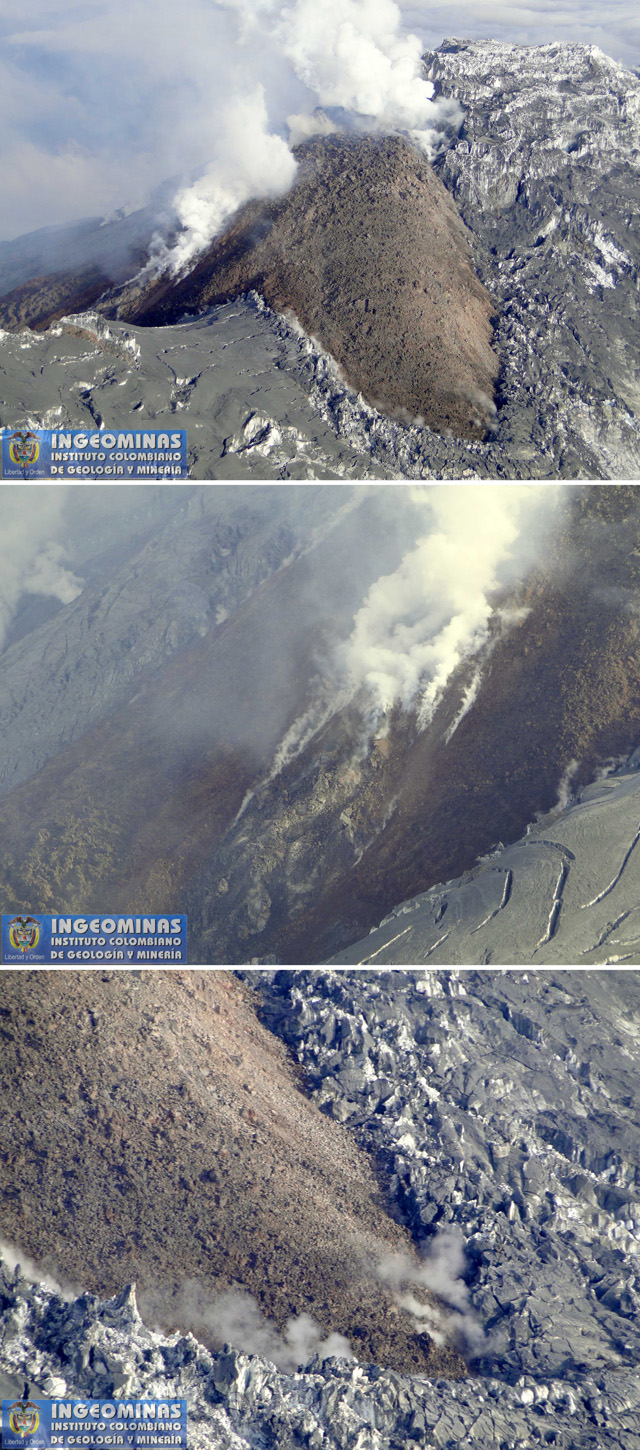 |
Figure 33. During an overflight on 22 February 2010, Nevado del Huila's active dome, displaced ice, and gas emissions were visible. Fresh volcanic material clearly began to extend W and E, divided by the long axis of the Huila complex. (Top) An aerial view of Pico Central's S-facing peak where the active dome was shedding material to the W and E. (Middle) Degassing dome rock is visible along the W flank. The blocky gray rock centered in this region was attributed to 2008 lava extrusion. (Bottom) New dome rock is in contact with the fragmented glacial ice on the E flank, and dome steaming is visible along the margin. Courtesy of FAC and INGEOMINAS. |
INGEOMINAS reported that on 12 April additional ash had accumulated on the glacier and lava extrusion was continuing. Columns of gas continued to be emitted from the surface of the new dome, at the contact of 2008 and 2009 lava, and from the crack that had formed in 2007 on the N flank of Pico Central.
No overflights were conducted in June, however the Alert Level was raised to Orange (II) due to increased seismicity, primarily hybrid earthquakes and SO2 emissions (see seismic and SO2 discussion below). INGEOMINAS suggested that the marked increase in hybrid earthquakes may have been linked with the ascent of new magmatic material within the volcanic edifice.
In July, degassing continued and intermittent, small ash emissions were observed toward the end of the month by the ground-based cameras Tafxnú and Maravillas. By 16 July, INGEOMINAS reduced the Alert Level to Yellow (III), due to the reduction in seismicity and SO2 flux, where it remained through August. The Washington VAAC reported possible ash plumes drifting from Huila during 28-30 of July but an absence of such plumes during August.
A 19 August flight revealed that snow had accumulated on the dome. INGEOMINAS noted that some episodes of tremor were likely related to the process of lava dome extrusion and these conditions did not show wide variations in August. Minor ash emissions were reported toward the end of the month. The Maravillas camera detected incandescence on 26 and 29 August, possibly from hot rockfalls from the lava dome.
A pulse of tremor on 30 August at 0635 coincided with ash emissions also observed by the Tafxnú camera. In the afternoon that day, people in the town of Toribío (~30 km W) noted an ash plume. There was also a report that the Símbola River changed color due to the presence of ash. The VAAC noted a hotspot at the summit in satellite images on 31 August.
During September, webcameras imaged plumes of gas as well as gray and reddish-colored emissions attributed to volcanic ash. These plumes were not visible in satellite imagery; however, the Washington VAAC released two notices on 9 September in response to reports from INGEOMINAS that ground-based observations included continuous emissions of gases and some ash.
During the first week of September, the Maravillas webcamera and local populations observed incandescence from the active dome; INGEOMINAS attributed the activity to hot rockfalls on the dome. On 9 September, INGEOMINAS raised the Alert Level to Orange (II); seismicity (particularly energetic tremor) and frequent incandescence were considerations for this announcement. On 9 September, both webcameras captured images of ash and incandescence. On 10 September, drumbeat earthquakes (earthquake signatures related to dome extrusion) had appeared in the seismic records. The last time that drumbeat earthquakes had been detected from Huila was in November 2008 (BGVN 37:10). By 21 September, INGEOMINAS announced that 1,799 drumbeat earthquakes had been detected over the past 13 days.
An overflight on 15 September determined that conditions at the dome were continuing to change; extrusion continued from the highest part of the dome (near the contact with the crater wall). They also observed a debris flow containing rocks and ice that had originated from the edge of the dome and had traveled ~1.5 km down the E flank (figure 34). By the end of the month, gas emissions continued and incandescence was observed by the webcameras.
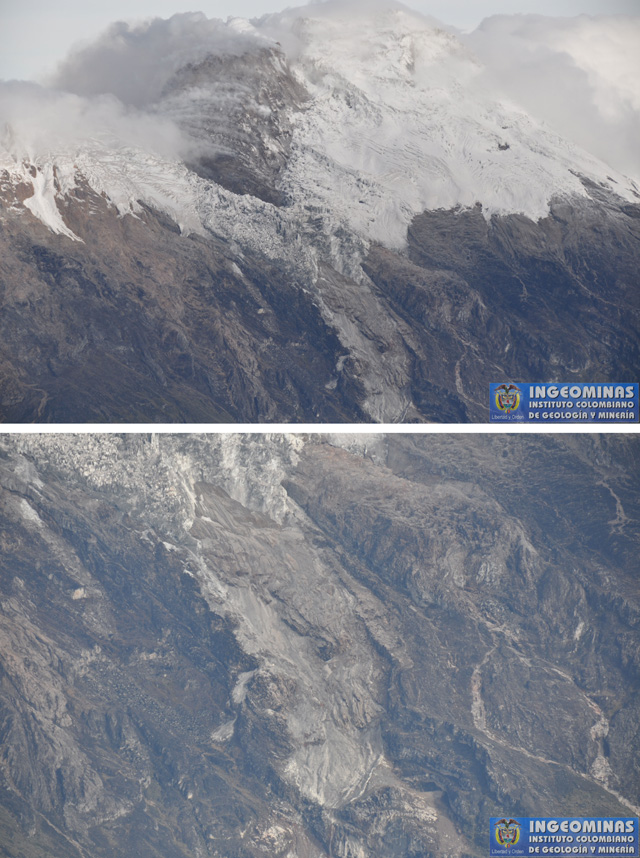 |
Figure 34. On 15 September 2010 INGEOMINAS observed debris flows along the E flank of Nevado del Huila. (top) Snow had visibly collected on the active dome that continued to degass and displace the glacier. Near the dome, the glacier was notably fragmented and discolored due to overlying debris and ash. (bottom) This view is a closeup of the area below the fragmented glacier on Huila's E flank. The extent of the debris flow is visible as a 1.5 km long trace of gray material that had incorporated blocks of ice and rocks. Courtesy of FAC and INGEOMINAS. |
Aerial observations on 29 September, 1 October, and 4 November confirmed ongoing dome growth. On 1 October, the VAAC reported ash drifting from the summit. On 12 October, INGEOMINAS reduced the Alert Level to Yellow (III); they stated that conditions appeared to have stabilized, in particular local seismicity and gas-and-ash emissions. The webcameras continued to capture images of white gas emissions during the second week of October. White plumes and some incandescence were visible in October. Thermal images from 4 November found that the W-central dome's temperature was 250°C. On 11 November the Washington VAAC reported ash drifting from the summit.
Observations during January-December 2011. The webcameras continued to record images of white plumes rising from the Pico Central dome throughout 2011. Aerial observations during the year noted frequent gas emissions and infrequent ash plumes. During an overflight on 25 January, a FLIR camera detected temperatures up to 90°C from various locations on the dome (figure 35). During an overflight on 29 March, observers noted degassing and odors of sulfur.
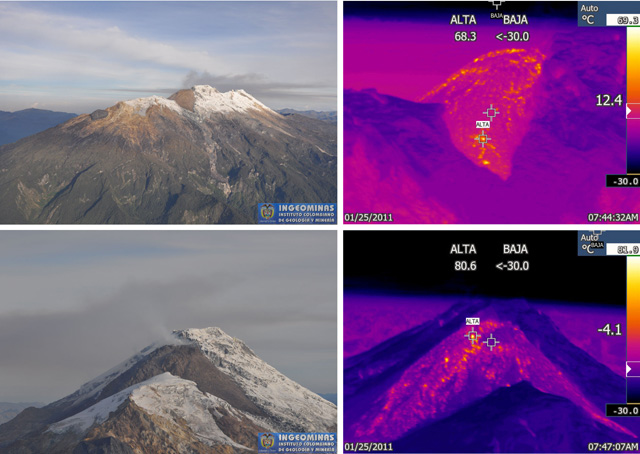 |
Figure 35. In these photo pairs taken during an overflight on 25 January 2011, INGEOMINAS measured surface temperatures of Nevado del Huila's lava dome. (top) These photos are centered on the E flank of Huila. The thermal image is zoomed in on the brown-colored lava dome that continued to steam and degass, forming a small plume rising above Pico Central. For the dome, the minimum ("BAJA") and maximum ("ALTA") temperatures were less than 30 and 68.3°C, respectively. (bottom) These photos are viewing the S-facing Pico Central with the lava dome (centered). Gas emissions were rising from the highest region of the dome and the minimum and maximum temperatures were less than 30 and 80.6°C, respectively. Courtesy of FAC and INGEOMINAS. |
On 19 April, the Washington VAAC reported that an ash plume was detected in enhanced multispectral imagery at 0315. The plume was drifting NNW from Huila. The announcement included a note that the ash plume did not appear to be the result of an explosive event. Later that day, after sunrise, INGEOMINAS confirmed that low seismicity was detected, a white plume was visible, but ash emissions were absent.
Aerial observations on 26 April included intense degassing from the NW side of the lava dome; the emissions were gray. A thermal camera detected temperatures of the dome in the range of 78-83°C. The glacier also appeared to have further deformed since the last aerial observations in March.
In May, degassing was observed with the webcameras on days where weather conditions permitted clear views. On 6 and 20 June, scientists confirmed that degassing continued during an overflight; they also observed the accumulation of snow on the lava dome as well as on the surrounding glacier. On 20 June, notable rockfalls were visible from the lava dome that contributed to scree along the dome's lower edges.
Degassing continued to appear in clear webcamera views and during overflights in June-July and September-December. Aerial observers on 22 October saw snow avalanches on the Pico Norte glacier and intense steaming from the upper regions of the dome.
Observations during January-December 2012. Throughout 2012, INGEOMINAS recorded observations of the dome based primarily on webcamera images. No major changes were noted in the weekly and monthly online reports; pervasive steaming and white plumes were frequently observed throughout the year by the two webcameras (Tafxnú and Maravillas). INGEOMINAS maintained Yellow Alert (III) during 2012.
One overflight was conducted by INGEOMINAS in 2012. On 14 January 2012, scientists observed the usual degassing and noted that snow had collected on the dome and glacier. That day's clear viewing conditions allowed detailed observations of the lava dome texture and INGEOMINAS attributed the spiny texture of the dome to late-stage extrusion (figure 36).
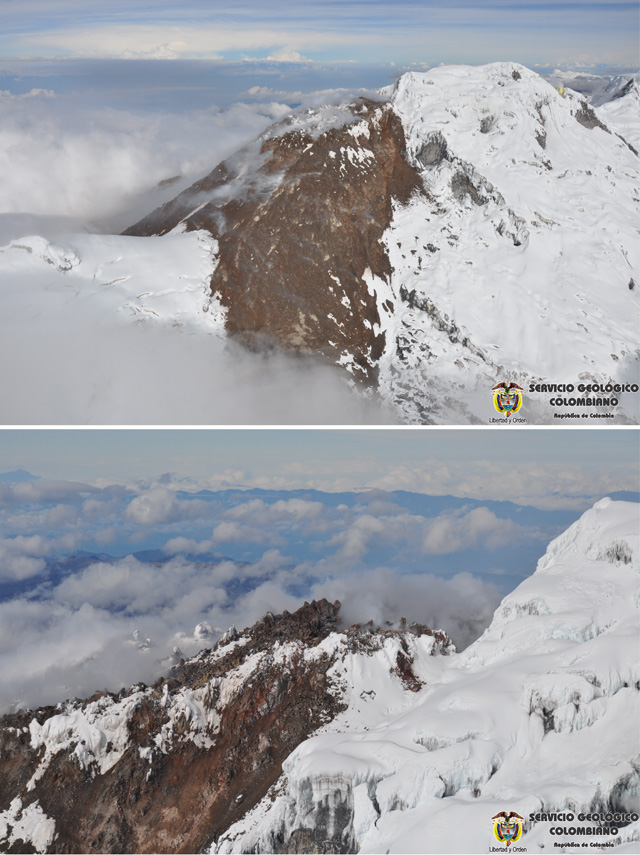 |
Figure 36. On 14 January 2012, clear conditions provided aerial views of Nevado del Huila's lava dome texture. (top) This view of the dome's SE face is centered on the part of the lava dome that had started to accumulate snow cover. Steaming was visible from some regions of the dome but a strong plume was not visible during this overflight. (bottom) INGEOMINAS noted that the higher region of the dome had distinguishable spines that may have formed recently. Courtesy of FAC and INGEOMINAS. |
Declining seismicity during January-August 2009. During 2009, four seismometers (two broadband and two short-period stations) were maintained by INGEOMINAS. Ash emissions in October 2009 temporarily disabled the short-period Verdún 2 station, located ~5 km N of the active dome. The Cerro Negro short-period station, closest to the active dome, was not operating during this reporting period (2009-2012). In general, three to four seismic stations were operating during 2009-2012.
In 2009, a total of nine earthquakes were large enough for people nearby to feel shaking; these events had magnitudes between 2.8 and 4.8 with focal depths between 6.2 and 12 km. The epicenters were 3-25 km away from the closest seismic station, CENE, which was located ~3 km S of Pico Central. INGEOMINAS highlighted these earthquakes in their monthly technical bulletins.
From January to September 2009, INGEOMINAS reported a decreasing trend in seismicity. In particular, volcano-tectonic (VT) and long period (LP) earthquakes were becoming less frequent on a monthly basis (figure 37). INGEOMINAS described VT earthquakes as resulting from rock-fracturing events, and LP earthquakes from fluid transport processes within the volcanic edifice. Large daily counts of LP earthquakes generally became less frequent over time. Low levels of tremor, hybrid events, and superficial activity (rockfalls and explosions) were detected throughout this time interval.
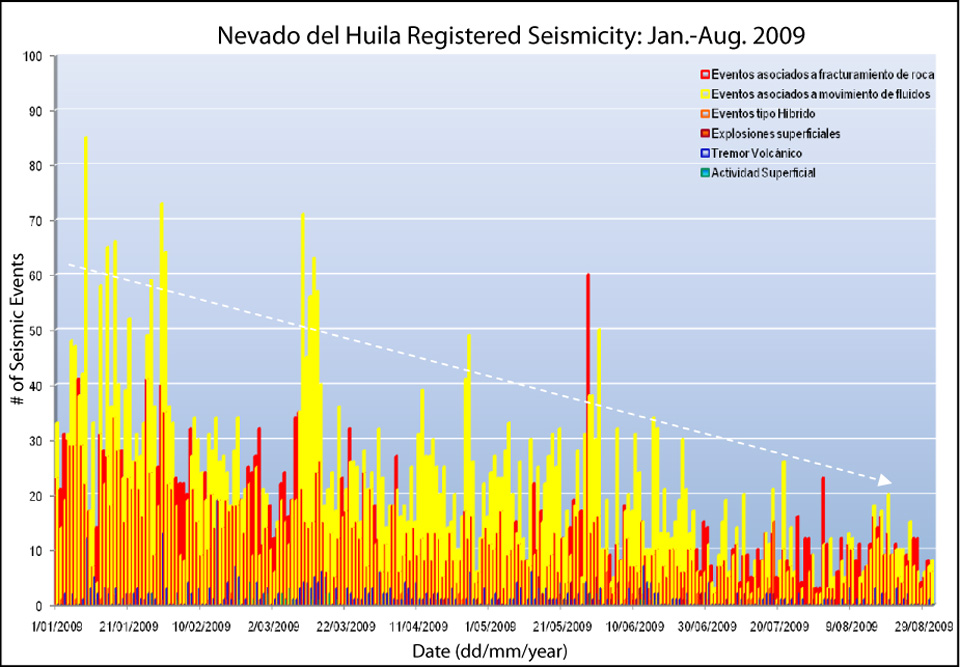 |
Figure 37. Nevado del Huila's seismicity, in particular VT, LP, and tremor earthquakes, decreased overall during January-August 2009. In this plot, the number of events were tallied per day and plotted over time. The legend in the upper right-hand corner lists terminology in Spanish that relates to these conventions: VT (red), LP (yellow), hybrid (orange), explosions (red with black outlines), tremor (blue), and surface activity such as rockfalls (green). Explosions were detected during this time period, but are difficult to read from this plot. Explosions were detected mainly in June and July; see previous subsection "Observations of dome growth and summit activity during 2009-2010" for descriptions of explosive activity. Courtesy of INGEOMINAS. |
Clustered epicenters in 2009. Beginning in January 2009, INGEOMINAS described a clustering of seismicity notable in distinct regions of the volcanic edifice. These consisted of three regions, the SW sector, the SE sector, and beneath the central edifice (Pico Central). This pattern was particularly clear in June, October, and December. The June 2009 map of seismicity appears in figure 38. The deepest earthquakes (8-12 km) tended to occur S of the edifice while shallow events were distributed throughout the area. Several deep and distal earthquakes occurred each month with depths between 10-20 km and epicenters up to 25 km from the edifice; these events have been attributed to regional faults.
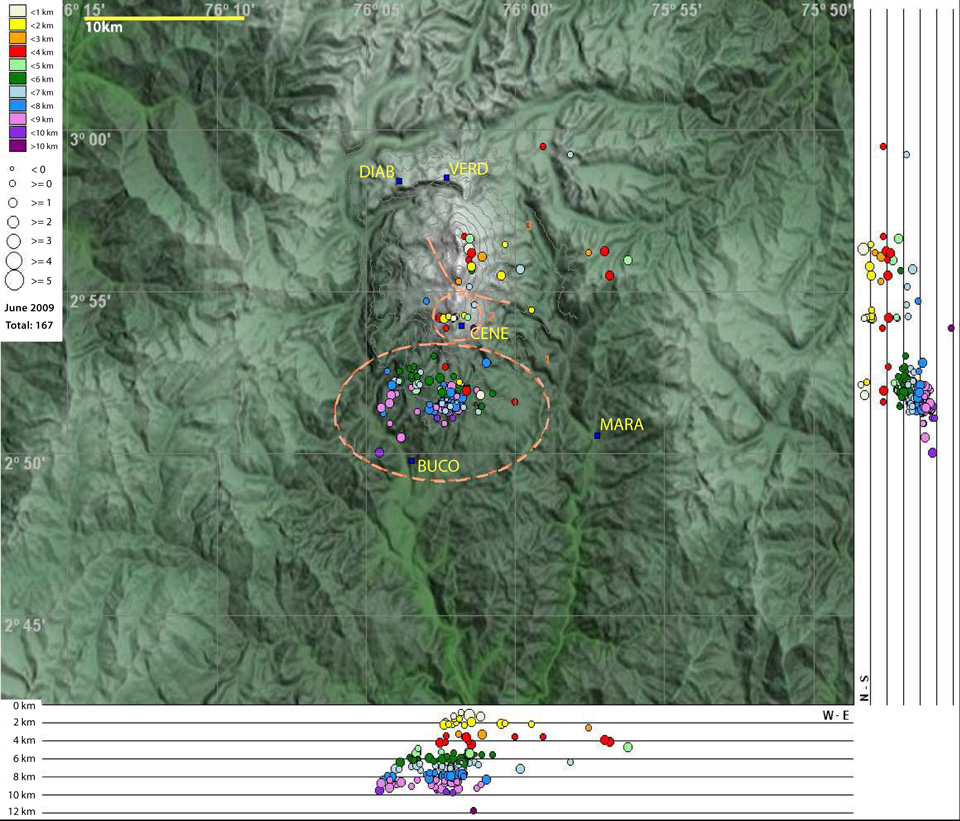 |
Figure 38. A map with cross-sections plotting epicenters and hypocenters of volcano-tectonic and hybrid earthquakes during June 2009 at Nevado del Huila. Three zones of clustered activity took place beneath the volcanic edifice (dashes lines). Note the yellow bar for scale (10 km) and the yellow text labeling five seismic stations (marked with blue squares). Four stations were operating; Cerro Negro (CENE) was offline during this reporting period. The active summit area of Pico Central is ~3 km N of the CENE station. Courtesy of INGEOMINAS. |
Peaks in seismicity and ash emissions between October 2009 and May 2010. INGEOMINAS reported an abrupt increase in seismicity in October 2009. The occurrence of VT, LP, hybrid, and tremor events had more than doubled since September. On 12 October, a swarm of VT events was detected (figure 39). During the onset of elevated seismicity, INGEOMINAS reported ash emissions during 17-21 October and the Washington VAAC released reports of ash observations from satellite imagery on 16 October.
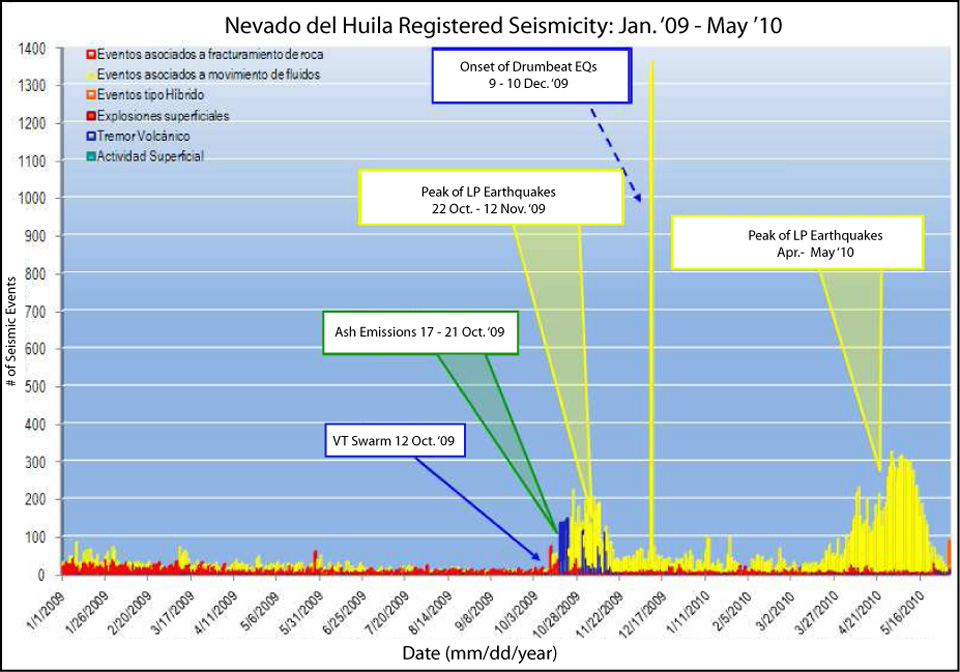 |
Figure 39. Seismicity from January 2009 through May 2010 detected from Nevado del Huila included notable peaks in LP earthquakes. In their May 2010 report, INGEOMINAS noted that tremor had been recorded continuously throughout January-May. The legend in the upper left-hand corner lists VT (red), LP (yellow), hybrid (orange), explosions (red with black outlines), tremor (blue), and surface activity such as rockfalls (green). Explosions were detected during this time period, but are difficult to read from this plot. Courtesy of INGEOMINAS. |
The appearance of volcanic ash in satellite images was periodically reported by the Washington VAAC from October through mid-November 2009. Aided by the web-camera Tafxnú, INGEOMINAS reported observations of ash plumes frequently occurring through November.
The Washington VAAC reported that, after 15 November 2009, volcanic ash was no longer visible in satellite images. In their monthly technical report, INGEOMINAS noted seismic signals suggesting ash emissions in December 2009, and visual observations of white plumes from the summit that were inferred to be gas-rich. As seen on figure 39, LP events peaked dramatically during 9-10 December when signals characterized as drumbeats were detected (see BGVN 37:10 for additional descriptions of drumbeat earthquakes). INGEOMINAS suggested the onset of drumbeat earthquakes was associated with the extrusion of new material to the surface and growth of the lava dome.
INGEOMINAS reported an average of 995 LP earthquakes per month during January-March 2010. VT events tallied on a monthly basis averaged 239 during that same time interval, suggesting an absence of discernible major changes in the volcanic system since the drumbeat earthquake swarm in December 2009. Tremor was detected more frequently over time and from February to May an average increase of 37 events per month was recorded.
As seen at the right on figure 39, during April-May 2010, very high LP seismicity returned. LP earthquakes peaked in May, with a total of 5,141 events. During April-May, the Washington VAAC released advisories in response to possible ash plumes from Huila, however, they did not detect ash due to frequent cloud cover, and because numerous reports indicated eruptions at night, when satellite instruments offer fewer means of detecting ash.
An ML 3.8 earthquake shook the towns of Toéz and Tálaga (15 km SSW and 22 km S respectively) at 0708 on 23 May. These towns are located SW of Pico Central. The earthquake was located 8.13 km SW of Pico Central and was 7.2 km deep (relative to the elevation of the active crater).
Seismicity and ash observations during June-December 2010. In June, direct observations of ash plumes were rare due to weather conditions; however, the Washington VAAC reported ash visible in satellite imagery on 2 June 2010. While LP seismicity remained low in early June 2010, hybrid seismicity emerged from background levels (figure 40). During January-May, typically 3-34 hybrid earthquakes were detected per month. By 14 June, more than 200 hybrid events were occurring per day; however, by 24 June, hybrid earthquakes had decreased to less than 50 events per day. Hybrid earthquakes, events INGEOMINAS attributes to the combined mechanisms of fluid transport and rock fractures, rarely dominate Huila's seismic records.
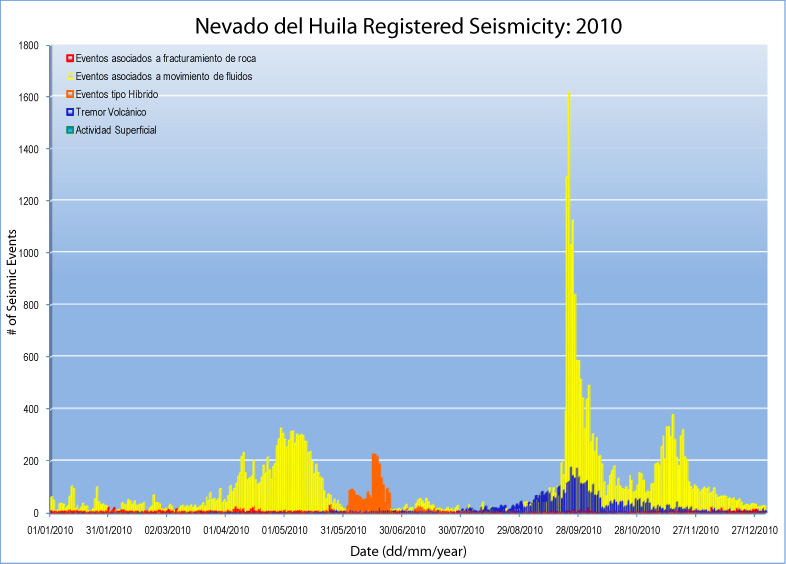 |
Figure 40. Seismicity from Nevado del Huila during 2010 included peaks of LP, VT, and tremor episodes. The legend in the upper left-hand corner lists VT (red), LP (yellow), hybrid (orange), explosions (red with black outlines), tremor (blue), and surface activity such as rockfalls (green). Explosions were detected during this time period, but are difficult to read from this plot. Courtesy of INGEOMINAS. |
As seen on figure 40, during August-November 2010, elevated tremor persisted (630-2,576 episodes per month). LP seismicity peaked in May and then twice between September and December. For the tallest peak (September 2010), counts reached more than 1,000 events per day.
On 3 December at 2054 a felt M 3.4 earthquake within the Páez River drainage centered 6.2 km S of Pico Central had a relatively shallow focal depth of 5.2 km (as measured beneath the crater). Another felt earthquake was reported by residents in the Belalcázar-Cauca area on 29 December. This ML 2.9 event occurred at 2106 with a focal depth of 8 km, located 8.5 km SW of Pico Central. This earthquake lacked any noticeable effect on the stability of the volcanic system.
Seismicity in 2011. In 2011, INGEOMINAS noted that both LP earthquakes and tremor were decreasing over time (figure 41). Tremor persisted at low levels. In June VT and LP earthquakes notably increased to 434 and 623 events, respectively, but returned to background levels during the following month.
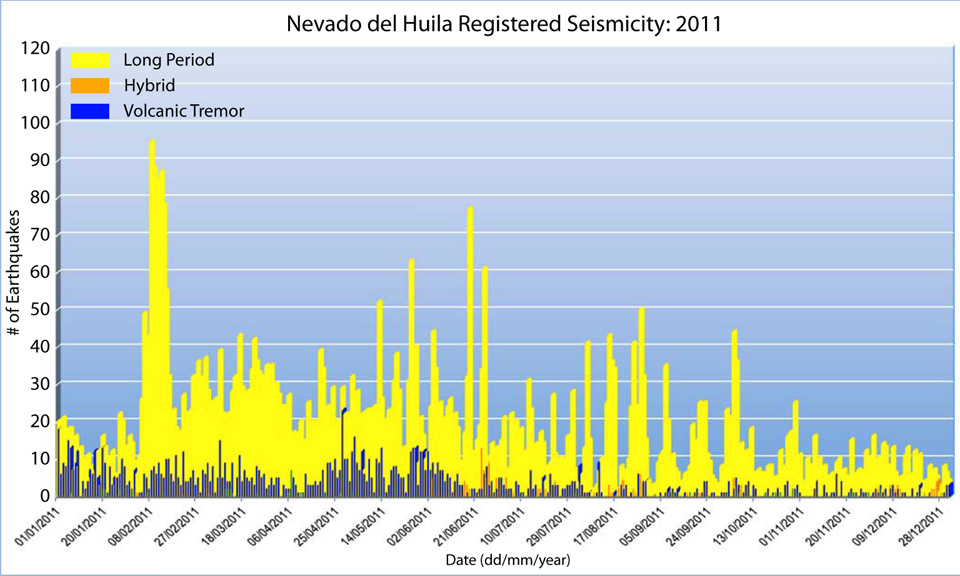 |
Figure 41. This plot of Nevado del Huila's seismicity during January-December 2011 shows a general decline in seismicity. This plot excludes VT earthquakes, highlighting instead the daily count of LP, hybrid, and tremor events. Courtesy of INGEOMINAS. |
In November 2011, several moderate earthquakes (M≤4) struck near Huila. In particular, three events had magnitudes 2.8, 3.2, and 4.0. For example, on 26 November, inhabitants of Mesa de Toéz felt an M 4.0 event whose epicenter was 8.5 km SW of Pico Central with a depth of 7.4 km (as measured below the crater). VT epicenters in November were widely distributed throughout the edifice and local region (figure 42). Depths of these earthquakes were within the range of past VT earthquakes (0-12 km). Persistent seismicity SW of Huila also continued in November.
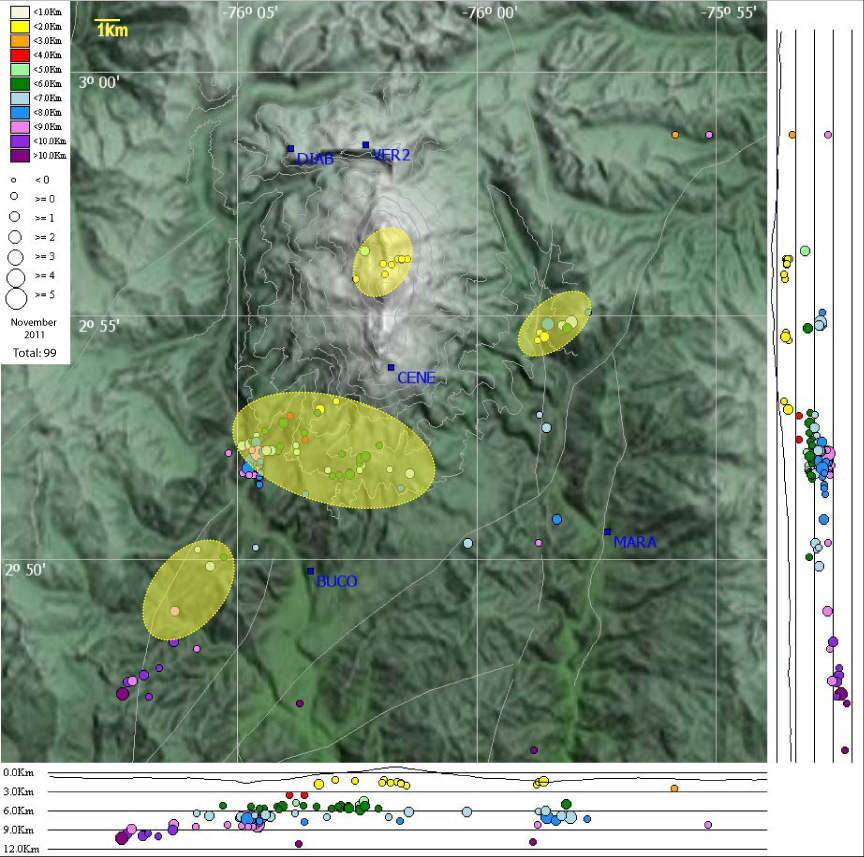 |
Figure 42. A map and cross-sections showing Nevado del Huila's VT epicenters during November 2011. The active dome is ~3 km N of CENE. INGEOMINAS noted four areas where seismicity was clustered (yellow shaded ovals). Note that the largest highlighted region has been an area of persistent seismicity throughout the year (for example, see figure 38). Seismic stations are marked with blue squares and labels (DIAB, VER2, CENE, BUCO, and MARA). Courtesy of INGEOMINAS. |
Seismicity in 2012. The low-level seismicity observed in the last months of 2011 continued through 2012. In a comparison with 2011, the average number of events per year was remarkably reduced in 2012 (VT, LP, and tremor); hybrid earthquakes, however, were the exceptions. The average for hybrid earthquakes per month was slightly higher in 2012 (table 4). Hybrid earthquakes were quite variable in number during 2011, ranging from 0 to 60 per month.
Table 4. Monthly counts for volcanic-tectonic, long period, tremor, and hybrid events detected at Nevado del Huila during 2011-2012. More event types and data appear in INGEOMINAS online reports. Courtesy of INGEOMINAS.
| Month | Volcanic-tectonic | Long-period | Tremor | Hybrid |
| Jan 2011 | 284 | 388 | 220 | 2 |
| Feb 2011 | 217 | 1,064 | 154 | 15 |
| Mar 2011 | 217 | 876 | 168 | 13 |
| Apr 2011 | 168 | 634 | 152 | 0 |
| May 2011 | 136 | 729 | 220 | 0 |
| Jun 2011 | 434 | 623 | 128 | 60 |
| Jul 2011 | 165 | 416 | 77 | 25 |
| Aug 2011 | 143 | 491 | 51 | 32 |
| Sep 2011 | 137 | 304 | 27 | 8 |
| Oct 2011 | 110 | 371 | 50 | 13 |
| Nov 2011 | 176 | 219 | 32 | 2 |
| Dec 2011 | 164 | 195 | 32 | 34 |
| 2011 Avg: | 196 | 526 | 109 | 17 |
| Jan 2012 | 155 | 245 | 27 | 28 |
| Feb 2012 | 111 | 159 | 12 | 18 |
| Mar 2012 | 145 | 200 | 27 | 21 |
| Apr 2012 | 154 | 244 | 19 | 21 |
| May 2012 | 87 | 200 | 34 | 13 |
| Jun 2012 | 121 | 183 | 11 | 18 |
| Jul 2012 | 109 | 208 | 14 | 16 |
| Aug 2012 | 118 | 178 | 15 | 30 |
| Sep 2012 | 93 | 172 | 5 | 14 |
| Oct 2012 | 168 | 257 | 18 | 23 |
| Nov 2012 | 171 | 205 | 9 | 14 |
| Dec 2012 | 158 | 227 | 26 | 32 |
| 2012 Avg: | 133 | 207 | 18 | 21 |
The wide distribution of epicenters noted in November and December 2011 persisted during January-February 2012, but fewer earthquakes were detected during these months. From March through December, significant clustering was absent, although, in October some events appeared concentrated along Huila's N-S axis.
The largest earthquake in 2012 occurred in March; a 3.8 earthquake shook the town of Toribio (in Cauca) at 0248 on 15 March. The epicenter was 1.8 km E of Pico Central with a focal depth of approximately 3.2 km. Seismicity that month was slightly higher than February (table 4). Throughout the year, VT earthquakes were typically less than M 2.6.
Infrasound monitoring 2009-2012. Augmenting seismic monitoring efforts, an infrasound station installed at the Diablo monitoring site (located ~5 km NNW of the active dome) became operational in July 2009. An additional acoustic monitoring system was installed at the Caloto station (located ~3.7 km from the active dome) in May 2012. Data collected with infrasonic microphones complements seismic instrumentation and can be analyzed with similar techniques. The method has also detected distant explosions from volcanoes such as Sakura-jima, Japan (BGVN 20:08), Fuego, Guatemala (BGVN 36:06), and Stromboli, Italy (BGVN 26:07).
Sulfur dioxide emissions during 2009-2012. INGEOMINAS conducted routine sulfur dioxide (SO2) gas monitoring with differential optical absorption spectroscopy (DOAS) equipment from January 2009 through December 2012. With this mobile scanner, INGEOMINAS conducted traverses along the Pan-American Highway between the cities of Calí and Popayán (figure 43).
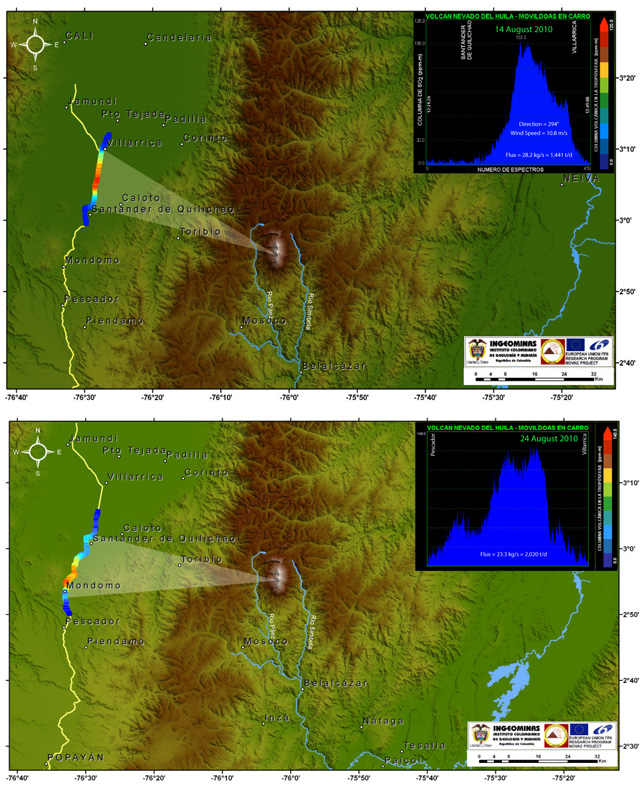 |
Figure 43. On 14 and 24 August 2010, INGEOMINAS technicians traversed routes along the Pan-American Highway with mobile DOAS equipment to measure Nevado del Huila's SO2 gas fluxes. These images include color-coded line segments that correspond to high and low concentrations (red and blue, respectively). The approximate locations of the plume have been shaded to correspond with the locations of high SO2 flux. The plots shows the wavelength on the x-axis and concentration-pathlength (ppm-m) on the y-axis. (Top) This image includes the mapped route between the towns of Santander de Quilichao and Villarrica where the gas plume was scanned on 14 August. The wind speed was 10.8 m/s, wind direction was 294°, and SO2 flux was 28.2 kg/s (1,441 t/d). (Bottom) This image includes the results from 24 August when field technicians traversed routes between Pescador and Villarrica. SO2 flux was 23.3 kg/s (2,020 t/d); wind speed and direction were not reported. Courtesy of INGEOMINAS. |
Scanning DOAS systems at fixed locations were operating during 2009-2012. During October 2009, elevated SO2 emissions were detected by the Calí and Santander de Quilichao stations (figure 44). In September 2009, a station was operating in Manantial (~53 km W of Huila).
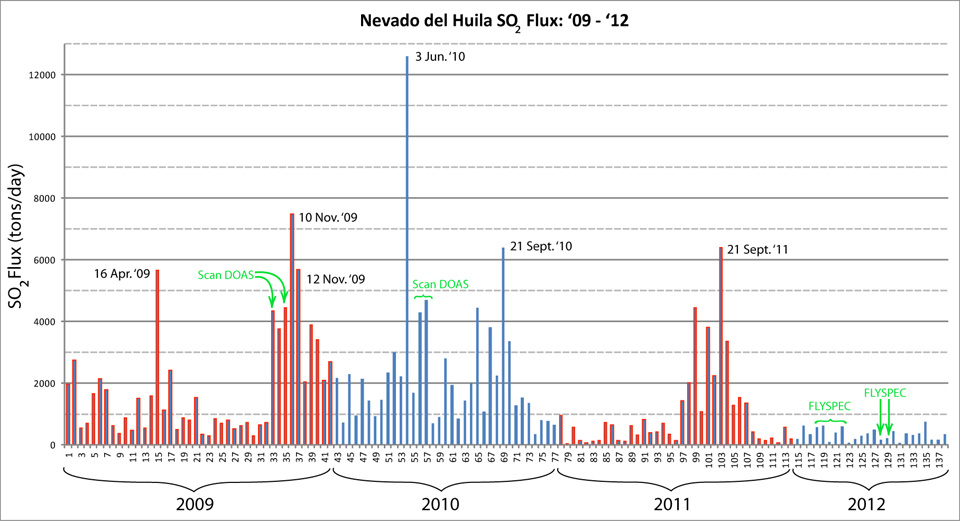 |
Figure 44. During 7 January 2009-27 November 2012, INGEOMINAS measured the SO2 flux from Nevado del Huila in a series of numbered campaigns (x-axis). A total of 137 values were reported from three detection methods, scan DOAS stations (corresponding to numbers 33 and 35 dating from October 2009, and 55-57 dating from June 2010), FLYSPEC (numbers 118-122 dating from May 2012, and 128 and 129 dating from August 2012), and mobile DOAS (all other values). Red and blue highlighting distinguishes the datasets from each year. SO2 detection was conducted several times each month and the maximum value from each measurement was reported. Courtesy of INGEOMINAS. |
Wind velocity has a strong bearing on the computed SO2 flux. In their December 2011 technical bulletin, INGEOMINAS discussed the variability in windspeed and direction, including the Weather Research and Forecasting (WRF) modeling system used for calculations during 2011 (figure 45). The WRF was public domain software available online and was developed in order to provide atmospheric simulations based on numerical modeling.
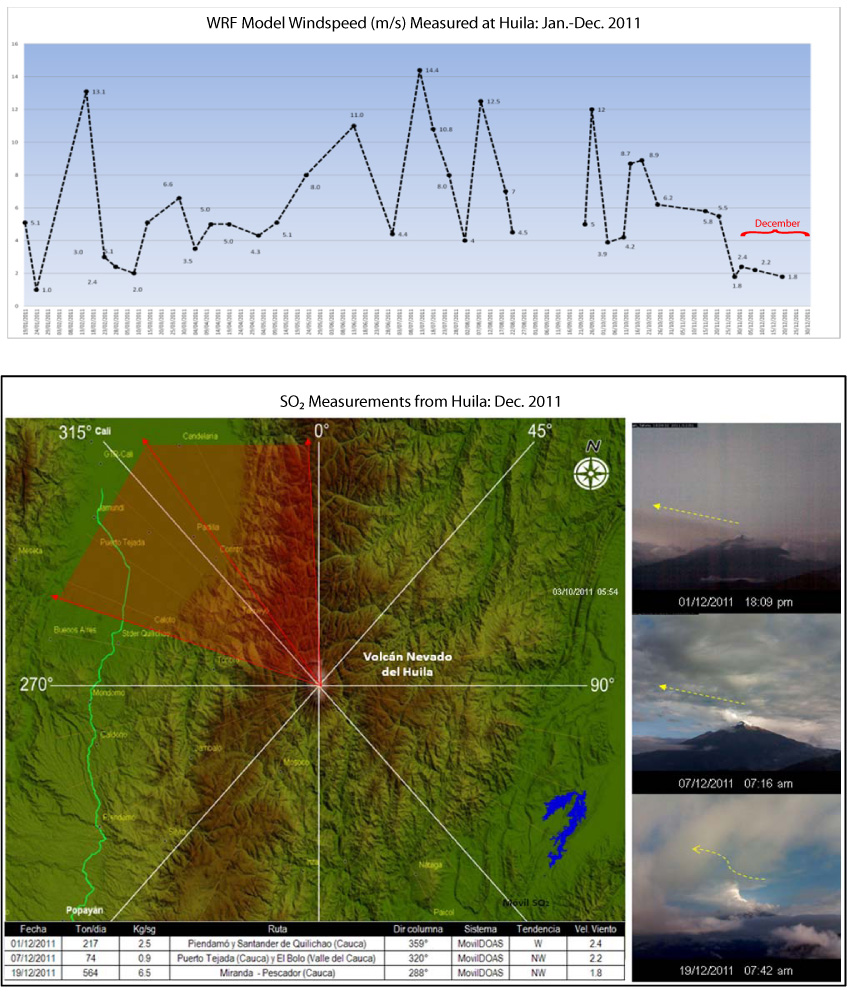 |
Figure 45. INGEOMINAS released the source of their windspeed data used for SO2 flux calculations in their December 2011 technical report. (top) This plot shows the datapoints used throughout 2011 for windspeed values determined by the WRF Model. (bottom) These images show a map of the expected aerial extent of the gas plume, a series of photos showing plume conditions during the SO2 surveys, and a table of the measurements from three surveys in December. Courtesy of INGEOMINAS. |
In May and August 2012, INGEOMINAS reported the results from FLYSPEC (a portable UV spectrometer) surveys and discussed the variations observed in SO2 flux. They emphasized that SO2 fluxes were low, a finding consistent with previous measurements during this post-crisis period (dome growth had ceased by November 2009). They also mentioned that seismicity had been low in May 2012, particularly in those events related to fluid motion (LP earthquakes, for example).
Flux calculations required wind speed data from the WRF models and daily forecasts from the Institute of Hydrology, Meteorology, and Environmental Studies (IDEAM), Colombia. Wind speeds in the range of 6-12 m/s during 8-29 May 2012 were applied to SO2 flux calculations.
Elevated SO2 emissions from Huila were detected almost daily by the OMI spectrometer during 2009-2012. The AURA satellite maps SO2 in the atmospheric column using ultraviolet solar backscatter. A flux can be estimated for the OMI spectrometer data by looking at the total mass of SO2 measured and the time it took to accumulate. On this basis, INGEOMINAS compared peaks in SO2 flux detected during traverses with DOAS (mobile and scanning) with OMI data for October 2009 (figure 46).
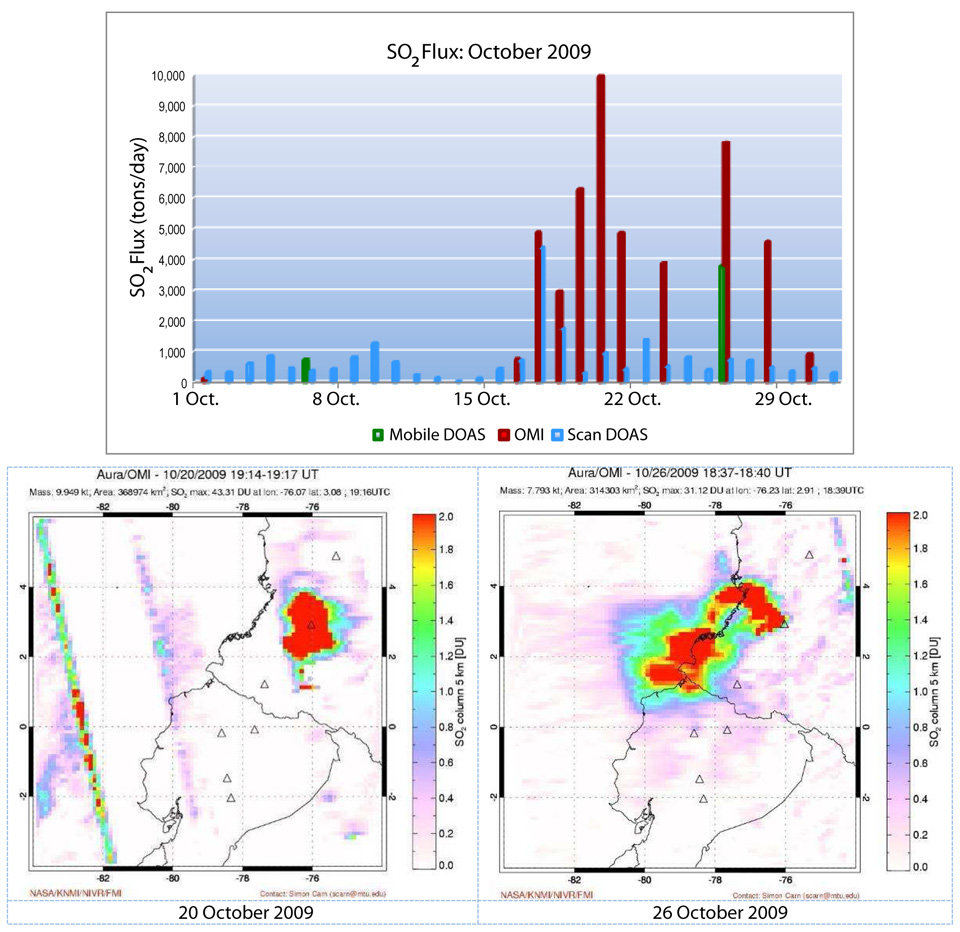 |
Figure 46. In October 2009, elevated SO2 flux was detected from Nevado del Huila by three remote sensing techniques. (Top) The plotted values show combined datasets from mobile DOAS, OMI, and scan DOAS. (Bottom) The OMI spectrometer on the AURA satellite detected 9.95 kt of SO2 on 20 October 2009 (left) during its pass at 2414-2417 local time (coverage area of 368,974 km2, recording a maximum value of 43.3 Dobson Units (DU)). On 26 October 2009 (right) it detected 7.79 kt of SO2 during its pass at 2337-2340 local time (coverage area of 314,303 km2, recording a maximum value of 31.12 DU). Courtesy of INGEOMINAS and Simon Carn, Michigan Technological University and Joint Center for Earth Systems Technology, University of Maryland Baltimore County. |
Lahar investigations. INGEOMINAS maintained seven early warning systems to warn of downstream flooding in vulnerable municipalities such as Belalcázar. At sites within the drainages of the Páez and Símbola rivers, flow monitoring with geophones has continued since October 2006, employing equipment installed by the INGEOMINAS Popayan Observatory in collaboration with the Nasa Kiwe Corporation (CNK). CNK is a relief group that has been active in this area of Colombia since the 1994 earthquake and resultant landslides that devastated the Cauca and Huila regions, including communities along the Páez river (BGVN 19:05). Those events also damaged the Tierradentro archaeological sites, a UNESCO World Heritage Site since 1995.
Following Huila's 2007 lahars (BGVN 33:01), Worni and others (2012) conducted fieldwork and reconstructed events in order to model future lahars for mitigation purposes. The researchers argued that large-volume lahars (tens to hundreds of millions of cubic meters) require targeted studies. The authors noted that "in 1994, 2007, and 2008, Huila volcano produced lahars with volumes of up to 320 million m3." To constrain the dimensions of simulated flows, they used inundation depths, travel duration, and observations of flow deposits from the April 2007 events and applied the two programs LAHARZ and FLO-2D for lahar modeling.
LAHARZ was developed by USGS scientists in order to provide a deterministic inundation forecasting tool; this program was designed to run in a Geographic Information System (GIS) environment (Schilling, 1998; Iverson and others, 1998). "For user-selected drainages and user-specified lahar volumes, LAHARZ can delineate a set of nested lahar-inundation zones that depict gradations in hazard in a manner that is rapid, objective, and reproducible" (Schilling, 1998). Worni and others (2012) presented results from the semi-empirical LAHARZ models along with physically-based results from FLO-2D (FLO-2D Software I, 2009) in order to forecast future inundation areas with specified flow volumes (figure 47). The authors concluded that, despite local deviations, the two models produced reasonable inundation depths (differing by only 10%) and encouraged future investigations that could address sources of uncertainty such as the effects of sediment entrainment that would cause dynamic changes in lahar volumes.
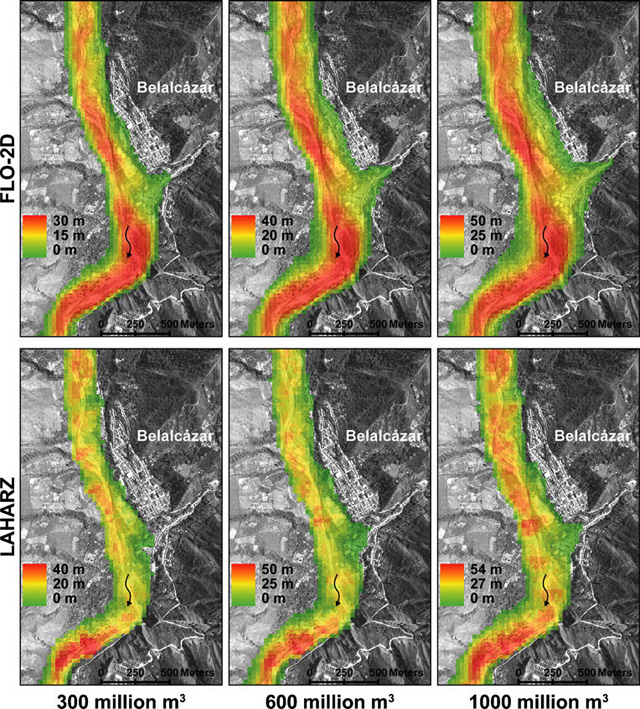 |
Figure 47. Results are shown from two modeling programs to understand lahar hazards from Nevado del Huila, FLO-2D (top three images) and LAHARZ (bottom three images), for the specified flow volumes. Note the modeled effects on the Belalcázar region (located ~20 km S of Huila). Three scenarios are presented based on lahar flow volumes of 3 x 10⁸, 6 x 10⁸, and 10 x 108 m3. Image from Worni and others (2012). |
Deformation monitoring during 2009-2012. An electronic tilt station was operating in July 2009, located at the Diablo monitoring site ~6.26 km NW of Pico Central (4.1 km above sea level). Telemetered data from a new electronic tilt station became available in May 2012; the station was located in the town of Caloto, located ~4 km SSW of Pico Central (4.2 km above sea level). Data from Diablo and Caloto was presented in the monthly technical bulletins posted online by INGEOMINAS.
After seven months of calibrations, INGEOMINAS developed an initial baseline for the new tilt data. The N and E components of Caloto recorded minor fluctuations during this time period. The trend of the E component was generally stable while the N component detected a gradual excursion during 17 June-25 September 2012.
References. FLO-2D Software I, 2009, FLO-2D User's Manual. Available at: www.flo-2d.com.
Iverson, R.M., Schilling, S.R, and Vallance, J.W., 1998, Objective delineation of areas at risk from inundation by lahars, Geological Society of America Bulletin, v. 110, no. 8, pg. 972-984.
Schilling, S.P, 1998, LAHARZ: GIS programs for automated mapping of lahar-inundation hazard zones, U.S. Geological Survey Open-File Report 98-638, 80 p.
Worni, R., Huggle, C., Stoffel, M., and Pulgarín, B., 2012, Challenges of modeling current very large lahars at Nevado del Huila Volcano, Colombia, Bulletin of Volcanology, 74: 309-324.
Information Contacts: Instituto Colombiano de Geologia y Mineria (INGEOMINAS), Observatorio Vulcanológico y Sismológico de Popayán, Popayán, Colombia; Washington Volcanic Ash Advisory Center (VAAC), NOAA Science Center Room 401, 5200 Auth road, Camp Springs, MD 20746, USA (URL: http://www.ospo.noaa.gov/Products/atmosphere/vaac/); Ozone Monitoring Instrument (OMI), Sulfur Dioxide Group, Joint Center for Earth Systems Technology, University of Maryland Baltimore County (UMBC), 1000 Hilltop Circle, Baltimore, MD 21250, USA (URL: https://so2.gsfc.nasa.gov/); Nasa Kiwe Corporation (CNK) (URL: http://www.nasakiwe.gov.co/index.php); Weather Research Forecasting (WRF) (URL: http://www.wrf-model.org/index.php).
2010: February
| June
| July
| August
| September
| November
2009: January
| March
| April
| May
| July
| October
| November
| December
2008: January
| February
| March
| April
| August
| October
| November
| December
2007: February
| April
| May
According to the Washington VAAC, INGEOMINAS reported a seismic event from Nevado del Huila on 11 November consistent with a potential ash emission. A possible ash plume detected in satellite imagery drifted 25 km WSW. A subsequent notice stated that seismicity returned to background levels and the plume was no longer visible. INGEOMINAS reported that during 10-16 November whitish-colored gas plumes seen through the Tafxnú and Maravillas (12 km SE) web cameras rose 2 km above the crater. The Alert Level had been lowered to III (Yellow; "changes in the behavior of volcanic activity") on 12 October, and remained at that level during the reporting period.
Sources: Servicio Geológico Colombiano (SGC); Washington Volcanic Ash Advisory Center (VAAC)
The Popayán Volcano Observatory (INGEOMINAS) reported that during 29 September-5 October gas plumes from Nevado del Huila, observed with the Tafxnú and Maravillas web cameras, rose 2.5 km above the summit. Incandescence from the extruding lava dome and collapsing material was also noted. Based on a SIGMET issued from the Bogota MWO, the Washington VAAC reported that on 1 October an ash plume rose to an altitude of 7.6 km (25,000 ft) a.s.l. Later that day, a 10-km-wide gas-and-ash plume was seen in satellite imagery drifting about 30 km S. The Alert Level remained at II (Orange; "probable eruption in term of days or weeks").
Sources: Washington Volcanic Ash Advisory Center (VAAC); Servicio Geológico Colombiano (SGC)
The Popayán Volcano Observatory (INGEOMINAS) reported increased activity from Nevado del Huila on 8 and 9 September. Pulses of tremor were associated with periodic emissions of gas, ash, and incandescent material observed with the Tafxnú and Maravillas web cameras. During 8-14 September plumes of steam and occasionally ash rose as high as 2 km above the summit. The Alert Level was raised to II (Orange; "probable eruption in term of days or weeks").
Source: Servicio Geológico Colombiano (SGC)
According to the Washington VAAC, the Popayán Volcano Observatory (INGEOMINAS) received several reports from towns W of Nevado del Huila that indicated ash emissions on 30 August. Ash was not seen in satellite imagery, although extensive clouds were present in the area. A thermal anomaly was detected, however. INGEOMINAS reported that a pulse of tremor was detected, associated with an ash emission seen in the web camera at Tafxnú. Ashfall was later confirmed in Toribio, 27 km W.
Sources: Washington Volcanic Ash Advisory Center (VAAC); Servicio Geológico Colombiano (SGC)
INGEOMINAS reported that periodically during 26 July-3 August sulfur dioxide plumes from Nevado del Huila were observed by ground-based instruments as well as satellite imagery. During 28-30 July INGEOMINAS noted that ash emissions reported by the Washington VAAC corresponded with increased seismicity. On 28, 30, and 31 July and 1 August gray fumarolic plumes drifting W were seen through the web camera at Tafxnú as well as a new web camera installed at Maravillas (12 km SE of Pico Central). The Alert Level remained at III (Yellow; "changes in the behavior of volcanic activity").
Source: Servicio Geológico Colombiano (SGC)
INGEOMINAS reported that during 9-15 June sulfur dioxide plumes from Nevado del Huila were detected by multiple sources. A distinct change in seismicity was noted on 13 June and was characterized by an increased intensity and a greater number of hybrid earthquakes. These earthquakes were shallow events beneath Pico Central. The Alert Level was raised to II (Orange; "probable eruption in term of days or weeks"). On 16 June two episodes of tremor possibly indicated ash emissions; this was unconfirmed. However, sulfur dioxide plumes were again detected. During 20-21 June small white pulsating fumarolic plumes drifted W.
Source: Servicio Geológico Colombiano (SGC)
INGEOMINAS reported that during 10-16 February whitish gas plumes from Nevado del Huila were seen through the web camera rising no more than 2 km above the lava domes. The rate of sulfur dioxide emissions was 945 and 4,130 tonnes per day on 10 and 16 February, respectively. During an overflight on 12 February scientists saw gas emissions and thermal anomalies on the high part of the dome. Based on analyses of images, the volume of the extruded lava dome was an estimated 70 million cubic meters. The Alert Level remained at III (Yellow; "changes in the behavior of volcanic activity").
Source: Servicio Geológico Colombiano (SGC)
Based on web camera views, INGEOMINAS reported that during 23-29 December a continuous white plume from Nevado del Huila rose 1 km. The output of sulfur dioxide was less than during the previous months of October and November. Seismicity and the rate of lava extrusion had also decreased during the previous weeks. On 5 January, INGEOMINAS lowered the Alert Level to III (Yellow; "changes in the behavior of volcanic activity").
Source: Servicio Geológico Colombiano (SGC)
Based on information from the Bogata MWO, the Washington VAAC reported that on 10 December an ash plume rose to an altitude of 7 km (23,000 ft) a.s.l. and drifted S. Ash was not identified in satellite imagery due to meteorological clouds in the area. INGEOMINAS reported that during 9-15 December seismic signals indicated occasional gas-and-ash emissions. White and bluish gas plumes seen on the web camera rose 2 km. Overflights revealed that the lava dome continued to grow and emit gases.
Sources: Washington Volcanic Ash Advisory Center (VAAC); Servicio Geológico Colombiano (SGC)
INGEOMINAS reported that during 25 November-1 December gas plumes from Nevado del Huila were seen on the web camera rising 8.4 km (27,600 ft) a.s.l. and drifting downwind. Seismicity included both tremor indicative of gas emissions and hybrid earthquakes. An overflight on 25 November revealed that the newest lava dome had continued to grow. Based on pilot observations, the Washington VAAC reported that on 26 November a gas plume, possibly containing ash, rose to an altitude of 7.6 km (25,000 ft) a.s.l. Ash was not identified in satellite imagery, although low weather clouds were present in the area. A sulfur dioxide plume was emitted on 30 November at a calculated rate of 3,900 tons per day. The Alert Level remained at II (Orange; "probable eruption in term of days or weeks").
Sources: Servicio Geológico Colombiano (SGC); Washington Volcanic Ash Advisory Center (VAAC)
INGEOMINAS reported that during 11-17 November gas plumes from Nevado del Huila were seen on the web camera rising 2.5 km and drifting downwind. Ash plumes sometimes accompanied the gas emissions on 12, 13, and 15 November. The Alert Level remained at II (Orange; "probable eruption in term of days or weeks"). Based on analyses of satellite imagery, the Washington VAAC reported that during 11-16 November thermal anomalies were seen intermittently through cloud cover.
Sources: Servicio Geológico Colombiano (SGC); Washington Volcanic Ash Advisory Center (VAAC)
INGEOMINAS reported that overflights of Nevado del Huila on 4, 6, and 10 November revealed a continued high rate of lava dome growth; the volume estimate for the new lava dome was nearly 25 million cubic meters. Small collapses occurred on the W part of the dome. Gas emissions were sometimes accompanied by pulsating ash emissions. Sulfur dioxide plumes rose 2.5 km above the lava dome and were seen in satellite imagery and the web camera drifting with the prevailing winds. The Alert Level remained at II (Orange; "probable eruption in term of days or weeks").
Based on analyses of satellite imagery, the Washington VAAC reported that during 4-6 and 10 November thermal anomalies on the volcano were seen intermittently through cloud cover. On 7 November, Bogota MWO reported an ash plume at an altitude of 9.4 km (31,000 ft) a.s.l., and a plume was seen drifting ESE on satellite imagery. Later that day, an ash plume was seen on satellite imagery and on the web cameras drifting SE at an altitude below 7.3 km (24,000 ft) a.s.l.
Sources: Servicio Geológico Colombiano (SGC); Washington Volcanic Ash Advisory Center (VAAC)
INGEOMINAS reported that on 28 October a pulse of tremor from Nevado del Huila was followed by an ash plume that, according to the Washington VAAC, rose to an altitude of 8.3 km (27,200 ft) a.s.l. On 30 October and 2 November overflights revealed a high rate of lava dome growth compared to the previous observation on 23 October. An ash layer covered the W part of Pico Central. Continuous and intense degassing originated from areas that also exhibited thermal anomalies detected with a thermal imaging camera. Resulting gas plumes drifted NW. The volume estimate for the new lava dome was nearly 9 million cubic meters.
Based on analyses of satellite imagery, pilot observations, and web camera views, the Washington VAAC reported that on 31 October an ash plume drifted 65 km S. During 31 October-2 November, thermal anomalies were seen on satellite imagery. On 2 November, a small plume seen on the web camera drifted SE. Gas plumes, occasionally accompanied by ash plumes, drifted 35 km SE.
On 3 November, INGEOMINAS reported that a pulse of tremor was followed by an ash plume that, according to the VAAC, rose to an altitude of 11.3 km (37,100 ft) a.s.l. and drifted SW. Ashfall was reported in communities downwind. The VAAC also noted that another ash plume rose to an altitude below 6.7 km (22,000 ft) a.s.l. and drifted E. INGEOMINAS stated that residents of Mosoco (20 km SSW) saw collapses from the W side of the dome generate small pyroclastic flows and incandescence at night. The Alert Level remained at II (Orange; "probable eruption in term of days or weeks").
Sources: Servicio Geológico Colombiano (SGC); Washington Volcanic Ash Advisory Center (VAAC)
The Washington VAAC reported a possible eruption from Nevado del Huila on 20 October. An ash plume was seen on satellite imagery drifting 45 km S and INGEOMINAS had reported increased seismicity. Another ash cloud was seen on satellite imagery drifting S later that day.
Based on web camera views, INGEOMINAS reported that on 21 October continuous gas emissions rose from Nevado del Huila and pulses of ash emissions produced plumes that drifted E. Observations during an overflight on 23 October revealed that gas-and-ash emissions originated from two locations. The area of greater discharge was between Pico Central and the lava dome, while fewer emissions came from the fissure that opened in April 2007, NE of Pico Central. Lava-dome growth was concentrated on the N end of the lava dome, an area also exhibiting a thermal anomaly detected with a thermal imaging camera. The Alert Level remained at II (Orange; "probable eruption in term of days or weeks"). Ashfall and sulfur odors were reported in several inhabited areas on 23 and 24 October.
Based on analyses of satellite imagery and information from INGEOMINAS, the Washington VAAC reported that on 24 October an eruption produced an ash plume that rose to an altitude of 9.1 km (30,000 ft) a.s.l. and drifted WSW. During 25-26 October, thermal anomalies were seen on satellite imagery. A plume drifted WSW on 25 October and a gas-and-ash plume drifted 90 km NW and SW on 26 October.
Sources: Servicio Geológico Colombiano (SGC); Washington Volcanic Ash Advisory Center (VAAC)
Based on web camera views, INGEOMINAS reported that on 16 October an ash plume from Nevado del Huila rose 1 km and drifted E. Ashfall and sulfur odors were reported in several surrounding areas. Later that day, seismicity increased, prompting INGEOMINAS to raise the Alert Level to II (Orange; "probable eruption in term of days or weeks").
Source: Servicio Geológico Colombiano (SGC)
INGEOMINAS reported that during 29 July-4 August seven pulses of seismic tremor from Nevado del Huila indicated explosions. Gas plumes seen on a web camera drifted W. On 3 August, ashfall was reported in areas to the W. The Alert Level remained at III (Yellow; "changes in the behavior of volcanic activity").
Source: Servicio Geológico Colombiano (SGC)
INGEOMINAS reported that during 22-28 July four pulses of seismic tremor from Nevado del Huila indicated explosions. Gas plumes were seen on a web camera and during a commercial flight. On 23 July, ashfall was reported in an area to the NW. The Alert Level remained at III (Yellow; "changes in the behavior of volcanic activity").
Source: Servicio Geológico Colombiano (SGC)
INGEOMINAS reported a seismic swarm at Nevado del Huila on 28 May that included M 4 and M 4.8 earthquakes felt by local residents. On 31 May, an episode of tremor was associated with an ash emission seen on a web camera. Another pulse of tremor was detected on 2 June. The Alert Level remained at III (Yellow; "changes in the behavior of volcanic activity").
Source: Servicio Geológico Colombiano (SGC)
INGEOMINAS reported images of Nevado del Huila taken during overflights on 7 and 9 May revealed thermal anomalies, volume increases, and changes in the color of the lava dome, indicating the extrusion of juvenile material. The Alert Level remained at III (Yellow; "changes in the behavior of volcanic activity").
Source: Servicio Geológico Colombiano (SGC)
During 15-21 April, INGEOMINAS reported that gas plumes from Nevado del Huila's lava dome, viewed through the web camera, rose to a maximum altitude of 6.9 km (22,600 ft) a.s.l. and drifted W. On 19 April, intense degassing observed during an overflight produced whitish and bluish plumes. Thermal anomalies were detected on the N and S parts of the dome. The Alert Level was at Yellow.
Source: Servicio Geológico Colombiano (SGC)
INGEOMINAS reported that during 11-17 March whitish colored gas plumes from Nevado del Huila viewed through the web camera rose to a maximum altitude of 6.4 km (21,000 ft) a.s.l. and drifted E and NW. The Alert Level remained at Orange.
Source: Servicio Geológico Colombiano (SGC)
INGEOMINAS reported that observations and images taken of Nevado del Huila during an overflight on 21 January revealed that the growing lava dome was about 1 km long, in a N-S direction, and 250 m wide, in a E-W direction. The current estimated volume of the dome was 52 million cubic meters. White-and-blue gas plumes were emitted. On 21 and 23 January, gas plumes viewed through the web camera rose to a maximum altitude of 6.3 km (21,000 ft) a.s.l. and drifted W. The Alert Level remained at Orange.
Source: Servicio Geológico Colombiano (SGC)
INGEOMINAS reported that during 18-19 January continuous emissions from Nevado del Huila were observed on the web camera, and produced white plumes that rose to heights less than 1 km above the summit. The Alert Level remained at Orange (the second highest on a four-color scale).
According to news reports, authorities in Colombia announced on 19 January the decision to relocate the town of Páez (population of about 4,000), currently about 27 km SSE of Nevado del Huila, due to the town's proximity to the Páez river and the volcano. Several populations have been affected by lahars generated by glacier melting from the volcanic activity.
Sources: Servicio Geológico Colombiano (SGC); Reuters
INGEOMINAS reported that during 12-16 December steam-and-gas plumes drifting SE and SW from Nevado del Huila were seen on a video camera rising to an altitude of 6.9 km (22,600 ft) a.s.l. A video camera was set up SSW of the volcano on 12 December.
Source: Servicio Geológico Colombiano (SGC)
INGEOMINAS reported that seismicity from Nevado del Huila continued to be elevated during 2-9 December. On 4 and 6 December overflights were conducted to view the new lava dome at the S flank of Pico Central. The dome elongated towards the SW of Pico Central, following the topography, and measured 400 m in the north-south direction, 150 m in the east-west direction, and was 120 m high. The approximate volume of the dome was 4,500,000 cubic meters. Gas plumes rose 1 km above the dome. New cracks in the glacier were also noted.
Source: Servicio Geológico Colombiano (SGC)
INGEOMINAS reported an eruption of Nevado del Huila at 2145 on 20 November that destroyed part of a new lava dome that had formed during the previous months. The Alert Level was raised to Red (on a 4-color scale where Red is the highest level). According to the Washington VAAC, two gas-and-ash plumes rose to altitudes of 12.4-15.4 km (40,700-50,500 ft) a.s.l. and drifted W and SE. Hot material erupted at the summit melted areas of the surrounding glacier and caused lahars in the Bellavista and Páez rivers. Lahars in the Páez River damaged infrastructure and destroyed homes, and residents of Taravira, Tóez, and La Estrella reported abundant ashfall and noises associated with both the eruption and the lahar. There may have been as many as 10 fatalities and 10 others were missing, and several populations were left without means of communication. By the time of a report at 0230 on 21 November, the seismicity had decreased. During an overflight, scientists observed a 400-m-diameter crater in the SW area of Pico Central. A lava dome inside the crater was degassing. Intense fumarolic activity was noted from the W end of a crack generated in April 2007. The next day, the Alert Level was lowered back to Orange because seismicity had returned to background levels. INGEOMINAS continued to receive reports of sulfur odors and continuous gas emissions from the summit.
According to news reports, the lahars damaged or destroyed about 70 homes and several bridges, and displaced many families. Hundreds of people were evacuated.
Sources: EFE News Service; Latin America Herald Tribune; Servicio Geológico Colombiano (SGC)
The Washington VAAC reported that on 11 November occasional emissions of gas and possible ash from Nevado del Huila were observed on satellite imagery. During 12-18 November, INGEOMINAS continued to receive reports of strong sulfur odors and ashfall in areas to the W and SW. They also noted that 14 instances of ash emissions were detected on satellite imagery during 13-14 November. Sulfur dioxide plumes were also detected on satellite imagery. According to the Washington VAAC, a pilot observed an ash plume on 14 November that rose to an altitude of 6.1 km (20,000 ft) a.s.l. and drifted SW. News articles stated that classes at educational institutions near the Páez and Símbola rivers were suspended while the Alert Level remained at Orange.
Sources: El Liberal; Washington Volcanic Ash Advisory Center (VAAC); Servicio Geológico Colombiano (SGC)
On 7 November, INGEOMINAS raised the Alert Level for Nevado del Huila to Orange (on a 4-color scale where Orange is the second highest) due to increased seismicity and the probability of ash and gas emissions. During an overflight on 9 November, scientists observed continuous emissions of ash and gas from Pico Central, including from new areas to the S. Resultant plumes drifted SW and W, and ash deposits were seen on the summit. Fissures were evident on the S and SW parts of Pico Central. Evidence of ash and flowing water that originated from the SW fissure was possibly the cause of the Páez river turning grayish during the previous few days.
Based on analysis of satellite imagery and information from INGEOMINAS, the Washington VAAC reported that on 10 November a plume drifted W and WSW. Ashfall was noted in towns 20 km NW.
According to news articles, ash and sulfur dioxide plumes impacted local livestock, rural aqueducts, infrastructure, and rivers. On 11 November, about 20 families living near the Símbola River evacuated because of increased fumarolic activity.
Sources: Servicio Geológico Colombiano (SGC); EL PAÍS; La Patria; Washington Volcanic Ash Advisory Center (VAAC)
INGEOMINAS reported that on 3 November residents in an area to the S of Nevado del Huila observed intense fumarolic activity from at or near the summit that was white in color and turned grayish for short intervals. Residents of Wila, Tóez, and Plan de Caloto, to the SW, reported ashfall and strong sulfur odors.
Source: Servicio Geológico Colombiano (SGC)
INGEOMINAS reported that on 26 October an episode of tremor at Nevado del Huila lasted about 1 hour and 40 minutes, and was interpreted to have possibly been associated with ash emissions. On 28 October local residents and passengers aboard a commercial flight reported smelling sulfur.
Source: Servicio Geológico Colombiano (SGC)
INGEOMINAS reported that on 2 September a M 4.6 earthquake at Nevado del Huila was detected 2.2 km NE of Pico Central. The Alert Level remained at Yellow (on a 4-color scale where Yellow is the second lowest).
Source: Servicio Geológico Colombiano (SGC)
INGEOMINAS reported that no significant morphological changes to the summit of Nevado del Huila were noted during an overflight on 6 May, although the NE and NW flanks could not be directly observed. Fumarolic plumes drifted NW. The Alert Level was lowered to Yellow (on a 4-color scale where Yellow is the second lowest).
Source: Servicio Geológico Colombiano (SGC)
INGEOMINAS reported that seismicity from Nevado del Huila decreased during 23-29 April. No significant morphological changes to the summit were noted during an overflight on 29 April, although the NE and NW flanks could not be seen due to strong winds. The Alert Level remains at Orange (on a 4-color scale where Orange is second highest).
Source: Servicio Geológico Colombiano (SGC)
Seismicity from Nevado del Huila increased during 9-12 April then again on 13 April, prompting INGEOMINAS to raise the Alert Level to Orange (the second highest level on a 4-color scale). During 13-14 April, seismic signals possibly indicated an eruption. According to news articles, authorities ordered about 15,000 people to evacuate. On 14 April at 2325, the Alert Level was raised to Red, the highest level, based on the seismicity. Seismic events decreased in number and intensity in the early evening of 15 April; the Alert Level was lowered to Orange. Weather inhibited visual observations and overflights of the summit.
Sources: Servicio Geológico Colombiano (SGC); CNN
According to news articles, communities surrounding Nevado del Huila responded to the raised Alert Level of Orange, established by INGEOMINAS on 29 March. The Local Committee of Disaster Prevention ordered the closing of a school with a student population of 1,100, declared the maximum alert for a local hospital, and facilitated meetings of multiple groups. Residents bought supplies and repaired roads that were key evacuation routes, and sirens were tested each day. Several populations in high-risk areas did not have systems of communication. On 7 April, residents in high-risk areas near the Páez river were evacuated to shelters as a precautionary measure.
On 8 April, INGEOMINAS lowered the Alert Level to Yellow due to decreased seismicity during 2-8 April. In addition, no superficial changes associated with the recent activity were observed during an overflight on 5 April.
Sources: Servicio Geológico Colombiano (SGC); El Tiempo; EL PAÍS
INGEOMINAS reported that seismic tremor from Nevado del Huila increased during 18-25 March. Residents reported noises, the odor of sulfur, and small ash plumes. Seismicity increased again on 29 March; INGEOMINAS raised the Alert Level to Orange (on a 4-color scale, Orange is second highest).
Source: Servicio Geológico Colombiano (SGC)
INGEOMINAS reported that seismic tremor from Nevado del Huila on 2 March was possibly associated with ash emission. Based on a Bogota SIGMET, the Washington VAAC reported that an ash plume rose to an altitude of 7.6 km (25,000 ft) a.s.l. the same day.
Sources: Servicio Geológico Colombiano (SGC); Washington Volcanic Ash Advisory Center (VAAC)
INGEOMINAS reported that sulfur dioxide plumes from Nevado del Huila drifted NW on 8 and 12 February.
Source: Servicio Geológico Colombiano (SGC)
Based on aerial observations from a commercial flight on 19 January, INGEOMINAS reported that ash deposits from Nevado del Huila were seen on the W sector of a summit glacier, confirming the seismic interpretation from the previous month.
Source: Servicio Geológico Colombiano (SGC)
Based on seismic interpretation, INGEOMINAS reported ash emissions from Nevado del Huila on 2, 7, and 12 January.
Source: Servicio Geológico Colombiano (SGC)
Based on seismic interpretation, INGEOMINAS reported ash emissions from Nevado del Huila during 27 May that were confirmed later that day by aerial observations. Tremor on 28 May possibly indicated another pulse of ash emissions. Sulfur-dioxide flux measured 3,000 metric tons per day on 1 June and about 6,900 metric tons per day on 2 June.
Source: Servicio Geológico Colombiano (SGC)
Based on satellite imagery, the Washington VAAC reported that on 14 May an ash plume from Nevado del Huila drifted SW and dissipated. INGEOMINAS reported that seismicity was possibly related to an ash emission.
Sources: Servicio Geológico Colombiano (SGC); Washington Volcanic Ash Advisory Center (VAAC)
Based on satellite imagery, the Washington VAAC reported that an ash eruption from Nevado del Huila on 18 April produced a plume that drifted SW and dissipated. On 22 April, INGEOMINAS reported that during aerial observations, fumarolic activity was observed from a fissure first noted on 19 February. The fissure was approximately 2.3 km long and 0.2 km wide. A resultant plume rose to an altitude of 10.4 km (34,100 ft) a.s.l. Another fissure, extending about 2 km from the SW to the NE sector of Pico Central, also produced fumarolic emissions. Mudflows in the Páez and Símbola rivers originating on Pico Central primarily swept through the Oso ravine on the E flank and Bellavista ravine on the W flank.
According to news articles, the eruption during 17-18 April caused damage to houses and destroyed 19 bridges along the Páez and Símbola rivers. Several kilometers of a highway, used to transport goods and medicines to the population, were also destroyed. INGEOMINAS noted that there were no reported deaths or injuries as a result of the eruption.
Sources: Associated Press; Servicio Geológico Colombiano (SGC); Associated Press; Washington Volcanic Ash Advisory Center (VAAC)
According to the Washington VAAC, a pilot reported an ash plume from Nevado del Huila on 17 April. An ash plume that was evident on satellite imagery at 0415 rose to an approximate altitude of 11.3 km (37,000 ft) a.s.l. and drifted E. An additional plume drifted SW. Later that day, INGEOMINAS reported increased seismicity. At 0257 on 18 April, INGEOMINAS reported an eruptive event. Based on a news article, an eruption triggered landslides and swelled rivers. About 5,000 people evacuated from areas to the S.
Sources: Servicio Geológico Colombiano (SGC); Mail and Guardian Online; Washington Volcanic Ash Advisory Center (VAAC)
The Washington VAAC reported that satellite imagery confirmed an eruption from Nevado del Huila on 19 February. The ash cloud rose to an altitude of 6.1 km (20,000 ft) a.s.l. and drifted W. Later the same day, a pilot reported an ash cloud to the same height and direction. During 2-3 March, INGEOMINAS reported that volcanic tremor was accompanied by gas-and-ash emissions that drifted NW. Fumaroles emitted from a N-S trending fissure.
Sources: Servicio Geológico Colombiano (SGC); Washington Volcanic Ash Advisory Center (VAAC)
INGEOMINAS reported that seismic activity from Nevado del Huila remained elevated during 21-23 February. On 21 February, steam plumes rose to altitudes of 5.7 km (18,700 ft) a.s.l. and drifted W. On 24 February, fumarolic activity from the central and N areas on the volcano was not seen during aerial observations.
Source: Servicio Geológico Colombiano (SGC)
INGEOMINAS reported increased seismic activity and two explosions from Nevado del Huila on 19 February. An ash plume rose to an altitude of approximately 6 km (19,700 ft) a.s.l. During aerial observations on 20 February, ash deposits were seen on the W sector of a summit glacier and dispersed to the NW. Fumarolic plumes originating from several points along a fissure rose to 7 km (23,000 ft) a.s.l. Small mudflows from a glacier traveled down a gorge. Based on news reports, small avalanches prompted officials to order evacuations from towns bordering rivers.
Sources: Servicio Geológico Colombiano (SGC); Reuters
Reports are organized chronologically and indexed below by Month/Year (Publication Volume:Number), and include a one-line summary. Click on the index link or scroll down to read the reports.
Hundreds killed by seismically triggered mudflows
. . . earthquake-triggered mudflows swept down steep-walled valleys engulfing multiple villages and settlements (figure 1). The M 6.4 earthquake . . . took place at 1547 on 6 June, apparently falling along the Cauca Romeral fault. It disturbed a wide area, causing minor structural damage in Bogota, but more significant damage to 10 buildings in Cali (100 km W of the epicenter; see inset, figure 1). Near the epicenter, located 10-30 km W of the volcano, the earthquake destroyed at least 40 homes. The most catastrophic damage caused by the earthquake took place when Nevado del Huila released gravitationally unstable rock, snow, and ice down the volcano's slopes. These mudflows are the main focus of the rest of this report.
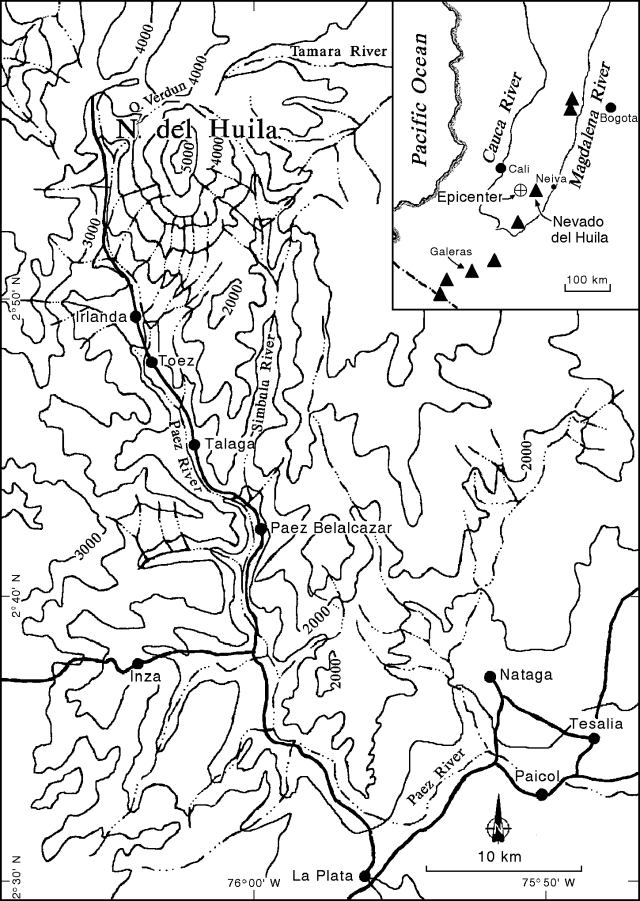 |
Figure 1. A 500-m contour interval topographic map (map coordinates approximate) of the Paez river basin, the primary drainage from Nevado del Huila. The map shows villages (large dots), roads (heavy lines), and rivers (broken lines). The index map of SW Colombia shows the epicenter, large rivers, and the chain of active volcanoes (solid triangles) along the Andes as far south as the international border (heavy broken line). After Cepeda (1989). |
A . . . topographic map from a published hazard study (Cepeda, 1989) shows the rugged local geography (figure 1, note the contour interval, 500 m). The study also contains a second map that outlines areas of likely risk from lava flows and mudflows. To avoid confusion with the actual event we have omitted this second map, however, it shows the mudflows along drainages down the mountain continuing toward the SSE into the channel of the Paez river. The region of mudflow risk extends all the way to the map's margin near Paical (in the SE corner). Available information suggests the mudflows did basically follow the Paez river as anticipated.
According to a 9 June Reuters news report, "Graphic video images shot by a tourist . . . captured the moment when the huge brown-grey mass of mud roared down the valley, sweeping away trees, rocks, and houses in its path." According to witnesses, the mudflow reached 30-m high. In the wake of the mudflow, access to the area was cut off. Roads and bridges were damaged or blocked by mud, necessitating the use of helicopters. News reports repeatedly cited damage and casualties in the villages of Irlanda, Toez, Talaga, and Paez Belalcazar (figure 1).
A 7 June, UPI report quoted the archbishop of Paez Belalcazar, Jorge Garcia. On a flight over the area, he observed that the village of Toez had been "buried in mud," and "only the roof of the school can be seen." The same news report noted "There were no immediate reports of how many Toez residents managed to escape before the village was smothered, although some 500 people were thought to have been buried." The news report also related that in Paez Belalcazar ". . . 12 people were washed away by the rushing waters."
Overall, the number affected by the widely felt earthquake and the more restricted mudflows was estimated at 50,000. In terms of the mudflows alone, fatality estimates ranged from 253 to over 1,200 people. About 250 people, including many severely injured children, were evacuated by helicopter to hospitals in the provincial capital Neiva. Some 2,500 survivors were brought by helicopters to tent camps in La Plata.
A 6 June Reuters news report told of people hearing a "strong explosion" leading to initial confusion about whether the mudflows were triggered by an eruption or seismic loading. It was reported that geologists monitoring the volcano suggested the explosion may have come from an avalanche in the area.
Problems apparently went beyond the damage from the initial mudflows and subsequent limited access. For example, the 6 June news report stated that at one point: ". . . the river burst through a natural dam created by a mud and rock slide caused earlier by the quake." Other reports cited aftershocks and heavy rains contributing to ground instability, conditions that in some cases injured both survivors and rescue workers.
Reference. Cepeda, H., 1989, Catálogo de los volcanes activos de Colombia: Bol. Geol., v. 30, no. 3.
Information Contacts: T. Casadevall, USGS; UPI; Reuters.
Description of the Paez earthquake's mass wasting
The destructive earthquake-triggered mudflows of 6 June (19:5) were the subject of a preliminary report (Casadevall and others, 1994) following an investigation by a team from INGEOMINAS and the USGS during 30 June-9 July. What follows is a summary of that report, which includes first-hand observations on slope-failure and transport of loosened material.
The M 6.4 earthquake that struck on 6 June 1994 is now termed the Paez earthquake. Although the preliminary epicenter determination was W of the volcano's summit, a more recent estimate places it on Nevado del Huila's SSW flank, several kilometers N of the village of Irlanda (figure 1; BGVN 19:5). Prior to the earthquake, normal background seismicity prevailed; a series of aftershocks also took place beneath the volcano.
Earthquake damage was attributed to shaking, mass movement of loosened material, and flooding. The volcano's topography and volcanic deposits contributed to the disaster, but the primary area of landslides lay S of the main volcanic edifice and reached a maximum elevation of ~3,000 m. Aerial observers on 7 July saw no changes in either the vigor of fumaroles present near the summit or in the distribution and surface appearance of glaciers. Though dislodged ice was noted in news reports, none was found during fieldwork. The latest estimates on direct human impact from the earthquake are >150 fatalities, 500 people listed as missing, and 20,000 people displaced. Six bridges and >100 km of roads were destroyed.
All mass movement due to slope failure was previously called "mudflows" (19:5). The new report uses more precise terminology (Varnes, 1978), and provides an English-Spanish glossary that includes these and other terms: (a) rock, soil, and earth falls, (b) various kinds of slides including earth slides and debris slides, (c) rock avalanches, (d) debris avalanches, and (e) earth flows. According to this scheme, the bulk of the observed slides were earth slides derived from weathered residual soils that have developed on the bedrock. Lack of bedrock involvement and the limited amount of translations that involved bouncing, rolling, or falling resulted in few mass movements categorized as rock avalanches.
Nearly all of the 6 June earthquake-triggered landslides originated on slopes of >=30°. In this steep terrain they mainly began as shallow slips in residual soils. The soils had been saturated a few weeks prior to the earthquake by heavy rains. Reduced shear strength because of the saturated soils was a major factor in the observed slope failures and the velocity of the downslope movements. Typically these water-charged slides were ~ 1-2 m thick, and immediately liquified, transforming into either debris avalanches or earth flows moving rapidly downslope. In total, these processes stripped >50% of the vegetation from the steep hillsides. The slides themselves caused little direct damage since the steep slopes were generally uninhabited.
Adjacent to the volcano, in up-river villages such as Irlanda and Wila, damage took place as the mobile earth flows ran across relatively flat terrace surfaces. Earth flows in Irlanda were only 2 m thick, but they destroyed the houses and structures in their path. Some of the damage at Irlanda may have been caused by a high-velocity earth flow that began on the opposite side (the E side) of Rio Paez and crossed over.
The 1994 debris flows in the Rio Paez were cohesive (>3% of sediment with <0.004 mm size), which means that they remain intact and travel long distances. On the other hand, large previous debris flows preserved in lateral terraces along the river are of the noncohesive type that transformed into hyperconcentrated flows as they moved downstream. The noncohesive debris flows are thought to have been more closely related to past explosive volcanism and provide one means of analyzing past behavior at Huila. This point is noteworthy because the headwaters of the Rio Paez provide the drainage for almost the entire volcano. Because the bulk of debris flows must travel down the Rio Paez, study of the deposits along it should provide a thorough record of the volcano's seismically and magmatically generated deposits.
The report noted several analogous cases of "widespread stripping of saturated materials and vegetative cover from steep slopes" during seismic loading. One case involved the M 6.1 and 6.9 earthquakes of March 1987 in NE Ecuador. Those earthquakes triggered an estimated 75-110 million m3 of mass wasting, killed an estimated 1,000 people, destroyed a major oil pipeline, and caused US $1 billion in damages. These events are also of interest because Mount Rainier (Washington State, USA) contains a gravitationally unstable zone of altered rock high on its edifice. The zone could detach during seismic loading and move downslope, eventually reaching heavily populated areas.
Researchers continue to watch the volcano to see if the recent seismicity causes any changes to its normally passive hydrothermal system. Monitoring is done from an observatory in Popayan, 83 km SW.
References. Casadevall, T.J., Schuster, R.L., and Scott, K.M., 29 July 1994, Preliminary report on the effects of the June 6, 1994 Sismo de Paez (Paez earthquake), Southern Colombia: U.S. Geological Survey Response Team, 15 p.
Varnes, D.J., 1978, Classification of mass movements, in Schuster, R.L., and Krizek, R.J. (eds.), Landslides: Analysis and Control: U.S. National Academy of Sciences, Transportation Research Board Special Report 176, p. 11-33.
Information Contacts: INGEOMINAS, Popayan; T. Casadevall, USGS.
Tremor pulses follow the 6 June earthquake
After the Paez earthquake (6 June 1994) tremor pulses began appearing on local seismic records. Such pulses were previously unseen since seismic monitoring began in 1986. On 7 August, a 75-minute interval of banded tremor took place over a 4-hour time span. On 27 September continuous tremor prevailed for up to 9.5 hours; the dominant frequency was in the 1-2 Hz range.
Information Contacts: H. Cepeda, INGOMINAS, Popayan.
Significant increase in seismicity in December 1997
The Observatorio Vulcanológico y Sismológico de Popayán (OVSP) reported increased seismicity at the Nevado del Huila volcanic complex. The complex is studied using three seismic stations in SW Colombia. One substantial seismic increase occurred during 20-25 December 1997. About 108 volcano-tectonic earthquakes in three swarms were located in a small area 3 km east of Pico Norte (figure 2). Seismic activity has not previously been known in this area. The swarms were 6-8.5 km in depth (figure 3) with magnitudes ranging from 0.93 to 2.98 (Richter scale).
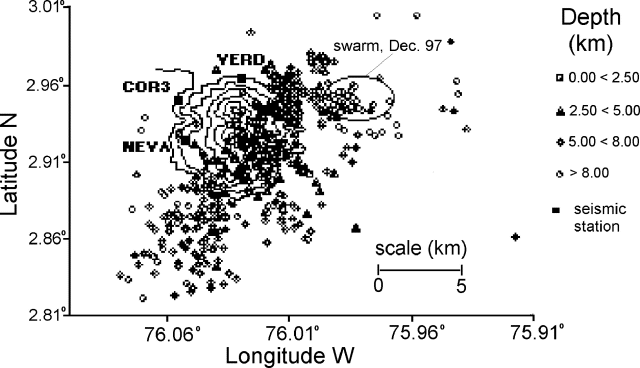 |
Figure 2. Epicenter map showing volcano-tectonic seismicity at the Nevado del Huila complex during January to December 1997. Courtesy OVSP. |
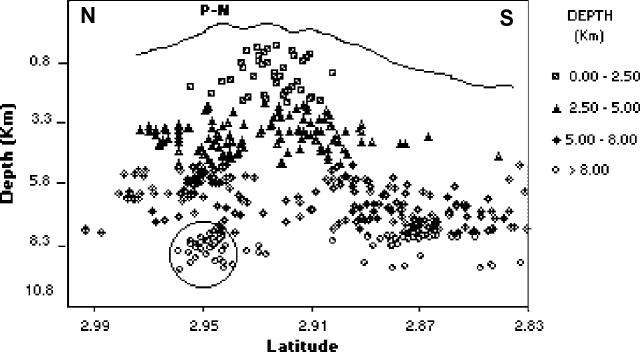 |
Figure 3. Depths of volcano-tectonic seismicity at Nevado del Huila during January to December 1997. Courtesy OVSP |
A second increase, energy released by volcano-tectonic earthquakes, has grown over the last two years. The period with the largest recorded energy was associated with the swarms of late December 1997, which totaled 1.20 x 10⁸ ergs (figure 4).
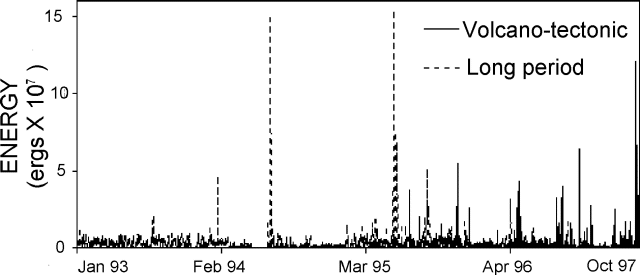 |
Figure 4. Seismic energy from volcano-tectonic and long-period (LP) earthquakes recorded at stations monitoring Nevado del Huila, 1993-1998. Courtesy OVSP. |
The Nevado del Huila volcanic complex is comprised of three main peaks aligned N-S; these are named Pico Norte, Pico Central and Pico Sur. Pico Central is the highest summit in the Cordillera Central, is composed of interbedded tephra and steep-sided lava flows located inside an old caldera. The sole known eruption recorded in historical time was an explosion in the 16th century. Two persistent steam columns rise from the southern peak and hot springs surround the volcano. The volcano has 13.4 km2 of glacial cover.
Information Contacts: Fabiola Patricia Rodríguez and Juan Carlos Diago, Observatorio Vulcanológico y Sismológico de Popayán, Calle 5B 2-14, Popayán, Colombia.
During February-May, two volcano-tectonic swarms (= M 3.3)
As shown on figure 5, during February-May 2000 seismic activity on Nevado del Huila volcano included two volcano-tectonic (VT) swarms.
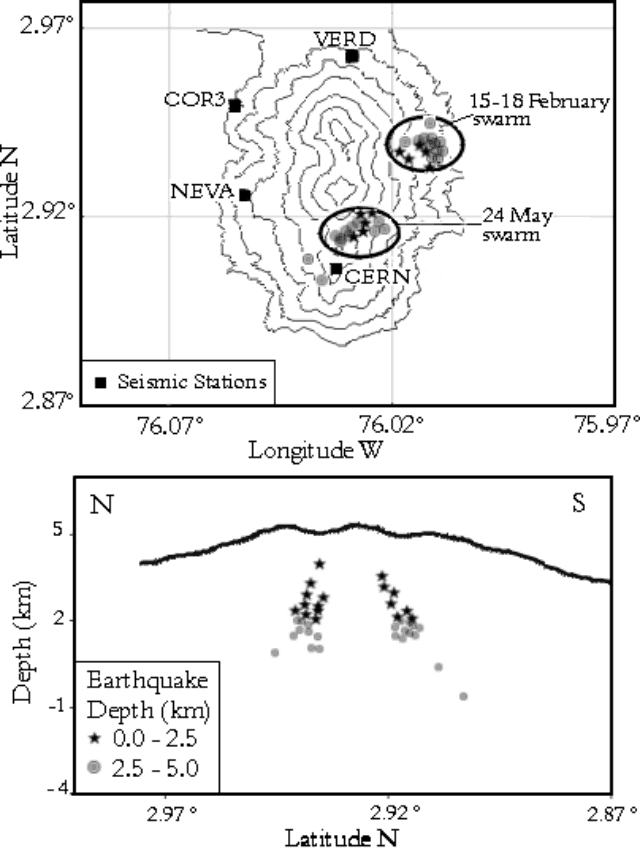 |
Figure 5. Location of seismic swarms on Nevado del Huila volcano during 15-18 February, and 24 May, 2000. Seismic stations are labeled as black boxes. The cross-section runs N - S through the swarms. Pico Sur is the topographic high at the S end of the edifice, just N of the CERN station. Courtesy of Observatorio Vulcanológico y Sismológico de Popayán (INGEOMINAS). |
The first VT swarm occurred during the period 15-18 February and comprised 61 earthquakes located on the E part of the volcano at less than 5 km depth. On 18 February, one M 3.3 earthquake in this swarm was felt in Belalacazar town, 20 km from the volcano.
The second swarm (24 May) lasted for less than two hours and consisted of 90 events located near Pico Sur. Focal depths ranged between 2 and 3 km with magnitudes of M 0.5-2.5; however, the release of energy by the swarm did not exceed normal levels.
Information Contacts: Fabiola Rodríguez and Jaime Raigosa, Observatorio Vulcanológico y Sismológico de Popayán, INGEOMINAS, Popayán, Colombia; Hector Cepeda, INGEOMINAS, Bogotá, Colombia.
Eruptions in February, April, and May 2007; lahars take out bridges
Nevado del Huila was the scene of elevated seismicity during February and May 2000 (BGVN 25:05). In 1994, the M 6.4 Paéz earthquake triggered avalanches and lahars along the Paéz river, which took many lives (BGVN 19:05, 19:07). A more recent abstract summarized the losses from the Paéz earthquake as 271 reported deaths, 1,700 people missing, and more than 32,000 people evacuated during the crisis (Schuster, 1996). Correa and Pulgarín (2002a, b) wrote reviews of the volcano's geology, hazards, and related topics.
This report discusses the onset of eruptions during February 2007 and repeated eruptions during April and May 2007. During the most active intervals during February and April there were substantial ash plumes, lahars, earthquake swarms (and some individual earthquakes up to M ~ 3), and the growth of fissures, crevasses, and new fumaroles on the volcano's upper, glacier-covered slopes. During the April eruption thousands of residents evacuated. This report draws heavily on material issued by the Instituto Colombiano de Geología y Minería (INGEOMINAS), Observatory Vulcanológico and Sismológico de Popayán.
The andesitic-dacitic edifice (figure 6) is large and elongate (with a footprint of ~ 170 km2 ). Located in the Central Cordillera (figure 7), it forms Colombia's highest peak. This area only 3 degrees from the equator experiences periods of high precipitation. In 1995 its alpine glaciers covered ~ 13.4 km2 with an approximate volume of 800 x 106 m3 (Pulgarín and others, 2005).
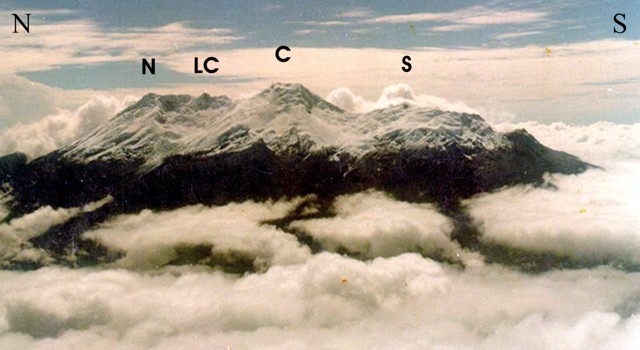 |
Figure 6. An aerial photo showing the upper slopes of Nevado del Huila from the W. The photo was taken at unknown date prior to 2002 when the volcano was in a non-eruptive state. From N to S the four main peaks consist of Pico Norte ("N"), Pico la Cresta ("LC"), Pico Central ("C"), and Pico Sur ("S"). Heavy cloud banks such as those in the foreground are common, adding to the difficulty of monitoring this remote, high stratovolcano. Taken from Correa and Pulgarín (2002a). |
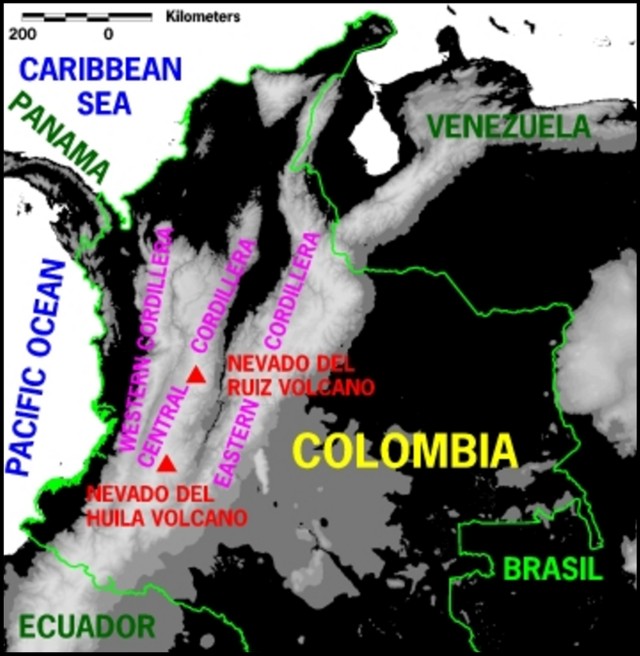 |
Figure 7. A sketch map showing the three distinct ranges (cordillera) of the Andes in Colombia, with Nevado del Huila indicated. Between the Western and Central cordillera, the valley contains the Cauca river (not shown). It flows N and ultimately joins the Magdalena river (not shown), traveling ~ 1,350 km beyond its starting point to reach Northern Colombia. Between the Central and Eastern cordillera, the valley contains the Magdalena river (not shown). It flows N and travels ~ 1,500 km before entering the Caribbean sea at Barranquilla. After a digital elevation map prepared by the USGS; courtesy of the International Charter "Space and Major Disasters." |
The April 2007 activity impacted not only the immediate vicinity of the volcano, but also ten's of kilometers to the S, where rivers carried debris. In order to assess the impact of the lahars, INGEOMINAS compared calibrated Landsat images from before and after the 19 February eruption. They found clear visual evidence that the lahars had discolored the Betania Reservoir, ~ 150 km downstream.
The Símbola joins the Paéz river ~ 28 km (straight-line distance) S of Pico Central (figure 8). Adjacent that intersection sits the town of Belacázar (figure 9). Another ~ 15 km downstream, the Paéz merges into the Magdalena river, the 6th largest river the world in terms of sediment yield (~ 690 t / (km2 ? yr); Restrepo and others, 2005). A straight-line distance of ~ 50 km downslope from the intersection of the Paéz and Magdalena rivers, the Magdalena enters the Betania Reservoir.
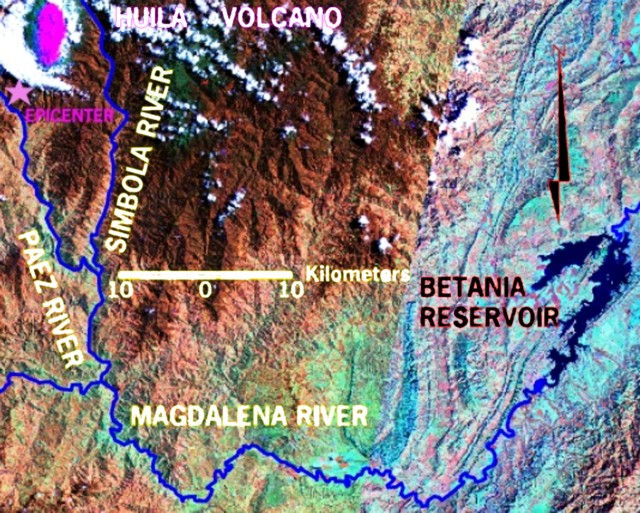 |
Figure 8. A false-color Landsat TM5 mosaic image showing the Magdalena river and some of its headwaters (eg. the Paéz and Símbola rivers) that feed from Nevado del Huila (upper left corner). Images are Landsat-5, 30-m resolution. Left image acquired 7 August 1989. Right image acquired 2 January 1988. The annotations include the epicenter for the Paéz earthquake (star) and the Betania Reservoir. On the colored version, snow is shown by the elongate magenta region around Huila.Created March 2007 by INGEOMINAS; courtesy of the International Charter "Space and Major Disasters." |
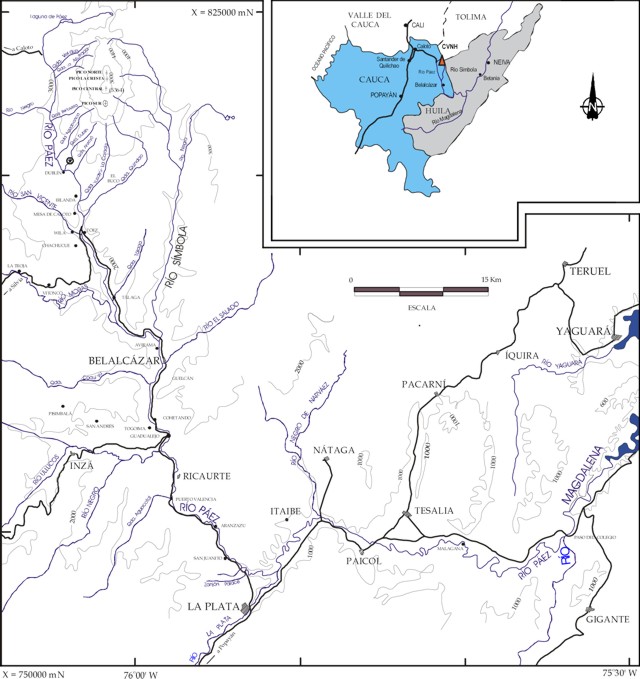 |
Figure 9. Map indicating the topography and naming conventions on the Huila edifice and some surrounding regions. The inset shows the volcano's location at the triangle labeled CVNH. Note epicenter for the Paéz earthquake. This was modified from a larger map in Correa and Pulgarín (2002a). |
Beyond the reservoir, the Magdalena flows NNE; it ultimately reaches the Carribean Sea at a large delta in N Colombia by the large city of Barranquilla (figure 7). According to Restrepo and Kjerfve (2000), "the Magdalena is the largest river discharging directly into the Caribbean sea [228 km3 water annually], and it has the highest sediment yield of any medium-sized or large river along the entire E coast of South America."
Unrest and 19 February eruption. Since 1994 the volcano has been monitored by multiple telemetered seismometers with data sent to the city of Popayán (~ 100 km SSW). Mumucué (2007) pointed out that people living around the volcano saw the appearance of fumaroles in October 2006.
From 22 November 2006, INGEOMINAS assigned an elevated hazard of Level II ('Eruption probable in the coming days or weeks'). Some fracture-related earthquakes took place at depths of 2 km below the summit. Some of these earthquakes reached MR 1.6-1.9.
A 13 February flight mainly found steam escaping both secondary craters and fumarole fields on the main crater's margin. The previous day, observers W of the volcano in Consacá saw steam emissions outside the crater.
A seismometer recorded an earthquake swarm during 1030-1259 on 18 February. The seismometer, located 2 km S of Pico Central (at station 'Cerro Negro') measured 108 earthquakes interpreted as rock fracture events in the upper part of the volcano. An M 3 earthquake followed, and at 0137 on 19 February a new swarm of 53 earthquakes occurred. In this swarm fracture earthquakes were accompanied by those of longer period; the amplitude and number of events increased into the next morning.
Seismic records also contained some long-period earthquakes called tornillos (events with long, gradually decreasing codas or tails, so that their seismic trace resembles the tapering profile of a wood screw; tornillo is Spanish for screw). During March 2006-February 2007, instruments had recorded 105 tornillos (an average of 9 per month). In contrast, during 1-19 February 2007, instruments recorded 20 tornillos, more than double the number usually seen during a full month.
INGEOMINAS reported two earthquakes on 19 February 2007, at 0830 and 0853, with probable explosive character. Aviation authorities reported ash-bearing columns over the edifice reaching ~ 0.6-0.7 km above the summit.
A later INGEOMINAS summary of events stated that the eruption began at 0856 on 19 February, manifested as a ~ 1.5 km tall eruption column blowing mainly W. Ashfall was noted by inhabitants of Toribio, Silvia, and Páez (in the Department of Cauca). Small mudflows came down the Bellavista and Azufrada rivers feeding into the Paéz river, but airborne observers found significant fresh deposits at higher elevations. Authorities advised inhabitants to move to higher ground. Inhabitants noticed the rise of the Paéz river at 1150 on 19 February.
A 20 February flight detected significant fresh ash, abundant crevasses in the ice, and a steaming fissure near the summit (figure 10). The fissure extended ~ 2 km between Pico Central and Pico la Cresta to the N. Observers noted that the fissure continually emitted gases along its entire length. The flight was a collaboration between INGEOMINAS and IGEFA (Inspección General de la Fuerza Aérea).
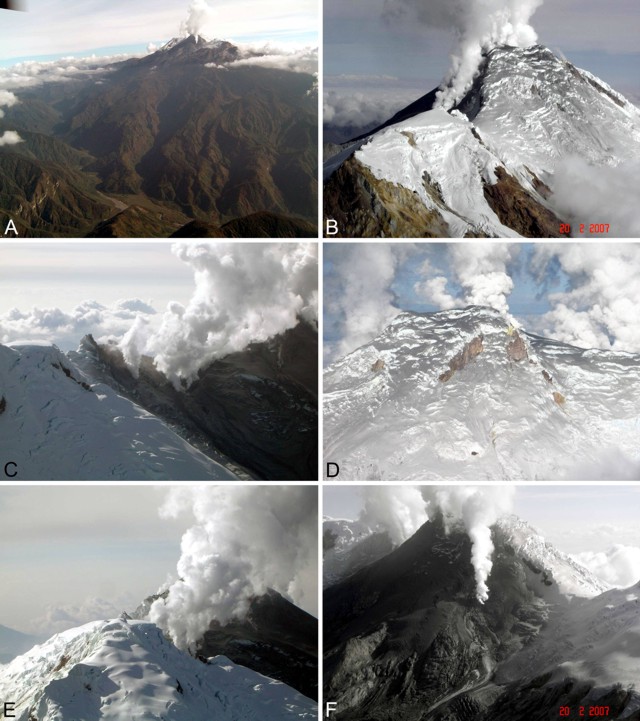 |
Figure 10. (a-f) Six aerial photos of Nevado del Huila taken from multiple angles and distances on 20 February 2007. A) A view with the Paéz river basin in the foreground and with Nevado del Huila steaming in the background. B) A close up of the SE flank looking NW, showing dark snow on the W side of the volcano and a thinner coating on the E side. C) Contrasting ash-free and thickly ash-covered ice at the N-central side of the summit (Pico Central to the right), with the elongate fissure emitting steam near the ridgeline. D) Pico Central seen at comparatively close range from the E side of the mountain, where a thin coating of ash is apparent over many of the upper slopes. E) A view looking S across Pico la Cresta slightly off the trend of the ridge axis, highlighting steam emissions from the fissure, areas of ash-covered snow, and abundant fresh crevasses in the upslope ice. F) A photo looking NW at the gray ash deposits on glacial ice of Pico Central and again illustrating venting steam. Courtesy of the Colombian Air Force and INGEOMINAS. |
A VAAC report noted an eruption at about 1400 UTC on the 19th to approximately FL 200 (~ 6.1 km altitude) moving W and dissipating quickly. No ash was seen in satellite imagery the next day at either 0045 or 1100 UTC, however, around this latter time, a pilot observed an ash cloud. In addition, a local aircraft reported ash to ~ 6.1 km at 0500 UTC on the 21st.
During 30 March-16 April 2007 INGEOMINAS observers reported the initiation of noteworthy seismicity indicating rock fractures and movement of fluids. The fracture events were located at depths of 4-8 km E and SW from the central peak and at magnitudes of less than 1.0. Low gas columns were again seen on 11 April, moving W.
Seismicity further increased on 17 April, leading up to an eruption on the 18th. Early on 18 April, a cluster of 25 rock-fracture earthquakes occurred, M 0.5 to 1.5. These were located at a depth less than 2 km. Seismicity again increased later that morning.
April 2007 eruption. A brief summary of the 18 April eruption appeared on the website hosted by the International Charter "Space and Major Disasters" on 20 April). It stated, "The Nevado del Huila volcano erupted at 02:57 local time 18 April, causing avalanches and floods [lahars] which affected the villages of La Plata, Paicol, Tesalia, Natagá, [and] Belalcázar. About 5,000 people were evacuated." (That same website hosted more than 10 (Landsat, Radarsat, and Envisat) images shedding light on this remote volcano's behavior, hazards, and impacts).
According to an 18 April 2007 report from the Washington Volcanic Ash Advisory Center (VAAC), a pilot in Colombia saw an ash cloud. Two ash plumes were evident on GOES-10 (split window) satellite imagery for an eruption starting at 0815 UTC on 18 April. They rose to poorly constrained altitudes of ~ 9 and 11 km and drifted E at 9 km/hour. The lower ash cloud was ~ 37 km across and moved SW at 9-18 km/hour. The higher ash cloud was ~ 19 km across and moved E at 0-9 km/hour. These clouds had dissipated by 1034 UTC.
The 18 April eruption sent an a torrent of brown water and rocks down the volcano's sides and into the Paéz and Símbola rivers (figures 11 and 12), causing them to flood, destroying several kilometers of highway and endangering or sweeping away what some government reports stated were 15 bridges (although it is uncertain how many of those were footbridges, and new reports tended to indicate a slightly higher numbers). In an evaluation the lahars of 18 April, INGEOMINAS staff found them quite similar, though smaller, than those of the earthquake and disaster of 1994.
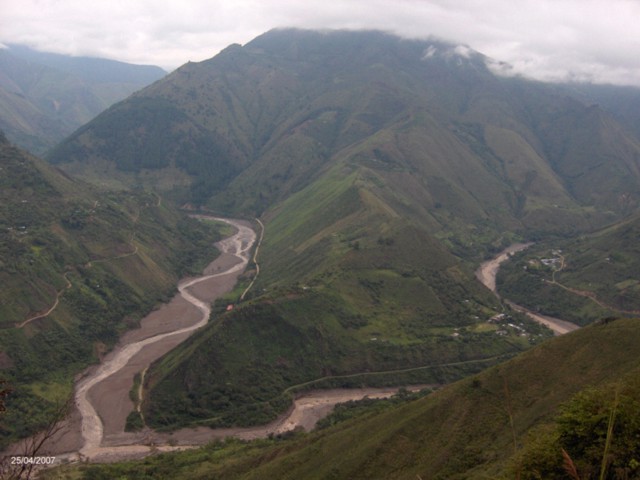 |
Figure 11. Photo from hillside overlooking the confluence of the Paéz and Símbola rivers, viewed upstream towards Nevado del Huila. One of the battered and partly lahar-covered bridges lies in the left-foreground. Photo was taken 25 April 2007 and came from Mumucué (2007). |
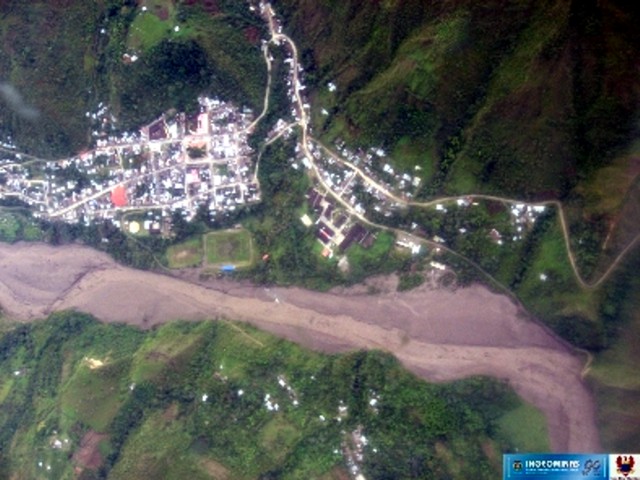 |
Figure 12. An aerial photo of part of the Huila lahar shot in sub-vertical orientation on 22 April 2007. Name and location of this settlement is uncertain. Lahars were apparently insufficiently thick to overrun established settlements. Courtesy of INGEOMINAS. |
Videos. At least three videos taken chiefly from Colombian military or national guard helicopters were posted on the web during April-May 2007 (see Videos, under References). They featured either the volcano or the powerful lahars or both, as follows.
Video 1("Avalancha . . ."; posted 18 April 2007) contains lahar footage from a television newscast, much of it taken from a helicopter. The shots include several bridges destroyed or impacted by lahars and the dialog mentioned nineteen bridges affected. Segments also show closeups of sediments and considerable flooding. Few if any flooded or damaged buildings were shown. Footage shows segments of the river with various gradients; the dark water carrying considerable debris. In one scene of a threatened bridge taken from shore, the turbulent river races by and among the passing logs seemingly floats a large farm animal.
Video 2 ("Sobrevuelo . . ." [Overflight . . .]) was taken by INGEOMINAS on 3 March 2007. It shows the volcano in modest eruption. A dense, dark plume emerges from the complex ice-bound summit area. Somewhat surprisingly, the plume immediately descends one flank of the volcano.
Video 3 (Erupcion . . . 18 Abril) shows vigorous white plumes escaping from multiple vents and forming a dense white plume. The text says that the footage was taken hours after the eruption on 18 April 2007. The base of the volcano is shrouded in weather clouds. The footage credits "Ejercito Nacional-INGEOMINAS-FAC."
Further observations and assessments. Seismicity escalated during 19-20 April but decreased on the 21st. Two larger earthquakes soon took place, on the 22nd and 27th. Their respective seismic signals appeared to come from rock fracturing at shallow depths; they had epicenters at Pico Central, and they were M 3.0 and M 3.2. On 23 April instruments detected continuous low-frequency tremor, interpreted as continuing instability and possible eruptions.
On 22 April, the Colombian Air Force flew INGEOMINAS staff past the volcano. They observed the N-trending fissure seen in February and found it had extended to reach a length of 2.3 km and a width of ~ 200 m. It emitted a white, sulfurous smelling gas column to 5 km altitude. The 22 April observers also saw a second new fissure ~ 2 km long across the same region. Strong fumaroles also discharged. Some lahars remained active down both E and W flank drainages.
Associated with the eruptions and as recent as 28 April 2007, there had been a total of 5,708 seismic events. Of those, 2,861 had signals suggesting rock fracture and 2,847 had signals suggesting movement of fluids.
During late April and early May 2007 the seismicity generally decreased (except for a 6 May, M 3.2 earthquake). On 5 May, INGEOMINAS staff, using a land-based correlation spectrometer, measured an SO2 flux from the volcano at 3,000 tons per day.
Early on 14 May, INGEOMINAS recorded a cluster of 54 low magnitude earthquake events, possibly triggering or associated with an ash emission. Based on satellite imagery of 14 May, the Washington VAAC reported an ash plume 8 km wide in an area 45 km W; it drifted SW and dissipated.
Based on seismic interpretation, INGEOMINAS inferred ash emissions during 27 May. Aerial observations later that day confirmed the emissions. Tremor recorded on 28 May possibly indicated another pulse of ash emissions. The SO2 flux measured on 1 June continued at 3,000 metric tons per day and on 2 June increased to ~ 6,900 metric tons per day. Flights on 3, 6, and 10 June indicated no changes in the existing fissures nor changes in the fumarolic field. Seismicity was relatively quiet during June 2007.
Humanitarian concerns. Luz Amanda Pulido, director of the national disaster office said that there were no reports of deaths or injuries. According to a 22 May report of the UN Office for the Coordination of Human Affairs (OHCA), by 26 April authorities resolved to evacuate 2,307 families affected by the crisis.
A government document issued May 2007 discussed the displaced residents. According to that report (Mumucué, 2007) the number of indigenous inhabitants living around the volcano and affected by lahars or emissions or both totaled 26,949 people. The affected territory he discussed (the Municipio de Páez, which has Belacazar as the main urban center) had an area of ~ 161,000 hectares. The inhabitants losses included cultivated areas and farm animals, including horses and smaller livestock. Photos showed displaced families living in temporary camps with outdoor cooking facilities. Another photo showed workers installing a footbridge where a vehicle bridge was lost to the torrent. That photo, taken ~5 days after the 18 April lahars began showed that by this time the river had greatly receded. The report was also a plea for supplies, including children's clothing and two-way radios with solar panels. Total days of community work devoted to reconstruction after the disaster and as late as May 2007 amounted to 4,264 (Mumucué, 2007).
References. Correa, A.M., and Pulgarín, B.A, 2002a, Revisión histórica de los estudios geológicos y otros aspectos, sobre el volcán Nevado del Huila y su área de influenza, Instituto Colombiano de Geologia y Mineria, INGEOMINAS; Observatorio Vulcanológico y Sismológico, Popayán; Junio de 2002, 51 p.
Correa, A., and Pulgarín, B., 2002b, Morfología, estratigrafía y petrografía general del Complejo Volcánico Nevado del Huila (énfasis en el flanco occidental): INGEOMINAS, Centro Operativo, Popayán, Informe Interno, 104 p.
Mumucué, J.A., May 2007, Analisis de los diversos eventos de erupción volcánica en la región de Tierradentro Páez Cauca hasta el momento: Republica de Colombia, Departamento del Cauca - Region de Tierradentro, Asociación de Cabildos Nasa ?xh??xha.
Pulagarín, B.A., Jordan, E., and Linder, W., 2005, Aspectos geológicos y cambio glaciar del volcán Nevado del Huila entre 1961 y 1995: Proceedings I Conferencia Cambio Climático, Bogotá 2005, 17 p.
Restrepoa, J.D., Kjerfveb, B., Hermelina, M., and Restrepoa, J.C., 2005, Factors controlling sediment yield in a major South American drainage basin: the Magdalena River, Colombia: Journal of Hydrology, v. 316, nos. 1-4, 10 January 2006, p. 213-232.
Restrepoa, J.D., and Kjerfve, B., 2000, Magdalena river: interannual variability (1975-1995) and revised water discharge and sediment load estimates: Journal of Hydrology, v. 235, nos. 1-2, 22 August 2000, p. 137-149, Elsevier.
Schuster, R. L., 1996, Recent earthquake-induced catastrophic landslides in the Andes of Ecuador and Colombia; Abstract, Colorado Scientific Society (URL: http://www.coloscisoc.org/abstracts).
Video References. (1) "Avalancha del Volcan Nevado del Huila" [A newscast from a Colombian television station, www.youtube.com/watch?v=k6nW1DP5mqg
(2) INGEOMINAS, 3 March 2007, Sobrevuelo Ingeominas Nevado Huila pocos dias despues de la erupción" (posted 8 May 2007) [Overflight of summit area] http://www.youtube.com/watch?v=UPP0vzBzZ38 (00:39)
(3) INGEOMINAS, 2007, Erupcion Nevado del Huila Colombia 18 Abril; Video stamped with "Ejercito Nacional-INGEOMINAS-FAC"; http://www.youtube.com/watch?v=xUnYOALOCWg; (00:56) (Posted 8 May 2007)
Information Contacts: Instituto Colombiano de Geología y Minería (INGEOMINAS), Observatorio Vulcanológico y Sismológico de Popayán, Popayán, Colombia; Washington Volcanic Ash Advisory Center (VAAC), Satellite Analysis Branch (SAB), NOAA/NESDIS E/SP23, NOAA Science Center Room 401, 5200 Auth road, Camp Springs, MD 20746, USA (URL: http://www.ospo.noaa.gov/Products/atmosphere/vaac/); Jorge Castilla Echenique, Salud para desplazados, Programa de Emergencias y Desastres OPS/OMS, PWR Colombia; Jorge E. Victoria R., Salud en Desastres y Emergencias Complejas, Organización Panamericana De La Salud, Oficina de Neiva, Carrera 10 No. 4-72, Huila, Colombia; International Charter-Space and Major Disasters (URL: http://www.disasterscharter.org/).
10 lives lost, houses and infrastructure destroyed during November 2008 eruption
Eruptions at Nevado del Huila during February and April 2007 included substantial ash plumes, lahars, earthquake swarms (with individual earthquakes up to M ~3), and the growth of fissures, crevasses, and new fumaroles on the upper, glacier-covered flanks (BGVN 33:01). After the explosive eruption on 18 April 2007, the Instituto Colombiano de Geología y Minería (INGEOMINAS) reported decreasing seismicity and activity through December 2007 (figure 13). After that, sporadic peaks in seismicity occurred in 2008 and, after a significant increase in long period (LP) earthquakes in November 2008, a large eruption and devastating lahars occurred on 20 November 2008. In this report, we discuss hazard mitigation efforts, escalating SO2 emissions, and unrest that culminated in that fatal November 2008 eruption.
INGEOMINAS activity bulletins and documentation of humanitarian efforts in this report were initially synthesized and edited by Jamie Kern, as part of a graduate student writing assignment in a volcanology class at Oregon State University under the guidance of professor Shan de Silva.
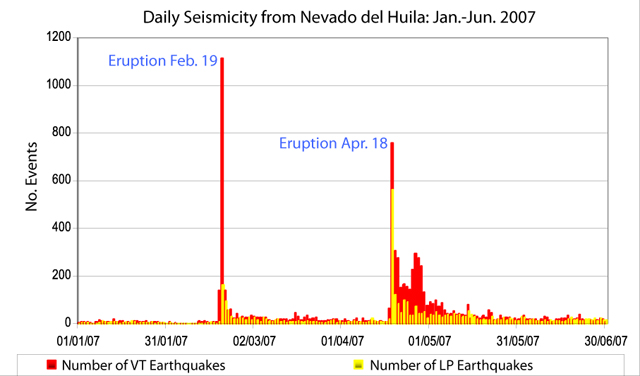 |
Figure 13. In this histogram of daily seismicity for 2007, the two major peaks represent elevated seismicity during Nevado del Huila's February and April 2007 eruptions. Courtesy of INGEOMINAS. |
Two volcanic hazard maps. The INGEOMINAS map of potential volcanic hazards for Nevado del Huila focuses on both the immediate area around the volcanic complex and the extensive drainages in the region (figures 14 and 15), which are differing ways to depict the same hazard information.
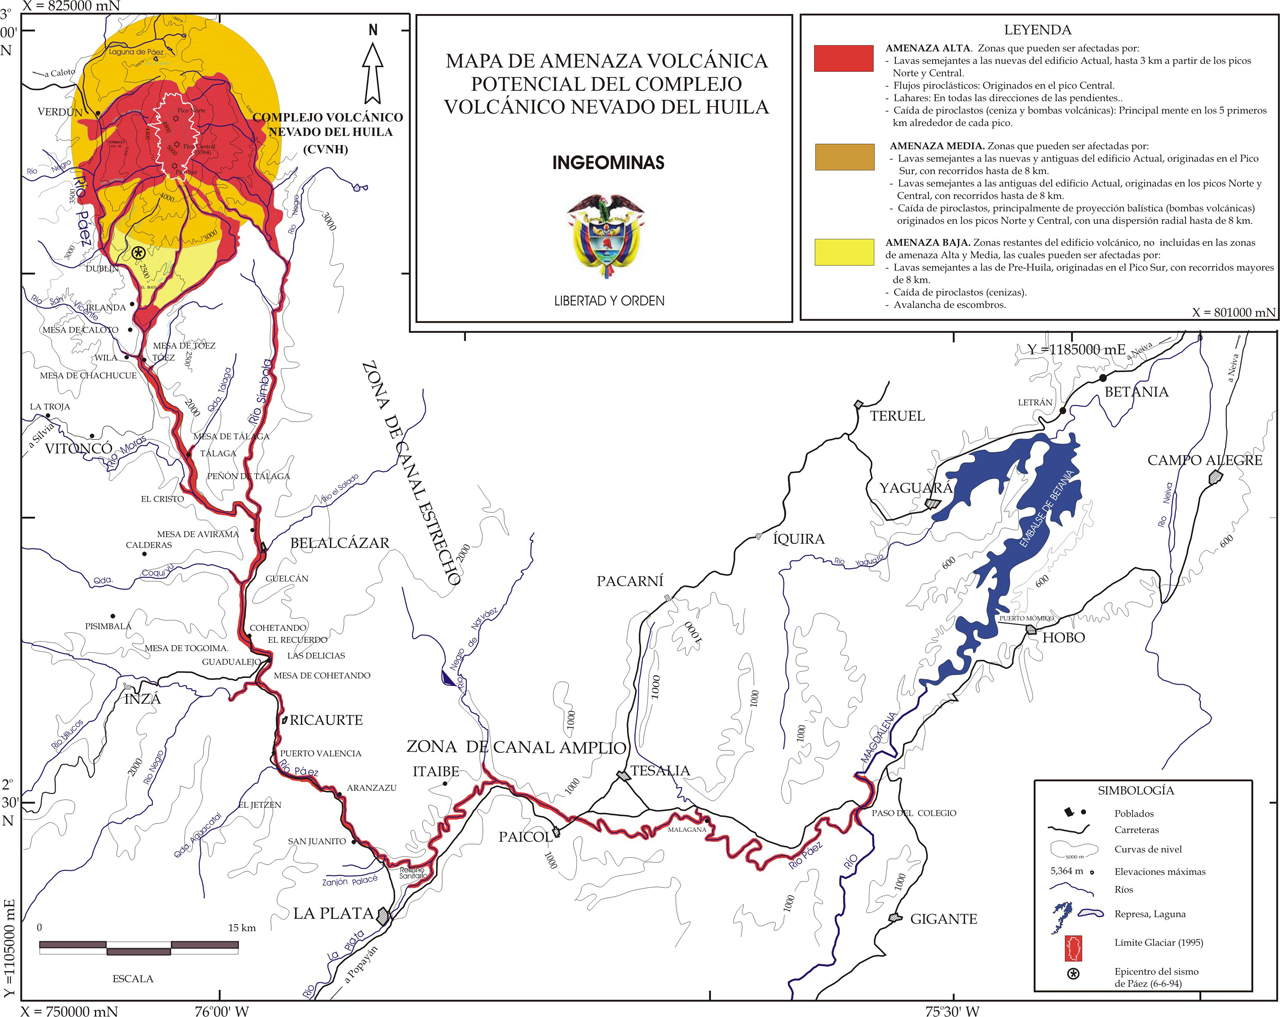 |
Figure 14. This volcanic hazard map of Nevado del Huila was prepared by INGEOMINAS in 1996. Hazard zonation defines three areas at risk: Highest risk (red), Moderate risk (orange), and Low risk (yellow). The Spanish text in "Leyenda" corresponds to descriptions of hazards translated in the accompanying text. Courtesy of INGEOMINAS. |
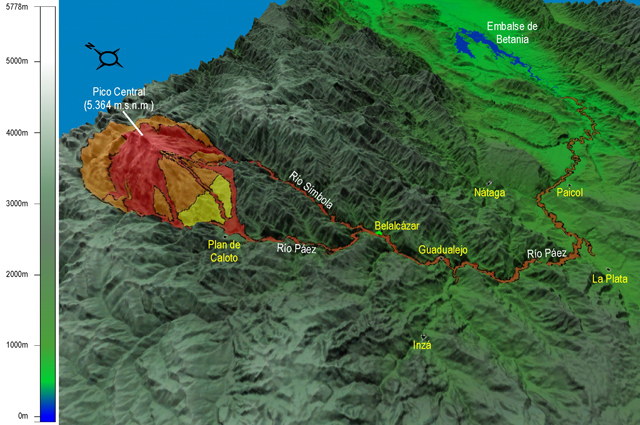 |
Figure 15. This 3D map combines the hazard zones of Nevado del Huila with a digital elevation model (DEM) of the region. Major rivers and towns are labeled including Belalcázar, in the Río Páez channel. For scale, the linear distance between Belalcázar and Guadualejo is ~20 km. Courtesy of INGEOMINAS. |
In figures 14 and 15, the red zone (highest risk) includes the young volcanic edifice and the major drainages; this region may experience lava flows up to 3 km from the edifice, particularly from the N and central peaks (see figure 6 in BGVN 33:01 for an annotated photo of peaks and names); pyroclastic flows are possible from the central peak (Pico Central); lahars could occur along the flanks and connected drainages; ash and volcanic bombs may fall to distances of 5 km from the volcanic peaks. Volcanic seismicity and gases are also a hazard in the most proximal regions. Note the high risk area extends more than 100 km along the length of the major drainage system (reaching the junction with Río Magdalena).
The orange zone (moderate risk) extends beyond the immediate volcanic edifice and encompasses an approximately circular region within a radius of 8 km. Within this zone, lava flows could cover the young and old edifice originating from Pico Sur (S peak) reaching distances up to 5 km; lava flows from the N and central peaks may cover the old edifice; pyroclastics, particularly lava bombs, could reach this region and fall up to 8 km from the N and central peaks. Seismicity and hazardous volcanic gases could also occur in the orange zone, but these events have a lower probability here compared to similar events in the red zone.
The yellow zone (lowest risk) is confined to the S flank within the Río Páez drainage system. This area was distinguished from the other regions due to the potential for debris avalanches, pyroclastic fall (mainly ash), and lava flows that could cover the pre-Huila edifice originating from Pico Sur and extending ~8 km down slope. Pyroclastic flows are also possible in the case of dome or lava flow front collapse.
Post-eruptive activity, May-December 2007. After the main eruption on 18 April 2007 and small ash emissions on 14 and 27 May 2007, INGEOMINAS reported that Nevado del Huila entered a period of relative quiescence (BGVN 33:01).
In late April, SO2 emissions remained high. OMI and mobile DOAS instruments detected SO2 emissions of greater than 13,000 tons per day between 24 and 28 April (table 1). Mobile DOAS data was also available during 1-2 June. Values in the range of 3,000-6,900 tons per day (t/d) were obtained from overflights and land-based traverses beneath the plume (BGVN 33:01).
Table 1. Between 2 March 2007 and 1 May 2007, INGEOMINAS reported seven analyses of SO2 flux from the OMI/Aura satellite. Courtesy of INGEOMINAS, Simon Carn (Michigan Technological University), and the Joint Center for Earth Systems Technology (University of Maryland Baltimore County).
| Date | SO2 concentration-pathlength (for total metric tons atmospheric column) | Areal extent of SO2 (km2) | Maximum Altitude (km above summit) |
| 20 Feb 2007 | 2,500 | 154,265 | 3.67 |
| 21 Feb 2007 | ~1,000 | 270,273 | 5.11 |
| 02 Mar 2007 | 1,000-1,500 | -- | ~1.4 |
| 24 Apr 2007 | 1,555 | 51,767 | 3.71 |
| 26 Apr 2007 | 1,365 | 30,853 | 5.85 |
| 28 Apr 2007 | 1,444 | 51,262 | 3.61 |
| 01 May 2007 | 594 | 24,446 | 2.21 |
After seismic activity peaked during 19-30 April with more than 2,800 volcano-tectonic (VT) events detected, 1,331 VT events were detected in May. Four tremor events during that month were linked to small ash eruptions, the strongest occurred at 1010 UTC on 14 May and 0524 UTC on 21 May.
Seismicity decreased from over 300 events per week in June 2007 to fewer than 100 events per week in December 2007. Shallow and deep earthquakes were recorded during this time period, mostly M 2 or less. Earthquakes were generally clustered in three groups; the shallowest events were those that occurred within less than 3 km below the surface, those that occurred at depths of 4-8 km below the surface, and the deepest events, which occurred at depths between 15-25 km. Small ash explosions may have occurred during tremor events in July and one event in August. The appearance of tremor in local seismic records is often part of the criteria that INGEOMINAS considers when interpreting ash emissions from Nevado del Huila.
During a 19 August observation flight conducted by INGEOMINAS, scientists observed no changes in the dimensions of the fractures or the fumarolic activity since the April eruptions (figure 16). Observers saw a white column of gas that rose up to 100 m above the crater.
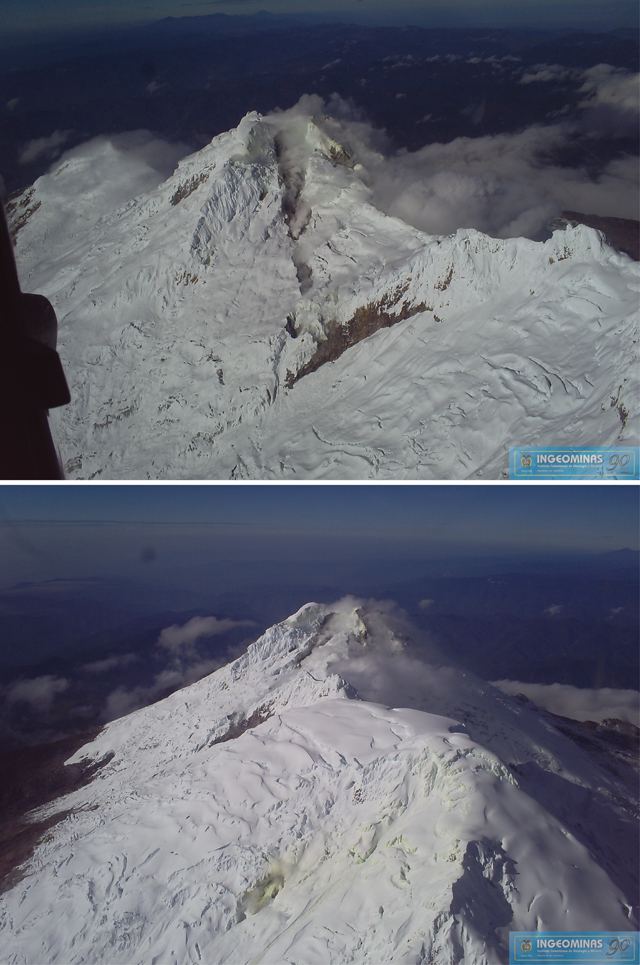 |
Figure 16. During an overflight of Nevado del Huila on 19 August 2007, views of Pico Central and Pico Norte showed the effects of unrest from earlier in the year, however, no additional changes were apparent. Details follow. (Top) One feature that had developed in February 2007 was a long, black fracture cutting down the N side of Pico Central. Yellow-colored snow and ice, described by INGEOMINAS as sulfur deposits, were visible near the top of Pico Central; steam-and-gas emissions vented along the fissure's length. (Bottom) On 19 August 2007, INGEOMINAS observed discolored snow and ice around a fumarole located on the N flank of Pico Norte (pale yellow steaming zone in the foreground). This fumarole had been active in February and April 2007. The tall peak in the middle ground is Pico Central. Courtesy of INGEOMINAS. |
Activity during January-May 2008. In January 2008, INGEOMINAS reported five episodes of tremor attributed to small ash events. People aboard commercial flights passing over the volcano in early January reported new ash deposits on the W flank of Pico Central. Seismometers detected pulses of tremor (~19), VT earthquakes (~193), and long-period (LP) seismicity (~284).
In February, INGEOMINAS reported that seismicity had decreased slightly. Volcanic tremor was rare (~4 events) and ~131 VT and ~193 LP events were detected. On 8 and 12 February, traverses with a mobile DOAS measured SO2 fluxes of 1,371 and 612 t/d, respectively. On both days, the gas column was dispersing NW. INGEOMINAS scientists conducted these surveys along the Pan-American Highway between Calí and Popayán.
Seismicity increased in March. Four swarms of earthquakes were detected and INGEOMINAS reported 23 tremor events, 704 VT events, and 478 LP earthquakes. SO2 emissions were assessed on 25 March during a mobile DOAS survey yielding 655 t/d.
Based on elevated seismicity, INGEOMINAS announced on 29 March 2008 an increase in Alert Level from Yellow (III, "Changes in the behavior of volcanic activity") to Orange (II, "Probability of eruption in terms of days or weeks").
El Tiempo reported on 4 April 2008 that Colombian Red Cross volunteers in the town of Belalcázar (~28 km SSE) on the Páez River were on 24-hour alert. The Local Committee of Disaster Prevention ordered the municipal school closed and placed the hospital on maximum alert. Jorge Quintero, director of the Red Cross in Belalcázar, reported that the town was aware of the dangers of mudflows and evacuation routes were in place, but that there were few shelters in the town and little aid to help them prepare for an eruption.
During an observation flight on 5 April, no significant geomorphic changes were observed at Pico Central or Pico Norte; sulfur odors were reported near areas of the E flank. Authorities of the Department of Cauca gave evacuation orders for families living in the Páez river basin on Monday 7 April. Inhabitants in high-risk areas were told to move to shelters in larger cities such as Inzá (25 km SSW) and Belalcázar. Elevated seismicity continued; ~12 pulses of tremor, 140 VT, and 84 LP earthquakes were recorded during 2-8 April.
Based on weekly bulletins from INGEOMINAS, there had been no reports of ash emissions since 25 March. On 8 April, the Alert Level was decreased to Yellow (III). On 13 April, a seismic swarm lasting over 2 hours and an associated M 3.4 earthquake near Pico Central resulted in an increase of the Alert Level to Orange (II).
On 14 April, a swarm of earthquakes was detected and LP seismicity suggested ash emissions had occurred. At 2308, the Alert Level was raised to Red (I), indicating "imminent eruption or in course," although the darkness made it difficult to discern what activity was occurring. El Tiempo reported that 4,500 people evacuated in less than 20 minutes from high-risk areas. The following day, the Alert Level was lowered to Orange (II).
On 15 April, INGEOMINAS reported that a seismic swarm occurred; between 2300 on 14 April and 0300 on 15 April, ~300 earthquakes were detected. Three VT earthquakes were detected during 13-15 April with magnitudes between 3.0 and 3.7. A gas survey with a mobile DOAS system was conducted on 15 April; the gas plume was dispersing W from the summit with an average flux of 700 t/d. SO2 surveys were repeated between 16 and 19 April and INGEOMINAS reported fluxes with a maximum of 1,541 t/d and a minimum of 514 t/d (the gas column dispersed W and the traverse followed the Pan-American Highway).
An observation flight on 29 April revealed no significant changes due to volcanic activity, but some glacial material had shaken loose and formed small flows high on the volcano that did not reach any major rivers. April seismicity included 966 VT, 642 LP, and 65 tremor events (figure 17).
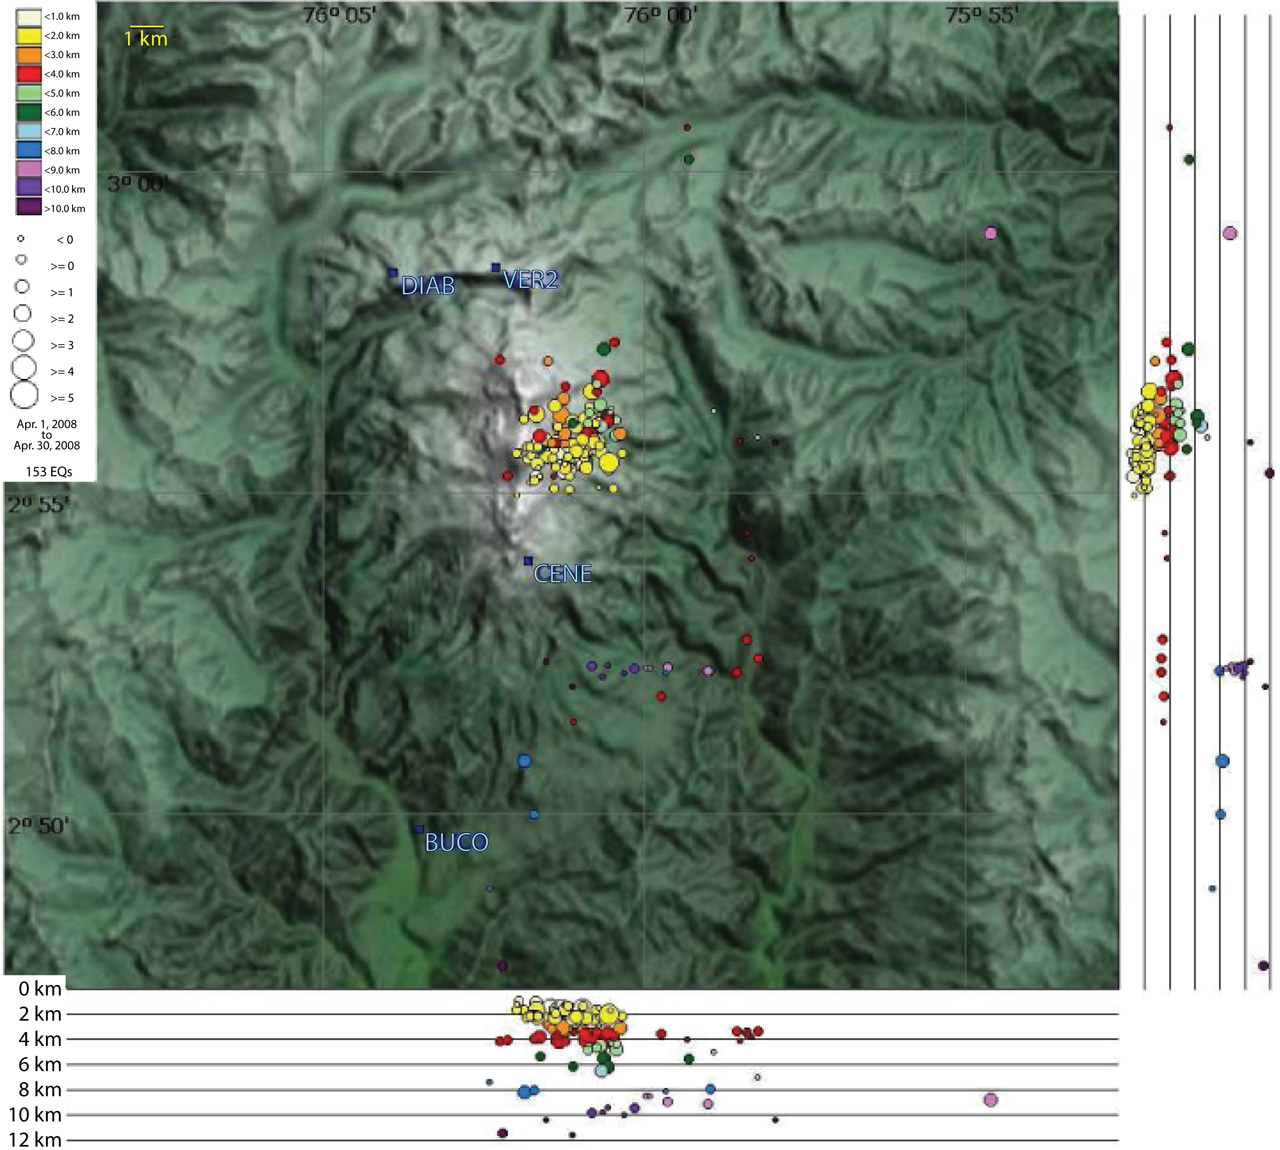 |
Figure 17. INGEOMINAS calculated 153 hypocenters for VT earthquakes at Nevado del Huila in April 2008. The shallowest events (1-3 km deep) clustered beneath the edifice in an area immediately ENE of Pico Central. This clustering of events was last observed in November 2007. Four seismic stations (VER2, DIAB, CENE, and BUCO) are labeled in blue text. Courtesy of INGEOMINAS. |
By early May, seismicity had decreased and the Alert Level was lowered to Yellow (III) on 6 May. On 9 May at 2316, 25 minutes of tremor occurred in an episode likely associated with ash emissions. This episode was preceded by 16 pulses of low-magnitude tremor. Sparse M 2-3 earthquakes were registered from Pico Central throughout the month and a swarm of 20 such events occurred on 27 May. The largest earthquake during this time, M 3.9, occurred at 2020. This event was felt by residents in the area of Plan de Caloto (2-7 km SW of Nevado del Huila) and had a relatively shallow depth, ~3 km below the summit of Pico Central. During 27-29 May LP earthquakes dominated the records.
Activity during June-August 2008. From June to August 2008, INGEOMINAS conducted gas surveys with a mobile DOAS system and recorded elevated SO2 emissions (figure 18). During this time period, the minimum flux was measured on 3 June (600 t/d) and the maximum flux was on 20 June (6,700 t/d). Sulfur dioxide odors were reported by scientists during an overflight of Nevado del Huila on 12 June 2008.
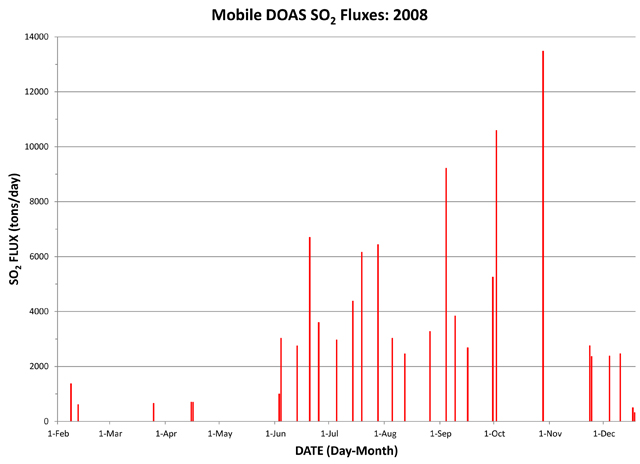 |
Figure 18. With a mobile DOAS unit, INGEOMINAS conducted gas surveys to determine SO2 flux from Nevado del Huila. Beginning in February 2008, SO2 emissions were relatively low until 13 June when 2,748 t/d was detected; SO2 emissions peaked on 28 October (13,482 t/d). The plume tended to disperse W and NW except in October when the plum drifted SW. Courtesy of INGEOMINAS. |
Seismicity during June-August 2008 included small episodes of VT and LP events, however, VT earthquakes dominated the record beginning in July (figure 19). An M 3.9 earthquake was felt by local residents on 11 June; this event occurred at 1503 local time and had a focal depth of 3 km below the summit of Pico Central. On 2 July at 1756, an M 2.7 VT earthquake occurred that was also detected by local populations in Plan de Caloto. This event was located 6.7 km S of Pico Central and had a focal depth of 2 km.
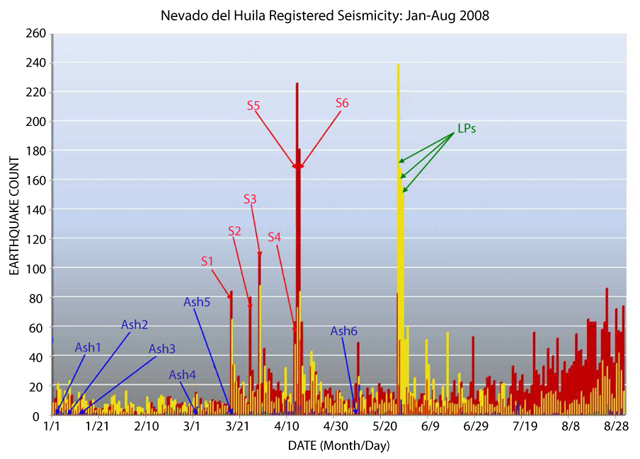 |
Figure 19. VT and LP seismicity from Nevado del Huila during January-August 2008 included numerous peaks that correlated with seismic swarms and ash emissions. Dates of highlighted events are as follows: Ash emissions, Ash1 = 2 January, Ash2 = 7 January, Ash3 = 12 January, Ash4 = 2 March, Ash5 = 17 March, Ash6 = 9 May; seismic swarms, S1 = 17 March, S2 = 25 March, S3 = 29 March, S4 = 13 April, S5 = 14 April, S6 = 15 April; and three episodes of LP earthquakes = 27-29 May. This plot was modified from a figure developed by INGEOMINAS. |
From June to August 2008, an average of 60 hybrid and 6 surficial events (rockfalls, avalanches, glacial noise, etc.) were detected per month. For the month of August 2008, seismometers detected 1,456 VT, 502 LP, 62 hybrid, 15 tremor, and 13 surficial events. Compared to April 2008, the distribution of earthquake hypocenters had become more dispersed over time. Thus, in August, earthquake focal depths were in the range of 0-13 km and were concentrated within linear groups (figure 20).
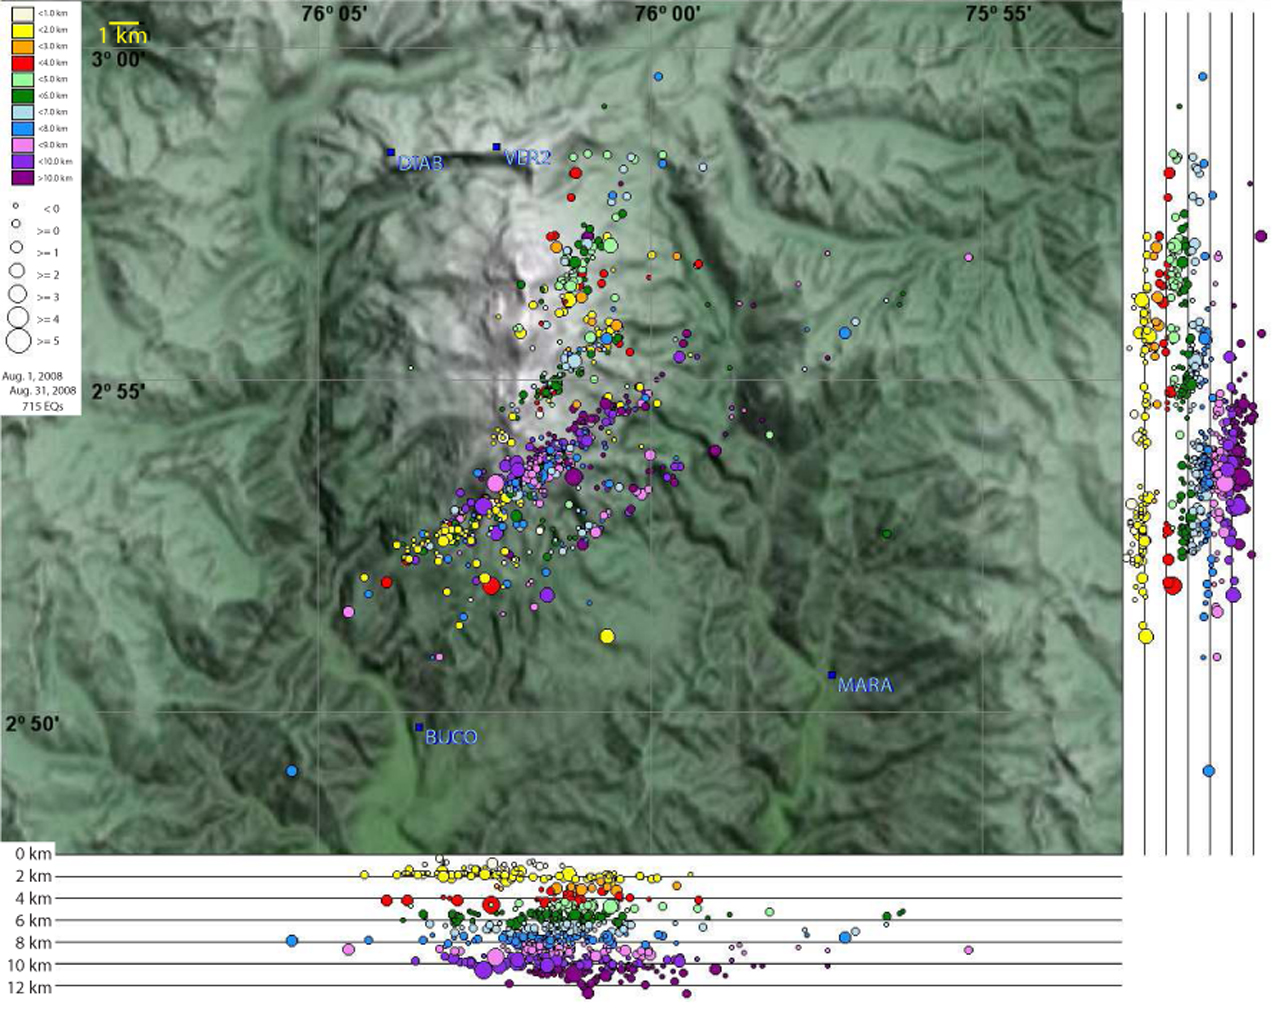 |
Figure 20. INGEOMINAS calculated 715 hypocenters for Huila's VT earthquakes in August 2008. Focal depths were in the range of 0-13 km below the edifice. Regardless of depth, these events were roughly aligned in diagonal groups. Four seismic stations (VER2, DIAB, MARA, and BUCO) are labeled in blue text. Courtesy of INGEOMINAS. |
Activity during September-October 2008. On 2 September 2008, an M 4.6 earthquake shook Pico Central, after which seismic activity steadily increased during the month. This earthquake was located 2.2 km NE of Pico Central and 1.7 km deep. Relatively large earthquakes were detected during 4-8 and 13-14 September. Four of the six largest earthquakes during 4-8 September caused local residents to report shaking. The largest event was an M 4, located 1 km N of Pico Central and at a depth of 3.5 km.
An M 4 earthquake that occurred at 1329 on 14 September was also noticed by residents; this event was 6.2 km SW of Pico Central with a focal depth of 7.3 km. VT seismicity continued to dominate the records in September and that month, the number of LP, tremor, and hybrid earthquakes increased compared to August (table 2).
Table 2. Seismicity detected at Nevado del Huila during August-December 2008. Courtesy of INGEOMINAS.
| Month | Volcano-tectonic | Long-period | Tremor | Hybrid | Surficial (eg. rockfalls) |
| Aug 2008 | 1,456 | 502 | 15 | 62 | 13 |
| Sep 2008 | 1,722 | 770 | 34 | 564 | 8 |
| Oct 2008 | 1,437 | 2,260 | 537 | 105 | 10 |
| Nov 2008 | 890 | 18,704 | 903 | 0 | 2 |
| Dec 2008 | 259 | 221 | 19 | 7 | 0 |
INGEOMINAS conducted four gas surveys in September and measured elevated SO2 emissions during traverses along the Pan-American Highway between Popayán and Calí, and also along the road between Corinto and Santander de Quilichao. The highest values were obtained on 4 September, when the SO2 flux was measured to be 9,215 t/d (figure 18).
During an observation flight in cooperation with the Colombian Air Force (FAC) on 12 September, observers noted intense fumarolic activity and small mudflows on the volcano's upper flanks. Seismicity was relatively high on 12 September and, at 0817, INGEOMINAS reported a tremor signal with a duration of approximately four hours. Ash-and-gas emissions may have been associated with that event.
INGEOMINAS detected over 550 seismic events clustered in 4 seismic swarms over 48 hours during 2-3 October 2008. On 2 October, the SO2 flux was 10,590 t/d, the highest yet recorded in 2008 (figure 21). INGEOMINAS interpreted this increased activity to represent a magmatic intrusion that was actively degassing. Fluctuating activity continued throughout October. NOAA satellite images revealed a constant flow of SO2 gas in a white cloud from the northern sector of the volcano. By 28 October, SO2 emissions had increased to 13,482 t/d, and passengers on commercial flights over the volcano noticed a strong sulfur odor.
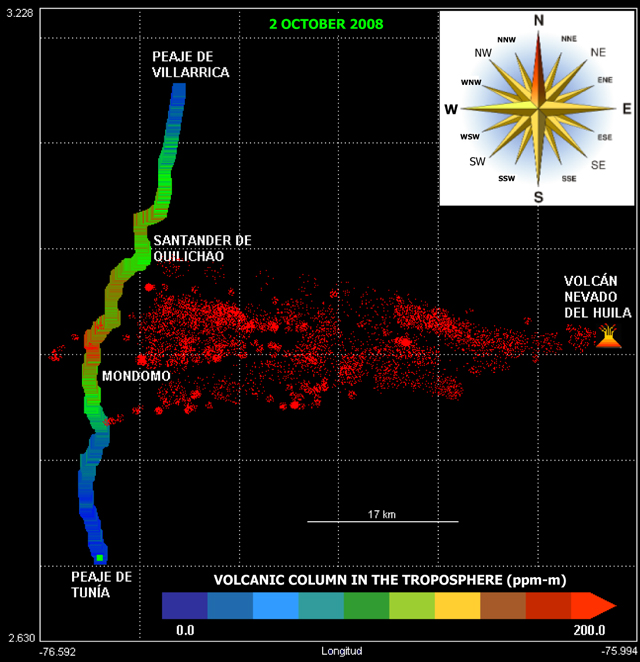 |
Figure 21. On 2 October 2008, INGEOMINAS conducted a gas survey to measure SO2 emissions from Nevado del Huila with a mobile DOAS. This image shows the route followed by investigators along the Pan-American Highway between the locations of Peaje de Villarrica and Peaje de Tunía; Popayán (73.5 km S of Mondomo) and Calí (~69 km N of Mondomo) are out of view. The approximate location of the gas plume and the volcano were added to the raw image for visual references. Note that the highest concentration-pathlength of SO2, ~200 ppm-m (parts per million per meter), was encountered N of the town Mondomo. Courtesy of INGEOMINAS. |
INGEOMINAS recorded significant increases in LP and tremor seismicity in October 2008 (table 2). LP earthquakes more than doubled and tremor had increased from 34 to 537 events since the previous month. VT events had occurred slightly less frequently (1,437 events in October compared to 1,722 events in September), and there were fewer hybrid events recorded.
Elevated activity in early November 2008. In early November, residents of Wila, Tóez, and Plan de Caloto along the Páez River (approximately 2-7 km to the SW) reported ashfall and strong sulfur odors following an intense period of seismicity on 3 November. Inhabitants on the S side of the volcano observed that gas emissions changed color from white to gray for short intervals.
Continuous seismic tremor was detected on 7 November and prompted an increase in the Alert Level from Yellow to Orange. INGEOMINAS reported that the volcano had entered a phase of unrest that could lead to hazardous conditions.
With the assistance of the Colombian Air Force, scientists aboard flights on 8 and 9 November observed cracks forming on the S side of Pico Central and traces of mudflows and ash originating from Pico Central that were thought to have contributed to the murky water in the Páez River during preceding days. Twenty families evacuated from the Símbola River on the E flank after increased seismic and fumarolic activity. A team of civil servants from Popayán was deployed to Belalcázar and Inzá to coordinate evacuations in the event of an eruption. The mayor of the Páez municipality closed schools in areas surrounding the Páez River and announced evacuation routes.
During the second week of November 2008, INGEOMINAS reported that, on average, 1,210 earthquakes were occurring per day. Earthquakes related to dynamic fluids (LP events) continued to dominate seismic records and INGEOMINAS described these events as possible evidence of a magma system migrating to the surface. They continued to receive reports of sulfur odors and ashfall in local regions W and SW of the edifice.
During 7-17 November, the Washington Volcanic Ash Advisory Center (VAAC) reported possible ash plumes from Nevado del Huila, however, satellite observations were limited due to persistent cloud cover. On 9, 10, 13, and 14 November, clear satellite views of the region revealed ash plumes up to ~9.25 km wide and ~37 km long drifting from the volcano. On 9 and 10 November, ash plumes reached ~5.5 km altitude and tended to drift W; communities located up to 20 km NW of Nevado del Huila reported ashfall on the morning of 10 November. On 13 and 14 November, ash plumes reached 6.7 km altitude and drifted SW and S, respectively.
On 14 November, scientists identified a conspicuous "drumbeat" pattern of seismicity underneath the volcano, signifying the movement of magma and the potential buildup to an eruption (figure 22). This pattern intensified over the next six days.
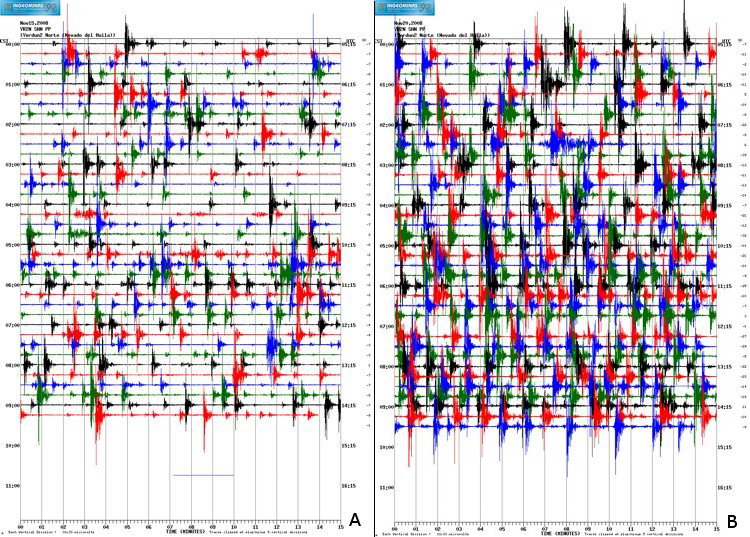 |
Figure 22. "Drumbeat" pattern of seismicity detected at Nevado del Huila prior to the 20 November 2008 eruption: (a) 15 November 2008, and (b) 19 November 2008. Each line is 15 minutes long and color-coded (red, blue, green, and black) as a visual aid to distinguish lines; local time is recorded at the beginning and end of each line. Courtesy of INGEOMINAS. |
Drumbeat earthquakes. The term "drumbeat" was coined by scientists during the onset of the Mount St. Helens (MSH) 2004 eruption (BGVN 30:12). After a series of seismic swarms, tremor, and explosions from the crater, USGS scientists noted that regular, impulsive seismic signals were detected at shallow depths beneath the Mount St. Helens dome on 16 October 2004; this pattern of seismicity continued until the end of 2005 (Moran and others, 2008).
“Seismograms showed that drumbeat waveforms typically had impulsive, high-frequency onsets and low-frequency codas, similar to those of other ‘hybrid’ volcanic earthquakes...all drumbeats originated at depths
Eruption during 20-21 November 2008. At 2145 on 20 November 2008, Nevado del Huila erupted. Two large lahars swept into the Páez River, claiming 10 lives and destroying bridges, houses, and pastures. According to the UN Office for the Coordination of Humanitarian Affairs (OCHA), the lahars had heights of as much as 30 meters, traveled down the Páez river, and joined the Magdalena River, which feeds the Betania reservoir in Yaguara municipality in Huila department; the reservoir cushioned the impact of the mud flows moving downstream. The inhabitants of Taravira (~22 km S), Toez (~15 km SSW), and La Estrella reported significant ashfall and loud noises likely associated with lahars in nearby drainages. By the following day, seismic activity diminished significantly, and the Alert Level was lowered from Red (I, posted during the eruption) to Orange (II).
The Washington VAAC detected two large plumes of gas and ash at 0345 on 21 November with altitudes ~14 km and ~11 km drifting SE and W, respectively. Two additional alerts were released (at 0445 and 1045) that tracked the ash plumes as they continued to drift at velocities up to 10 m/s SE and W.
During two observation flights conducted with the support of the Colombian Air Force, observers saw a 400-m-diameter crater in the S part of Pico Central containing a degassing lava dome on 21 November (figure 23). The lava dome was thought to have formed during previous months, but had not been visible due to poor weather conditions prior to the eruption. Lahars were observed to originate from the upper flanks of the volcano and extend into the Páez River basin (figure 24). Strong fumarolic activity was observed along the large cracks in the volcano from previous eruptions. INGEOMINAS reported that they would continuously monitor the lava dome for future hazards, but that they believed that the late November eruption had ended.
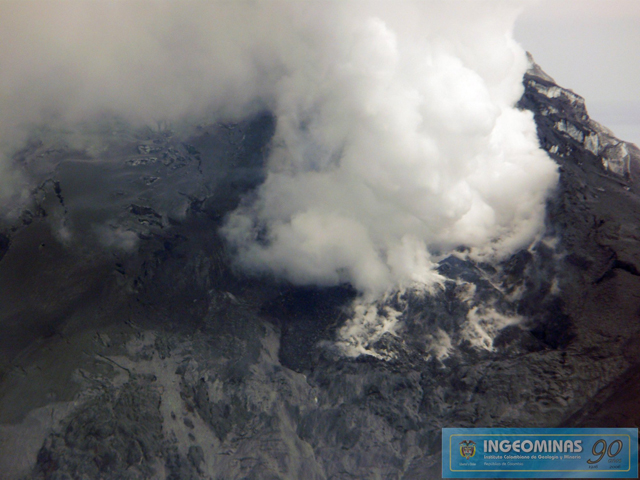 |
Figure 23. Aerial photo of Nevado del Huila's degassing lava dome on 21 November 2008. This view is toward the S-facing summit of Pico Central. Courtesy of INGEOMINAS. |
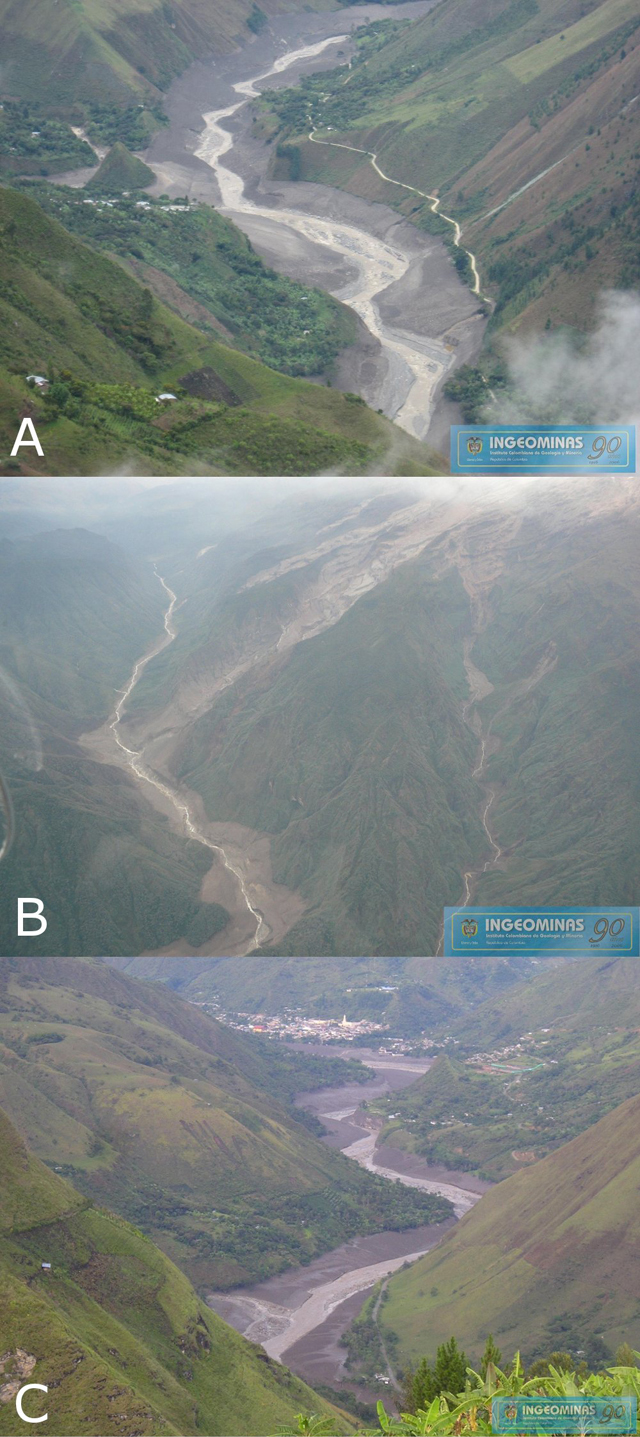 |
Figure 24. Aerial photos of mudflows into the Páez River after the 20 November 2008 eruption of Nevado del Huila. (A and B) Views along the Páez River. (C) A view of Belalcázar from Togoima. Courtesy of INGEOMINAS. |
Human toll and humanitarian response. On 23 November 2008, the National Direction for Prevention and Assistance (DPAD) reported that six people had died (three boys, one girl and two men) and three people were missing. The International Federation's Disaster Relief Emergency Fund (DREF) reported that over 8,000 people were affected by the lahars (table 3). On 21 November, President Alvaro Uribe flew over the disaster area to observe the damage. Afterward, he designated a special commission to oversee the repair of infrastructure damaged by the mudflows. Destruction of bridges and roads made humanitarian aid to the area difficult, especially to more isolated communities, but the Colombian Air Force (FAC) provided air support to ease relief efforts.
Table 3. Human impact of the 20 November 2008 Nevado del Huila eruption. Adapted from ReliefWeb DREF report.
| Category | Number of People |
| People evacuated during the eruption phase | 6,000 |
| People affected after the eruption | 2,864 |
| Casualties | 10 |
| Injured | 7 |
| Missing | 6 |
| Houses destroyed in urban areas | 40 |
| Houses destroyed in rural areas | 7 |
| Houses damaged in urban areas | 75 |
| Houses damaged in rural areas | 14 |
DREF funding had been awarded to the Colombian Red Cross Society (CRCS) in April 2008 to provide disaster aid. Temporary shelters set up by the CRCS in Belalcázar were crude but successfully sheltered nearly 1,000 people early in the relief efforts. The Colombian government and the National System for Disaster Preparedness and Response (SNPAD) provided over 98 tons of humanitarian relief distributed by SNPAD, CRCS, FAC, and other organizations.
Activity during December 2008. After the November eruption, volcanic unrest significantly decreased. Seismic activity decreased to less than 500 events per week (table 2), and SO2 emissions decreased to approximately 2,500 t/d (figure 18). Overflights were conducted on 4 and 6 December to observe the degassing lava dome; gases were primarily rising from the highest portions of the dome, producing a white plume reaching less than 1,000 m above the peak (figure 25). New fractures were also observed in the surface of Pico Central's glaciers. INGEOMINAS reported an estimated lava-dome volume of 4,500,000 m3. A more recent estimate, however, was proposed in an online December report by INGEOMINAS citing 32,000,000 m3 with dimensions of 700 m N-S and 250 m E-W.
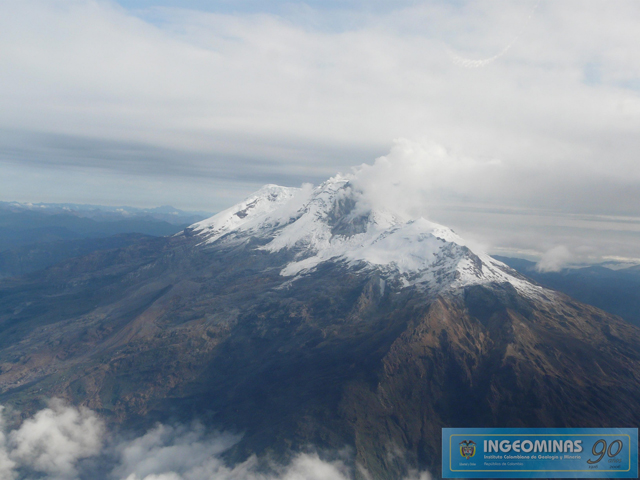 |
Figure 25. On 6 December 2008 INGEOMINAS captured this image of Nevado del Huila. The new lava dome appears dark gray against the snowy peak, Pico Central. This view is looking approximately NNE. Courtesy of INGEOMINAS. |
On 12 December 2008, a webcam was installed within the SSW sector of Nevado del Huila and by 18 December began to provide continuous visual monitoring of changes in the dome. Installed at Tafxnú (viewing the NW flank of Nevado del Huila), the camera was programmed to refresh the images every minute. This equipment was a donation from the U.S. Geological Survey.
On 18 December a permanent station dedicated to the monitoring of SO2 emissions was installed in the town of Caloto (Cauca). Elevated SO2 emissions continued to the end of December and were detected by the AURA/OMI satellite. Sulfur dioxide odors were noted by a commercial airline crew at 0158 on 30 December.
References. Iverson, R.M., Dzurisin, D., Gardner, C.A., Gerlach, T.M., LaHusen, R.G., Lisowski, M., Major, J.J., Malone, S.D., Messerich, J.A., Moran, S.C., Pallister, J.S., Qamar, A.I., Schilling, S.P., and Vallance, J.W. (2006) Dynamics of seismogenic volcanic extrusion at Mount St Helens in 2004-05, Nature, 444: 439-443.
Moran, S.C., Malone, S.D., Qamar, A.I., Thelen, W.A., Wright, A.K., and Caplan-Auerbach, J. (2008) Seismicity associated with renewed dome building at Mount St. Helens, 2004-2005. In Sherrod, D.R., Scott, W.E., Stauffer, P.H. (eds) A volcano rekindled: the renewed eruption of Mount St. Helens, 2004-2006. U.S. Geological Survey Professional Paper 1750: 27-60.
Information Contacts: Instituto Colombiano de Geologia y Mineria (INGEOMINAS), Observatorio Vulcanológico y Sismológico de Popayán, Popayán, Colombia; Washington Volcanic Ash Advisory Center (VAAC), NOAA Science Center Room 401, 5200 Auth road, Camp Springs, MD 20746, USA (URL: http://www.ospo.noaa.gov/Products/atmosphere/vaac/); Ozone Monitoring Instrument (OMI), Sulfur Dioxide Group, Joint Center for Earth Systems Technology, University of Maryland Baltimore County (UMBC), 1000 Hilltop Circle, Baltimore, MD 21250, USA (URL: https://so2.gsfc.nasa.gov/); United Nations Office for the Coordination of Humanitarian Affairs (OCHA) (URL: http://www.unocha.org/); International Federation’s Disaster Relief Emergency Fund (DREF) (URL: http://www.ifrc.org/); Colombian Red Cross Society (CRCS) (URL: http://www.cruzrojacolombiana.org/); ReliefWeb (URL: https://reliefweb.int/report/colombia/colombia-volcano-dref-operation-no-mdrco005-final-report); El Tiempo (URL: http://www.eltiempo.com/archivo/documento/CMS-4100993).
Dome growth and displaced glacier in 2009; decreasing activity during 2010-2012
Lava dome emplacement occurred at Nevado del Huila's Pico Central (central peak) in late 2008, and was accompanied by seismic unrest and significant sulfur dioxide (SO2) emissions (BGVN 37:10). Extrusion continued between November 2008 and November 2009. Ash plumes were frequently observed by webcameras during late 2008 to December 2009, and satellite imagery reviewed by the Washington Volcanic Ash Advisory Center (VAAC) detected intermittent ash emissions between October 2009 and April 2011. From January 2009 to December 2012, the Instituto Colombiano de Geología y Minería (INGEOMINAS) reported persistent emissions from the lava dome and dramatic changes to the perched glacier as the lava dome expanded across the E and W flanks. Activity generally decreased in November 2010 through 2012.
In this report, we focus on the time period of December 2008-December 2012 and also discuss monitoring efforts overseen by INGEOMINAS with collaborators such as the Colombian Air Force (FAC), the Washington VAAC, and the Sulfur Dioxide Group's Ozone Monitoring Instrument (OMI). The following subsections review webcamera and aerial observations, thermal-camera imaging, satellite images of volcanic plumes, seismicity, SO2 measurements (DOAS, Flyspec, and OMI), acoustic flow monitoring, and new tilt data. The local monitoring network was expanded during this reporting period, adding two infrasound monitoring stations in 2009 and 2012, two webcameras in 2010 and 2012, and instrumentation at the Caloto site that included a broadband seismometer and an electronic tilt station in 2012.
Web-camera observations. From December 2008 to December 2009, the Tafxnú web-camera (located ~15 km S of the volcanic edifice) frequently recorded gas-and-ash plumes rising higher than 2,000 m above the active dome (figure 26). In 2009, plumes (frequently ash-and-gas, but in some cases gas without ash) rose to maximum heights above the dome as follows: 1,000-2,000 m in June; 1,000-2,500 m in November; and 2,000-5,000 m in December.
|
Figure 26. On 6 and 9 November 2009, summit activity from Nevado del Huila was observed by INGEOMINAS' N-looking Tafxnú web-camera. Accelerated dome growth was noted by INGEOMINAS that month (discussed in text below), and they annotated this image to circle the location of incandescence and summit activity. Note that these images have been altered from the originals; GVP staff increased the brightness and contrast in order to better distinguish the peaks of the Huila complex. (Top images) Incandescence on 6 November was absent at 0331 (left image) but appeared at 0333 within the green circled region (right image). INGEOMINAS suggested this incandescence resulted from dome collapse events exposing hot rock. The darker peak centered in the foreground is Pico Sur, while the active Pico Central is located higher and to the right of that peak in these images. (Bottom images) Plumes of ash and gas drifting NW from Pico Central were observed on 9 November at 0652 (left image) and 0653 (right image). The green circled region in the left-hand image corresponds to the same location circled in the image from 0333 on 6 November. Two water droplets on the camera lens created the local circular distortions. Courtesy of INGEOMINAS. |
An additional camera was brought online in July 2010, located in the town of Maravillas (~10 km SE). A third camera, located at the Caloto site (~4 km SSW of the active dome) came online in July 2012 (figures 27 and 28).
|
Figure 27. This composite image shows, at left, a map view of the three Nevado del Huila webcamera locations and the extent of their viewsheds. Photos at right show camera installation sites. The newest monitoring station (Caloto) was installed on 19 May 2012 on the SW flank. Courtesy of INGEOMINAS. |
|
Figure 28. A map of monitoring stations for Nevado del Huila from June 2012 included locations of webcameras and seismic, geochemical, and geophysical instruments. The summit of Pico Central is located approximately beneath the text BUCB. Note that yellow and black lines represent major and minor roads, respectively, and blue lines represent rivers. Courtesy of INGEOMINAS. |
Observations of dome growth and summit activity during 2009-2010. With support from the Colombian Air Force (FAC) during 2009-2012, INGEOMINAS monitored dome growth and geomorphological changes at Huila by conducting aerial observations with helicopters.
During February 2009 and June-December 2009, INGEOMINAS reported numerous episodes of tremor that were likely associated with ash emissions, but cloud cover and nightfall sometimes precluded direct observations. Notable ash plumes were observed on 11 February, 23 July, 3 August, 16-23 October, and 3, 9, 12, 13 and 15 November; ashfall was noted by observers on all days except 11 February. A crack that had formed along the N face of Pico Central in 2007 continued to steam during this time period.
During three overflights conducted in January 2009, INGEOMINAS determined that the Pico Central lava dome had grown since November 2008. With repeat aerial photography, scientists calculated a total dome volume of 52 x 106 m3 with dimensions of 1,000 m N-S and 250 m E-W. The fresh dome rock continuously degassed (figure 29). Tafxnú webcamera images also showed that gas emissions frequently rising above Pico Central were often blue-colored. Due to continued unrest at Nevado del Huila (note that this name is shortened to 'Huila' during the remainder of this report), especially seismicity and active dome growth at Pico Central, INGEOMINAS maintained Orange Alert (Alert Level II; the second highest Alert Level on a 4-color scale from Green/IV-Yellow/III-Orange/II-Red/I) during January-February 2009.
|
Figure 29. On 28 January 2009, the FAC facilitated observations of Nevado del Huila's growing lava-dome. In this view, the SW flank (centered) emitted a small gas column. This image highlights the zone of active lava dome growth (outlined in yellow) and the perimeter of the crater (outlined in orange). Courtesy of FAC and INGEOMINAS. |
On 11 February 2009, a small pulse of tremor was accompanied by an ash plume discharged at Pico Central which was captured by the Taxfnú webcamera during 0745-0751. During that time period, INGEOMINAS noted a small pulse of tremor. On 23 February, an INGEOMINAS passenger on a commercial aircraft saw diffuse gas escaping from both the crater that hosts the dome and from the N-flank crack. During March, the webcamera frequently showed degassing from the crater and the lava dome. Clear conditions enabled observers on commercial flights to observe a white plume rising from Pico Central in the morning of 10 March. INGEOMINAS noted that both seismicity and remote observations of dome growth indicated decreased activity since February. Accordingly, on 31 March 2009, INGEOMINAS reduced the Alert Level to Yellow (II).
Aerial observations in April highlighted the presence of ash covering the S glacier, confirming the ongoing eruption. Elevated temperatures were concentrated at the extreme high and low points of the dome and degassing continued from the higher-elevation portion of the crater (figure 30).
|
Figure 30. Photos taken on 19 April 2009 showed Nevado del Huila's active dome and the adjacent ash-covered and locally disturbed glacier. (top) In this visible-light view, the active lava dome has extended down the SW flank of Pico Central (yellow line). Cloud cover obscures the upper peaks of Pico Central (left) and Pico Sur (right). The glacier around Pico Central is difficult to distinguish due to ash cover and cracking attributed to dome emplacement. (bottom) This image is a close-up of the lava dome's SW flank with a forward-looking infrared (FLIR) camera which disclosed higher thermal flux from the dome's upper and lower regions. Gas emissions had been more concentrated from the higher region of the dome, however, the bright glow in this image may also be due to the reflective cloud-cover seen in the visible-spectrum image (top). Courtesy of FAC and INGEOMINAS. |
During May and June 2009, the dome's surface continued to produce thermal anomalies, and dome growth was inferred based on the observable fragmentation of dome rock and a wider distribution of fresh material. INGEOMINAS noted that the color of the extruded material in the higher region of the dome had changed to a red-brown color (earlier dome rock was distinctively gray).
On 23 July ashfall was reported at the local military base in Santo Domingo and José Jair Cuspian (Caloto). They reported ashfall in the NW sector of the volcanic edifice. INGEOMINAS reported that this ash event coincided with a pulse of tremor registered that day at 0442.
On 3 August there was a pulse of tremor at 0036 and INGEOMINAS received reports of ashfall in the municipalities of Toribío and Santander de Quilichao (~30 km and ~50 km W of the edifice, respectively). Aerial observations on 16 August established that the crater had grown wider.
During September 2009 there were no major changes observed via webcam. On 16 and 23 October, reports of widespread ashfall came from various municipalities of N Cauca, Valle del Cauca, and in the foothills around the volcano (departments of Cauca, Valle, Tolima, and Huila) (figure 31). There were also reports of sulfur odors from the most proximal communities.
|
Figure 31. An ash plume from Nevado del Huila's newly-formed crater and fumarolic sites was observed from aircraft on 23 October 2009. (top) A dark curtain of ash ("Cortina de cenizas") drifted SE from Pico Central that day; the plume height was ~1,000 m above the crater. The Washington VAAC reported ash in satellite images at 1015 that day, and noted that the ash plume rose to 6 km altitude, was ~46 km long, and drifting SE at 5 m/s. (bottom) A closer view of the W flank highlights gas-and-ash plumes rising from the upper crater (orange outline) while isolated sites released white plumes, including the site on the N flank of Pico Central (at left) where steam from a fissure had been observed consistently since November 2007. The accumulation of newly erupted material was typically observed from the upper region of the dome (circled in blue); the extent of the dome is outlined with yellow. Ashfall had covered the snow and glaciers of Huila; however, cracks in the glacier remained visible as jagged black and white lines, particularly on Pico Sur (right-hand edge of photo). Courtesy of FAC and INGEOMINAS. |
At 0541 on 16 October 2009, the webcamera captured images of an ash plume rising in pulses from Pico Central and drifting E. Accordingly, the Alert Level was raised from Yellow (III) to Orange (II), where it stayed until 5 January 2010. An overflight on 23 October provided views of both intense fumarolic activity from the dome and a column of ash that reached up to 1,000 m above the crater. The summit and glaciers were covered by ashfall, lava extrusion was continuing from the upper region of the crater, and there were thermal anomalies where gas emissions were concentrated. An 11-minute-long episode of tremor that began at 0200 on 28 October was thought to signify dome rock extrusion.
Based on observations during overflights on 30 October and 2 November, INGEOMINAS calculated that the dome volume had increased by ~9 x 10⁶ m3 since the previous estimate in January 2009. Aerial observers saw ash emitted in pulses.
Rapid dome growth occurred in November as witnessed during five aerial investigations (2, 4, 6, 10, and 25 November). On 3 November, an explosion was heard and ashfall was reported by the communities of Inzá, Mosoco, Jambaló y Belalcázar, and other communities SW of the volcano. New layers of ash had accumulated around the summits of Huila, often appearing brown-red as opposed to the gray material deposited in previous months (figure 32). A weekly INGEOMINAS report announced that by 10 November 2009, the dome volume had increased by ~16 x 106 m3 since the previous estimate, more than doubling the amount of growth that had occurred during January-October 2009.
|
Figure 32. Aerial photos from November 2009 documented rapid changes on Nevado del Huila's Pico Central. (top) On 4 November INGEOMINAS observed additional ejecta surrounding the lava dome and elevated ash emissions. In this photo of the S face of Pico Central, steam and ash rise from the crater, and brown-red ash and blocks cover the glacier that surrounds the active dome. Dome rock extends from the center of Pico Central to lower elevations on the W flank. (bottom) This view of Nevado del Huila's SE flank on 25 November 2009 reveals the increased size of the lava dome which towers above Pico Sur, the rugged-looking peak centered in this view. Ash covered snow and glacial ice surrounds the immediate region of the dome while plumes of gas drift westerly. The dark gray, rounded peak to the lower left is Cerro Negro, the location of a seismic station that remained offline during this reporting period. Courtesy of FAC and INGEOMINAS. |
Gas emissions were observed by the webcamera at Tafxnú and during four overflights in December 2009; however, fumarolic activity dropped during the first week of December. Aerial observations determined that 2008 dome rock was being covered by 2009 lava that contained fewer large blocks; the 2008 dome material was distinctively more gray and blocky. During an overflight on 29 December, clear weather allowed INGEOMINAS scientists to observe minor dome collapse events, new cracks in the glacier along the lower E dome contact, and additional dome rock extending down the E flank.
In January 2010, dome growth continued and notably expanded the dome E by ~50 m, further displacing portions of the Pico Central glacier. Gray ash continued to be deposited in the area, covering the glacier surfaces. White plumes were observed this month during overflights and from the webcamera. On 5 January, INGEOMINAS reduced the Alert Level from Orange (II) to Yellow (III); this status was maintained until 15 June 2010.
On 22 February 2010, scientists on board an FAC helicopter noted displaced glacial ice, some steaming along the dome edge, and the surface textures of the 2008 and 2009 lava domes persisted (blocky vs. smaller clast sizes, respectively; figure 33). Based on aerial observations, INGEOMINAS calculated a total dome volume of at least 70 x 106 m3.
|
Figure 33. During an overflight on 22 February 2010, Nevado del Huila's active dome, displaced ice, and gas emissions were visible. Fresh volcanic material clearly began to extend W and E, divided by the long axis of the Huila complex. (Top) An aerial view of Pico Central's S-facing peak where the active dome was shedding material to the W and E. (Middle) Degassing dome rock is visible along the W flank. The blocky gray rock centered in this region was attributed to 2008 lava extrusion. (Bottom) New dome rock is in contact with the fragmented glacial ice on the E flank, and dome steaming is visible along the margin. Courtesy of FAC and INGEOMINAS. |
INGEOMINAS reported that on 12 April additional ash had accumulated on the glacier and lava extrusion was continuing. Columns of gas continued to be emitted from the surface of the new dome, at the contact of 2008 and 2009 lava, and from the crack that had formed in 2007 on the N flank of Pico Central.
No overflights were conducted in June, however the Alert Level was raised to Orange (II) due to increased seismicity, primarily hybrid earthquakes and SO2 emissions (see seismic and SO2 discussion below). INGEOMINAS suggested that the marked increase in hybrid earthquakes may have been linked with the ascent of new magmatic material within the volcanic edifice.
In July, degassing continued and intermittent, small ash emissions were observed toward the end of the month by the ground-based cameras Tafxnú and Maravillas. By 16 July, INGEOMINAS reduced the Alert Level to Yellow (III), due to the reduction in seismicity and SO2 flux, where it remained through August. The Washington VAAC reported possible ash plumes drifting from Huila during 28-30 of July but an absence of such plumes during August.
A 19 August flight revealed that snow had accumulated on the dome. INGEOMINAS noted that some episodes of tremor were likely related to the process of lava dome extrusion and these conditions did not show wide variations in August. Minor ash emissions were reported toward the end of the month. The Maravillas camera detected incandescence on 26 and 29 August, possibly from hot rockfalls from the lava dome.
A pulse of tremor on 30 August at 0635 coincided with ash emissions also observed by the Tafxnú camera. In the afternoon that day, people in the town of Toribío (~30 km W) noted an ash plume. There was also a report that the Símbola River changed color due to the presence of ash. The VAAC noted a hotspot at the summit in satellite images on 31 August.
During September, webcameras imaged plumes of gas as well as gray and reddish-colored emissions attributed to volcanic ash. These plumes were not visible in satellite imagery; however, the Washington VAAC released two notices on 9 September in response to reports from INGEOMINAS that ground-based observations included continuous emissions of gases and some ash.
During the first week of September, the Maravillas webcamera and local populations observed incandescence from the active dome; INGEOMINAS attributed the activity to hot rockfalls on the dome. On 9 September, INGEOMINAS raised the Alert Level to Orange (II); seismicity (particularly energetic tremor) and frequent incandescence were considerations for this announcement. On 9 September, both webcameras captured images of ash and incandescence. On 10 September, drumbeat earthquakes (earthquake signatures related to dome extrusion) had appeared in the seismic records. The last time that drumbeat earthquakes had been detected from Huila was in November 2008 (BGVN 37:10). By 21 September, INGEOMINAS announced that 1,799 drumbeat earthquakes had been detected over the past 13 days.
An overflight on 15 September determined that conditions at the dome were continuing to change; extrusion continued from the highest part of the dome (near the contact with the crater wall). They also observed a debris flow containing rocks and ice that had originated from the edge of the dome and had traveled ~1.5 km down the E flank (figure 34). By the end of the month, gas emissions continued and incandescence was observed by the webcameras.
|
Figure 34. On 15 September 2010 INGEOMINAS observed debris flows along the E flank of Nevado del Huila. (top) Snow had visibly collected on the active dome that continued to degass and displace the glacier. Near the dome, the glacier was notably fragmented and discolored due to overlying debris and ash. (bottom) This view is a closeup of the area below the fragmented glacier on Huila's E flank. The extent of the debris flow is visible as a 1.5 km long trace of gray material that had incorporated blocks of ice and rocks. Courtesy of FAC and INGEOMINAS. |
Aerial observations on 29 September, 1 October, and 4 November confirmed ongoing dome growth. On 1 October, the VAAC reported ash drifting from the summit. On 12 October, INGEOMINAS reduced the Alert Level to Yellow (III); they stated that conditions appeared to have stabilized, in particular local seismicity and gas-and-ash emissions. The webcameras continued to capture images of white gas emissions during the second week of October. White plumes and some incandescence were visible in October. Thermal images from 4 November found that the W-central dome's temperature was 250°C. On 11 November the Washington VAAC reported ash drifting from the summit.
Observations during January-December 2011. The webcameras continued to record images of white plumes rising from the Pico Central dome throughout 2011. Aerial observations during the year noted frequent gas emissions and infrequent ash plumes. During an overflight on 25 January, a FLIR camera detected temperatures up to 90°C from various locations on the dome (figure 35). During an overflight on 29 March, observers noted degassing and odors of sulfur.
|
Figure 35. In these photo pairs taken during an overflight on 25 January 2011, INGEOMINAS measured surface temperatures of Nevado del Huila's lava dome. (top) These photos are centered on the E flank of Huila. The thermal image is zoomed in on the brown-colored lava dome that continued to steam and degass, forming a small plume rising above Pico Central. For the dome, the minimum ("BAJA") and maximum ("ALTA") temperatures were less than 30 and 68.3°C, respectively. (bottom) These photos are viewing the S-facing Pico Central with the lava dome (centered). Gas emissions were rising from the highest region of the dome and the minimum and maximum temperatures were less than 30 and 80.6°C, respectively. Courtesy of FAC and INGEOMINAS. |
On 19 April, the Washington VAAC reported that an ash plume was detected in enhanced multispectral imagery at 0315. The plume was drifting NNW from Huila. The announcement included a note that the ash plume did not appear to be the result of an explosive event. Later that day, after sunrise, INGEOMINAS confirmed that low seismicity was detected, a white plume was visible, but ash emissions were absent.
Aerial observations on 26 April included intense degassing from the NW side of the lava dome; the emissions were gray. A thermal camera detected temperatures of the dome in the range of 78-83°C. The glacier also appeared to have further deformed since the last aerial observations in March.
In May, degassing was observed with the webcameras on days where weather conditions permitted clear views. On 6 and 20 June, scientists confirmed that degassing continued during an overflight; they also observed the accumulation of snow on the lava dome as well as on the surrounding glacier. On 20 June, notable rockfalls were visible from the lava dome that contributed to scree along the dome's lower edges.
Degassing continued to appear in clear webcamera views and during overflights in June-July and September-December. Aerial observers on 22 October saw snow avalanches on the Pico Norte glacier and intense steaming from the upper regions of the dome.
Observations during January-December 2012. Throughout 2012, INGEOMINAS recorded observations of the dome based primarily on webcamera images. No major changes were noted in the weekly and monthly online reports; pervasive steaming and white plumes were frequently observed throughout the year by the two webcameras (Tafxnú and Maravillas). INGEOMINAS maintained Yellow Alert (III) during 2012.
One overflight was conducted by INGEOMINAS in 2012. On 14 January 2012, scientists observed the usual degassing and noted that snow had collected on the dome and glacier. That day's clear viewing conditions allowed detailed observations of the lava dome texture and INGEOMINAS attributed the spiny texture of the dome to late-stage extrusion (figure 36).
|
Figure 36. On 14 January 2012, clear conditions provided aerial views of Nevado del Huila's lava dome texture. (top) This view of the dome's SE face is centered on the part of the lava dome that had started to accumulate snow cover. Steaming was visible from some regions of the dome but a strong plume was not visible during this overflight. (bottom) INGEOMINAS noted that the higher region of the dome had distinguishable spines that may have formed recently. Courtesy of FAC and INGEOMINAS. |
Declining seismicity during January-August 2009. During 2009, four seismometers (two broadband and two short-period stations) were maintained by INGEOMINAS. Ash emissions in October 2009 temporarily disabled the short-period Verdún 2 station, located ~5 km N of the active dome. The Cerro Negro short-period station, closest to the active dome, was not operating during this reporting period (2009-2012). In general, three to four seismic stations were operating during 2009-2012.
In 2009, a total of nine earthquakes were large enough for people nearby to feel shaking; these events had magnitudes between 2.8 and 4.8 with focal depths between 6.2 and 12 km. The epicenters were 3-25 km away from the closest seismic station, CENE, which was located ~3 km S of Pico Central. INGEOMINAS highlighted these earthquakes in their monthly technical bulletins.
From January to September 2009, INGEOMINAS reported a decreasing trend in seismicity. In particular, volcano-tectonic (VT) and long period (LP) earthquakes were becoming less frequent on a monthly basis (figure 37). INGEOMINAS described VT earthquakes as resulting from rock-fracturing events, and LP earthquakes from fluid transport processes within the volcanic edifice. Large daily counts of LP earthquakes generally became less frequent over time. Low levels of tremor, hybrid events, and superficial activity (rockfalls and explosions) were detected throughout this time interval.
|
Figure 37. Nevado del Huila's seismicity, in particular VT, LP, and tremor earthquakes, decreased overall during January-August 2009. In this plot, the number of events were tallied per day and plotted over time. The legend in the upper right-hand corner lists terminology in Spanish that relates to these conventions: VT (red), LP (yellow), hybrid (orange), explosions (red with black outlines), tremor (blue), and surface activity such as rockfalls (green). Explosions were detected during this time period, but are difficult to read from this plot. Explosions were detected mainly in June and July; see previous subsection "Observations of dome growth and summit activity during 2009-2010" for descriptions of explosive activity. Courtesy of INGEOMINAS. |
Clustered epicenters in 2009. Beginning in January 2009, INGEOMINAS described a clustering of seismicity notable in distinct regions of the volcanic edifice. These consisted of three regions, the SW sector, the SE sector, and beneath the central edifice (Pico Central). This pattern was particularly clear in June, October, and December. The June 2009 map of seismicity appears in figure 38. The deepest earthquakes (8-12 km) tended to occur S of the edifice while shallow events were distributed throughout the area. Several deep and distal earthquakes occurred each month with depths between 10-20 km and epicenters up to 25 km from the edifice; these events have been attributed to regional faults.
|
Figure 38. A map with cross-sections plotting epicenters and hypocenters of volcano-tectonic and hybrid earthquakes during June 2009 at Nevado del Huila. Three zones of clustered activity took place beneath the volcanic edifice (dashes lines). Note the yellow bar for scale (10 km) and the yellow text labeling five seismic stations (marked with blue squares). Four stations were operating; Cerro Negro (CENE) was offline during this reporting period. The active summit area of Pico Central is ~3 km N of the CENE station. Courtesy of INGEOMINAS. |
Peaks in seismicity and ash emissions between October 2009 and May 2010. INGEOMINAS reported an abrupt increase in seismicity in October 2009. The occurrence of VT, LP, hybrid, and tremor events had more than doubled since September. On 12 October, a swarm of VT events was detected (figure 39). During the onset of elevated seismicity, INGEOMINAS reported ash emissions during 17-21 October and the Washington VAAC released reports of ash observations from satellite imagery on 16 October.
|
Figure 39. Seismicity from January 2009 through May 2010 detected from Nevado del Huila included notable peaks in LP earthquakes. In their May 2010 report, INGEOMINAS noted that tremor had been recorded continuously throughout January-May. The legend in the upper left-hand corner lists VT (red), LP (yellow), hybrid (orange), explosions (red with black outlines), tremor (blue), and surface activity such as rockfalls (green). Explosions were detected during this time period, but are difficult to read from this plot. Courtesy of INGEOMINAS. |
The appearance of volcanic ash in satellite images was periodically reported by the Washington VAAC from October through mid-November 2009. Aided by the web-camera Tafxnú, INGEOMINAS reported observations of ash plumes frequently occurring through November.
The Washington VAAC reported that, after 15 November 2009, volcanic ash was no longer visible in satellite images. In their monthly technical report, INGEOMINAS noted seismic signals suggesting ash emissions in December 2009, and visual observations of white plumes from the summit that were inferred to be gas-rich. As seen on figure 39, LP events peaked dramatically during 9-10 December when signals characterized as drumbeats were detected (see BGVN 37:10 for additional descriptions of drumbeat earthquakes). INGEOMINAS suggested the onset of drumbeat earthquakes was associated with the extrusion of new material to the surface and growth of the lava dome.
INGEOMINAS reported an average of 995 LP earthquakes per month during January-March 2010. VT events tallied on a monthly basis averaged 239 during that same time interval, suggesting an absence of discernible major changes in the volcanic system since the drumbeat earthquake swarm in December 2009. Tremor was detected more frequently over time and from February to May an average increase of 37 events per month was recorded.
As seen at the right on figure 39, during April-May 2010, very high LP seismicity returned. LP earthquakes peaked in May, with a total of 5,141 events. During April-May, the Washington VAAC released advisories in response to possible ash plumes from Huila, however, they did not detect ash due to frequent cloud cover, and because numerous reports indicated eruptions at night, when satellite instruments offer fewer means of detecting ash.
An ML 3.8 earthquake shook the towns of Toéz and Tálaga (15 km SSW and 22 km S respectively) at 0708 on 23 May. These towns are located SW of Pico Central. The earthquake was located 8.13 km SW of Pico Central and was 7.2 km deep (relative to the elevation of the active crater).
Seismicity and ash observations during June-December 2010. In June, direct observations of ash plumes were rare due to weather conditions; however, the Washington VAAC reported ash visible in satellite imagery on 2 June 2010. While LP seismicity remained low in early June 2010, hybrid seismicity emerged from background levels (figure 40). During January-May, typically 3-34 hybrid earthquakes were detected per month. By 14 June, more than 200 hybrid events were occurring per day; however, by 24 June, hybrid earthquakes had decreased to less than 50 events per day. Hybrid earthquakes, events INGEOMINAS attributes to the combined mechanisms of fluid transport and rock fractures, rarely dominate Huila's seismic records.
|
Figure 40. Seismicity from Nevado del Huila during 2010 included peaks of LP, VT, and tremor episodes. The legend in the upper left-hand corner lists VT (red), LP (yellow), hybrid (orange), explosions (red with black outlines), tremor (blue), and surface activity such as rockfalls (green). Explosions were detected during this time period, but are difficult to read from this plot. Courtesy of INGEOMINAS. |
As seen on figure 40, during August-November 2010, elevated tremor persisted (630-2,576 episodes per month). LP seismicity peaked in May and then twice between September and December. For the tallest peak (September 2010), counts reached more than 1,000 events per day.
On 3 December at 2054 a felt M 3.4 earthquake within the Páez River drainage centered 6.2 km S of Pico Central had a relatively shallow focal depth of 5.2 km (as measured beneath the crater). Another felt earthquake was reported by residents in the Belalcázar-Cauca area on 29 December. This ML 2.9 event occurred at 2106 with a focal depth of 8 km, located 8.5 km SW of Pico Central. This earthquake lacked any noticeable effect on the stability of the volcanic system.
Seismicity in 2011. In 2011, INGEOMINAS noted that both LP earthquakes and tremor were decreasing over time (figure 41). Tremor persisted at low levels. In June VT and LP earthquakes notably increased to 434 and 623 events, respectively, but returned to background levels during the following month.
|
Figure 41. This plot of Nevado del Huila's seismicity during January-December 2011 shows a general decline in seismicity. This plot excludes VT earthquakes, highlighting instead the daily count of LP, hybrid, and tremor events. Courtesy of INGEOMINAS. |
In November 2011, several moderate earthquakes (M≤4) struck near Huila. In particular, three events had magnitudes 2.8, 3.2, and 4.0. For example, on 26 November, inhabitants of Mesa de Toéz felt an M 4.0 event whose epicenter was 8.5 km SW of Pico Central with a depth of 7.4 km (as measured below the crater). VT epicenters in November were widely distributed throughout the edifice and local region (figure 42). Depths of these earthquakes were within the range of past VT earthquakes (0-12 km). Persistent seismicity SW of Huila also continued in November.
|
Figure 42. A map and cross-sections showing Nevado del Huila's VT epicenters during November 2011. The active dome is ~3 km N of CENE. INGEOMINAS noted four areas where seismicity was clustered (yellow shaded ovals). Note that the largest highlighted region has been an area of persistent seismicity throughout the year (for example, see figure 38). Seismic stations are marked with blue squares and labels (DIAB, VER2, CENE, BUCO, and MARA). Courtesy of INGEOMINAS. |
Seismicity in 2012. The low-level seismicity observed in the last months of 2011 continued through 2012. In a comparison with 2011, the average number of events per year was remarkably reduced in 2012 (VT, LP, and tremor); hybrid earthquakes, however, were the exceptions. The average for hybrid earthquakes per month was slightly higher in 2012 (table 4). Hybrid earthquakes were quite variable in number during 2011, ranging from 0 to 60 per month.
Table 4. Monthly counts for volcanic-tectonic, long period, tremor, and hybrid events detected at Nevado del Huila during 2011-2012. More event types and data appear in INGEOMINAS online reports. Courtesy of INGEOMINAS.
| Month | Volcanic-tectonic | Long-period | Tremor | Hybrid |
| Jan 2011 | 284 | 388 | 220 | 2 |
| Feb 2011 | 217 | 1,064 | 154 | 15 |
| Mar 2011 | 217 | 876 | 168 | 13 |
| Apr 2011 | 168 | 634 | 152 | 0 |
| May 2011 | 136 | 729 | 220 | 0 |
| Jun 2011 | 434 | 623 | 128 | 60 |
| Jul 2011 | 165 | 416 | 77 | 25 |
| Aug 2011 | 143 | 491 | 51 | 32 |
| Sep 2011 | 137 | 304 | 27 | 8 |
| Oct 2011 | 110 | 371 | 50 | 13 |
| Nov 2011 | 176 | 219 | 32 | 2 |
| Dec 2011 | 164 | 195 | 32 | 34 |
| 2011 Avg: | 196 | 526 | 109 | 17 |
| Jan 2012 | 155 | 245 | 27 | 28 |
| Feb 2012 | 111 | 159 | 12 | 18 |
| Mar 2012 | 145 | 200 | 27 | 21 |
| Apr 2012 | 154 | 244 | 19 | 21 |
| May 2012 | 87 | 200 | 34 | 13 |
| Jun 2012 | 121 | 183 | 11 | 18 |
| Jul 2012 | 109 | 208 | 14 | 16 |
| Aug 2012 | 118 | 178 | 15 | 30 |
| Sep 2012 | 93 | 172 | 5 | 14 |
| Oct 2012 | 168 | 257 | 18 | 23 |
| Nov 2012 | 171 | 205 | 9 | 14 |
| Dec 2012 | 158 | 227 | 26 | 32 |
| 2012 Avg: | 133 | 207 | 18 | 21 |
The wide distribution of epicenters noted in November and December 2011 persisted during January-February 2012, but fewer earthquakes were detected during these months. From March through December, significant clustering was absent, although, in October some events appeared concentrated along Huila's N-S axis.
The largest earthquake in 2012 occurred in March; a 3.8 earthquake shook the town of Toribio (in Cauca) at 0248 on 15 March. The epicenter was 1.8 km E of Pico Central with a focal depth of approximately 3.2 km. Seismicity that month was slightly higher than February (table 4). Throughout the year, VT earthquakes were typically less than M 2.6.
Infrasound monitoring 2009-2012. Augmenting seismic monitoring efforts, an infrasound station installed at the Diablo monitoring site (located ~5 km NNW of the active dome) became operational in July 2009. An additional acoustic monitoring system was installed at the Caloto station (located ~3.7 km from the active dome) in May 2012. Data collected with infrasonic microphones complements seismic instrumentation and can be analyzed with similar techniques. The method has also detected distant explosions from volcanoes such as Sakura-jima, Japan (BGVN 20:08), Fuego, Guatemala (BGVN 36:06), and Stromboli, Italy (BGVN 26:07).
Sulfur dioxide emissions during 2009-2012. INGEOMINAS conducted routine sulfur dioxide (SO2) gas monitoring with differential optical absorption spectroscopy (DOAS) equipment from January 2009 through December 2012. With this mobile scanner, INGEOMINAS conducted traverses along the Pan-American Highway between the cities of Calí and Popayán (figure 43).
|
Figure 43. On 14 and 24 August 2010, INGEOMINAS technicians traversed routes along the Pan-American Highway with mobile DOAS equipment to measure Nevado del Huila's SO2 gas fluxes. These images include color-coded line segments that correspond to high and low concentrations (red and blue, respectively). The approximate locations of the plume have been shaded to correspond with the locations of high SO2 flux. The plots shows the wavelength on the x-axis and concentration-pathlength (ppm-m) on the y-axis. (Top) This image includes the mapped route between the towns of Santander de Quilichao and Villarrica where the gas plume was scanned on 14 August. The wind speed was 10.8 m/s, wind direction was 294°, and SO2 flux was 28.2 kg/s (1,441 t/d). (Bottom) This image includes the results from 24 August when field technicians traversed routes between Pescador and Villarrica. SO2 flux was 23.3 kg/s (2,020 t/d); wind speed and direction were not reported. Courtesy of INGEOMINAS. |
Scanning DOAS systems at fixed locations were operating during 2009-2012. During October 2009, elevated SO2 emissions were detected by the Calí and Santander de Quilichao stations (figure 44). In September 2009, a station was operating in Manantial (~53 km W of Huila).
|
Figure 44. During 7 January 2009-27 November 2012, INGEOMINAS measured the SO2 flux from Nevado del Huila in a series of numbered campaigns (x-axis). A total of 137 values were reported from three detection methods, scan DOAS stations (corresponding to numbers 33 and 35 dating from October 2009, and 55-57 dating from June 2010), FLYSPEC (numbers 118-122 dating from May 2012, and 128 and 129 dating from August 2012), and mobile DOAS (all other values). Red and blue highlighting distinguishes the datasets from each year. SO2 detection was conducted several times each month and the maximum value from each measurement was reported. Courtesy of INGEOMINAS. |
Wind velocity has a strong bearing on the computed SO2 flux. In their December 2011 technical bulletin, INGEOMINAS discussed the variability in windspeed and direction, including the Weather Research and Forecasting (WRF) modeling system used for calculations during 2011 (figure 45). The WRF was public domain software available online and was developed in order to provide atmospheric simulations based on numerical modeling.
|
Figure 45. INGEOMINAS released the source of their windspeed data used for SO2 flux calculations in their December 2011 technical report. (top) This plot shows the datapoints used throughout 2011 for windspeed values determined by the WRF Model. (bottom) These images show a map of the expected aerial extent of the gas plume, a series of photos showing plume conditions during the SO2 surveys, and a table of the measurements from three surveys in December. Courtesy of INGEOMINAS. |
In May and August 2012, INGEOMINAS reported the results from FLYSPEC (a portable UV spectrometer) surveys and discussed the variations observed in SO2 flux. They emphasized that SO2 fluxes were low, a finding consistent with previous measurements during this post-crisis period (dome growth had ceased by November 2009). They also mentioned that seismicity had been low in May 2012, particularly in those events related to fluid motion (LP earthquakes, for example).
Flux calculations required wind speed data from the WRF models and daily forecasts from the Institute of Hydrology, Meteorology, and Environmental Studies (IDEAM), Colombia. Wind speeds in the range of 6-12 m/s during 8-29 May 2012 were applied to SO2 flux calculations.
Elevated SO2 emissions from Huila were detected almost daily by the OMI spectrometer during 2009-2012. The AURA satellite maps SO2 in the atmospheric column using ultraviolet solar backscatter. A flux can be estimated for the OMI spectrometer data by looking at the total mass of SO2 measured and the time it took to accumulate. On this basis, INGEOMINAS compared peaks in SO2 flux detected during traverses with DOAS (mobile and scanning) with OMI data for October 2009 (figure 46).
|
Figure 46. In October 2009, elevated SO2 flux was detected from Nevado del Huila by three remote sensing techniques. (Top) The plotted values show combined datasets from mobile DOAS, OMI, and scan DOAS. (Bottom) The OMI spectrometer on the AURA satellite detected 9.95 kt of SO2 on 20 October 2009 (left) during its pass at 2414-2417 local time (coverage area of 368,974 km2, recording a maximum value of 43.3 Dobson Units (DU)). On 26 October 2009 (right) it detected 7.79 kt of SO2 during its pass at 2337-2340 local time (coverage area of 314,303 km2, recording a maximum value of 31.12 DU). Courtesy of INGEOMINAS and Simon Carn, Michigan Technological University and Joint Center for Earth Systems Technology, University of Maryland Baltimore County. |
Lahar investigations. INGEOMINAS maintained seven early warning systems to warn of downstream flooding in vulnerable municipalities such as Belalcázar. At sites within the drainages of the Páez and Símbola rivers, flow monitoring with geophones has continued since October 2006, employing equipment installed by the INGEOMINAS Popayan Observatory in collaboration with the Nasa Kiwe Corporation (CNK). CNK is a relief group that has been active in this area of Colombia since the 1994 earthquake and resultant landslides that devastated the Cauca and Huila regions, including communities along the Páez river (BGVN 19:05). Those events also damaged the Tierradentro archaeological sites, a UNESCO World Heritage Site since 1995.
Following Huila's 2007 lahars (BGVN 33:01), Worni and others (2012) conducted fieldwork and reconstructed events in order to model future lahars for mitigation purposes. The researchers argued that large-volume lahars (tens to hundreds of millions of cubic meters) require targeted studies. The authors noted that "in 1994, 2007, and 2008, Huila volcano produced lahars with volumes of up to 320 million m3." To constrain the dimensions of simulated flows, they used inundation depths, travel duration, and observations of flow deposits from the April 2007 events and applied the two programs LAHARZ and FLO-2D for lahar modeling.
LAHARZ was developed by USGS scientists in order to provide a deterministic inundation forecasting tool; this program was designed to run in a Geographic Information System (GIS) environment (Schilling, 1998; Iverson and others, 1998). "For user-selected drainages and user-specified lahar volumes, LAHARZ can delineate a set of nested lahar-inundation zones that depict gradations in hazard in a manner that is rapid, objective, and reproducible" (Schilling, 1998). Worni and others (2012) presented results from the semi-empirical LAHARZ models along with physically-based results from FLO-2D (FLO-2D Software I, 2009) in order to forecast future inundation areas with specified flow volumes (figure 47). The authors concluded that, despite local deviations, the two models produced reasonable inundation depths (differing by only 10%) and encouraged future investigations that could address sources of uncertainty such as the effects of sediment entrainment that would cause dynamic changes in lahar volumes.
|
Figure 47. Results are shown from two modeling programs to understand lahar hazards from Nevado del Huila, FLO-2D (top three images) and LAHARZ (bottom three images), for the specified flow volumes. Note the modeled effects on the Belalcázar region (located ~20 km S of Huila). Three scenarios are presented based on lahar flow volumes of 3 x 10⁸, 6 x 10⁸, and 10 x 108 m3. Image from Worni and others (2012). |
Deformation monitoring during 2009-2012. An electronic tilt station was operating in July 2009, located at the Diablo monitoring site ~6.26 km NW of Pico Central (4.1 km above sea level). Telemetered data from a new electronic tilt station became available in May 2012; the station was located in the town of Caloto, located ~4 km SSW of Pico Central (4.2 km above sea level). Data from Diablo and Caloto was presented in the monthly technical bulletins posted online by INGEOMINAS.
After seven months of calibrations, INGEOMINAS developed an initial baseline for the new tilt data. The N and E components of Caloto recorded minor fluctuations during this time period. The trend of the E component was generally stable while the N component detected a gradual excursion during 17 June-25 September 2012.
References. FLO-2D Software I, 2009, FLO-2D User's Manual. Available at: www.flo-2d.com.
Iverson, R.M., Schilling, S.R, and Vallance, J.W., 1998, Objective delineation of areas at risk from inundation by lahars, Geological Society of America Bulletin, v. 110, no. 8, pg. 972-984.
Schilling, S.P, 1998, LAHARZ: GIS programs for automated mapping of lahar-inundation hazard zones, U.S. Geological Survey Open-File Report 98-638, 80 p.
Worni, R., Huggle, C., Stoffel, M., and Pulgarín, B., 2012, Challenges of modeling current very large lahars at Nevado del Huila Volcano, Colombia, Bulletin of Volcanology, 74: 309-324.
Information Contacts: Instituto Colombiano de Geologia y Mineria (INGEOMINAS), Observatorio Vulcanológico y Sismológico de Popayán, Popayán, Colombia; Washington Volcanic Ash Advisory Center (VAAC), NOAA Science Center Room 401, 5200 Auth road, Camp Springs, MD 20746, USA (URL: http://www.ospo.noaa.gov/Products/atmosphere/vaac/); Ozone Monitoring Instrument (OMI), Sulfur Dioxide Group, Joint Center for Earth Systems Technology, University of Maryland Baltimore County (UMBC), 1000 Hilltop Circle, Baltimore, MD 21250, USA (URL: https://so2.gsfc.nasa.gov/); Nasa Kiwe Corporation (CNK) (URL: http://www.nasakiwe.gov.co/index.php); Weather Research Forecasting (WRF) (URL: http://www.wrf-model.org/index.php).
The Global Volcanism Program has no synonyms or subfeatures listed for Nevado del Huila.
|
|
||||||||||||||||||||||||
There is data available for 4 confirmed Holocene eruptive periods.
2008 Oct 26 (?) - 2012 Jan 14 (?) Confirmed Eruption Max VEI: 3 (?)
| Episode 1 | Eruption Episode | Upper SW side of Pico Central | ||||||||||||||||||||||||||||||||||||||||||||||||||||||||||||||||
|---|---|---|---|---|---|---|---|---|---|---|---|---|---|---|---|---|---|---|---|---|---|---|---|---|---|---|---|---|---|---|---|---|---|---|---|---|---|---|---|---|---|---|---|---|---|---|---|---|---|---|---|---|---|---|---|---|---|---|---|---|---|---|---|---|---|
| 2008 Oct 26 (?) - 2012 Jan 14 (?) | Evidence from Observations: Reported | ||||||||||||||||||||||||||||||||||||||||||||||||||||||||||||||||
|
List of 11 Events for Episode 1 at Upper SW side of Pico Central
| |||||||||||||||||||||||||||||||||||||||||||||||||||||||||||||||||
2008 Jan 2 - 2008 Apr 16 (?) ± 15 days Confirmed Eruption Max VEI: 2 (?)
| Episode 1 | Eruption Episode | ||||||||||||||||||||||||||||||||||||||||
|---|---|---|---|---|---|---|---|---|---|---|---|---|---|---|---|---|---|---|---|---|---|---|---|---|---|---|---|---|---|---|---|---|---|---|---|---|---|---|---|---|
| 2008 Jan 2 - 2008 Apr 16 (?) ± 15 days | Evidence from Observations: Reported | |||||||||||||||||||||||||||||||||||||||
|
List of 6 Events for Episode 1
| ||||||||||||||||||||||||||||||||||||||||
2007 Feb 19 - 2007 May 28 (?) Confirmed Eruption Max VEI: 3 (?)
| Episode 1 | Eruption Episode | ||||||||||||||||||||||||||||||||||||||||||||||||||||||||||||
|---|---|---|---|---|---|---|---|---|---|---|---|---|---|---|---|---|---|---|---|---|---|---|---|---|---|---|---|---|---|---|---|---|---|---|---|---|---|---|---|---|---|---|---|---|---|---|---|---|---|---|---|---|---|---|---|---|---|---|---|---|
| 2007 Feb 19 - 2007 May 28 (?) | Evidence from Observations: Reported | |||||||||||||||||||||||||||||||||||||||||||||||||||||||||||
|
List of 10 Events for Episode 1
| ||||||||||||||||||||||||||||||||||||||||||||||||||||||||||||
1555 ± 5 years Confirmed Eruption
| Episode 1 | Eruption Episode | ||||||||||||||||||||
|---|---|---|---|---|---|---|---|---|---|---|---|---|---|---|---|---|---|---|---|---|
| 1555 ± 5 years - Unknown | Evidence from Observations: Reported | |||||||||||||||||||
|
List of 2 Events for Episode 1
| ||||||||||||||||||||
There is no Deformation History data available for Nevado del Huila.
There is no Emissions History data available for Nevado del Huila.
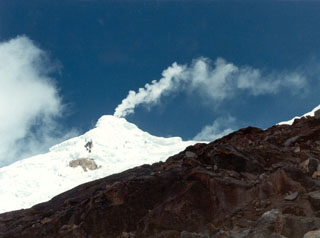 A gas plume rises above the glaciated Nevado del Huila Pico Central, seen here from the east in September 1996. Long-term, persistent, gas plumes occurred prior to the onset of eruptive activity in 2007. Before then, only a single 16th century eruption was known during historical time.
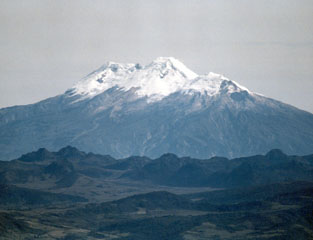 Nevado del Huila is an elongate, N-S-trending glaciated edifice constructed within an old caldera, seen here from the SW. The northern peak (La Cuesta) is to the left and the lower southern peak to the right is Pico Central.
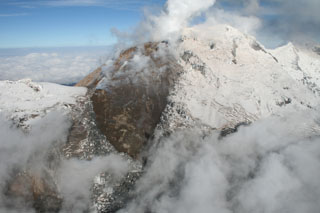 A dark, steaming lava seen from the east was emplaced during an eruption from Huila volcano that began in 2008. Pico del Sur lies at the left, with glacier-covered Pico Central at upper right and Pico Norte at far right. The lava dome straddled the summit ridge and descended opposite sides of the volcano. A major lahar in November 2008 swept down the Rio Paez, causing extensive damage. Long-term ome growth and periodic ash emissions continued.
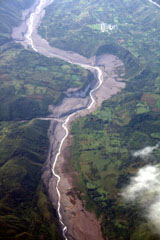 This aerial view of the Río Páez, with flow direction to the top, shows the path of the November 2008 lahars. The village at upper right is Mesa de Caloto, SSW of Huila. An eruption on November 20, 2008 destroyed part of the new lava dome, and hot material melted areas of the surrounding glacier and caused lahars in the Bellavista and Páez rivers, damaging infrastructure and destroying homes along the Río Páez.
 The maps shown below have been scanned from the GVP map archives and include the volcano on this page. Clicking on the small images will load the full 300 dpi map. Very small-scale maps (such as world maps) are not included. The maps database originated over 30 years ago, but was only recently updated and connected to our main database. We welcome users to tell us if they see incorrect information or other problems with the maps; please use the Contact GVP link at the bottom of the page to send us email.
There are no samples for Nevado del Huila in the Smithsonian's NMNH Department of Mineral Sciences Rock and Ore collection.
| Copernicus Browser | The Copernicus Browser replaced the Sentinel Hub Playground browser in 2023, to provide access to Earth observation archives from the Copernicus Data Space Ecosystem, the main distribution platform for data from the EU Copernicus missions. |
| MIROVA | Middle InfraRed Observation of Volcanic Activity (MIROVA) is a near real time volcanic hot-spot detection system based on the analysis of MODIS (Moderate Resolution Imaging Spectroradiometer) data. In particular, MIROVA uses the Middle InfraRed Radiation (MIR), measured over target volcanoes, in order to detect, locate and measure the heat radiation sourced from volcanic activity. |
| MODVOLC Thermal Alerts | Using infrared satellite Moderate Resolution Imaging Spectroradiometer (MODIS) data, scientists at the Hawai'i Institute of Geophysics and Planetology, University of Hawai'i, developed an automated system called MODVOLC to map thermal hot-spots in near real time. For each MODIS image, the algorithm automatically scans each 1 km pixel within it to check for high-temperature hot-spots. When one is found the date, time, location, and intensity are recorded. MODIS looks at every square km of the Earth every 48 hours, once during the day and once during the night, and the presence of two MODIS sensors in space allows at least four hot-spot observations every two days. Each day updated global maps are compiled to display the locations of all hot spots detected in the previous 24 hours. There is a drop-down list with volcano names which allow users to 'zoom-in' and examine the distribution of hot-spots at a variety of spatial scales. |
|
WOVOdat
Single Volcano View Temporal Evolution of Unrest Side by Side Volcanoes |
WOVOdat is a database of volcanic unrest; instrumentally and visually recorded changes in seismicity, ground deformation, gas emission, and other parameters from their normal baselines. It is sponsored by the World Organization of Volcano Observatories (WOVO) and presently hosted at the Earth Observatory of Singapore.
GVMID Data on Volcano Monitoring Infrastructure The Global Volcano Monitoring Infrastructure Database GVMID, is aimed at documenting and improving capabilities of volcano monitoring from the ground and space. GVMID should provide a snapshot and baseline view of the techniques and instrumentation that are in place at various volcanoes, which can be use by volcano observatories as reference to setup new monitoring system or improving networks at a specific volcano. These data will allow identification of what monitoring gaps exist, which can be then targeted by remote sensing infrastructure and future instrument deployments. |
| Volcanic Hazard Maps | The IAVCEI Commission on Volcanic Hazards and Risk has a Volcanic Hazard Maps database designed to serve as a resource for hazard mappers (or other interested parties) to explore how common issues in hazard map development have been addressed at different volcanoes, in different countries, for different hazards, and for different intended audiences. In addition to the comprehensive, searchable Volcanic Hazard Maps Database, this website contains information about diversity of volcanic hazard maps, illustrated using examples from the database. This site is for educational purposes related to volcanic hazard maps. Hazard maps found on this website should not be used for emergency purposes. For the most recent, official hazard map for a particular volcano, please seek out the proper institutional authorities on the matter. |
| IRIS seismic stations/networks | Incorporated Research Institutions for Seismology (IRIS) Data Services map showing the location of seismic stations from all available networks (permanent or temporary) within a radius of 0.18° (about 20 km at mid-latitudes) from the given location of Nevado del Huila. Users can customize a variety of filters and options in the left panel. Note that if there are no stations are known the map will default to show the entire world with a "No data matched request" error notice. |
| UNAVCO GPS/GNSS stations | Geodetic Data Services map from UNAVCO showing the location of GPS/GNSS stations from all available networks (permanent or temporary) within a radius of 20 km from the given location of Nevado del Huila. Users can customize the data search based on station or network names, location, and time window. Requires Adobe Flash Player. |
| DECADE Data | The DECADE portal, still in the developmental stage, serves as an example of the proposed interoperability between The Smithsonian Institution's Global Volcanism Program, the Mapping Gas Emissions (MaGa) Database, and the EarthChem Geochemical Portal. The Deep Earth Carbon Degassing (DECADE) initiative seeks to use new and established technologies to determine accurate global fluxes of volcanic CO2 to the atmosphere, but installing CO2 monitoring networks on 20 of the world's 150 most actively degassing volcanoes. The group uses related laboratory-based studies (direct gas sampling and analysis, melt inclusions) to provide new data for direct degassing of deep earth carbon to the atmosphere. |
| Large Eruptions of Nevado del Huila | Information about large Quaternary eruptions (VEI >= 4) is cataloged in the Large Magnitude Explosive Volcanic Eruptions (LaMEVE) database of the Volcano Global Risk Identification and Analysis Project (VOGRIPA). |
| EarthChem | EarthChem develops and maintains databases, software, and services that support the preservation, discovery, access and analysis of geochemical data, and facilitate their integration with the broad array of other available earth science parameters. EarthChem is operated by a joint team of disciplinary scientists, data scientists, data managers and information technology developers who are part of the NSF-funded data facility Integrated Earth Data Applications (IEDA). IEDA is a collaborative effort of EarthChem and the Marine Geoscience Data System (MGDS). |

