Servicio Nacional de Geología y Minería (SERNAGEOMIN) reported an increase in seismicity associated with rock-fracturing at Hudson starting at 1200 on 16 October, with a total of 160 volcano-tectonic earthquakes. The highest magnitude earthquake of 2.5 occurred at 1416 on 17 October, which was located 2.9 km ESE from the center of the caldera and at a depth of 4.4 km. A long-period earthquake was detected at 1638 on 17 October. A volcano-tectonic earthquake was detected at 0245 on 19 October. The Alert Level remained at Green (the lowest level on a four-color scale).
Source: Servicio Nacional de Geología y Minería (SERNAGEOMIN)
October 2011 earthquakes and eruption with ash, causing evacuation
A large eruption occurred at Cerro Hudson on 8 August 1991 (BGVN 16:07-18:02), which was followed by minor non-eruptive activity that caused sulfurous odors, increased river flows and turbidity, and noise at least through early 1995 (BGVN 20:02). This report describes a minor eruption during 25-26 October 2011. Cerro Hudson is located in Patagonia in the Aysén Region of Chile (figure 1).
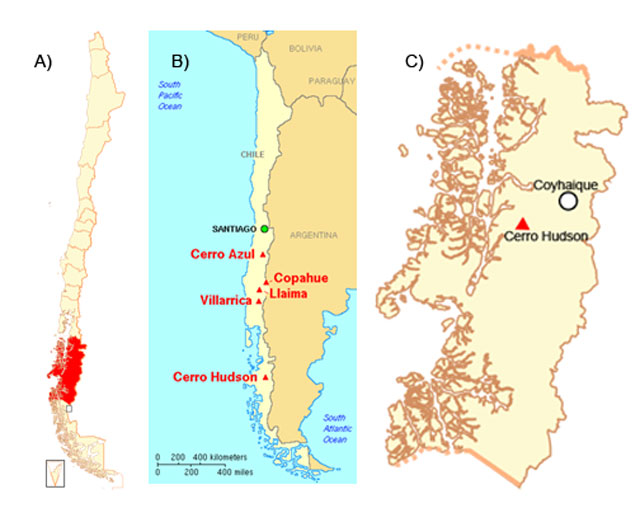 |
Figure 8. Map of Chile (a), the Aysén region in red (b), and a detail marking the region's capital, Coyhaique, and Cerro Hudson (c). Original image courtesy of Wikipedia. |
According to the Southern Andes Volcanological Observatory-National Geology and Mining Service (OVDAS-SERNAGEOMIN), seismicity increased during 25-26 October 2011. On 25 October, an M 4.6 volcano-tectonic earthquake occurred at a depth of 19 km, followed by a seismic swarm. More than 100 events, with depths ranging from 15 to 25 km, were recorded through the next day; twelve were M 3, and three were M 4. Most of the earthquakes were volcano-tectonic events with magnitudes below 3.6 and located W of the caldera at depths between 3 and 25 km. The earthquake hypocenters became shallower over time. OVDAS-SERNAGEOMIN did not detect any explosive event or episodes of high intensity harmonic tremor (as reported on 28 October).
During a 24-hour period beginning at 1600 on 27 October, an average of one earthquake per hour was recorded. Most were long-period with magnitudes less than 2.2. On 27 October, an M 3.6 VT earthquake occurred on the SW edge of the crater.
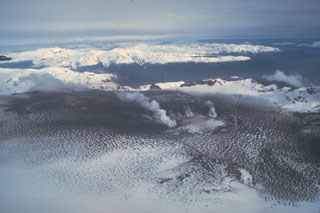
On 26 and 27 October, OVDAS-SERNAGEOMIN and local authorities flew over the caldera and observed three new craters along the SSE edge of the caldera, with approximate diameters of 200, 300, and 500 m. Mostly white plumes rose above the two smaller craters. The largest, southern-most crater emitted a plume with more ash that rose more than 5 km above the crater. Satellite imagery showed a plume drifting 12 km SE. The scientists also observed lahars in the Huemules river, to the W. In response, OVDAS-SERNAGEOMIN raised the Alert Level to 5 (Red), the highest level. According to the Oficina Nacional de Emergencia - Ministerio del Interior (ONEMI), 140 people were evacuated from areas within a 45-km radius of the volcano, defined as a high-risk zone. The hazard lay not only with earthquakes and eruption, but also with the possibility of flooding resulting from to glacier melt.
During another overflight on 28 October scientists observed a gas plume with a very low ash content rising 3-4 km above the craters. Seismicity continued to decrease during 28-29 October. Plumes were observed on 29 October (figure 9). Scientists conducting an overflight noted that one ash plume rose 1 km above the craters and drifted 5-8 km NE. They also confirmed that a large lahar descended the volcano and flowed into the drainage system including the Huemules river during the initial phase of the eruption. During another observation flight on 30 October, scientists saw ash plumes rising 0.8 km from two of the three craters.
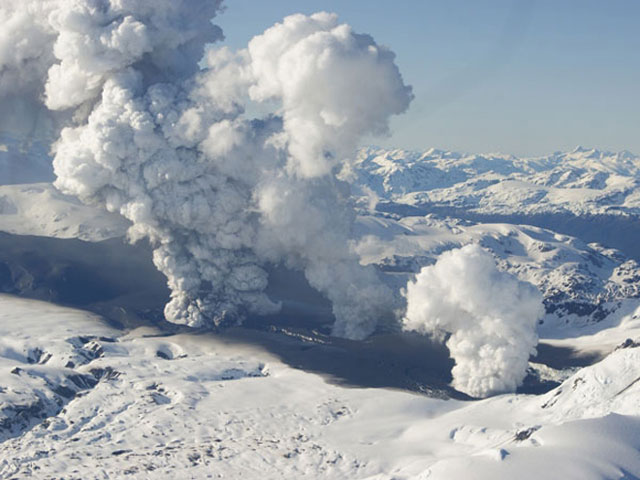 |
Figure 9. The three vents at Cerro Hudson observed on 29 October 2011. Dark gray ash can be seen at the base of at least one vent. Courtesy of, and copyrighted by, El Mercurio and SERNAGEOMIN, Chile. |
On 31 October, scientists observed gas plumes rising 0.5 km above the craters and drifting SE. Around 31 October, they also noted subsequent minor explosions and ash emissions. On 1 November, scientists observed an explosion and an accompanying ash plume that rose 1.5 km above the active craters.
On 2 November, OVDAS-SERNAGEOMIN reported that the Alert Level for Cerro Hudson had been lowered to 4 (Yellow), noting that the eruption that began on 26 October had ceased. ONEMI reported that the 140 evacuees were permitted to return home. Analysis of ash deposited on the edge of the crater during the eruption indicated the presence of juvenile basalt. During 1-6 November between 16 and 110 earthquakes per day were recorded, and satellite images showed drifting plumes daily.
According to OVDAS-SERNAGEOMIN, satellite imagery and an area web camera showed no plumes during 7-15 November. Seismic activity decreased significantly, reaching no more than four earthquakes per hour.
The NASA Earth Observatory photographed Cerro Hudson on 17 November 2011 (figure 10) and weeks later (figure 11).
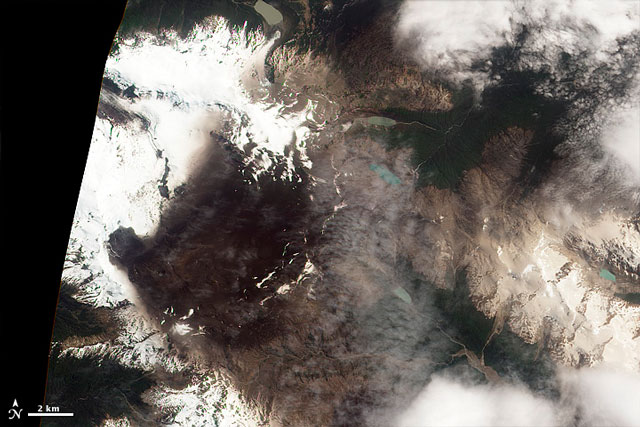 |
Figure 10. Image of Cerro Hudson taken in natural color on 17 November 2011 by the Advanced Land Imager (ALI) on NASA's Earth Observing-1 (EO-1) satellite. The image shows extensive fresh ash on the snowy surface. The apparent vent rests on the image's left-center, at the apex of the darkest funnel-shaped area. Courtesy of NASA Earth Observatory (Image by Jesse Allen; caption by Michon Scott). |
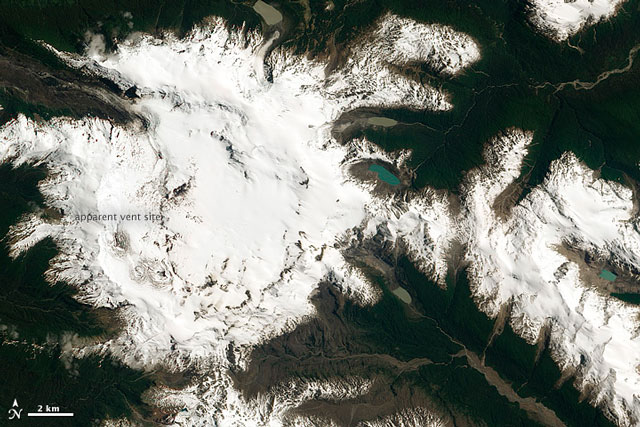 |
Figure 11. This post-eruptive image of Cerro Hudson, taken two weeks after figure 10, shows the volcano covered with snow. The label "apparent vent site" sits directly above the oval shaped vent site, a spot at left located below the gap between the words "apparent" and "vent" (also see previous figure). Courtesy of NASA Earth Observatory. |
Information Contacts: SERNAGEOMIN (Southern Andes Volcanological Observatory-National Geology and Mining Service), Avda Sta María No. 0104, Santiago, Chile (URL: http://www.sernageomin.cl/); NASA Earth Observatory, EOS Project Science Office, NASA Goddard Space Flight Center, Goddard, Maryland, USA (URL: http://earthobservatory.nasa.gov/); Oficina Nacional de Emergencia - Ministerio del Interior (ONEMI), Beaucheff 1637 / 1671, Santiago, Chile (URL: http://www.onemi.cl/); and El Mercurio (URL: http://www.elmercurio.cl/).
2024: October
2021: September
2020: December
2016: November
| December
2011: October
| November
Servicio Nacional de Geología y Minería (SERNAGEOMIN) reported an increase in seismicity associated with rock-fracturing at Hudson starting at 1200 on 16 October, with a total of 160 volcano-tectonic earthquakes. The highest magnitude earthquake of 2.5 occurred at 1416 on 17 October, which was located 2.9 km ESE from the center of the caldera and at a depth of 4.4 km. A long-period earthquake was detected at 1638 on 17 October. A volcano-tectonic earthquake was detected at 0245 on 19 October. The Alert Level remained at Green (the lowest level on a four-color scale).
Source: Servicio Nacional de Geología y Minería (SERNAGEOMIN)
SERNAGEOMIN lowered the Alert Level for Cerro Hudson to Green (the lowest level on a four-color scale) on 7 September, based on decreased activity. Neither morphological changes nor thermal anomalies were visible in satellite images or webcam views during 16-31 August. Seismicity remained low and sulfur dioxide emissions were not recorded.
Source: Servicio Nacional de Geología y Minería (SERNAGEOMIN)
SERNAGEOMIN reported that a notable change in seismicity at Cerro Hudson was characterized by an increase in the frequency and magnitude of volcano-tectonic (VT), hybrid (HB), and long-period (LP) signals during 1-15 December. Two swarms of VT earthquakes were recorded during 10-11 December, with the largest event, a local M 2.9, located 4.7 km ESE of the caldera’s center at a depth of 4.6 km. The largest of five HB signals was a local M 3.1, located 4 km ESE at a depth of 4.3 km. The earthquake locations suggested a relatively shallow source SE of the caldera. No deformation or surficial changes were observed. The Alert Level was raised to Yellow (second highest level on a four-color scale) on 22 December, based on the increased seismicity. ONEMI warned the communities of Aysén and Río Ibáñez, declaring a status of “Preventive Early Warning”, a level in between Green and Yellow.
Source: Servicio Nacional de Geología y Minería (SERNAGEOMIN)
Based on an OVDAS-SERNAGEOMIN notice, ONEMI reported that seismicity at Cerro Hudson had become more stable during 1-15 December, after an increase in the magnitude of the highest energy events had been detected the previous month. The volcano Alert Level remained at Yellow (second highest level on a four-color scale), and ONEMI noted that the Alert Level remained at Yellow (the middle level on a three-color scale) for the communities of Aysén, Río Ibáñez, and Chile Chico.
Sources: Servicio Nacional de Geología y Minería (SERNAGEOMIN); Oficina Nacional de Emergencia-Ministerio del Interior (ONEMI)
Based on OVDAS-SERNAGEOMIN notices from 1 and 30 November, ONEMI reported on 2 December that, although the rate of seismicity at Cerro Hudson had remained at normal levels and similar to previous periods, the magnitude of the highest energy events had steadily increased during the last months. Additionally the earthquakes were occurring in the same general area as those detected during the 2011 volcanic crisis. OVDAS-SERNAGEOMIN raised the Alert Level to Yellow (second highest level on a four-color scale), and ONEMI declared an Alert Level Yellow (the middle level on a three-color scale) for the communities of Aysén, Río Ibáñez, and Chile Chico.
Sources: Oficina Nacional de Emergencia-Ministerio del Interior (ONEMI); Servicio Nacional de Geología y Minería (SERNAGEOMIN)
OVDAS-SERNAGEOMIN reported that satellite imagery and an area web camera showed no plumes rising from Cerro Hudson during 7-15 November. Seismic activity decreased significantly, reaching a low level characterized by no more than four earthquakes per hour and the absence of tremor. The Alert Level remained at Yellow, Level 4.
Source: Servicio Nacional de Geología y Minería (SERNAGEOMIN)
On 2 November, OVDAS-SERNAGEOMIN reported that the Alert Level for Cerro Hudson was lowered to Yellow, Level 4, noting that the eruption that began on 26 October had ceased. ONEMI reported that the 140 evacuees were permitted to return home. Analysis of ash deposited on the edge of the crater during the eruption indicated the presence of juvenile basalt. During 1-6 November between 16 and 110 earthquakes per day were recorded and satellite images showed drifting plumes daily.
Sources: Servicio Nacional de Geología y Minería (SERNAGEOMIN); Oficina Nacional de Emergencia-Ministerio del Interior (ONEMI)
OVDAS-SERNAGEOMIN reported three new craters at Cerro Hudson following increased seismicity that was detected during 25-26 October. At 1908 on 25 October an M 4.6 volcano-tectonic earthquake occurred at a depth of 19 km, followed by a seismic swarm starting at 2149. More than 100 events, with depths ranging from 15 to 25 km, were recorded through the next day; 12 of the events were M 3, and three events were M 4. Scientists aboard an overflight on 26 October observed a white plume with some ash content that rose 1.5 km and lahars in Rio Huemul, to the W. The Alert Level was raised to Level 5 - Red. A very low-frequency M 4.3 earthquake occurred that same day at a depth of 15 km.
Five earthquakes per hour were recorded between 1600 on 26 October and 1600 on 27 October. Most of the earthquakes were volcano-tectonic events with magnitudes lower that 3.6 and located W of the caldera at depths between 3 and 25 km. The earthquake hypocenters became shallower with time. The most significant event, a M 3.6, occurred at 0227 on 27 October and was located in the SW edge of the crater. Very low-frequency earthquakes possibly indicated magma movement.
SERNAGEOMIN staff aboard an overflight on 27 October observed three craters along the S, SE edge of the caldera, with diameters of 200, 300, and 500 m. Mostly white plumes rose above the two smaller craters. The larger, southern-most crater emitted a plume with a greater ash content that rose 5 km above the crater. Satellite imagery showed a plume drifting 12 km SE. In response to the raised Alert Level, ONEMI reported that 128 people were evacuated from areas within a 45-km radius of the volcano, defined as high-risk zone.
One earthquake per hour was recorded between 1600 on 27 October and 1600 on 28 October. The majority of the earthquakes were characterized as long-period with magnitudes less than 2.2. During an overflight on 28 October, scientists observed a gas plume with a very low ash content rise 3-4 km above the craters. Seismicity continued to decrease during 28-29 October. Scientists conducting an overflight noted that a gas plume with some ash rose 1 km above the craters and drifted 5-8 km NE. They also confirmed that a large lahar had traveled down the Rio Huemul and another branch of the river during the initial phase of the eruption. During another observation flight on 30 October, scientists saw plumes with minor ash rising 0.8 km from two of the three craters. ONEMI noted that the total number of evacuees had reached 140. On 31 October scientists observed gas plumes rising 0.5 km above the craters and drifting SE. On 1 November scientists observed an explosion and an accompanying ash plume that rose 1.5 km above the active craters. They also noted subsequent minor explosions and ash emissions.
Sources: Servicio Nacional de Geología y Minería (SERNAGEOMIN); Oficina Nacional de Emergencia-Ministerio del Interior (ONEMI)
Reports are organized chronologically and indexed below by Month/Year (Publication Volume:Number), and include a one-line summary. Click on the index link or scroll down to read the reports.
Mid-August eruption generates large plumes and lahars
Card 1280 (16 August 1971) Eruption causes property damage and cattle evacuation
"A volcano, presumable The Hudson, in Coihaique Department in southern Chile, has spread debris over an area of 60 km2 forcing the evacuation of 10,000 head of cattle and sheep from the area. The volcano's explosion was followed by a river of lava that has razed one house, cut several roads, and is damming the rivers. Several other houses have probably been razed. Bad weather in the area of the eruption has prevented patrols from determining exactly where the eruption occurred, the amount of damage, and the number of victims."
Card 1282 (17 August 1971) Ashfall causes significant crop and cattle damage
The Aysen mayor has informed the Interior Ministry that the volcanic eruption in the area of Huemules Cordon has caused grave losses to agriculture. A correspondent for Radio Patagonia Chilena provided more details of the eruption:
"Because of poor climatic conditions and inaccessible terrain it has not been possible to reach the sector where the Hudson Volcano has been erupting since Thursday, 12 August. Both civilian and military patrols are going to Huemules Valley to learn of the extent of the damage caused yb the volcanic lava.
"This afternoon we learned that the Hudson was erupting with more intensity and that the lives of the inhabitants of Bahia (Eranco) are endangered. It was confirmed that 70% of the cattle in this sector are affected by the heavy covering of ashes which prevent the cattle from grazing.
"Information from Coihaique, 120 km NE of the site of Thursday's eruption, is that approximately 200 persons are missing, while rivers of lava and showers of ash have isolated and wiped out pastures for 200 km around, threatening also to wipe out 10,000 head of cattle in the region. Only nine people have been rescued of the 50 families scattered throughout the Huemules cattle-raising area."
Card 1283 (23 August 1971) Eruption plumes to 20,000 feet; five victims
"The Hudson Volcano entered a new phase of violent activity today (20 August). Since 19 August it has made the province an inferno of lava, ash, and telluric phenomena. While the volcano shoots terrifying smoke columns from its three craters to a height of 20,000 feet, earthquakes have resumed in the region, more than 2,000 km S of Santiago. There have been reports of five victims: three minors and two adults. The snow at the top of the volcano continues to thaw at an increasing rate and is descending into the valleys, threatening serious flooding."
Card 1284 (25 August 1971) Potential deaths of fifty families
The following cable was received from the American Embassy on 25 August.
"Eruption reported as initiating July 12 at 18 plus hours. Location at coordinates 45.33 S, 73.5 W at headwaters River Huemules, 120 km SE Coyhaique, 30 km N Mount San Valentin. Second eruption July 16 reported at coordinate 45.73 S, 73.13 W. Eruptions continue through July 18. Seismic shock grade 4 lasting 45 seconds recorded July 17 at 1505. Smoke cloud between 10 and 15,000 feet. Ash covering 100-150 km area. Lava flow extending 10 km into valley estimated at 2 m base. Avalanches of mud, water, and glacial ice verified. Few persons of estimated 50 families in valley expected to have survived."
NOTE: Date of 12 July is not confirmed. All reports received to date have reported that eruption began on 12 August.
Card 1286 (30 August 1971) Activity diminishes after 26 August
The following was received by cable from the American Embassy on 30 August. Francisco Munizaga, Professor Volcanology, Department Geology, University of Chile, overflew eruption site August 18 and offered following information:
"Eruption not volcano Hudson but caldera Cerro Ventisquero about 30 km N of Hudson at head Huemules Valley. Due low visibility unable tell if reactivity is lateral or central. Suspect is central with cone 1-1.5 km wide. Eruption is viroplastic explosion. Appears to be no expulsion of large fragments. Seismic activity registered grades 3-5 before and after eruption and was limited to locality. Eruption continued through August 26 but diminished in force as evidenced by disappearance of ash cloud. Fumarolic cloud is now principal. No repeat no lava flow observed. Object of earlier newspaper reports was flow of mud ash and water (lahar) reaching 20-30 km to River Huemules where it carried out to canal in suspension.
"In opinion Munizaga and Peter Welkner, Institutio Geofisica, seismological phenomenon is of minor importance. Team Chilean scientists headed by Alvaro Tobar, Instituto Investigacion es Geologicas, and Mario Vergara, Department Geology, University of Chile, plan visit site week August 30 for preliminary study phenomenon."
Information Contacts:
Card 1280 (16 August 1971) Instituto de Geologia y Geografia, Universidad Austral de Chile; Buenos Aires Ansa (radio), Argentina.
Card 1282 (17 August 1971) Instituto de Geologia y Geografia, Universidad Austral de Chile; Radio Patagonia Chilena, Chile.
Card 1283 (23 August 1971) Instituto de Geologia y Geografia, Universidad Austral de Chile (via news media).
Card 1284 (25 August 1971) American Embassy, Santiago, Chile; Chilean Meteorology Office; Chilean news media.
Card 1286 (30 August 1971) Francisco Munizaga, University of Chile; American Embassy, Santiago, Chile.
Eruption on 5 April causes mud avalanches that bury two people and hundreds of animals
Card 1603 (11 April 1973) Eruption on 5 April causes mud avalanches that bury two people and hundreds of animals
The Mt. Hudson volcano erupted on 5 April 1973 and showered ash over a 25-mile area. The eruption was reportedly characterized by a "giant fireball" and thick columns of smoke, as well as the ejection of lava and rocks. Two shepherd and hundreds of animals were buried by mud avalanches in the Huemules Valley.
Information Contacts: Alvaro Tobar B., Instituto de Investigaciones Geologicas, Santiago, Chile.
Temperature rise, not eruption, caused damaging April lahar
Card 1645 (24 May 1973) Temperature rise, not eruption, caused damaging April lahar
The following information was received by cable from Santiago on 24 May 1973. "The last airplane reconnaisance flight on April 14 confirms that Mount Hudson has not been active since the 1971 eruption. Fumarolic activity in the central area of the 9-km-wide crater was observed. The ice cover melted last April producing a lahar which flowed down the Huemules and Cupquelan valleys destroying property, farmhouses, and cattle, finally reaching the sea 70 km away. A rise in temperature produced a 70% melting of the ice cover in the crater area."
Information Contacts: Ricardo Fuenzalida, Instituto de Investigaciones Geologicas, Santiago, Chile.
SO2 circles globe; aircraft encounter ash over Australia; >1 km3 airfall on Argentina
On 12 August, the volcano entered a paroxysmal phase, after four days of lesser explosive activity. Tephra was ejected to 16-18 km height, falling up to 1,000 km SE on the Falkland Islands, and with estimates of >1 km3 deposited in Argentina [but see 16:8]. Ash leacheate analyses showed unusually high levels of fluorine. The SO2-rich plume produced by the eruption was rapidly transported around the world, returning to Chile within 7 days. Airline pilots reported sighting the plume as it passed near Melbourne, Australia (roughly 15,000 km from the volcano).
Initial strong explosive activity, 8-10 August. The following quoted material is from José A. Naranjo. "Just 20 years after the previous activity, Hudson started a new eruption on 8 August at 1820. Local inhabitants who were evacuated from the Huemules River (to the W) reported small precursory seismic activity 3-4 hours before the first explosion. The eruption started with a phreato-magmatic explosion that produced a column almost 7-10 km high. Immediately following the initial explosion, a dense, ash-laden column (light brown-greyish in color) formed, reaching ~12 km. Intense lightning discharged from the mushroom-shaped cloud. Activity steadily decreased through 11 August, when direct observation of the summit showed that the 8 August eruption vent was on the W side of the caldera (10 x 7 km; figure 1). The caldera floor was covered by glacial ice estimated to be at least 40 m thick, and having a volume of about 2.5 km3. In addition, a flank valley, extending 10 km NW from the summit to Huemules valley, is filled with a tongue of ice from the main summit glacier. This terminates at the Huemules Valley, which extends onward ~35 km W to the coast.
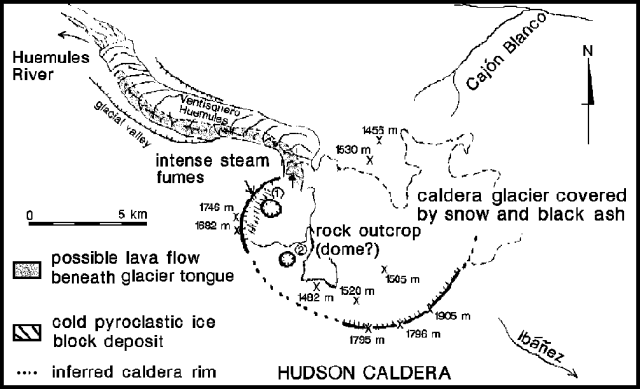 |
Figure 1. Sketch map of the summit area of Hudson, 11 August 1991. Courtesy of José Naranjo. |
"Prevailing winds during clear weather carried the column NNE (figure 2) over Puerto Chacabuco (50 km away), where 5-7 mm of ash was deposited. At Puerto Aisén (~ 65 km NNE), ash accumulations reached 5 mm in 16 hours. Lava was observed beneath glacial ice near the vent, flowing down to Ventisquero ('glacial tongue') Huemules. Between 3 and 4 hours after the main explosion, a jökullhaup flowed down the Huemules valley to the coast. A 2-m-thick deposit of ash- to lapilli-sized sand and 0.2-5-m-diameter ice blocks was randomly dispersed near the delta. These ice blocks probably floated in the mudflow." The press reported that the flow increased the river width from 80 m to 170 m.
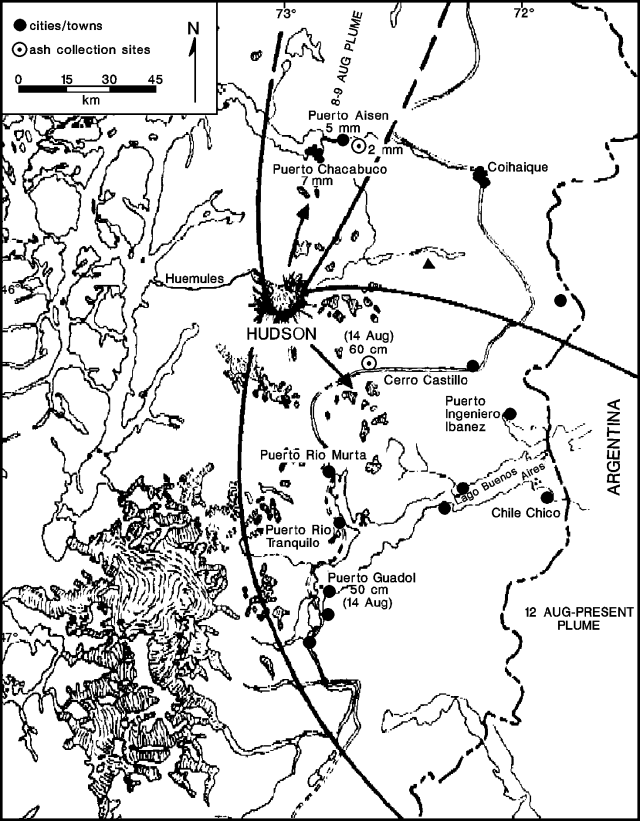 |
Figure 2. Map showing the location of Hudson and the direction of ash dispersal on 8-9 and 12-15 August 1991. Courtesy of José Naranjo. |
Late on 9 August, a NOTAM reported the plume at 11-12 km altitude. Although the eruption remained nearly continuous, intensity declined. By 10 August, Ladeco (Chilean Airlines) pilots reported the plume at ~ 6 km altitude.
"Eleven people were evacuated from along the Huemules River on 11 August. Direct observations at 1250 showed an explosion from a new vent (Crater 2), about 2.5 km SSE of the first vent (Crater 1; figure 1). The new white-and-black explosion cloud was smaller and spread laterally, developing black, cold pyroclastic-ice flows around the vent, similar to the original. White-grey columns, reaching 3 km height, were observed up to the last direct observation at 1630 on 11 August.
Paroxysmal activity, 12-15 August. "A second, larger eruption started at about 1200 on 12 August. Bad weather prevented aerial observation, but heavy ashfall was reported at Río Murta (60 km SSE) at 1245, and 7 minutes later at Río Tranquilo, 20 km farther S. The ashfall was accompanied by intense lightning, and a sulfur odor. At 1300, ashfall was reported at Puerto Guadal (105 km S). The eruption was directly observed on a commercial flight at 1430. The dense, brown-grey cauliflower-shaped cloud, carried SE, was visible from 4 km altitude, but clearly reached >10 km, with more than a 5-km thickness. One explosion was observed rising at a rate of 1.9 km/min. Observations ended at 1440.
"Since 12 August the eruption has continued without variation, and the plume has been carried SE. On 13 August at 1415, a black ash-laden column was reported from a commercial airplane at >10 km altitude. Pumice fall was since reported beginning 14 August, and coarse lapilli up to 5 cm in diameter fell 55 km SE."
Although weather clouds obscurred the eruption plume to visible and infrared satellite images on the 12th and much of the 13th, preliminary data from the Nimbus-7 satellite (TOMS) indicated 250,000 metric tons of SO2, within a disconnected section of the eruption cloud near the Falkland Islands at about 1100 on the 13th. Beginning at about 2000, a continuous, narrow, eruption plume was visible on AVHRR (NOAA 9 and 11) and GOES satellite images, gradually extending 1200 km SE, beyond the Falkland Islands, at ~12 km altitude. The plume became disconnected from the volcano at about 1200 on 14 August, by which time, Naranjo reported, the eruptive column reached a stable altitude of 16 km. TOMS data from 1100 on the 14th revealed a segment of SO2-rich plume (probably the same as on the 13th) near South Georgia Island (2,600 km ESE of the volcano), and a second, smaller segment over the Falkland Islands. No other SO2-rich plume was visible.
Intense seismic activity was felt on 14 August at 1630, 60 km SSE, where 3-cm-diameter pumice was falling. A continuous eruption began again at about 2000, when satellite images (GOES and NOAA 9 and 11) showed that the plume was carried SE at 185 km/hr (100 knots) at stratospheric altitudes of 17-18 km (figure 3). Seismicity increased, with felt earthquakes at Coyhaique (80 km NE) beginning at 2200, and a series of five large earthquakes (M>5) detected near Hudson by the WWSSN beginning at 2238 (table 1). Early on the 15th, the plume extended 1,500 km SE, past the Falkland Islands, where it divided into two components, one travelling E, the other S, both quickly becoming diffuse. At its widest point (the Falkland Islands), the plume was 370 km wide. Infrared satellite imagery showed the plume before it disconnected from the volcano at 1130. TOMS data from 1100 on the 15th (figure 4) showed the plume already disconnected from the volcano, and containing roughly twice as much SO2 as on the 13th (missing data prevented more accurate determinations). No additional emissions have been reported as of 23 August.
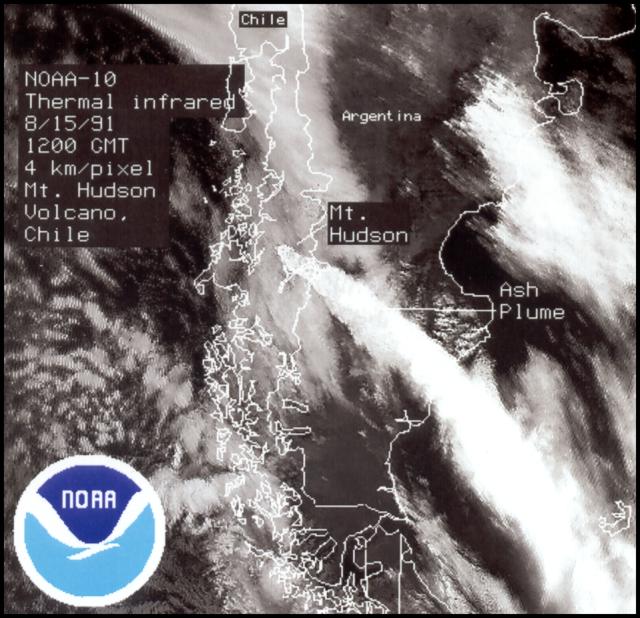 |
Figure 3. Infrared image from the NOAA 10 polar orbiting weather satellite on 15 August 1991 at about 0800, showing the ash plume extending SE from Hudson. Temperature estimates suggest that the plume is at aboout 17-18 km altitude. Courtesy of G. Stephens. |
Table 1. Earthquakes near Hudson recorded by the Worldwide Standardized Seismic Net on 14-15 August 1991. Original, very preliminary data are replaced by information from the National Earthquake Information Center's Preliminary Determination of Epicenters.
| Date | Time | Latitude | Longitude | Magnitude | Depth |
| 14 Aug 1991 | 2238:15 | 45.6°S | 72.6°W | 5.2 mb | -- |
| 15 Aug 1991 | 0039:08.5 | 45.7°S | 72.6°W | 5.3 mb | -- |
| 15 Aug 1991 | 0250:37.9 | 45.8°S | 72.5°W | 5.3 mb | -- |
| 15 Aug 1991 | 0546:15.7 | 45.7°S | 73.2°W | 5.7 Ms | 13 km |
| 15 Aug 1991 | 0816:19.3 | 45.6°S | 71.9°W | 5.3 mb | -- |
Eruption plume migration. The eruption plume of 14-15 August was rapidly carried E by the "Roaring Forties" winds as shown by TOMS data (figure 4), reaching Australia (15,000 km E) on 20 August. There the following report was compiled from airline information by Alfred Prata:
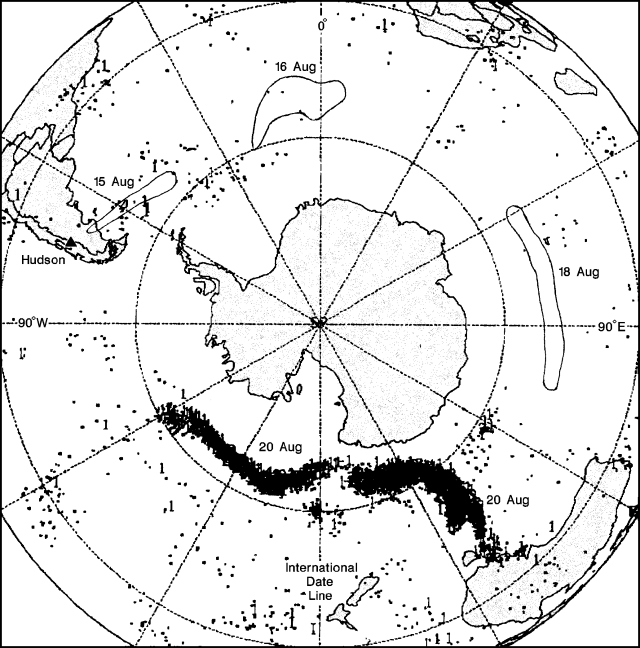 |
Figure 4. Preliminary data from the TOMS on the Nimbus-7 satellite showing a polar view of an eruption cloud from Hudson on 20 August 1991 at about 1100 (local time). Each dot represents SO2 values above 10 milliatmosphere-cm (100 ppm-m), within an area 50 km across. The prominent concentration of SO2 to the left represents the cloud's position 24 hours after that to the right, but both are 20 August because they straddle the International Date Line. Envelopes surrounding the cloud's position at approximately 1100 (local time) on 15, 16, and 18 August have been added to illustrate its passage around the globe. Courtesy of Scott Doiron. |
"On 20 August, Australian Airlines flight FL418 (Airbus) from Melbourne to Sydney reported an encounter with a strange hazy cloud 260 km NE of Melbourne at about 0230. The haze was faint grey, much like the material often trapped under a temperature inversion, and had a brownish-orange tinge. The haze appeared uniform (not wispy) and there was no evidence of any trace of debris. Associated with this was a strong smell of sulfurous gas which entered the aircraft and was noticed by the crew and passengers. The return flight departed Sydney at about 0400 and encountered the same haze in roughly the same place at 0445. The aircraft was in the haze for 5-10 minutes (75-150 km) and did not change their flight level (FL330, ~10 km altitude). A NOTAM was issued for the period of the evening of the 20th through the morning of the 22nd." The cloud was also reported by pilots from Qantas and Ansett, as late as 2000 on the 20th.
The Atmospheric Research Division of CSIRO were able to discriminate the plume, ~ 500 km long and 100 km wide, on an AVHRR image by ratioing bands 4 and 5. TOMS data showed the plume continuing its eastward path, reaching Chile on 21 August.
Deposits and post-eruptive activity. Intense fumarolic activity continued from a 2-km fissure (oriented N20°E) on the WNW caldera margin during a 23 August overflight. Weaker fumarolic activity was observed on the interior slopes of the 500-m-diameter Crater 1, located 400 m E of the fissure (figure 1). The fissure and Crater 1 were the site of activity 8-10 August.
A black flow (probably lava), with shades of reddish-brown, extended about 3.5 km from the extreme N end of the fissure, onto Ventisquero Huemules. The flow was 50-300 m wide, with several broader sections, and covered recent scoria (8-10 August) in places. Several weak vapor/gas emissions were visible. Scoriaceous pyroclastic flow deposits containing large quantities of ice and snow extended from the fissure toward the interior of the caldera, and in part, over Ventisquero Huemules toward the NW, and Huemules Valley.
Products of the 8-10 August activity were basaltic in composition. Ash samples (ranging to 0.1 mm in size) from Puerto Aisén contained abundant magnetite, pyroxene, plagioclase, and black glass shards. Silica contents of the ash were determined to be 50.98% (at Sernageomin Laboratory).
At Crater 2, believed to be the site of activity on 12-15 August, intense degassing occurred at 3 fumaroles along the S margin. Concentric cracks were visible in the thick ice surrounding the 800-m-wide Crater 2. Pumice from 12-15 August activity differed in composition from the earlier erupted material. Whole rock analyses (from Peter Bitschene) indicated a trachyandesitic composition, with ~ 60% SiO2 and 8-9% alkalies. The distal fallout ash was >98% vitric with predominant pumice and platy shards, and some entrained blocky basaltic shards.
Bitschene estimated that more than 1 km3 of tephra was deposited in Argentina's Santa Cruz province [but see 16:8]. Lakes near the volcano were highly turbid and had layers of floating pumice along their E shores. Increased sediment load resulted in the acceleration of delta growth in Lago Buenos Aires (SE; also called Lago General Carrera), and silting up of the mouth of Río Ibáñez near Puerto Ingeniero Ibáñez (75 km SE) creating a flood risk.
Roughly 50-60,000 sheep and cattle are located within the airfall zone. Extremely high values of fluorine (225 ppm water extractable) were obtained from the ash analyzed 4 days after the eruption. Alberto Villa (INTA, Univ de Chile) reported that grass samples collected at the same site had 280 ppm fluorine (on a dry basis). [but see 16:9-10]
Reference. Stern, C.R., 1991, Mid-Holocene Tephra on Tierro del Fuego (54°S) Derived from the Hudson Volcano (46°S): Evidence for a Large Explosive Eruption; Revista Geológica de Chile, v. 18, no. 2, in press.
Information Contacts: J. Naranjo, SERNAGEOMIN; H. Moreno, Univ de Chile; G. Fuentealba and P. Riffo, Univ de La Frontera; P. Bitschene, Patagonia Volcanism Project, Argentina; N. Banks, USGS; SAB, NOAA; G. Stephens, NOAA/NESDIS; S. Doiron, GSFC; B. Presgrave, NEIC; C. Stern, Univ of Colorado, Boulder; A.J. Prata, CSIRO, Australia; ICAO; Radio Nacional de Chile; AP.
Basaltic fissure eruption preceded andesitic paroxysmal phase; strong winds rework major ash deposits
In one of the largest eruptions of the century, Hudson's mid-August paroxysm produced an eruption cloud 18 km high and deposited ash up to 1,000 km SE. Estimates of tephra volume range between 2 and 6 km3; >1 km3 was deposited in Chile, around 2 km3 in Argentina, and 2 km3 may have fallen in the Atlantic Ocean or been lost to the atmosphere. Satellite data showed that the eruption produced a large SO2-rich cloud, estimated to contain 1.5 megatons of SO2 on 16 August, that was transported twice around the globe in 2 weeks.
The following is from a report by Norman Banks. "The eruption produced 1 to 2+ km3 (dense rock equivalent) of magma. The initial 8-9 August eruption (beginning about 1820 on 8 August) was from a basaltic (50% SiO2) dike through a fissure 4 km long, trending through the NW rim of the 10 x 7 km, ice-filled caldera. The basalt erupted both as a lava fountain and phreatomagmatically, producing a tephra column 12 km high, scoria flows that covered 10 km2 of the western caldera floor and an unknown area outside of the caldera, a 4-km-long lava flow over the WNW flank's Huemules glacier, long-lived (12 hours) floods down the Río Sorpresa (WSW flank) and Río Huemules valleys, and a rather low-volume tephra-fall deposit N of the volcano. This ash had a moderate level (100-300 ppm dry weight) of soluble fluorine that was quickly reduced to 2-10 ppm by heavy rains during the next 2 weeks. Grass growing through this deposit has a fluorine content of about 30 ppm.
"The andesitic eruption of 12-15 August may have been due to secondary boiling triggered by intrusion of the 8 August basalt, or other basaltic dikes into the andesitic magma body under the caldera; bombs and lapilli of pumiceous andesite (60% SiO2) mixed with chilled basalt are common in the tephra-fall deposits. The 3-day andesitic eruption produced a strong Plinian column that ejected pyroclastic material into a very strong SE-directed stratospheric wind (185 km/hr) that kept the plume narrow even 700 km from the volcano. Pumiceous ballistic bombs 1 m in diameter were found 10 km from the vent, where tephra-fall deposits were >2.5 m thick. The 10-cm isopach reached just SE of Chile Chico (120 km SE of the vent) and 1-2 cm of ash was deposited at Argentina's coast (figure 5). [As many as 13 distinct layers of ash were deposited in some locations.] Fortunately, pyroclastic flows did not spill onto the outer snow-covered flanks during this episode, and no additional mudflows were reported. Shortly after the 12-15 August eruption, however, secondary water-and-pumice flows formed on the volcano's flanks during daily melting of the snow. Because most of the thick deposits on the steep mountainous terrain SE of the volcano are on and interleaved with snow, downslope movement and associated hydrological problems for the downstream valleys are certain to accelerate as the summer melting and rains begin. The andesitic ash in Chile had low amounts of soluble fluorine (<20 ppm), and grass covered by or growing through the ash deposits has a relatively low fluorine content. Analysis of fine fractions of the Chilean deposits suggest that downwind (Argentinean) fluorine values will not be significantly higher."
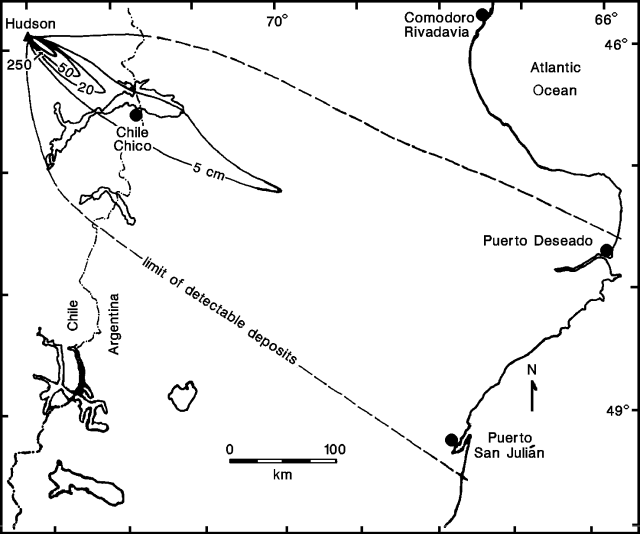 |
Figure 5. Preliminary isopach map of the 12-15 August 1991 tephra-fall deposits from Hudson. Prepared by N. Banks, H. Moreno, H. Corbella, M. Haller, and H. Ostera. |
Steam emission, occasionally containing minor quantities of ash, declined rapidly following the eruption's end on 15 August.
Major reworking of ash deposits in Argentina by strong winds led to several false reports of renewed activity at Hudson. Ash was redistributed N to Comodoro Rivadavia (2 mm at 400 km E of Hudson) and was reported S to Río Gallegos (700 km SSE). In early September, GOES satellite images detected ash clouds, probably below 3 km, carried by ground-level winds at 55-65 km/hr; these clouds extended from near the volcano to over the Atlantic ocean. The densest part of the clouds appeared to be ~250 km SE of the volcano, about halfway to the Argentine coast. Poor visibility, down to a few hundred meters, was reported at Puerto Deseado and Puerto San Julián. Argentine officials have expressed concern over the >2 million sheep and 3,000 cattle in the affected region.
Information Contacts: N. Banks, USGS; H. Moreno, Univ de Chile; J. Naranjo, SERNAGEOMIN; P. Bitschene, Patagonia Volcanism Program, Argentina; P. Maxwell, US Embassy, Buenos Aires; D. Helms, Lockheed, Houston; S. Doiron and G. Bluth, GSFC.
New mudflow and gas emission; details of major mid-August tephra fall
In the first new activity since the paroxysmal event of 12-15 August, a small eruption occurred several days before 6 October, emitting ash that was carried 8 km SE. The probable source was the new vent in the SW part of the caldera, which showed numerous fumaroles, especially along the S wall, during a helicopter overflight on 14 September. At about 2200 on 11 October, a mudflow, estimated to be 2-3 times larger than the 8 August mudflow (16:7), traveled 20 km NW down the Huemules valley, and SSW down the Cupquelán valley to reach the coast at Bahía Erasmo (45 km from the volcano). During the evening a brief ashfall was reported 60 km SSE (at Bahía Murta), and a strong degassing event occurred within the caldera. Sulfurous fumes were very intense in the Huemules valley, where some inhabitants became sick, vomiting and losing consciousness. On 12 October, a sulfur odor was detected in Cochrane (150 km S) and at Coyhaique (75 km NE), but it had disappeared by 13 October. Several small earthquake swarms were recorded between 0400 and 1130 on 12 October.
A 16 October helicopter overflight of the mudflow deposits showed them to include ash, snow (ice), and mud; five dead animals were observed together with some others trapped in the mud. Bad weather conditions hindered direct observation of the caldera in October, and as of the 21st it was not certain whether the mudflow was caused by fumarolic activity (which apparently triggered a mudflow in 1973) or new lava emission (as in 1971 and on 8 August 1991). Seismicity fluctuated below ~ 10 recorded earthquakes/day through mid-October (figure 6), typical of levels since a rapid decrease following the paroxysmal eruption 12-15 August.
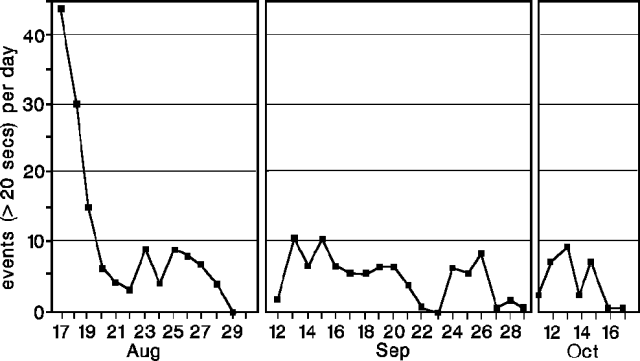 |
Figure 6. Daily number of earthquakes at Hudson, 17 August-17 October 1991. No data exist for 1-11 September or 1-10 October. A swarm recorded between 0400 and 1130 on 12 October is not included. Data for 11 October are for 1200-midnight; data for 17 October are for midnight-1020. August-September data are from Héctor Massone; October data are from Mario Villouta. All data were collected at a seismic station 50 km NE of the volcano near Lago Elizalde. |
The following, from the Geological Team of the Santa Cruz Volcanic Emergency Commission, describes the impact of the Hudson eruption in Argentina.
The eruption's first effect in Argentina was reported on 9 August at 1600, when an Aerolineas Argentinas aircraft flew through a dense SO2-rich cloud at ~ 10.5 km altitude, near 40°S, 69°W. NOAA 10 and 11 satellite images of the eruption's basaltic phase on 8-9 August showed a narrow 550-km-long plume extending NE across the central area of Chubut Province (Argentina). The 12-15 August paroxysmal trachyandesitic eruptive phase produced a dense plume of gas and ash that was transported ESE by the jet stream at nearly 200 km/hour, at ~ 8 km altitude near the caldera and rising progressively to more than 12 km at the Chile-Argentina border. This dense, elongate plume traveled in the lower stratosphere (12-16 km) without great dispersion, spanning a horizontal angle of only 15° during 12-15 August. As a consequence, tephra fall was concentrated in a narrow fan-shaped sector of Patagonia, extending to Puerto Deseado (580 km ESE) and San Julián (550 km SE) on the Atlantic coast. By the end of the eruption, 100,000 km2 of Santa Cruz Province, Argentina, had been covered by an ash blanket 0.1-10 cm thick, and a 6.5-km-thick stratus cloud of suspended particles remained.
Deposits. On 16 August, shortly after tephra fall had effectively ceased, a strong wind began to blow (surface winds of up to 110 km/hour are common in Patagonia), lasting for a week. When the winds stopped, four multidisciplinary groups of the Santa Cruz Volcanic Emergency Commission were able to enter the affected area, employing specially dust-protected trucks. A survey was performed between 25 August and 1 September along access roads; the main technical problem in making isopach and volumetric estimations was correcting for remobilization of the primary tephra-fall deposits by the violent winds.
Sampling was performed, on individual layers or on the whole deposit, with an attempt to avoid remobilized materials. Isopach curves differ from the usual pattern, in which thickness rapidly decreases with distance from the vent. Instead, some maxima were found 500 km from the volcano, close to the Atlantic coast. This is probably a consequence of a special air-circulation condition: low-density pumice fragments transported by a powerful jet stream. In Santa Cruz Province, ash deposits originally ranged from 0.1 to 11 cm thick, but accumulations up to 150 cm thick were observed on the protected, downwind sides of obstacles in the zones affected by remobilization. The volume of the accumulated ash deposits was estimated at 2.8 km3, equivalent to ~ 2.3 x 10¹² kg of ash deposited over a 100,000 km2 area.
Nature of the materials. Investigation of the internal structure of the deposits revealed strong grading with a sharp transition between sand-sized and silt-sized layers. Bimodality is also reflected in the grain-size distribution, with one mode for sand and one mode for silt, and a remarkably low content of very fine sand. The layers indicated at least 5 strong pulses of eruptive activity.
The proportion of fine material clearly increases with distance to the eruptive center. Following this trend, the maximum pumice-fragment size diminished from around 3 mm near Lago Buenos Aires (a 110-km lake, 65 km from the volcano at its closest point) to ~ 0.3 mm along the Atlantic coast.
Density measured on 39 pumice samples ranged from 0.61 to 1.05 g/cm3. Coarse floating pumice, occasionally forming rafts, was observed in Lago Buenos Aires.
Mineralogical composition was determined for the very fine sand fraction (0.062-0.125 mm), which consists of vitric particles (87%) and crystals (13%) with rare lithics. The vitric particles are composed of pumice (~70%) and cuspate to platy shards (30%). Most pumice particles have a fibrous texture with tubular vesicles of subparallel orientation and longitude/diameter ratios larger than 10/1. Crystals are fresh, euhedral, commonly broken, and often have glass rinds. The main components are feldspar, olivine, ortho- and clinopyroxene, and magnetite. Biotite, tridymite and unidentified iron/manganese oxides are less abundant.
Regional impact. The consequences of the eruption on Argentine territory, together with the difficult meteorological conditions that usually affect this region, produced a serious and persistent situation. The tephra fall hindered transportation and caused the collapse of some house roofs due to the weight of the ash accumulations. Ashfall and/or the later remobilization by winds polluted the atmosphere, causing respiratory ailments, damage by abrasion to engines and mechanical devices, and other problems. Low visibility provoked numerous accidents and aviation inconveniences. Problems persisted in mid-October.
The eruption has caused many difficulties for livestock (principally sheep and cattle) and wildlife, including: thirst, because the great water absorption capacity of the fine pumice particles dried every source of water in this already desert area; hunger, because the tephra deposit covered the grass, preventing ingestion or obliging the animals to swallow a large proportion of ash; blindness, due to the abrasive action of the glass shards and minerals, continuously blown by the wind, on the cornea; and immobilization due to increase in weight by accumulation of ash into the wool fleece, impeding movement. As a consequence, 50% of the sheep and cattle had died within 30 days of the end of the Hudson eruption. [see also 16:10]
Vegetation in this desert region (<150 mm/year precipitation) was initially covered by a thin layer of ash that retained moisture. However, the strong winds removed this protective cover, damaging pastures by the impact of the particles and by completely burying them under dune formations.
Other phenomena related to the Hudson eruption were:
Earthquakes. In Bajo Caracoles, 200 km ESE of Hudson, shocks of medium intensity destroyed some adobe buildings. People from these rural areas reported loud noises and ground vibrations.
Acid rain. The odor of sulfurous gas was noticeable everywhere in the area affected by ashfalls, but acid rain was only reported in Gobernador Gregores, 360 km ESE of the volcano, where H2SO4 produced light face and hand burns, and damaged roof paint.
Atmospheric contamination. After the tephra fall stopped (August 15), remobilization of fine ash occurred each time the W wind blew at speeds higher than 35 km/hour, causing the formation of huge dust clouds. The population was warned to employ protective dust masks to prevent respiration of the fine glass shards in these clouds (<5 mm, in average concentrations of 300 p/cm3 with maximum of 1,500 p/cm3). This last phenomenon has had the largest impact on the rural and urban population, not counting the economic losses suffered.
Information Contacts: H. Corbella, R. Scasso, P. Rial, M. Palacios, M. Lucero, P. Tiberi, and D. Perez, Geological Team of the Santa Cruz Volcanic Emergency Commission, Argentina; J. Naranjo, SERNAGEOMIN ; M. Villouta, Univ de la Frontera; H. Moreno, Univ de Chile; H. Massone, Univ de Chile; G. Villaroes Pinilla, ONEMI, Santiago; R. Osorio Araneda, Coyhaique, Chile; N. Banks, USGS.
Eruption impact on livestock described
The following report about the effects of ash from Hudson's 12-15 August eruption on livestock is from the U.S. Centers for Disease Control.
"Large numbers of livestock deaths were reported in Santa Cruz province, Argentina, in the weeks immediately following the initial eruptions of Hudson. In response to reports that large numbers of sheep deaths were due to high fluoride levels from ash, an investigation was conducted by U.S. Centers for Disease Control personnel in cooperation with the Office of Foreign Disaster Assistance.
"Analysis of sheep urine and ash samples collected between 17 and 22 September revealed low levels of fluoride. Mean fluoride urine levels of 5.7 mg/L fall within the normal range for ruminants. Preliminary fluoride analyses on ash samples collected at different distances from Hudson were performed both before and after rainfall. Ion chromatography using acetic acid extraction revealed fluoride levels ranging from nondetectable to 14 ppm in the samples collected 17-20 September. Although this ash analysis is preliminary, the results indicate that fluoride levels in these samples are well below toxic concentrations. The maximally tolerable range for fluoride concentrations in ruminant feed is between 40 and 50 ppm.
"These results, in combination with clinical impressions, lead to the conclusion that a great many of the sheep deaths are possibly due to a complex set of environmental, topographical, and husbandry conditions that were exacerbated by the presence of large amounts of volcanic ash. The sheep in Santa Cruz had just survived a particularly harsh winter and were going into the spring lambing season feeding on overgrazed land that had undergone a period of prolonged drought. Pregnant ewes are typically very susceptible to toxemia late in gestation and the unavailability of food and water due to ashcover for even a short period of time is sufficient to trigger this often fatal condition. Clinical observations of sheep deaths in the area of volcano ashfall are consistent with death due to complications of pregnancy, greatly exacerbated by the physical presence of ash. Pregnancy toxemia is a condition with a very poor prognosis and no easy and certain treatment."
Information Contacts: C. Rubin and E. Noji, Centers for Disease Control, Atlanta.
Large plumes on satellite images, probably wind-blown August tephra
Satellite images on 27 November revealed extensive gray plumes extending from the vicinity of Hudson more than 1,000 km across southern Argentina and the western Atlantic Ocean (figure 7). The next day, ash could be tracked over the Atlantic to beyond 40°W. Additional, smaller plumes were seen on 3 December satellite images. Although the plumes appeared to have been generated by new eruptive activity, observers near the volcano saw no tephra ejection and seismic instruments detected no change from background seismicity. These ash clouds were probably generated as strong winds remobilized fine ash from the August eruption. The press reported heavy ashfall at Mar del Plata, on Argentina's Atlantic coast >1,500 km NE of Hudson, on 2-3 December. All flights from nearby Camet airport were cancelled because of reduced visibility and mounds of ash blocking runways.
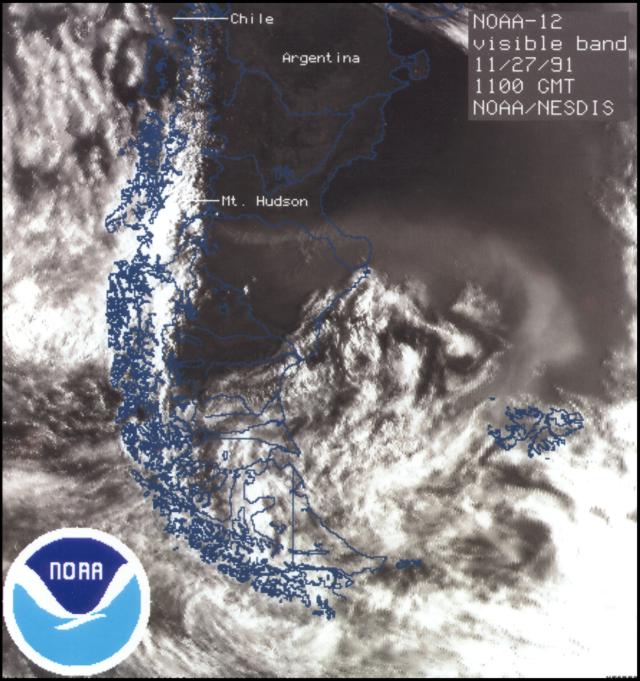 |
Figure 7. Visible-band image from the NOAA-12 polar-orbiting weather satellite on 27 November at 0800, showing an ash plume extending from the vicinity of Hudson to the western Atlantic Ocean. Courtesy of G. Stephens. |
High winds and limited post-eruption rainfall may combine to make Hudson's ash deposits particularly mobile. During a flight into a town (Chile Chico) roughly 100 km SE of Hudson shortly after the eruption, Norman Banks observed an estimated 100-200 large dust devils that were simultaneously carrying ash to ~ 4,500 m altitude, where their swirling winds were dispersed by a shear layer. Above the shear layer, ash obscured the ground, and visibility was only an estimated 2 km at ground level.
Information Contacts: SAB; G. Stephens, NOAA/NESDIS; N. Banks, USGS; Buenos AiresHerald.
Overflight reveals thick tephra and disruption of summit glaciers; many early-eruption lava flows
The following, from J. Naranjo, describes observations made during a 21 January helicopter overflight.
Strong winds produced a continuous dense gray dusty haze along valleys and over mountains SE of the volcano. Weak fumarolic activity was visible at several summit vents and a small rockfall (landslide) on the caldera's N inner wall exposed altered rocks.
The N part of the 8-9 August fissure vent (16:8), 1.5 km long, ~200 m wide, and 100 m deep, showed sparsely distributed steam fumes. An ice dome, still present in the 8-9 August steam crater, was surrounded by beige-colored water. No fumarolic activity was observed.
The caldera glacier and the 12-15 August crater were covered by tephra, including bombs and coarse lapilli, estimated to be >10 m thick. Tilted steps were observed along the partially collapsed and intensively cracked concentric fractures around the central crater. Within the crater, glacier fragments and ponds of green and pale-brown water were visible. Weak gas emission from fumaroles (during warm weather) produced an intense sulfur odor. Another circular depression, ~ 300 m in diameter, had formed ~ 3 km E of the 12-15 August crater. Concentric cracks also developed around it, without accompanying collapse.
Lava flows on the NW flank of the caldera extended 1-1.5 km down the Ventisquero Huemules glacier from the rim fissure. Small flows were 2-3 m wide and 0.5 m thick; larger ones were up to 15 m wide and 1 m thick. These aa-like flows had developed conspicuous levees and central channels with curved ridges. They were partially covered by black ash from the 8-9 August eruption and had a dark reddish-brown color. Huemules glacier was intensively cracked and partially covered by layered lahar deposits and ash along erosional channels. Various green ponds were distributed along the glacier.
Information Contacts: J. Naranjo, SERNAGEOMIN, Santiago; P. Ippach, GEOMAR.
Sulfur odors; increased river flow and turbidity; fine August 1991 ash remobilized
Sulfurous odors were occasionally detected up to 90 km S and SE of the volcano, beginning 10 April and increasing to a peak at 1100 on 13 April. Residents of Murta (60 km SSE) and Puerto Tranquilo (80 km SSE) reported headaches and nausea at 1500. The Civil Aviation Administration confirmed the intense sulfur odor SE of the volcano, but direct observation of the summit on 13 April revealed no visible eruptive activity. At 1700 on 14 April, an abnormal increase in river flow volume and turbidity was reported from Puerto Ibáñez, 90 km SE. Geologists suggested that the observed phenomena were a result of increased thermal and fumarolic activity beneath the caldera glacier (10 km diameter), combined with the abnormally dry weather conditions.
In late March, aeolian re-suspension of ash from Hudson's August 1991 eruption continued in Argentinian Patagonia. The following is from a report by the Patagonian Volcanism Project.
At about 1030 on 30 March, the crew of flight TAN 404 (Malargue to Neuquen), noted a brown "dust veil" ~50 km S of Malargue, at ~ 6,000 m altitude. Finely dispersed, light-brown volcanic ash formed a well-defined layer ~100 m thick and 300 km wide that spanned the horizon. The layer was rather homogeneous and perfectly visible against the cloud-free blue sky, but once within it the layer was no longer evident. The pilot reported that the layer had not originated from nearby surface dust, but was the result of Hudson ash again being transported to high altitudes from Argentinian Patagonia following calm weather that had prevailed in late March.
The ash was not from a recent eruption, but was entirely due to reworking of volcanic ash in dry, windy Santa Cruz Province, Argentina. On 21 March, re-suspended ash was deposited in Comodoro Rivadavia, accompanying local precipitation and a drop in temperature. At that time, strong southerly winds in Southern Patagonia suspended the ash, which preferentially traveled N along Argentina's Atlantic coastline and the Andean foothills. Other atmospheric effects included lowering of the dust layer during cold morning conditions, followed by ascent during the day due to surface heating, and fiery-red to pink high-level clouds seen in Comodoro Rivadavia at dawn on 31 March.
Volcanic bombs from the Hudson area contain black streaks in highly vesicular lighter-colored pumice. However, microprobe data indicate that the clear and dark glasses have essentially identical high-K dacite compositions.
Information Contacts: J. Naranjo, SERNAGEOMIN; P. Bitschene, A. Arizmendi, M. Fernández, N. Arias, and A. Nillni, Patagonian Volcanism Proyect, Argentina.
Increased gas emission and mudflows
The following, from Peter Ippach and Rolf Kilian, describes observations during a caldera crossing and overflight between 11 February and 5 March. These are the first reported caldera observations since January 1992 (16:12). One of the largest eruptions of the 20th century began on 8 August 1991 from a fissure cutting the caldera rim (16:7-12, and 17:3). The paroxysmal phase began on 12 August, producing eruption columns up to 16-18 km for 3 days, resulting in ashfall in the Falkland Islands, 1,000 km away. Pyroclastic flows were mostly restricted to the caldera floor, and a lava flow traveled 4 km down the WNW flank.
The basaltic eruption phase of 8-9 August 1991 (16:8) took place on the W caldera rim under 20-30 m of ice, forming an elliptical N 25°W-trending fissure vent about 2.5 km long, 300 m wide, and 200 m deep. A lava flow from the eruption extended 3.5 km WNW along the Huemules glacier from the N flank of the fissure vent (see map in 16:7); it had a maximum thickness of 8 m. Lava debris flows and aa-like flows were observed on the N flank extending up to 2.5 km from the source. Lava- and spatter-flows traveled down the slope of the inner W caldera rim, one traveling 800-1,000 m before going into a 300 m-deep depression on the ice-covered caldera surface. The proximal fallout layer is about 1-5 m thick with individual pumice clasts up to 40 cm in diameter. Constant fumarolic activity was observed, and there was an intense sulfur smell.
Since the andesitic Plinian eruption of 12-15 August 1991 (16:7), gas emission has apparently increased in a 10 km2 area surrounding the vents. Gas columns from different locations were rising to 500 m altitude. A young phreatic eruption had produced a fan of reworked pyroclastic material 10 km to the E. Mudflow production has intensified as a result of strong geothermal activity increasing glacial melting. Volcaniclastic material was flowing in erosional channels SE of the caldera and following the Huemules glacier WNW. The increased mud- and mass-flow production in the Huemules valley is similar to the April 1973 volcaniclastic flow that followed the 1971 eruption. This implies a continuing risk for the valley, which is inhabited during the summer.
Crater-like depressions in a 5 km2 area in the SW part of the caldera probably indicated two eruption centers from the August 1991 eruption. The depressions contained lakes 650 m and 800 m in diameter, surrounded by an intensively cracked glacier. Pyroclastic material was reworked and redeposited in the lower NW part of the caldera during the austral summer of 1991/92, leaving deposits up to 50 m thick. These deposits were then covered by snow during the winter of 1992. Geothermal activity was not present in the NE part of the caldera.
Pyroclastic material on the SE-directed fan from the August 1991 eruption, between the Ibáñez and Murta rivers, was also extensively reworked during the 1991/92 summer. After a rainy summer, reworking and deposition had stopped by March 1993, with a great reduction in ash transport by the rivers. However, on the W side of the volcano, irregular meltwater flows from the Huemules glacier carried a large amount of pyroclastic material down the Huemules river.
Information Contacts: P. Ippach, GEOMAR; R. Kilian, Universität Tübingen, Germany.
Sulfurous odors, noises, rising rivers, and thermal anomalies
On 15 February, inhabitants of the Huemules valley 40 km NW of Hudson heard noises coming from the volcano. The next day a sulfurous odor reached the city of Coihaique, 75 km NE of Hudson. The day after that (17 February), inhabitants of the Huemules valley again heard noises and smelled sulfur. Furthermore, the Huemules river rose such that its banks shifted laterally by 30-40 m from its normal course.
Based on an interpretation of a NOAA satellite image, personnel of the Centro de Estudios Espaciales de la Universidad de Chile reported a 10-km-diameter, 37°C thermal anomaly over the E sector of the caldera. Rodrigo Rodrigues (ONEMI) overflew the area on 21 February but saw no fresh ash upon the snow. He only saw minor fumarolic activity, mainly discharging steam. The steam escaped from part of crater 1, an area in the glacial ice cap along the W wall of the 9-km-diameter summit caldera (see BGVN 16:07-16:11).
As on 14 March 1994, this event may have generated phreatic explosions, local subglacial melting, and steam production, all possibly due to heat remaining from the 1991 eruptive cycle. Similar activity was also reported during 10-13 April 1993 and a rainy summer season in 1991-1992 caused extensive reworking of pyroclastic debris, particularly down the Huemules river (BGVN 17:03). Prior to the overflight, on 6 February 1995 a pilot flying near the Chile-Argentina border (close to Balmaceda, 45.52°S, 72.43°W) noted "strong volcanic activity." Since prevailing winds blow from the W, this might have been new ash from Hudson, but it also might have been dust or Hudson ash re-suspended from previous ground deposits.
Preliminary tephrochronology indicates that in the last 7,000 years Hudson has had at least 3 large magnitude eruptions (possibly in the VEI 4-6 range). Minor Plinian eruptions had a recurrence interval of 500 to 1,000 years (Stern and Naranjo, in press).
Hudson produced one of the largest eruptions of the 20th century starting on 8 August 1991 from a fissure cutting the caldera rim. The paroxysmal phase began on 12 August, sending columns up to 16-18 km for 3 days, resulting in ash fall on the Falkland Islands, 1,000 km away. Pyroclastic flows were mostly restricted to the caldera floor, and a lava flow traveled 4 km down the WNW flank following the glacier along the upper reaches of the Huemules valley. The eruption plume of 14-15 August was blown rapidly E by the Roaring Forties winds so that about 5-6 days later a "strange haze" arrived in Australia, 15,000 km E.
Reference. Stern, C.R., and Naranjo, J.A., in press, Summary of the Holocene eruptive history of the Hudson volcano, in Bitschene & Mendia (Eds.). The 1991 eruption of the Hudson volcano: a thousand days after, Naturalia Patagonica: Universidad Nacional de la Patagonia, Comodoro Rivadavia and Publicacion Series of the Argentianian Geological Survey, Buenos Aires, Argentina.
Information Contacts: Jose Antonio Naranjo, Servicio Nacional de Geologia y Mineria, Avenida Santa Maria 0104, Casilla 1347, Santiago, Chile.
October 2011 earthquakes and eruption with ash, causing evacuation
A large eruption occurred at Cerro Hudson on 8 August 1991 (BGVN 16:07-18:02), which was followed by minor non-eruptive activity that caused sulfurous odors, increased river flows and turbidity, and noise at least through early 1995 (BGVN 20:02). This report describes a minor eruption during 25-26 October 2011. Cerro Hudson is located in Patagonia in the Aysén Region of Chile (figure 1).
|
Figure 8. Map of Chile (a), the Aysén region in red (b), and a detail marking the region's capital, Coyhaique, and Cerro Hudson (c). Original image courtesy of Wikipedia. |
According to the Southern Andes Volcanological Observatory-National Geology and Mining Service (OVDAS-SERNAGEOMIN), seismicity increased during 25-26 October 2011. On 25 October, an M 4.6 volcano-tectonic earthquake occurred at a depth of 19 km, followed by a seismic swarm. More than 100 events, with depths ranging from 15 to 25 km, were recorded through the next day; twelve were M 3, and three were M 4. Most of the earthquakes were volcano-tectonic events with magnitudes below 3.6 and located W of the caldera at depths between 3 and 25 km. The earthquake hypocenters became shallower over time. OVDAS-SERNAGEOMIN did not detect any explosive event or episodes of high intensity harmonic tremor (as reported on 28 October).
During a 24-hour period beginning at 1600 on 27 October, an average of one earthquake per hour was recorded. Most were long-period with magnitudes less than 2.2. On 27 October, an M 3.6 VT earthquake occurred on the SW edge of the crater.
On 26 and 27 October, OVDAS-SERNAGEOMIN and local authorities flew over the caldera and observed three new craters along the SSE edge of the caldera, with approximate diameters of 200, 300, and 500 m. Mostly white plumes rose above the two smaller craters. The largest, southern-most crater emitted a plume with more ash that rose more than 5 km above the crater. Satellite imagery showed a plume drifting 12 km SE. The scientists also observed lahars in the Huemules river, to the W. In response, OVDAS-SERNAGEOMIN raised the Alert Level to 5 (Red), the highest level. According to the Oficina Nacional de Emergencia - Ministerio del Interior (ONEMI), 140 people were evacuated from areas within a 45-km radius of the volcano, defined as a high-risk zone. The hazard lay not only with earthquakes and eruption, but also with the possibility of flooding resulting from to glacier melt.
During another overflight on 28 October scientists observed a gas plume with a very low ash content rising 3-4 km above the craters. Seismicity continued to decrease during 28-29 October. Plumes were observed on 29 October (figure 9). Scientists conducting an overflight noted that one ash plume rose 1 km above the craters and drifted 5-8 km NE. They also confirmed that a large lahar descended the volcano and flowed into the drainage system including the Huemules river during the initial phase of the eruption. During another observation flight on 30 October, scientists saw ash plumes rising 0.8 km from two of the three craters.
|
Figure 9. The three vents at Cerro Hudson observed on 29 October 2011. Dark gray ash can be seen at the base of at least one vent. Courtesy of, and copyrighted by, El Mercurio and SERNAGEOMIN, Chile. |
On 31 October, scientists observed gas plumes rising 0.5 km above the craters and drifting SE. Around 31 October, they also noted subsequent minor explosions and ash emissions. On 1 November, scientists observed an explosion and an accompanying ash plume that rose 1.5 km above the active craters.
On 2 November, OVDAS-SERNAGEOMIN reported that the Alert Level for Cerro Hudson had been lowered to 4 (Yellow), noting that the eruption that began on 26 October had ceased. ONEMI reported that the 140 evacuees were permitted to return home. Analysis of ash deposited on the edge of the crater during the eruption indicated the presence of juvenile basalt. During 1-6 November between 16 and 110 earthquakes per day were recorded, and satellite images showed drifting plumes daily.
According to OVDAS-SERNAGEOMIN, satellite imagery and an area web camera showed no plumes during 7-15 November. Seismic activity decreased significantly, reaching no more than four earthquakes per hour.
The NASA Earth Observatory photographed Cerro Hudson on 17 November 2011 (figure 10) and weeks later (figure 11).
|
Figure 10. Image of Cerro Hudson taken in natural color on 17 November 2011 by the Advanced Land Imager (ALI) on NASA's Earth Observing-1 (EO-1) satellite. The image shows extensive fresh ash on the snowy surface. The apparent vent rests on the image's left-center, at the apex of the darkest funnel-shaped area. Courtesy of NASA Earth Observatory (Image by Jesse Allen; caption by Michon Scott). |
|
Figure 11. This post-eruptive image of Cerro Hudson, taken two weeks after figure 10, shows the volcano covered with snow. The label "apparent vent site" sits directly above the oval shaped vent site, a spot at left located below the gap between the words "apparent" and "vent" (also see previous figure). Courtesy of NASA Earth Observatory. |
Information Contacts: SERNAGEOMIN (Southern Andes Volcanological Observatory-National Geology and Mining Service), Avda Sta María No. 0104, Santiago, Chile (URL: http://www.sernageomin.cl/); NASA Earth Observatory, EOS Project Science Office, NASA Goddard Space Flight Center, Goddard, Maryland, USA (URL: http://earthobservatory.nasa.gov/); Oficina Nacional de Emergencia - Ministerio del Interior (ONEMI), Beaucheff 1637 / 1671, Santiago, Chile (URL: http://www.onemi.cl/); and El Mercurio (URL: http://www.elmercurio.cl/).
|
|
||||||||||||||||||||||||||
There is data available for 15 confirmed Holocene eruptive periods.
2011 Oct 26 - 2011 Nov 1 Confirmed Eruption (Explosive / Effusive) VEI: 2
| Episode 1 | Eruption (Explosive / Effusive) | S and SE edge of the caldera | |||||||||||||||||||||||||||||||||||||||||||||||||||||||||||||||||||||||||||||||
|---|---|---|---|---|---|---|---|---|---|---|---|---|---|---|---|---|---|---|---|---|---|---|---|---|---|---|---|---|---|---|---|---|---|---|---|---|---|---|---|---|---|---|---|---|---|---|---|---|---|---|---|---|---|---|---|---|---|---|---|---|---|---|---|---|---|---|---|---|---|---|---|---|---|---|---|---|---|---|---|---|
| 2011 Oct 26 - 2011 Nov 1 | Evidence from Observations: Reported | |||||||||||||||||||||||||||||||||||||||||||||||||||||||||||||||||||||||||||||||
|
List of 14 Events for Episode 1 at S and SE edge of the caldera
|
||||||||||||||||||||||||||||||||||||||||||||||||||||||||||||||||||||||||||||||||
1991 Aug 8 - 1991 Oct 27 Confirmed Eruption (Explosive / Effusive) VEI: 5
| Episode 1 | Eruption (Explosive / Effusive) | NW caldera rim and SW caldera floor | ||||||||||||||||||||||||||||||||||||||||||||||||||||||||||||||||||||||||||||||||||||
|---|---|---|---|---|---|---|---|---|---|---|---|---|---|---|---|---|---|---|---|---|---|---|---|---|---|---|---|---|---|---|---|---|---|---|---|---|---|---|---|---|---|---|---|---|---|---|---|---|---|---|---|---|---|---|---|---|---|---|---|---|---|---|---|---|---|---|---|---|---|---|---|---|---|---|---|---|---|---|---|---|---|---|---|---|---|
| 1991 Aug 8 - 1991 Oct 27 | Evidence from Observations: Reported | ||||||||||||||||||||||||||||||||||||||||||||||||||||||||||||||||||||||||||||||||||||
|
List of 15 Events for Episode 1 at NW caldera rim and SW caldera floor
|
|||||||||||||||||||||||||||||||||||||||||||||||||||||||||||||||||||||||||||||||||||||
1971 Aug 12 - 1971 Sep 18 (on or after) Confirmed Eruption (Explosive / Effusive) VEI: 3
| Episode 1 | Eruption (Explosive / Effusive) | NW part of caldera, tephra layer T9 | |||||||||||||||||||||||||||||||||||||||||||||||||||||||||||||||||||||
|---|---|---|---|---|---|---|---|---|---|---|---|---|---|---|---|---|---|---|---|---|---|---|---|---|---|---|---|---|---|---|---|---|---|---|---|---|---|---|---|---|---|---|---|---|---|---|---|---|---|---|---|---|---|---|---|---|---|---|---|---|---|---|---|---|---|---|---|---|---|---|
| 1971 Aug 12 - 1971 Sep 18 (on or after) | Evidence from Observations: Reported | |||||||||||||||||||||||||||||||||||||||||||||||||||||||||||||||||||||
|
List of 12 Events for Episode 1 at NW part of caldera, tephra layer T9
|
||||||||||||||||||||||||||||||||||||||||||||||||||||||||||||||||||||||
1891 Confirmed Eruption (Explosive / Effusive)
| Episode 1 | Eruption (Explosive / Effusive) | |||||||||||||||
|---|---|---|---|---|---|---|---|---|---|---|---|---|---|---|---|
| 1891 - Unknown | Evidence from Observations: Reported | ||||||||||||||
|
List of 1 Events for Episode 1
|
|||||||||||||||
1740 ± 150 years Confirmed Eruption (Explosive / Effusive)
| Episode 1 | Eruption (Explosive / Effusive) | Tephra layer T8 | |||||||||||||||||||
|---|---|---|---|---|---|---|---|---|---|---|---|---|---|---|---|---|---|---|---|---|
| 1740 ± 150 years - Unknown | Evidence from Isotopic: 14C (uncalibrated) | |||||||||||||||||||
|
List of 2 Events for Episode 1 at Tephra layer T8
|
||||||||||||||||||||
0860 ± 100 years Confirmed Eruption (Explosive / Effusive)
| Episode 1 | Eruption (Explosive / Effusive) | Tephra layer T7 | |||||||||||||||||||
|---|---|---|---|---|---|---|---|---|---|---|---|---|---|---|---|---|---|---|---|---|
| 0860 ± 100 years - Unknown | Evidence from Isotopic: 14C (uncalibrated) | |||||||||||||||||||
|
List of 2 Events for Episode 1 at Tephra layer T7
|
||||||||||||||||||||
0390 ± 150 years Confirmed Eruption (Explosive / Effusive)
| Episode 1 | Eruption (Explosive / Effusive) | Tephra layer HW7 | |||||||||||||||||||
|---|---|---|---|---|---|---|---|---|---|---|---|---|---|---|---|---|---|---|---|---|
| 0390 ± 150 years - Unknown | Evidence from Isotopic: 14C (calibrated) | |||||||||||||||||||
|
List of 2 Events for Episode 1 at Tephra layer HW7
|
||||||||||||||||||||
0120 BCE ± 200 years Confirmed Eruption (Explosive / Effusive)
| Episode 1 | Eruption (Explosive / Effusive) | Tephra layer T6 | |||||||||||||||||||
|---|---|---|---|---|---|---|---|---|---|---|---|---|---|---|---|---|---|---|---|---|
| 0120 BCE ± 200 years - Unknown | Evidence from Isotopic: 14C (uncalibrated) | |||||||||||||||||||
|
List of 2 Events for Episode 1 at Tephra layer T6
|
||||||||||||||||||||
0790 BCE ± 75 years Confirmed Eruption (Explosive / Effusive)
| Episode 1 | Eruption (Explosive / Effusive) | Tephra layer HW6 | |||||||||||||||||||
|---|---|---|---|---|---|---|---|---|---|---|---|---|---|---|---|---|---|---|---|---|
| 0790 BCE ± 75 years - Unknown | Evidence from Isotopic: 14C (calibrated) | |||||||||||||||||||
|
List of 2 Events for Episode 1 at Tephra layer HW6
|
||||||||||||||||||||
1890 BCE (?) Confirmed Eruption (Explosive / Effusive) VEI: 6
| Episode 1 | Eruption (Explosive / Effusive) | Tephra layer H2/T5 | ||||||||||||||||||||||||
|---|---|---|---|---|---|---|---|---|---|---|---|---|---|---|---|---|---|---|---|---|---|---|---|---|---|
| 1890 BCE (?) - Unknown | Evidence from Isotopic: 14C (calibrated) | ||||||||||||||||||||||||
|
List of 3 Events for Episode 1 at Tephra layer H2/T5
|
|||||||||||||||||||||||||
2250 BCE (in or before) Confirmed Eruption (Explosive / Effusive)
| Episode 1 | Eruption (Explosive / Effusive) | Tephra layer T4 | |||||||||||||||||||
|---|---|---|---|---|---|---|---|---|---|---|---|---|---|---|---|---|---|---|---|---|
| 2250 BCE (in or before) - Unknown | Evidence from Isotopic: 14C (uncalibrated) | |||||||||||||||||||
|
List of 2 Events for Episode 1 at Tephra layer T4
|
||||||||||||||||||||
3890 BCE ± 500 years Confirmed Eruption (Explosive / Effusive)
| Episode 1 | Eruption (Explosive / Effusive) | Tephra layer T3 | |||||||||||||||||||
|---|---|---|---|---|---|---|---|---|---|---|---|---|---|---|---|---|---|---|---|---|
| 3890 BCE ± 500 years - Unknown | Evidence from Isotopic: 14C (uncalibrated) | |||||||||||||||||||
|
List of 2 Events for Episode 1 at Tephra layer T3
|
||||||||||||||||||||
4750 BCE (?) Confirmed Eruption (Explosive / Effusive) VEI: 6
| Episode 1 | Eruption (Explosive / Effusive) | Tephra layer H1/T2 | ||||||||||||||||||||||||||||||||||
|---|---|---|---|---|---|---|---|---|---|---|---|---|---|---|---|---|---|---|---|---|---|---|---|---|---|---|---|---|---|---|---|---|---|---|---|
| 4750 BCE (?) - Unknown | Evidence from Isotopic: 14C (uncalibrated) | ||||||||||||||||||||||||||||||||||
|
List of 5 Events for Episode 1 at Tephra layer H1/T2
|
|||||||||||||||||||||||||||||||||||
4960 BCE ± 150 years Confirmed Eruption (Explosive / Effusive)
| Episode 1 | Eruption (Explosive / Effusive) | Tephra layer T1 | |||||||||||||||||||
|---|---|---|---|---|---|---|---|---|---|---|---|---|---|---|---|---|---|---|---|---|
| 4960 BCE ± 150 years - Unknown | Evidence from Isotopic: 14C (uncalibrated) | |||||||||||||||||||
|
List of 2 Events for Episode 1 at Tephra layer T1
|
||||||||||||||||||||
8010 BCE (?) Confirmed Eruption (Explosive / Effusive)
| Episode 1 | Eruption (Explosive / Effusive) | ||||||||||||||||||||
|---|---|---|---|---|---|---|---|---|---|---|---|---|---|---|---|---|---|---|---|---|
| 8010 BCE (?) - Unknown | Evidence from Isotopic: 14C (uncalibrated) | |||||||||||||||||||
|
List of 2 Events for Episode 1
|
||||||||||||||||||||
This compilation of synonyms and subsidiary features may not be comprehensive. Features are organized into four major categories: Cones, Craters, Domes, and Thermal Features. Synonyms of features appear indented below the primary name. In some cases additional feature type, elevation, or location details are provided.
Synonyms |
||||
| Ventisqueros, Cerro de los | ||||
Cones |
||||
| Feature Name | Feature Type | Elevation | Latitude | Longitude |
| Río Ibáñez | Pyroclastic cone | |||
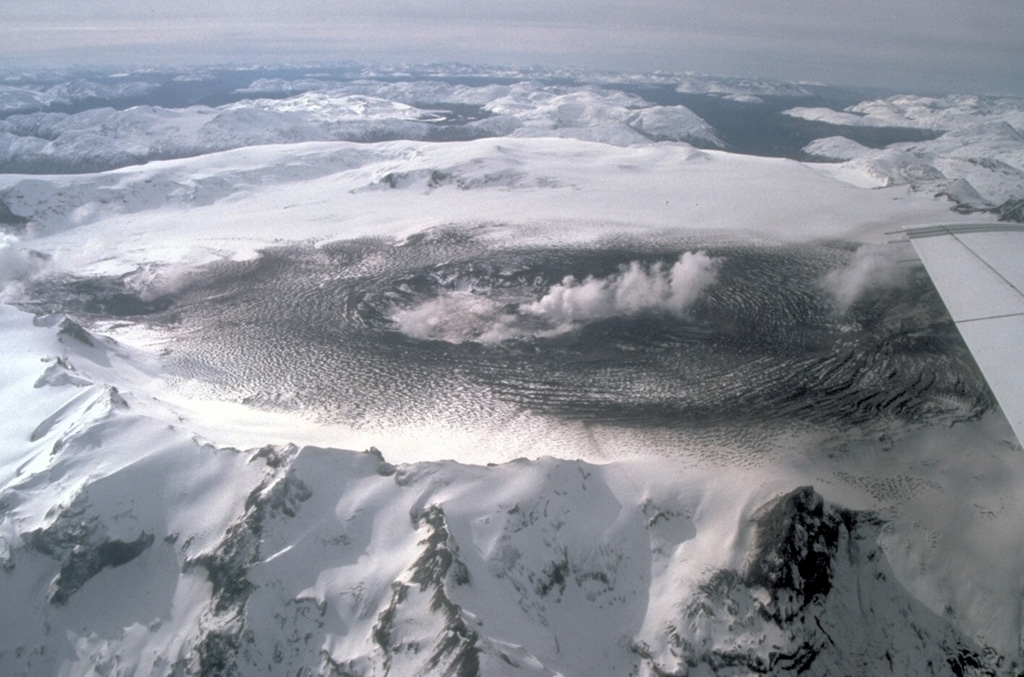
 Ash from the 1991 eruption darkens the glacier filling the caldera of Hudson volcano. This August 23 view from the NE shows steam clouds rising from the margins of a 800-m-wide subglacial crater in the SW part of the caldera that was formed during violent explosive eruptions August 12-15. Ashfall from the eruption spread eastward across Argentina, damaging airport facilities, houses, and agricultural land. The eruption caused major mortality of grazing animals, whose food and water were contaminated by fluorine-rich ashfall.
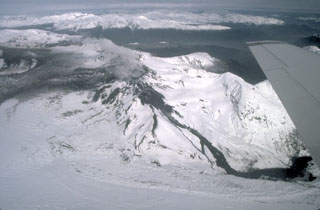 The dark streak descending the NW flank of the caldera of Hudson volcano is a lava flow that was erupted during the initial stages of the 1991 eruption. During the first two days of the eruption, August 8-9, basaltic ash and lava were erupted from a 4.5-km-long fissure on the western caldera rim. The lava flow traveled 4 km down the Huemules glacier. Ash from the August 12-15 paroxysmal eruption, which originated from a subglacial vent whose margin is just visible at the extreme left, darkens the caldera floor in this August 23 photo.
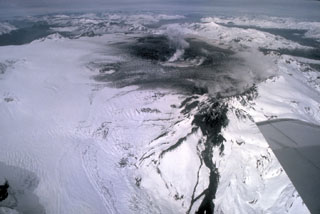 Chile's second largest explosive eruption of the 20th century began on August 8, 1991 from a fissure cutting the western rim of Cerro Hudson caldera. The paroxysmal phase began on August 12 and was sustained for three days, producing ashfall that collapsed roofs near the volcano and fell in the Falkland Islands, 1000 km to the SE. Pyroclastic flows were mostly restricted to the caldera floor. The dark streak at the lower right-center is a lava flow that traveled 4 km down the WNW flank from the west caldera rim fissure.
  The ice-filled 10-km-wide caldera of the remote Cerro Hudson volcano was not recognized until its first 20th-century eruption in 1971. The massive, 1905-m-high Cerro Hudson, seen here from the west on August 23 during its 1991 eruption, covers an area of 300 km2. The caldera is drained through a breach on its NW rim (upper left), which has been the source of mudflows down the Rio de Los Huemules. The 1991 eruption was Chile's second largest of the 20th century, and formed a new 800-m-wide crater in the SW part of the caldera.
 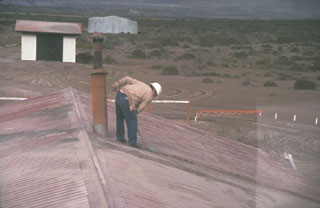 A resident of the Chilean town of Chile Chico, 125 km SE of Hudson volcano near the Argentinian border, sweeps ash from a rooftop on August 23, 1991. One of the world's largest eruptions of the 20th century took place August 12-15, 1991. It produced heavy ashfall across Argentina, damaging airport facilities and collapsing roofs of houses near the volcano. Ash fell as far away as the Falkland Islands, 1000 km to the SE. The fluorine-rich ash caused extensive mortality to grazing animals across Argentina.
The following 8 samples associated with this volcano can be found in the Smithsonian's NMNH Department of Mineral Sciences collections, and may be availble for research (contact the Rock and Ore Collections Manager). Catalog number links will open a window with more information.
| Catalog Number | Sample Description | Lava Source | Collection Date |
|---|---|---|---|
| NMNH 116535-1 | Volcanic Ash | -- | 18 Aug 1991 |
| NMNH 116535-2 | Volcanic Ash | -- | 12 Aug 1991 |
| NMNH 116535-3 | Pumice | -- | -- |
| NMNH 116538-1 | Pumice | -- | -- |
| NMNH 116538-2 | Pumice | -- | -- |
| NMNH 116539-1 | Pumice | -- | -- |
| NMNH 116539-2 | Pumice | -- | -- |
| NMNH 116539-3 | Pumice | -- | -- |
| Copernicus Browser | The Copernicus Browser replaced the Sentinel Hub Playground browser in 2023, to provide access to Earth observation archives from the Copernicus Data Space Ecosystem, the main distribution platform for data from the EU Copernicus missions. |
| MIROVA | Middle InfraRed Observation of Volcanic Activity (MIROVA) is a near real time volcanic hot-spot detection system based on the analysis of MODIS (Moderate Resolution Imaging Spectroradiometer) data. In particular, MIROVA uses the Middle InfraRed Radiation (MIR), measured over target volcanoes, in order to detect, locate and measure the heat radiation sourced from volcanic activity. |
| MODVOLC Thermal Alerts | Using infrared satellite Moderate Resolution Imaging Spectroradiometer (MODIS) data, scientists at the Hawai'i Institute of Geophysics and Planetology, University of Hawai'i, developed an automated system called MODVOLC to map thermal hot-spots in near real time. For each MODIS image, the algorithm automatically scans each 1 km pixel within it to check for high-temperature hot-spots. When one is found the date, time, location, and intensity are recorded. MODIS looks at every square km of the Earth every 48 hours, once during the day and once during the night, and the presence of two MODIS sensors in space allows at least four hot-spot observations every two days. Each day updated global maps are compiled to display the locations of all hot spots detected in the previous 24 hours. There is a drop-down list with volcano names which allow users to 'zoom-in' and examine the distribution of hot-spots at a variety of spatial scales. |
|
WOVOdat
Single Volcano View Temporal Evolution of Unrest Side by Side Volcanoes |
WOVOdat is a database of volcanic unrest; instrumentally and visually recorded changes in seismicity, ground deformation, gas emission, and other parameters from their normal baselines. It is sponsored by the World Organization of Volcano Observatories (WOVO) and presently hosted at the Earth Observatory of Singapore.
GVMID Data on Volcano Monitoring Infrastructure The Global Volcano Monitoring Infrastructure Database GVMID, is aimed at documenting and improving capabilities of volcano monitoring from the ground and space. GVMID should provide a snapshot and baseline view of the techniques and instrumentation that are in place at various volcanoes, which can be use by volcano observatories as reference to setup new monitoring system or improving networks at a specific volcano. These data will allow identification of what monitoring gaps exist, which can be then targeted by remote sensing infrastructure and future instrument deployments. |
| Volcanic Hazard Maps | The IAVCEI Commission on Volcanic Hazards and Risk has a Volcanic Hazard Maps database designed to serve as a resource for hazard mappers (or other interested parties) to explore how common issues in hazard map development have been addressed at different volcanoes, in different countries, for different hazards, and for different intended audiences. In addition to the comprehensive, searchable Volcanic Hazard Maps Database, this website contains information about diversity of volcanic hazard maps, illustrated using examples from the database. This site is for educational purposes related to volcanic hazard maps. Hazard maps found on this website should not be used for emergency purposes. For the most recent, official hazard map for a particular volcano, please seek out the proper institutional authorities on the matter. |
| IRIS seismic stations/networks | Incorporated Research Institutions for Seismology (IRIS) Data Services map showing the location of seismic stations from all available networks (permanent or temporary) within a radius of 0.18° (about 20 km at mid-latitudes) from the given location of Cerro Hudson. Users can customize a variety of filters and options in the left panel. Note that if there are no stations are known the map will default to show the entire world with a "No data matched request" error notice. |
| UNAVCO GPS/GNSS stations | Geodetic Data Services map from UNAVCO showing the location of GPS/GNSS stations from all available networks (permanent or temporary) within a radius of 20 km from the given location of Cerro Hudson. Users can customize the data search based on station or network names, location, and time window. Requires Adobe Flash Player. |
| DECADE Data | The DECADE portal, still in the developmental stage, serves as an example of the proposed interoperability between The Smithsonian Institution's Global Volcanism Program, the Mapping Gas Emissions (MaGa) Database, and the EarthChem Geochemical Portal. The Deep Earth Carbon Degassing (DECADE) initiative seeks to use new and established technologies to determine accurate global fluxes of volcanic CO2 to the atmosphere, but installing CO2 monitoring networks on 20 of the world's 150 most actively degassing volcanoes. The group uses related laboratory-based studies (direct gas sampling and analysis, melt inclusions) to provide new data for direct degassing of deep earth carbon to the atmosphere. |
| Large Eruptions of Cerro Hudson | Information about large Quaternary eruptions (VEI >= 4) is cataloged in the Large Magnitude Explosive Volcanic Eruptions (LaMEVE) database of the Volcano Global Risk Identification and Analysis Project (VOGRIPA). |
| EarthChem | EarthChem develops and maintains databases, software, and services that support the preservation, discovery, access and analysis of geochemical data, and facilitate their integration with the broad array of other available earth science parameters. EarthChem is operated by a joint team of disciplinary scientists, data scientists, data managers and information technology developers who are part of the NSF-funded data facility Integrated Earth Data Applications (IEDA). IEDA is a collaborative effort of EarthChem and the Marine Geoscience Data System (MGDS). |

