Report on Witori (Papua New Guinea) — March 2003
Bulletin of the Global Volcanism Network, vol. 28, no. 3 (March 2003)
Managing Editor: Edward Venzke.
Witori (Papua New Guinea) Lava flows from NW-most vent continue through February
Please cite this report as:
Global Volcanism Program, 2003. Report on Witori (Papua New Guinea) (Venzke, E., ed.). Bulletin of the Global Volcanism Network, 28:3. Smithsonian Institution. https://doi.org/10.5479/si.GVP.BGVN200303-252080
Witori
Papua New Guinea
5.5745°S, 150.5161°E; summit elev. 724 m
All times are local (unless otherwise noted)
The eruption that began in August 2002 continued during early 2003 with lava effusion through at least 28 February and vapor emissions. The following is from the Rabaul Volcano Observatory.
Activity during January 2003. No field or aerial observations of the caldera or lava flow were made in January. However, blue vapor was observed throughout January from the NW-most lava-producing vent and other vents along the NW-SE-trending fissure system, suggesting that hot lava was near the surface and presumably still flowing. Besides the blue vapor emissions, variable amounts of white vapor were released. Evidence of dead and dried vegetation downwind of the fissure system indicated that hazardous gases, such as sulfur dioxide, were present in the vapor emissions. The dead vegetation is restricted to an area extending 1-2 km to the S (downwind). This is unlike similar vegetation effects during the SE-wind season, which extended as far as 10 km to the NW from the source of the vapor emissions. Occasional low roaring noises were heard on 9, 21, 22, 25, and 26 January.
Seismic activity was relatively steady with no significant deviation from the background levels determined since the permanent seismic network was established in early October 2002. Earthquakes consisted mainly of volcano-tectonic (VT) events averaging 45 per day, with a low of 18 (recorded on the 20th) and a high of 71 (on the 4th). The events occurred randomly over each day. Low-frequency earthquakes were recorded on some days; a maximum of six events was recorded on the 18th.
Airlink began to use Hoskins airport in the latter half of January after winds began to blow away from the airport. Furthermore, the absence of ash emissions since August and early September 2002 made conditions favorable. The decision to re-use the airport followed information provided by RVO to the Papua New Guinea Civil Aviation Authority and aviation industry.
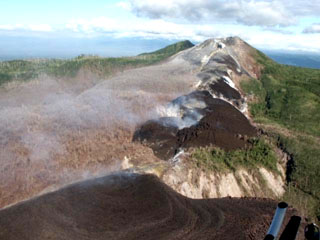
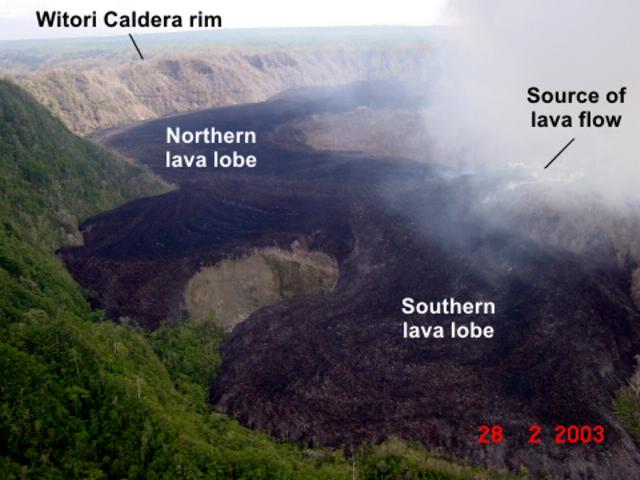
Activity during February 2003. An aerial inspection on 28 February showed that lava effusion continued from the NW-most vent of the fissure system (figure 19). The lava flow had two lobes. The main lobe was directed initially to the N but later curved to a northeasterly direction, dictated by topographic features of the Witori caldera floor. On 28 February it appeared that horizontal lateral flow of this lobe had stopped after it reached a topographic barrier. As a result, the lava flow began to gain height along its entire northern portion. The height of the flow was estimated to be ~25-33% of the height of the ~240-m-high Witori Caldera wall. The second lobe of the lava flow, which flowed to the S, showed slow progress. Between October 2002 and February 2003 it advanced only a few hundred meters. The thickness of this flow was ~30-40 m. As of 28 February the total volume of erupted lava from this single vent was estimated to be ~0.09-0.12 km3.
Emissions of minor to moderate volumes of white vapor continued from all vents along the fissure system. The lower vents to the NW released more vapor than the upper ones to the SE. Small amounts of blue vapor were released from the lava-producing vent. Because the vapor emissions were blown S and SE, vegetation within 2 km downwind turned brown. No ash emissions were produced during the month. Low jet-roaring noises were heard on 4, 9-11, 13, and 21 February. Hoskins airport continued to be used by Airlink in February.
Seismic activity was low during the month. Earthquakes were mainly volcano-tectonic. The daily count was ~30 compared to 45 in January. Most of the earthquakes were very small ones, but moderate-sized events were recorded on 1 (2 events), 10 (2), 12 (1), and 18 February (6). The six earthquakes on the 18th were recorded within a time span of 1.5 hours. A handful of low-frequency earthquakes were also recorded on the 6th (2), 10th (1) and 11th (1).
Activity during March 2003. No field or aerial observations of the lava flow were made in March, so it is uncertain whether lava effusion from the NW-most vent continued. The upper vents continued to release weak emissions of thin white vapor. The lower vents released weak to moderate emissions of white vapor and bluish vapor emissions on 13, 18, 23, and 28-30 March, indicative of hot material. Low roaring noises heard on 13, 16, 18, 23, and 29 March did not accompany explosive activity. No seismic recordings were made in March.
Geological Summary. The active Pago cone has grown within the Witori caldera (5.5 x 7.5 km) on the northern coast of central New Britain contains the active Pago cone. The gently sloping outer caldera flanks consist primarily of dacitic pyroclastic-flow and airfall deposits produced during a series of five major explosive eruptions from about 5,600 to 1,200 years ago, many of which may have been associated with caldera formation. Pago cone may have formed less than 350 years ago; it has grown to a height above the caldera rim, and a series of ten dacitic lava flows from it covers much of the caldera floor. The youngest of these was erupted during 2002-2003 from vents extending from the summit nearly to the NW caldera wall. The Buru caldera cuts the SW flank.
Information Contacts: Ima Itikarai, Rabaul Volcano Observatory (RVO), P.O. Box 386, Rabaul, Papua New Guinea.


