
Based on analyses of satellite imagery, the Darwin VAAC reported that on 11 July an ash plume from Pago rose to an altitude of 4.3 km (14,000 ft) a.s.l. and drifted over 275 km SW.
Source: Darwin Volcanic Ash Advisory Centre (VAAC)
Explosive ash plumes reported in May-July 2012
Based on analyses of satellite images as reported by the Global Disaster Alert and Coordination System (GDACS) and the Darwin Volcanic Ash Advisory Centre (VAAC), five volcano plume advisories were issued for Pago volcano in the Summer of 2012 (table 1).
Table 1.Five VAAC volcano ash advisories were issued for Pago volcano for the period May-July 2012. Darwin VAAC Aviation Alert Colors range in four steps from green to yellow to orange to red - lowest to highest alert. Courtesy of Darwin VAAC and GDACS.
| Date – Time, 2012, UTC | VAAC Aviation Alert Color | Other Observations |
| 3 May – 0530 | Red | high level eruption to 12.2 km |
| 3 May – 0600 | Red | high level eruption to 13.7 km extending 74 km to NE |
| 3 May – 0715 | Orange | ash/steam plume to 13.7 km extending 74 km to NE |
| 10 Jul – 1630 | Orange | ash plume to 4.3 km extending 280 km SW |
| 10 Jul – 2203 | Orange | ash plume to 4.3 km extending 185 km SW |
According to the Papua New Guinea (PNG) National Disaster Centre (2013), PNG has 16 active and at least 28 potentially active or 'dormant' volcanoes which are a potential danger to the lives of about a quarter of a million people living in a total area of 16, 000 km2. Of the 16 active volcanoes, 6 of them are classified as high-risk volcanoes - high-risk in the sense that they have had explosive eruptions in the past and have the potential of repeating these eruptions in future. Of these 6 high-risk volcanoes, 3 are in New Britain - Rabaul in East New Britain, and Ulawun and Pago in West New Britain (for locations, see figure 3, BGVN 32:04, on Sulu Range volcano).
Figure 20 shows a satellite photo of approximately 8-km diameter Witori caldera from Google Earth. The walls of the caldera appear on the N and NW side of the caldera. A series of lava flows have formed the lobate character of the floor of the caldera. More detail on the lava flows appear in a previous report on Pago (figure 3, BGVN 27:08 - a vertical photo, with the old caldera rim delineated in white, distribution of new lava flows from August 2002 shown in red, compared with the previous lava flows from the 1911-18 eruption shown in light blue; a fault perpendicular to the 2002 lava flow is shown in dark blue).
 |
Figure 20. Satellite photo of Witori caldera within which Pago volcano exists. Courtesy of Google Earth. |
References. Volcano Research Center, 2002 (4 September), Pago volcano, New Britain, Papua, New Guinea: Brief report and Photographs Aug. 26-September 2, 2002; URL:http://hakone.eri.u-tokyo.ac.jp.
Papua New Guinea (PNG) National Disaster Centre (NDC), 2013 (28 July), Volcanic eruption, PGN NDC (URL:http://www.pngndc.gov.pg/).
Information Contacts: Ima Itikarai and Herman Patia, Rabaul Volcano Observatory (RVO), P.O. Box 386, Rabaul, Papua New Guinea; Darwin Volcanic Ash Advisory Centre (VAAC), Bureau of Meteorology, Northern Territory Regional Office, PO Box 40050, Casuarina, NT 0811, Australia (URL: http://www.bom.gov.au/info/vaac/); Global Disaster Alert and Coordination System (GDACS), United Nations and the European Commission (URL: http://www.gdacs.org/Volcanoes); Volcano Research Center, Earthquake Research Institute, University of Tokyo, 113-0032 1-1-1, Yayoi, Bunkyo-ku, Tokyo (URL: http://hakone.eri.u-tokyo.ac.jp); and Papua New Guinea (PNG) National Disaster Centre (URL: http://www.pngndc.gov.pg/).
2012: May
| July
2007: August
2005: August
2004: April
2003: March
| May
| August
2002: July
| August
| September
| October
| November
| December
Based on analyses of satellite imagery, the Darwin VAAC reported that on 11 July an ash plume from Pago rose to an altitude of 4.3 km (14,000 ft) a.s.l. and drifted over 275 km SW.
Source: Darwin Volcanic Ash Advisory Centre (VAAC)
Based on analyses of satellite imagery, the Darwin VAAC reported that ash-and-steam plumes from Pago rose to an altitude of 13.7 km (45,000 ft) a.s.l. and drifted 75 km NE on 3 May.
Source: Darwin Volcanic Ash Advisory Centre (VAAC)
Based on a report from Kimbe Vulcanological Observatory (KVO), RVO reported that people from villages near Pago heard a single booming noise and saw an increase in white vapor emission on 27 August. Seismicity increased during 27-28 August. The second crater of the upper vents ejected lava fragments on 28 August. White vapor emitted from the same crater was seen during an inspection of the area on 29 August.
Source: Rabaul Volcano Observatory (RVO)
Pago was quiet during 15-21 August, with only steam emissions occurring from the upper vents of the fissure system. Seismicity was at low levels.
Source: Rabaul Volcano Observatory (RVO) via the Darwin Volcanic Ash Advisory Center
During 15 March to 1 April, volcanic and seismic activity at Pago remained at low levels. All vents gently released small volumes of "thin white vapor." On some days, small amounts of "blue vapor" were emitted from the lower vents. A dull glow was observed at the volcano on 17 March.
Source: Rabaul Volcano Observatory (RVO)
During 25 June to 14 August, volcanic and seismic activity remained at low levels at Pago. Small amounts of "fume" were released from the lower vents, with only trace amounts of SO2emissions in early August. A local tectonic earthquake on 9 August led to an increase in energy release and number of earthquakes recorded at one seismic station.
Source: Rabaul Volcano Observatory (RVO)
An aerial inspection of Pago's summit area on 22 May revealed that lava effusion from the northwestern-most vent had ceased following the last aerial inspection in February 2003. Also, there were no indications of fresh lava near the vents. This observation was confirmed by the lack of further movement of the northerly and southerly lobes of lava. Furthermore, there was no change in the height of the lava body against the caldera wall. Scientists also saw that a new fumarole area had formed between Mt. Pago and the Pyramid to the east. Significant inflation had been measured since December 2002, but it may be related to roadwork in the area causing benchmarks to move.
Source: Rabaul Volcano Observatory (RVO)
An aerial inspection of Pago's Witori caldera on 28 February revealed that lava continued to flow from the northwestern-most vent as it had in January. Lateral flow of the N lava lobe had slowed since it was last observed, but there was thickening of the lava deposit along the entire body of the flow. The S lava lobe progressed farther S, but at a very slow rate. All lava was contained inside the floor of Witori caldera. Scientists found that vegetation had died on the S side of the volcano due to volcanic gases blowing to the S, rather than from increased volcanic heat. Vapor continued to be emitted from all vents along the fissure system, and in smaller amounts from the main summit crater. Seismicity continued at low levels, with a decline in the number of earthquakes during the previous 2 weeks. Seismic and GPS data from the remote field site were no longer available as of 27 February due to the theft of four solar panels.
Source: Rabaul Volcano Observatory (RVO) via the Darwin Volcanic Ash Advisory Center
As of 2 January lava continued to flow from Pago's northwestern-most vent. In addition, variable amounts of white vapor were released from most vents along the fissure system. Weak incandescence was visible on the night of 28 December. Seismicity continued at low levels as it has since early October 2002 when the seismic network was installed. No significant ground deformation had been recorded in a month, in contrast to the period between the start of the eruption (early August) and early November when complex and significant movement was recorded.
Source: Rabaul Volcano Observatory (RVO) via the Darwin Volcanic Ash Advisory Center
An aerial inspection of Pago on 10 December confirmed that lava continued to slowly flow from the volcano. The lava flow remained confined by the walls of Witori caldera. Variable amounts of steam was emitted from vents. Blue vapor, which was inferred to be juvenile volcanic gas, was emitted from the northwestern-most vent. Seismicity continued to be at background levels, and consisted of small volcano-tectonic earthquakes.
Source: Rabaul Volcano Observatory (RVO) via the Darwin Volcanic Ash Advisory Center
RVO reported that Pago continued to erupt through 2 December. Slow lava effusion from the northwestern-most vent continued, with the lava flow still contained within the Witori Caldera floor. Variable amounts of white vapor continued to be released from the vents. The northwestern-most vent released bluish vapor, indicating and/or confirming continuing lava effusion. Seismicity, consisting of small volcanotectonic earthquakes, remained at normal background levels. RVO stated that results from data analysis did not indicate a major increase in eruptive activity.
Source: Rabaul Volcano Observatory (RVO) via the Darwin Volcanic Ash Advisory Center
Volcanic activity continued at Pago and residents in relatively low-risk areas near the volcano were told it was safe to return to their homes according to a news article. The eruption of Pago began in August, leading to the evacuation of 12,000-15,000 residents.
Source: Asia Pacific
On 3 November at 0620 a pilot saw a low-level ash plume rise above Pago. A narrow plume was visible on satellite imagery.
Source: Darwin Volcanic Ash Advisory Centre (VAAC)
Volcanic activity continued at Pago during 9-15 October. According to a news article, scientists found that inflation continued at the volcano, with ~1 cm of uplift occurring in a month. By 10 October, approximately 15,000 residents near the volcano had been evacuated since volcanic activity commenced in August.
Sources: ABC News - Australian Broadcasting Corporation; Associated Press
As of 30 September seismicity remained at low levels at Pago and lava continued to flow from the northeastern-most vent of the fissure system. A significant lava field had developed, with all lava flows contained within the caldera. Incandescence was visible at the lava-flow front.
Sources: US Geological Survey; The National
According to a news article, an explosive event occurred at Pago during 7-8 September. The Darwin VAAC reported that on 7 September at 0656 a low-level (~1.5 km a.s.l.) ash-and-steam plume was visible on satellite imagery drifting NW.
Sources: The National; Darwin Volcanic Ash Advisory Centre (VAAC)
The Japanese Disaster Relief Team that visited Pago during 25 August to 3 September found that lava had erupted from four of the five craters NW of the Pago Central cone that are aligned NW-SE. The largest quantity of lava was emitted from the lowest cone; lava from the cone flowed NE and then was directed SE after reaching the crater wall. Two faults were visible; one was parallel to the crater line, and the other was perpendicular to it. No eruption column was observed, only blue-white fumarolic gas was emitted. The thickest ash deposits were 2 mm thick 3 km N of the craters, and less than 1 mm thick at Hoskins airport.
Source: Volcano Research Center-Earthquake Research Institute (University of Tokyo)
On 21 August several news articles reported that surface deformation had been recorded at Pago by Rabaul Volcano Observatory (RVO) staff. They also reported that Ima Itikarai, an RVO seismologist, stated that "Lava is flowing from one of the small vents that was formed, but the lava is still contained within the corridor, so it's not a threat." The natural corridor is reportedly 30 m high. Due to the volcanism that has been occurring for three weeks, emergency officials discussed re-settling the 8,000 displaced residents near Pago.
Sources: Reuters; Associated Press; Australian Associated Press
The Darwin VAAC reported that at Pago on 14 August around 1030 a very thin, low-level ash plume was visible on satellite imagery. The plume extended N to NNW and was probably below ~2.1 km a.s.l. On the 16th, intermittent eruptions with low ash content produced low-level plumes. The Rabaul Volcano Observatory reported that the low level of activity was expected to continue.
Source: Darwin Volcanic Ash Advisory Centre (VAAC)
The eruption at Pago that began the previous week continued through 13 August. According to news articles, 6,000-8,000 people had been evacuated from villages surrounding the volcano by 9 August. No injuries had been reported. The Rabaul Volcano Observatory (RVO) reported that the eruption was characterized by the ejection of light gray to some dark ash clouds. The clouds drifted primarily to the N and NW, after reaching heights of a few kilometers above the summit. Very little ash was deposited in areas surrounding the volcano. The thickest ashfall (3 mm) occurred at Rikau and Matmada, 6-8 km NNW of the volcano. There was not more than 1 mm of ash deposited at Hoskins airport. Aerial inspection of the summit area by RVO staff indicated that there were no lava flows descending the volcano's flanks, instead, lava extruded onto the surface formed cones above the active vents. The highest cone was about 60 m tall. Contrary to previous reports, there was no bulging on the N or NW sides of the volcano. During the week, seismicity was at low-to-moderate levels. The closure of the airport near the town of Kimbe, 30 miles N of Pago, disrupted island air traffic. On 13 August at 1030 a thin plume was visible on satellite imagery reaching a height of about 2.1 km and extending N to NW. The summit was covered by meteorological clouds, preventing visual observations. Only weak intermittent rumbling was heard. RVO advised that activity had settled into a steady pattern, although changes in the nature of the eruption could occur.
Sources: Darwin Volcanic Ash Advisory Centre (VAAC); Reuters; Associated Press; Rabaul Volcano Observatory (RVO)
Qantas Airlines reported that a rapidly increasing ash cloud was visible at 9.1 km a.s.l. on 3 August at 1440. The summit was obscured by clouds, so ash was not identifiable from satellite imagery. On 5 August at 0705 Air Niugini reported another ash cloud that was 18 km wide at 1.2 km a.s.l. extending 37 km NW. According to press reports, this plume was from an eruption that began on 5 August around 0530. By 0600, residents in Hoskins and Kimbe towns realized there had been an eruption when they saw thick clouds of ash drifting W across Kimbe Bay. Another eruption occurred about midday, raining ash on Hoskins. An estimated 10,000 to 15,000 people in villages at the foot of the volcano and surrounding areas could be affected by ashfall. Earthquakes were felt before the eruption.
Air Niugini reported that on 6 August at 0630 a 1.8- to 2.4-km-thick gray ash plume extended 148 km WNW at 7.6 km a.s.l. The Rabaul Volcano Observatory noted that at 0830 the ash column had reached 10 km above the volcano. A low-level ash plume identified on GMS visible satellite imagery at 0932 extended 111 km WNW with a width of 18 km. By 1132 the ash plume was 37 km wide based on visible satellite imagery. The Rabaul Volcano Observatory reported that eruptions were continuing on 6 August at 1800 with the ash plume moving NNW to N.
Sources: Papua New Guinea Post-Courier Online; Darwin Volcanic Ash Advisory Centre (VAAC)
Reports are organized chronologically and indexed below by Month/Year (Publication Volume:Number), and include a one-line summary. Click on the index link or scroll down to read the reports.
Mild summit and flank fumarolic activity
"Emissions from the summit crater were very weak during an overflight in early September. Mild fumarolic emissions were noted from the NW flank of Pago."
Information Contacts: C. McKee and I. Itikarai, RVO.
Early August ash eruptions; > 6,000 people evacuated; new lava cones
A new eruption began at Pago on 3 August 2002. Although there were three eruptions from Pago in the 20th century (1911, 1920 ± 2 years, and 1933), fumarolic emissions were last reported during September 1990. At 1440 on 3 August 2002, Qantas Airlines reported a rapidly rising ash cloud at 9.1 km altitude. The summit was obscured by clouds, and ash was not identifiable from satellite data. At 0705 on 5 August Air Niugini reported another ash cloud that was 18 km wide at 1.2 km altitude extending 37 km NW. This plume was from an eruption that began, according to press reports, around 0530 on 5 August. By 0600, residents in Hoskins and Kimbe towns realized there had been a volcanic eruption when they saw thick clouds of ash drifting W across Kimbe Bay. Another eruption occurred about midday, depositing ash on Hoskins. Earthquakes were felt before the eruption.
Air Niugini reported that at 0630 on 6 August a 1.8- to 2.4-km-thick gray ash plume extended 148 km WNW at 7.6 km altitude. The Rabaul Volcano Observatory (RVO) noted that at 0830 the ash column had reached 10 km above the volcano. A low-level ash plume identified on GMS visible satellite imagery at 0932 extended 111 km WNW with a width of 18 km. By 1132 the ash plume was 37 km wide based on visible satellite imagery. The RVO reported that eruptions were continuing at 1800 on 6 August with the ash plume moving NNW to N.
According to news articles, 6,000-8,000 people had been evacuated from villages surrounding the volcano by 9 August. No injuries had been reported. RVO reported that the eruption was characterized by the ejection of light gray to dark ash clouds. The clouds drifted primarily N and NW, after reaching heights of a few kilometers above the summit. Very little ash was deposited in areas surrounding the volcano. The thickest ashfall (3 mm) occurred at Rikau and Matmada, 6-8 km NNW of the volcano (figure 1). There was not more than 1 mm of ash deposited at Hoskins airport. Aerial inspection of the summit area by RVO staff indicated that there were no lava flows descending the volcano's flanks. Instead, lava extruded onto the surface formed cones above the active vents. The highest cone was about 60 m tall. Contrary to previous reports, there was no bulging on the N or NW sides of the volcano. Seismicity was at low-to-moderate levels. The closure of the airport near the town of Kimbe, ~48 km N of Pago, disrupted island air traffic.
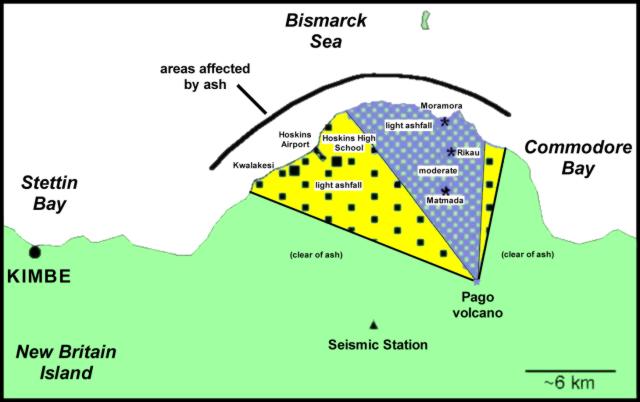 |
Figure 1. Ashfall from Pago during the August 2002 eruption. The distribution was heaviest towards the NNW (cross-hatched pattern), lighter towards the W (squares pattern). Courtesy RVO. |
On 13 August at 1030 a thin plume was visible on satellite imagery to a height of ~2.1 km and extending N to NW. The summit was cloud-covered, preventing visual observations. Only weak intermittent rumbling was heard.
Information Contacts: Ima Itikarai, Rabaul Volcano Observatory (RVO), PO Box 386, Rabaul, E.N.B.P., Papua New Guinea; Darwin Volcanic Ash Advisory Center (VAAC), Bureau of Meteorology, Northern Territory Regional Office, PO Box 40050, Casuarina, NT 0811, Australia (URL: http://www.bom.gov.au/info/vaac/); Reuters; Associated Press.
Eruption that began on 3 August 2002 continues through at least mid-September
The eruption that began at Pago on 3 August 2002 (BGVN 27:07) continued through at least mid-September. The Darwin VAAC reported that on 14 August around 1030 a very thin, low-level ash plume was visible on satellite imagery. The plume extended N to NNW from Pago and was probably below ~2.1 km altitude. On 16 August, intermittent eruptions with low ash content produced low-level plumes.
The United Nations Office for the Coordination of Humanitarian Affairs (OCHA) reported on 16 August that small earthquakes and tremors had occurred in early July and as of 5 August the volcano was ejecting thick dark gray ash and sulfurous fumes. The Rabaul Volcanological Observatory (RVO) reported that five vents on the NW flank were active and releasing short lava flows in the crater. RVO indicated that the eruptions were of small magnitude, but the situation could deteriorate rapidly. More than 10,000 people were evacuated from villages surrounding Pago to the provincial capital of Kimbe, 50 km N of the volcano. Airports in Kimbe and in nearby Hoskins were closed due to ashfall. OCHA reported that, should the eruption continue, local crops could be severely damaged by ash.
On 21 August several news articles reported that surface deformation had been recorded at Pago by RVO staff. They also reported that Ima Itikarai, a RVO seismologist, stated that lava appeared to be topographically constrained within the Witori caldera.
MODIS imagery on 22 August showed a NNW-trending plume coming from Pago. An image that day disclosed a narrow, cigar-shaped plume conspicuous for ~20 km, becoming broken and extending for perhaps another ~20 km.
A Japanese Disaster Relief Team visited Pago during 25 August-3 September and provided a brief initial report and sensational photos of the scene there (figures 2 and 3), showing abundant lava emitted from a series of vents. Figures 2 and 3 show the NW-SE alignment of vents extending radially NW from the central vent. The Team found that lava had erupted from four of the five emission points NW of the central vent.
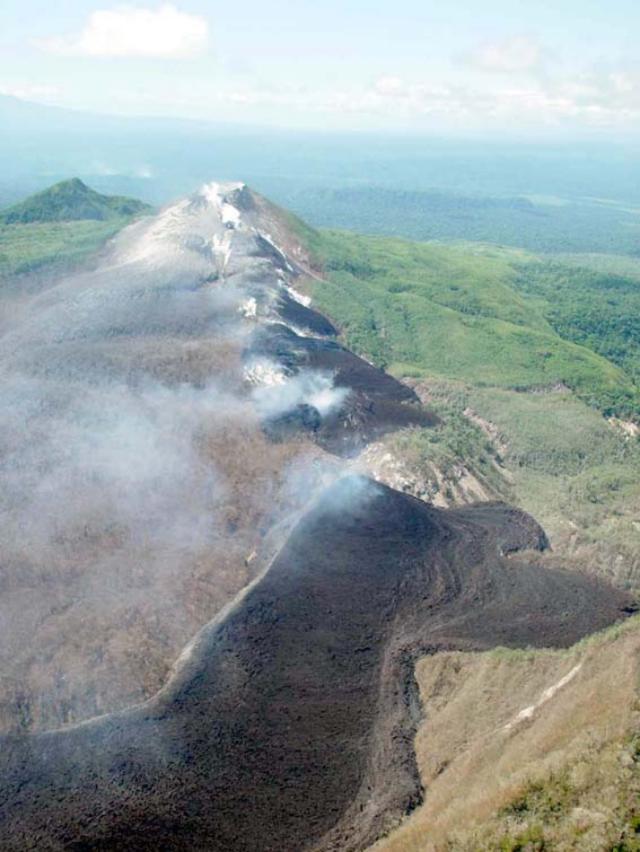 |
Figure 2. NW view showing the chain of vents and the new lava flows at Pago taken during the 28-29 August 2002 visit of the Japanese Disaster Relief Team. Courtesy Mitsuhiro Yoshimoto, VRC-ERI. |
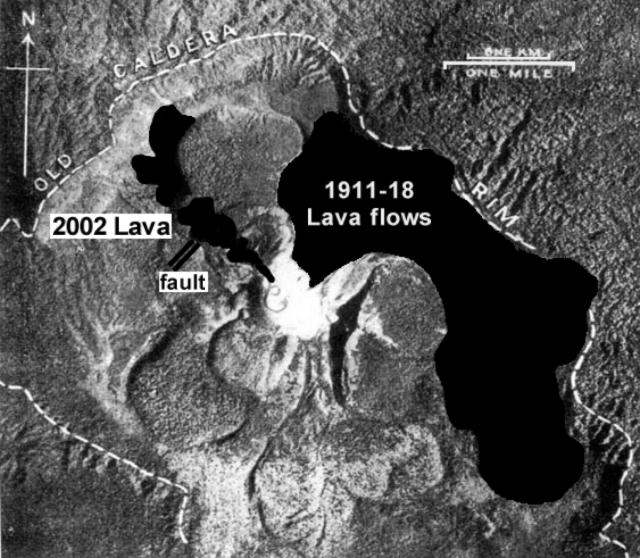 |
Figure 3. Vertical photo showing distribution of new lava flows from August 2002, compared with the previous lava flows from the 1911-18 eruption. Courtesy Mitsuhiro Yoshimoto, VRC-ERI. |
The Team noted that the largest quantity of lava was emitted from the outermost and lowest vent. Lava discharged there flowed hundreds of meters NNW, and then, after it encountered the Witori caldera's wall, it began advancing NE and SW. Lava flowing NE was constrained by both the caldera's wall and an older, large, sub-circular flow on its E side (figure 3). Lava-flow composition and other details will be discussed in future reports.
Two faults were visible; one was parallel to the line of craters, and the other was perpendicular to it (figure 3). No eruption column was observed, only blue-white fumarolic gas was emitted. The thickest ash deposits the Team saw were 2 mm thick 3 km N of the craters, and less than 1 mm thick at Hoskins airport.
A satellite image on 6 September 2002 showed a NW-trending plume from Pago (figure 4). The Darwin VAAC reported that on 7 September at 0656 a low-level (~1.5 km altitude) ash-and-steam plume was visible on satellite imagery drifting NW. A news article reported that an explosive event occurred at Pago during 7-8 September. Another news article reported that monitoring equipment coming from the US and Japan would serve to monitor volcanoes in the region, including Pago.
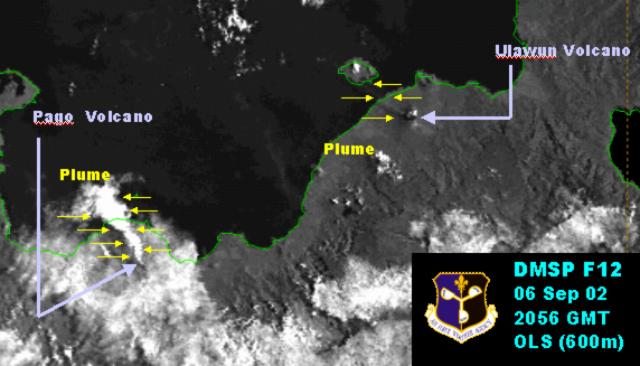 |
Figure 4. Satellite imagery taken on 6 September 2002 at 2056 (UTC) shows a NW-trending plume from Pago. The plume is conspicuous for 30-40 km, dispersing over Kimbe Bay and the Bismark Sea. A smaller and less distinct plume can be seen coming from Ulawun to the ENE. Courtesy US Air Force Weather Agency. |
Information Contacts: Ima Itikarai, Rabaul Volcano Observatory (RVO), PO Box 386, Rabaul, E.N.B.P., Papua New Guinea; Japanese Disaster Relief Team, including these three members: (a)Kohichi Uhira, Volcanological Division, Seismological and Volcanological Department, Japan Meteorological Agency, 1-3-4 Ote-machi, Chiyoda-ku, Tokyo 100-8122 Japan, (b)Akimitsu Takagi, Meteorological Research Institute of Japan Meteorological Agency, 1-1 Nagamine, Tsukuba, Ibaraki 305-0052 Japan, and (c)Mitsuhiro Yoshimoto, Volcano Research Center (VRC), Earthquake Research Institute (ERI), University of Tokyo, 113-0032 1-1-1, Yayoi, Bunkyo-ku, Tokyo (URL: http://www.eri.u-tokyo.ac.jp/VRC/index_E.html); Darwin Volcanic Ash Advisory Center (VAAC), Bureau of Meteorology, Northern Territory Regional Office, PO Box 40050, Casuarina, NT 0811, Australia (URL: http://www.bom.gov.au/info/vaac/); United Nations Office for the Coordination of Humanitarian Affairs (OCHA), United Nations, New York, NY 10017 USA (URL: http://www. reliefweb.int); Charles Holliday, Air Force Weather Agency (AFWA), Satellite Applications Branch, Offutt AFB, NE 68113-4039; Reuters; Associated Press; Australian Associated Press; Papua New Guinea Post Courier; The National.
Continued lava flows and deformation; monitoring network installed
The eruption that began at Pago on 3 August with significant ash plumes (BGVN 27:07) had produced lava flows from multiple vents NW of the main crater by early September (BGVN 27:08). This report provides additional details of fieldwork by the Japanese Disaster Relief Team noted in the last issue. Varied information from a United Nations report on 27 September has been distributed into appropriate sections below.
Observations of recent activity. The United Nations reported on 27 September that the volcano continued to emit steam and a thin vapor plume from vents near the summit and that the plume drifted to the NW over the Hoskins Peninsula. Lava continued to flow into the wider Witori Caldera basin, but was contained by its wall. Low-level seismicity and slow ground deformation along the W part of the caldera floor also continued. Monitoring about 3 km SW of the summit has shown a slight uplift.
While enroute from Kavieng to Port Moresby, Dave Innes (acting First Officer of an Air Niugini Fokker F-28, Captain Alex Porter in command) photographed Pago around 1230 on 14 September from an altitude of about 8.5 km (28,000 feet) while the volcano was quiet (figure 5). Later in the month Innes noted that the volcano had been putting out little more than "smoke," but on the 30th he and Captain Seymour (another Air Niugini F-28 commander) put in an "ash-sighting chit" when they saw that it was fairly active. He reports that the "smoke" stayed over the whole center section of the N coast of New Britain through to the following day (1 October).
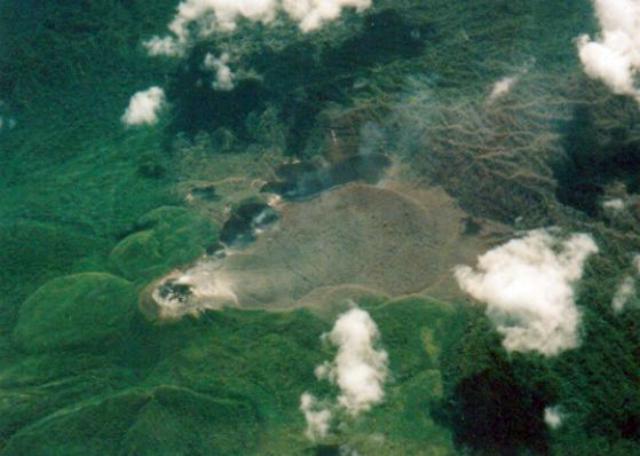 |
Figure 5. Aerial photograph of Pago around 1230 on 14 September 2002. Dark lava flows can be seen extending NNW from the crater towards the upper center of the view. The lighter-colored fan-shaped area in the center (N of the crater) is most likely ash-covered vegetation; previous ash plumes blew in that direction. Courtesy of David Innes, Air Niugini. |
The "ash-sighting chit" noted by Innes is an internal Air Niugini Volcanic Volcanic Activity Report. This is a company variation of the ICAO VAR (section one) which is separate from the formal reporting process. Crews transitting known hot-spots fill out the form, rip off the white copy (which looks like a receipt or "chit" ), and put it in a box at crewing in Port Moresby. Pilots arriving to commence flights can then see what their colleagues had seen the last time someone passed that way.
Volcano monitoring. As noted in the UN report, the assistance of technical teams from Japan and the United States was achieved through the efforts of the Rabaul Volcanological Observatory from East New Britain, which is overseeing scientific efforts. The government of Papua New Guinea (PNG) has set up a Kimbe Volcanological Observatory to coordinate the scientific work on Pago, and ultimately to monitor and evaluate the threat posed by West New Britain's three other active volcanoes.
Installing a volcanic monitoring system on Pago had been long-planned as part of a cooperative program between the U.S. Geological Survey's Volcano Disaster Assistance Program (VDAP), with funding from the Office of Foreign Disaster Assistance, and Geoscience Australia to provide assistance to PNG. However, the current eruption accelerated those plans. On 5 September, at the invitation of the PNG government a 3-person team from VDAP departed the United States with equipment for a telemetered monitoring network consisting of five seismometers (one 3-component instrument) and three real-time GPS stations. The network was installed with the assistance of personnel from the Rabaul Volcano Observatory, and the VDAP team returned on 13 October after the network was operational and sending telemetered data to the observatory in Kimbe.
Civil Defence. The following information is from a situation report issued by the United Nations Office for the Coordination of Humanitarian Affairs (OCHA) on 27 September. This report was based on information provided by OCHA's Regional Disaster Response Adviser in Kimbe, working alongside the PNG National Disaster Management Office (NDMO) and the AusAID team that is supporting the West New Britain Provincial Disaster Committee.
Of the 15,000 inhabitants of the affected part of the Hoskins Peninsula, the region close to the crater and in the arc to the NW, ~13,000 have been evacuated since early August; the remainder are still living in their villages, looking after property, and engaged in limited cultivation.
Although only a few millimeters of ash has fallen even in the worst affected areas, it is a fine volcanic ash with high silica content, which poses a serious hazard to aviation. Hoskins Airport has therefore been closed since early August, shutting off the direct link to Port Moresby and the flow of tourists that helps support the provincial economy. It is only possible to reach Kimbe by sea, or by light aircraft to Bialla and then three hours drive along the rough coast road, only passable in the dry season.
Current understanding of the risk is based on incomplete scientific evidence, and it will be at least 3 months before sufficient data can be gathered and analyzed to enable a decent hazard assessment. Consequently the Provincial Disaster Committee (PDC) has not permitted the permanent return of the evacuees to their villages. The lack of cheap transport also restricts such activities and would complicate and delay any larger scale evacuation if this became necessary. The seasonal shift in the prevailing winds during October will place another 8,000-9,000 people at risk in any future ash ejection.
National and provincial disaster managers are preparing contingency plans for three possible scenarios. The first scenario is that eruptive activity continues as at present through the wet season, with ashfall affecting a further 8,000 people; the second is that it becomes more explosive with pyroclastic flows impacting an area up to 15 km from the volcano; the worst case scenario is a caldera-forming eruption, potentially affecting up to 30,000 people within a 30 km radius.
Observations during 25 August-3 September made by the Japanese Team. The Japanese Disaster Relief Team, including two seismologists from the Japan Meteorological Agency (JMA) and a geologist from the Earthquake Research Institute, University of Tokyo, was dispatched to Pago during 25 August through 3 September 2002. Observations were carried out with support from the Rabaul Volcano Observatory (RVO) and governmental agencies of both Japan and Papua New Guinea, including the Japan International Cooperation Agency (JICA). A brief report of their observations is provided below. The Team extends their thanks to Chris Mckee, Hassan El-kherbotly, Isolde Macatol, and Ima Itikarai of RVO for their great assistance with the research activities.
On 27 August aerial inspections were made from a helicopter and a survey of air-fall tephra was done. Work the next day included the installation of a seismograph, infrared surveys from a helicopter, and field surveys of air-fall deposits. New lava was sampled on the 29th. Additional aerial inspections were accomplished on the 30th, and the seismograph was picked up. Fieldwork on 31 August consisted of sampling older lava.
During this work, the following observations were noted. 1) Two craters and four lava vents are aligned NW-SE from the middle slope NW of the Pago Central Cone to the Witori caldera. 2) New lava descending from each of the four vents forms complex lobes. The largest amount of lava erupted from the lowest vent, changing its flow direction to the NE and SW due to the caldera wall. 3) No eruption column was seen, though bluish white-colored fumarolic gas was being emitted. Sulfur was deposited on the crater rim. 4) A fault perpendicular to the crater line could be seen in the middle and W of the crater line. 5) The thickness of air-fall deposit is ~2 mm at a spot 10.5 km N of the craters (Rikau), and
A distinct thermal anomaly was observed in an infrared image at the lowest crater (figure 6), with a maximum temperature of about 350°C, indicating vigorous upwelling of lava. The lowermost part of the lava, the flow front, was also a high-temperature zone.
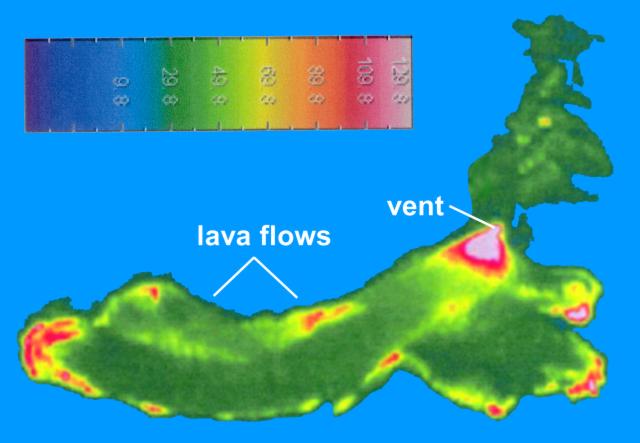 |
Figure 6. Thermal image of Pago showing recent lava flows and areas of active lava emission from the lowest vent on 28 August 2002. Low-temperature near-background values beyond the extent of the lava flows have been combined into a single shade to better define the area of lava flows. View is approximately to the SE. Courtesy of the Japanese Disaster Relief Team. |
Seismicity was stable, but without doubt exceeds its background level, although only about 40 hours of data were recorded. Approximately 20-30 small seismic events, mainly high-frequency B-type earthquakes (BL events, predominant frequency of ~3-4 Hz), were detected per hour. The S-P time of about 1.6s and polarity of first motions suggest that the seismic waves came from the direction of the lava, possibly from near the vents. Besides these BL events, there were seismic events with more complex waveforms. They might be a succession of BL events or caused by rockfalls at the edge of the lava flows. No notable swarm-type activity occurred during the observation period.
Information Contacts: Ima Itikarai, Rabaul Volcano Observatory (RVO), PO Box 386, Rabaul, E.N.B.P., Papua New Guinea; Japanese Disaster Relief Team: Kohichi Uhira, Volcanological Division, Seismological and Volcanological Department, Japan Meteorological Agency, 1-3-4 Ote-machi, Chiyoda-ku, Tokyo 100-8122, Japan; Akimitsu Takagi, Meteorological Research Institute of Japan Meteorological Agency, 1-1 Nagamine, Tsukuba, Ibaraki 305-0052, Japan; Mitsuhiro Yoshimoto, Volcano Research Center (VRC), Earthquake Research Institute (ERI), University of Tokyo, 1130032 111, Yayoi, Bunkyoku, Tokyo (URL: http://www.eri.u-tokyo.ac.jp/VRC/index_E.html); United Nations Office for the Coordination of Humanitarian Affairs (OCHA), United Nations, New York, NY 10017 USA (URL: https://reliefweb.int/); C. Dan Miller, Volcano Disaster Assistance Program, US Geological Survey, Cascades Volcano Observatory, 1300 Southeast Cardinal Court, Building 10, Suite 100, Vancouver, Washington 98683, USA (URL: http://volcanoes.usgs.gov/); David Innes, Air Niugini, PO Box 7186, Boroko, Port Moresby, National Capital District, Papua New Guinea (URL: http://www.airniugini.com.pg/).
Dacite lava flows, flattened forest, deformation, and faulting
Additional information about Mt. Pago's recent eruption (BGVN 27:07-27:09) has been provided by members of the U.S. Geological Survey's Volcano Disaster Assistance Program (VDAP). The team donated to the GVP archives an extensive suite of digital photographs (still and video) taken during August-October 2002. The photographers included the helicopter pilot Alan Cameron (Heli Niugini), and VDAP members Andy Lockhart, Jeff Marso, and Elliot Endo.
In terms of the basic distribution of eruptive products, the August-October 2002 photos (figures 7-16) appeared similar to those shown in earlier reports (BGVN 27:07-27:09). All photos were taken from a helicopter, often during routine observation flights provided by the West New Britain Provincial Government. For scale on some of the photos, Cameron estimated that tree heights ranged from 5-30 m, with the taller trees in the low-lying areas and most of the ones in the photos at the shorter end of that range.
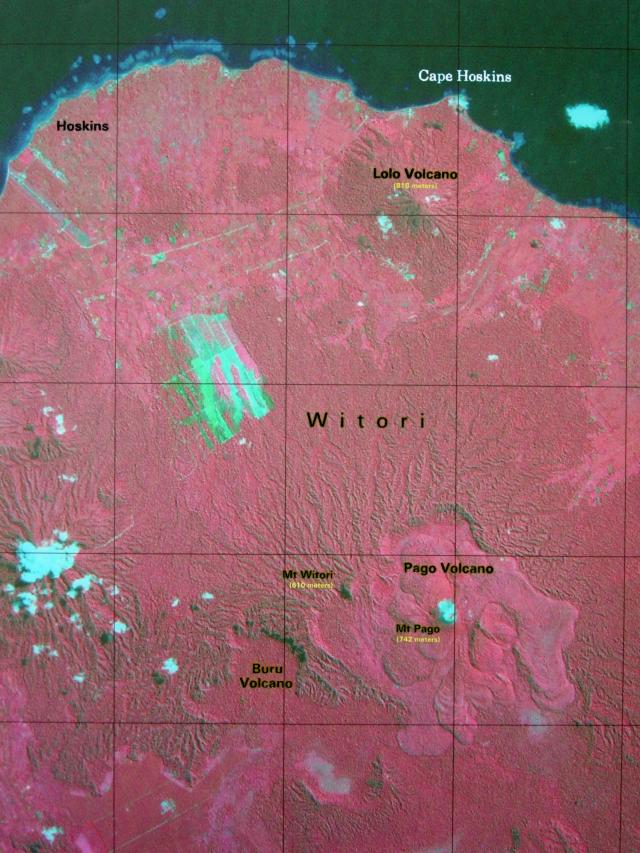 |
Figure 7. A false-color Landsat satellite image labeling some key features at Mt. Pago and its vicinity. N is upwards (parallel to the grid lines) and, for scale, Pago lies ~20 km S of the coast at Cape Hoskins. Although the settlement at Hoskins is labeled, several others also lie along the coast, including some E of Lolo volcano. Taken by LANDSAT 7 on 26 May 2002 (path 94, row 64) and provided courtesy of USGS-VDAP. |
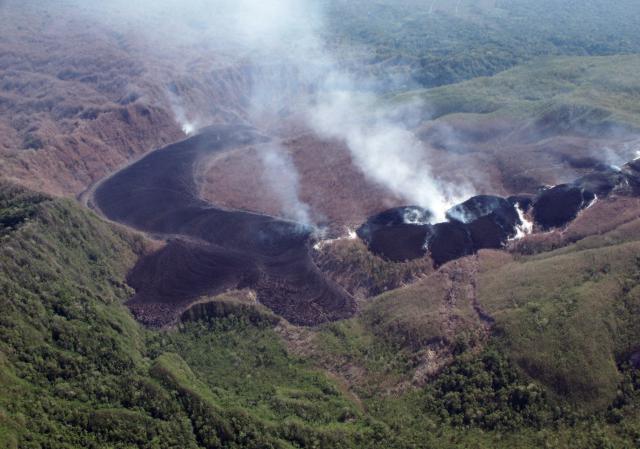 |
Figure 8. An overview of Pago's N sector taken on 7 October 2002 and showing middle to lower flanks and caldera. The shot was taken from the NW, sighting cross-wise to the aligned chain of recent eruptive vents. Freshly erupted lavas have thus far remained confined within the caldera. The extruded massive dacitic lavas include two lava tongues flowing towards the viewer and a larger lava flow ponded in the distance, banked up against older (1911-18) intra-caldera lavas and the caldera's topographic margins. The wide zone of discolored vegetation continues well beyond both the caldera's topographic margin and the photo's left-hand edge. This and several other features such as a zone of deformation and faulting (lower center) appear less distinct here but are highlighted on later figures. Courtesy of USGS-VDAP. |
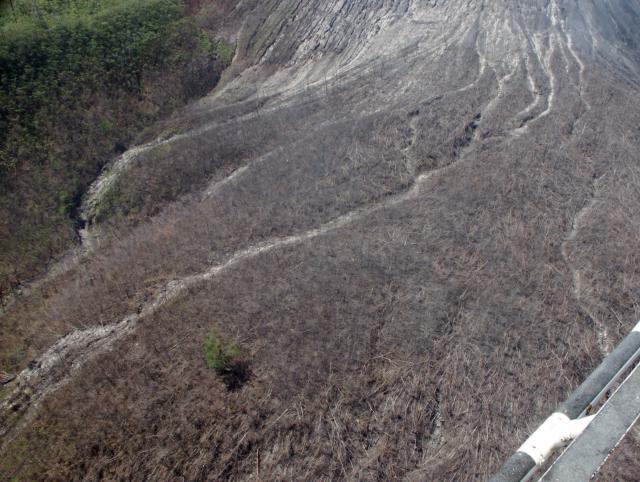 |
Figure 9. Upper NE flanks of Pago highlighting the broad zone of denuded and knocked-down vegetation there. Most of the trees have been laid flat, and there exist occasional cleared-out gullies resembling avalanche chutes, washouts, and lahar paths. Courtesy of the USGS-VDAP. |
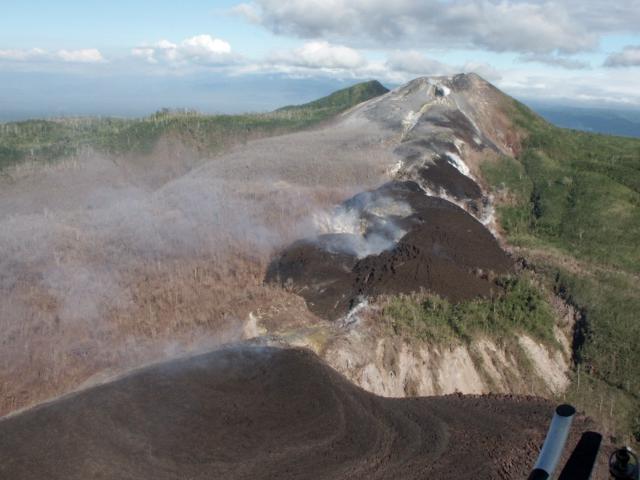 |
Figure 10. A 16 September 2002 view of Pago, as seen looking SSE towards the summit along the aligned, radial-trending chain of vents. Massive lava flows lie in the foreground. Their extrusive vent sits along the main fissure below the lowest cone, in an area of local degassing and conspicuous yellow deposits. Provided courtesy of USGS-VDAP. |
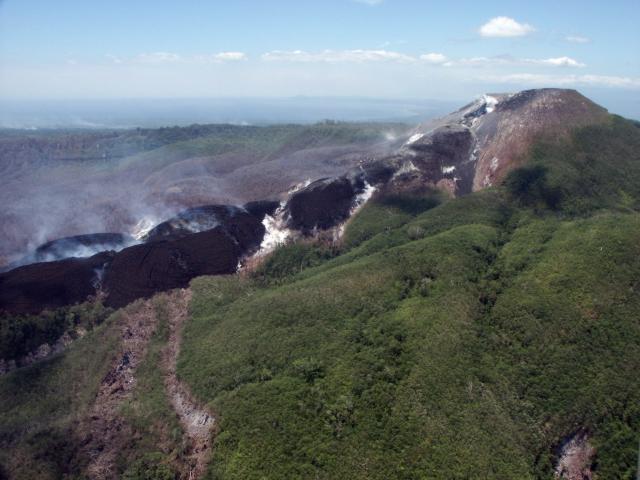 |
Figure 11. A 13 September 2002 photo of Pago's middle-to-upper flanks, including the summit crater and the higher-elevation radial-vent areas. This photo was taken from the NW; in many other photos taken during August-October 2002 white steam plumes tended to obscure the ground. Note the sub-linear swaths of denuded vegetation, particularly two swaths in the left foreground, and the broad area of discolored vegetation in the background behind the fresh lava. The swaths denote the surface traces of recent faults with significant offset, places where existing trees had fallen over. Observation flights in mid- to late September disclosed still further visible, meter-length deformations in this area. Observers inferred that these features reflected a graben formed in the upper portion of a cryptodome. Courtesy of USGS-VDAP. |
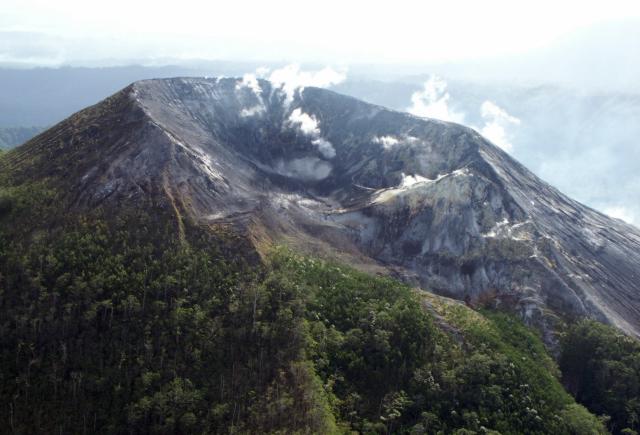 |
Figure 12. A close-up photo of Pago's ravaged summit crater taken from the N on 16 September 2002. Despite their proximity to the crater, some portions of the cone's flanks appear relatively undisturbed. Although difficult to see at the limited scale and resolution of this rendition, the original image clearly shows that a band of denuded trees remained standing within the highly disturbed zone along the breach. Many trees in a zone farther downslope were knocked flat. Courtesy of USGS-VDAP. |
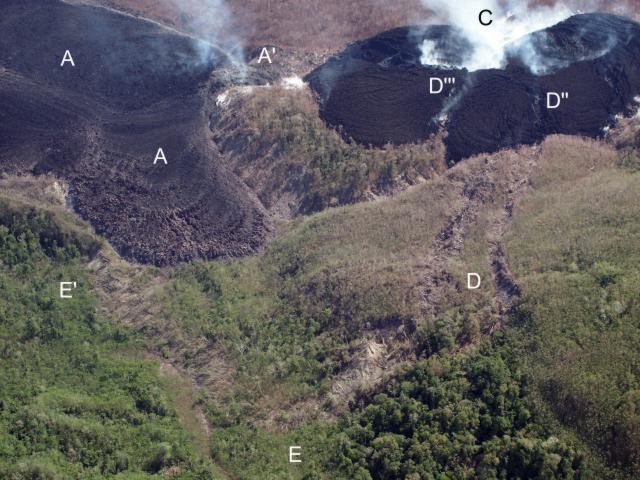 |
Figure 13. A closer view of a portion of Pago's NW outer flanks (seen in figure 3 and part of figure 5) centered on Pago's zone of intense deformation and faulting. The traces of two sub-parallel faults offset the intervening area (D) downward, forming a graben, which crosses the steep sides of older, tree-covered lavas. Farther upslope, the two faults intersect the steaming, lowermost cone (C) at several points (D'' and D'''). Downslope, the two faults join a larger system, which seems to curve back towards the massive lavas (E and E'). The massive lavas (A) discharge at the surface at a point just below A'. Courtesy of USGS-VDAP. |
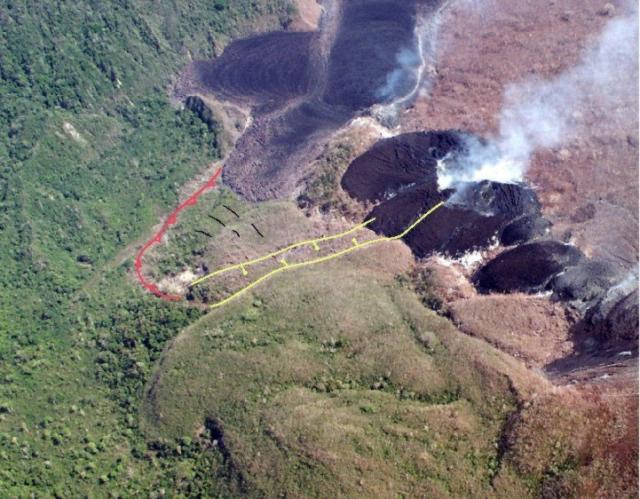 |
Figure 14. Preliminary structural interpretation by Elliot Endo of Pago's zone of intense faulting and deformation. In this interpretation, the upslope area contains a graben; the downslope area a thrust or a region of mass wasting. Courtesy of Elliot Endo, USGS-VDAP. |
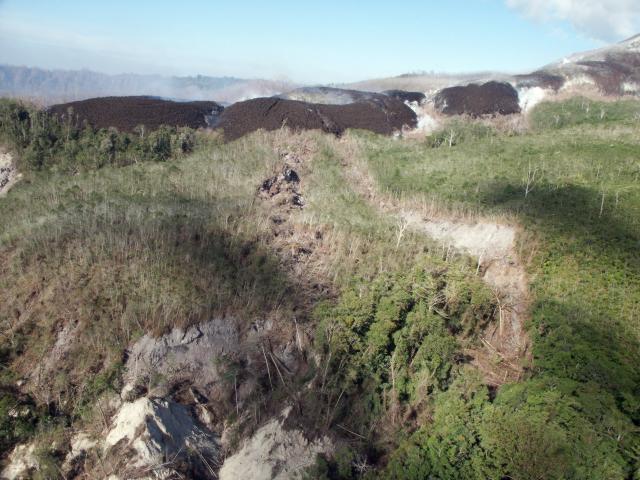 |
Figure 15. A closer view showing Pago's graben deformation feature. Earliest photographs available (~ August 15) show this feature in the early stage of development. The photo was taken looking E on 16 September 2002. For scale, mature trees midway along the fault are 10-15 m in length. Courtesy of the USGS-VDAP. |
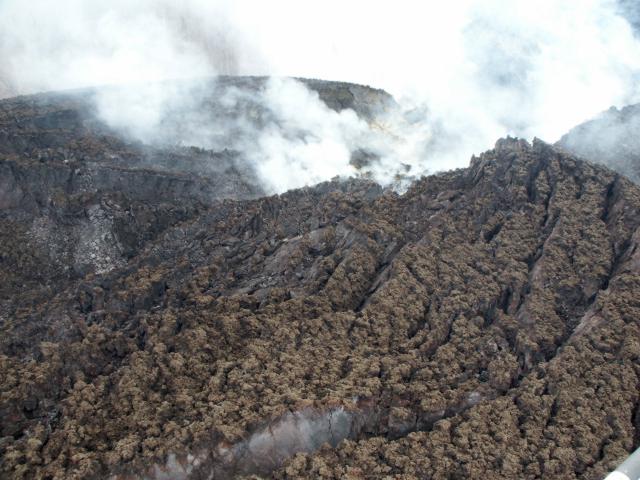 |
Figure 16. Closeup showing the extreme surface roughness of the recent Pago dacite extrusions appearing in an area near the lower vent. Large fractures sub-parallel to the vent developed during extrusion. Offsets along fractures were estimated to be as much as 5-7 m and the height of numerous adjacent points on the lava flow's surface easily varied by a meter. Courtesy of the USGS-VDAP. |
| Movie 1. Digital movie of Pago filmed from a helicopter on 6 October 2002 showing the zone of deformation and faulting followed by a views of the lava flows and vents with the summit crater in the distance towards the SSE. Courtesy of the USGS-VDAP. (30 seconds, 10.7 MB MPEG) |
During all or part of this August-October 2002 interval, lavas erupted at high rates: 10-20 m3/s. The crystal-poor dacitic lavas were roughly the same as those produced during the ancestral caldera-forming eruption. The same composition had also been consistent for the intervening lavas. By or before the end of October the current eruption had emitted ~60 x 106 m3 to ~100 x 106 m3 of magma. There was some evidence of magma mixing. Available evidence suggested that the magma rose in a dike from source depths of 6-8 km. A vital question was whether a gas-rich eruptive phase might start.
Highlighted in the August-October photos were recent faults and associated surface deformation. These had been documented by Chris McKee (Geophysical Observatory, PNG) who found that these features covered an area on Pago's mid-to-lower NW flanks. In many cases the faults left conspicuous trails marked by swaths of fallen trees across the rainforest (figures 5 and 8). Despite their clear expressions and documentation, a thermal-imaging device found that the faults and adjacent areas generally lacked anomalous high-temperature signals (Steve Saunders, RVO). The obvious exceptions to this occurred where faults cut across either vent areas and their cones or across massive lava flows in the caldera (figure 7). The inferred cause of the faulting and associated deformation was a shallow magmatic intrusion.
The USGS contributors expressed gratitude to their colleagues affiliated with Rabaul Volcano Observatory in Papua New Guinea and the West New Britain Provincial Government who had helped them with field and logistical support.
At the close of 2002 Alan Cameron (Heli Niugini) wrote Endo the following brief note. "Since you left, interest in Mt. Pago seems to have diminished; I have not flown over it for some time. Yesterday I flew a [medical evacution] past it, and smoke, etc. was still rising but the weather was bad and I did not get closer than about a half mile [(~1 km)], so I don't know what it is doing. Hoskins [airport] is still closed to aircraft, and the Talasea [air]strip is often closed due to water over it and the soft surface, so air travel is somewhat unreliable from here."
In the first week of February, Cameron sent another message. "The last time I had a close look at Pago was about a month ago. It still looked to be fairly active in most respects, however there is not much emission of ash now and the lava seems to have slowed, but I think this is on account of the flow being restricted in its exit to the [S]. To my eye it seems that the lava deposit may be increasing in height due to that restriction . . . . I do recall that there is still a great deal of heat from the lava ( I could feel its effect on the helicopter), which supports my feeling that it is building vertically and the lava is still flowing."
Reference. Cooke, R.J.S., 1981, Eruptions at Pago volcano, 1911-1933 (Compiled by R.W. Johnson), in Cooke-Ravian Volume of Volcanological Papers (editor, R.W. Johnson) Geological Survey of Papua New Guinea Memoir 10, 135-46; Printed in Hong Kong by Libra Press Ltd.
Information Contacts: Elliot Endo, John Ewert, C. Dan Miller, Andy Lockhart, Jeff Marso, and Chris Newhall, U.S. Geological Survey, David A. Johnston Cascades Volcano Observatory, Volcano Disaster Assistance Program (VDAP), 1300 SE Cardinal Ct, Building 10, Suite 100, Vancouver, WA 98683, USA; Alan Cameron, Chief Pilot, Heli Niugini Kimbe, Box 404, Kimbe WNB, Papua New Guinea; Ima Itikarai and Steve Saunders, Rabaul Volcano Observatory (RVO), Papua New Guinea; Chris Mckee, Port Moresby Geophysical Observatory, PO Box 323, Port Moresby NCD, Papua New Guinea; Hugh Davies, Earth Sciences, University of Papua New Guinea, PO Box 414, University Post Office NCD, Papua New Guinea.
Slow lava effusion within the caldera continues through January 2003
The eruption that began at Pago on 3 August 2002 (BGVN 27:07-27:09 and 27:12) continued through at least early February 2003. The Rabaul Volcano Observatory (RVO) reported that slow effusion of the lava flow from the northwestern-most vent continued. The flow was still contained within the Witori Caldera. An aerial inspection on 10 December confirmed that the lava was still moving. Besides the continuing lava flow, a weak glow was observed on the night of 28 December and rumbling noises were heard for a very short period on 9 January. Rumblings noises were also reported on 4 and 9 February.
Small volcano-tectonic earthquakes continued at background levels. Variable amounts of white vapor were released from the vents. During late December and January the northwestern-most vent was releasing some bluish vapor, indicative of continuing eruption of lava from the same vent. Some booming noises were reported on 22 January from the summit area. As of 24 January 2003, reports of browning vegetation on the S part of the volcano had not been investigated due to logistical problems. However, RVO stated that a likely cause was volcanic plumes containing sulfur gases blowing to the S and SE and affecting vegetation. Ground deformation showed a lack of significant changes during December. This contrasts with the period between the start of the eruption on 3 August and the beginning of November when complex and significant movements were recorded.
MODVOLC Thermal Alerts, 2001-2002. Throughout 2001 and 2002, thermal alerts for Pago occurred only during August-December 2002 (figure 17). This period was characterized by continuous thermal anomalies first detected on 6 August at 1030 and growing to several pixels in size. At this time the anomaly consisted of a single alert-pixel with an alert ratio of -0.31. At 2250 MODIS detected five alert-pixels with a maximum alert ratio of -0.35. The alert ratio of the anomaly rose to a peak on 8 August at 1015 when a single alert-pixel had an alert ratio of -0.035.
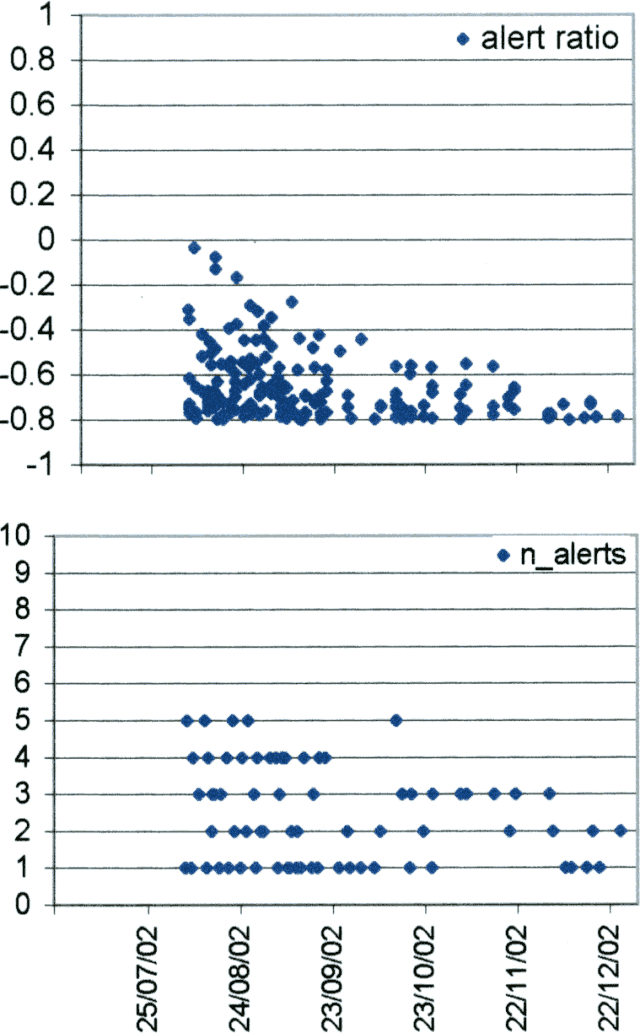 |
Figure 17. MODIS detected alerts on Pago during 2001-2002. Courtesy of Diego Coppola and David Rothery, The Open University. |
After that, during August detected alerts on Pago gradually decreased. On 15 August the anomaly consisted of three alert-pixels with a maximum alert ratio of -0.077, and on 22 August two alert-pixels were detected with maximum alert ratio of -0.167. The RVO reported that the eruption continued with low levels of activity during August and was characterized by the ejection of ash clouds (BGVN 27:08). The earliest date reported for lava effusion is 9 August (BGVN 27:07).
On 26 August MODIS detected five alert-pixels with a maximum alert ratio of -0.291. The anomaly decreased on 29 August when only one alert-pixel was detected (alert ratio -0.318), but had expanded by 31 August to two alert-pixels with a maximum alert ratio of -0.382, and by 2 September to four alert-pixels with a maximum alert ratio of -0.345. This series of anomalies is evidently related to lava erupted from the craters NW of the central cone during 25 August to 3 September (BGVN 27:08), during which lava flowed NE and then SW after reaching the caldera wall. The coordinates of the alert-pixels throughout the eruption were dispersed between the active vent and the caldera wall in a pattern consistent with this description (figure 18).
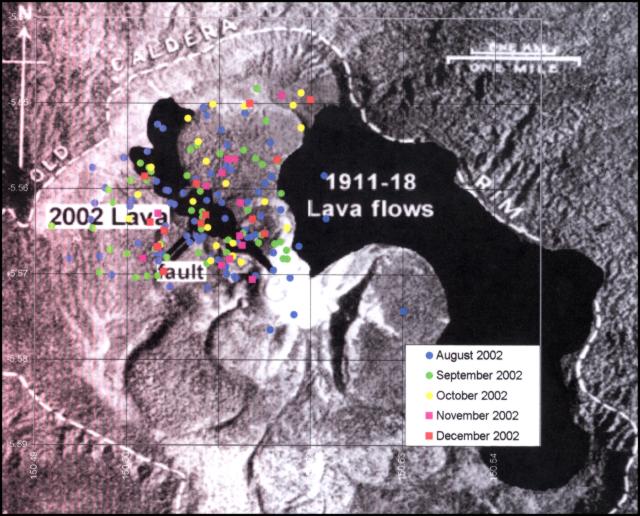 |
Figure 18. Locations of alert-pixels on Pago during 2001-2002. Courtesy of Diego Coppola and David Rothery, The Open University. |
On 9 September MODIS detected a single pixel anomaly with an alert ratio of -0.275. This anomaly was probably related to the explosion(s) that produced a 1.5-km-high ash-and-steam plume visible on satellite images on 7 and 8 September (BGVN 27:08). During September and October the alert ratio became lower and varied between one and five pixels. The relatively high alert ratio of -0.441 on 2 October was probably related to continuous lava flows in the NE portion of a fissure system inside the caldera, reported by the RVO (BGVN 27:09). MODIS detected continuous anomalies during October-December 2002, attributed to continuing lava effusion. Another alert was recorded on 15 January 2003.
Information Contacts: Ima Itikarai, Rabaul Volcano Observatory (RVO), PO Box 386, Rabaul, E.N.B.P., Papua New Guinea; Diego Coppola and David A. Rothery, Department of Earth Sciences, The Open University, Milton Keynes, MK7 6AA, United Kingdom.
Lava flows from NW-most vent continue through February
The eruption that began in August 2002 continued during early 2003 with lava effusion through at least 28 February and vapor emissions. The following is from the Rabaul Volcano Observatory.
Activity during January 2003. No field or aerial observations of the caldera or lava flow were made in January. However, blue vapor was observed throughout January from the NW-most lava-producing vent and other vents along the NW-SE-trending fissure system, suggesting that hot lava was near the surface and presumably still flowing. Besides the blue vapor emissions, variable amounts of white vapor were released. Evidence of dead and dried vegetation downwind of the fissure system indicated that hazardous gases, such as sulfur dioxide, were present in the vapor emissions. The dead vegetation is restricted to an area extending 1-2 km to the S (downwind). This is unlike similar vegetation effects during the SE-wind season, which extended as far as 10 km to the NW from the source of the vapor emissions. Occasional low roaring noises were heard on 9, 21, 22, 25, and 26 January.
Seismic activity was relatively steady with no significant deviation from the background levels determined since the permanent seismic network was established in early October 2002. Earthquakes consisted mainly of volcano-tectonic (VT) events averaging 45 per day, with a low of 18 (recorded on the 20th) and a high of 71 (on the 4th). The events occurred randomly over each day. Low-frequency earthquakes were recorded on some days; a maximum of six events was recorded on the 18th.
Airlink began to use Hoskins airport in the latter half of January after winds began to blow away from the airport. Furthermore, the absence of ash emissions since August and early September 2002 made conditions favorable. The decision to re-use the airport followed information provided by RVO to the Papua New Guinea Civil Aviation Authority and aviation industry.
Activity during February 2003. An aerial inspection on 28 February showed that lava effusion continued from the NW-most vent of the fissure system (figure 19). The lava flow had two lobes. The main lobe was directed initially to the N but later curved to a northeasterly direction, dictated by topographic features of the Witori caldera floor. On 28 February it appeared that horizontal lateral flow of this lobe had stopped after it reached a topographic barrier. As a result, the lava flow began to gain height along its entire northern portion. The height of the flow was estimated to be ~25-33% of the height of the ~240-m-high Witori Caldera wall. The second lobe of the lava flow, which flowed to the S, showed slow progress. Between October 2002 and February 2003 it advanced only a few hundred meters. The thickness of this flow was ~30-40 m. As of 28 February the total volume of erupted lava from this single vent was estimated to be ~0.09-0.12 km3.
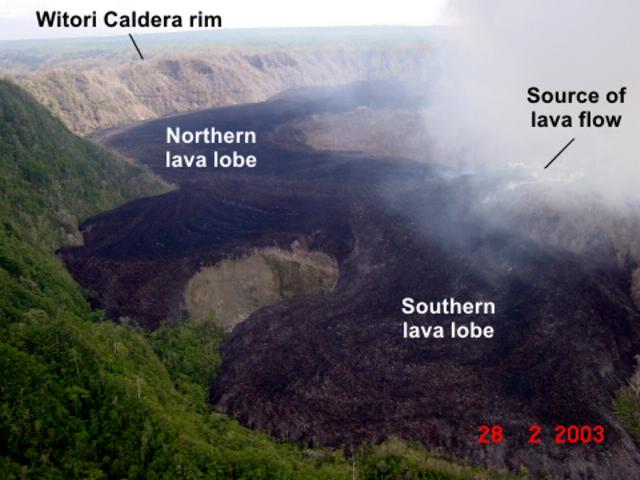 |
Figure 19. Lava flow lobes from the NW-most vent of the fissure system on 28 February 2003. The view is to the N. The white cloud at the top right of the photo is caused by vapor emissions from the line of vents on the fissure system. Photo by Ima Itikarai, RVO. |
Emissions of minor to moderate volumes of white vapor continued from all vents along the fissure system. The lower vents to the NW released more vapor than the upper ones to the SE. Small amounts of blue vapor were released from the lava-producing vent. Because the vapor emissions were blown S and SE, vegetation within 2 km downwind turned brown. No ash emissions were produced during the month. Low jet-roaring noises were heard on 4, 9-11, 13, and 21 February. Hoskins airport continued to be used by Airlink in February.
Seismic activity was low during the month. Earthquakes were mainly volcano-tectonic. The daily count was ~30 compared to 45 in January. Most of the earthquakes were very small ones, but moderate-sized events were recorded on 1 (2 events), 10 (2), 12 (1), and 18 February (6). The six earthquakes on the 18th were recorded within a time span of 1.5 hours. A handful of low-frequency earthquakes were also recorded on the 6th (2), 10th (1) and 11th (1).
Activity during March 2003. No field or aerial observations of the lava flow were made in March, so it is uncertain whether lava effusion from the NW-most vent continued. The upper vents continued to release weak emissions of thin white vapor. The lower vents released weak to moderate emissions of white vapor and bluish vapor emissions on 13, 18, 23, and 28-30 March, indicative of hot material. Low roaring noises heard on 13, 16, 18, 23, and 29 March did not accompany explosive activity. No seismic recordings were made in March.
Information Contacts: Ima Itikarai, Rabaul Volcano Observatory (RVO), P.O. Box 386, Rabaul, Papua New Guinea.
Minor seismicity and vapor emissions; no lava effusion as of 22 May
The eruption at Pago that began in August 2002 continued during early 2003 with lava effusion through at least 28 February and vapor emissions (BGVN 28:03). The Rabaul Volcanological Observatory (RVO) reports that activity at Pago continued, but remained low, from 14 April through 9 October 2003.
The line of vents on the NW slope of Pago continued to release small amounts of thin white vapor over the whole of the period. Occasional weak audible booming noises were heard (eg. on 20 April) and roaring noises were heard on 24 April, 6 May, and 22 May. Very small traces of blue vapor were seen coming from the lower vents on 8 May.
An aerial inspection on 22 May showed that lava effusion from the NW vent had ceased since the February inspection; there were no indications of fresh lava near the vent, no movement of the N and S lobes, and no change in the height of lava against the caldera wall. It also revealed a new fumarolic area to the E.
Monitoring instruments were restored on 19 May. Leveling measurements showed a few centimeters of inflation compared to December 2002. This was considered by RVO to be very significant when compared to previous measurements, but may have been due to nearby roadwork.
Less than 20 volcano-tectonic earthquakes per day were recorded during 25-30 June. A local tectonic earthquake on 9 August seemed to lead to an increase in energy release and event numbers at one seismic station, but it may have been an instrumentation problem. An airborne spectrophotometer revealed only trace amounts of SO2 in early August. Between two and seven volcano-tectonic earthquakes per day were reported in the 26 September-9 October period.
Information Contacts: Ima Itikarai, Rabaul Volcanological Observatory, P.O. Box 386, Rabaul, Papua New Guinea.
All vents still degassing; low seismicity (5-7 VT earthquakes per day)
Pago remained quiet, with all vents continuing to release weak, thin white vapor during 10 October-14 December 2003. Seismicity was generally low, with daily averages of 5-7 small volcano-tectonic earthquakes. The highest number of daily events through 26 November were the 45 recorded on 28 October.
Information Contacts: Ima Itikarai, Rabaul Volcano Observatory (RVO), P.O. Box 386, Rabaul, Papua New Guinea.
Two explosions on 24 February 2004, otherwise quiet during that month
Pago was mainly quiet throughout the month of February 2004. However, two explosions were reported in the early hours of 24 February [see update and correction in BGVN 29:04]. The explosions were accompanied by thick dark grey ash clouds from the lower and upper vents. The ash clouds drifted SW of the volcano resulting in fine ashfall downwind. Jet-like noises were also heard at 0140 on 24 February accompanying the explosions. A weak glow was visible from the lower vents.
Information Contacts: Rabaul Volcano Observatory (RVO), P.O. Box 386, Rabaul, Papua New Guinea.
Recharacterization of reported 24 February eruptive activity
A message in mid-April from Rabaul Volcano Observatory's assistant director, Ima Itikarai, to Dan Shackelford indicated that their previous Pago report (BGVN 29:02), which noted two eruptions on 24 February 2004, was no longer believed to be true. Described activity, especially felt tremors, contradicted instrumental data. After discussions with local observers Itikarai concluded that "the reported activity may not be true." Although no explanation was given for the reports of ashfall or glow, the message noted that the "jet-like noises" may have been low-frequency sounds from local thunderstorms.
RVO reports for 15 March-1 April noted that Pago's volcanic and seismic activity remained at low levels. All vents gently released small volumes of 'thin white vapor,' with small amounts of 'blue vapor' from the lower vents on some days. A dull glow was observed on 17 March.
Information Contacts: Ima Itikarai and Herman Patia, Rabaul Volcano Observatory, Papua New Guinea.
Mostly quiet except for thin white vapor emissions in July
Pago was quiet during July. The upper vents released thin white vapor throughout the month. No emission was observed from the lower vents. Seismic activity was at a low level.
Information Contacts: Ima Itikarai and Herman Patia, Rabaul Volcano Observatory (RVO), P. O. Box 386, Rabaul, Papua New Guinea.
Low-level vapor emissions and seismicity through August 2005
Pago has remained quiet during April-August 2005, with no reports of volcanism since the end of the most recent eruption in early 2003 (BGVN 28:03 and 28:09). Reports since that time have described low-level emissions and seismicity (BGVN 28:12, 29:02, 29:04, 29:07).
In April the upper vents and the summit crater released small amounts of white vapor and occasional thin white vapor was reported from the lower vents. Seismic activity was low; the daily number of low-frequency earthquakes ranged from zero to a few. In June weak emissions of thin white vapor continued to be released from the upper vents but no emissions were noted from the lower vents. Seismicity in June remained low, with no more than 8 small, high-frequency earthquakes recorded per day. Similar activity continued through August. Visual observations on 27 and 28 August revealed emissions of very small volumes of thin white vapor being released from the upper vents of the fissure system. No emissions originated from the lower or main summit vents. Seismic activity was low throughout the month, and some small high-frequency earthquakes were recorded. The greatest number of high-frequency events recorded on any given day was 7 on 25 August. No noises were heard and no glow was observed during the reporting period.
Information Contacts: Ima Itikarai and Herman Patia, Rabaul Volcano Observatory (RVO), P. O. Box 386, Rabaul, Papua New Guinea.
Steaming, and few earthquakes, during field observations in September 2005
During the observation interval 12-18 September 2005, Pago continued to be quiet. Very small volumes of thin white vapor were released from all vents. No noises were heard and no glow was observed. Seismic activity was low, with some small, high frequency earthquakes being recorded. The highest number of high frequency events on any given day was 3, recorded on 18 September.
Information Contacts: Ima Itikarai and Herman Patia, Rabaul Volcano Observatory (RVO), PO Box 386, Rabaul, Papua New Guinea.
Quiescent, with minor seismicity, through March 2006
Since 18 September 2005 (BGVN 30:09) through 31 March 2006, Pago has remained quiet. Only small volumes of diffuse white vapor released from all vents have been observed, with no noises or glow. Between 16 February and 31 March low-frequency earthquakes were recorded at a rate of 1-4 per day. The daily number of high-frequency events during that period ranged from 7 to 26.
Information Contacts: Ima Itikarai, Rabaul Volcano Observatory (RVO), P.O. Box 386, Rabaul, Papua New Guinea; Andrew Tupper, Darwin Volcanic Ash Advisory Centre (VAAC), Bureau of Meteorology, Northern Territory Regional Office, PO Box 40050, Casuarina, Northern Territory 0811, Australia (URL: http://www.bom.gov.au/info/vaac/).
Ejection of lava fragments in late August 2007; quiet steaming
Reports about Pago early in 2006 (BGVN 31:02) noted small vapor emissions, but no noises or glow, and low levels of seismicity. Similar observations were reported by the Rabaul Volcano Observatory (RVO) for December 2006. A local security company reported that sometime during 27-31 October 2006 there was a single booming noise accompanied by a white-gray emissions above the summit. Volcanologists were sent to verify the activity, but no report about the event was received. A March 2007 report only noted diffuse white vapor emissions and low seismicity.
On 28 August 2007 lava fragments were observed being ejected during the daytime from one of the Upper vents (2nd Crater). People in a nearby village heard only a single booming noise in the early hours of 27 August. The residents also indicated increased white vapor emissions from 2nd Crater on the 27th that returned to normal levels the following day. Seismic activity had increased on 27-28 August, and the Real-Time Seismic Amplitude Measurement (RSAM) increased from background level (around 100 units) to a peak of about 400 units. RSAM levels began to decline on the 29th, returning to background levels on 30 August. An inspection on 1 October revealed that only the 2nd Crater of the Upper Vents was releasing diffuse white vapor, and that there were no noises or glow.
Pago remained quiet during September-November 2007. When observations were made, only diffuse white vapor was being released from the Upper Vents. A handful of high-frequency earthquakes and 18 low-frequency events were recorded during September. The daily number of earthquakes ranged from 1 to 4 from 1 to 24 September, with none after through the end of the month. There was a slight increase in gas emission during 9-11 November. The vapor plume was blown N, where villagers reported nose and windpipe irritation, and watery eyes. The daily number of high-frequency earthquakes ranged from 1 to 3, while low-frequency earthquakes ranged from 1 to 9. During January 2008 Pago was still quiet with diffuse white vapor from the upper vents and very occasional low-frequency seismic events.
Information Contacts: Ima Itikarai and Herman Patia, Rabaul Volcano Observatory (RVO), P.O. Box 386, Rabaul, Papua New Guinea.
Explosive ash plumes reported in May-July 2012
Based on analyses of satellite images as reported by the Global Disaster Alert and Coordination System (GDACS) and the Darwin Volcanic Ash Advisory Centre (VAAC), five volcano plume advisories were issued for Pago volcano in the Summer of 2012 (table 1).
Table 1.Five VAAC volcano ash advisories were issued for Pago volcano for the period May-July 2012. Darwin VAAC Aviation Alert Colors range in four steps from green to yellow to orange to red - lowest to highest alert. Courtesy of Darwin VAAC and GDACS.
| Date – Time, 2012, UTC | VAAC Aviation Alert Color | Other Observations |
| 3 May – 0530 | Red | high level eruption to 12.2 km |
| 3 May – 0600 | Red | high level eruption to 13.7 km extending 74 km to NE |
| 3 May – 0715 | Orange | ash/steam plume to 13.7 km extending 74 km to NE |
| 10 Jul – 1630 | Orange | ash plume to 4.3 km extending 280 km SW |
| 10 Jul – 2203 | Orange | ash plume to 4.3 km extending 185 km SW |
According to the Papua New Guinea (PNG) National Disaster Centre (2013), PNG has 16 active and at least 28 potentially active or 'dormant' volcanoes which are a potential danger to the lives of about a quarter of a million people living in a total area of 16, 000 km2. Of the 16 active volcanoes, 6 of them are classified as high-risk volcanoes - high-risk in the sense that they have had explosive eruptions in the past and have the potential of repeating these eruptions in future. Of these 6 high-risk volcanoes, 3 are in New Britain - Rabaul in East New Britain, and Ulawun and Pago in West New Britain (for locations, see figure 3, BGVN 32:04, on Sulu Range volcano).
Figure 20 shows a satellite photo of approximately 8-km diameter Witori caldera from Google Earth. The walls of the caldera appear on the N and NW side of the caldera. A series of lava flows have formed the lobate character of the floor of the caldera. More detail on the lava flows appear in a previous report on Pago (figure 3, BGVN 27:08 - a vertical photo, with the old caldera rim delineated in white, distribution of new lava flows from August 2002 shown in red, compared with the previous lava flows from the 1911-18 eruption shown in light blue; a fault perpendicular to the 2002 lava flow is shown in dark blue).
|
Figure 20. Satellite photo of Witori caldera within which Pago volcano exists. Courtesy of Google Earth. |
References. Volcano Research Center, 2002 (4 September), Pago volcano, New Britain, Papua, New Guinea: Brief report and Photographs Aug. 26-September 2, 2002; URL:http://hakone.eri.u-tokyo.ac.jp.
Papua New Guinea (PNG) National Disaster Centre (NDC), 2013 (28 July), Volcanic eruption, PGN NDC (URL:http://www.pngndc.gov.pg/).
Information Contacts: Ima Itikarai and Herman Patia, Rabaul Volcano Observatory (RVO), P.O. Box 386, Rabaul, Papua New Guinea; Darwin Volcanic Ash Advisory Centre (VAAC), Bureau of Meteorology, Northern Territory Regional Office, PO Box 40050, Casuarina, NT 0811, Australia (URL: http://www.bom.gov.au/info/vaac/); Global Disaster Alert and Coordination System (GDACS), United Nations and the European Commission (URL: http://www.gdacs.org/Volcanoes); Volcano Research Center, Earthquake Research Institute, University of Tokyo, 113-0032 1-1-1, Yayoi, Bunkyo-ku, Tokyo (URL: http://hakone.eri.u-tokyo.ac.jp); and Papua New Guinea (PNG) National Disaster Centre (URL: http://www.pngndc.gov.pg/).
|
|
||||||||||||||||||||||||||||
There is data available for 19 confirmed eruptive periods.
2012 May 3 - 2012 Jul 11 Confirmed Eruption (Explosive / Effusive) VEI: 3
| Episode 1 | Eruption (Explosive / Effusive) | Pago | |||||||||||||||||||||||
|---|---|---|---|---|---|---|---|---|---|---|---|---|---|---|---|---|---|---|---|---|---|---|---|---|
| 2012 May 3 - 2012 Jul 11 | Evidence from Observations: Reported | |||||||||||||||||||||||
|
List of 3 Events for Episode 1 at Pago
|
||||||||||||||||||||||||
2007 Aug 28 - 2007 Aug 28 Confirmed Eruption (Explosive / Effusive) VEI: 1 (?)
| Episode 1 | Eruption (Explosive / Effusive) | Pago | |||||||||||||||||||||||||||||||||
|---|---|---|---|---|---|---|---|---|---|---|---|---|---|---|---|---|---|---|---|---|---|---|---|---|---|---|---|---|---|---|---|---|---|---|
| 2007 Aug 28 - 2007 Aug 28 | Evidence from Observations: Reported | |||||||||||||||||||||||||||||||||
|
List of 5 Events for Episode 1 at Pago
|
||||||||||||||||||||||||||||||||||
[ 2004 Feb 24 - 2004 Feb 24 ] Uncertain Eruption
| Episode 1 | Eruption (Explosive / Effusive) | Pago | ||||||||||||||||||||||||||||||||||||||
|---|---|---|---|---|---|---|---|---|---|---|---|---|---|---|---|---|---|---|---|---|---|---|---|---|---|---|---|---|---|---|---|---|---|---|---|---|---|---|---|
| 2004 Feb 24 - 2004 Feb 24 | Evidence from Unknown | ||||||||||||||||||||||||||||||||||||||
|
List of 6 Events for Episode 1 at Pago
|
|||||||||||||||||||||||||||||||||||||||
2002 Aug 3 - 2003 Mar 26 ± 25 days Confirmed Eruption (Explosive / Effusive) VEI: 3
| Episode 1 | Eruption (Explosive / Effusive) | Pago (summit and NW flank) | |||||||||||||||||||||||||||||||||||||||||||
|---|---|---|---|---|---|---|---|---|---|---|---|---|---|---|---|---|---|---|---|---|---|---|---|---|---|---|---|---|---|---|---|---|---|---|---|---|---|---|---|---|---|---|---|---|
| 2002 Aug 3 - 2003 Mar 26 ± 25 days | Evidence from Observations: Reported | |||||||||||||||||||||||||||||||||||||||||||
|
List of 7 Events for Episode 1 at Pago (summit and NW flank)
|
||||||||||||||||||||||||||||||||||||||||||||
1933 Jul (?) - 1933 Aug (?) Confirmed Eruption (Explosive / Effusive) VEI: 2
| Episode 1 | Eruption (Explosive / Effusive) | Pago | |||||||||||||||||||||||
|---|---|---|---|---|---|---|---|---|---|---|---|---|---|---|---|---|---|---|---|---|---|---|---|---|
| 1933 Jul (?) - 1933 Aug (?) | Evidence from Observations: Reported | |||||||||||||||||||||||
|
List of 3 Events for Episode 1 at Pago
|
||||||||||||||||||||||||
1920 ± 2 years Confirmed Eruption (Explosive / Effusive) VEI: 0
| Episode 1 | Eruption (Explosive / Effusive) | Pago | ||||||||||||||||||
|---|---|---|---|---|---|---|---|---|---|---|---|---|---|---|---|---|---|---|---|
| 1920 ± 2 years - Unknown | Evidence from Observations: Reported | ||||||||||||||||||
|
List of 2 Events for Episode 1 at Pago
|
|||||||||||||||||||
1911 - 1918 May (?) Confirmed Eruption (Explosive / Effusive) VEI: 3
| Episode 1 | Eruption (Explosive / Effusive) | Pago | ||||||||||||||||||||||||||||||||||||||||||||||||||||||||||
|---|---|---|---|---|---|---|---|---|---|---|---|---|---|---|---|---|---|---|---|---|---|---|---|---|---|---|---|---|---|---|---|---|---|---|---|---|---|---|---|---|---|---|---|---|---|---|---|---|---|---|---|---|---|---|---|---|---|---|---|
| 1911 - 1918 May (?) | Evidence from Observations: Reported | ||||||||||||||||||||||||||||||||||||||||||||||||||||||||||
|
List of 10 Events for Episode 1 at Pago
|
|||||||||||||||||||||||||||||||||||||||||||||||||||||||||||
[ 1900 (?) ] Discredited Eruption
Pago was reported to be active at the turn of the century according to a Catholic priest (Johnson and Blake, 1972). However, the phrase "turn of the century" really meant "early part of the century", so the report almost certainly refers to the 1911-18 eruption (Johnson 1990, pers. comm.).
1800 (?) Confirmed Eruption (Explosive / Effusive) VEI: 4
| Episode 1 | Eruption (Explosive / Effusive) | W-H6 tephra | |||||||||||||||||||||||
|---|---|---|---|---|---|---|---|---|---|---|---|---|---|---|---|---|---|---|---|---|---|---|---|---|
| 1800 (?) - Unknown | Evidence from Correlation: Tephrochronology | |||||||||||||||||||||||
|
List of 3 Events for Episode 1 at W-H6 tephra
|
||||||||||||||||||||||||
1730 ± 25 years Confirmed Eruption (Explosive / Effusive)
| Episode 1 | Eruption (Explosive / Effusive) | W-H5 tephra | ||||||||||||||||||
|---|---|---|---|---|---|---|---|---|---|---|---|---|---|---|---|---|---|---|---|
| 1730 ± 25 years - Unknown | Evidence from Correlation: Tephrochronology | ||||||||||||||||||
|
List of 2 Events for Episode 1 at W-H5 tephra
|
|||||||||||||||||||
1550 (?) Confirmed Eruption (Explosive / Effusive) VEI: 4
| Episode 1 | Eruption (Explosive / Effusive) | W-H4 tephra | |||||||||||||||||||||||
|---|---|---|---|---|---|---|---|---|---|---|---|---|---|---|---|---|---|---|---|---|---|---|---|---|
| 1550 (?) - Unknown | Evidence from Correlation: Tephrochronology | |||||||||||||||||||||||
|
List of 3 Events for Episode 1 at W-H4 tephra
|
||||||||||||||||||||||||
1450 (?) Confirmed Eruption (Explosive / Effusive)
| Episode 1 | Eruption (Explosive / Effusive) | W-H3 tephra | ||||||||||||||||||
|---|---|---|---|---|---|---|---|---|---|---|---|---|---|---|---|---|---|---|---|
| 1450 (?) - Unknown | Evidence from Correlation: Tephrochronology | ||||||||||||||||||
|
List of 2 Events for Episode 1 at W-H3 tephra
|
|||||||||||||||||||
1050 ± 100 years Confirmed Eruption (Explosive / Effusive)
| Episode 1 | Eruption (Explosive / Effusive) | W-H2 tephra | ||||||||||||||||||
|---|---|---|---|---|---|---|---|---|---|---|---|---|---|---|---|---|---|---|---|
| 1050 ± 100 years - Unknown | Evidence from Correlation: Tephrochronology | ||||||||||||||||||
|
List of 2 Events for Episode 1 at W-H2 tephra
|
|||||||||||||||||||
0950 (?) Confirmed Eruption (Explosive / Effusive)
| Episode 1 | Eruption (Explosive / Effusive) | W-H1 tephra | ||||||||||||||||||
|---|---|---|---|---|---|---|---|---|---|---|---|---|---|---|---|---|---|---|---|
| 0950 (?) - Unknown | Evidence from Correlation: Tephrochronology | ||||||||||||||||||
|
List of 2 Events for Episode 1 at W-H1 tephra
|
|||||||||||||||||||
0710 ± 75 years Confirmed Eruption (Explosive / Effusive) VEI: 6
| Episode 1 | Eruption (Explosive / Effusive) | W-G tephra | ||||||||||||||||||||||||||||
|---|---|---|---|---|---|---|---|---|---|---|---|---|---|---|---|---|---|---|---|---|---|---|---|---|---|---|---|---|---|
| 0710 ± 75 years - Unknown | Evidence from Isotopic: 14C (uncalibrated) | ||||||||||||||||||||||||||||
|
List of 4 Events for Episode 1 at W-G tephra
|
|||||||||||||||||||||||||||||
0690 ± 90 years Confirmed Eruption (Explosive / Effusive) VEI: 5
| Episode 1 | Eruption (Explosive / Effusive) | W-K4 tephra | ||||||||||||||||||||||||||||||||||||||||||||||||||||||||||
|---|---|---|---|---|---|---|---|---|---|---|---|---|---|---|---|---|---|---|---|---|---|---|---|---|---|---|---|---|---|---|---|---|---|---|---|---|---|---|---|---|---|---|---|---|---|---|---|---|---|---|---|---|---|---|---|---|---|---|---|
| 0690 ± 90 years - Unknown | Evidence from Isotopic: 14C (calibrated) | ||||||||||||||||||||||||||||||||||||||||||||||||||||||||||
|
List of 10 Events for Episode 1 at W-K4 tephra
|
|||||||||||||||||||||||||||||||||||||||||||||||||||||||||||
0310 ± 100 years Confirmed Eruption (Explosive / Effusive) VEI: 5
| Episode 1 | Eruption (Explosive / Effusive) | W-K3 tephra | ||||||||||||||||||||||||||||||||||||||
|---|---|---|---|---|---|---|---|---|---|---|---|---|---|---|---|---|---|---|---|---|---|---|---|---|---|---|---|---|---|---|---|---|---|---|---|---|---|---|---|
| 0310 ± 100 years - Unknown | Evidence from Isotopic: 14C (calibrated) | ||||||||||||||||||||||||||||||||||||||
|
List of 6 Events for Episode 1 at W-K3 tephra
|
|||||||||||||||||||||||||||||||||||||||
0640 BCE ± 300 years Confirmed Eruption (Explosive / Effusive)
| Episode 1 | Eruption (Explosive / Effusive) | ||||||||||||||||||||||||
|---|---|---|---|---|---|---|---|---|---|---|---|---|---|---|---|---|---|---|---|---|---|---|---|---|
| 0640 BCE ± 300 years - Unknown | Evidence from Isotopic: 14C (uncalibrated) | |||||||||||||||||||||||
|
List of 3 Events for Episode 1
|
||||||||||||||||||||||||
1370 BCE ± 160 years Confirmed Eruption (Explosive / Effusive) VEI: 6
| Episode 1 | Eruption (Explosive / Effusive) | W-K2 tephra | ||||||||||||||||||||||||||||||||||||||||||||||||||||||||||
|---|---|---|---|---|---|---|---|---|---|---|---|---|---|---|---|---|---|---|---|---|---|---|---|---|---|---|---|---|---|---|---|---|---|---|---|---|---|---|---|---|---|---|---|---|---|---|---|---|---|---|---|---|---|---|---|---|---|---|---|
| 1370 BCE ± 160 years - Unknown | Evidence from Isotopic: 14C (calibrated) | ||||||||||||||||||||||||||||||||||||||||||||||||||||||||||
|
List of 10 Events for Episode 1 at W-K2 tephra
|
|||||||||||||||||||||||||||||||||||||||||||||||||||||||||||
4000 BCE ± 210 years Confirmed Eruption (Explosive / Effusive) VEI: 6 (?)
| Episode 1 | Eruption (Explosive / Effusive) | W-K1 tephra | |||||||||||||||||||||||||||||||||||||||||||||||||||||||||||||||
|---|---|---|---|---|---|---|---|---|---|---|---|---|---|---|---|---|---|---|---|---|---|---|---|---|---|---|---|---|---|---|---|---|---|---|---|---|---|---|---|---|---|---|---|---|---|---|---|---|---|---|---|---|---|---|---|---|---|---|---|---|---|---|---|---|
| 4000 BCE ± 210 years - Unknown | Evidence from Isotopic: 14C (calibrated) | |||||||||||||||||||||||||||||||||||||||||||||||||||||||||||||||
| Following a relatively long period of dormancy, a series of five major explosive eruptions began about 5,600 years BP (tephra layer W-K1) that lasted until 1,200 BP (Machida et al., 1996). The W-K1 eruption, radiocarbon dated at 5,630 ± 110 BP from charcoal within a pyroclastic-flow deposit, suggests formation of a caldera; the W-K2, W-K3, W-H4, and W-G deposits may also represent caldera forming eruptions (Machida et al., 1996). Neall et al. (2008) assigned a calibrated age of 6,160-5,740 BP (5,950 ± 210) and noted that the eruption would have caused direct loss of life and caused residents to leave the area to obtain food sources. Radiocarbon dating indicates a gap in human occupation for about 1,350-2,000 years. | ||||||||||||||||||||||||||||||||||||||||||||||||||||||||||||||||
|
List of 11 Events for Episode 1 at W-K1 tephra
|
||||||||||||||||||||||||||||||||||||||||||||||||||||||||||||||||
7510 BCE ± 150 years Confirmed Eruption (Explosive / Effusive)
| Episode 1 | Eruption (Explosive / Effusive) | Witori | ||||||||||||||||||
|---|---|---|---|---|---|---|---|---|---|---|---|---|---|---|---|---|---|---|---|
| 7510 BCE ± 150 years - Unknown | Evidence from Isotopic: 14C (uncalibrated) | ||||||||||||||||||
| A 14C date of 9,460 ± 150 BP was obtained from a pumice-fall deposit; the nearest source for the pumice is Witori (Johnson and Blake, 1972). | |||||||||||||||||||
|
List of 2 Events for Episode 1 at Witori
|
|||||||||||||||||||
This compilation of synonyms and subsidiary features may not be comprehensive. Features are organized into four major categories: Cones, Craters, Domes, and Thermal Features. Synonyms of features appear indented below the primary name. In some cases additional feature type, elevation, or location details are provided.
Cones |
||||
| Feature Name | Feature Type | Elevation | Latitude | Longitude |
| Pago
Bango Pango |
Cone | 724 m | 5° 34' 32.00" S | 150° 30' 56.00" E |
Craters |
||||
| Feature Name | Feature Type | Elevation | Latitude | Longitude |
| Buru | Caldera | 400 m | 5° 38' 0.00" S | 150° 32' 0.00" E |
| Witori | Caldera | 610 m | 5° 35' 0.00" S | 150° 32' 0.00" E |
Thermal |
||||
| Feature Name | Feature Type | Elevation | Latitude | Longitude |
| Kasolali
Lolatolo |
Thermal | 40 m | 5° 36' 0.00" S | 150° 36' 0.00" E |
| Namagura | Thermal | 5° 37' 0.00" S | 150° 36' 0.00" E | |
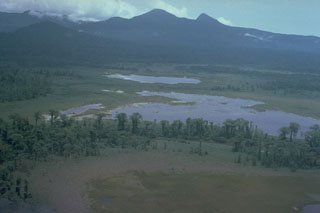 Pago, the flat-topped peak on the center horizon, is a young post-caldera edifice that may have been constructed less than 350 years ago within the 5.5 x 7.5 km Witori caldera. Extensive pyroclastic flows accompanied caldera formation about 3,300 years ago. The low-angled outer slopes of Witori, seen here from the S, consist primarily of pyroclastic flow and airfall deposits produced during a series of five major explosive eruptions from about 5,600 to 1,200 years ago.
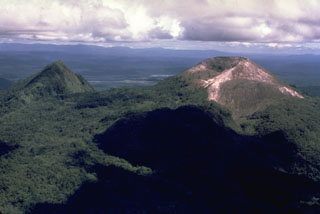 Pago (right), seen here from the N, is a young cone that was constructed within the 5.5 x 7.5 km Witori caldera. Caldera formation occurred about 3,300 years ago and was accompanied by voluminous pyroclastic flows. Pago, which may have formed less than 350 years ago, has grown to a height above the caldera rim. The vegetated lava flow that descends to the left between Pago and the peak to the left was emplaced during a 1911-18 eruption. The 5-km-long lava flow banked against the eastern caldera rim.
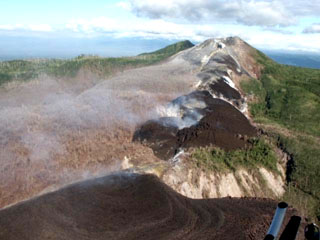 Recently-emplaced lava flows are seen along a SSE line of vents leading towards the summit of Pago in this 16 September 2002 view. The Pago cone that was constructed within the 5.5 x 7.5 km Witori caldera, which formed around 3,300 years ago. Since its formation a few hundred years ago the cone has grown to a height above the caldera rim. A series of ten lava flows, one of which underlies the area of scorched vegetation left of the 2002 lava flows, cover much of the caldera floor.
There are no samples for Witori in the Smithsonian's NMNH Department of Mineral Sciences Rock and Ore collection.
| Copernicus Browser | The Copernicus Browser replaced the Sentinel Hub Playground browser in 2023, to provide access to Earth observation archives from the Copernicus Data Space Ecosystem, the main distribution platform for data from the EU Copernicus missions. |
| MIROVA | Middle InfraRed Observation of Volcanic Activity (MIROVA) is a near real time volcanic hot-spot detection system based on the analysis of MODIS (Moderate Resolution Imaging Spectroradiometer) data. In particular, MIROVA uses the Middle InfraRed Radiation (MIR), measured over target volcanoes, in order to detect, locate and measure the heat radiation sourced from volcanic activity. |
| MODVOLC Thermal Alerts | Using infrared satellite Moderate Resolution Imaging Spectroradiometer (MODIS) data, scientists at the Hawai'i Institute of Geophysics and Planetology, University of Hawai'i, developed an automated system called MODVOLC to map thermal hot-spots in near real time. For each MODIS image, the algorithm automatically scans each 1 km pixel within it to check for high-temperature hot-spots. When one is found the date, time, location, and intensity are recorded. MODIS looks at every square km of the Earth every 48 hours, once during the day and once during the night, and the presence of two MODIS sensors in space allows at least four hot-spot observations every two days. Each day updated global maps are compiled to display the locations of all hot spots detected in the previous 24 hours. There is a drop-down list with volcano names which allow users to 'zoom-in' and examine the distribution of hot-spots at a variety of spatial scales. |
|
WOVOdat
Single Volcano View Temporal Evolution of Unrest Side by Side Volcanoes |
WOVOdat is a database of volcanic unrest; instrumentally and visually recorded changes in seismicity, ground deformation, gas emission, and other parameters from their normal baselines. It is sponsored by the World Organization of Volcano Observatories (WOVO) and presently hosted at the Earth Observatory of Singapore.
GVMID Data on Volcano Monitoring Infrastructure The Global Volcano Monitoring Infrastructure Database GVMID, is aimed at documenting and improving capabilities of volcano monitoring from the ground and space. GVMID should provide a snapshot and baseline view of the techniques and instrumentation that are in place at various volcanoes, which can be use by volcano observatories as reference to setup new monitoring system or improving networks at a specific volcano. These data will allow identification of what monitoring gaps exist, which can be then targeted by remote sensing infrastructure and future instrument deployments. |
| Volcanic Hazard Maps | The IAVCEI Commission on Volcanic Hazards and Risk has a Volcanic Hazard Maps database designed to serve as a resource for hazard mappers (or other interested parties) to explore how common issues in hazard map development have been addressed at different volcanoes, in different countries, for different hazards, and for different intended audiences. In addition to the comprehensive, searchable Volcanic Hazard Maps Database, this website contains information about diversity of volcanic hazard maps, illustrated using examples from the database. This site is for educational purposes related to volcanic hazard maps. Hazard maps found on this website should not be used for emergency purposes. For the most recent, official hazard map for a particular volcano, please seek out the proper institutional authorities on the matter. |
| IRIS seismic stations/networks | Incorporated Research Institutions for Seismology (IRIS) Data Services map showing the location of seismic stations from all available networks (permanent or temporary) within a radius of 0.18° (about 20 km at mid-latitudes) from the given location of Witori. Users can customize a variety of filters and options in the left panel. Note that if there are no stations are known the map will default to show the entire world with a "No data matched request" error notice. |
| UNAVCO GPS/GNSS stations | Geodetic Data Services map from UNAVCO showing the location of GPS/GNSS stations from all available networks (permanent or temporary) within a radius of 20 km from the given location of Witori. Users can customize the data search based on station or network names, location, and time window. Requires Adobe Flash Player. |
| DECADE Data | The DECADE portal, still in the developmental stage, serves as an example of the proposed interoperability between The Smithsonian Institution's Global Volcanism Program, the Mapping Gas Emissions (MaGa) Database, and the EarthChem Geochemical Portal. The Deep Earth Carbon Degassing (DECADE) initiative seeks to use new and established technologies to determine accurate global fluxes of volcanic CO2 to the atmosphere, but installing CO2 monitoring networks on 20 of the world's 150 most actively degassing volcanoes. The group uses related laboratory-based studies (direct gas sampling and analysis, melt inclusions) to provide new data for direct degassing of deep earth carbon to the atmosphere. |
| Large Eruptions of Witori | Information about large Quaternary eruptions (VEI >= 4) is cataloged in the Large Magnitude Explosive Volcanic Eruptions (LaMEVE) database of the Volcano Global Risk Identification and Analysis Project (VOGRIPA). |
| EarthChem | EarthChem develops and maintains databases, software, and services that support the preservation, discovery, access and analysis of geochemical data, and facilitate their integration with the broad array of other available earth science parameters. EarthChem is operated by a joint team of disciplinary scientists, data scientists, data managers and information technology developers who are part of the NSF-funded data facility Integrated Earth Data Applications (IEDA). IEDA is a collaborative effort of EarthChem and the Marine Geoscience Data System (MGDS). |

