Report on Spurr (United States) — August 1992
Bulletin of the Global Volcanism Network, vol. 17, no. 8 (August 1992)
Managing Editor: Lindsay McClelland.
Spurr (United States) Third brief explosive episode ejects large cloud
Please cite this report as:
Global Volcanism Program, 1992. Report on Spurr (United States) (McClelland, L., ed.). Bulletin of the Global Volcanism Network, 17:8. Smithsonian Institution. https://doi.org/10.5479/si.GVP.BGVN199208-313040
Spurr
United States
61.299°N, 152.251°W; summit elev. 3374 m
All times are local (unless otherwise noted)
An explosive eruption from the S flank's Crater Peak occurred during the night of 16-17 September. Significant deep seismicity followed by episodes of shallow tremor had prompted AVO to warn of renewed activity a week earlier. Little or no apparent precursory seismicity was associated with the most recent explosive episode on 18 August, but seismic activity began to increase 10 months before the initial explosion on 27 June.
AVO personnel visited Crater Peak vent on 16 September and detected no obvious increase in thermal activity or seismicity by late afternoon. Seismic activity began to build on stations near Spurr at about 1930, and another significant increase occurred at 2226. The eruption's first phase began at 2236, and one minute later, ash was seen at 4.5 km altitude from an aircraft. The initial activity lasted until 2252, when strong volcanic tremor declined. An hour of relative quiescence followed, although a pilot reported glow over the Crater Peak area and a dark plume moving NE at 2311. Another pilot report at 2345 indicated that the cloud had reached 10.5-12 km altitude, but it was not evident on National Weather Service (NWS) radar.
The second, more vigorous phase began suddenly at 0003. Seismicity continued to increase steadily, and between 0008 and 0018 the seismic station on the rim of Crater Peak was destroyed. NWS radar first detected the ash cloud at 0017, indicating a maximum altitude of 12 km by 0048 and 13.5-15 km by 0115 (figure 8). Eruption seismicity reached its maximum intensity at 0130, remaining constant until sporadic changes in amplitude began about 0215. At 0308, a M 2.0 earthquake occurred at 11 km depth and was followed by an abrupt decrease in tremor.
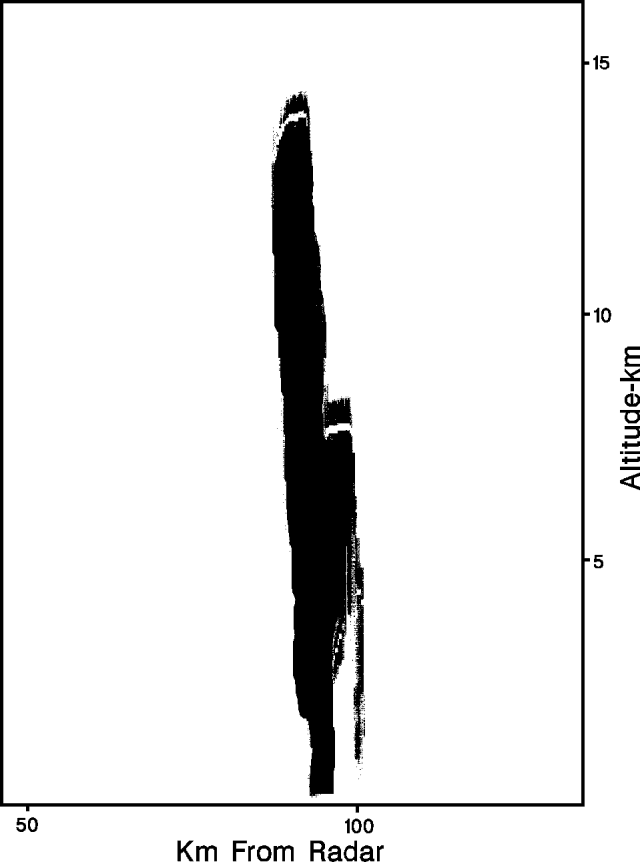 |
Figure 8. Radar image showing a vertical profile of the eruption column from Spurr on 17 September at 0226, 16 minutes after the map view in figure 9. The color version of the image shows varying radar reflectivities within the plume, densest at the core, lowest on the fringes. Declining reflectivity at the plume's center begins roughly 1 km from the top. Range-Height Indicator data are from the Enterprise Electronics WSR74C, 5-cm radar operated by the NWS at Kenai, Alaska, about 80 km from the volcano. Courtesy of Richard Hutcheon and Dale Eubanks. |
The plume moved ENE to NE of Spurr (figure 9) where ashfall was reported from communities out as far as Beaver Creek near the Canadian border, almost 600 km away. The ash was 3 mm thick in Willow (130 km NE) and formed two distinctly colored layers like those of the 18 August deposit. Effects in Anchorage were limited to a very fine dusting of ash and hazy conditions in parts of the city. Anchorage International Airport was not closed, but some flights were rerouted or cancelled during the night.
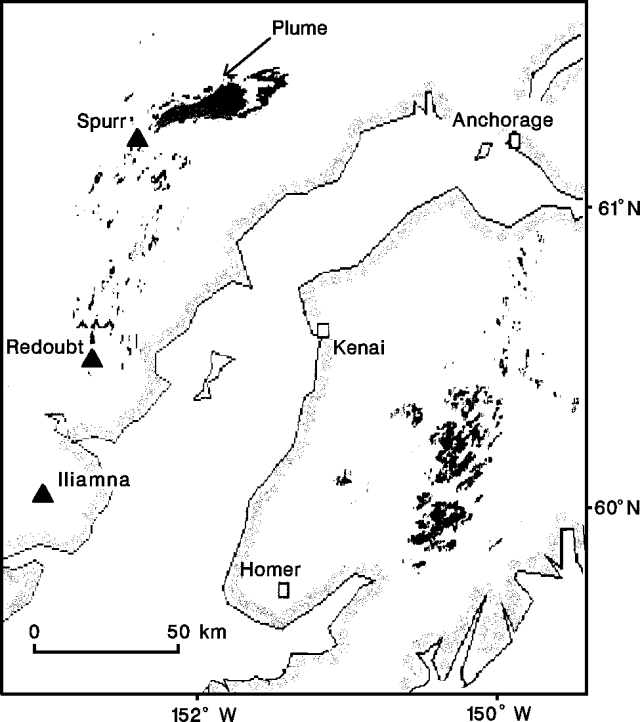 |
Figure 9. Radar image showing a map view of the Spurr plume on 17 September at 0210, about 15 minutes before the vertical profile in figure 8. Plan-Position Indicator data are from the Enterprise Electronics WSR74C, 5-cm radar operated by the NWS at Kenai, Alaska, about 80 km from the volcano. Courtesy of Richard Hutcheon and Dale Eubanks. |
An AVO helicopter overflight the next morning revealed that multiple, dark, lithic-rich mudflows had moved down the S flank of Crater Peak. The largest had reached the Chakachatna River 5 km from the vent. A temporary dam formed on the river, but was breached by 1000. Hot pyroclastic avalanches had traveled down the E side of the cone across the W arm of the Kidzageni Glacier, causing significant melting and erosion of the ice.
Vigorous steaming continued after the eruptive episode, producing a plume that reached 6 km altitude on the morning of 18 September. Volcanic tremor of variable amplitude persisted, declining more gradually than after the 27 June and 18 August episodes. Two earthquakes occurred at about 30 km depth during the night of 18-19 September. AVO noted that magma may remain at shallow depth, and a minor eruption could occur with little warning.
The TOMS on the Nimbus-7 satellite detected 190 kilotons of SO2 in a plume of about 290 km2 over the SW Yukon Territory, Canada, roughly 10.5 hours after the onset of strong activity (figure 10). Similar SO2 amounts were measured following the 27 June eruption. Revised maximum values for the 18 August cloud were about 50% larger, at roughly 300 kilotons. The leading edge of the S02 plume was about 1,400 km from the volcano on the initial TOMS image. A day later, the SO2 plume remained relatively compact and was centered over the Dakotas, roughly 3,500 km from Spurr. A more elongate plume was visible on satellite imagery. Airplane pilots reported ash NW of Regina, Saskatchewan (one layer about 600 m thick, centered at 9 km altitude, and a more intense layer to 11.5 km), near Calgary, Alberta (6.5-7.5 km), near Pierre, South Dakota (10-12.5 km), and later in the day near Mason City, Iowa (13 km), Chicago, and from Milwaukee to Windsor, Ontario (8 km). On 19 September, a 1500-km crescent-shaped zone of enhanced SO2 extended across eastern Canada from Lake Ontario to E of Hudson Bay, 4500-5000 km from Spurr. This zone corresponded very closely with the densest portion of the cloud on weather satellite imagery, which also showed a zone of more diffuse ash extending a few hundred kilometers beyond the densest material. Pilot reports indicated that the base of the cloud was at about 6 km altitude, and most aircraft were flying below that level to avoid it. Maximum reported elevations were about 10 km. The leading edge of the SO2 plume reached the W coast of Greenland 20 September, and a little SO2 was still evident over E Greenland on 21 September.
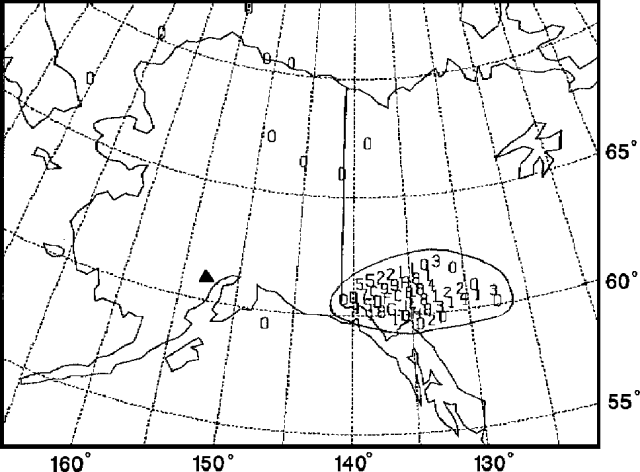 |
Figure 10. Image of the SO2 cloud from Spurr as detected by the Nimbus-7 satellite's Total Ozone Mapping Spectrometer on 17 September at 1047, about 10.5 hours after the onset of strong activity. Values of SO2 in each 50 x 50-km pixel are shown on a relative scale of 0-9, then upward through alphabetic characters with increasing concentration. Spurr is marked with a solid triangle. Courtesy of Gregg Bluth. |
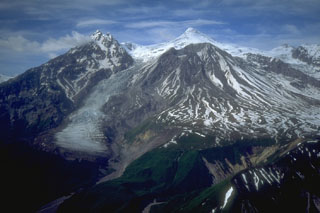
Geological Summary. Mount Spurr is the closest volcano to Anchorage, Alaska (130 km W) and just NE of Chakachamna Lake. The summit is a large lava dome at the center of a roughly 5-km-wide amphitheater open to the south formed by a late-Pleistocene or early Holocene debris avalanche and associated pyroclastic flows that destroyed an older edifice. The debris avalanche traveled more than 25 km SE, and the resulting deposit contains blocks as large as 100 m in diameter. Several ice-carved post-collapse cones or lava domes are present. The youngest vent, Crater Peak, formed at the southern end of the amphitheater and has been the source of about 40 identified Holocene tephra layers. Eruptions from Crater Peak in 1953 and 1992 deposited ash in Anchorage.
Information Contacts: AVO; SAB, NOAA/NESDIS; G. Bluth, NASA GSFC; Richard Hutcheon and D. Eubanks, NWS, Anchorage.