Report on Atmospheric Effects (1995-2001) — February 1996

Atmospheric Effects (1995-2001)
Bulletin of the Global Volcanism Network, vol. 21, no. 2 (February 1996)
Managing Editor: Richard Wunderman.
Atmospheric Effects (1995-2001) Lidar data from Cuba, Germany, and Hawaii; aerosol layer with unknown source
Please cite this report as:
Global Volcanism Program, 1996. Report on Atmospheric Effects (1995-2001) (Wunderman, R., ed.). Bulletin of the Global Volcanism Network, 21:2. Smithsonian Institution.
Atmospheric Effects (1995-2001)
All times are local (unless otherwise noted)
Colorful twilights of long duration have been reported since late September 1995 by observers in England and across the United States in Florida, Maryland, Kentucky, Arkansas, Texas, New Mexico, Colorado, California and Hawaii (F. M. Mims III and others, 1996). This report describes information compiled by Mims and co-authors and includes lidar backscatter data from sites in Cuba, Germany, and Hawaii (figure 1 and table 5). Lidar values are similar to those from earlier in 1995 (Bulletin v. 20, nos. 7 and 10).
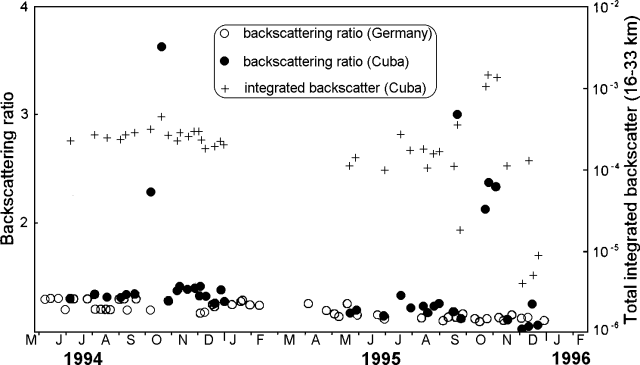 |
Figure 1. Lidar backscattering in 1994 and 1995 for Camagüey, Cuba and Garmisch-Partenkirchen, Germany (see table 1 for details). Data courtesy of Rene Estevan and Horst Jäger; plot courtesy of Forrest Mims III. |
Table 5. Lidar data from Cuba and Germany showing altitudes of aerosol layers; some layers have multiple peaks. Backscattering ratios are for the Nd-YAG wavelength of 0.53 microns, with equivalent ruby values (0.69 microns) in parentheses for data from Germany. The integrated value shows total backscatter, expressed in steradians^-1, integrated over 300-m intervals from 16-33 km for Cuba and from the tropopause to 30 km at Garmisch-Partenkirchen. Courtesy of Rene Estevan and Horst Jäger.
| DATE | LAYER ALTITUDE (km) (peak) | BACKSCATTERING RATIO | BACKSCATTERING INTEGRATED |
| Camaguey, Cuba (21.2°N, 77.5°W) | |||
| 28 Jul 1995 | 15.1 (21.4) | 1.23 | 1.75 x 10⁻⁴ |
| 28 Jul 1995 | 15.1 (22.0) | 1.21 | -- |
| 13 Aug 1995 | 15.4 (23.8) | 1.24 | 1.79 x 10⁻⁴ |
| 18 Aug 1995 | 16.0 (20.5) | 1.18 | 1.04 x 10⁻⁴ |
| 26 Aug 1995 | 13.9 (19.9) | 1.24 | 1.58 x 10⁻⁴ |
| 26 Aug 1995 | 13.9 (20.0) | 1.31 | -- |
| 30 Aug 1995 | 14.5 (22.6) | 1.26 | 1.69 x 10⁻⁴ |
| 15 Sep 1995 | 16.6 (18.4) | 1.20 | 1.10 x 10⁻⁴ |
| 15 Sep 1995 | 16.6 (21.1) | 1.17 | -- |
| Garmisch-Partenkirchen, Germany (47.5°N, 11.0°E) | |||
| 10 Aug 1995 | 10-28 (19.8) | 1.13 (1.3) | -- |
| 04 Sep 1995 | 11-26 (17.9) | 1.11 (1.2) | -- |
| 09 Sep 1995 | 10-27 (18.2) | 1.14 (1.3) | -- |
| 18 Sep 1995 | 11-33 (18.4) | 1.14 (1.3) | -- |
| 26 Sep 1995 | 13-27 (18.4) | 1.17 (1.3) | -- |
| 09 Oct 1995 | 14-32 (18.5) | 1.13 (1.3) | -- |
| 15 Oct 1995 | 11-27 (19.0) | 1.10 (1.2) | -- |
| 23 Oct 1995 | 13-29 (17.5) | 1.13 (1.3) | -- |
| 05 Nov 1995 | 9-32 (16.3) | 1.14 (1.3) | -- |
| 11 Nov 1995 | 11-31 (18.1) | 1.11 (1.2) | -- |
| 20 Nov 1995 | 11-29 (17.3) | 1.16 (1.3) | -- |
| 01 Dec 1995 | 8-32 (17.4) | 1.13 (1.3) | -- |
| 09 Dec 1995 | 11-31 (14.9) | 1.14 (1.3) | -- |
| 28 Dec 1995 | 10-27 (16.5) | 1.11 (1.2) | -- |
| Mauna Loa, Hawaii (19.5°N, 155.6°W) | |||
| 01 Aug 1995 | 16-27 (22.0) | 1.38 | 0.93 x 10⁻⁴ |
| 08 Aug 1995 | 16-27 (22.0) | 1.31 | 0.61 x 10⁻⁴ |
| 16 Aug 1995 | 16-27 (22.0) | 1.35 | 0.71 x 10⁻⁴ |
| 23 Aug 1995 | 16-27 (22.3) | 1.27 | 0.59 x 10⁻⁴ |
| 31 Aug 1995 | 16-27 (22.0) | 1.32 | 0.67 x 10⁻⁴ |
| 12 Sep 1995 | 16-26 (21.7) | 1.31 | 0.53 x 10⁻⁴ |
| 12 Oct 1995 | 16-26 (23.2) | 1.28 | 0.74 x 10⁻⁴ |
Visual observations from both the ground and commercial aircraft of colorful twilights and a prominent solar aureole suggest a stratospheric cloud now extends from about 20 to 37°N. The origin of the scattering aerosols is presently unknown. Many of the twilights last fall and winter had a duration of 45-60 minutes, which implies an altitude for the aerosols of ~23-35 km. Photographs of the twilights closely resemble images of El Chichón and Pinatubo twilights.
Increased aerosol optical thickness (AOT) has been measured at two sites (Seguin, Texas, and San Diego, California) where extended twilights have been reported. (The optical thickness is equal to the negative natural logarithm of the attenuation of incident light, or Tau = -ln(I/Io), where I and Io are the initial and final light intensity, respectively.) The lowest AOT (1.003 µm) at Seguin, Texas, during winter 1995-96 was 0.03 higher, double the smallest AOT during the previous two winters (figure 2).
 |
Figure 2. Aerosol optical thickness (AOT) at 1.003 microns from 23 September 1989 to 27 March 1996 measured at Seguin, Texas USA. The data show both the seasonal cycle (greatest optical clarity in winter, least in summer) and the volcanic perturbation from Pinatubo. Courtesy of Forrest M. Mims III. |
Visual and AOT observations of the aerosol cloud have been corroborated by lidar measurements in Cuba from September-December 1995 (figure 1 and table 5). Several episodes of unusually high total integrated backscatter at 16-33 km occurred during this period. Finally, backscatter data from Germany confirm visual and Sun photometer observations that the new aerosol has not reached 47.5°N.
Reference. Mims, F.M., III, Meinel, C., Roosen, R.G., Russell, R.T., Hawkins, G.P., and Easton, H., 1996, Stratospheric aerosol cloud of unknown origin: unpublished manuscript.
Information Contacts: Horst Jäger, Fraunhofer -- Institut für Atmosphärische Umweltforschung, Kreuzeckbahnstrasse 19, D-8100 Garmisch-Partenkirchen, Germany; Forrest M. Mims III, Sun Photometer Atmospheric Network (SPAN), 433 Twin Oak Rd., Seguin, TX 78155 USA; Rene Estevan and Juan Carlos Antuña, Centro Meteorologico de Camagüey, Apartado 134, Camagüey 70100, Cuba [J.C.A is presently at Univ. Maryland, Dept. of Meteorology, College Park, MD 20742 USA]; John Barnes, Mauna Loa Observatory, P.O. Box 275, Hilo, HI 96720 USA.