Report on Soufriere Hills (United Kingdom) — February 1997
Bulletin of the Global Volcanism Network, vol. 22, no. 2 (February 1997)
Managing Editor: Richard Wunderman.
Soufriere Hills (United Kingdom) Dome growth and pyroclastic flows continue; alert status downgraded
Please cite this report as:
Global Volcanism Program, 1997. Report on Soufriere Hills (United Kingdom) (Wunderman, R., ed.). Bulletin of the Global Volcanism Network, 22:2. Smithsonian Institution. https://doi.org/10.5479/si.GVP.BGVN199702-360050
Soufriere Hills
United Kingdom
16.72°N, 62.18°W; summit elev. 915 m
All times are local (unless otherwise noted)
The following condenses the daily and weekly Scientific Reports of the Montserrat Volcano Observatory (MVO) for the period 9 February-8 March 1997. This interval was characterized by continued dome growth on the crater's E side; late in the interval the NE side of the dome became increasingly unstable. Seismic activity was dominated by repetitive swarms of volcano-tectonic and hybrid earthquakes, with a few episodes of tremor. Also, on 17 February the alert stage at the volcano was reduced from Orange to Amber (table 13).
Table 13. Alert status codes used for Soufriere Hills volcano. Courtesy of MVO.
| Alert Code | Alert Color | Observed Phenomena |
| 0 | White | Background seismicity, no new surface manifestation of volcanic activity. |
| 1 | Yellow | Enhanced local seismic activity, ground deformation and mild phreatic activity. |
| 2 | Amber | Dome-forming eruption in progress, periodic gravitationally induced collapses including pyroclastic-flow and rockfall generation. |
| 3 | Orange | Change in style of activity anticipated within a few days. Increasing rockfall and minor pyroclastic-flow activity with associated light ashfall. |
| 4 | Red | Dome collapse under way, pyroclastic flows in valleys adjacent to area of collapse and ash to the W and NW. Explosive event distinct possibility if activity continues. |
| 5 | Purple | Ongoing explosive eruption with heavy ashfall. |
The results from a dome survey, undertaken between 18 February and 1 March, show that there was ~42 m of vertical dome growth. The highest point on the dome was measured at 942 m elevation.
Visual and satellite observations. On 10 February, near-continuous rockfalls traveled down the steep face of the dome that began extruding on 20 January (hereafter, "20 January dome"; see BGVN 20:01). Lava extruded from the E side of the dome and moved downhill as fast as it was emitted. Also, two clearly defined chutes cut into the dome's E face at rate that appeared to be equal to the extrusion rate.
Galway's Wall eroded further as dome material continued to fall over the crater wall's top and into the upper reaches of the White River. The dome material generally followed two clearly defined gullies cut into the steep face of the wall. Fresh rockfalls extended to ~50 m above the road at Galway's Soufriere (<1 km S of the dome).
A GOES-8 satellite image, acquired at 1215 on 10 February, revealed an eruption plume that extended 65 km WSW. The plume's maximum width was 10 km. Upper-air analysis suggested the plume rose to ~3,000 m. Another GOES-8 image, acquired at 1415 the same day, showed the plume extending ~120 km WSW. Analysis indicated that the plume remained below 3,000 m.
On the morning of 12 February, a large pyroclastic flow down the Tar River reached about halfway across the delta. Another flow on the evening of 14 February reached as far as the Tar River Estate House (~2 km NE of the dome).
A rockfall deposit in the White River Valley was also observed on 13 February. The deposit did not extend as far as that of 10 February, however it was more voluminous close to the base of Galway's Wall. The deposit had a lobate morphology with well-defined, gravelly levees. Several small, slow-moving, dust-generating rockfalls originated from three well-defined gullies in the top of the wall. By 15 February, the eastern side of the dome had steepened and had a flower-shaped structure with radiating pinnacles at the top of the face. On 15 February a rockfall over Galway's Wall generated a small ash cloud.
During the week of 17 February large blocks fell off the dome's face and moved slowly outwards following deep gullies. At night, incandescence emanating from the dome's face was strongest within these gullies. Galway's wall continued to degrade slowly with the three gullies in the top of the wall becoming more pronounced.
A fresh rockfall deposit observed on 17 February extended as far as the previous longest flows (~1 km from the dome). Several small pyroclastic flows were also observed during the week; most originated from the SE part of the dome and flowed into the Tar River valley. The longest pyroclastic flows reached 1.5 km on the night of 17 February.
On 18 February, the NE part of the dome showed increased activity, with several small pyroclastic flows traveling N towards Farrell's Wall. During 18-27 February the dome mainly grew vertically, rather than the outward growth of the E face that had characterized the previous weeks. On 27 February, observations revealed a small spine at the summit of the January dome. The SE flank of the dome was modified by avalanche; two large blocks, observed on the talus slope on 23 February, were no longer visible, and the deep gullies in the E face were less pronounced. Small rockfalls and pyroclastic flows continued from the N and SE flanks of the dome. One of the pyroclastic flows from the N flank sent ash over Plymouth at 1515.
During a period of increased seismicity on 28 February, several rockfalls occurred on the SE, E, and N faces of the dome. Many of the rockfalls were composed of hot material and resulted in small convective ash clouds. Slow crumbling of Galway's Wall continued, and by 1 March a fourth gully, E of the previous gullies, developed in the top of the wall. Small rockfalls continued to fall over the wall.
Between 1 and 7 March, slow upward growth of the 20 January dome continued, but at a slower rate than the previous few weeks. The NE face of the dome began to show signs of activity as rockfall gullies developed and the entire face began to crumble. Small rockfalls from the active faces of the January and October domes were nearly continuous. Some of these falls generated small pyroclastic flows with accompaning ash clouds that drifted W. Incandescence was observed at night from the active areas of the 20 January dome and gullies in the October dome. Areas of incandescence shifted throughout the week moving from the E to the N and NE faces of the dome.
Dome volume measurements. Between 20 January and 22 February dome growth was confined to the SE area of the dome within the 20 January scar. Extrusion rates varied from 2.7 to 3.2 m3/s, slightly above rates seen since June 1996.
On 1 March a survey concentrating on the 20 January dome indicated that growth since 18 February continued to be confined within the 20 January scar; extrusion was primarily vertical and the dome's height increased 38 m. Talus lying E of the dome's high point had thickened 40 m. Dome profiles from White's (figure 18) showed an increased progradation of the talus slope to the E and also indicated that lateral spreading of the dome, established in the last few weeks, continued. A wedge of the October dome, adjacent to the contact of the October and January domes, appeared to have been thrust up ~ 10 m by the recent extrusion from the 20 January dome.
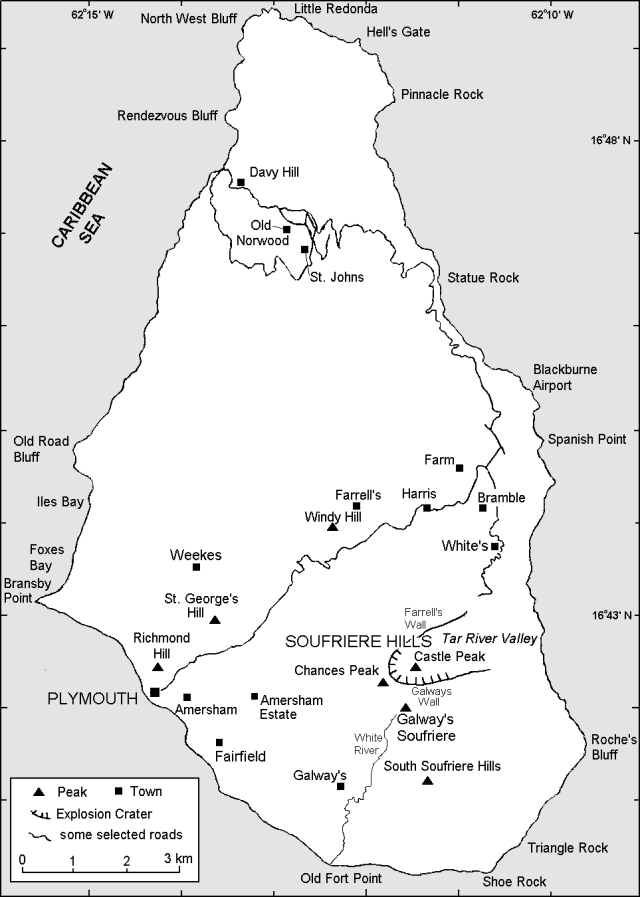 |
Figure 18. Map of Montserrat showing selected towns and features. |
The volume increase between 18 February and 1 March totalled 3.42 x 10⁶ m3. Added to the previous total amount of dome extrusion, the new total volume was 43.7 x 10⁶ m3. In terms of dense rock equivalence, the total volume of erupted magma, including pyroclastic-flow deposits, was estimated at 72 x 106 m3. The average extrusion rate for the 11-day study period was 4.37 m3/s.
Seismicity. Although seismicity was generally low, signals were predominantly attributed to rockfalls, small pyroclastic flows, volcano-tectonic and hybrid earthquakes, and occasional episodes of continuous tremor.
Earthquake swarms often began as volcano-tectonic events and led into hybrid events during the swarm' second half. Particularly towards the end of the swarms, hybrid earthquakes generally occurred every 1-2 minutes. These swarms did not culminate in periods of continuous tremor, unlike some of the swarms observed in previous weeks (BGVN 22:01). However, occasionally the hybrids joined to form short periods of high-amplitude tremor. Between 26 and 28 February three short episodes of continuous tremor were recorded, each lasting 1-2 hours.
The seismometer at Gages continued to record high-frequency tremor, previously referred to as broadband tremor (frequencies >3 Hz). This type of event has been observed throughout the eruption but has yet to be correlated to any visual phenomena.
COSPEC and other measurements. SO2 flux measurements were made on 25 January, 1- 3 March, and 5 March. The results were 217, 165, 106, 174, and 159 metric tons/day (t/d), respectively. These values are lower than the last values recorded at the beginning of February (300-700 t/d; BGVN 20:01).
SO2 diffusion-tube samples, representing the period between 29 December 1996 and 9 February, were analyzed and showed that levels of the gas remain low. This follows a trend that began during the period 1 October-29 December 1996.
Water samples showed that the rainwater directly W of the volcano continued to be acidic and contained high concentrations of certain anions (table 14). Throughout the period, pH levels at individual sample sites fluctuated only slightly. The sample collected from the overflow of the water storage tank at Fairfield (Trials Reservoir) contained anion concentrations and pH levels well within World Health Organization guidelines for drinking water.
Table 14. Rain and surface water geochemistry at Soufriere Hills, 2 March 1997. Courtesy of MVO.
| Location | pH | Conductivity (mS/cm) | Total Dissolved Solids (g/l) | Sulfates (mg/l) | Chlorides (mg/l) | Fluorides (mg/l) |
| Upper Amersham | 2.60 | 0.448 | 0.224 | 24 | 118 | >1.5 |
| Lower Amersham | 2.85 | 0.911 | 0.456 | 3 | 52 | 1.4 |
| Police HQ, Plymouth | 3.31 | 0.237 | 0.118 | 3 | 53 | 0.8 |
| Weekes | 6.20 | 0.402 | 0.201 | 3 | 44 | 0.65 |
| Trials Reservoir | 7.68 | 0.618 | 0.309 | 38 | 90 | 0.35 |
Scientists continued to monitor the two widening cracks on Chances Peak. On 11 February, Crack 1, the more easterly of the two cracks, had widened by 44 cm (2.75 cm/day average) and exhibited a dextral shear displacement of 23 cm since the last measurement on 28 January. The original crack had also developed several bifurcations and smaller subparallel cracks. Due to safety precautions, no further measurements will be made on this crack.
Crack 2, ~100 m from the hut on top of Chances Peak, had widened by 2.6 cm with a shear displacement of 6 cm. Before failing on 24 February due to ashfall, an extensometer across the crack transmitted real-time data. Much of the time the crack had opened at an average rate of 0.5 mm/day. Five periods of increased deformation also occurred, coincident with volcano-tectonic swarms (figure 19). The maximum deformation rate was 8 mm in less than 4 hours. During 28 January to 24 February, the total shear displacement along the crack was 18 cm.
 |
Figure 19. Comparison of earthquakes and the widening of Crack 2, a discontinuity near the top of Chances Peak (Soufriere Hills), 16-23 February. Crack widening is depicted on the plot as crack width (top); amount of extension (middle); the hourly number of located volcano-tectonic (VT) earthquakes (bottom). Courtesy of MVO. |
EDM measurements were made to the Chances Peak reflector on 17 February. The line from Galway's Plantation to Chances Peak had shortened by 18 mm since the last measurement on 2 December, a reduction in the rate of shortening. Measurements were also made on 19 February on the line from Amersham to Chances Steps. Results there continued to show no significant deformation.
GPS surveys of the WESTNET and EASTNET networks were carried out on 5 and 6 March, respectively. There were no significant changes in baseline length, station position, or station height, indicating an absence of a widespread strain field associated with the eruption.
On the other hand, GPS measurements at one site (FT3), 80 m NW of the dome have shown large movements. The baseline to Harris (M18) shortened by 6.5 cm between 18 January and 3 March. The station had moved radially away from the dome (to the NW) by 12.9 cm (on 3 March) and 14.5 cm (on 8 March). Since 18 January, the station height has remained stable with all occupations yielding values within 1.6 cm of one another.
Geological Summary. The complex, dominantly andesitic Soufrière Hills volcano occupies the southern half of the island of Montserrat. The summit area consists primarily of a series of lava domes emplaced along an ESE-trending zone. The volcano is flanked by Pleistocene complexes to the north and south. English's Crater, a 1-km-wide crater breached widely to the east by edifice collapse, was formed about 2000 years ago as a result of the youngest of several collapse events producing submarine debris-avalanche deposits. Block-and-ash flow and surge deposits associated with dome growth predominate in flank deposits, including those from an eruption that likely preceded the 1632 CE settlement of the island, allowing cultivation on recently devegetated land to near the summit. Non-eruptive seismic swarms occurred at 30-year intervals in the 20th century, but no historical eruptions were recorded until 1995. Long-term small-to-moderate ash eruptions beginning in that year were later accompanied by lava-dome growth and pyroclastic flows that forced evacuation of the southern half of the island and ultimately destroyed the capital city of Plymouth, causing major social and economic disruption.
Information Contacts: Montserrat Volcano Observatory (MVO), c/o Chief Minister's Office, PO Box 292, Plymouth, Montserrat (URL: http://www.mvo.ms/).