Report on Long Valley (United States) — March 2003
Bulletin of the Global Volcanism Network, vol. 28, no. 3 (March 2003)
Managing Editor: Edward Venzke.
Long Valley (United States) Summary of 2001-2002 activity; renewed inflation of the resurgent dome
Please cite this report as:
Global Volcanism Program, 2003. Report on Long Valley (United States) (Venzke, E., ed.). Bulletin of the Global Volcanism Network, 28:3. Smithsonian Institution. https://doi.org/10.5479/si.GVP.BGVN200303-323822
Long Valley
United States
37.7°N, 118.87°W; summit elev. 3390 m
All times are local (unless otherwise noted)
The following are summaries from the U.S. Geological Survey (USGS) of activity at Long Valley during 2001 (Hill, 2001) and 2002 (Hill, 2002). Summaries of activity during 1996, 1997, and 1998 are found in BGVN 22:11-22:12 and 24:06; activities during 1999 through 2000 are found in BGVN 26:07. Figure 25 shows some of the locations mentioned in this report.
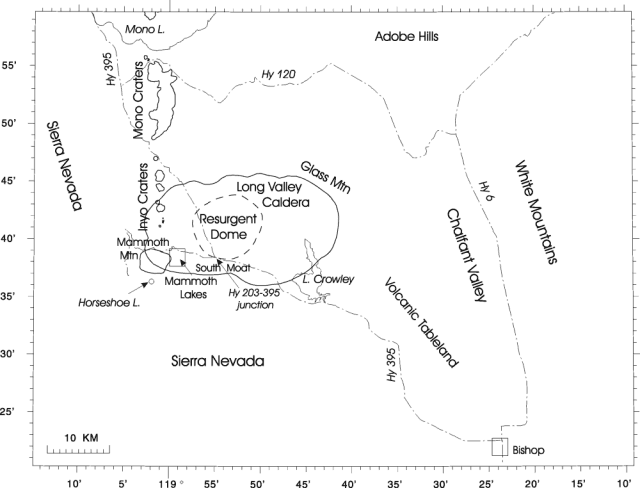 |
Figure 25. Map of the Long Valley caldera area. Courtesy of USGS. |
Summary of activity during 2001. Activity levels in Long Valley caldera and vicinity were incrementally lower in 2001 than in 2000, thus continuing the trend of extended quiescence that began toward the end of 1999. Low-level seismic activity within the caldera typically included five or fewer earthquakes per day large enough to be located by the online computer system. Most were smaller than M 2.0, and none were as large as M 3.0; the largest was a M 2.8 earthquake beneath the southern margin of the caldera 800 m N of Convict Lake on 21 May. Seismic activity in the Sierra Nevada S of the caldera continued to be concentrated within the aftershock zone of the 1998-99 sequence of three M 5 earthquakes. The 2001 activity (figure 26) included eight earthquakes of M 3.0 or larger. The largest was the M 3.4 earthquake of 2 December located near the epicenter of the M 5.6 earthquake of 15 May 1999.
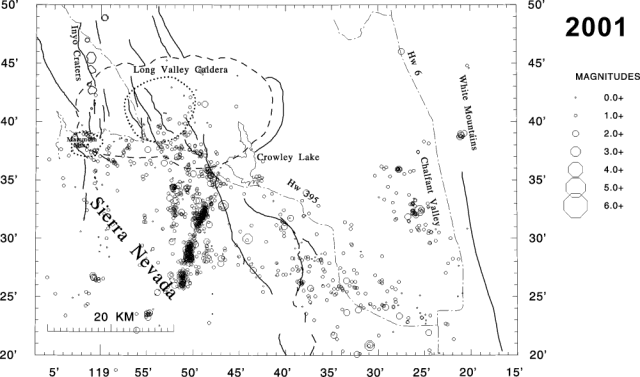 |
Figure 26. Earthquake epicenters in the Long Valley region for the year 2001. Courtesy of USGS. |
Mid-crustal long-period (LP) volcanic earthquakes continued to occur at depths of 10-25 km beneath the W flank of Mammoth Mountain (figure 27), although at a much reduced rate compared with the peak in activity in 1997-98. Some 60 LP earthquakes were detected during 2001, with over 15 of these occurring in a cluster on 10 February.
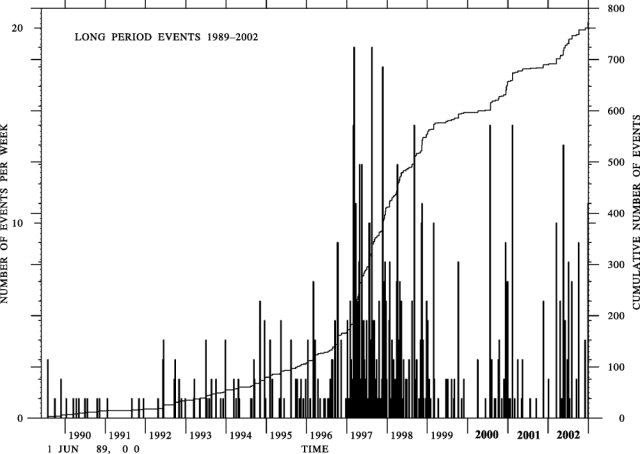 |
Figure 27. Time history of deep (depth 10-25 km) LP earthquakes in the Long Valley caldera beneath Mammoth Mountain from 1989 through 2002. Vertical bars indicate number of LP earthquakes per week (left axis) and the continuous curve shows the cumulative number of events (right axis). Courtesy of USGS. |
Deformation within the caldera was limited to continuing slow subsidence of the resurgent dome at a rate of roughly 1 cm/year. All together, the center of the resurgent dome has lost some 2 cm in elevation since inflation stopped in late 1998, leaving the center of the resurgent dome roughly 75 cm or so higher at the end of 2001 than in the late 1970's. The continuous strain and deformation monitoring networks detected no short-term deformation transients during the year. The same is true for the magnetometer networks.
The diffuse carbon dioxide (CO2) degassing at the Horseshoe Lake tree-kill area (BGVN 22:11) and other sites around the flanks of Mammoth Mountain has shown no significant change over the past several years. The total CO2 flux continued to fluctuate ~200 tons per day, with the Horseshoe Lake area contributing roughly 90 tons per day.
The lull in caldera unrest over the past couple of years has provided the Long Valley Observatory (LVO) an opportunity to look back over the wealth of data collected during the previous two decades of activity and to investigate the nature and significance of the processes driving the unrest, toward the goal of assessing future unrest episodes and their significance in terms of potential volcanic hazards. Data from the intense unrest during the 1997-98 episode in the S moat, for example, indicate that fluids (magmatic brine or perhaps magma) played a central role in this activity. This underscores the value of a closely integrating the seismic, deformation, and hydrologic monitoring efforts.
Summary of activity during 2002. Activity in 2002 was dominated by the onset of renewed inflation of the resurgent dome following nearly three years of gradual subsidence. Earthquake activity within the caldera, which remained low through the first half of the year, showed a slight increase through the second half. Of particular note was the response of the caldera to the shear and surface waves generated by the M 7.9 Denali Fault earthquake of 3 November 2002 in the form of a burst of some 60 small earthquakes beneath the S flank of Mammoth Mountain, a coincident strain transient consistent with aseismic slip on a normal fault beneath the E flank of the mountain, and an earthquake swarm the following day in the S moat that included the first M 3.0 earthquake since 1999. This is the third time Long Valley has shown a well-documented response to large, distant earthquakes, the first two being with the M 7.4 Landers earthquake of 28 June 1992 and the M 7.2 Hector Mine earthquake of 16 October 1999. No other significant changes occurred within the caldera during the year. Both the carbon dioxide flux from the flanks of Mammoth Mountain and the rate of deep long-period (LP) volcanic earthquakes beneath Mammoth Mountain showed little change from previous years. The LVO detected no very-long-period (VLP) earthquakes during 2002.
Beginning around the first of the year, both the 2-color EDM and continuous GPS data for the baselines radiating from the CASA monument turned from gradual contraction to renewed extension that persisted through the year at rate of 2.5-3.0 cm/year. This rate is comparable to extension rates that prevailed through the mid-1990's. Cumulative uplift of the center of the resurgent dome associated with this extension has returned to its 1999 value of roughly 80 cm with respect to the late 1970's.
Earthquake activity within the caldera remained low through the first half of the year averaging fewer than five earthquakes per day, most with M 2.0 (figures 27 and 28). The largest event within the caldera during this period was a M 2.8 earthquake on 15 March located in the W lobe of the S moat seismic zone, 1.6 km S of the 203-395 Highway junction. Activity increased slightly in mid-June beginning with a cluster of small earthquakes beneath the W flank of Mammoth Mountain on 26 June that included four events of about M 2. A number of small (M 2) events with the appearance of LP earthquakes occurred at shallow depths (less than 2 km) beneath the southern section of the resurgent dome during the last half of August.
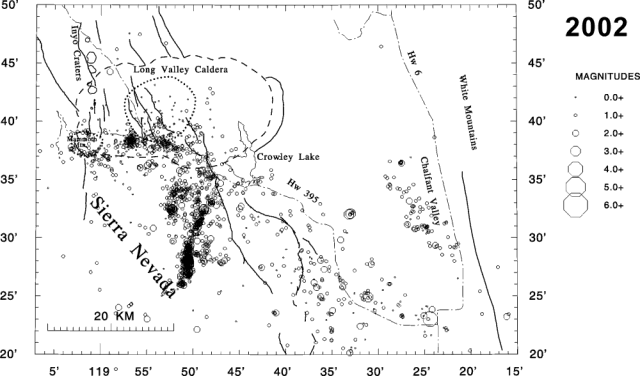 |
Figure 28. Earthquake epicenters in the Long Valley caldera region for 2002. Courtesy of USGS. |
The most notable activity began with a burst of over 60 small earthquakes of M 1 beneath the S flank of Mammoth Mountain as the surface waves generated by the M 7.9 Denali Fault, Alaska, earthquake of 3 November 2002 passed through just 17 minutes after the mainshock rupture. At the same time, the borehole dilatometers detected a 0.1-microstrain strain transient that is consistent with slow (aseismic) slip on a normal fault at a depth of about 7 km beneath the W flank of Mammoth Mountain. As with the caldera activity remotely triggered by the M 7.4 Landers earthquake of 28 June 1992 and the M 7.2 Hector Mine earthquake of 16 October 1999, this strain transient is much larger than can be explained by cumulative slip for the 60 or so earthquakes of M 1 triggered by the Denali Fault earthquake. The following day, 4 November, the largest earthquake swarm in the S moat of the caldera since 1998 developed as a sequence that included six earthquakes of M 2 and one of M 3.0. This S-moat swarm was unusual in that it occurred in a relatively aseismic section of the S moat, focal depths of the swarm earthquakes were unusually shallow (4 km), and the NNW lineations of the swarm epicenters cuts across the prevailing WNW-trend of the usual S-moat swarm activity. The latter was also true for the swarm activity triggered by the M 7.4 Landers earthquake of 1992. This S-moat earthquake swarm was not accompanied by detectable strain changes. Mid-crustal long-period (LP) earthquakes have continued at depths of 10-25 km beneath Mammoth Mountain at a fairly steady rate over the past three years. Occasional bursts of activity included 12-15 events per week.
Diffuse emission of carbon dioxide from the flanks of Mammoth Mountain showed little change from previous years. Emission rates estimated for the Horseshoe Lake tree-kill area continued to fluctuate between 50 and 150 tons of CO2 per day, with an average flux of 100 tons per day since 1995. The Horseshoe Lake area produced roughly one-third of the total CO2 flux from the flanks of Mammoth Mountain.
Values for the helium isotope ratio 3He/ 4He from samples taken in early and mid-2002 from the Mammoth Mountain Fumarole (MMF), located at 3,000 m elevation some 300 m E of the Chair 3 ski lift, averaged 5.5, or essentially the same as the 2001 values. These values are significantly higher than the 1999 value of 3.0. The increase with respect to 1999 is consistent with an increase in the magmatic component in the gas emissions from the fumarole. Whether the elevated values for 2001-2002 are related to the very-long-period (VLP) volcanic earthquakes that occurred at a depth of 3 km beneath the summit of Mammoth Mountain in July and August of 2000 remains to be seen.
Seismic activity in the region surrounding Long Valley caldera continued to be dominated by earthquakes in the SSW-trending aftershock zone of the June and July 1998 and the May 1999 earthquakes in the Sierra Nevada S of the caldera. Activity within this aftershock zone included a cluster of earthquakes near the southern end of the zone centered just E of Grinnell Lake that began on 6 June and persisted through the end of the month. Elsewhere, a M 3.7 earthquake on 15 July just 3.2 km NNW of Bishop produced felt shaking throughout the Bishop area. Earthquakes of M 2.9 and 3.5 on 12 December were located beneath the Volcanic Tableland 19 km NNW of Bishop.
An updated revision of the USGS Response Plan for Volcanic Unrest in the Long Valley Caldera - Mono Craters Region, California was released in March 2002 as USGS Bulletin 2185. This bulletin is available in print and in electronic form at ttp://geopubs.wr.usgs.gov/bulletin/b2185/.
References. Hill, D.P., 2001, Long Valley Observatory quarterly report October-December 2001 and annual summary for 2001: Long Valley Observatory, U.S. Geological Survey, Menlo Park, CA (URL: http://lvo.wr.usgs.gov/Annual/lvc_01.html).
Hill, D.P., 2002, Long Valley Observatory quarterly report July-September and October-December 2002 and annual summary for 2002: Long Valley Observatory, U.S. Geological Survey, Menlo Park, CA (URL: http://lvo.wr.usgs.gov/Quarterly/qrt_rpt3-4-02.html).
Geological Summary. The large 17 x 32 km Long Valley caldera east of the central Sierra Nevada Range formed as a result of the voluminous Bishop Tuff eruption about 760,000 years ago. Resurgent doming in the central part of the caldera occurred shortly afterwards, followed by rhyolitic eruptions from the caldera moat and the eruption of rhyodacite from outer ring fracture vents, ending about 50,000 years ago. During early resurgent doming the caldera was filled with a large lake that left strandlines on the caldera walls and the resurgent dome island; the lake eventually drained through the Owens River Gorge. The caldera remains thermally active, with many hot springs and fumaroles, and has had significant deformation, seismicity, and other unrest in recent years. The late-Pleistocene to Holocene Inyo Craters cut the NW topographic rim of the caldera, and along with Mammoth Mountain on the SW topographic rim, are west of the structural caldera and are chemically and tectonically distinct from the Long Valley magmatic system.
Information Contacts: David Hill, Long Valley Observatory, Volcano Hazards Program, U.S. Geological Survey, 345 Middlefield Rd., MS 977, Menlo Park, CA 94025, USA (URL: https://volcanoes.usgs.gov/observatories/calvo/).