Report on Anatahan (United States) — May 2003
Bulletin of the Global Volcanism Network, vol. 28, no. 5 (May 2003)
Managing Editor: Edward Venzke.
Anatahan (United States) Nearly continuous ash plumes through May
Please cite this report as:
Global Volcanism Program, 2003. Report on Anatahan (United States) (Venzke, E., ed.). Bulletin of the Global Volcanism Network, 28:5. Smithsonian Institution. https://doi.org/10.5479/si.GVP.BGVN200305-284200
Anatahan
United States
16.35°N, 145.67°E; summit elev. 790 m
All times are local (unless otherwise noted)
The explosive eruption that began on 10 May is the first documented eruption from Anatahan in historical time. There were no residents on the island due to their evacuation following a shallow earthquake swarm in 1990 (Moore and others, 1994), and another in 1993 (Sako and others, 1995). Anatahan is a composite volcano that erupts lavas that are primarily dacitic in composition. It has the largest caldera of the volcanoes in the Commonwealth of the Northern Mariana Islands (CNMI). The presence of this caldera indicates that large explosive eruptions are possible.
Strong activity continued over the next few days (BGVN 28:04), with high ash plumes seen in satellite imagery. The area within ~55 km of the island was also placed off-limits to all boats and aircraft not approved by the CNMI Emergency Management Office (EMO). A smaller but nearly continuous eruption column rose from the E crater of Anatahan for the next several weeks. Activity was continuing in early July, but at low levels.
The EMO invited USGS scientists to provide assistance in tracking the volcano's activity and assessing potential hazards shortly after the eruption began. USGS scientists first arrived in Saipan on 30 May to work directly with EMO officials to install and maintain monitoring equipment and interpret data from overflights and a single seismometer operating on Anatahan. This station became operational on 5 June.
Beginning of the eruption, 10-12 May 2003. On 6 May researchers from Washington University, Scripps Institution of Oceanography, and the EMO aboard the MV Super Emerald deployed a seismograph on Anatahan as part of a joint US-Japan Mariana Subduction Imaging Experiment, which is funded by the National Science Foundation. There were no indications of an impending eruption. During the night of 10-11 May the ship was again approaching Anatahan when scientists observed a tremendous lightning display ahead. As morning broke, they saw a pillar of steam and ash billowing to an altitude of 9 km. The ship had to detour around the island to avoid the ashfall.
Initial reports indicated that the eruption began around 2100 on 10 May. Satellite data interpreted by the Washington Volcanic Ash Advisory Center (VAAC) showed that the eruption appeared to have started by 1730. An ash plume was clearly visible in imagery at 2232, resulting in an advisory being issued to the aviation community at 2300 (1300 UTC). Plume heights were reported to be 10-12 km in the early stages of the eruption, with one ash advisory indicating ash to 13.4 km altitude on the 11th. At times multiple clouds were moving in different directions at different altitudes.
On 13 May Joe Kaipat from the CNMI Emergency Management Office (EMO) and seismologist Doug Weins (Washington University) flew to Sarigan (6.5 km W of Anatahan) to retrieve seismic data from a broadband instrument installed on 6 May. Records from the Sarigan station showed increased seismicity commencing at about 1300 on 10 May. The activity remained very strong for about 36 hours before decreasing.
Activity during 13-30 May 2003. A helicopter overflight on 13 May showed that the island was still erupting, but with less intensity than on 11 May. Large volcanic bombs were observed flying high in the air over the crater region, and the whole W side of the island was covered with ash, including the seismograph site. The village appeared to have 15-30 cm of ash (figure 5). Ash advisories for 13-14 May reported that a dense ash cloud was drifting W away from the island, but that it was not continuous and varied in size. Ash plumes through 17 May generally drifted NW or WNW. The eruption clouds through May after the initial activity were generally below ~6 km.
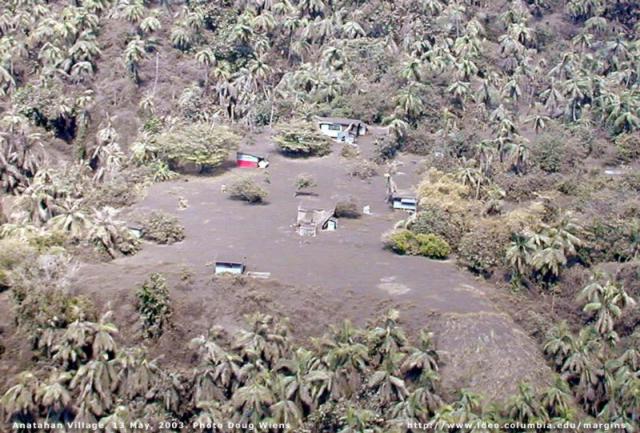 |
Figure 5. The village on Anatahan covered with ash, 13 May 2003. The recently deployed seismograph is barely visible in the clearing to the left. Note the ash on the roofs. Courtesy of Doug Weins. |
On 18 May the EMO group took an overflight accompanied by David Hilton (Scripps Institution of Oceanography) and Tobias Fischer (University of New Mexico). They reported a rising plume comprised of steam and ash. The cloud was much lighter in color, with a reduced ash component compared to the initial phases of the eruption. Bombs, possibly up to several meters in size, were being tossed into the air; most fell back into the E crater. The ash was being blown W, but most of the ashfall was still on the E side of the island. The team landed on the E side of the island and deployed a PS- 2 seismometer that appears to have recorded earthquakes and some tremor. At that site they found ejecta thought to be from the initial stage of the eruption. The ground/vegetation near and under the ejecta was not scorched. Most of the material appeared to be non- juvenile. The largest fragments were up to 50 cm across. The team heard "booms" coming from the crater.
The ongoing explosive activity excavated a deep crater within Anatahan's E crater. Scientists estimated the inner crater was nearly at sea level by about 20 May; before the eruption, the floor of the E crater was 68 m above sea level. On 20 May the EMO group took an overflight and installed a telemetered seismic station. Pressure waves from detonations in the E crater were felt on the E flank. From a helicopter the team also observed rocks several meters across being thrown up above the E crater rim and falling back into the crater. Ash continued to fall on the western two-thirds of the island and out to sea. The ash cloud size and length was variable during 17-23 May; it continued in general to drift WNW from the island, at times spreading over a wide area.
On 23-24 May, typhoon Chan-hom shifted the prevailing east winds to the S, blowing the eruption column toward Saipan and Guam. Light ashfall resulted in flight cancellations and the closure of the Saipan and Guam international airports. Residents of Saipan reported a rotten egg smell associated with the ashfall. The report from Saipan was that 1-2 mm of ash had fallen on the island.
EMO personnel took an overflight on 27 May and reported that ash cloud heights reached 3 km, significantly lower than during the first few days of the eruption. The ash cloud was more opaque and laden with ash; the color was closer to that of 10-11 May than more recent plumes. The streaming ash cloud, still exhibiting variable size and length, drifted NW and NNW through 29 May.
Fieldwork on 21 May 2003. Hilton and Fischer arrived by ship at Anatahan at approximately 0630 on 21 May. The activity level was similar to that on their visit 2 days earlier. The ship sailed through the ashfall out to the SW side of the island, and continued along the W coast. The W coast was draped in ash; vegetation was completely covered giving the island a gray pallor. They landed at 0815 and spent ~4 hours ashore. A trench through the recent deposits on the beach area exposed a 25-cm section from the present eruptive phase with three main layers. The lowermost layer consisted of ~5 cm of fine-grained ash. Next was a layer ~15 cm thick comprised of accretionary lapilli with some fine ash. At the top was a 5-cm-thick layer that was a mixture of coarser grained ash and angular clasts of scoriaceous material. The abandoned village, where a team led by Patrick Shore (Washington University) was working on the seismic station installed on 6 May, was similarly covered in ash with many buildings having collapsed roofs. Two sections also revealed initial ash, covered by accretionary lapilli, then a mixture of ash and scoriaceous material. Pumice was floating in water-collection vessels by the buildings.
From the ship the scientists set up the COSPEC instrument and started a traverse through the plume around 1330. The telescope was oriented vertically and the ship made a N-to-S transect through the volcanic plume at a distance of ~1.5 km from shore. Sulfur dioxide (SO2) in the plume was recorded immediately. The transect took 50 minutes until no SO2 was being detected. In addition, they sailed through the ash fallout. During the traverse, the volcano erupted every 5 minutes with a deep resonating boom. The width of the volcanic plume was ~6 km and its direction was to the SW. From the COSPEC measurements and wind speed data provided by NOAA, the SO2 flux was estimated to be 3,000-4,500 metric tons/day. As the group sailed away from the island around 1430 there was a very large eruption with a significantly louder "boom" than had been heard previously, followed by a dark billowing ash-laden plume.
MODVOLC Thermal Alerts. Thermal satellite observations of the current eruption of Anatahan provided by the HIGP MODIS Thermal Alert Team (http://modis.higp.hawaii.edu) confirmed that activity was heavily concentrated in the E crater (figure 6). The most recent hot-spot (as of 1700 UTC on 28 May) was observed on 24 May. The large amounts of ash produced during the eruption will have obscured some thermal anomalies from the MODIS sensor. Plumes were clearly visible on MODIS imagery on 14, 21, 22, 25, 26, 28, and 30 May (figure 7). The persistent, long plume from this island volcano was frequently detected in imagery from a wide variety of satellite platforms.
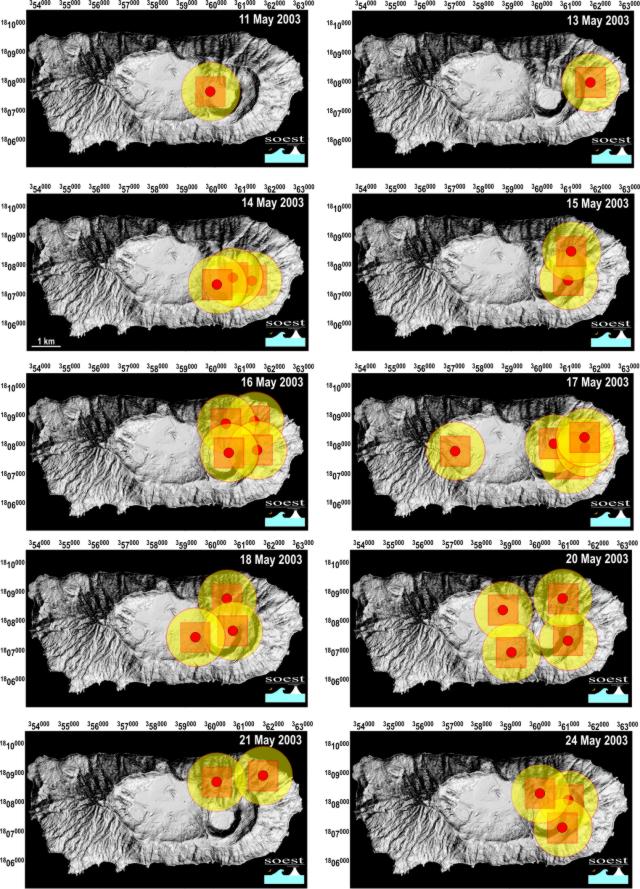 |
Figure 6. Summary of MODIS thermal alerts detected at Anatahan, 11-28 May 2003. Each dot defines the geodetic location of the pixels flagged by the MODVOLC algorithm (Wright and others, 2002) as containing volcanic hot-spots. However, although the coordinate describes the center point of each pixel, the hot-spots could have been located anywhere in the square boxes (which portray the nominal 1-km pixel size of the MODIS instrument.) The shaded circles denote the absolute limits within which the volcanic hot-spots responsible for the anomalies must have been sited (based on a statistical analysis of long-term hot-spot location stability at other volcanoes). The hot-spot locations are referenced to WGS-84 ellipsoid. Map coordinates are in UTM zone 55 (north). Courtesy of the HIGP MODIS Thermal Alert Team (http://modis.higp.hawaii.edu). |
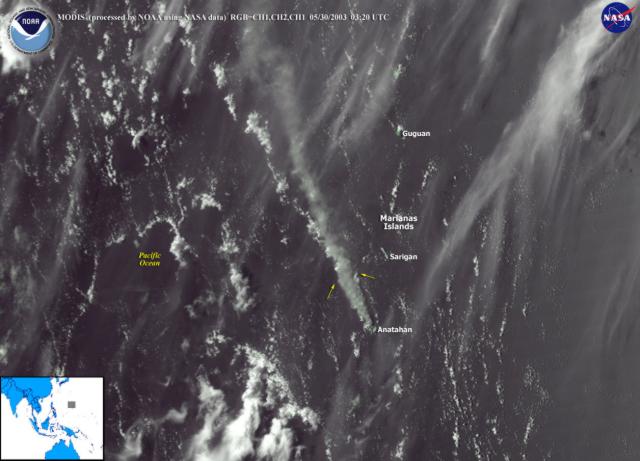 |
Figure 7. Ash plume from Anatahan (indicated by arrows) visible in MODIS imagery from the Aqua satellite, 0320 UTC on 30 May. Image processed by NOAA with data from NASA. Courtesy of NOAA/NASA. |
SO2 data from TOMS. Simon Carn reported that the Earth Probe Total Ozone Mapping Spectrometer (EP TOMS) has observed SO2 and ash emissions from the ongoing eruption. No emissions were detected in the EP TOMS overpass at 0116 UTC on 10 May, several hours before the reported eruption onset. On May 11 a data gap over the Marianas prevented detection of proximal emissions, though a small ash cloud (no larger than ~120 km across) was detected ~500 km ESE of Anatahan at 0027 UTC. Washington VAAC estimates suggested a height of 14-15 km for this cloud. A weak SO2 cloud was also observed, displaced from the ash cloud and centered ~560 km SE of Anatahan. This cloud contained an estimated SO2 mass of ~10 kilotons (kt), but it is suspected to be only the distal end of a larger SO2 plume obscured by the data gap. Diffuse ash was also apparent at least 500 km W of the volcano at 0205 UTC, but no measurable SO2.
The EP TOMS orbit was better placed on 12 May at 0115 UTC. At this time an ash cloud extending ~560 km on its long axis was centered ~570 km W of Anatahan. An SO2 cloud, again displaced from the ash, extended ~1,100 km from a point ~510 km W of the volcano to a point ~700 km SE of it. This cloud contained ~110 kt of SO2. On 13 May a data gap covered the Marianas though ash was detected farther W, with no significant new SO2 evident. On 14 May a low-level SO2 plume appeared to be drifting W from Anatahan.
As of May 30 the Earth Probe TOMS instrument continued to detect significant SO2 emissions from Anatahan. No TOMS data were collected during 15-23 May due to a technical fault on the spacecraft. Thereafter, TOMS detected SO2 clouds in the region of Anatahan on 24 May (~19 kt SO2), 25 May (~23 kt minimum), 26 May (~35 kt), 28 May (~70 kt), and 30 May (~50-100 kt). Data gaps covered the Marianas on other days. Given the persistent ash plume from the volcano reported by the Washington VAAC, these SO2 clouds are presumed to be the product of continuous emissions and not discrete explosive events.
Observations from 20 May-8 June 2001. Anatahan was visited during 20 May-8 June 2001 as part of fieldwork in the Northern Marianas (Trusdell and others, 2001), including helicopter observations on 4 June. At that time line lengths on the Anatahan EDM network were measured and showed no significant changes. Most line lengths exhibited small contractions when compared to the data from the 1994 survey. Deformation appeared to be slowing down with no significant changes. Temperatures were measured for several boiling pots and springs on the floor of the E crater. The temperature of the ponds as well as fumaroles ranged from a minimum of 96.7°C to a maximum of 100.3°C.
References. Moore, R.B., Koyanagi, R.Y., Sako, M.K., Trusdell, F.A., Kojima, G., Ellorda, R.L., and Zane, S., 1994, Volcanologic investigations in the Commonwealth of the Northern Mariana Islands, September-October 1990: U.S. Geological Survey Open-File Report 91-320, 31 p.
Sako, M.K., Trusdell, F.A., Koyanagi, R.Y., Kojima, G., and Moore, R.B., 1995, Volcanic investigations in the Commonwealth of the Northern Mariana Islands, April to May 1994: U.S. Geological Survey Open-File Report 94-705, 57 p.
Trusdell, F.A., Sako, M.K., Moore, R.B., Koyanagi, R.Y., and Schilling, S., 2001, Preliminary studies of seismicity, ground deformation, and geology, Commonwealth of the Northern Mariana Islands, May 20 to June 8, 2001: U.S. Geological Survey, prepared for the Office of the Governor, the Emergency Management Office, and the Office of the Mayor of the Northern Islands, Commonwealth of the Northern Mariana Islands.
Wright, R., Flynn, L.P., Garbeil, H., Harris, A.J.L., and Pilger, E., 2002, Automated volcanic eruption detection using MODIS: Remote Sensing of Environment, v. 82, p. 135-155.
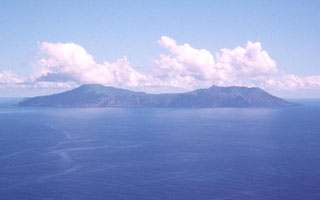
Geological Summary. The elongate, 9-km-long island of Anatahan in the central Mariana Islands consists of a large stratovolcano with a 2.3 x 5 km compound summit caldera. The larger western portion of the caldera is 2.3 x 3 km wide, and its western rim forms the island's high point. Ponded lava flows overlain by pyroclastic deposits fill the floor of the western caldera, whose SW side is cut by a fresh-looking smaller crater. The 2-km-wide eastern portion of the caldera contained a steep-walled inner crater whose floor prior to the 2003 eruption was only 68 m above sea level. A submarine cone, named NE Anatahan, rises to within 460 m of the sea surface on the NE flank, and numerous other submarine vents are found on the NE-to-SE flanks. Sparseness of vegetation on the most recent lava flows had indicated that they were of Holocene age, but the first historical eruption did not occur until May 2003, when a large explosive eruption took place forming a new crater inside the eastern caldera.
Information Contacts: Juan Takai Camacho and Ramon Chong, Commonwealth of the Northern Mariana Islands Emergency Management Office, P.O. Box 10007, Saipan, MP 96950 (URL: http://www.cnmihsem.gov.mp/); Frank Trusdell, Hawaiian Volcano Observatory, PO Box 51, Hawaii National Park, HI, 96718-0051 (URL: https://volcanoes.usgs.gov/nmi/activity/); Doug Wiens and Patrick Shore, Washington University, St. Louis, McDonnell Hall 403 Box 1169, St. Louis, MO 63130; Allan Sauter and David Hilton, Scripps Institution of Oceanography, UCSD, 9500 Gilman Drive, La Jolla CA, 92093-0225; Washington VAAC, Satellite Analysis Branch (SAB), NOAA/NESDIS E/SP23, NOAA Science Center Room 401, 5200 Auth Road, Camp Springs, MD 20746, USA (URL: http://www.ssd.noaa.gov/); Simon A. Carn, TOMS Volcanic Emissions Group, Joint Center for Earth Systems Technology (NASA/UMBC), University of Maryland Baltimore County, 1000 Hilltop Circle, Baltimore, MD 21250, USA (URL: https://so2.gsfc.nasa.gov/); Rob Wright, Luke Flynn, Harold Garbeil, Andy Harris, Matt Patrick, Eric Pilger, and Scott Rowland, Hawai'i Institute of Geophysics and Planetology, University of Hawai'i, 2525 Correa Road, Honolulu, HI 96822, USA (URL: http://modis.higp.hawaii.edu/); George Stephens, Operational Significant Event Imagery (OSEI) team, World Weather Bldg., 5200 Auth Rd Rm 510 (E/SP 22), NOAA/NESDIS, Camp Springs, MD 20748USA.