Report on Galeras (Colombia) — July 2004
Bulletin of the Global Volcanism Network, vol. 29, no. 7 (July 2004)
Managing Editor: Richard Wunderman.
Galeras (Colombia) 7 June 2002 and 16 July 2004 ash emissions; the latter leads into an eruptive episode
Please cite this report as:
Global Volcanism Program, 2004. Report on Galeras (Colombia) (Wunderman, R., ed.). Bulletin of the Global Volcanism Network, 29:7. Smithsonian Institution. https://doi.org/10.5479/si.GVP.BGVN200407-351080
Galeras
Colombia
1.22°N, 77.37°W; summit elev. 4276 m
All times are local (unless otherwise noted)
This report covers activity on Galeras volcano after calendar year 2002 (BGVN 28:02) and through July 2004. Towards the end of this interval, on 16 July 2004, a new eruptive episode began. In contrast to the 2004 events, the interval from 1994 to June 2004 was characterized by relative quiet, except for a small ash emission from a secondary crater on 7 June 2002. Since 1997 INGEOMINAS has been part of a research project called 'The multiparameter station at Galeras volcano' that was developed with the German group, Bundesanstalt für Geowissenschaften und Rohstoffe (BGR). The station includes the monitoring of fumarolic gas, electromagnetic fields, broadband seismicity, thermal imagery, and other parameters (Seidl and others, 1998). Most instruments were functioning during the recent period of activity.
INGEOMINAS reported that during January-March 2004 Galeras volcanism was at very low levels, with persistent gas emissions from different foci on the active cone, particularly on its W side. There were 60 volcano-tectonic (VT) earthquakes, with many centered ~ 3 km NE of the active cone, several dispersed about the region, and a few epicenters within 2 km of the summit. Magnitudes based on the duration of the signal coda (Md) varied between 0.1 and 2.8.
Residents felt three earthquakes in Pasto. Two on 27 January occurred at 1511 and 2147 and another on 30 January at 0018. Their respective local magnitudes (ML) were 2.9, 3.1, and 2.3. All had epicenters 4-5 km NNE of Galeras.
Table 7 compares seismicity for the first quarter of 2004 with the last quarter in 2002 and the first in 2003. The number of VT events clearly dropped, but their energy release varied and was largest in the most recent quarter. The range of depths for the VT earthquakes is roughly comparable, although in the first quarter of 2004 these earthquakes had focal depths only down to 12 km, compared to as deep as 15 and 16 km in the other quarters shown. For the 2004 quarter, six episodes of tremor were recorded. Although fewer episodes occurred than for the other quarters shown in the table, they released an appreciable amount of energy. Spectral analysis generally suggested a fundamental frequency of 4.3 Hz.
Table 7. Cumulative seismicity in the given three-month intervals (quarter of a year) at Galeras. The second through fourth columns show the number of volcano-tectonic events, a sum of their energy release calculated from their codas, and their focal-depth ranges. The next two columns describe the number of tremor episodes and the associated energy release, and the last column contains the number of long-period events. Courtesy of INGEOMINAS.
| Quarter | VT Count | VT Energy | VT Depth below summit | Tremor Count | Tremor Energy | Long-Period |
| Oct-Dec 2002 | 197 | 2.9 x 10¹⁵ ergs | 0.2-16 km | 209 | 27 x 1014 ergs | 1,541 |
| Jan-Mar 2003 | 126 | 0.49 x 10¹⁵ ergs | 0.2-15 km | 19 | 0.03 x 10¹⁴ ergs | 104 |
| Jan-Mar 2004 | 60 | 6.7 x 10¹⁵ ergs | 0.3-12 km | 6 | 12 x 1014 ergs | 1 |
In early 2003, LP signals continued to be present in the record, although their classification was made difficult by their atypical signatures. Their frequency spectra showed peaks between 10 and 16 Hz. Sometimes these events were preceded by one or more small-amplitude precursor signals, which appeared to have very similar waveforms. The frequencies were stable over time and from one station to another, indicating processes related to the source rather than to the path or the station site.
The W sector of the active cone continued to show the highest fumarole temperatures. INGEOMINAS measured fumarole temperatures on the active cone in March 2003 and January 2004, and at both times they were cooler than those measured in 2002. Spot measurements in 2002, 2003, and 2004 were reported for two fumarolic areas: Deformes fumaroles (~50 m outside the main crater's SSW rim, 118°C, 85°C, and 86°C, respectively) and Chavas fumarole (344°C, 267°C, and 310°C).
Commencement of 2004 eruptions. The most recent phreatic eruption before 16 July 2004 took place on 7 June 2002 (BGVN 28:02). The eruption on 16 July 2004 was preceded by a decrease in the amount of CO2 released at La Joya fumarole (W side of the cone). The decrease began on 6 June and lasted until the gas sensor stopped working on 26 July 2004. On 27 June the seismic activity picked up. The earthquakes exhibited high frequencies, and they underwent rapid attenuation in both time and space. The VT and LP events were at shallow levels (less than 2 km).
On 8 July 2004 a swarm of VT earthquakes was centered slightly W of the cone at depths of 2-4.5 km. The largest event had ML 3 (figure 102). The swarm was preceded by intervals with LP events and spasmodic tremor at somewhat lower frequencies.. The seismic episode caused tiltmeters to vary on the E and NE flanks During fieldwork on the S and SW sides of the active cone on 9 July, numerous new points with gas emission were observed. However, the secondary crater "El Pinta" (at the E edge of the main crater) only produced sporadic, weak pulses of gas (figure 103).
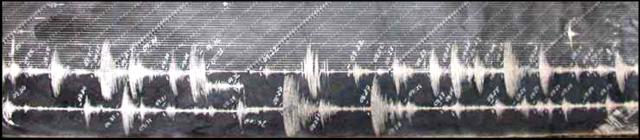 |
Figure 102. A seismic record of a portion of the Galeras earthquake swarm on 8 July 2004, from the station OLGA on the upper E slope. These were described as fracture earthquakes. During the recording process, the seismologist on duty adjusted the distance between adjacent traces, setting them farther apart than the upper, comparatively quiet portion of the record. The seismologist's notes of earthquake arrival times appear as faint, poorly legible marks on the image. Several earthquakes occurred at such short intervals that they overlapped. Courtesy of INGEOMINAS. |
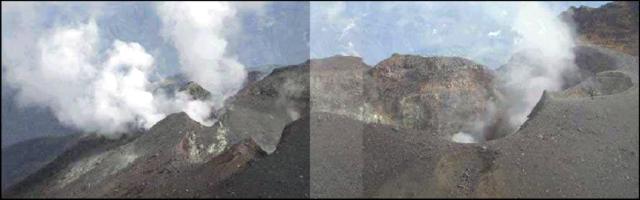 |
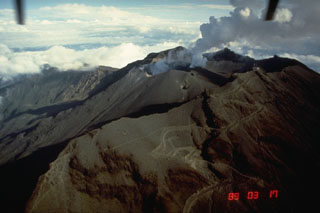
Figure 103. Composite of photos portraying the active cone at Galeras on 9 July 2004. The photos were taken looking NW. At the time these photos were taken the principal focus of emissions was from fumaroles located on the W side of the cone. El Pinta crater on the E edge of the main crater was not emitting any visible products; later, however, this crater became the primary vent. (A map of crater features appeared in BGVN 19:07.) Courtesy of INGEOMINAS. |
On 9 July, only minor, white-colored emissions were observed. They came from the main crater and from sporadic gas venting from the secondary El Pinta crater.
The first episode of ash emissions from El Pinta were noted at 0901 on 16 July and was associated with tremor. It took place under conditions of poor visibility, thwarting clear observations. At the time of ash emission, tremor with very large amplitudes at the upper-flank Olga station had persisted for slightly more than 10 hours (figure 104).
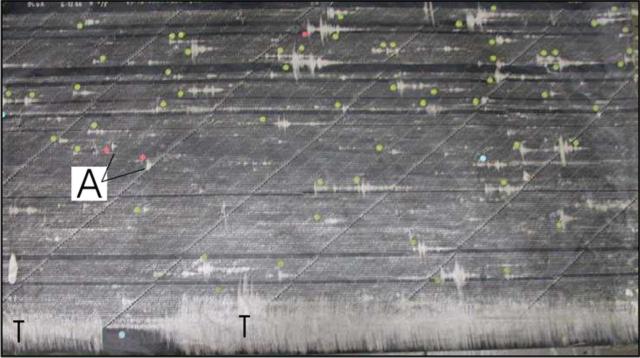 |
Figure 104. A seismic record from station Olga on 16 July 2004, showing examples of the seismic signals seen as the eruption began. Only a few of the local (or micro) earthquakes were inferred to be associated with classic rock fracture. The bulk of the record contains more complex waveforms, inferred to be related to fluid movement. The bottom of this record is dominated by the kind of high-amplitude tremor often associated with active venting during this eruptive episode. Heavy index lines appear on the seismic record every minute; lighter (faint) intermediate lines are 10 seconds apart. The seismic interpretations of the record were indicated by red dots to indicate fracture earthquakes, and yellow, green and blue dots to indicate earthquakes associated with pressure transients. Courtesy of INGEOMINAS. |
The seismicity and gas venting accompanied signals on the two tiltmeters, as well as variations in the horizontal components of the electric and magnetic fields at an electromagnetic station at the NE base of the active cone. Since the beginning of July, the CO2 sensor at La Joya fumarole showed a gradual decrease in values, and the temperatures at La Joya and Chavas fumaroles increased gradually just two days before the emission. After 16 July, temperatures at Chavas had risen by 20°C and at La Joya by around 5°C.
According to the personnel of the military outpost at the summit of Galeras, gas emissions had increased by the afternoon of 17 July when compared with those before 9 July. The emissions came from the El Pinta crater and from Deformes fumarolic field, which is located ~ 50 m from the crater on the upper S and SSW flank of the active cone. Gas emissions subsequently decreased until 20 July, when again, small magnitude earthquakes occurred.
Field observations on 19 July disclosed fresh ash on Galeras (figure 105). It had vented from El Pinta crater. The ash thickness ranged from 3 mm at the base of the cone to ~ 20 cm near the point of emission. The right-hand photo on figure 106 shows field workers ascending the steep upper slopes, walking through the thick ash, leaving deep footprints akin to trudging through fresh snow.
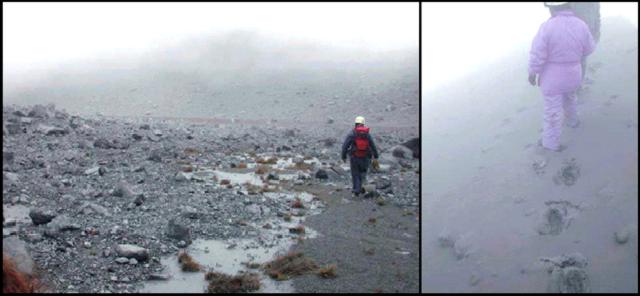 |
Figure 105. Galeras reconnaissance investigations undertaken on 19 July (3 days after the ash emission of 16 July). The left-hand photo shows a team in the volcano's E sector where they found thin ash-fall deposits. The right-hand photo shows climbers on the upper part of the cone at El Pinta, in vicinity of the vent, where substantial ash had fallen. Courtesy of INGEOMINAS. |
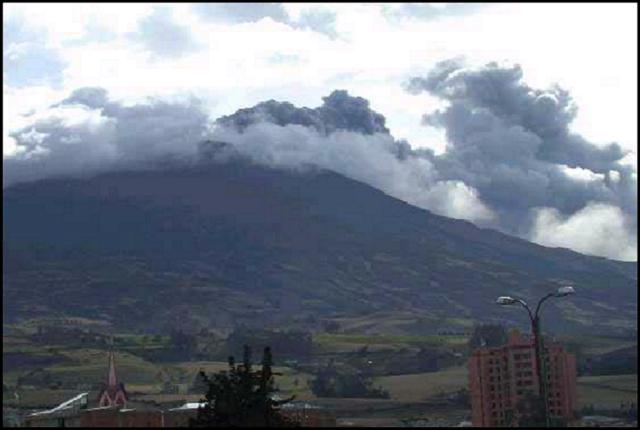 |
Figure 106. The ash-bearing eruption from Galeras on 21 July 2004, as seen looking W from the town of Pasto. The town sits on the volcano's flank, making it vulnerable to slope instability and other volcanic hazards. Pasto residents have previously undergone considerable tension due to unrest at Galeras in the 1989-2002 eruptive episode. Courtesy of INGEOMINAS. |
On 21 July, an ash emission was seen rising to ~ 500 m above the volcano's rim (figure 5). It was widely visible, including from the largest adjacent city, San Juan de Pasto, which lies just to the E. Seismic signals increased and included a variety of wave forms such as short impulsive events as well as more complex ones. Tremor on 21 July was particularly strong (often dominating the record) and of long duration—extending for ~13 hours. Once again the electric- and magnetic-field sensors appeared to respond to the onset of emissions.
Although ash-free, gaseous emissions occurred on 23 July, ash-bearing ones were noted on many days in the following weeks from El Pinta. Specifically, ash plumes were every day during 27-31 July accompanied by tremor; LP and VT earthquakes were also recorded. Some of these processes were heard from canyons around the volcano. Several changes at the active cone were noted, which included increases in both venting, exit pressures, and quantities of gases driving the eruptions.
An afternoon overflight on 28 July confirmed a vigorous ash plume coming from El Pinta crater reaching to ~ 1 km altitude and visible for a distance ~ 5 km. A morning overflight on 29 July showed a light, gray to off-white colored plume again emerging from El Pinta and in this case described as blowing NNW, the prevailing direction of strong wind in this season of the year.
On 29 July a low ash plume was visible from Pasto. On that day, scientists took a thermal image of ash clouds; the maximum temperatures were 260°C, seen on the cloud's E side, at a spot above the vent at El Pinta (figure 107). SO2 measured on 31 July gave a value of 1,366 tons/day.
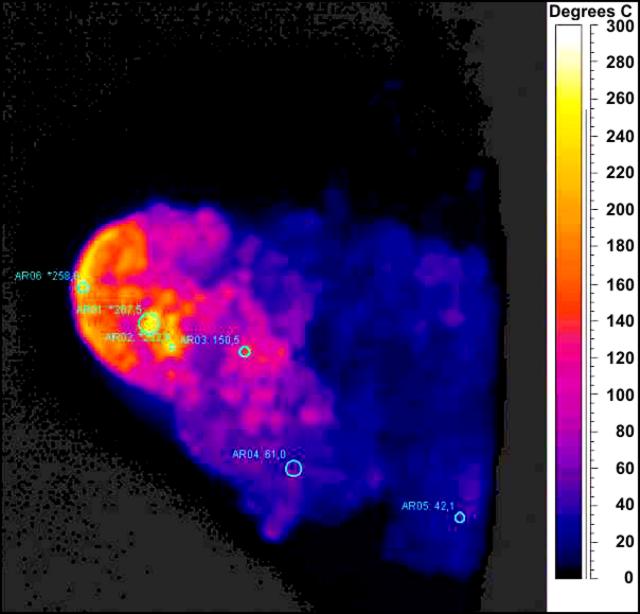 |
Figure 107. Thermal image of a Galeras eruption cloud on 29 July 2004 coming from El Pinta crater (N is towards the bottom of this image). The image was taken by INGEOMINAS with the support of the Air Force of Colombia, from ~ 500 m over El Pinta crater. The right hand side shows the temperature scale. Courtesy of INGEOMINAS. |
Two non-technical books discussed the 14 January 1993 Galeras eruptions that killed six scientists and three tourists (Bruce, 2001; Williams and Montaigne, 2001).
References. Bruce, V., 2001, No apparent danger: the true story of volcanic disaster at Galeras and Nevado del Ruiz: Harper Collins, 239 p.
McNutt, S., 2000, Seismic monitoring, in Encyclopedia of Volcanoes (H. Sigurdsson, Editor-in-chief): Academic Press, p. 1095-1119.
Seidl, D., Calvache, M., Bannert, D., Buttkus, B., Faber, E., Greinwald, S., Hellweg, M., and Rademacher, H., 1998, The Galeras multiparameter-station: Deutsche Geophys. Ges., Sonderband III / 1998 (Herausg.: J. Zschau, M. Westerhaus), p. 9-11.
Williams, S., and Montaigne, F., 2001, Surviving Galeras: Houghton Mifflin, 270 p.
Geological Summary. Galeras, a stratovolcano with a large breached caldera located immediately west of the city of Pasto, is one of Colombia's most frequently active volcanoes. The dominantly andesitic complex has been active for more than 1 million years, and two major caldera collapse eruptions took place during the late Pleistocene. Long-term extensive hydrothermal alteration has contributed to large-scale edifice collapse on at least three occasions, producing debris avalanches that swept to the west and left a large open caldera inside which the modern cone has been constructed. Major explosive eruptions since the mid-Holocene have produced widespread tephra deposits and pyroclastic flows that swept all but the southern flanks. A central cone slightly lower than the caldera rim has been the site of numerous small-to-moderate eruptions since the time of the Spanish conquistadors.
Information Contacts: Diego Gomez Martinez, Observatorio Vulcanológico y Sismológico de Pasto (OVSP), INGEOMINAS, Carrera 31, 1807 Parque Infantil, PO Box 1795, Pasto, Colombia (URL: https://www2.sgc.gov.co/volcanes/index.html); Washington Volcanic Ash Advisory Center (VAAC), Satellite Analysis Branch (SAB), NOAA/NESDIS E/SP23, NOAA Science Center Room 401, 5200 Auth Road, Camp Springs, MD 20746, USA (URL: http://www.ospo.noaa.gov/Products/atmosphere/vaac/).