Report on Telica (Nicaragua) — November 2011
Bulletin of the Global Volcanism Network, vol. 36, no. 11 (November 2011)
Managing Editor: Richard Wunderman.
Edited by Julie A. Herrick.
Telica (Nicaragua) Degassing in 2011; seismic crisis leading to explosive eruption in May 2011
Please cite this report as:
Global Volcanism Program, 2011. Report on Telica (Nicaragua) (Herrick, J.A., and Wunderman, R., eds.). Bulletin of the Global Volcanism Network, 36:11. Smithsonian Institution. https://doi.org/10.5479/si.GVP.BGVN201111-344040
Telica
Nicaragua
12.606°N, 86.84°W; summit elev. 1036 m
All times are local (unless otherwise noted)
Our last report discussed Telica volcano's intermittent gas emissions from 2009 through early 2010 as well as installation of an early warning system (Sistema de Alerta Temprana, SAT) in March 2010 (BGVN 35:03). New information has been released by INETER (the Instituto Nicaragüense de Estudios Territoriales) detailing the escalation of activity that culminated in a major eruption in May 2011. This report also covers the field investigations from April 2010 through October 2011, seismic data from January 2010 through October 2011, SO2 monitoring from 25 May 2011 through 13 September, and regular thermal measurements from the crater and flank fumaroles.
Volcanic activity at Telica during 2010 was characterized by diffuse degassing. Persistent gas emissions from this volcano have caused a legacy of hazards for local communities and have been linked to acute respiratory infections (Bellos and others, 2010; Freundt and others, 2006; Malilay and others, 1996). Field investigations in 2010 conducted by INETER focused on measuring temperatures from the crater as well as fumaroles located near the flanks (figure 20). Heavy rain and inaccessible roads limited visual and thermal monitoring to short field excursions in April, July, and August 2010.
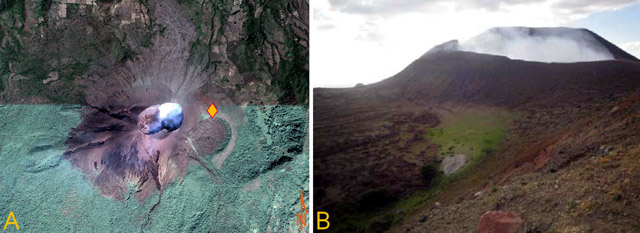 |
Figure 20. (A) Telica's 700-m-wide double crater (gray to white central area) and E-flank fumaroles (diamond) were sites of thermal monitoring for 3 months in 2010. The seismic station TELN is located 30 m N of the orange diamond. (B) Typical diffuse degassing from the summit photographed on 14 January 2011. Courtesy of INETER. |
Using a thermal camera, INETER determined the maximum temperatures within Telica's crater on 28 July and 18 August were 259°C and 251°C respectively. The four fumaroles located near seismic station TELN were measured three times in 2010. With a digital thermocouple, INETER determined that maximum temperatures from the flank fumaroles gradually increased from April to August: 72.3°C, 81°C, and 105°C. Minimum measured temperatures were irregular and ranged from 66.4 to 76°C.
Few earthquakes were sufficiently large to registered and be located during 2010 (table 2), but INETER reported that those recorded were smaller, and there was frequent tremor. The seismic network for this volcano was installed in 1994. The two local seismic stations, TEL3 and TELN, operated with 3-component sensors but during this reporting interval TELN was offline until July 2010. Microseismicity was reported during four months in 2010 (March, September, November, and December). The highest rate occurred in March, exceeding 150 events per day. In September, more than 120 events were recorded per day, and in November and December, the rate was 80 microseisms per day.
Table 2. Located earthquakes at Telica recorded in the interval from January 2010 through October 2011. Only months with earthquakes reported are shown. High values in May-June were during an eruption. Values are based on monthly reports from INETER.
| Month | Number of Events | Magnitudes | Depths |
| Apr 2010 | 4 | 1.7-2.5 | 0-3 km |
| Oct 2010 | 1 | 1.4 | 0 km |
| Feb 2011 | 1 | 2.9 | 3 km |
| Apr 2011 | 5 | 0.2-1.5 | 0-1 km |
| May 2011 | ~175 | 0.3-4.0 | 0-4 km |
| Jun 2011 | ~100 | 0.1-2.8 | 0-28 km |
| Jul 2011 | ~20 | 0.8-1.8 | 0-1 km |
| Aug 2011 | ~22 | 0.3-2.3 | 0-1 km |
INETER reported that field investigators encountered significant gas plumes from Telica's summit in April and July. The W edge of the crater and a small vent on the E interior wall were constant sources. There were notable rockfalls from the crater rim; an observation from 28 July 2010 mentioned the NE and SE walls in particular experience rockfalls of sufficient magnitude to increase the summit crater's size.
January 2011. Investigators from INETER visited Telica this month for instrument maintenance and monitoring activities. Rockfalls from the S crater wall were noted on 11 January by staff. According to Halldor Geirsson, Mel Rodgers (Univ. of South Florida) was in the vicinity during 25-31 January and noted strong degassing and occasional rockfalls. On 14 January thermal data was collected from the central crater and fumaroles on the outer flank. The maximum temperature recorded from the crater was 295°C. The four fumaroles located on the W flank (figure 20a) had recorded temperatures ranging from 68°C to 72°C.
Seismicity during January 2011 was generally high, with ~ 907 earthquakes recorded. Most were long-period (LP) with dominant frequencies of 1-3 Hz. From 19 to 23 January events were absent. Seismic tremor was recorded throughout January at 30-40 RSAM units with scattered intervals of greater than 100 RSAM units.
February 2011. Collaborative fieldwork was conducted on 26 February between INETER and scientists from the Institute of Renewable Energy (Spain). This team measured temperatures and took thermal images of the fumaroles located both within the crater and on the W flank. Maximum temperatures within the crater ranged from 62-75°C.
Elevated seismicity continued through February with 676 recorded events. These events were similar to those recorded in previous months; LP events had dominant frequencies of 1-3 Hz. Figure 21 presents an example of frequency analysis for one earthquake at Telica. Volcanic-tectonic (VT) events rarely occurred. Tremor was recorded at 30-40 RSAM units.
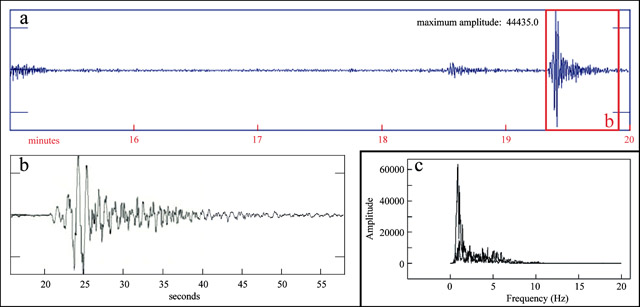 |
Figure 21. The seismic trace of a characteristic LP event (a) from Telica processed with spectrum-analysis software to obtain the dominant frequency ranges. This event was recorded on 1 February 2011 and lasted for more than 20 seconds (b, a zoom on the trace). The dominant frequencies (c, frequency vs. amplitude) ranged from 1 to 2 Hz with some signals to ~10 Hz. Courtesy of INETER. |
Ashfall in March 2011. On 6 March residents living near Telica felt an earthquake during the night and during the following day they observed small plumes rising from the volcano. INETER scientists visited on 8 March for routine data collection and to investigate reports of fresh ashfall. Light ash was still visible on leaves and rooftops and appeared directed towards the N and SE. Residents also reported strong sulfurous odors during the explosive events. Field investigators found evidence of juvenile material along the SE rim of the crater.
INETER collected thermal data on 8 March from fumaroles located within the crater and near the seismic station (TELN) on the E flank. The maximum temperature measured within the crater was 137°C. Two fumaroles were identified within the crater on the W side; these sites had recorded temperatures in the range of 47-71°C. Thermal measurements near TELN ranged from 51-60°C. This site did not emit steam or other gases.
The INETER field crew noticed that degassing appeared to be more intense during the 8 March field visit compared to their previous 26 February visit. The view to the crater was often obscured from the point of view of seismic station TELN (figure 20b).
In their March report, INETER discussed the relevance of the new temperatures measured during the 8 March field campaign. The issue was the apparent decrease compared to temperatures recorded from Telica in January. INETER staff acknowledged the limits of monthly temperature readings but looked forward to longer-term correlations with seismic data.
Seismicity in March remained high with ~ 572 events recorded. The majority of the earthquakes were LP events with dominant frequencies between 1-3 Hz. Few VT events were recorded. Seismic tremor was between 30-40 RSAM units.
April 2011. New seismic data from an early warning system (Sistema de Alerta Temprana, SAT) was presented for the first time in INETER's April report. The new 6-station network contained five stations with 3-component sensors and one station with a single-component sensor. The network included two short-period stations, TEL3 and TEL4 (note that TEL4 was TELN), that continued to send data.
From late March through the second week of April, small explosions, LP earthquakes, and seismic swarms were detected. There was a three-day lull in early April, but VT earthquakes began occurring with increasing magnitudes and small explosions from the summit occurred at least once per week throughout the month. By 30 April, explosions were registered having 30-minute durations and were followed by periods of degassing and low-altitude ash plumes. For an interval in late April, seismicity was very high, with more than 600 events recorded each day with a range of M 0.1-3.3. A maximum of 380 RSAM units was recorded and seismic tremor ranged between 30-40 RSAM. The VT earthquakes were strong enough to be noticed by residents in local communities.
During field investigations on 11 April, INETER measured temperatures within the crater, recording a of maximum 254°C. One fumarole within the W wall of the crater had decreased temperature by 10°C while the other had increased by 1°C compared to values from March. The four fumaroles near TEL4 had recorded temperatures in the range of 53-69°C.
Eruptions in May 2011. The escalation of seismic activity and recurrence of ash plumes seen since March prompted INETER to issue an alert to civil defense on 13 May warning that eruptive activity was possible. During the first week of May seismicity increased to 500 microseismic events per day (in general, microseismic events in April occurred at a rate of ~ 220 per day) and VT events suddenly became rare (figure 22).
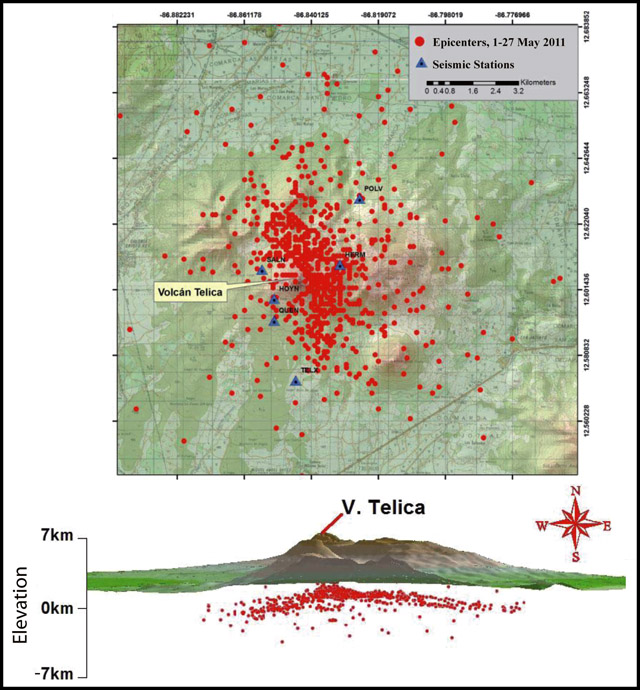 |
Figure 22. Telica's seismicity recorded during May 2011: epicenters shown on map and cross section (roughly aligned with map) were located with the new, early warning system (the 6 stations shown as blue triangles). Note that the focal depths are clustered under the volcano at depths mainly below 5 km. Courtesy of INETER. |
Large explosions from Telica were registered at midnight on 13 May. After that, INETER reported that residents in three different communities observed pink-colored ash had fallen, and residents had also felt earthquakes. Frequent explosions of abundant gas and falls of coarse-to-fine ash occurred 14-15 May. Seismicity during 14 May was dominated by M 1.0-3.3 events with depths between 1 and 5 km (figure 23). Ash fell over the community of La Quemada, located 4 km N of the volcano. Residents heard loud noises from the volcano.
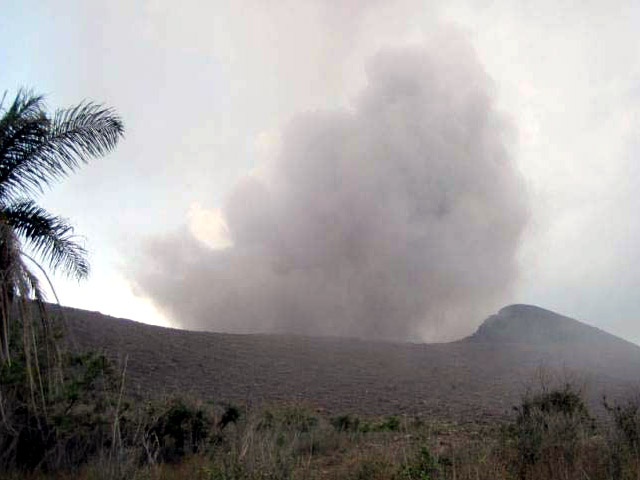 |
Figure 23. This minor explosion at Telica was observed on 16 May 2011. Courtesy of Halldor Geirsson (Pennsylvania State University). |
On 16 May observers first saw gray ash clouds rising from Telica's summit. Later, this activity visibly escalated and ashfall was observed in continuous plumes (figure 23). The highest plumes reached 1.2 km altitude and ash fell to the SE over communities. By mid-May the number of seismic events had increased to 800 microseismic events per day, most of which were explosions with a few VT events (figure 24). INETER noted that seismic stations recorded up to 140 RSAM units on 16 May.
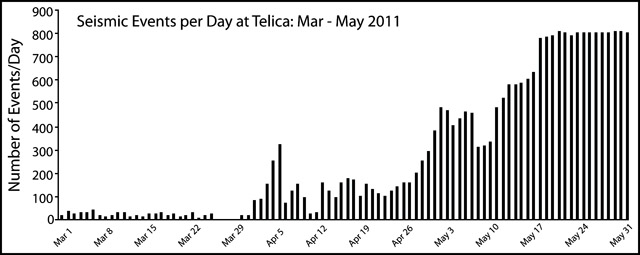 |
Figure 24. The number of seismic events registered per day during March-May 2011. This record was dominated by microseismicity and explosions from Telica. Courtesy of INETER. |
Fieldworkers from INETER and others, deployed a large tarp, collected ~ 80 kg of tephra during 16-18 May. Preliminary assessments determined the nature of material that landed on the tarp included dominant lithics, fragmented rock and crystalline material of 0.5-1.0 mm diameter, and round fragments of pink-colored tephra (as opposed to the gray, sand-size grains from a small event on 12 May). These observations were also reported in field notes by Halldor Geirsson and in an abstract by Witter and others (2011). During a lull in activity on 16 May 2011, the team visited Telica's summit. Upon approaching the N rim, they heard no sounds coming from the crater, and they measured temperatures on the crater floor of ~ 395°C. They observed fresh, inward-directed rockfalls from the crater's rim and found the N wall unstable and dangerous, seemingly on the verge of falling. The team also observed a dark area on the SE wall and floor of the crater, which suggested that recent explosions had concentrated tephra on these surfaces.
Washington VAAC 15 and 17 May. The Washington Volcanic Ash Advisory Center (VAAC) reported that the GOES-13 satellite detected at least two plumes on 15 and 17 May 2011. This satellite imagery confirmed gas-rich plumes on both days at ~ 1.8 km altitude, but ash content could not be determined from available images. INETER reported that these events were accompanied by elevated seismicity on 15 May and associated ashfall occurred 4 km N of the summit. After three emissions of gas on 17 May, ash and tephra fell SE of the summit. The last time plumes from Telica appeared in VAAC reports was in early months of 2007 when plumes reached an altitude of ~ 1.5 km for three days in January and February drifting SW.
Explosion with sustained ash plumes. On 18 May INETER posted two online reports ("Volcanic Communications" 5 and 6) indicating the peak of activity starting on that day. After two hours of sustained explosive activity producing ash plumes ~ 600 m high, the largest explosion suddenly occurred at 1350 on the 18th. A column of ash rose to an altitude of 2.6 km and was maintained for six minutes (figure 25). More than 15 explosions were seismically recorded (with a maximum of 350 RSAM units). The episodic explosions produced ash, steam, and, at times, lightning within the plume. Temperatures within the crater were gauged at a maximum 432°C, and flank fumaroles were measured to be 60-126°C.
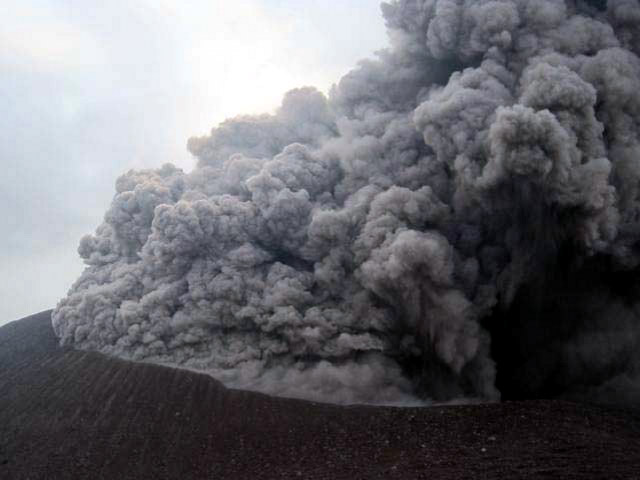 |
Figure 25. A sustained ash plume issued from Telica during the peak of activity in 21 May 2011. Courtesy of Halldor Geirsson. |
In a 19 May statement to news agencies, the municipal committee for disaster prevention and mitigation (COMUPRED) reported the evacuation of 390 families from nine villages near the volcano. The villages included Agua Fría (150 m from the edifice) and Los Patos, the most distant of the villages at 8 km from the edifice.
On 19 May, public meetings were held that included INETER, civil defense, and national disaster response (SINAPRED) representatives. A widely discussed issue was how the heavy ashfall and volcanic gases were affecting water quality. Officials favored monitoring local wells within 5 km of Telica's edifice.By 20 May, Telica's explosions became infrequent: three were registered that day. Only ash and resulting plumes rose to 500-800m altitude. Microseismicity remained high (850 events) and 60 earthquakes (M 0.8-2.2) were located at depths of 0.7-2.2 km (table 2).
On 20 May, explosions were also infrequent but four large events from the crater emitted plumes with heights of 500-700 m. In addition, at 1500 on the 20th, one large, continuous explosion occurred that lasted 36 minutes. Observers described a plume containing gas, steam, tephra, and small rocks. The largest ballistics did not reach farther than the crater rim and lightning was observed in the plume. INETER noted that wind conditions allowed the plume to reach 2 km altitude. Nine hundred microseismic events were recorded on 21 May and 57 earthquakes (M 0.5-2.0) were located with average depth of 1 km.
Well monitoring on 21 May revealed slight changes in local water quality. Sites located NE and within 5 km of the summit showed elevated quantities of sulfates, chlorides, alkalinity and PH.
New SO2 monitoring efforts. On 22 May, Universidad Tecnológica de Chalmers (Switzerland) and SNET (El Salvador) installed two portable Mini-DOAS stations (Differential Optical Absorption Spectrometer) at Los Angeles and Mendoza to measure SO2 levels.. These stations were installed downwind from Telica, SW of the edifice (figure 26). While the fixed stations collected data, traverses were made across the plume with mobile Mini-DOAS.
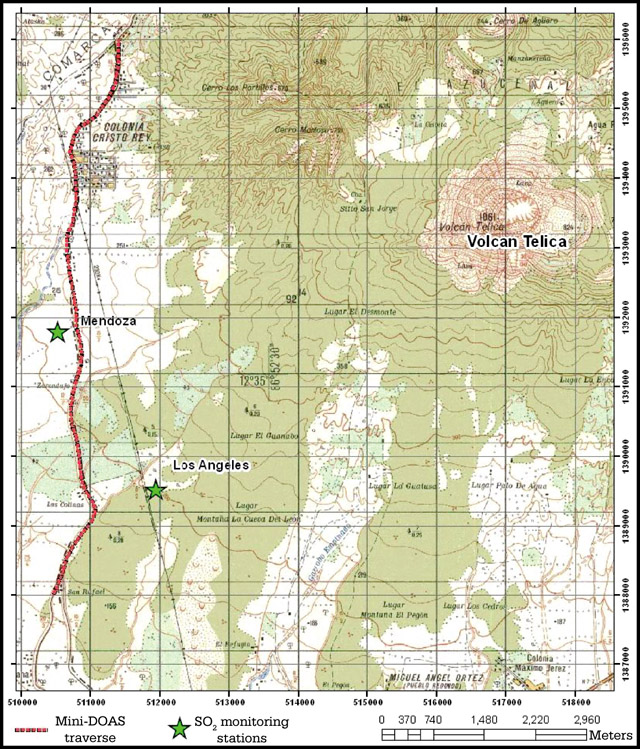 |
Figure 26. Location map of SO2 monitoring stations, Los Angeles and Mendoza, located SW of Telica Volcano (green stars). The 22 May 2011, Mini-DOAS traverse is highlighted in red. Courtesy of INETER. |
The first Mini-DOAS results from fixed stations were obtained on 24 May. Data from the Los Angeles and Mendoza monitoring stations showed that flow of SO2 oscillated between 50 and 150 tons/day. Data collected from traverses below the plume on 23-27 May were processed by the Universidad Tecnológica de Chalmers (Switzerland). The traverse results compared well with the fixed stations: reported values ranged from 40 to 130 tons/day. Peak SO2 values from the fixed stations appeared as follows: Mendoza station, 420 tons/day on (28 May); Los Angeles station, 194 tons/day (30 May).
May 2011 eruption declines. INETER reported that ash explosions became infrequent during 23-30 May. That said, a cluster of eight explosions occurred sequentially on 24 May and created plumes reaching 600 m above the crater. Microseismicity remained high throughout the rest of the month. During 23-24 May, the largest number of earthquakes were located. Approximately 100 earthquakes (M 0.7-2.5) occurred with hypocenters at depths of 1-15 km.
According to the information supplied by the Directiorate of Meteorology of INETER, on 24 May ash expelled from Telica drifted SE at 8-15 km/hour at altitudes of 1.5 km. In their 24 May report, INETER warned that eruptive conditions could continue during the remainder of the month. They recommended the authorities of the Institute Nicargüense of Aeronaútica Civil (INAC) to caution air traffic about persistent and dispersed volcanic ash.
SO2 monitoring in June. On 3 June INETER conducted field investigations and measured SO2 with Mini-DOAS and Mobile DOAS. There were eight successful on-land traverses below the plume, each covering 18 km. Mobile DOAS data indicated a decrease in SO2: the maximum value recorded was 39 tons/day. SO2 flux from the two fixed stations, Mendoza and Los Angeles, also showed reduced levels during the early part of the month but an increase appeared from both sites in 13-15 June. INETER suggested that the low SO2 flux in early June may have been influenced by local wind patterns. Observers in the area noticed that the summit plume was very dispersed during this time. Wind velocities reported by NOAA were as low as 1.2 m/s on 3 June.
During a field visit by INETER on 14 June, the investigators managed to count 17 explosions that expelled ash and gas. The explosions occurred within short intervals of time, from two to three minutes and the longest interim was 10 minutes. The field team visited fumaroles S of the TEL4 seismic station and recorded temperatures from three fumaroles with values ranging from 64-76°C.
Field data collected on 30 June included a maximum temperature of 590°C from the crater (figure 27). The team observed incandescence within the crater and from a new vent near the NE wall. There were jetting and collapse sounds emitting from the crater.
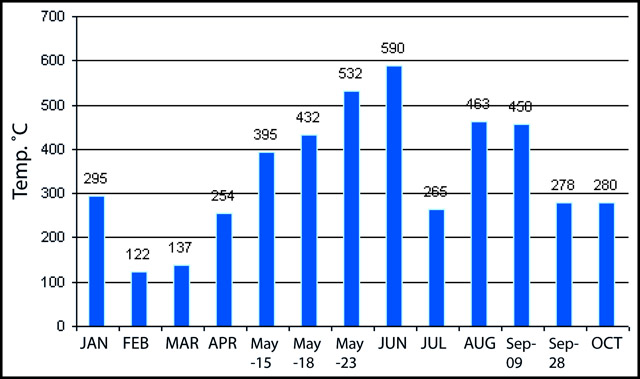 |
Figure 27. Telica's crater temperatures measured January-October 2011. Note multiple measurements taken during the peak of activity in May and two measurements in September. The value measured in February was obtained with an infrared camera (Institute of Renewable Energy). Courtesy of INETER. |
During June the number of earthquakes diminished but seismicity remained high. Approximately 500 earthquakes were registered per day. Approximately 100 earthquakes (up to M 2.8) were located (half the number located in May) at a maximum depth of 28 km (table 2). The majority of the events were volcanic-tectonic (VT) and doublet earthquakes (paired events). The dominant frequencies of the earthquakes shifted in June to 4.0-8.0 Hz.
Routine monitoring in July. During fieldwork on 12 July, INETER measured SO2 flux with Mobile DOAS. Five traverses, each one 8.5 km in distance, were recorded. The average value of SO2 was higher than the previous month, 484 tons/day. In their monthly report, INETER discussed the strong impact of inferred wind speed on their new gas measurements. During the month wind patterns were variable with speeds average ~ 5.8 m/s. They commented that the plume was noticeably less dispersed when they conducted the gas measurements.
On 22 July routine fieldwork was conducted at Telica. Residents of La Joya had heard loud jetting noises and at night saw incandescence at the summit. During the day, the team also heard jetting but did not see any explosive activity or feel earthquakes. Crater temperatures averaged 265°C (five measurements), very low compared to the previous month (figure 27). Temperatures taken from fumaroles S of the seismic station ranged from 68-72°C (three fumaroles).
Incandescence during August to October 2011. Halldor Geirsson noted that incandescence was seen in August 2011 (by Mel Rodgers and INETER staff). Further anomalous activity was not reported that month. A night visit took place on 9 September. The INETER team observed incandescence from the crater and measured temperatures with a thermal camera recording a maximum 458?C. No jetting sounds were heard.
On 13 September INETER measured SO2 with Mobile DOAS. There were seven traverses along an 8.5-km stretch of road to cross below Telica's gas plume. SO2 flux was significantly lower than the previous month with an average of 81 tons/day.
On 13 October, SO2 traverses were attempted, but no gas was detected. Wind patterns had been disrupted by a low-pressure system that caused major flooding along Nicaragua's W coast.
During INETER's 27 October field visit, the team observed incandescence during the day and fragments of molten spatter were released during moderate gas explosions (figure 28). They also observed minor gas emissions and loud jetting persisted from the crater. INETER took five measurements of crater temperature, which averaged 280?C. Temperatures from three fumaroles S of seismic station TEL4 were 66-72°C. Vegetation was noticeably affected by volcanic gases; numerous dead plants were photographed during the 27 October visit.
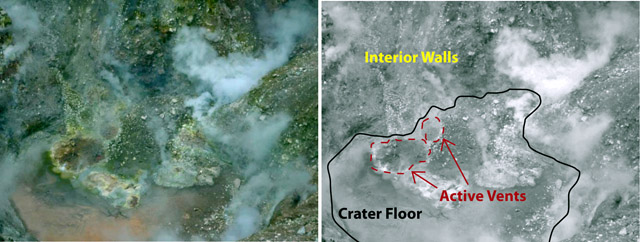 |
Figure 28. Two photos both showing the same scene, centered on active vents within Telica's summit crater on 27 October 2011. Original photo (left); black and white copy (right). Gas explosions and spatter escaped from these vents during the field visit. Courtesy of INETER. |
References. Bellos, A., Mulholland, K., O'Brien, K.L., Qazi, S.A., Gayer, M., Checchi, F., 2010, The burden of acute respiratory infections in crisis-affected populations: a systematic review: Conflict and Health, v. 4, no. 3.
Freundt, A., Kutterolf, S., Schmincke, H.-U., Hansteen, T., Wehrmann, H., Peréz, W., Strauch, W., Navarro, M., 2006, Volcanic hazards in Nicaragua: Past, present, and future, in Rose, W.I., Bluth, G.J.S., Carr, M.J., Ewert, J.W., Patino, L.C., and Vallance, J.W., eds., Volcanic hazards in Central America: Geological Society of America Special Paper 412, p. 141-165.
Malilay, J., Real, M.G., Vanegas, A.R., Noji, E., and Sinks, T., 1996, Public Health Surveillance after a Volcanic Eruption: Lessons from Cerro Negro, Nicaragua, 1992: Bulletin of Pan American Health Organization, v. 30, no. 3.
Witter, M.R., Geirsson, H., La Femina, P.C., Roman, D.C., Rodgers, M., Muñoz, A., Morales, A., Tenorio, V., Chavarria, D., Feineman, M.D., Furman, T., and Longley, A., 2011, May 2011 eruption of Telica Volcano, Nicaragua: Multidisciplinary observations, Abstract V53E-2670, Fall Meeting, AGU, San Francisco, California.
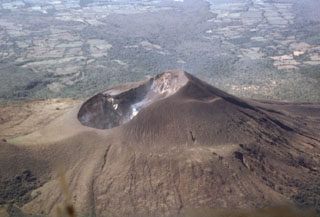
Geological Summary. Telica, one of Nicaragua's most active volcanoes, has erupted frequently since the beginning of the Spanish era. This volcano group consists of several interlocking cones and vents with a general NW alignment. Sixteenth-century eruptions were reported at symmetrical Santa Clara volcano at the SW end of the group. However, its eroded and breached crater has been covered by forests throughout historical time, and these eruptions may have originated from Telica, whose upper slopes in contrast are unvegetated. The steep-sided cone of Telica is truncated by a 700-m-wide double crater; the southern crater, the source of recent eruptions, is 120 m deep. El Liston, immediately E, has several nested craters. The fumaroles and boiling mudpots of Hervideros de San Jacinto, SE of Telica, form a prominent geothermal area frequented by tourists, and geothermal exploration has occurred nearby.
Information Contacts: Instituto Nicaragüense de Estudios Territoriales (INETER), Apartado Postal 2110, Managua, Nicaragua (URL: http://www.ineter.gob.ni/); Washington Volcanic Ash Advisory Center, Satellite Analysis Branch (SAB), NOAA/NESDIS E/SP23, NOAA Science Center Room 401, 5200 Auth Rd, Camp Springs, MD 20746, USA (URL: http://www.ospo.noaa.gov/Products/atmosphere/vaac/); Halldor Geirsson, The Pennsylvania State University, Department of Geosciences, 536 Deike Building, University Park, PA 16802, USA; La Prensa: (URL: http://www.laprensa.com.ni/2011/05/19/departamentos/60948); Mel Rodgers, University of South Florida, Department of Geology, 4202 East Fowler Ave., SCA528, Tampa, FL 33620, USA.