Report on Zubair Group (Yemen) — July 2016

Bulletin of the Global Volcanism Network, vol. 41, no. 7 (July 2016)
Managing Editor: Edward Venzke.
Edited by A. Elizabeth Crafford.
Zubair Group (Yemen) Two new volcanic islands; Sholan eruption ends January 2012, Jadid emerges in September 2013
Please cite this report as:
Global Volcanism Program, 2016. Report on Zubair Group (Yemen) (Crafford, A.E., and Venzke, E., eds.). Bulletin of the Global Volcanism Network, 41:7. Smithsonian Institution. https://doi.org/10.5479/si.GVP.BGVN201607-221020
Zubair Group
Yemen
15.05°N, 42.18°E; summit elev. 191 m
All times are local (unless otherwise noted)
The Zubair group in the southern Red Sea had been volcanically quiet since at least 1846 until two new islands formed: Sholan in 2011-12, and Jadid in 2013. The previously reported eruption of Sholan (BGVN 36:11 and 38:04) began in mid-December 2011, and the last day with activity seen in satellite imagery was 12 January 2012. The first evidence for the eruption that formed the island of Jadid was a MODVOLC thermal anomaly recorded on 28 September 2013 and the last satellite imagery indicating activity was 20 November 2013. A Nature Communications article by Xu, Ruch and Jonsson in 2015 provides most of the information discussed below about the 2013 eruption, as well as additional information about the 2011-2012 eruption that formed Sholan island.
Optical satellite imagery indicated cessation of the eruption at the new Sholan Island NW of Rugged Island on 12 January 2012. Subsequently about 30% of the island was eroded in 2012-2013. A new eruption 8 km SE of Sholan, NW of Saba Island, was captured by thermal anomaly and SO2 monitoring satellite instruments beginning 28 September 2013 (local time). The new Jadid Island was clearly visible by 23 October 2013 with a plume rising from it, and the last volcanic activity was observed via satellite on 20 November 2013. Significant seismic swarms in the area preceded both eruptions.
At least six seismic swarms occurred in the southern Red Sea between 1994 and 2014, according to Xu et al. (2015). Three of these were followed by nearby volcanic eruptions; in 2007 at Jebel at Tair (50 km NW of the Zubair group); in 2011 NW of Rugged island, forming Sholan island; and in 2013 NW of Saba, forming Jadid island (figure 7).
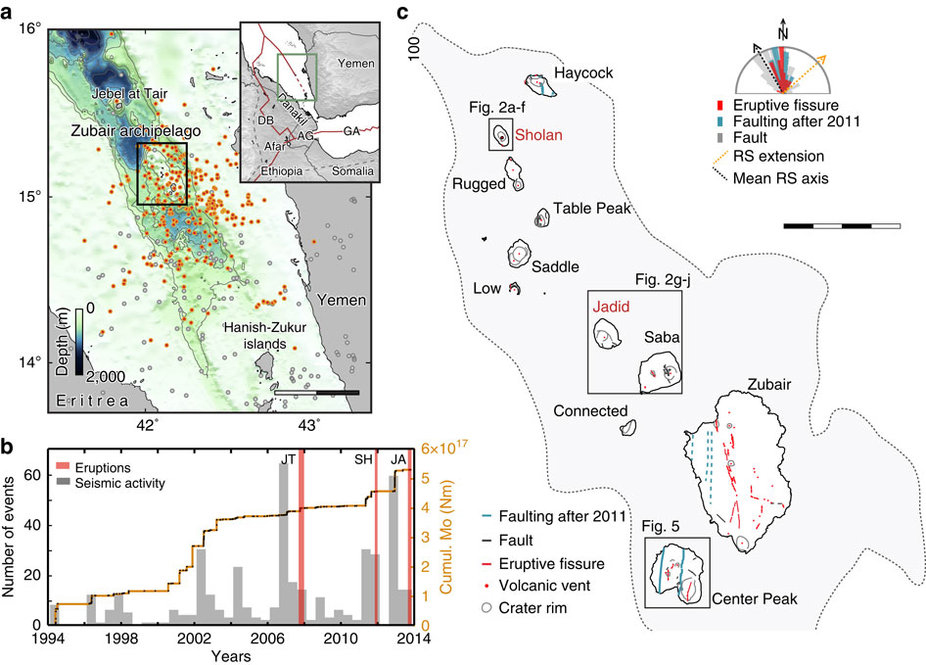 |
Figure 7. The Zubair archipelago and its seismic and volcanic activity during 1994-2014. (a) Earthquake locations (ISC catalogue) in the southern Red Sea with orange dots highlighting events related to seismic swarms. Red lines in the inset delineate the plate boundaries separating the Nubian, Somalian, and Arabian plates. DB, Dabbahu; AG, Asal-Ghoubbet; GA, Gulf of Aden. Scale bar, 50 km. (b) Cumulative seismic moment release (orange line), number of events per 3 months (grey bars) and eruptions (red bars) at Jebel at Tair (JT), Sholan (SH) and Jadid (JA) islands. (c) Map of the Zubair archipelago (the grey dotted line outlines platform depths shallower than 100 m) including the new Sholan and Jadid islands and general structural feature locations and orientations (stereoplot; RS for Red Sea). Scale bar, 4 km. Taken from figure 1 of Xu et al. (2015). |
Activity at Sholan. Three distinct earthquake swarms in April, June, and August 2011 occurred in the area during the eight months prior to the eruption that created Sholan, in addition to the two earthquakes detected by the Yemeni seismological network on 13 December 2011 (reported earlier). A sequence of satellite images between 23 December 2011 and 24 February 2014 show the subaerial eruptive sequence and subsequent erosion of the island (figure 8).
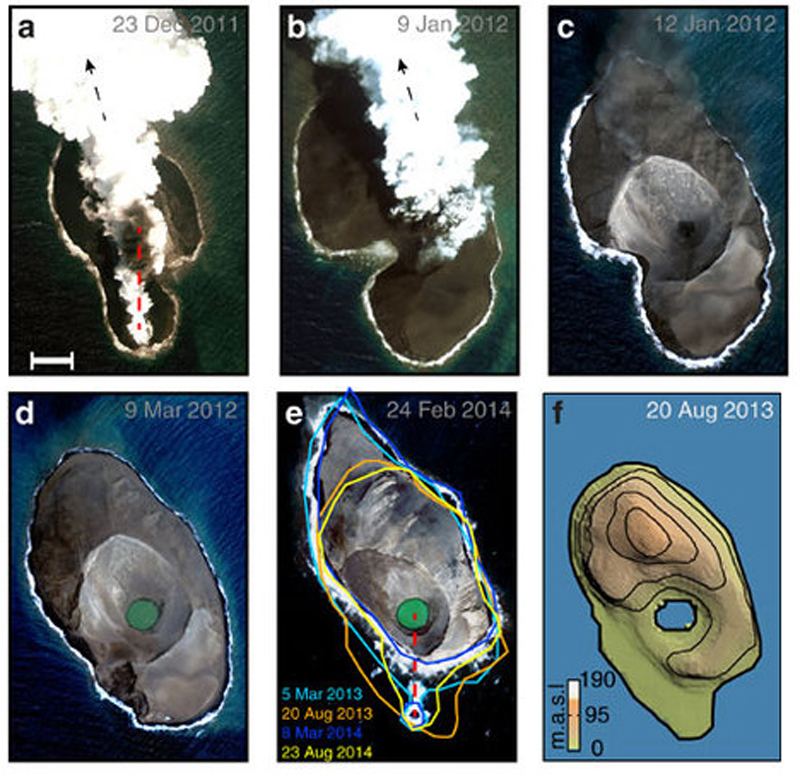 |
Figure 8. Formation and erosion of Sholan island in the Zubair archipelago between 23 December 2011 and 24 February 2014. High-resolution optical satellite images show (a-b) the 2011-2012 Sholan eruption and (c-e) its post-eruptive changes. (f) TanDEM-X (high-resolution InSAR digital elevation model) shaded relief topography of Sholan island with 20-m elevation contours on 20 August 2013. The red dashed line in a and e indicates the 2011-2012 eruptive fissure orientation; the black dashed arrows in a and b indicate the direction of volcanic ash deposits during the construction of the island, and coastline changes are color-coded in e. Scale bar shown in panel (a) is 100 m. Taken from figure 2 of Xu et al. (2015). |
As pointed out by Xu et al. (2015), initially, the eruption appeared to come from a N-S fissure (figure 8a), but later coalesced around a single vent (figure 8b). The image from 12 January 2012 (figure 8c) shows only a narrow dark plume, after which no additional activity was observed. Erosion of the island and formation of a crater lake became apparent by 9 March 2012 (figure 8d). The maximum subaerial area of the island was reported as 0.25 km2 with dimensions of 0.52 x 0.77 km shortly after the end of the eruption. Yemeni scientists who visited on 17 January 2012 found hydromagmatic deposits and witnessed several landslides on the steep, unstable flanks (Jamal Sholan, personal communication, 2013, in Wu et al., 2015). By 24 February 2014 the subaerial area had decreased by ~30% to 0.18 km2 (figure 8e).
Activity at Jadid. Earthquake swarms were recorded in December 2012, May 2013, and September 2013 (figure 7b) in the area around the Zubair islands. Six earthquakes with magnitudes less than 4 were detected to the east of the Zubair islands two days before the eruption was noticed. A MODVOLC thermal alert of a single pixel on 28 September 2013 local time (2320 UTM on 27 September) was followed by an SO2 plume detected by the Ozone Monitoring Instrument (OMI) on 28 and 29 September 2013 (figure 9).
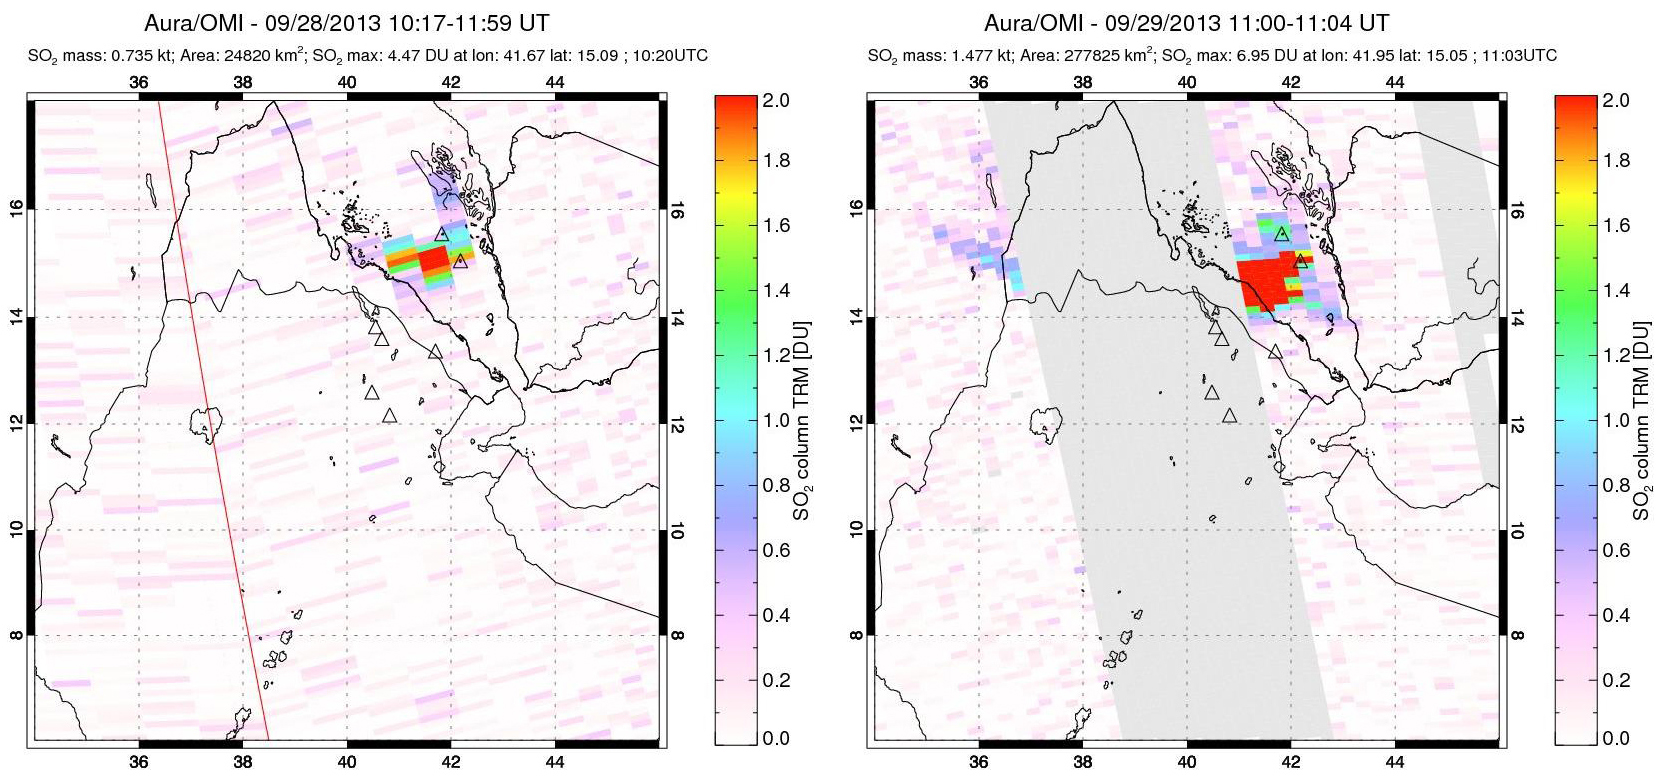 |
Figure 9. The first SO2 plumes from the Jadid Island eruption at Zubair on 28 and 29 September 2013. Courtesy of NASA GSFC (Goddard Space Flight Center). |
The first optical imagery of the eruption (figure 10), reported by Xu et al. (2015), was acquired on 29 September 2013 and shows discolored seawater and a plume rising from the sea surface NW of Saba Island (figure 10g). A new island is visible in a 23 October 2013 image (figure 10h) with a 0.8-km-diameter cone at its center. Its final appearance was a near circular shape with a diameter of ~0.9 km and subaerial size of ~ 0.68 km2 (figure 10j). Its size had decreased slightly from erosion by 24 February 2014 to 0.67 km2.
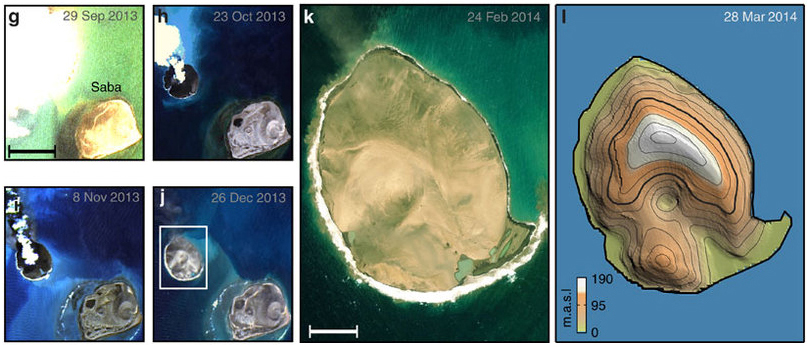 |
Figure 10. High-resolution optical satellite images of the formation of Jadid Island in the Zubair group between 29 September 2013 and 24 February 2014. Scale bar shown in (g) is 1 km. (j) shows post-eruptive change. (k) is a closeup of Jadid from a WorldView-2 image, scale bar: 200 m. (I) is a TanDEM-X (high-resolution InSAR digital elevation model) shaded relief topography of Jadid with 20-m elevation contours. Taken from figure 2 of Xu et al (2015). |
No further MODVOLC thermal alert pixels were recorded in the area, but SO2 anomalies were intermittently observed by the OMI satellite instrument until 16 October 2013. Additional optical imagery that showed the eruption was reported by Xu et al. (2015) until 20 November 2013. Google Earth imagery confirmed the presence of two new islands in the Zubair group by 2014 (figure 11).
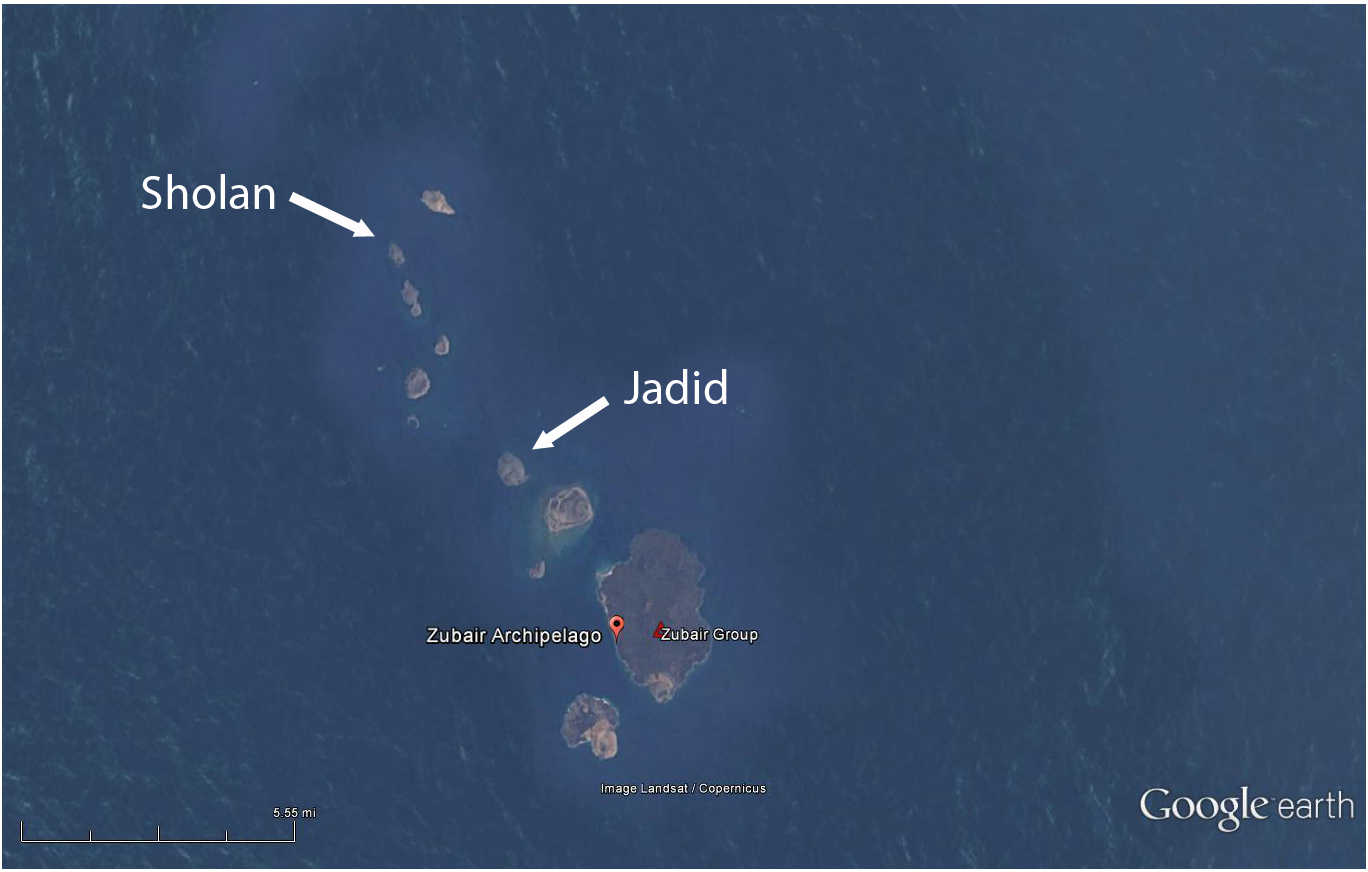 |
Figure 11. Google Earth imagery dated 30 December 2014 showing two new islands in the Zubair Archipelago. Sholan emerged between December 2011 and January 2012, and Jadid emerged between September and November 2013. Courtesy of Google Earth. |
References: Xu, W., Ruch, J., and Jonsson, S., 2015, Birth of two volcanic islands in the southern Red Sea. Nature Communications 6:7104. doi: 10.1038/ncomms8104 (2015).
Geological Summary. The 5-km-long Jebel Zubair Island is the largest of a group of small islands and submerged shoals that rise from a shallow platform in the Red Sea rift. The platform and eruptive vents forming the islands and shoals are oriented NNW-SSE, parallel to the rift. An early explosive phase was followed by a brief period of marine erosion, then by renewed explosive activity accompanied by the extrusion of basaltic pahoehoe lava flows. This latest phase of activity occurred on the morphologically youngest islands of Zubair, Centre Peak, Saba, and Haycock. Historical explosive activity was reported from Saddle Island in the 19th century. Spatter cones and pyroclastic cones were erupted along fissures that form the low spine of Zubair Island. Eruptions that began in late 2011 built two new islands, increasing the total number in the group to 12.
Information Contacts: Hawai'i Institute of Geophysics and Planetology (HIGP), MODVOLC Thermal Alerts System, School of Ocean and Earth Science and Technology (SOEST), Univ. of Hawai'i, 2525 Correa Road, Honolulu, HI 96822, USA (URL: http://modis.higp.hawaii.edu/, http://modis.higp.hawaii.edu/cgi-bin/modisnew.cgi); NASA Goddard Space Flight Center (NASA/GSFC), Global Sulfur Dioxide Monitoring Page, Atmospheric Chemistry and Dynamics Laboratory, Goddard, Maryland, USA (URL: https://so2.gsfc.nasa.gov/); Google Earth (URL: https://www.google.com/earth/).