Report on Sabancaya (Peru) — June 2018
Bulletin of the Global Volcanism Network, vol. 43, no. 6 (June 2018)
Managing Editor: Edward Venzke.
Edited by A. Elizabeth Crafford.
Sabancaya (Peru) Strong, sporadic explosions with ash plumes throughout December 2017-May 2018
Please cite this report as:
Global Volcanism Program, 2018. Report on Sabancaya (Peru) (Crafford, A.E., and Venzke, E., eds.). Bulletin of the Global Volcanism Network, 43:6. Smithsonian Institution. https://doi.org/10.5479/si.GVP.BGVN201806-354006
Sabancaya
Peru
15.787°S, 71.857°W; summit elev. 5960 m
All times are local (unless otherwise noted)
Although tephrochronology has dated activity at Sabancaya back several thousand years, renewed activity that began in 1986 was the first recorded in over 200 years. Intermittent activity since then has produced significant ashfall deposits, seismic unrest, and fumarolic emissions. A renewed period of explosive activity began in early November 2016 and continued through 2017. It was characterized by continuing pulses of ash emissions with plume heights exceeding 10 km altitude, thermal anomalies, and numerous significant SO2 plumes (BGVN 42:12). Details of the continuing eruptive activity from December 2017 to May 2018 in this report come from the two Peruvian observatories that monitor the volcano: Instituto Geofisico del Peru - Observatoria Vulcanologico del Sur (IGP-OVS), and Observatorio Volcanologico del INGEMMET (Instituto Geológical Minero y Metalúrgico) (OVI-INGEMMET). Aviation notices come from the Buenos Aires Volcanic Ash Advisory Center (VAAC), and satellite data is reported from several sources.
Sabancaya continued with its explosive eruption that began on 6 November 2016 during December 2017-May 2018. Around 100 aviation notices were issued each month by the Buenos Aires VAAC; tens of daily explosions were reported, fluctuating from highs in the 60s per day in December 2017 to lows in the teens per day during February-April 2018. Ash plumes heights varied at 3-5 km above the summit; altitudes mentioned in the VAAC reports were between 7.3 and 8.5 km altitude most days, although plume heights over 9.1 km were observed a number of times. MIROVA thermal anomalies were recorded every week; MODVOLC thermal alerts occurred every month. A significant number of SO2 anomalies greater than two Dobson Units were measured by NASA's Goddard Space Flight Center each month (table 2).
Table 2. Eruptive Activity at Sabancaya, December 2017-May 2018. Compiled using data from IGP-OVS, OVI-INGEMMET, Buenos Aires VAAC, HIGP - MODVOLC Thermal Alerts System, and NASA Goddard Space Flight Center.
| Month | VAAC Reports | Avg Daily Explosions by week | Max Plume Heights (m above crater) | Plume Drift | MODVOLC Alerts | Min Days with SO2 over 2 DU |
| Dec 2017 | 120 | 69, 63, 55, 67, 42 | 2,500-3,300 | 40-50 km, SW, NE, NW, W, N | 2 | 7 |
| Jan 2018 | 101 | 41, 57, 57, 33 | 2,500-3,300 | 50 km, SW, W, NW, N | 2 | 13 |
| Feb 2018 | 94 | 22, 18, 19, 17 | 2,500-4,500 | 30-50 km, SE, S, SW, NW | 1 | 12 |
| Mar 2018 | 115 | 12, 10, 17, 17, 18 | 2,000-5,350 | 30-50 km, S, SW, W, NW, N | 3 | 13 |
| Apr 2018 | 114 | 15, 15, 19, 22 | 2,000-3,200 | 30-40 km, All | 3 | 12 |
| May 2018 | 132 | 25, 27, 30, 35, 28 | 1,900-4,300 | 30-40 km, NW, N, NE, E, SE, S | 4 | 7 |
Activity during December 2017-February 2018. The Buenos Aires VAAC issued 120 aviation alerts during December 2017; webcam and satellite imagery revealed continuous emissions of water vapor and gas, accompanied by sporadic puffs of ash, throughout the month. When visible in satellite imagery, plumes rose to 7.3-8.2 km altitude (figure 46); a few plumes were reported to 9.1 km altitude. According to OVI-INGEMMET, about 1,800 explosions took place in December. During the third week, ashfall was reported in Huambo (28 km WNW). There were two MODVOLC thermal alerts issued, on 3 and 10 December.
 |
Figure 46. Webcam photo of an ash plume at Sabancaya on 16 December 2017. The Buenos Aires VAAC reported a plume that day to 8.2 km altitude. Courtesy of OVI-INGEMMET (RSSAB-51-2017/OVI-INGEMMET & IGP Semana del 11 al 17 de diciembre de 2017). |
The number of explosions reported by OVI-INGEMMET dropped slightly to about 1,400 during January 2018. The number of VAAC reports was similar to December; when weather clouds prevented observations of emissions, seismic activity showed intermittent peaks that suggested puffs of ash. Plume descriptions by the Buenos Aires VAAC ranged from intermittent plumes that rose to 7.0-7.6 km altitude early in the month to persistent puffs of ash that rose to 7.9-8.2 km altitude during the last two weeks of January. The prevailing winds were directed SW and NW, and ash plumes often drifted as far as 50 km. NASA Goddard Space Flight Center recorded at least 13 days with SO2 emissions greater than two Dobson Units (DU) (figure 47). HIGP issued two MODVOLC thermal alerts on 4 and 20 January.
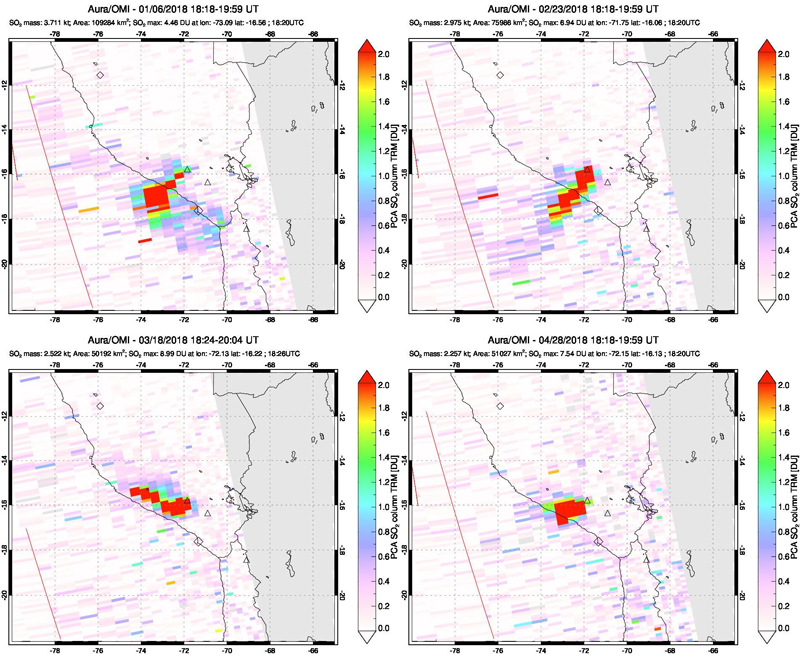 |
Figure 47. SO2 emissions at Sabancaya were significant throughout the report period. Most months, NASA-GSFC measured 10 or more days where the Dobson Unit (DU) values exceeded two. Dobson Units are a measure of the molecular density of SO2 in the atmosphere. The larger plumes shown here are from 6 January 2018 (top left), 23 February 2018 (top right), 18 March 2018 (bottom left), and 28 April 2018 (bottom right). Courtesy of NASA Goddard Space Flight Center. |
OVI-INGEMMET reported ash plume heights during February 2018 at 2,500-4,500 m above the summit. They also noted that deflation was measured during the middle two weeks of the month. The number of daily explosions decreased significantly from the previous few months, with about 500 total explosions recorded in February. The Buenos Aires VAAC noted that the webcam showed continuous emissions of gases with sporadic puffs of ash every day that the summit was visible. Ash plumes were only visible in satellite imagery a few times during the month; during 8-10 February, intermittent emissions were seen moving SE between 7.9 and 8.5 km altitude. During 17-24 February, weak, thin ash plumes drifted several different directions at 7.3-7.9 km altitude (figure 48), and on 28 February a plume was visible drifting NW at 7.6 km altitude. Only a single MODVOLC thermal alert was issued on 18 February.
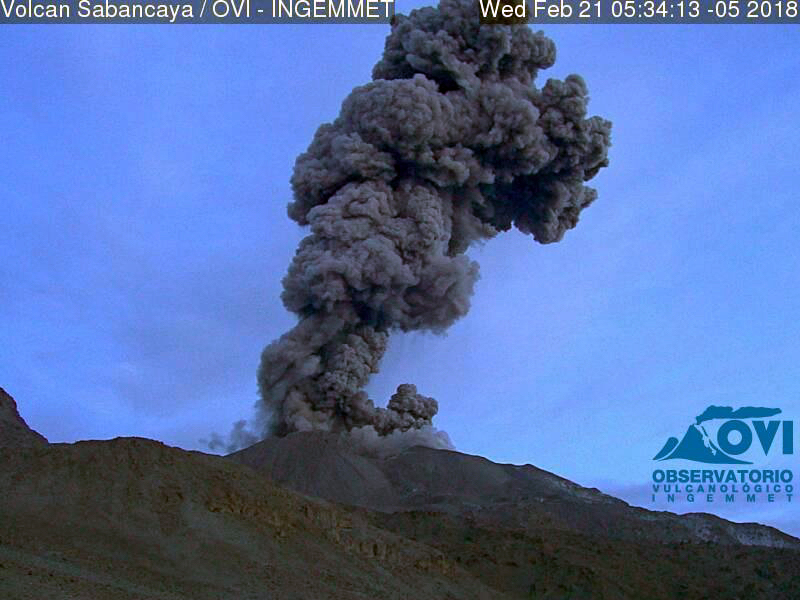 |
Figure 48. A strong pulse of ash rose from the summit of Sabancaya early in the morning of 21 February 2018. Courtesy of OVI-INGEMMET (RSSAB-08-2018/OVI-INGEMMET & IGP Semana del 19 al 25 de febrero de 2018). |
Activity during March-May 2018. Three MODVOLC thermal alerts were issued in March 2018, two on 14 March and one on 27 March. Sporadic ash explosions continued, but with the lowest number per day of the reporting period. About 450 explosions were recorded during March. In spite of the smaller number of explosions, some of the tallest ash plumes of the period occurred this month. The Buenos Aires VAAC reported a diffuse ash plume drifting NW in satellite imagery on 2 March at 8.8 km altitude. The following week, several ash plumes were spotted in satellite imagery at altitudes of 7.3-8.2 km drifting either SW or NW. On 11 March, cloudy weather prevented visual satellite imagery observations, but multispectral imagery and the webcam revealed intermittent pulses of ash moving SW at 7.6 km altitude. The following day sporadic strong pulses of ash were observed in the webcam, and there was a pilot report of an ash plume at 9.1 km altitude. During the second half of March, ash plumes were noted in satellite imagery most days at altitudes of 6.4-8.2 km; a few pulses produced short-lived ash plumes that rose over 9.1 km, including on 14, 22, 24, and during 27-30 March (figure 49). The highest plume was observed in visible imagery drifting E on 28 March at 10.1 km altitude. A lahar was also reported on 28 March descending the SE flank, towards the Sallalli River; no damage was reported.
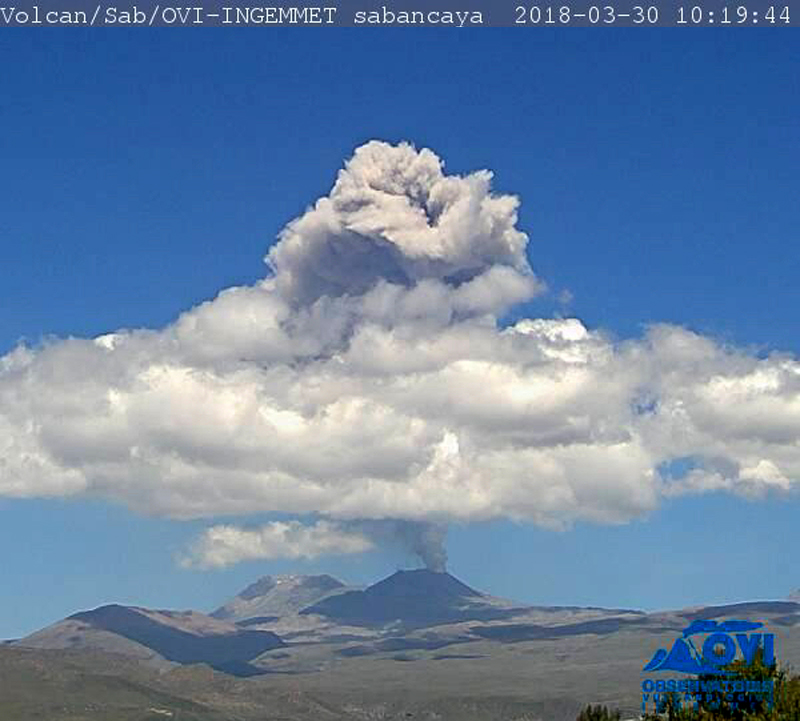 |
Figure 49. An ash plume at Sabancaya on 30 March 2018 can be seen rising from the summit and above the meteorological cloud in this webcam image. The Buenos Aires VAAC reported ash plumes on 30 March that rose to 9.1 and 9.5 km and drifted NE. Courtesy of OVI-INGEMMET (RSSAB-13-2018/OVI-INGEMMET & IGP Semana del 26 de marzo al 01 de abril de 2018). |
The number of explosions during April 2018 increased slightly from March to about 540. The maximum plume heights ranged from 2,000 to 3,200 m above the summit according to OVI-INGEMMET. The webcam showed continuous emissions of water vapor and gas and sporadic pulses of ash throughout the month. Ashfall was reported during the first week in Achoma (23 km NE), Chivay (33 km NE), and Huanca. During the second week, the prevailing winds brought ashfall to the W and NW to Huambo (28 km W) and Cabanaconde (22 km NW). The Buenos Aires VAAC reported faint ash plumes visible in satellite imagery nearly every day; plume heights consistently ranged from 7.0 to 8.2 km altitude. Three MODVOLC thermal alerts were issued during the month, one on 13 April and two on 17 April.
Activity increased in many ways during May 2018. The Buenos Aires VAAC issued 132 aviation alerts, the most of any month during the period. The numbers of daily explosions increased compared to April, resulting in a monthly total of around 900. OVI-INGEMMET reported plume heights up to 4,300 m above the summit. MODVOLC thermal alerts were issued on 8, 19, 24, and 26 May. In addition to ash plumes visible in satellite imagery every day at altitudes of 7.3-8.2 km altitude (figure 50), a significant number of ash plumes were reported to altitudes greater than 9.1 km during the month, resulting in more VONA's (Volcanic Observatory Notice to Aviation) issued than in previous months. Sporadic strong puffs of ash were observed in the webcam on the days that satellite imagery measurements of ash plume heights exceeded 9.1 km including on 4, 5, 10, 14, 19, 21, 22, 25, 28, and 31 May. The highest plumes reached 10.4 km altitude on 19 May and 10.1 km altitude on 25 May. Hotspots were also reported on 20, 24, and 27 May. As in previous months, the webcam showed constant emissions of steam and gas, with intermittent pulses of volcanic ash throughout the month.
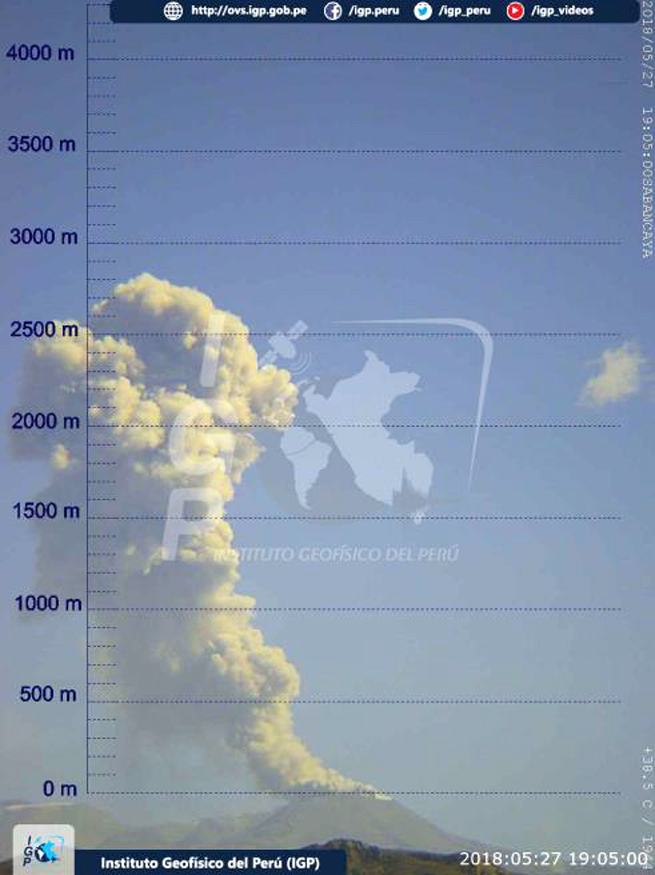 |
Figure 50. An IGP webcam at Sabancaya recorded the plume height above the summit at 2,800 m on 27 May 2018. Courtesy of OVI-INGEMMET (RSSAB-22-2018/OVI-INGEMMET & IGP Semana del 28 de mayo al 3 de junio del 2018). |
Geological Summary. Sabancaya, located in the saddle NE of Ampato and SE of Hualca Hualca volcanoes, is the youngest of these volcanic centers and the only one to have erupted in historical time. The oldest of the three, Nevado Hualca Hualca, is of probable late-Pliocene to early Pleistocene age. The name Sabancaya (meaning "tongue of fire" in the Quechua language) first appeared in records in 1595 CE, suggesting activity prior to that date. Holocene activity has consisted of Plinian eruptions followed by emission of voluminous andesitic and dacitic lava flows, which form an extensive apron around the volcano on all sides but the south. Records of observed eruptions date back to 1750 CE.
Information Contacts: Observatorio Volcanologico del INGEMMET, (Instituto Geológical Minero y Metalúrgico), Barrio Magisterial Nro. 2 B-16 Umacollo - Yanahuara Arequipa, Peru (URL: http://ovi.ingemmet.gob.pe); Instituto Geofisico del Peru, Observatoria Vulcanologico del Sur (IGP-OVS), Arequipa Regional Office, Urb La Marina B-19, Cayma, Arequipa, Peru (URL: http://ovs.igp.gob.pe/); Buenos Aires Volcanic Ash Advisory Center (VAAC), Servicio Meteorológico Nacional-Fuerza Aérea Argentina, 25 de mayo 658, Buenos Aires, Argentina (URL: http://www.smn.gov.ar/vaac/buenosaires/inicio.php); Hawai'i Institute of Geophysics and Planetology (HIGP) - MODVOLC Thermal Alerts System, School of Ocean and Earth Science and Technology (SOEST), Univ. of Hawai'i, 2525 Correa Road, Honolulu, HI 96822, USA (URL: http://modis.higp.hawaii.edu/); NASA Goddard Space Flight Center (NASA/GSFC), Global Sulfur Dioxide Monitoring Page, Atmospheric Chemistry and Dynamics Laboratory, 8800 Greenbelt Road, Goddard, Maryland, USA (URL: https://so2.gsfc.nasa.gov/).