Report on Nevado del Ruiz (Colombia) — January 2020
Bulletin of the Global Volcanism Network, vol. 45, no. 1 (January 2020)
Managing Editor: Edward Venzke.
Edited by Kadie L. Bennis.
Nevado del Ruiz (Colombia) Intermittent ash, gas-and-steam, and SO2 plumes, and thermal anomalies during January 2018-December 2019
Please cite this report as:
Global Volcanism Program, 2020. Report on Nevado del Ruiz (Colombia) (Bennis, K.L., and Venzke, E., eds.). Bulletin of the Global Volcanism Network, 45:1. Smithsonian Institution. https://doi.org/10.5479/si.GVP.BGVN202001-351020
Nevado del Ruiz
Colombia
4.892°N, 75.324°W; summit elev. 5279 m
All times are local (unless otherwise noted)
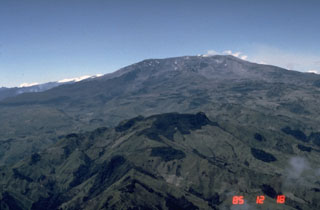
Nevado del Ruiz is a glaciated stratovolcano located in Colombia. It is most known for the eruption on 13 November 1985 that produced an ash plume and pyroclastic flows onto the glacier, triggering a lahar and killing approximately 25,000 people in the towns of Armero (46 km W) and Chinchiná (34 km E). Since the September 1985-July 1991 eruption, volcanism has occurred dominantly at the Arenas crater, with eruptive periods during February 2012-July 2013 and November 2014-May 2017 (BGVN 42:06 and 44:12). The previous eruption included ash and gas-and-steam plumes, ashfall, and thermal anomalies through May 2017, after which no clear observations of ongoing activity were available until an ash plume was seen in satellite and webcam images on 18 December 2017. This report provides data and observations from January 2018 through December 2019 using information primarily from reports by the Servicio Geologico Colombiano and the Observatorio Vulcanológico y Sismológico de Manizales, the Washington Volcanic Ash Advisory Center (VAAC) notices, and various satellite data.
Summary of activity during December 2017-December 2019. Although data is incomplete, the current eruptive period is considered to have begun with the emission of an ash plume on 18 December 2017. The Washington VAAC issued an advisory that day for an ash plume to 6 km that was moving west and dispersing, further describing it as a "thin veil of volcanic ash and gasses" that was seen in visible satellite imagery, NOAA/CIMSS, and supported by webcam imagery.
Reports of significant ash plumes visible in satellite imagery were infrequent in 2018 and 2019, with a few notable pulses in July 2018, February-March 2019, and August-September 2019 (figure 95). Sentinel-2 thermal satellite data in comparison with Suomi NPP/VIIRS sensor data, and the MODVOLC algorithm for MODIS data registered infrared thermal hotspots intermittently throughout 2018 to 2019 with more frequent anomalies during January-March 2018, August 2018, October 2018-February 2019, and November-December 2019; observations during March-June of each year were low. Identification of SO2 emissions were frequent and consistent during all of 2018-2019 (figure 96).
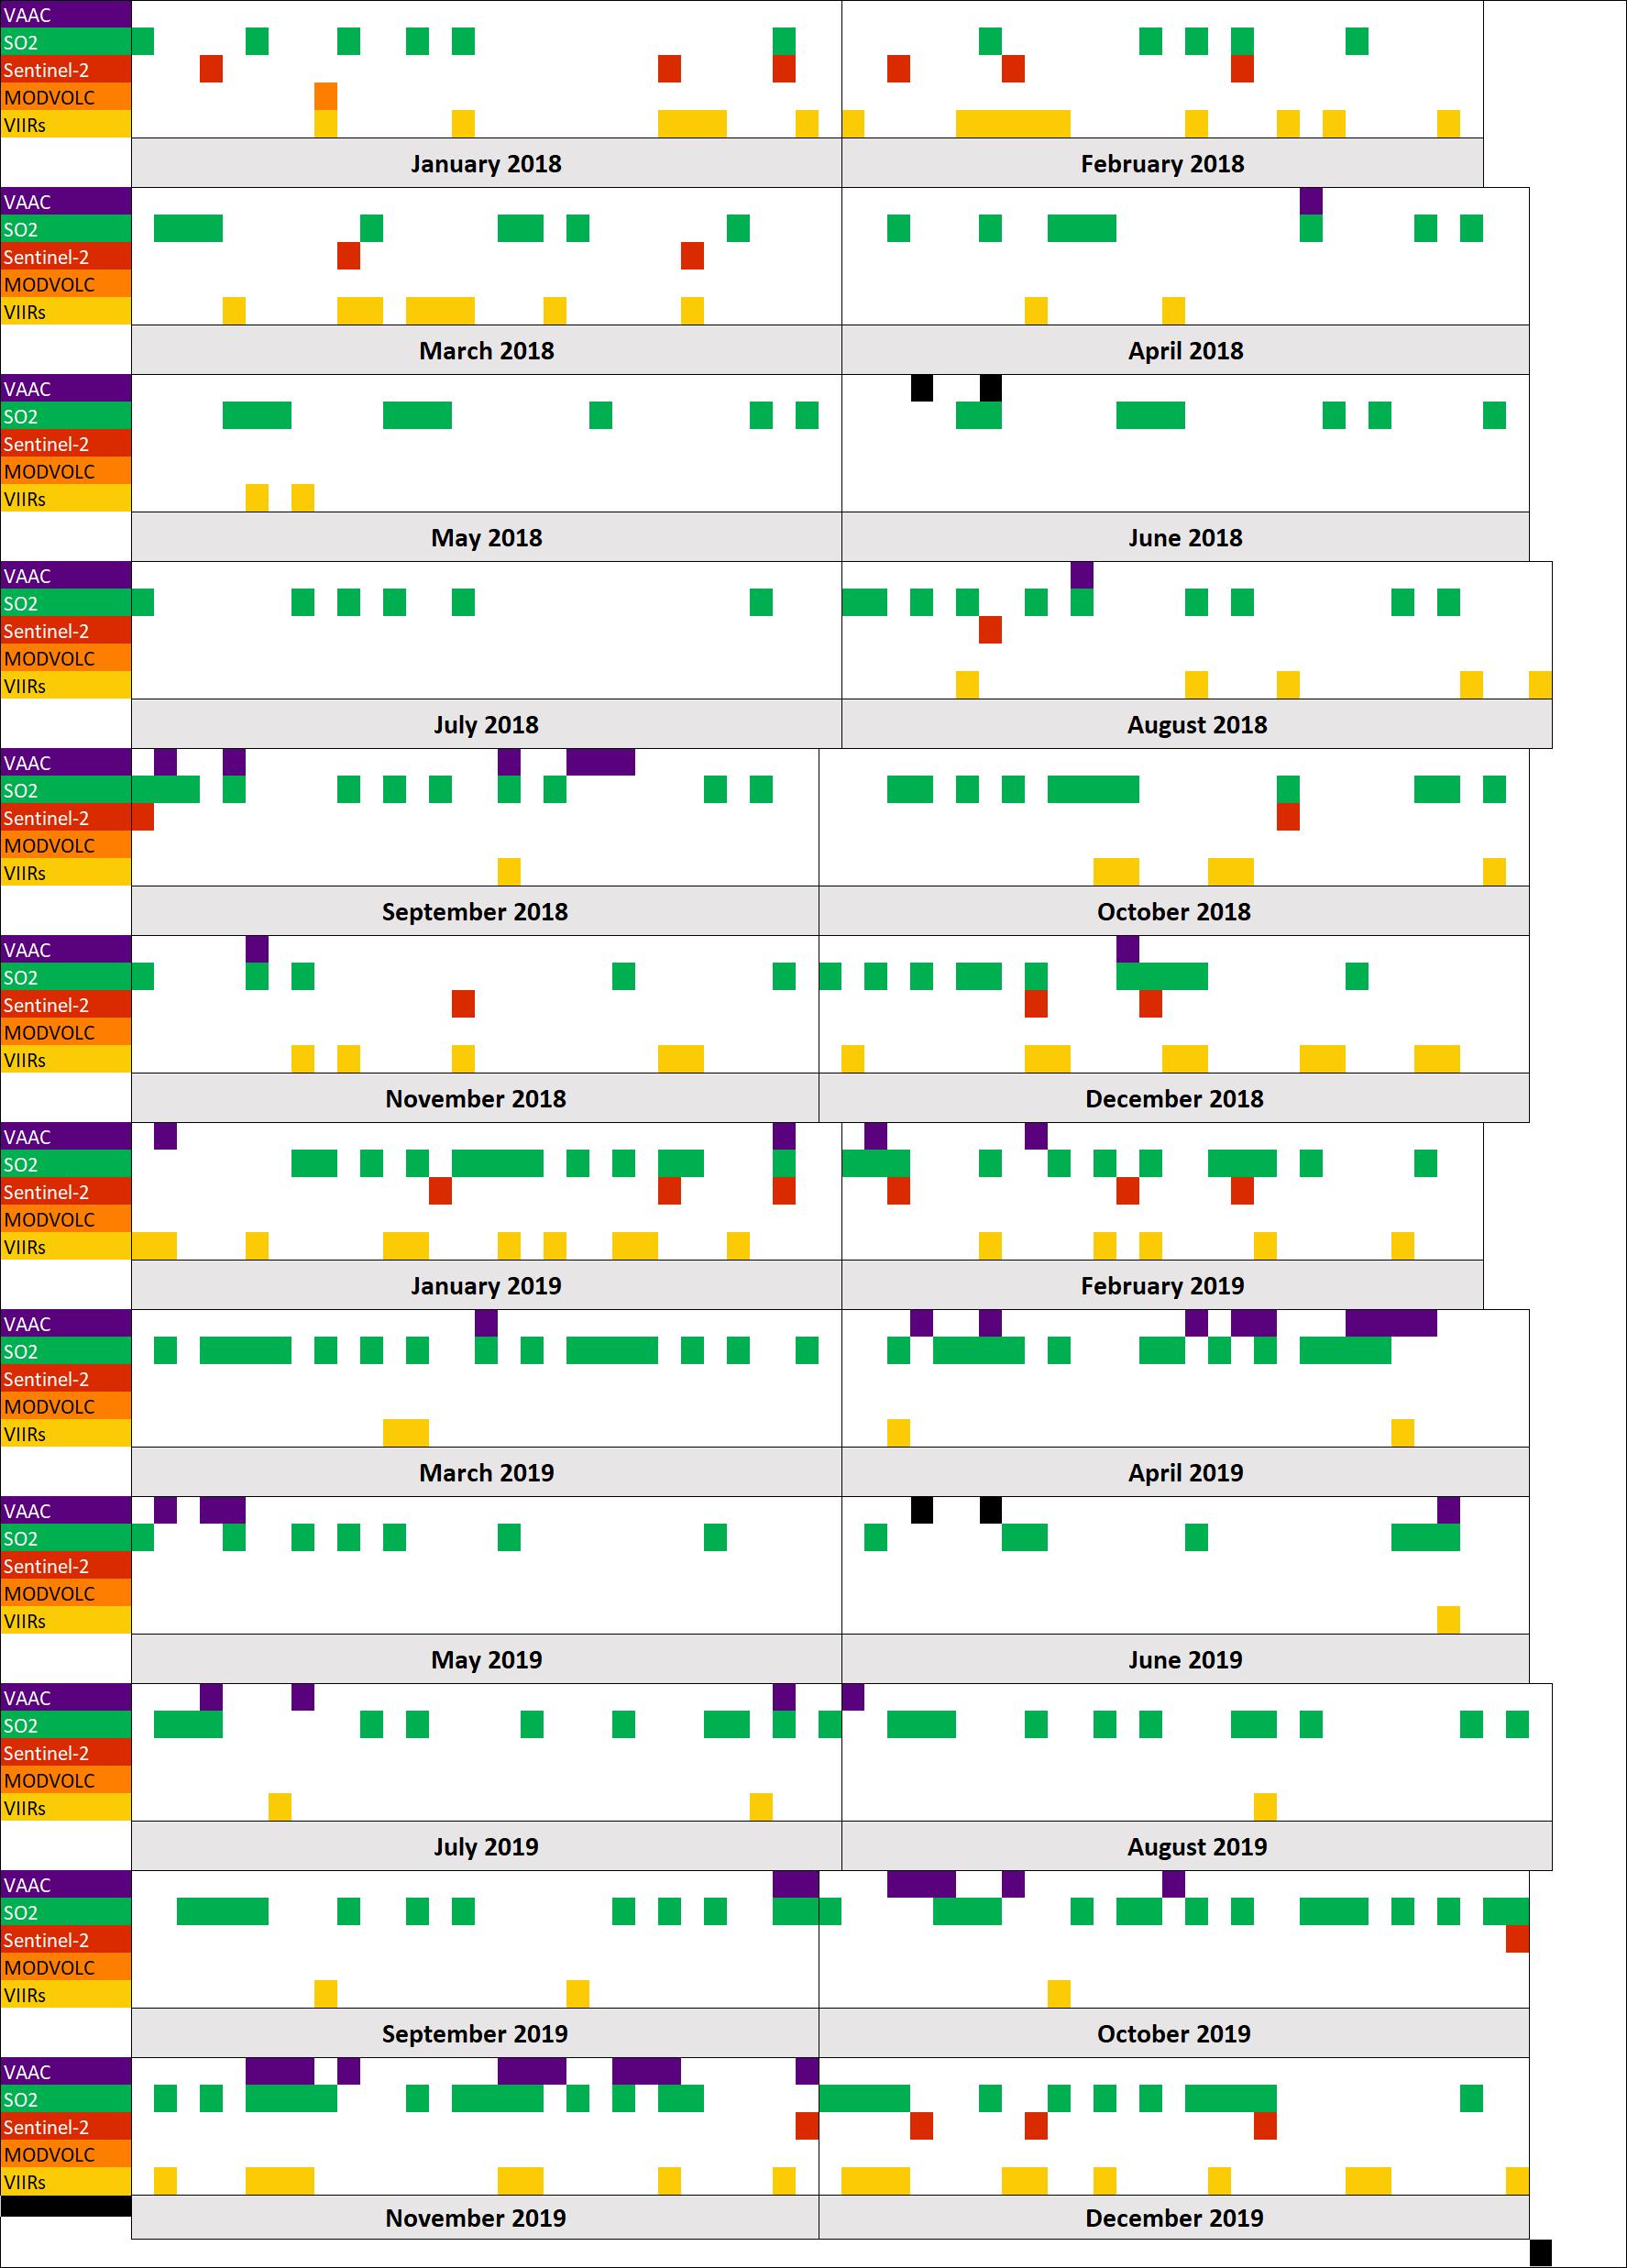 |
Figure 95. Timeline summary of observed activity at Nevado del Ruiz from January 2018 through December 2019. VAAC reports typically indicate a significant ash plume. Satellite-based SO2 data is variable with respect to volume of emitted gas, but reflects a point source at the volcano. For Sentinel-2, MODVOLC, and VIIRS data, the dates indicated represents detected thermal anomalies. White areas indicate no activity was observed, which may also be due to meteoric clouds. Data courtesy of Washington VAAC, NASA Goddard Space Flight Center, Sentinel Hub Playground, HIGP, and NASA Worldview using the "Fire and Thermal Anomalies" layer. |
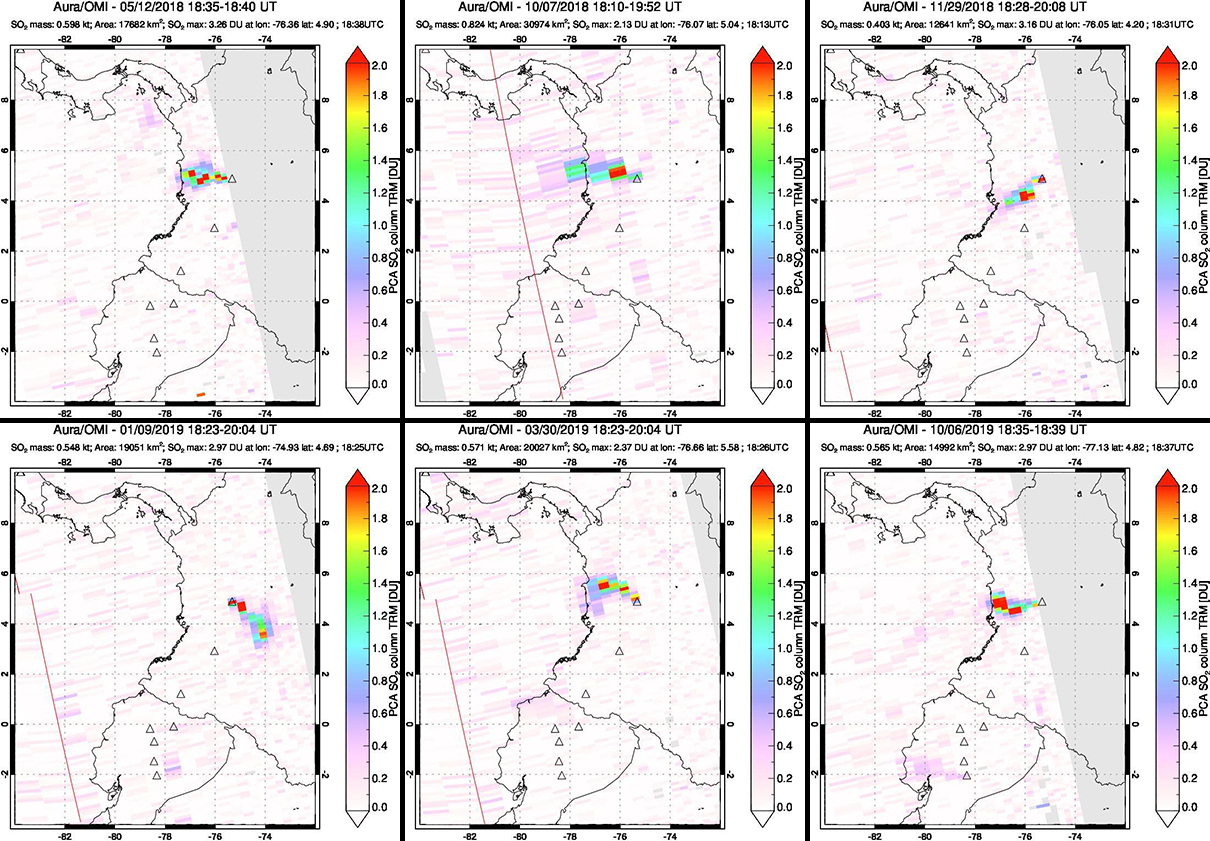 |
Figure 96. Examples of SO2 plumes from Nevado del Ruiz detected by the Aura/OMI instrument during 12 May (top left), 7 October (top middle), and 29 November 2018 (top right) and 9 January (bottom left), 30 March (bottom middle), and 6 October 2019 (bottom right). Courtesy of NASA Goddard Space Flight Center. |
MIROVA (Middle InfraRed Observation of Volcanic Activity) analysis of MODIS satellite data shows weak thermal anomalies within 5 km of the summit occurring dominantly between October 2018 through March 2019 (figure 97). Between April and October 2019, the number of thermal anomalies was low, registering eight during this time. The number of thermal signatures increased at the beginning of November 2019 and continued through the rest of 2019.
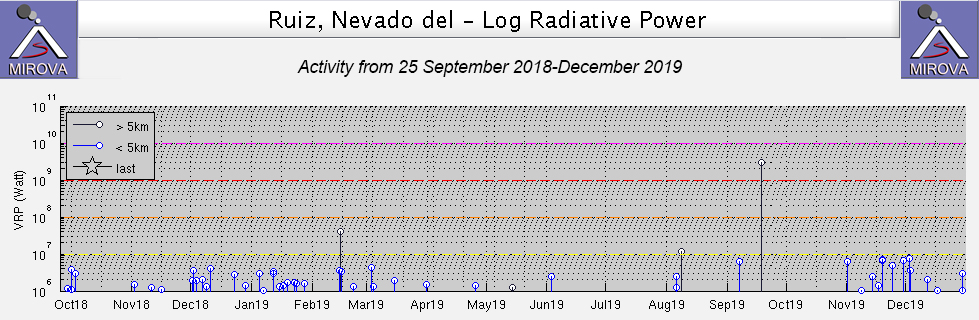 |
Figure 97. Weak thermal anomalies at Nevado del Ruiz for 25 September 2018 through December 2019 as recorded by the MIROVA system (log radiative power) occurred mostly during December 2018 through March 2019. Activity was low during April to October 2019 with renewed signatures in November 2019. Courtesy of MIROVA. |
Seismicity that occurred during 2018-2019 was located mainly in the Arenas crater and consisted of low-frequency (LF) and very low-frequency (VLF) earthquakes and volcanic tremors, many of which were associated with minor gas-and-steam and ash emissions confirmed through webcams. The number of earthquakes reported by SGC fluctuated each week, but the energy remained relatively consistent. The highest magnitude earthquake that occurred during 2018 was on 26 October reaching 3.1 ML (local magnitude) and during 2019 the largest was 2.8 ML on 21 April.
Activity during 2018. Throughout 2018, gas-and-steam plumes, mostly composed of water vapor and sulfur dioxide frequently occurred, rising to a maximum of 2.2 km above the Arenas crater on 24 March. Weak thermal anomalies were seen intermittently in thermal satellite imagery from Sentinel-2 and NASA Worldview during 4 January through March and September to December (figure 98). Activity during March to April 2018 was relatively low and consisted dominantly of gas-and-steam emissions, low-energy seismicity, and intermittent thermal anomalies. Between 9 May and 5 August, no thermal signatures were detected.
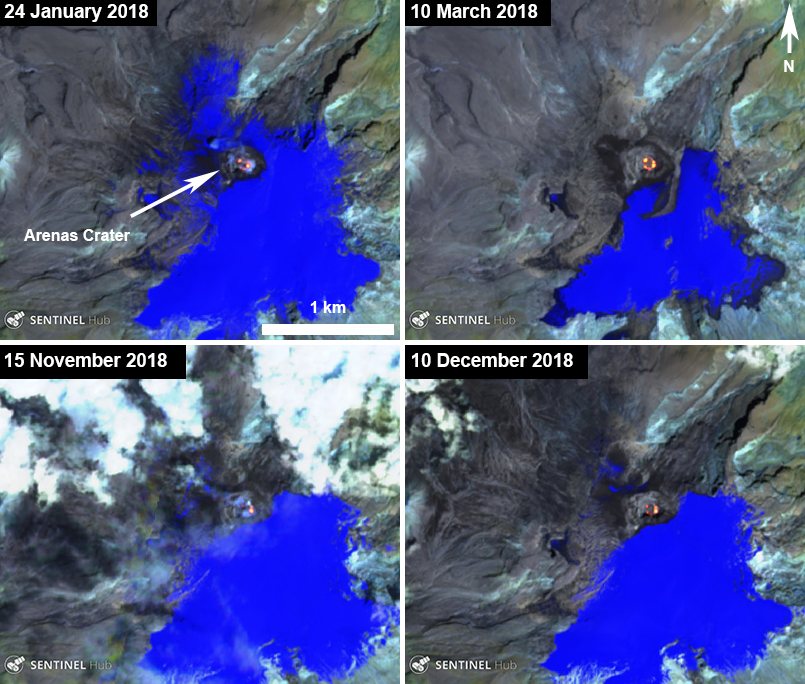 |
Figure 98. Sentinel-2 thermal satellite imagery detected thermal anomalies (bright yellow-orange) within the Arenas crater at Nevado del Ruiz that were mostly visible during the beginning and last months of 2018. Sentinel-2 atmospheric penetration (bands 12, 11, 8A) images courtesy of Sentinel Hub Playground. |
Ash plumes were seen in GOES-EAST satellite imagery, through webcams, and by SGC personnel. The first ash plume of 2018 occurred on 21 April at 0800, six days after NASA Worldview detected a thermal anomaly within the Arenas crater. The plume rose 6 km altitude and drifted NW as seen in GOES-EAST satellite imagery and reported by the Washington VAAC. Weak gas-and-steam and ash emissions were confirmed by webcams on 22 July, associated with a volcanic tremor. On 11 August 2018, another ash plume was reported in a VAAC notice rising 6.7 km altitude drifting W. During the week of 21 August, SGC reported that seismicity in the Arenas crater was associated with minor gas-and-steam and ash emissions, as confirmed by webcams.
The number of ash plumes increased during September (figure 99), one of which reached a maximum altitude of 7.3 km on 2 September. On 5 September, a continuous volcanic tremor occurred and was accompanied by an ash plume rising 7 km altitude drifting W, according to a Washington VAAC report. Ashfall was observed during the week of 11 September in Manizales (30 km NW) and Villamaría (27 km NW). A new volcanic tremor occurred on 15 September and was accompanied by various ash emissions reaching 1.4 km above the crater and drifting NW as confirmed by PNNN, inhabitants within the vicinity of the volcano, and the Washington VAAC. Seismicity continuing into the weeks of 25 September and 2 October was also accompanied by ash emissions, rising to an altitude of 1.4 km above the crater on 22 September. The number of reported gas-and-steam and ash emissions decreased after September; ash emissions were reported by SGC on 19, 22, 26, and 31 October, 6, 9, and 17 November, and 14 December.
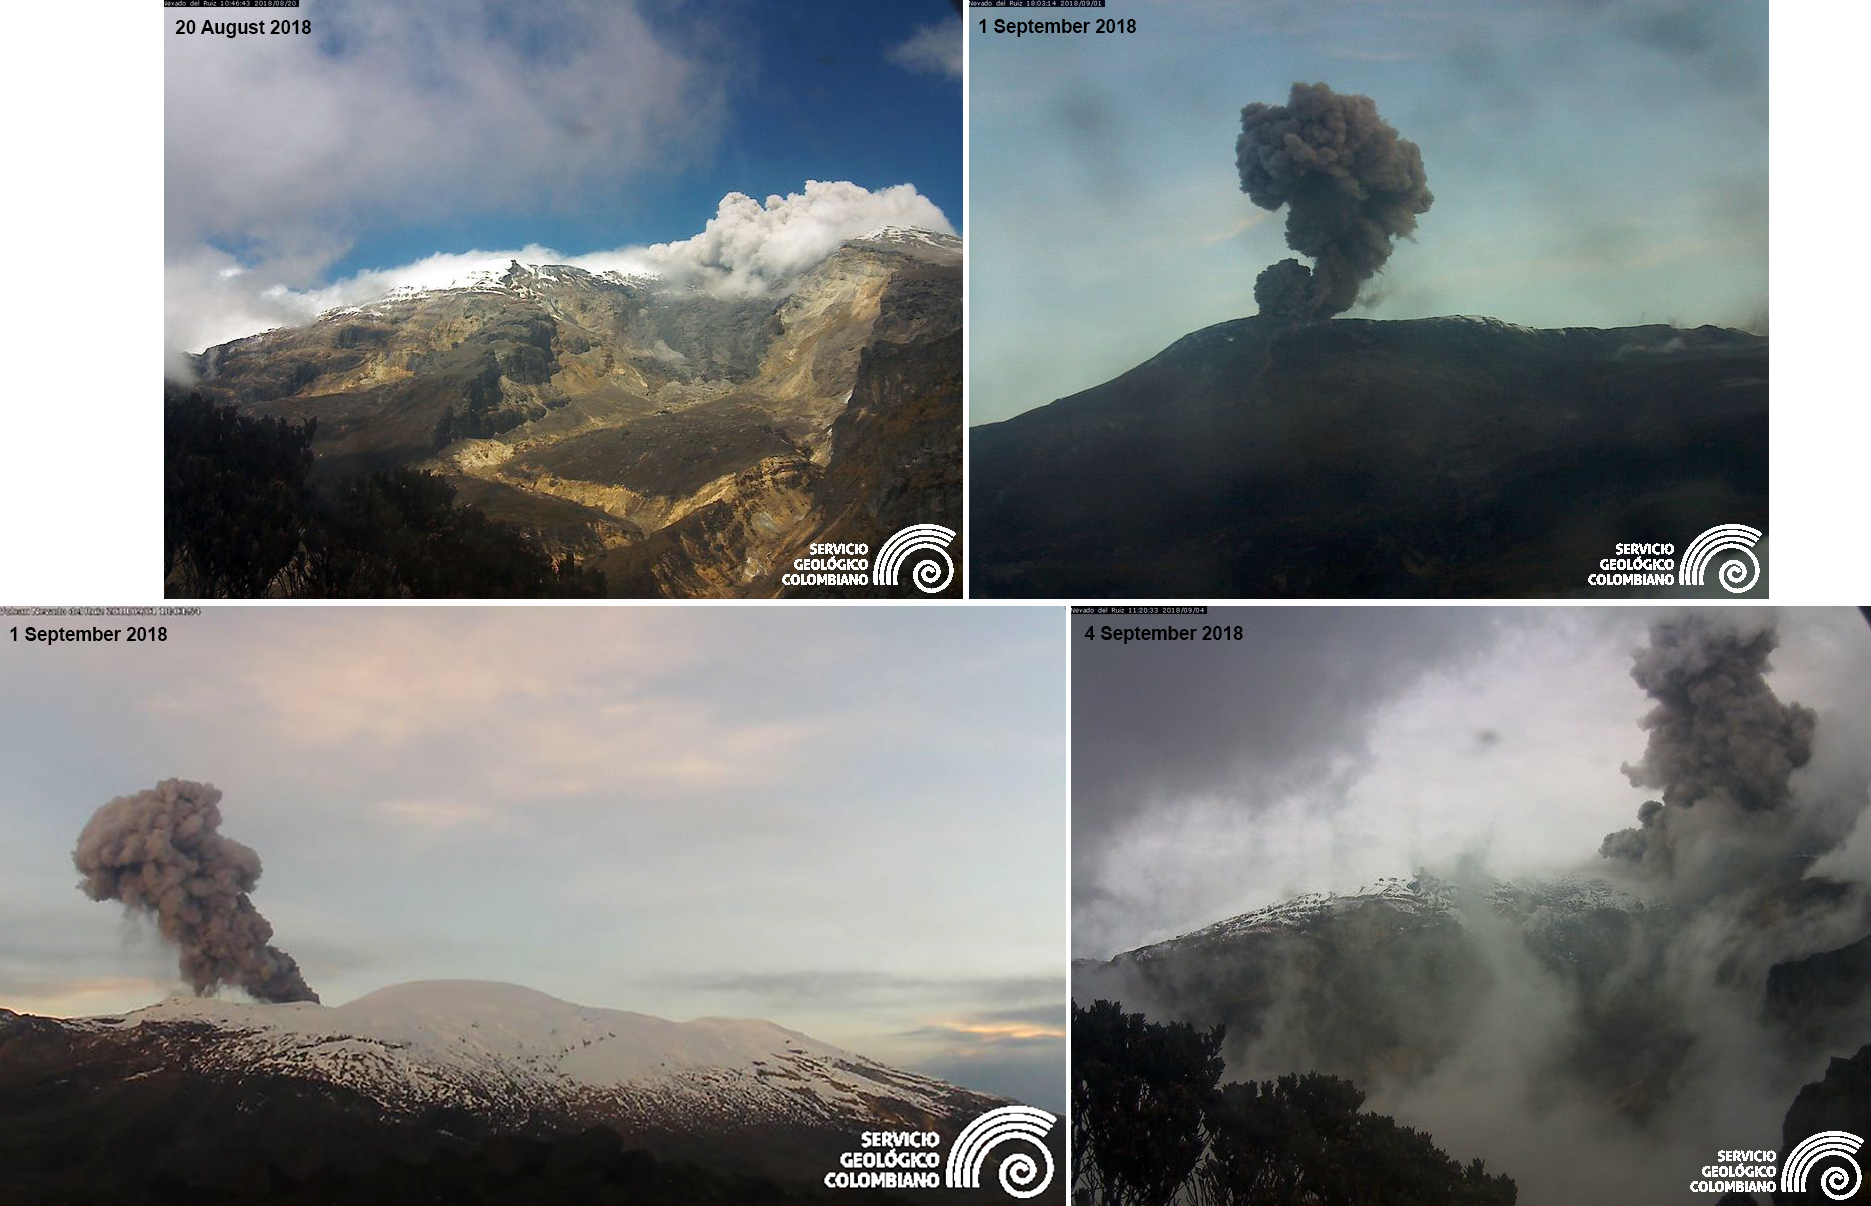 |
Figure 99. Webcam images of gas-and-steam and ash plumes rising from Nevado del Ruiz during 2018. Courtesy of Servicio Geologico Colombiano. |
Activity during 2019. Gas-and-steam and ash emissions continued intermittently through 2019, with an increased number of ash emissions compared to the previous year. Infrared hotspots were detected in Sentinel-2 satellite imagery primarily during January-February 2019 and December 2019, often accompanied by gas-and-steam emissions (figure 100). An ash plume was seen in GOES-EAST satellite imagery on 2 January 2019, rising to an altitude of 5.8 km and drifting NW, according to a Washington VAAC report. On 7 January, ashfall in Manizales and Villamaría was observed. A thermal hotspot was detected in multispectral imagery, according to a Washington VAAC report on 29 January. Slight ground deformation was observed by GNSS and electronic inclinometers during the weeks of 29 January and 10 September. Volcanism was relatively low during February to March and consisted of mostly gas-and-steam emissions and rare ash plumes; these ash emissions were reported on 2 and 9 February and 16 March by the Washington VAAC rising between 5.8-6.7 km altitude. Gas-and-steam emission were detected on 6 and 17 February and 17 and 21 March.
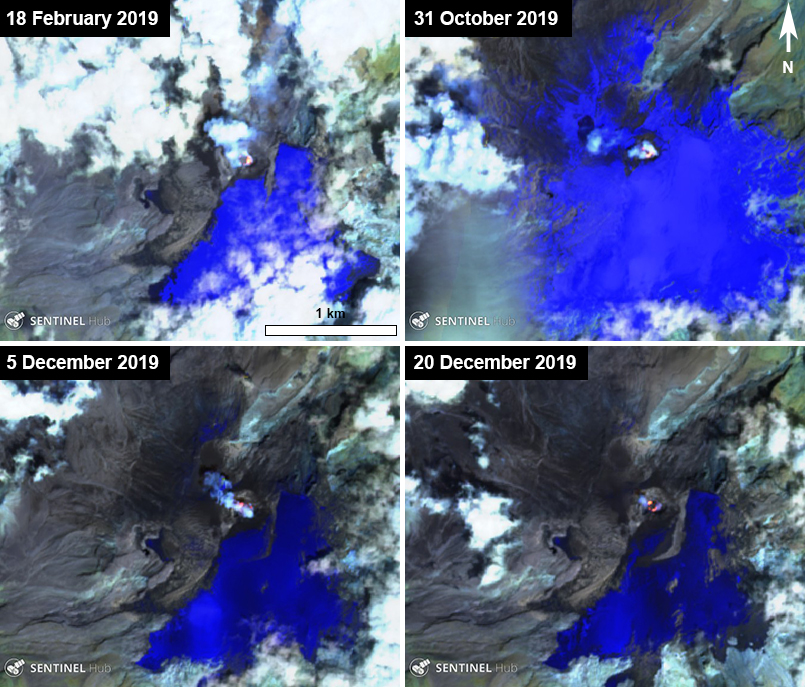 |
Figure 100. Sentinel-2 thermal satellite imagery detected thermal anomalies (bright yellow-orange) mostly visible within the Arenas crater at Nevado del Ruiz during the last three months of 2019 and were accompanied by gas-and-steam emissions. Sentinel-2 atmospheric penetration (bands 12, 11, 8A) images courtesy of Sentinel Hub Playground. |
The number of ash emissions detected in satellite imagery increased after March, occurring on 4, 7, 16, 17-19, and 23-26 April and 2 and 4-5 May. Ash plumes were detected on 27 June, 4, 7, 8, and 29 July, 1 August, and on 19, 29, and 30 September. Los Nevados National Natural Park (PNNN) personnel reported that the ash plume on 8 July was accompanied by gas-and-steam emissions and a continuous tremor occurring at 0722 (figure 101). These emissions rose 450 m above the crater and drifted W. On 29 September, a tremor associated with an ash plume occurred at 2353. The ash plume rose to a maximum altitude of 8.5 km drifted NW, resulting in ashfall confirmed by PNNN, GOES-EAST satellite imagery, and SGC personnel in the field.
Seismicity increased during the week of 1 October compared to the previous week, which was accompanied by several gas-and-steam and ash emissions rising 1 km altitude drifting NW observed by webcams, PNNN personnel, and GOES-EAST satellite imagery. An ash plume rising 7 km altitude drifting NW on 4 October resulted in fine ashfall in Manizales. Ash plumes rose to an altitude of 7.3 km drifting N on 5, 9, and 16 October and was seen in the GOES-EAST satellite according to Washington VAAC notices. Ash emissions were observed frequently during November; 11 Washington VAAC notices, the most for any month during 2019, reported emissions ranging 5.8 to 7 km altitude drifting in different directions. Gas-and-steam plumes rose to a maximum of 2.4 km above the crater during 14 and 30 November. The number of reported emissions decreased during December with one ash emission observed on 4 December.
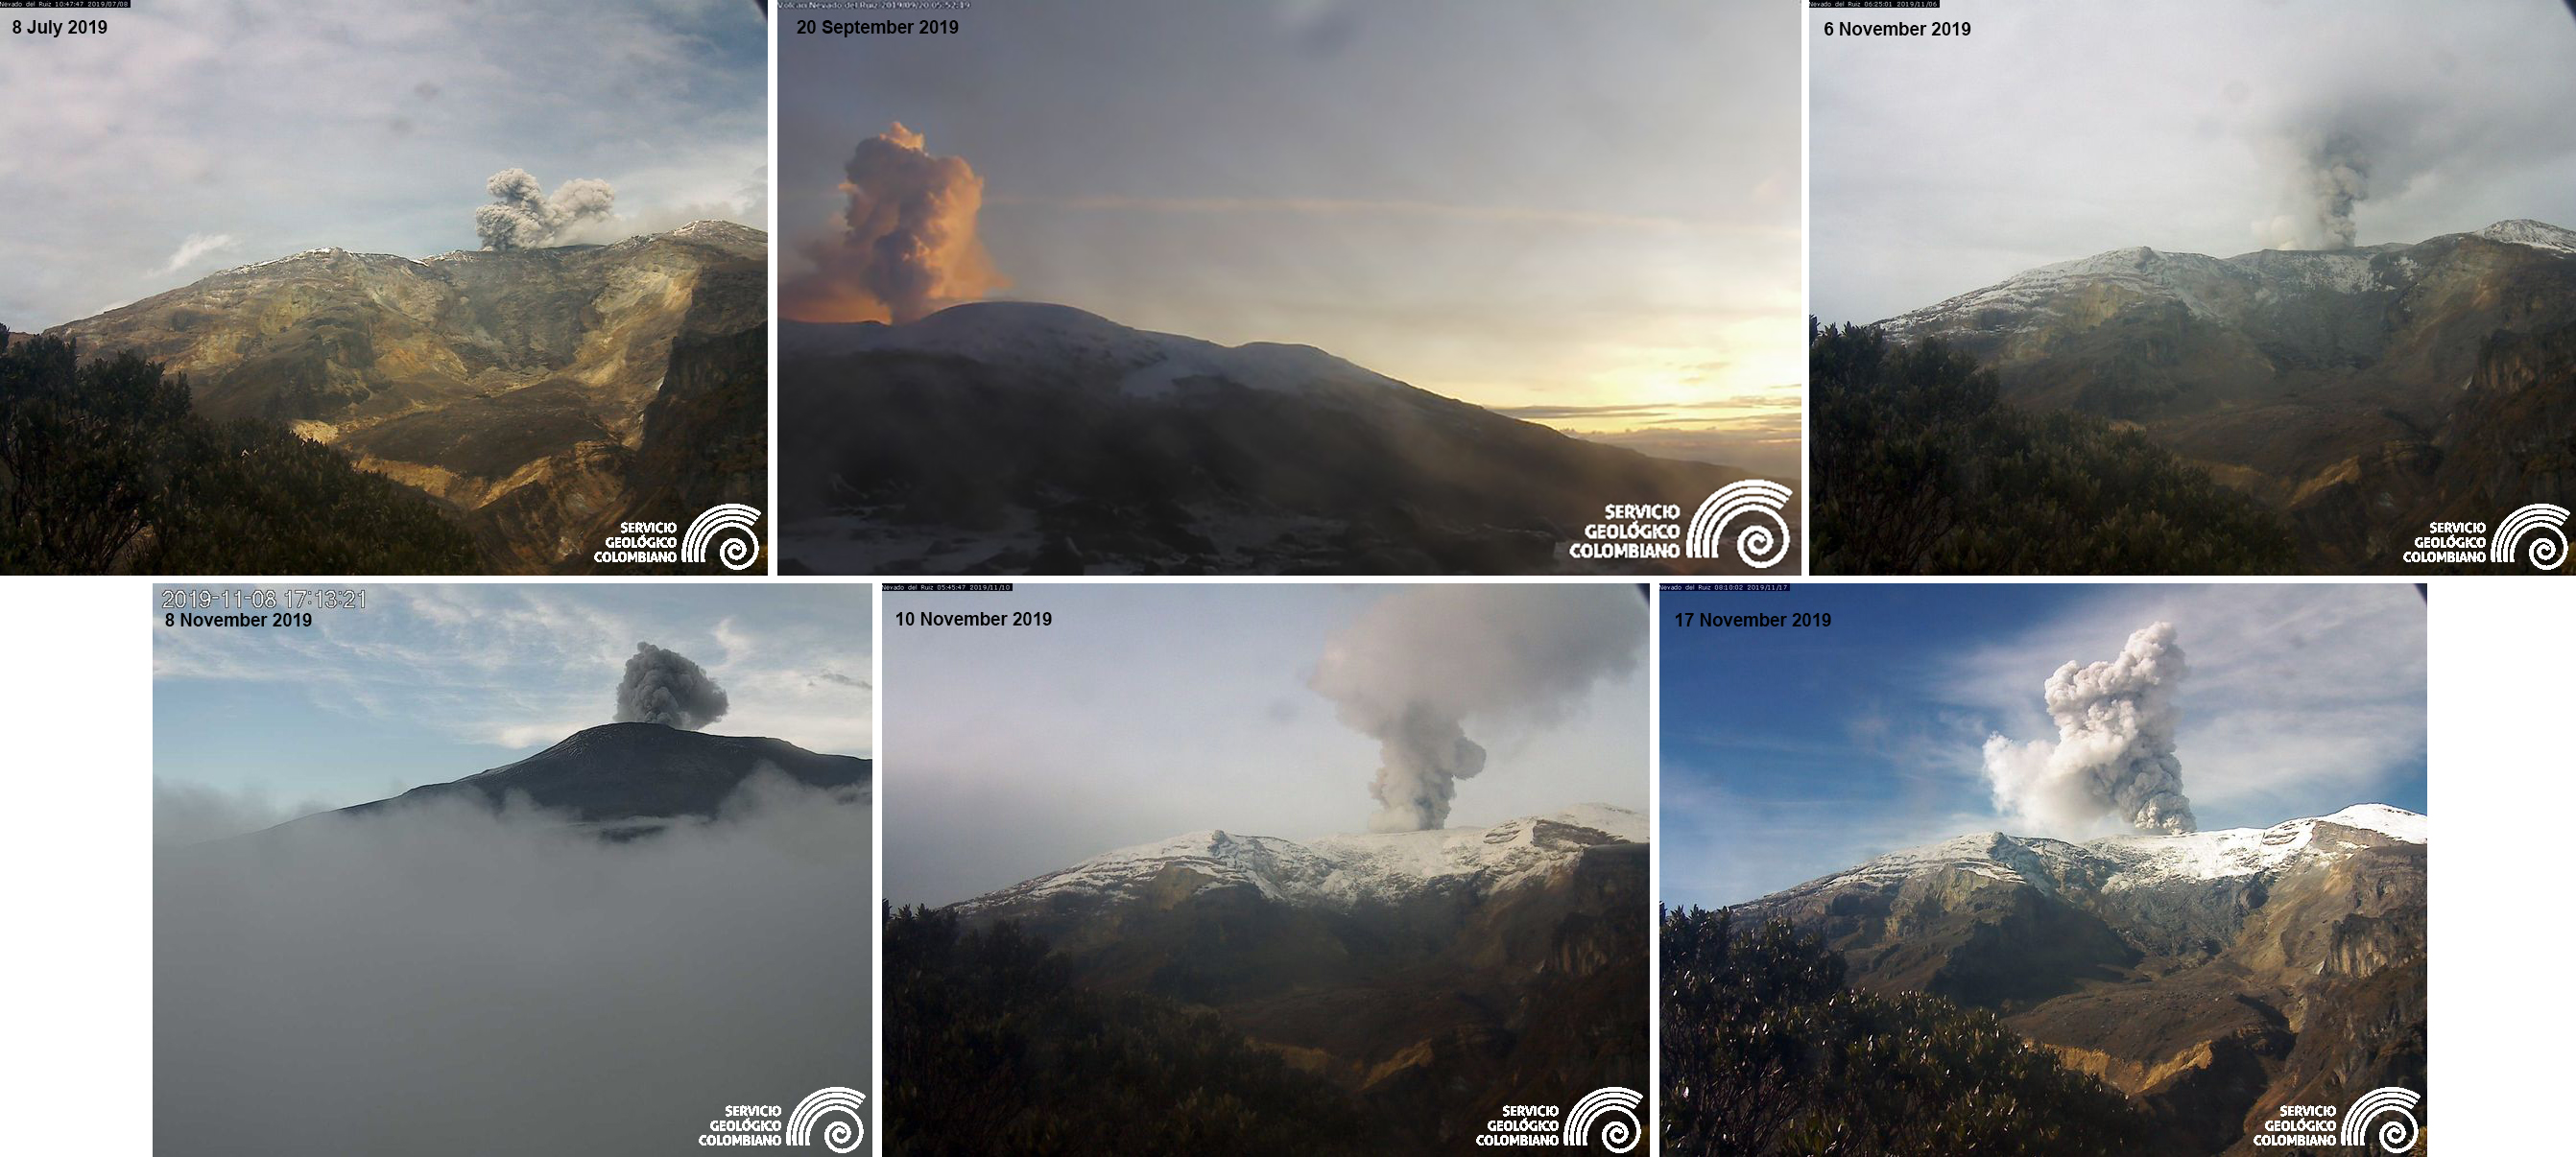 |
Figure 101. Webcam images of gas-and-steam and ash plumes rising from Nevado del Ruiz during 2019. Courtesy of Servicio Geologico Colombiano. |
Geological Summary. Nevado del Ruiz is a broad, glacier-covered volcano in central Colombia that covers more than 200 km2. Three major edifices, composed of andesitic and dacitic lavas and andesitic pyroclastics, have been constructed since the beginning of the Pleistocene. The modern cone consists of a broad cluster of lava domes built within the caldera of an older edifice. The 1-km-wide, 240-m-deep Arenas crater occupies the summit. The prominent La Olleta pyroclastic cone located on the SW flank may also have been active in historical time. Steep headwalls of massive landslides cut the flanks. Melting of its summit icecap during historical eruptions, which date back to the 16th century, has resulted in devastating lahars, including one in 1985 that was South America's deadliest eruption.
Information Contacts: Servicio Geologico Colombiano (SGC), Diagonal 53 No. 34-53 - Bogotá D.C., Colombia (URL: https://www2.sgc.gov.co/volcanes/index.html); Washington Volcanic Ash Advisory Center (VAAC), Satellite Analysis Branch (SAB), NOAA/NESDIS OSPO, NOAA Science Center Room 401, 5200 Auth Rd, Camp Springs, MD 20746, USA (URL: www.ospo.noaa.gov/Products/atmosphere/vaac, archive at: http://www.ssd.noaa.gov/VAAC/archive.html); Global Sulfur Dioxide Monitoring Page, Atmospheric Chemistry and Dynamics Laboratory, NASA Goddard Space Flight Center (NASA/GSFC), 8800 Greenbelt Road, Goddard, Maryland, USA (URL: https://so2.gsfc.nasa.gov/); MIROVA (Middle InfraRed Observation of Volcanic Activity), a collaborative project between the Universities of Turin and Florence (Italy) supported by the Centre for Volcanic Risk of the Italian Civil Protection Department (URL: http://www.mirovaweb.it/); Sentinel Hub Playground (URL: https://www.sentinel-hub.com/explore/sentinel-playground); Hawai'i Institute of Geophysics and Planetology (HIGP) - MODVOLC Thermal Alerts System, School of Ocean and Earth Science and Technology (SOEST), Univ. of Hawai'i, 2525 Correa Road, Honolulu, HI 96822, USA (URL: http://modis.higp.hawaii.edu/); NASA Worldview (URL: https://worldview.earthdata.nasa.gov/).