Report on Sangay (Ecuador) — January 2020
Bulletin of the Global Volcanism Network, vol. 45, no. 1 (January 2020)
Managing Editor: Edward Venzke.
Edited by A. Elizabeth Crafford.
Sangay (Ecuador) Continuing ash emissions, lava flows, pyroclastic flows, and lahars through December 2019
Please cite this report as:
Global Volcanism Program, 2020. Report on Sangay (Ecuador) (Crafford, A.E., and Venzke, E., eds.). Bulletin of the Global Volcanism Network, 45:1. Smithsonian Institution. https://doi.org/10.5479/si.GVP.BGVN202001-352090
Sangay
Ecuador
2.005°S, 78.341°W; summit elev. 5286 m
All times are local (unless otherwise noted)
Frequent activity at Ecuador's Sangay has included pyroclastic flows, lava flows, ash plumes, and lahars since 1628. Its remoteness on the east side of the Andean crest has made ground observations difficult until recent times. The current eruption began in March 2019; this report covers ongoing activity from July through December 2019. Information is provided by Ecuador's Instituto Geofísico, Escuela Politécnica Nacional (IG-EPN), and a number of sources of remote data including the Washington Volcanic Ash Advisory Center (VAAC), the Italian MIROVA Volcano HotSpot Detection System, and Sentinel-2 satellite imagery.
The eruption that began in March 2019 continued during July-December 2019 with activity focused on two eruptive centers at the summit, the Cráter Central and the Ñuñurco (southeast) vent. The Cráter Central produced explosive activity which generated small ash emissions that rose up to 3.2 km above the crater and were frequently directed towards the W and SW. Associated with these emissions in early November, ashfall was reported in Chimborazo province and elsewhere, and ejecta from explosions was deposited on all the upper flanks. At the Ñuñurcu vent, effusive activity resulted in an almost continuous emission of material down the SE flank. Small rockfalls and pyroclastic flows along the fronts and sides of the flows reached the basin and upper channel of the Volcán river which flows into the Upano river. These deposits were remobilized by rainfall and formed mud and debris flows (lahars) in the Volcán river, which caused damming at the confluence with the Upano river downstream. Increased thermal activity was recorded by the MIROVA system from mid-May 2019 through the end of the year, corresponding to the ongoing lava flow and explosive activity (figure 39).
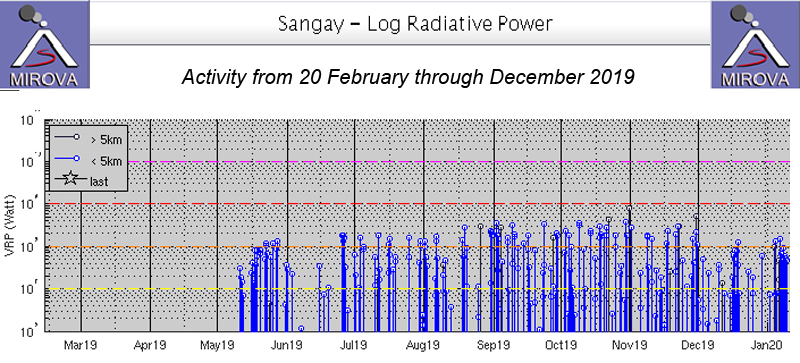 |
Figure 39. Increased heat flow at Sangay was recorded beginning in mid-May 2019 and continued steadily through the end of the year as seen in this graph of Log Radiative Power produced by the MIROVA project. Courtesy of MIROVA. |
Activity during July-September 2019. Several ash emissions were reported by the Washington VAAC during the first part of July 2019. On 1 July a plume rose to 6.7 km altitude and extended 45 km WSW from the summit. During 3-4 July a plume rose 6.4 km and drifted WNW; it included occasional discrete emissions that extended approximately 35 km from summit. The VAAC recorded a bright hotspot in SWIR imagery on 4 July. On 11 July a 7.3-km-altitude ash plume detached from the summit and extended from immediately W of the summit S past Segu. Webcam and satellite imagery on 11 July demonstrated the continuing thermal activity of the lava flow on the SE flank and ash emissions drifting W (figure 40). On 29 July a plume rose to 7.6 km altitude and drifted 65 km WSW. Later in the day continuous emissions were drifting SW from the summit at 5.8 km altitude before dissipating. The first satellite images of 30 July showed a plume extending 110 km WSW from the summit at 7 km altitude. Activity decreased later in the day and the plume extended W about 45 km from the summit at 6.4 km altitude. Composite satellite imagery on 31 July showed almost constant ash emissions extending over 150 km W of the summit (figure 41).
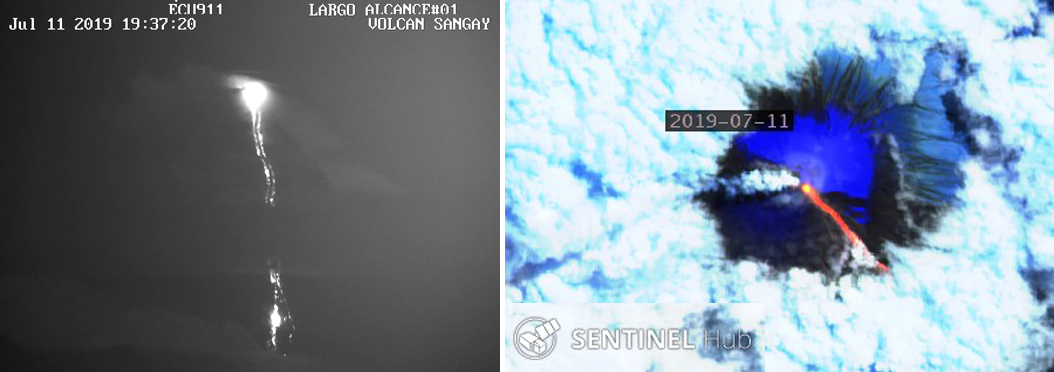 |
Figure 40. The local webcam at Sangay (left) and Sentinel satellite imagery (right, bands 12, 11, and 8A) both confirmed the high heat output from the active lava flow on the SE flank on 11 July 2019. The flow is about 2 km long. A plume of steam and ash also drifted W from the summit (right). Courtesy of IG-EPN (left) and Sentinel Hub Playground (right). |
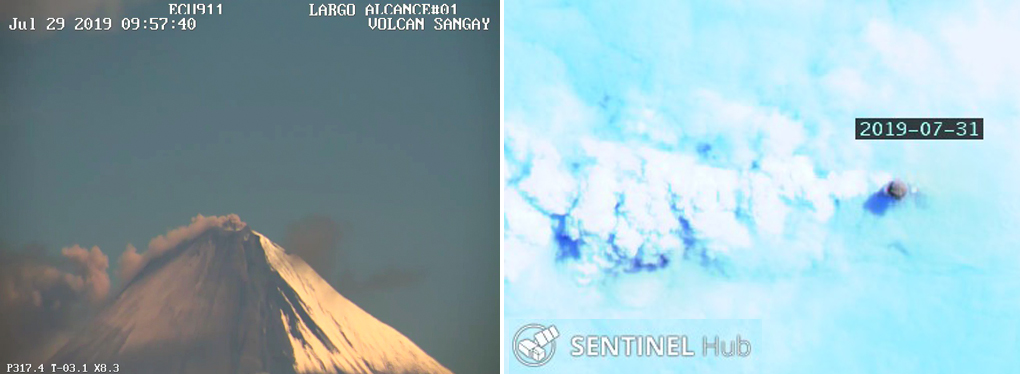 |
Figure 41. An ash emission from Sangay on 29 July 2019 drifted tens of km WSW as seen in the webcam (left). Two days later on 31 July a small dark ash plume was visible above the dense cloud cover in Sentinel satellite imagery; the VAAC reported ash drifting W throughout the day. Courtesy of IG-EPN (left) and Sentinel Hub Playground (right). |
During an overflight on 6 August 2019 scientists from IG-EPN observed ash emissions from the Cráter Central, and the lava flow continuing from the Vento Ñuñurco in a similar location to where it was in May 2019 (figure 42). Light-colored sediments filled much of the upper basin of the Volcán river. Thermal images of the area also showed that some of the deposits were elevated in temperature, even in the riverbed (figure 43).
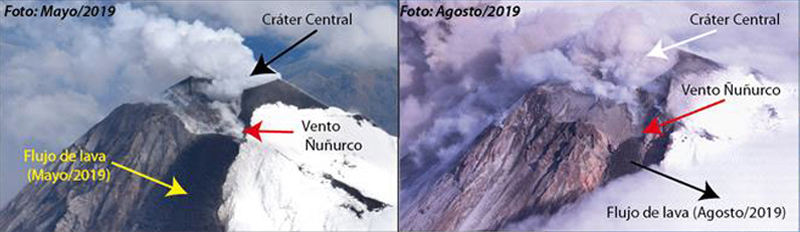 |
Figure 42. The E and SE flanks of Sangay showed continuing activity during August 2019 (right) that was similar to activity going on during May (left). In May, steam issued from the Cráter Central and a lava flow descended the SE flank from Vento Ñuñurco (photo by M. Almeida, IG-EPN). In August, diffuse ash and steam issued from the Crater Central, and a new flow descended from the same area of the Vento Ñuñurco seen in May (photo by P. Ramón , IG-EPN). Courtesy of IG-EPN (Informe Especial del Volcán Sangay - 2019 - No 5, Quito, 13 de noviembre del 2019). |
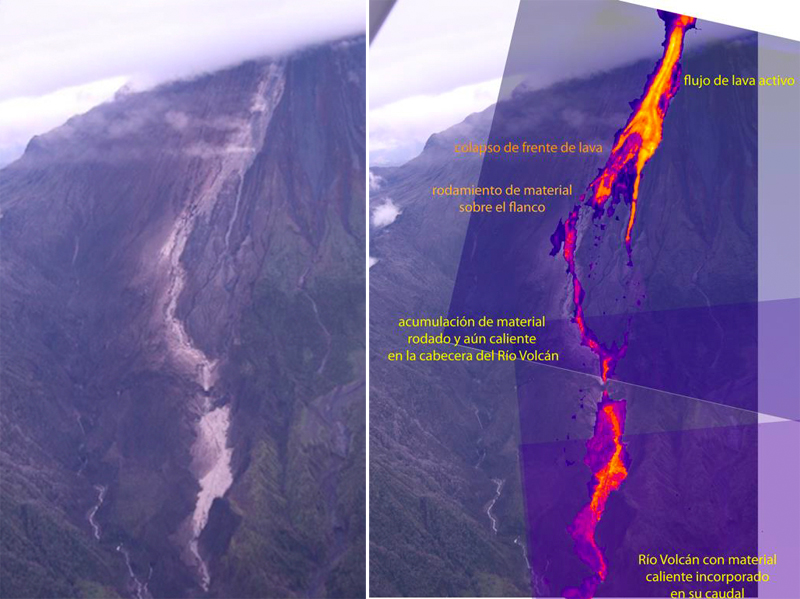 |
Figure 43. The upper Volcán River basin was filled with deposits of pyroclastic material associated with the most recent activity at Sangay when observed during an overflight on 6 August 2019 (left). Thermal analysis of the drainage indicated that several of the deposits were still hot, as was the active flow (right). Left photo by P. Ramón, thermal image by Silvia Vallejo; courtesy of IG-EPN (Informe Especial del Volcán Sangay - 2019 - No 5, Quito, 13 de noviembre del 2019). |
Frequent ash emissions continued during August 2019. Diffuse ash was seen moving W from the summit at 5.8 km altitude on 1 August. Another short-lived plume was observed extending 15 km WSW the next day at 5.8-6.1 km altitude. Continuous ash emissions were visible in satellite imagery extending 35 km SW from the summit at 6.1 km altitude on 5 August. During the next two days, the emissions extended 45 km WSW and a prominent hot spot was visible through the meteoric clouds. The ash plume altitude rose to 6.7 km on 8 August and a larger ash emission extended more than 100 km WSW. A new emission the next day drifted 25-35 km W at 6.1 km altitude. A well-defined hotspot seen in shortwave imagery on 10 August accompanied an ash emission that extended 35 km WSW from the summit at 6.7 km altitude. On 12 August a plume drifted 65 km due W at 6.4 km altitude; emissions continued the next day in the same direction at 6.1 km altitude. An ash plume extended 100 km WNW of the summit at 5.8 km altitude on 18 August. A very bright hotspot was observed in infrared imagery the next day. The ash emissions continued to be visible in satellite imagery through 20 August.
An ash plume extending 10 km N from the summit on 25 August coincided with the appearance of a vivid hot spot, according to the Washington VAAC. The plume was initially reported at 7.6 km altitude and later in the day was at 6.7 km altitude. The leading edge of an ash emission reported on 31 August was 350 km W of the summit late that day moving at 5.8 km altitude, and over 950 km WSW before it dissipated on 1 September. Fewer ash emissions were reported during September 2019. The leading edge of a plume extended about 160 km W from the summit on 2 September at 7.6 km altitude; a second emission that day moved NE at 6.4 km altitude. On 4 September a small emission rose to 6.4 km altitude and drifted SW; on 9 September a plume was observed moving W at 5.5 km. A new emission on 19 September was seen in satellite imagery moving in many different directions (N, NE, E, and SE) at 6.7 km altitude. The lava flow on the SE flank produced a strong thermal signature that appeared unchanged from late August through late September (figure 44).
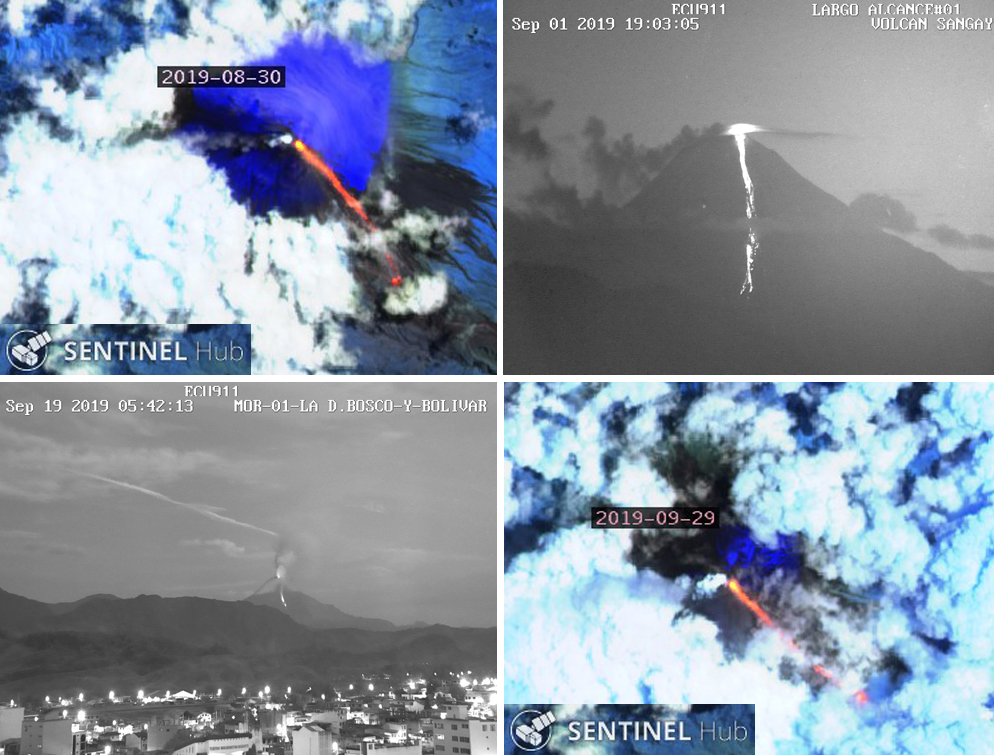 |
Figure 44. The thermal signature from the lava flow on the SE flank of Sangay appeared unchanged from late August (top left) to late September 2019 (bottom right) in Sentinel-2 imagery (bands 12, 11, and 8A); an ash emission drifted in multiple directions on 19 September 2019. Courtesy of Sentinel Hub Playground and IG-EPN. |
Activity during October-December 2019. Pulses of ash were reported during 1, 9-11, 14, 26, and 31 October 2019 by the Washington VAAC. On 1 October the plume rose to 5.8 km altitude and drifted NE. A narrow plume on 9 October extending 55 km NW corresponded with a bright hotspot at its source. Concentrated emissions the next day rose to 7.3 km altitude and extended over 200 km WNW. Later in the day on 10 October emissions were reported at 5.8 km drifting W. A substantial thermal anomaly and a constant plume of diffuse ash appeared in satellite imagery on 14 October at 6.1 km altitude drifting 15 km W. Diffuse emissions on 26 October appeared 35 km NW of the summit at 5.8 km altitude. The intensity of the thermal anomaly from the lava flow on the SE flank remained strong during the month, and emissions of steam and ash were also visible in satellite images (figure 45). In a site visit on 19 October 2019, IG-EPN scientists measured a recent lahar deposited near the confluence of the Volcán and Upano rivers. It was full of sand-sized particles and approximately 30 cm thick at the river’s edge (figure 46).
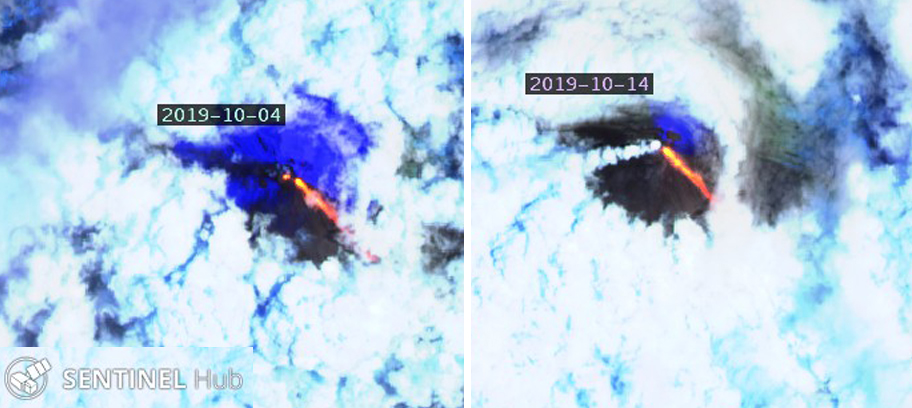 |
Figure 45. The thermal anomaly from the lava flow on the SE flank of Sangay remained strong during October 2019, and both ash and steam emissions were seen in Sentinel-2 satellite images (bands 12, 11, and 8A). The lava flow is about 2 km long. Courtesy of Sentinel Hub Playground. |
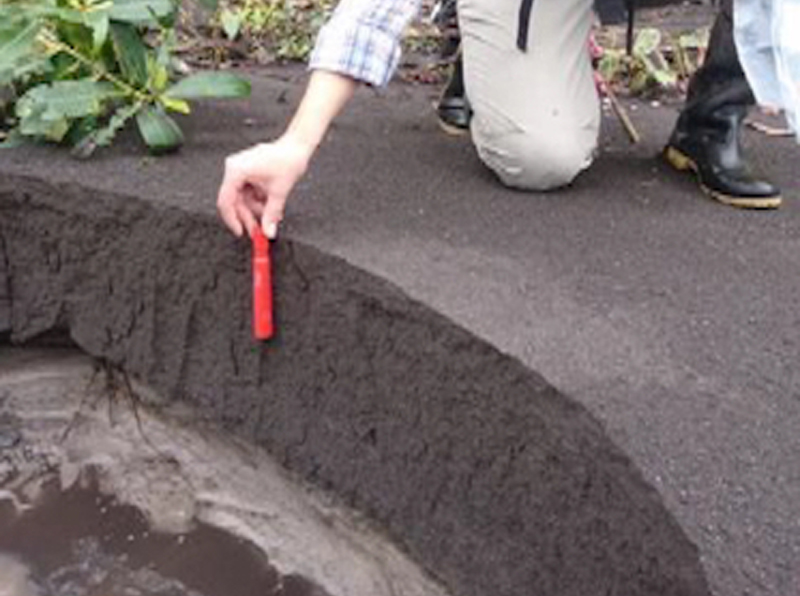 |
Figure 46. A lahar deposit at the confluence of Río Volcán and Río Upano at Sangay was about 30 cm thick on 19 October 2019. Photograph by Francisco Vasconez, courtesy of IG-EPN (Informe Especial del Volcán Sangay - 2019 - No 5, Quito, 13 de noviembre del 2019). |
Ash emissions during 10-26 November 2019 were reported daily by the Washington VAAC, each lasting for less than 24 hours before dissipating. The first report of ash detected in satellite imagery on 10 November indicated that the plume extended 25 km WSW at 6.7 km altitude. On the subsequent days, the plumes drifted in many different directions at altitudes of 5.8-7.3 km, usually around 6.4 km. The plumes generally drifted 25-45 km from the summit, although some were still visible over 100 km away, depending on weather conditions. The highest plume reached 7.3 km altitude on 18 November and drifted W. The plume on 26 November rose to 6.4 km altitude and was last seen 140 km SW of the summit before it dissipated. Pyroclastic flows were witnessed on 20 November 2019 (figure 47). The last plume of the month, on 29 November, rose to 6.4 km altitude and drifted 65 km W, dissipating quickly, and was accompanied by a very bright thermal anomaly.
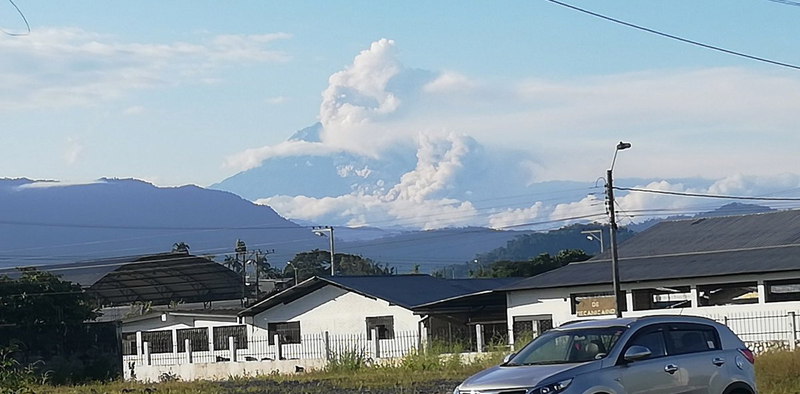 |
Figure 47. Ash plumes from Sangay rose to 5.8 km altitude on 20 November 2019 and drifted 25 km NE before dissipating, according to the Washington VAAC. Pyroclastic flows appeared on the flank that day. Courtesy of Walter Calle C. |
Ashfall was reported during November in the provinces of Chimborazo (Alao, 20 km NW, Cebadas, 35 km NW, and Guaguallá), Morona Santiago (Macas, 40 km SE), and Azuay (120 km SW). Samples of ash collected from two locations indicated that the amount of material was very small (less than10 g/m2) with a high content of extremely fine ash (between 40 and 60% ash less 63 μm in diameter). The larger fraction over 63 μm was mainly composed of juvenile magma (80%) and a small fraction of free crystals (10% plagioclase and pyroxenes), oxidized fragments (5%), and gray lithics (5%) (figure 48).
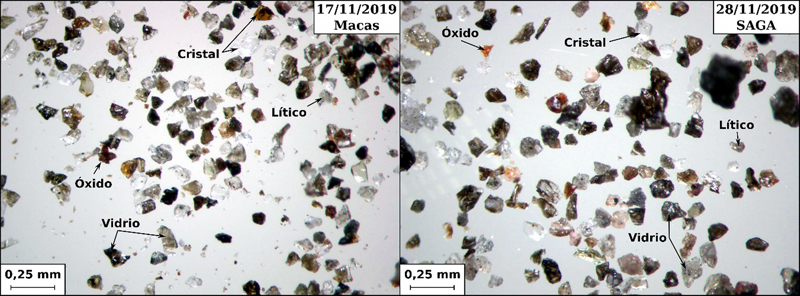 |
Figure 48. Photos from a binocular microscope of the greater than 63 μm fraction of ash from Sangay collected in Macas and at the SAGA station during November 2019. See text for details. Courtesy of IG (Informe Especial del Volcán Sangay - 2019 - No 6, 4 de diciembre del 2019). |
In a report issued in early December 2019 the IG-EPN noted that eruptive activity which increased in May 2019 was continuing (figure 49); a small amount of inflation was observed during November. Explosive activity continued at the Cráter Central with ash plumes reaching 2 km above the summit, and plumes drifting frequently towards the NE causing small amounts of ash to fall in the Chimborazo, Morona Santiago, and Azuay provinces. Effusive activity from the Ñuñurco vent produced almost continuous lava that flowed down the SE flank. Small pyroclastic flows around the margins of the lava flows reached the basin and the upper channel of the Volcán river, causing temporary dams that turned to mudflows during rain events.
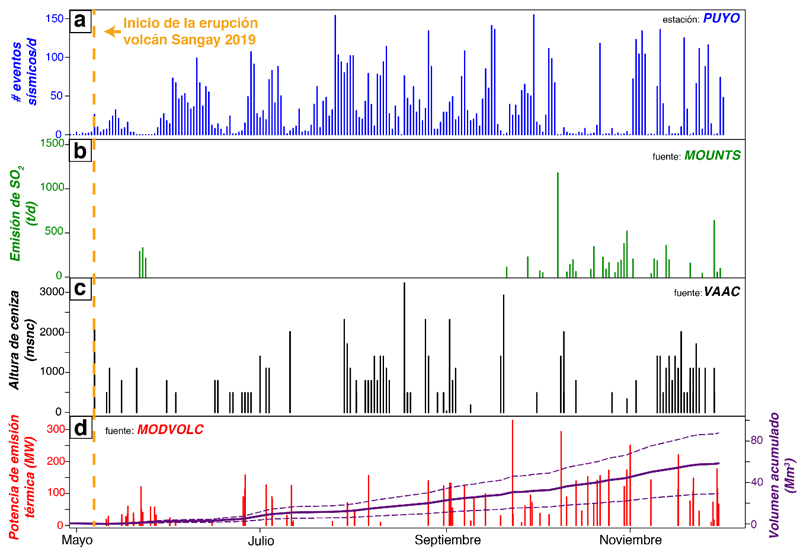 |
Figure 49. IG-EPN published this multi-parameter chart of activity of the Sangay volcano from May to 1 December 2019. a: seismic activity (number of events per day) detected at the PUYO station (source: IG-EPN); b: SO2 emissions (tons per day) detected by the Sentinel-5P satellite sensor (source: MOUNTS); c: height of ash clouds (m above crater level) detected by the GOES-16 satellite sensor (source: Washington VAAC); d: thermal emission power (megawatt) detected by the MODIS satellite sensor (source: MODVOLC) and estimated accumulated lava volume (million m3, dotted lines represent the error range). Courtesy of IG-EPN (Informe Especial del Volcán Sangay - 2019 - No 6, 4 de diciembre del 2019). |
During an overflight on 3 December 2019 a strong smell of sulfur was noted 1 km above the summit. The Ñuñurco vent continued to emit lava with a maximum apparent temperature of 100 to 210°C (figure 50). IG-EPN scientists concluded that approximately 58 ± 29 million m3 of lava had been emitted through 3 December.
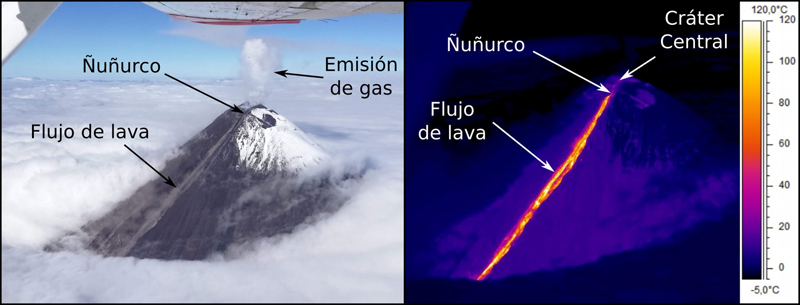 |
Figure 50. Views of the SE flank of Sangay on 3 December 2019 with visible (left) and thermal (right) imagery. Photograph by C. Viracucha, thermal analysis by F. Naranjo; courtesy of IG-EPN (Informe Especial del Volcán Sangay - 2019 - No 6, 4 de diciembre del 2019). |
Recurring lahars in the Río Volcán during the period occasionally reached the Rio Upano (figure 51). By late November, they had partially dammed the Upano river (figure 52). On 26 November 2019 when IG-EPN and Sangay National Park officials inspected the area, they recorded deposits more than 2 m thick at the confluence of the two rivers (figure 53). During an overflight the next day, additional deposits were identified along 16 km upstream. The total volume of the lahar deposits was estimated at 5 million m3 to date.
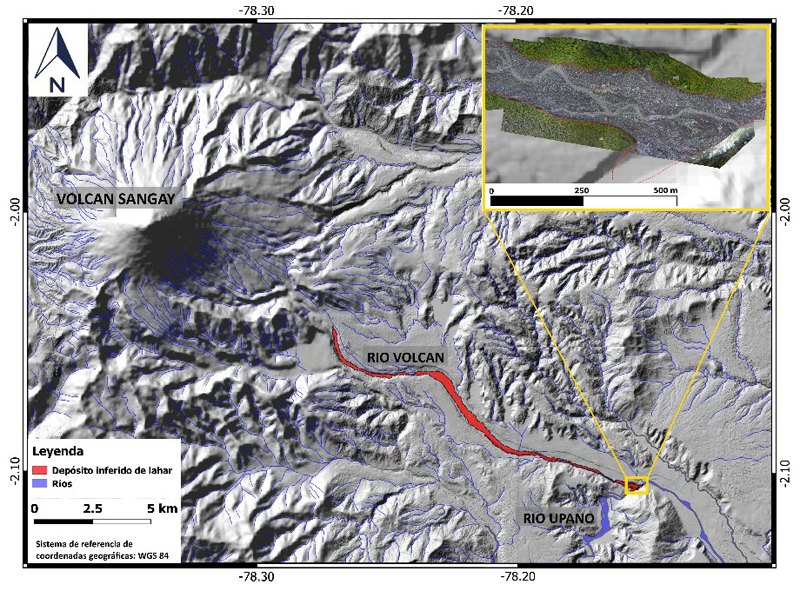 |
Figure 51. Inferred lahar deposits at Sangay along the Río Volcán from the foot of the volcano up to its confluence with Río Upano shown in red. Courtesy of IG-EPN (Informe Especial del Volcán Sangay - 2019 - No 6, 4 de diciembre del 2019). |
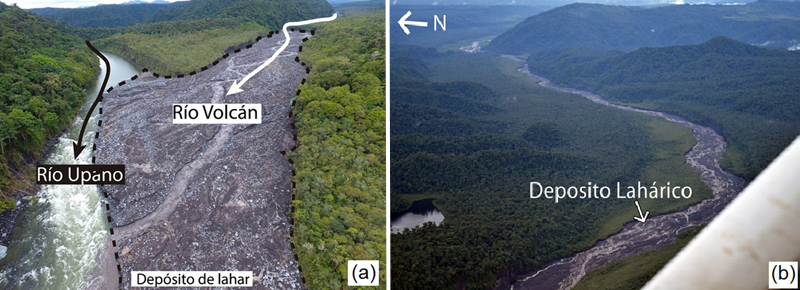 |
Figure 52. Lahar deposits at Sangay filled Río Volcán and dammed part of the confluence where it joins río Upano when photographed during an overflight on 26 November 2019. Photographs by Pedro Espín; courtesy of IG-EPN (Informe Especial del Volcán Sangay - 2019 - No 6, 4 de diciembre del 2019). |
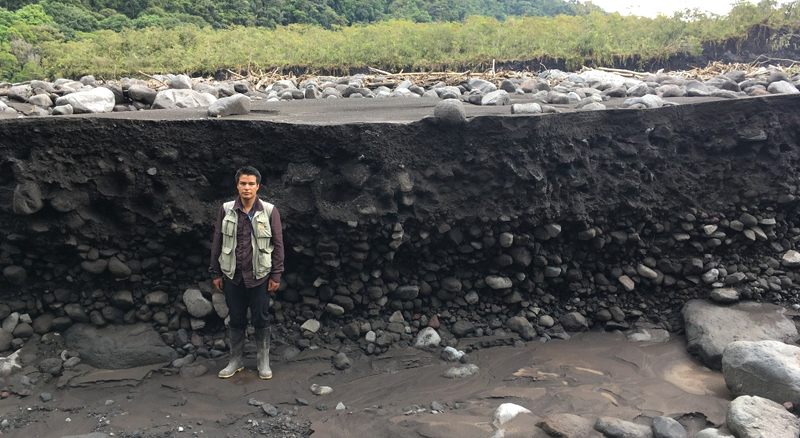 |
Figure 53. Lahar deposits from Sangay exceeded 2 m in thickness at the confluence of the Upano and Volcán rivers on 26 November 2019. Photography by Pedro Espín; courtesy of IG-EPN (Informe Especial del Volcán Sangay - 2019 - No 6, 4 de diciembre del 2019). |
Another extended period of ash emissions began on 4 December 2019 and continued daily through 19 December. The Washington VAAC reported that an ash plume was initially at 6.7 km altitude drifting S on 4 December. Continuous emissions were observed at 4.6 km altitude later in the day and were visible in satellite images located 25 km S at 5.8 km altitude that evening. The drift directions were initially mostly SW in early December, but migrated to mostly SE during 10-16 December, then back to SW. Plume altitudes ranged from 5.8 to 7.3 km and satellite images revealed ash as far as 160 km away; most plumes were visible to about 25 km before dissipating or disappearing into meteoric clouds. IG-EPN reported steam and gas emissions with small amounts of ash on 13 December that drifted SE (figure 54). Small block avalanches from the active flow were also observed on the SE flank. The next day, ash and gas emissions rose to 1,170 m above the summit and drifted NE while the lava flow appeared incandescent on the SE flank.
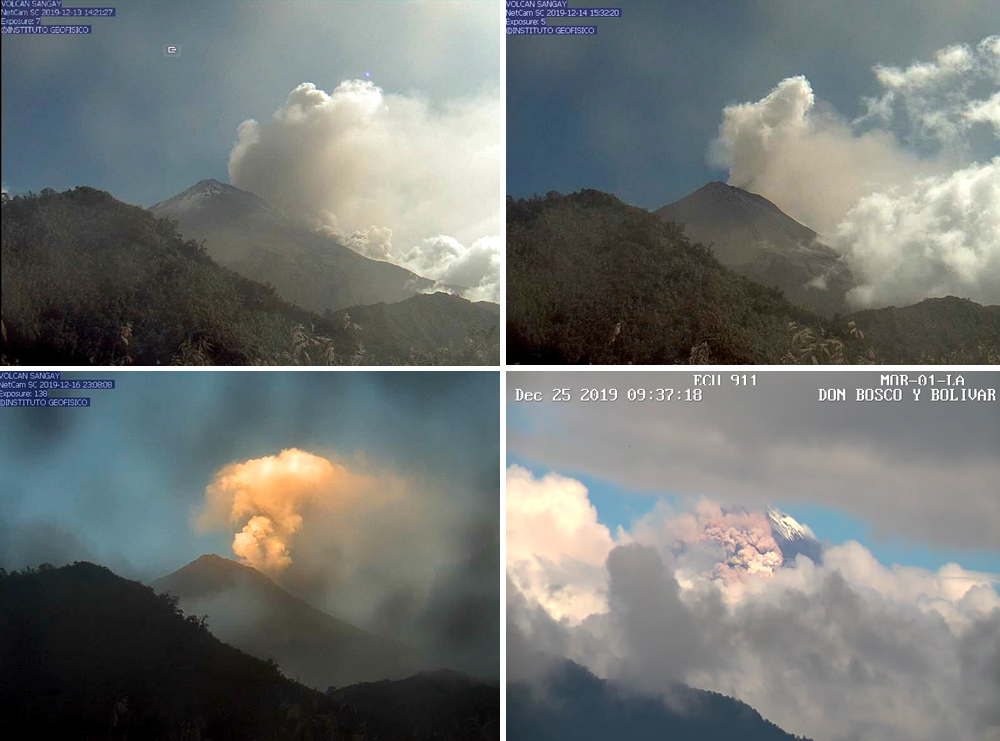 |
Figure 54. Numerous explosions produced ash emissions from Sangay during 4-30 December 2019, shown here on days 13, 14, 16, and 25. Courtesy of IG-EPN (Informe Diario del Estado del Volcán Sangay No. 2019-1, 13 Diciembre; No. 2019-2, 14 Diciembre; No. 2019-5, 17 Diciembre; No. 2019-13, 25 Diciembre 2019). |
During the night of 14-15 December ashfall was reported in San Isidro in the Province of Morona Santiago (30 km SE). Ash plumes rose 870 m above the summit on 15 December and 1,470 m high the next day. Ashfall was reported in the Guasuntos (60 km SW) and Llagos (80 km SW) areas of the Chimborazo province on the morning of 16 December. The next day plumes drifted SE and SW, and minor ashfall was reported that night (16-17 December) in Macas (40 km SE), Morona Santiago province. Satellite images captured gas and ash emissions on 25 December, and ashfall was reported in Alausí (60 km SW) in the province of Chimborazo. An explosion on 29 December produced an ash plume that rose to 6.1 km and first drifted WNW then in an arc to the SW almost 185 km to the coast. Multiple plumes at 5.8-6.7 km drifted westerly for tens of kilometers that day and the next. Prominent thermal anomalies were noted in satellite imagery on 8, 15, 17, and 30 December.
By late December 2019, the lahar deposits in Rio Volcán had backed up noticeably further into the Upano river from a month earlier (figure 55). Sulfur dioxide emissions were not recorded during July through August 2019, but small, pulsing plumes were captured in satellite images during September, October and November, gradually increasing in density. Several plumes were detected hundreds of kilometers from the volcano before dissipating; by December, larger, more frequent pulses of SO2 were measured during many days when ash emissions were reported (figure 56).
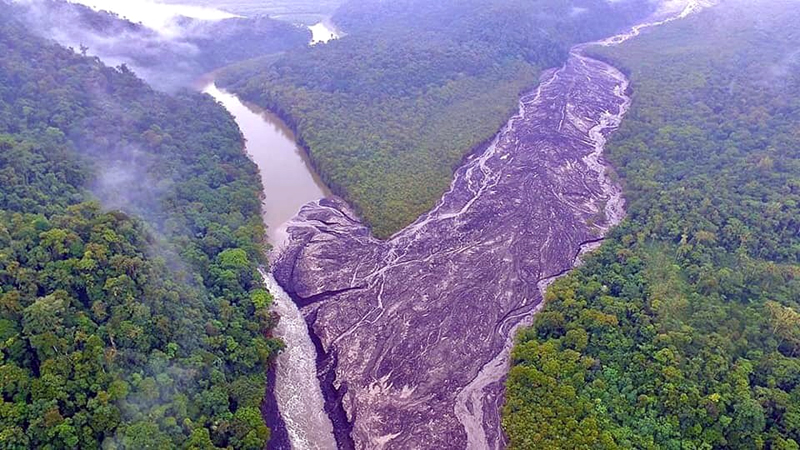 |
Figure 55. Lahar deposits from Sangay in the Rio Volcán (right) continued to dam up the Rio Upano into late December 2019. Compare with figure 49 taken one month earlier. Photo by WJ Hernandes, courtesy of Edgar Chulde, posted online 21 December 2019. |
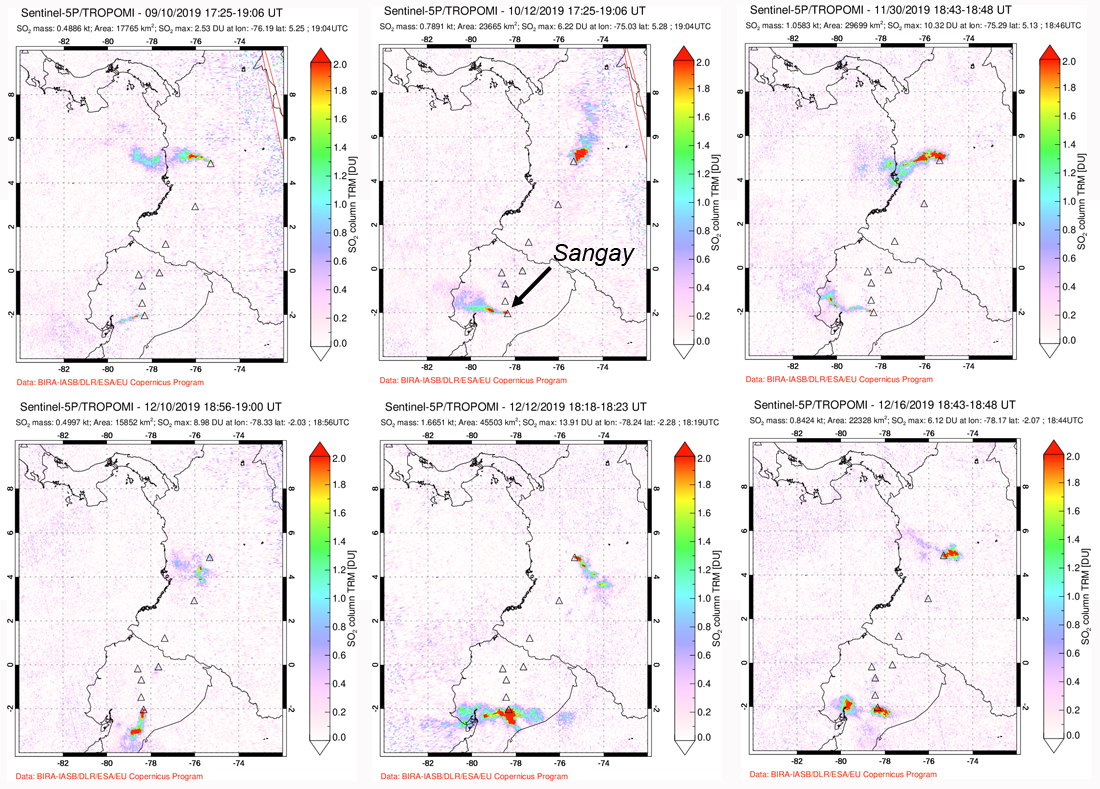 |
Figure 56. Sulfur dioxide emissions from Sangay were weak but persistent during September-November 2019 (top row), often drifting in narrow plumes with distinct pulses. During December, the density of the SO2 emissions increased noticeably (bottom row). Colombia’s Nevado del Ruiz was also producing plumes of SO2 at the same time. Courtesy of NASA Goddard Space Flight Center. |
Geological Summary. The isolated Sangay volcano, located east of the Andean crest, is the southernmost of Ecuador's volcanoes and its most active. The steep-sided, glacier-covered, dominantly andesitic volcano grew within the open calderas of two previous edifices which were destroyed by collapse to the east, producing large debris avalanches that reached the Amazonian lowlands. The modern edifice dates back to at least 14,000 years ago. It towers above the tropical jungle on the east side; on the other sides flat plains of ash have been eroded by heavy rains into steep-walled canyons up to 600 m deep. The earliest report of an eruption was in 1628. Almost continuous eruptions were reported from 1728 until 1916, and again from 1934 to the present. The almost constant activity has caused frequent changes to the morphology of the summit crater complex.
Information Contacts: Instituto Geofísico (IG-EPN), Escuela Politécnica Nacional, Casilla 17-01-2759, Quito, Ecuador (URL: http://www.igepn.edu.ec/); MIROVA (Middle InfraRed Observation of Volcanic Activity), a collaborative project between the Universities of Turin and Florence (Italy) supported by the Centre for Volcanic Risk of the Italian Civil Protection Department (URL: http://www.mirovaweb.it/); Sentinel Hub Playground (URL: https://www.sentinel-hub.com/explore/sentinel-playground); Global Sulfur Dioxide Monitoring Page, Atmospheric Chemistry and Dynamics Laboratory, NASA Goddard Space Flight Center (NASA/GSFC), 8800 Greenbelt Road, Goddard, Maryland, USA (URL: https://so2.gsfc.nasa.gov/); Walter Calle C., Macas, Ecuador (Twitter: @walterc333; URL: https://twitter.com/walterc333/status/1197273200822046720); Edgar Chulde, Quito, Ecuador (Twitter: @EdgarChulde2; URL: https://twitter.com/EdgarChulde2/status/1208547471024173056).