Report on Stromboli (Italy) — August 2020
Bulletin of the Global Volcanism Network, vol. 45, no. 8 (August 2020)
Managing Editor: Edward Venzke.
Edited by Kadie L. Bennis.
Stromboli (Italy) Strombolian explosions persist at both summit craters during January-April 2020
Please cite this report as:
Global Volcanism Program, 2020. Report on Stromboli (Italy) (Bennis, K.L., and Venzke, E., eds.). Bulletin of the Global Volcanism Network, 45:8. Smithsonian Institution. https://doi.org/10.5479/si.GVP.BGVN202008-211040
Stromboli
Italy
38.789°N, 15.213°E; summit elev. 924 m
All times are local (unless otherwise noted)
Stromboli is a stratovolcano located in the northeastern-most part of the Aeolian Islands composed of two active summit vents: the Northern (N) Crater and the Central-South (CS) Crater that are situated at the head of the Sciara del Fuoco, a large scarp that runs from the summit down the NW side of the volcano. The ongoing eruption began in 1934 and has been characterized by regular Strombolian explosions in both summit craters, ash plumes, and occasional lava flows (BGVN 45:08). This report updates activity from January to April 2020 with information primarily from daily and weekly reports by Italy's Istituto Nazionale di Geofisica e Vulcanologia (INGV) and various satellite data.
Activity was consistent during this reporting period. Explosion rates ranged from 1-20 per hour and were of variable intensity, producing material that rose from less than 80 to over 250 m above the vents (table 8). Strombolian explosions were often accompanied by gas-and-steam emissions, spattering, and lava flows which has resulted in fallout deposited on the Sciara del Fuoco and incandescent blocks rolling toward the coast up to a few hundred meters down the slopes of the volcano. According to INGV, the average SO2 emissions measured 300-650 tons/day.
Table 8. Summary of activity at Stromboli during January-April 2020. Low-intensity activity indicates ejecta rising less than 80 m, medium-intensity is ejecta rising less than 150 m, and high-intensity is ejecta rising over 200 m above the vent. Data courtesy of INGV.
| Month | Activity |
| Jan 2020 | Strombolian activity and degassing continued with some spattering. Explosion rates varied from 2-20 per hour. Ejected material rose 80-150 m above the N crater and 150-200 m above the CS crater. A small cone is growing on the S1 crater and has produced some explosions and ejected coarse material mixed with fine ash. The average SO2 emissions measured 300 tons/day. |
| Feb 2020 | Strombolian activity and degassing continued. Explosion rates varied from 2-14 per hour. Ejected material rose 80-200 m above the N crater and 80-250 m above the CS crater. The average SO2 emissions measured 300 tons/day. |
| Mar 2020 | Strombolian activity and degassing continued with discontinuous spattering. Explosion rates varied from 1-16 per hour. Ejected material rose 80-150 m above the N crater and 150-250 m above the CS crater. Intense spattering was observed in the N crater. The average SO2 emissions measured 300-650 tons/day. |
| Apr 2020 | Strombolian activity and degassing continued with spattering. Explosion rates varied from 1-17 per hour. Ejected material rose 80-150 m above the N crater and 150-250 m above the CS crater. Spattering was observed in the N crater. The average SO2 emissions measured 300-650 tons/day. |
During January 2020, explosive activity mainly originated from three vents in the N crater and at least three vents in the CS crater. Ejecta from numerous Strombolian explosions covered the slopes on the upper Sciara del Fuoco, some of which rolled hundreds of meters down toward the coast. Explosion rates varied from 2-12 per hour in the N crater and 9-14 per hour in the CS crater; ejected material rose 80-200 m above the craters. According to INGV, a small cone growing in the S1 crater produced some explosions that ejected coarse material mixed with fine ash. On 18 and 19 January a lava flow was observed, both of which originated in the N crater. In addition, two explosions were detected in the N crater that was associated with two landslide events.
Explosive activity in February primarily originated from 2-3 eruptive vents in the N crater and at least three vents in the CS crater (figure 177). The Strombolian explosions ejected material 80-250 m above the craters, some of which fell onto the upper part of the Sciara. Explosion rates varied from 3-12 per hour in the N crater and 2-14 per hour in the CS crater (figure 178). On 3 February a short-lived lava flow was reported in the N crater.
 |
Figure 177. A drone image showed spattering accompanied by gas-and-steam emissions at Stromboli rising above the N crater on 15 February 2020. Courtesy of INGV (Rep. No. 08/2020, Stromboli, Bollettino Settimanale, 10/02/2020 - 16/02/2020, data emissione 18/02/2020). |
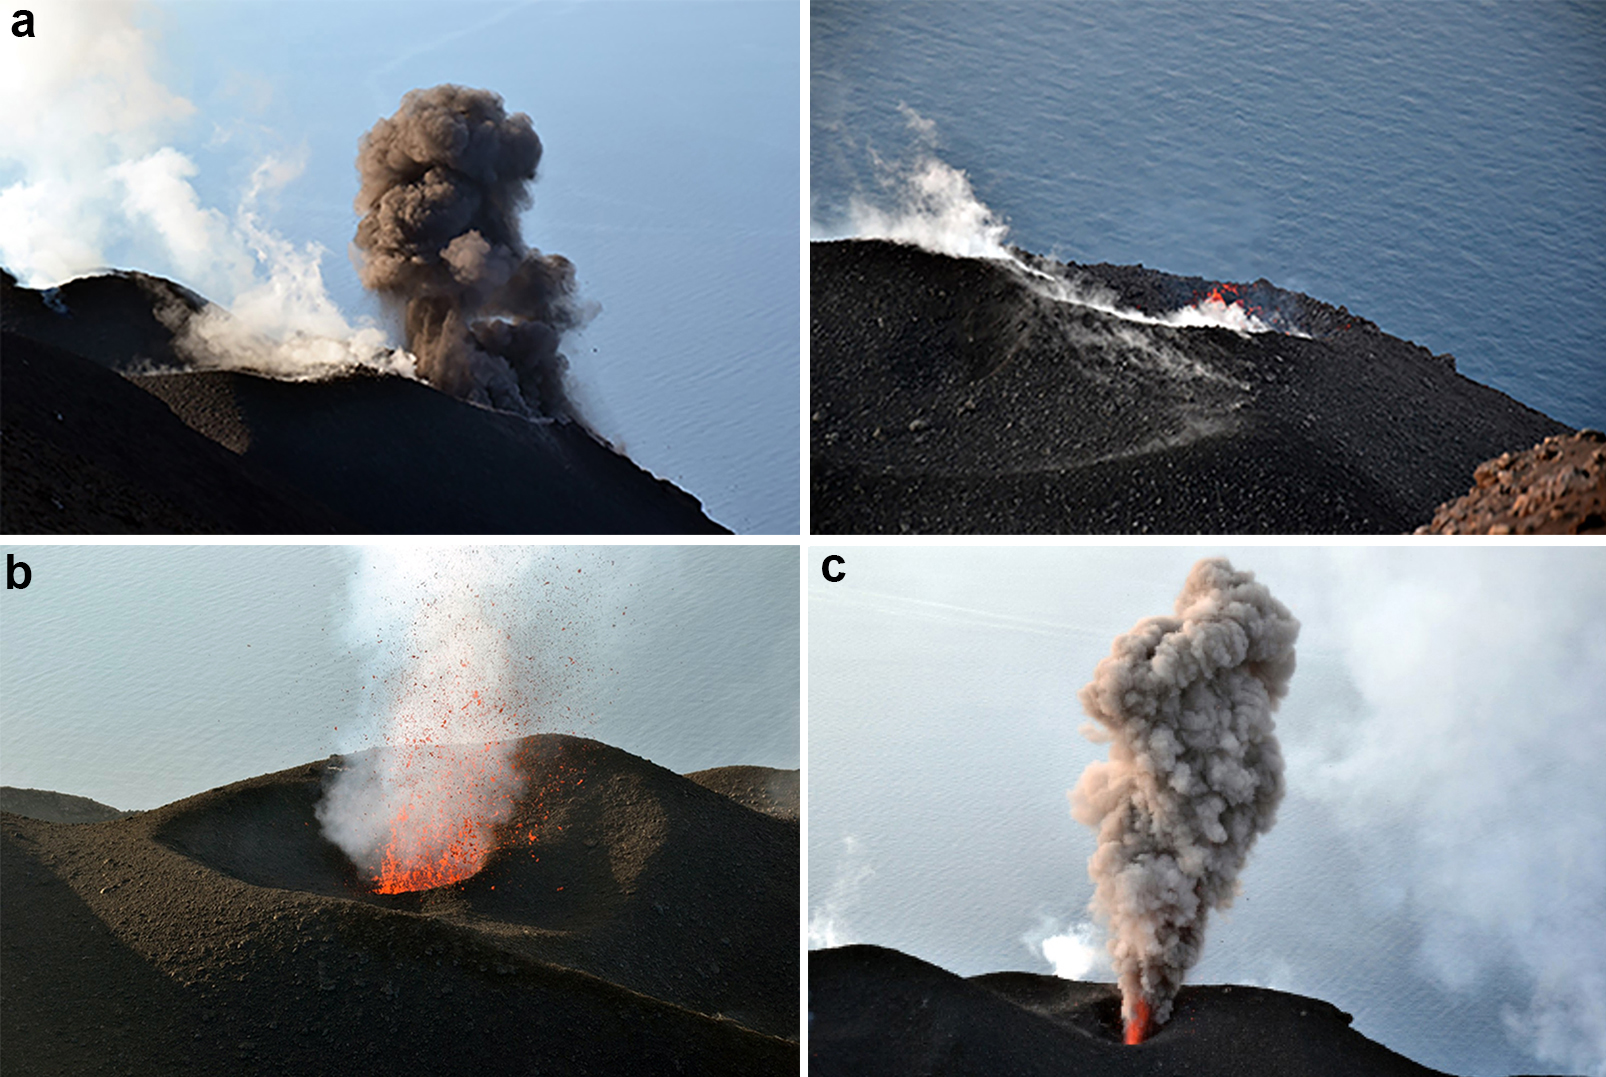 |
Figure 178. a) Strombolian explosions during the week of 17-23 February 2020 in the N1 crater of Stromboli were seen from Pizzo Sopra La Fossa. b) Spattering at Stromboli accompanied by white gas-and-steam emissions was detected in the N1 and S2 craters during the week of 17-23 February 2020. c) Spattering at Stromboli accompanied by a dense ash plume was seen in the N1 and S2 craters during the week of 17-23 February 2020. All photos by F. Ciancitto, courtesy of INGV (Rep. No. 09/2020, Stromboli, Bollettino Settimanale, 17/02/2020 - 23/02/2020, data emissione 25/02/2020). |
Ongoing explosive activity continued into March, originating from three eruptive vents in the N crater and at least three vents in the CS crater. Ejected lapilli and bombs rose 80-250 m above the craters resulting in fallout covering the slopes in the upper Sciara del Fuoco with blocks rolling down the slopes toward the coast and explosions varied from 4-13 per hour in the N crater and 1-16 per hour in the CS crater. Discontinuous spattering was observed during 9-19 March. On 19 March, intense spattering was observed in the N crater, which produced a lava flow that stretched along the upper part of the Sciara for a few hundred meters. Another lava flow was detected in the N crater on 28 March for about 4 hours into 29 March, which resulted in incandescent blocks breaking off the front of the flow and rolling down the slope of the volcano. On 30 March a lava flow originated from the N crater and remained active until the next day on 31 March. Landslides accompanied by incandescent blocks rolling down the Sciara del Fuoco were also observed.
Strombolian activity accompanied by gas-and-steam emissions continued into April, primarily produced in 3-4 eruptive vents in the N crater and 2-3 vents in the CS crater. Ejected material from these explosions rose 80-250 m above the craters, resulting in fallout products covering the slopes on the Sciara and blocks rolling down the slopes. Explosions varied from 4-15 per hour in the N crater and 1-10 per hour in the CS crater. On 1 April a thermal anomaly was detected in satellite imagery accompanied by gas-and-steam and ash emissions downstream of the Sciara del Fuoco. A lava flow was observed on 15 April in the N crater accompanied by gas-and-steam and ash emissions; at the front of the flow incandescent blocks detached and rolled down the Sciara (figure 179). This flow continued until 16 April, ending by 0956; a thermal anomaly persisted downslope from the lava flow. Spatter was ejected tens of meters from the vent. Another lava flow was detected on 19 April in the N crater, followed by detached blocks from the front of the flow rolling down the slopes. Spattering continued during 20-21 April.
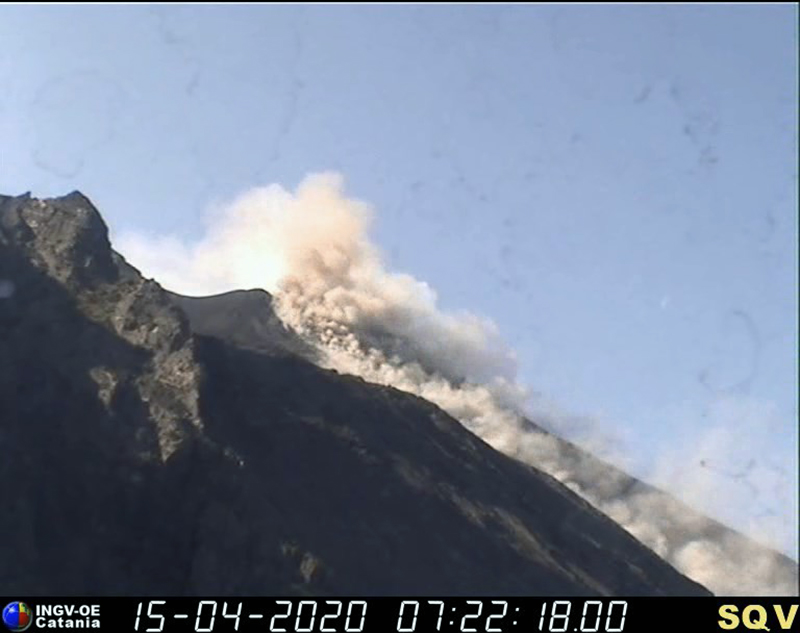 |
Figure 179. A webcam image of an ash plume accompanied by blocks ejected from Stromboli on 15 April 2020 rolling down the Sciara del Fuoco. Courtesy of INGV via Facebook posted on 15 April 2020. |
Moderate thermal activity occurred frequently during 16 October to April 2020 as recorded in the MIROVA Log Radiative Power graph using MODIS infrared satellite information (figure 180). The MODVOLC thermal alerts recorded a total of 14 thermal signatures over the course of nine different days between late February and mid-April. Many of these thermal signatures were captured as hotspots in Sentinel-2 thermal satellite imagery in both summit craters (figure 181).
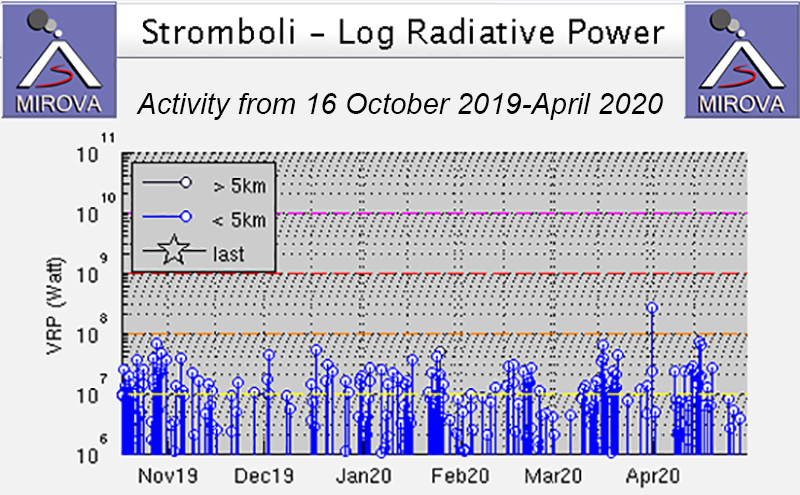 |
Figure 180. Low to moderate thermal activity at Stromboli occurred frequently during 16 October-April 2020 as shown in the MIROVA graph (Log Radiative Power). Courtesy of MIROVA. |
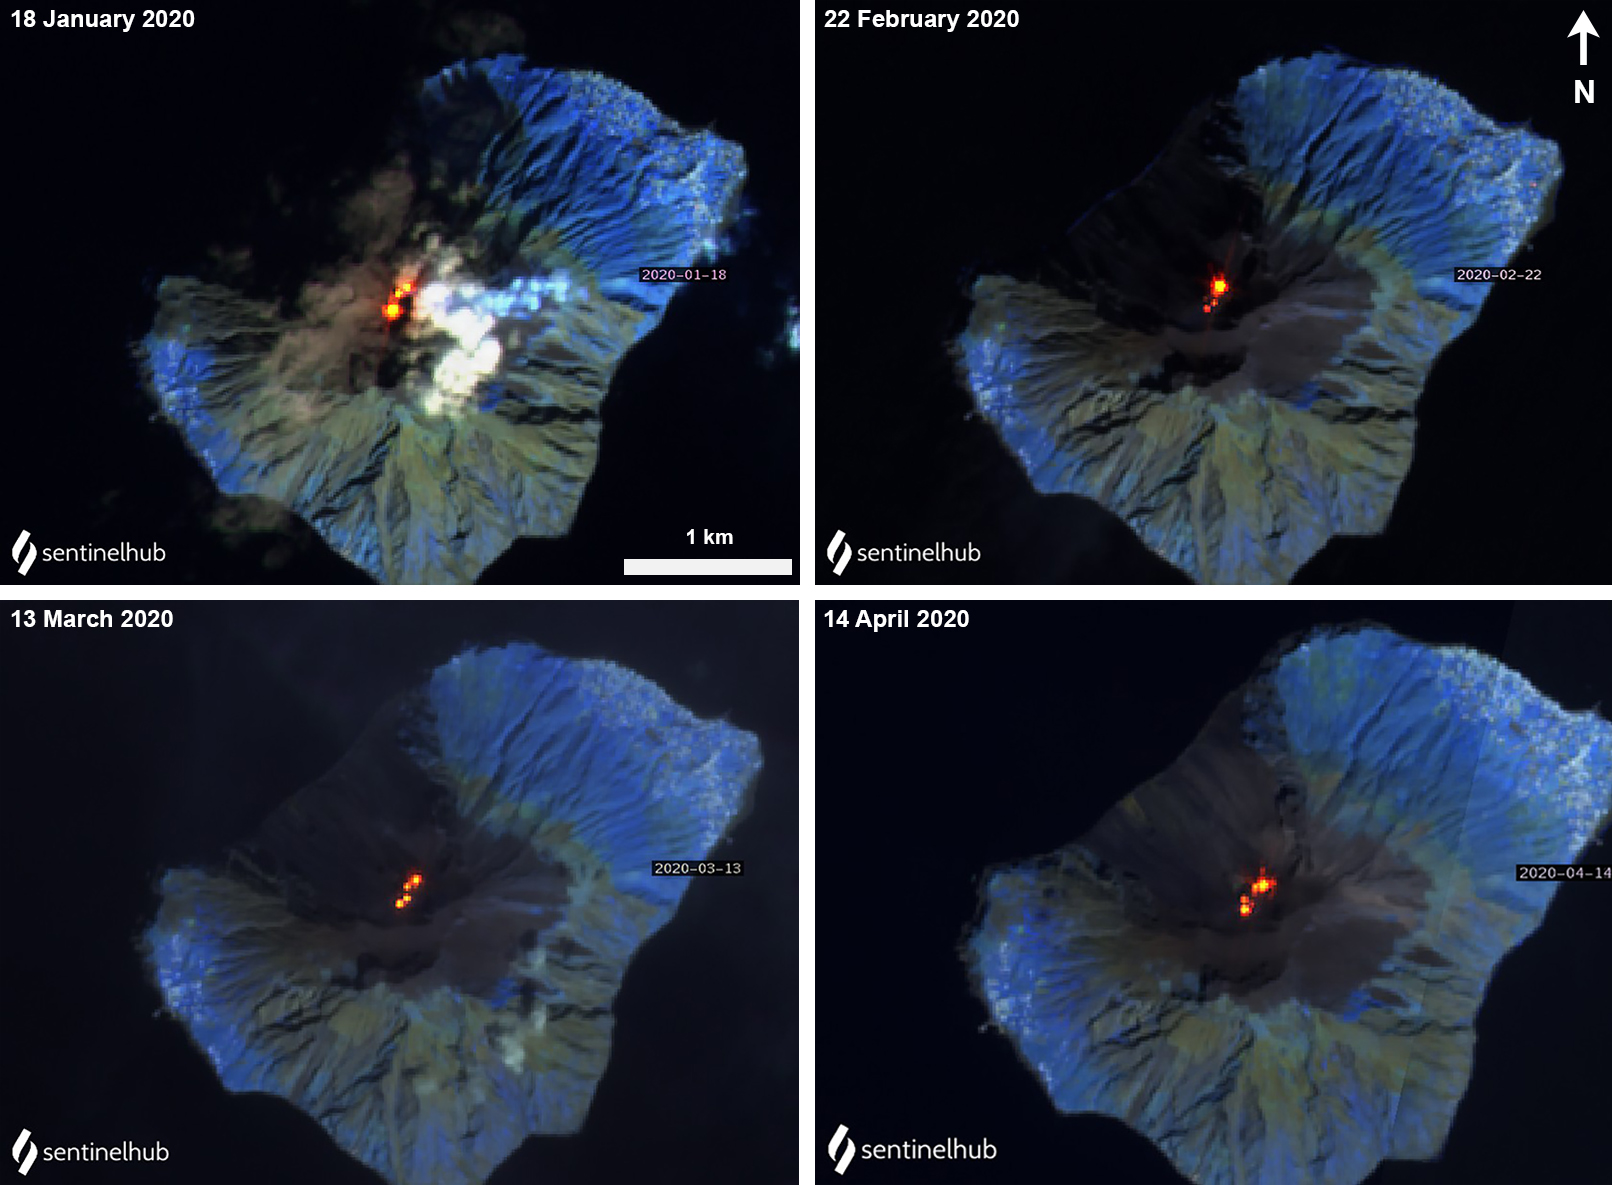 |
Figure 181. Thermal anomalies (bright yellow-orange) at Stromboli were observed in thermal satellite imagery from both of the summit vents throughout January-April 2020. Images with Atmospheric Penetration rendering (bands 12, 11, 8A); courtesy of Sentinel Hub Playground. |
Geological Summary. Spectacular incandescent nighttime explosions at Stromboli have long attracted visitors to the "Lighthouse of the Mediterranean" in the NE Aeolian Islands. This volcano has lent its name to the frequent mild explosive activity that has characterized its eruptions throughout much of historical time. The small island is the emergent summit of a volcano that grew in two main eruptive cycles, the last of which formed the western portion of the island. The Neostromboli eruptive period took place between about 13,000 and 5,000 years ago. The active summit vents are located at the head of the Sciara del Fuoco, a prominent scarp that formed about 5,000 years ago due to a series of slope failures which extends to below sea level. The modern volcano has been constructed within this scarp, which funnels pyroclastic ejecta and lava flows to the NW. Essentially continuous mild Strombolian explosions, sometimes accompanied by lava flows, have been recorded for more than a millennium.
Information Contacts: Istituto Nazionale di Geofisica e Vulcanologia (INGV), Sezione di Catania, Piazza Roma 2, 95123 Catania, Italy (URL: http://www.ct.ingv.it/en/, Facebook: https://www.facebook.com/ingvvulcani/); MIROVA (Middle InfraRed Observation of Volcanic Activity), a collaborative project between the Universities of Turin and Florence (Italy) supported by the Centre for Volcanic Risk of the Italian Civil Protection Department (URL: http://www.mirovaweb.it/); Hawai'i Institute of Geophysics and Planetology (HIGP) - MODVOLC Thermal Alerts System, School of Ocean and Earth Science and Technology (SOEST), Univ. of Hawai'i, 2525 Correa Road, Honolulu, HI 96822, USA (URL: http://modis.higp.hawaii.edu/); Sentinel Hub Playground (URL: https://www.sentinel-hub.com/explore/sentinel-playground).