Report on Sabancaya (Peru) — October 2020
Bulletin of the Global Volcanism Network, vol. 45, no. 10 (October 2020)
Managing Editor: Edward Venzke.
Edited by Kadie L. Bennis.
Sabancaya (Peru) Daily explosions produced ash plumes, SO2 plumes, and thermal anomalies during June-September 2020
Please cite this report as:
Global Volcanism Program, 2020. Report on Sabancaya (Peru) (Bennis, K.L., and Venzke, E., eds.). Bulletin of the Global Volcanism Network, 45:10. Smithsonian Institution. https://doi.org/10.5479/si.GVP.BGVN202010-354006
Sabancaya
Peru
15.787°S, 71.857°W; summit elev. 5960 m
All times are local (unless otherwise noted)
Sabancaya, located in Peru, is a stratovolcano that has been very active since 1986. The current eruptive period began in November 2016 and has recently been characterized by lava dome growth, daily explosions, ash plumes, ashfall, SO2 plumes, and ongoing thermal anomalies (BGVN 45:06). Similar activity continues into this reporting period of June through September 2020 using information from weekly reports from the Observatorio Vulcanologico INGEMMET (OVI), the Instituto Geofisico del Peru (IGP), and various satellite data. The Buenos Aires Volcanic Ash Advisory Center (VAAC) issued a total of 520 reports of ongoing ash emissions during this time.
Volcanism during this reporting period consisted of daily explosions, nearly constant gas-and-ash plumes, SO2 plumes, and persistent thermal anomalies in the summit crater. Gas-and-ash plumes rose to 1.5-4 km above the summit crater, drifting up to 35 km from the crater in multiple directions; several communities reported ashfall every month except for August (table 7). Sulfur dioxide emissions were notably high and recorded almost daily with the TROPOMI satellite instrument (figure 83). The satellite measurements of the SO2 emissions exceeded 2 DU (Dobson Units) at least 20 days each month of the reporting period. These SO2 plumes sometimes persisted over multiple days and ranged between 1,900-10,700 tons/day. MIROVA (Middle InfraRed Observation of Volcanic Activity) analysis of MODIS satellite data shows frequent thermal activity through September within 5 km of the summit crater, though the power varied; by late August, the thermal anomalies were stronger compared to the previous months (figure 84). This increase in power is also reflected by the MODVOLC algorithm that detected 11 thermal anomalies over the days of 31 August and 4, 6, 13, 17, 18, 20, and 22 September 2020. Many of these thermal hotspots were visible in Sentinel-2 thermal satellite imagery, occasionally accompanied by gas-and-steam and ash plumes (figure 85).
Table 7. Persistent activity at Sabancaya during June through September included multiple daily explosions that produced ash plumes rising several kilometers above the summit and drifting in multiple directions; this resulted in ashfall in communities within 35 km of the volcano. Satellite instruments recorded daily SO2 emissions. Data courtesy of OVI-INGEMMET, IGP, and the NASA Global Sulfur Dioxide Monitoring Page.
| Month | Avg. daily explosions by week | Max plume heights (km above the crater) | Plume drift (km) and direction | Communities reporting ashfall | Minimum days with SO2 over 2 DU | SO2 emissions per day (tons) by week |
| Jun 2020 | 20, 10, 9, 13 | 1.5-4 | 30 km, SE, S, SW, NE, W, E | Chivay, Achoma, Ichupampa, Yanque, and Coporaque, Sallali, Madrigal, Lari, and Ichupampa | 28 | 8,400, 2,200, 3,100, 7,600 |
| Jul 2020 | 20, 15, 11, 12, 19 | 2-2.6 | 15-30 km E, NE, NW, SE, SW, S, W | Achoma and Chivay | 23 | 4,400, 6,000, 1,900, 2,100, 5,900 |
| Aug 2020 | 18, 12, 9, 29 | 1.7-3.6 | 20-30 km W, SW, SE, S, E, NW | - | 20 | 2,300, 3,800, 5,300, 10,700 |
| Sep 2020 | 39, 35, 33, 38, 40 | 1.8-3.5 | 25-35 km SE, S, SW, W, E, NE, N, NW, W | Lari, Achoma, Maca, Chivay, Taya, Huambo, Huanca, and Lluta | 28 | 9,700, 2,600, 8,800, 7,800, 4,100 |
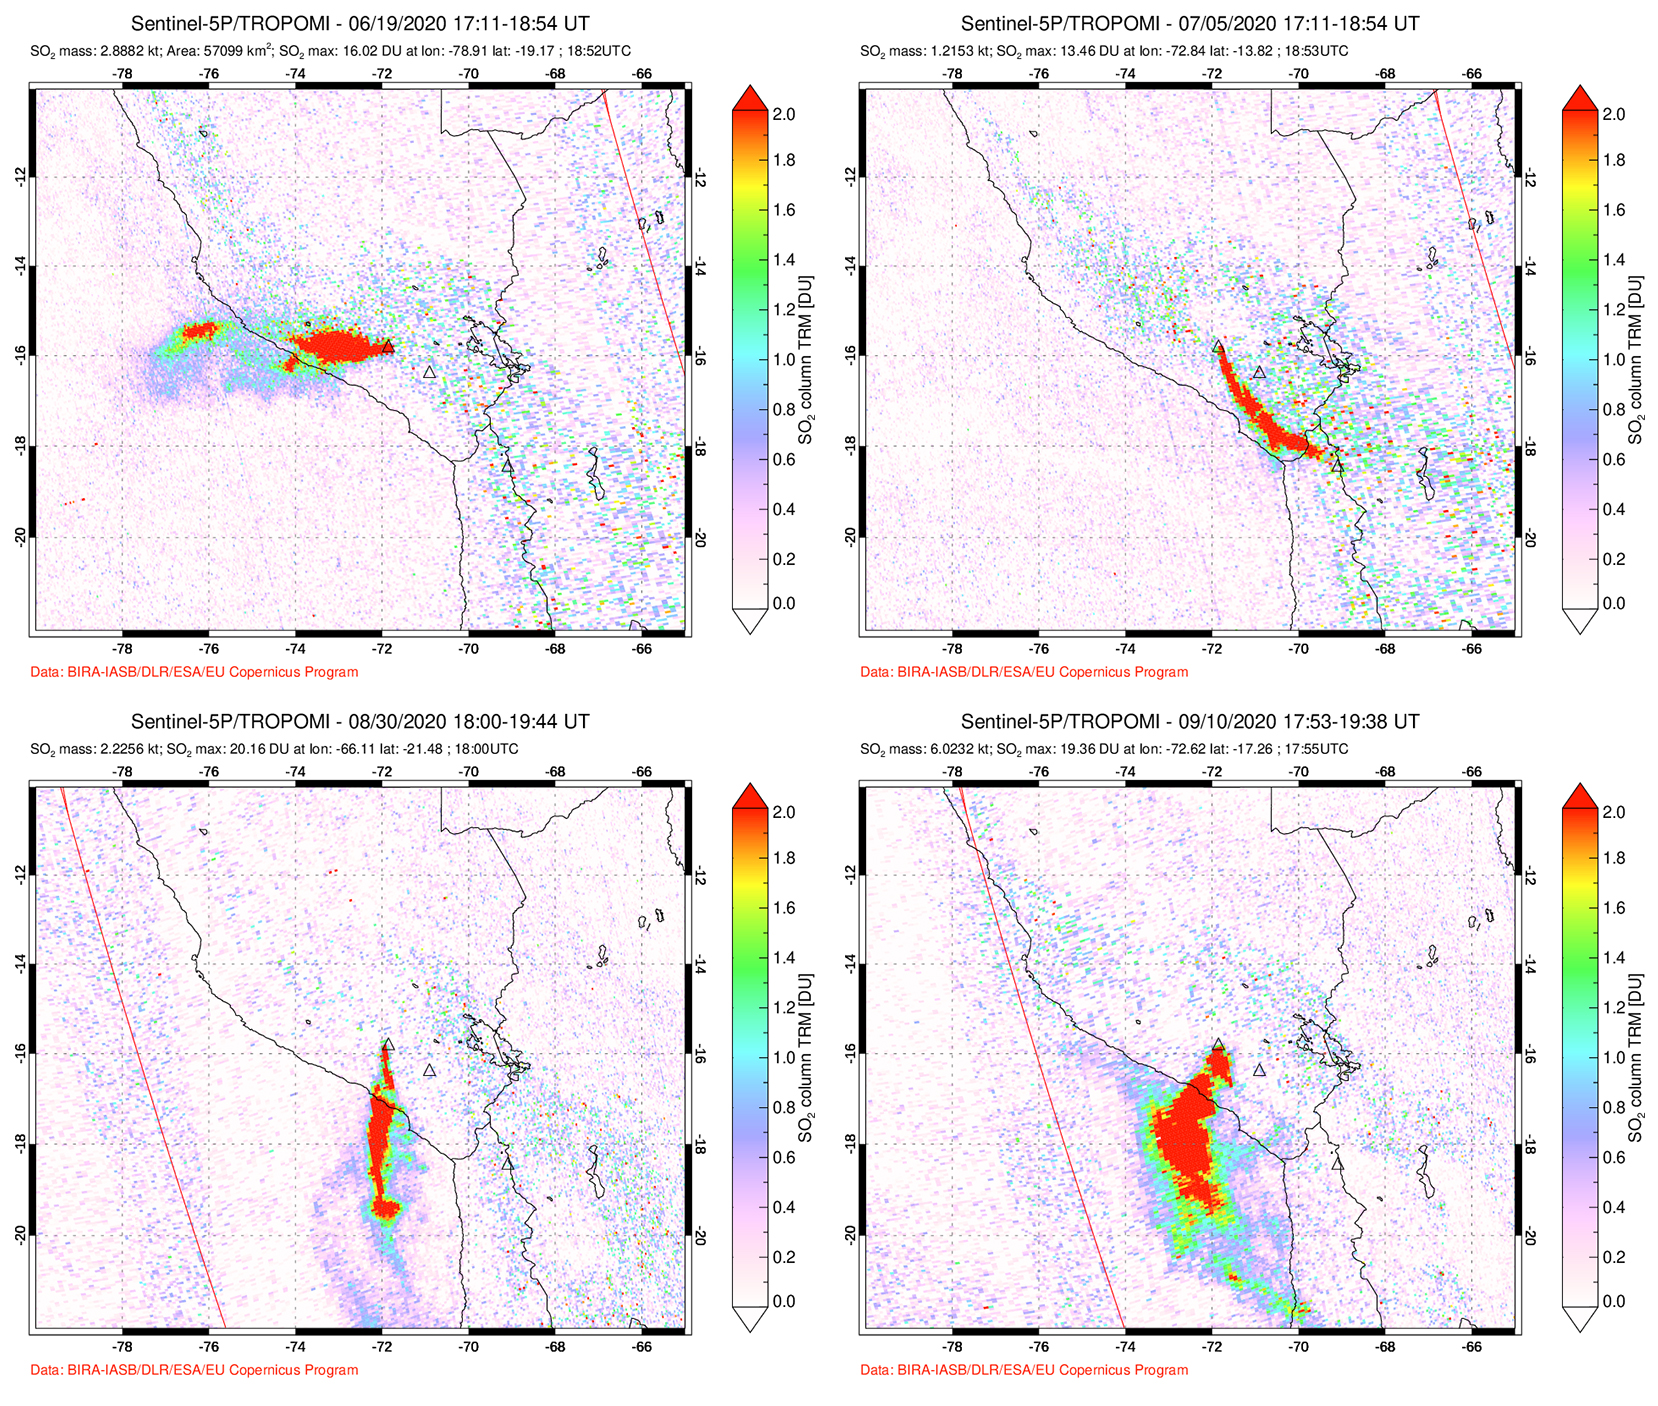 |
Figure 83. Sulfur dioxide plumes were captured almost daily from Sabancaya during June through September 2020 by the TROPOMI instrument on the Sentinel-5P satellite. Some of the largest SO2 plumes occurred on 19 June (top left), 5 July (top right), 30 August (bottom left), and 10 September (bottom right) 2020. Courtesy of NASA Global Sulfur Dioxide Monitoring Page. |
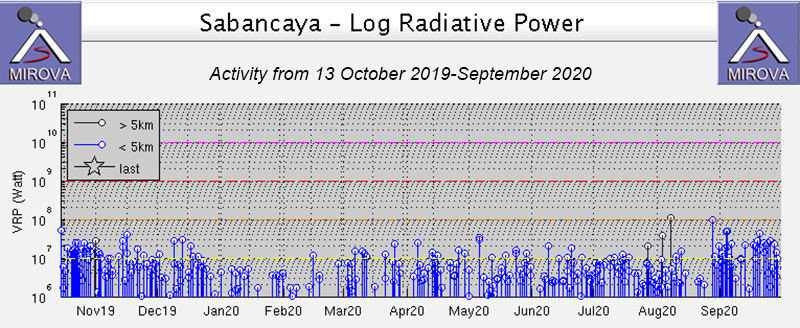 |
Figure 84. Thermal activity at Sabancaya varied in power from 13 October 2019 through September 2020, but was consistent in frequency, according to the MIROVA graph (Log Radiative Power). A pulse in thermal activity is shown in late August 2020. Courtesy of MIROVA. |
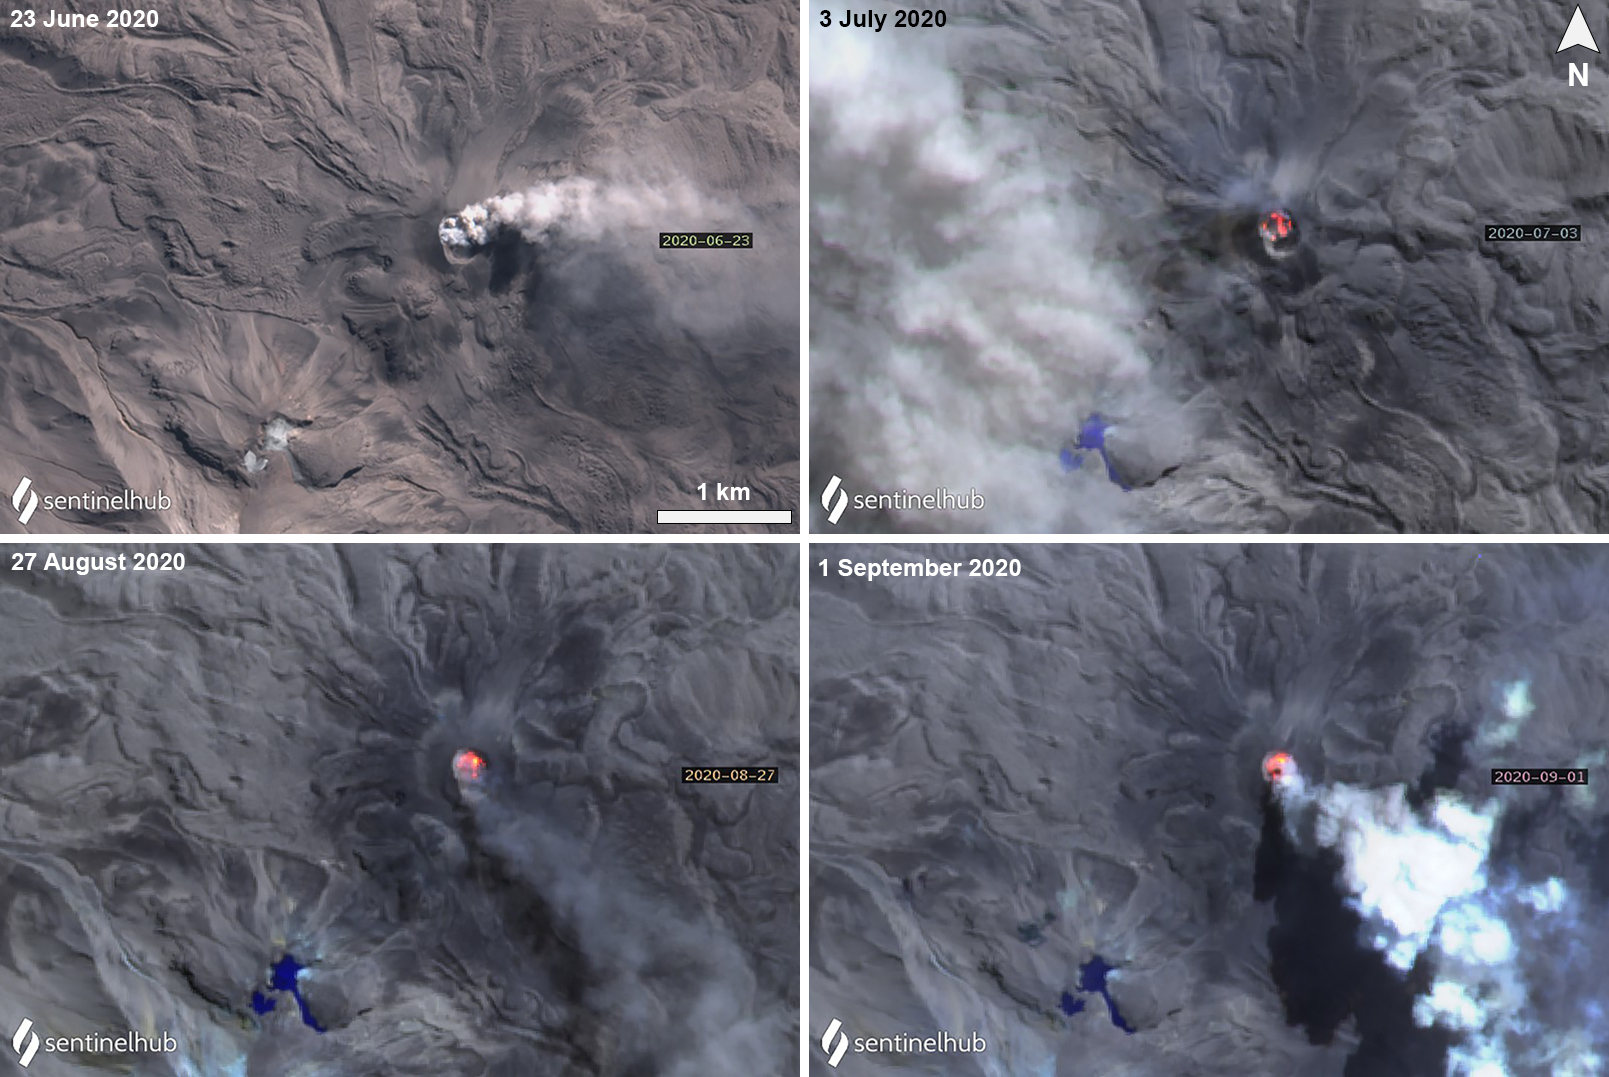 |
Figure 85. Sentinel-2 thermal satellite imagery showed frequent gas-and-steam and ash plumes rising from Sabancaya, accompanied by ongoing thermal activity from the summit crater during June through September 2020. On 23 June (top left) a dense gray-white ash plume was visible drifting E from the summit. On 3 July (top right) and 27 August (bottom left) a strong thermal hotspot (bright yellow-orange) was accompanied by some degassing. On 1 September (bottom right) the thermal anomaly persisted with a dense gray-white ash plume drifting SE from the summit. Images using “Natural Color” rendering (bands 4, 3, 2) on 23 June 2020 (top left) and the rest have “Atmospheric penetration” rendering (bands 12, 11, 8a). Courtesy of Sentinel Hub Playground. |
OVI detected slight inflation on the N part of the volcano, which continued to be observed throughout the reporting period. Persistent thermal anomalies caused by the summit crater lava dome were observed in satellite data. The average number of daily explosions during June ranged from 18 during 1-7 June to 9 during 15-21 June, which generated gas-and-ash plumes that rose 1.5-4 km above the crater and drifted 30 km SE, S, SW, NE, W, and E (figure 86). The strongest sulfur dioxide emissions were recorded during 1-7 June measuring 8,400 tons/day. On 20 June drone video showed that the lava dome had been destroyed, leaving blocks on the crater floor, though the crater remained hot, as seen in thermal satellite imagery (figure 85). During 22-28 June there were an average of 13 daily explosions, which produced ash plumes rising to a maximum height of 4 km, drifting NE, E, and SE. As a result, ashfall was reported in the districts of Chivay, Achoma, Ichupampa, Yanque, and Coporaque, and in the area of Sallali. Then, on 27 June ashfall was reported in several areas NE of the volcano, which included the districts of Madrigal, Lari, Achoma, Ichupampa, Yanque, Chivay, and Coporaque.
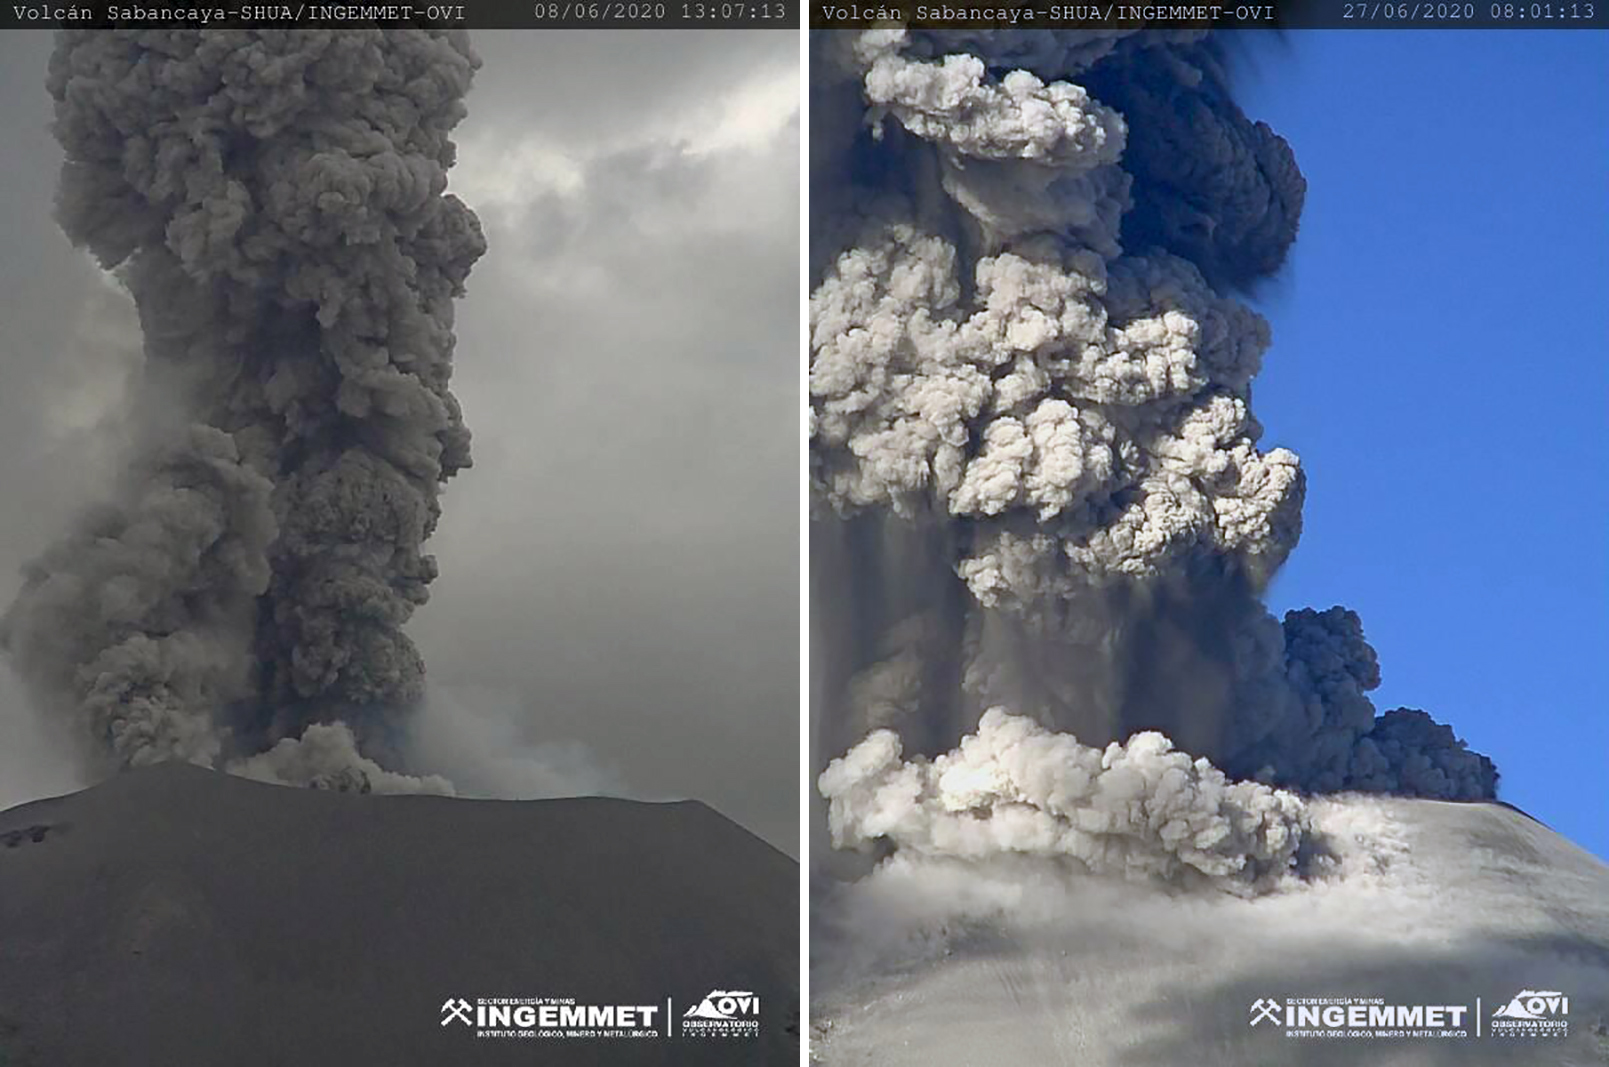 |
Figure 86. Multiple daily explosions at Sabancaya produced ash plumes that rose 1.5-4 km above the crater during June 2020. Images are showing 8 (left) and 27 (right) June 2020. Courtesy of OVI (Reporte Semanal de Monitorio de la Actividad de la Volcan Sabancaya, RSSAB-24-2020/INGEMMET Semana del 08 al 14 de junio del 2020 and RSSAB-26-2020/INGEMMET Semana del 22 al 28 de junio del 2020). |
Slight inflation continued to be monitored in July, occurring about 4-6 km N of the crater, as well as on the SE flank. Daily explosions continued, producing gas-and-ash plumes that rose 2-2.6 km above the crater and drifting 15-30 km E, NE, NW, SE, SW, S, and W (figure 87). The number of daily explosions increased slightly compared to the previous month, ranging from 20 during 1-5 July to 11 during 13-19 July. SO2 emissions that were measured each week ranged from 1,900 to 6,000 tons/day, the latter of which occurred during 6-12 July. Thermal anomalies continued to be observed in thermal satellite data over the summit crater throughout the month. During 6-12 July gas-and-ash plumes rose 2.3-2.5 km above the crater, drifting 30 km SE, E, and NE, resulting in ashfall in Achoma and Chivay.
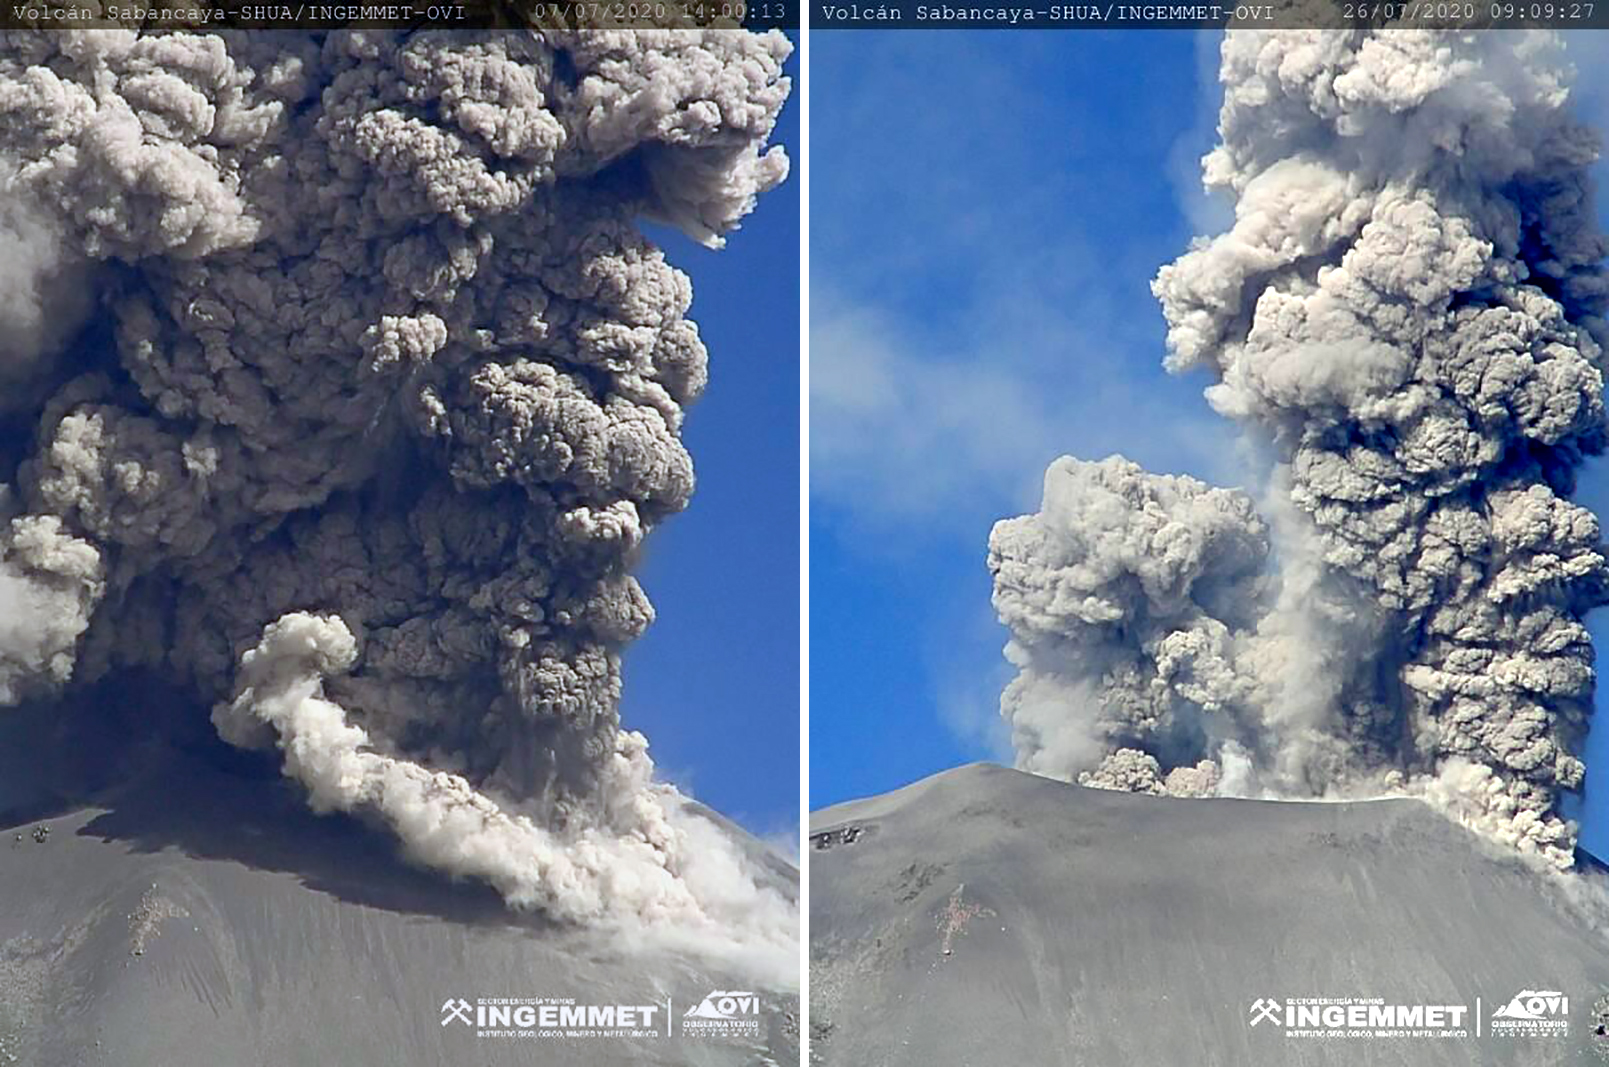 |
Figure 87. Multiple daily explosions at Sabancaya produced ash plumes that rose 2-3.5 km above the crater during July 2020. Images are showing 7 (left) and 26 (right) July 2020. Courtesy of OVI (Reporte Semanal de Monitorio de la Actividad de la Volcan Sabancaya, RSSAB-28-2020/INGEMMET Semanal: del 06 al 12 de julio del 2020 and RSSAB-30-2020/INGEMMET Semanal: del 20 al 26 de julio del 2020). |
OVI reported continued slight inflation on the N and SE flanks during August. Daily explosive activity had slightly declined in the first part of the month, ranging from 18 during the 3-9 August to 9 during 17-23 August. Dense gray gas-and-ash plumes rose 1.7-3.6 km above the crater, drifting 20-30 km in various directions (figure 88), though no ashfall was reported. Thermal anomalies were observed using satellite data throughout the month. During 24-30 August a pulse in activity increased the daily average of explosions to 29, as well as the amount of SO2 emissions (10,700 tons/day); nighttime incandescence accompanied this activity. During 28-29 August higher levels of seismicity and inflation were reported compared to the previous weeks. The daily average of explosions increased again during 31 August-6 September to 39; nighttime incandescence remained.
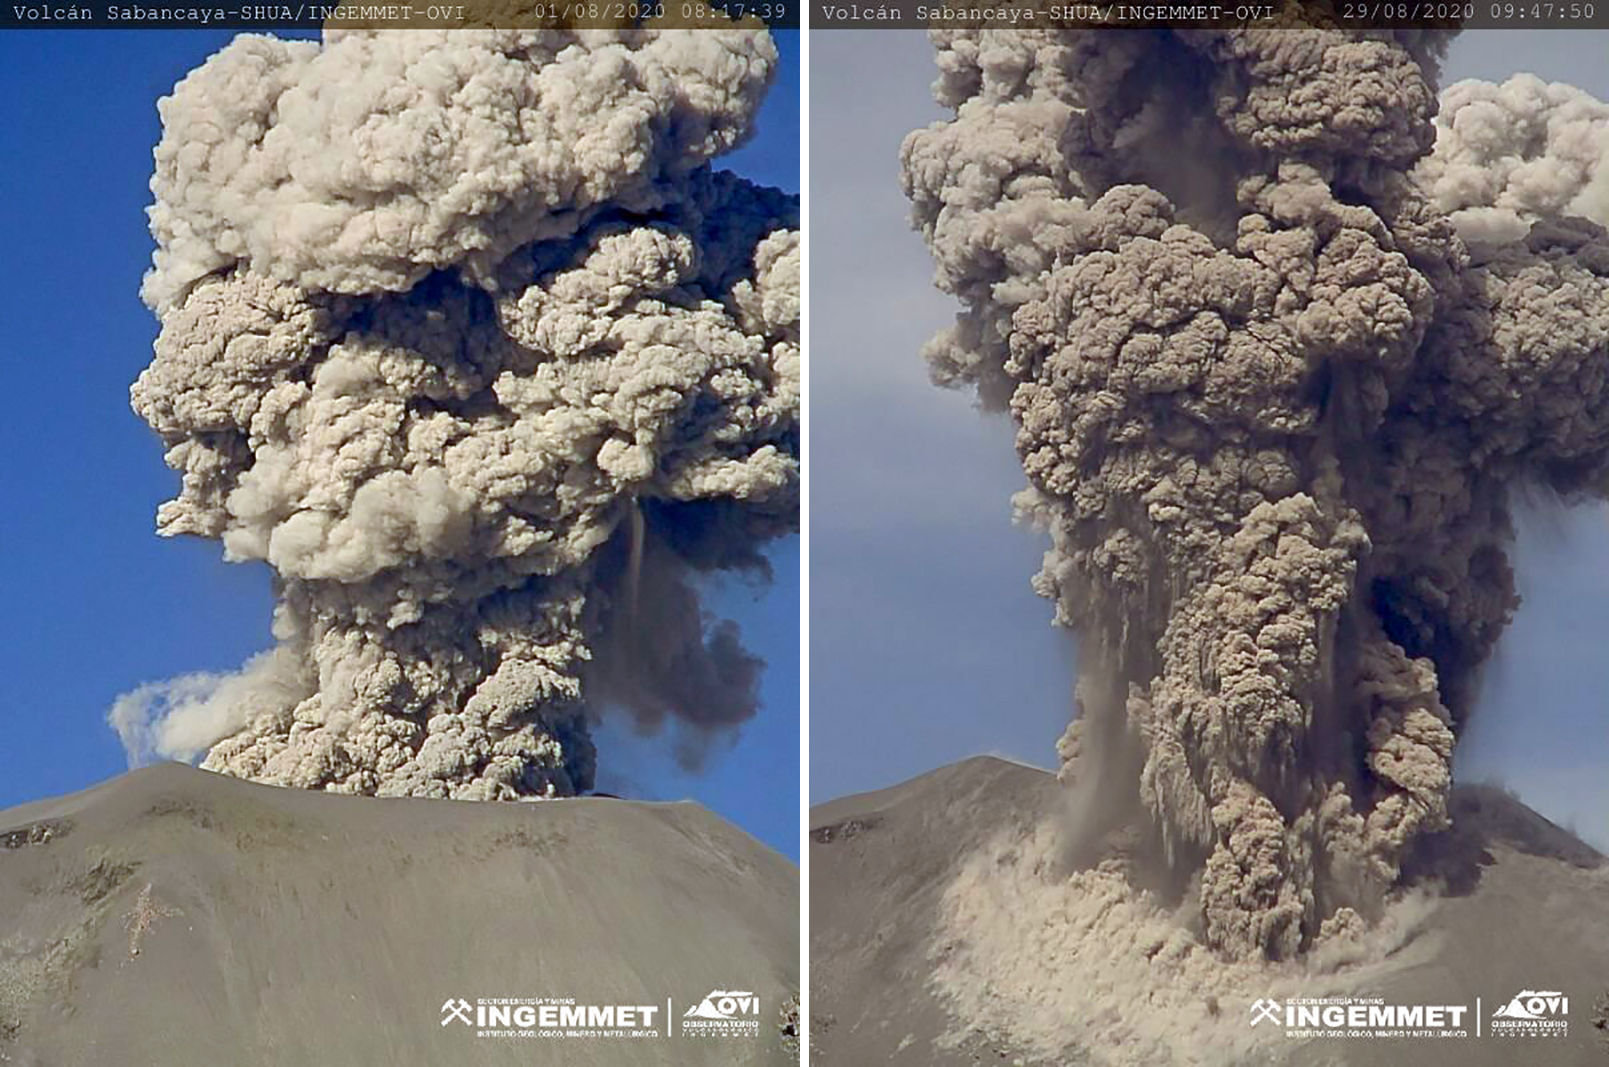 |
Figure 88. Multiple daily explosions at Sabancaya produced ash plumes that rose 1.7-3.6 km above the crater during August 2020. Images are showing 1 (left) and 29 (right) August 2020. Courtesy of OVI (Reporte Semanal de Monitorio de la Actividad de la Volcan Sabancaya, RSSAB-31-2020/INGEMMET Semanal del 27 de julio al 02 de agosto del 2020 and RSSAB-35-2020/INGEMMET Semanal del 24 al 30 de agosto del 2020). |
Increased volcanism was reported during September with the daily average of explosions ranging from 33 during 14-20 September to 40 during 28 September-4 October. The resulting gas-and-ash plumes rose 1.8-3.5 km above the crater drifting 25-35 km in various directions (figure 89). SO2 flux was measured by OVI ranging from 2,600 to 9,700 tons/day, the latter of which was recorded during 31 August to 6 September. During 7-13 September an average of 35 explosions were reported, accompanied by gas-and-ash plumes that rose 2.6-3.5 km above the crater and drifting 30 km SE, SW, W, E, and S. These events resulted in ashfall in Lari, Achoma, and Maca. The following week (14-20 September) ashfall was reported in Achoma and Chivay. During 21-27 September the daily average of explosions was 38, producing ash plumes that resulted in ashfall in Taya, Huambo, Huanca, and Lluta. Slight inflation on the N and SE flanks continued to be monitored by OVI. Strong activity, including SO2 emissions and thermal anomalies over the summit crater persisted into at least early October.
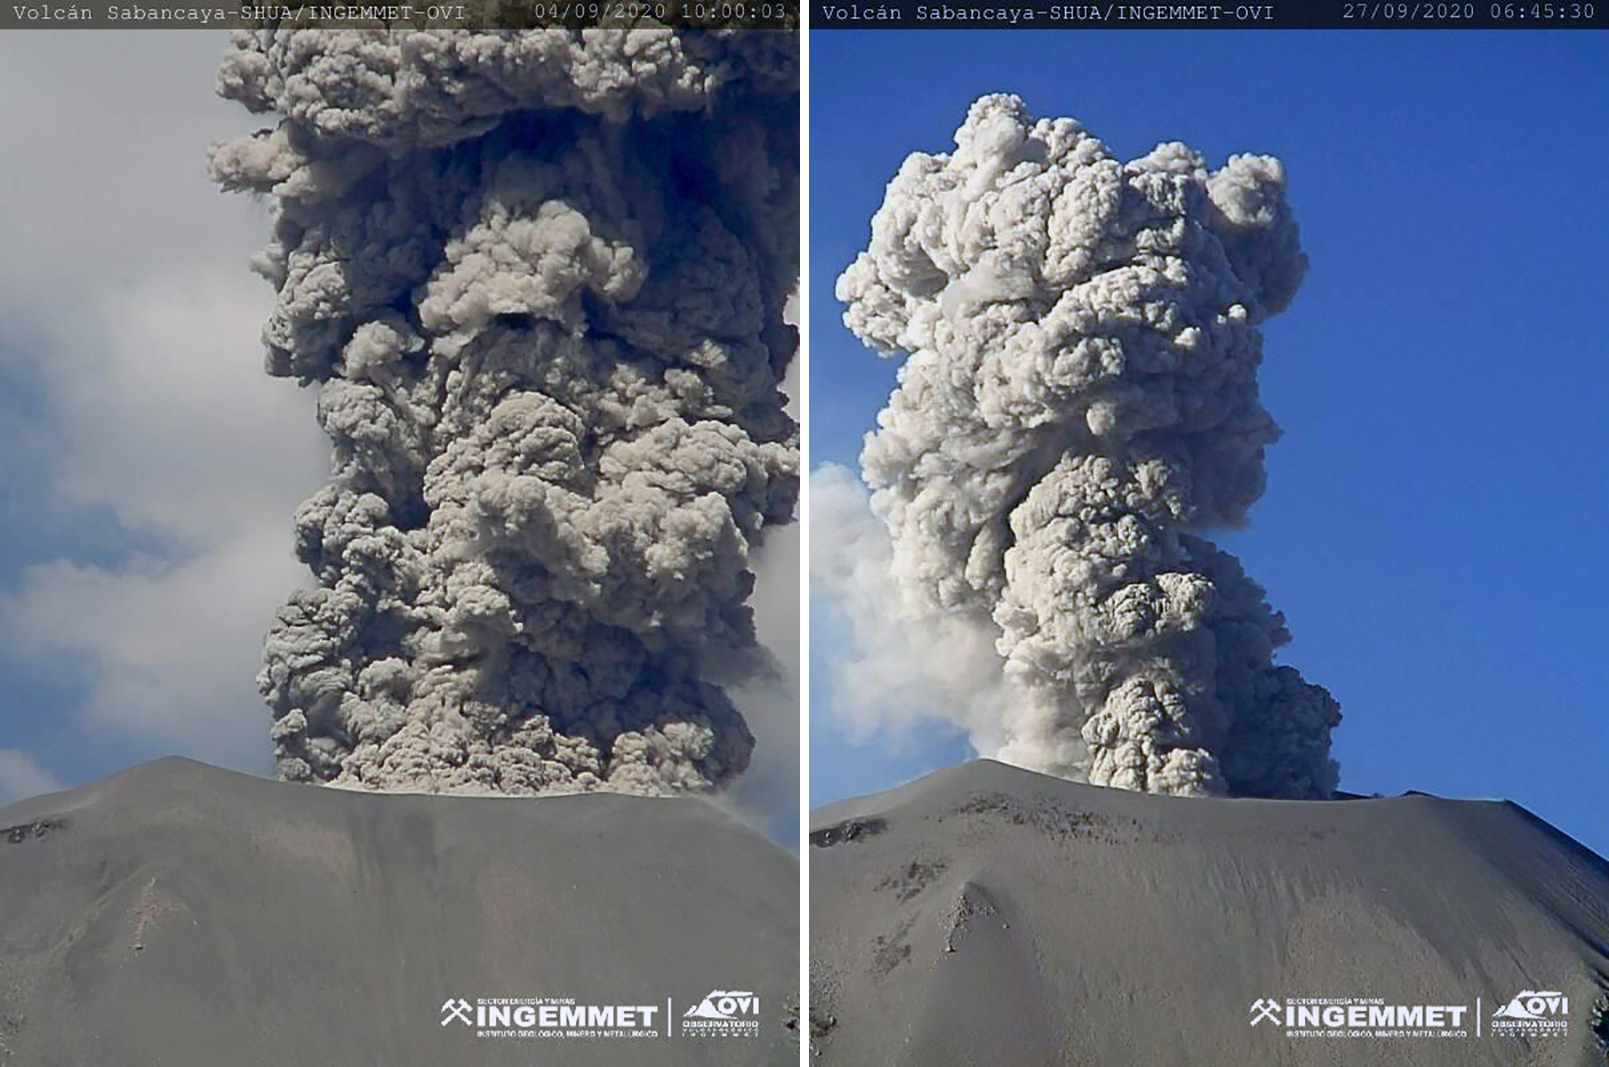 |
Figure 89. Multiple daily explosions at Sabancaya produced ash plumes that rose 1.8-2.6 km above the crater during September 2020. Images are showing 4 (left) and 27 (right) September 2020. Courtesy of OVI (Reporte Semanal de Monitorio de la Actividad de la Volcan Sabancaya, RSSAB-36-2020/INGEMMET Semanal del 31 de agosto al 06 de septiembre del 2020 and RSSAB-39-2020/INGEMMET Semanal del 21 al 27 de septiembre del 2020). |
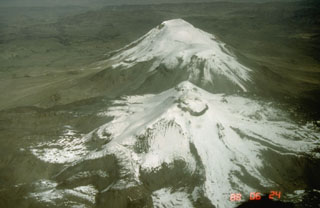
Geological Summary. Sabancaya, located in the saddle NE of Ampato and SE of Hualca Hualca volcanoes, is the youngest of these volcanic centers and the only one to have erupted in historical time. The oldest of the three, Nevado Hualca Hualca, is of probable late-Pliocene to early Pleistocene age. The name Sabancaya (meaning "tongue of fire" in the Quechua language) first appeared in records in 1595 CE, suggesting activity prior to that date. Holocene activity has consisted of Plinian eruptions followed by emission of voluminous andesitic and dacitic lava flows, which form an extensive apron around the volcano on all sides but the south. Records of observed eruptions date back to 1750 CE.
Information Contacts: Observatorio Volcanologico del INGEMMET (Instituto Geológical Minero y Metalúrgico), Barrio Magisterial Nro. 2 B-16 Umacollo - Yanahuara Arequipa, Peru (URL: http://ovi.ingemmet.gob.pe); Instituto Geofisico del Peru (IGP), Calle Badajoz N° 169 Urb. Mayorazgo IV Etapa, Ate, Lima 15012, Perú (URL: https://www.gob.pe/igp); Buenos Aires Volcanic Ash Advisory Center (VAAC), Servicio Meteorológico Nacional-Fuerza Aérea Argentina, 25 de mayo 658, Buenos Aires, Argentina (URL: http://www.smn.gov.ar/vaac/buenosaires/inicio.php); MIROVA (Middle InfraRed Observation of Volcanic Activity), a collaborative project between the Universities of Turin and Florence (Italy) supported by the Centre for Volcanic Risk of the Italian Civil Protection Department (URL: http://www.mirovaweb.it/); Hawai'i Institute of Geophysics and Planetology (HIGP) - MODVOLC Thermal Alerts System, School of Ocean and Earth Science and Technology (SOEST), Univ. of Hawai'i, 2525 Correa Road, Honolulu, HI 96822, USA (URL: http://modis.higp.hawaii.edu/); Sentinel Hub Playground (URL: https://www.sentinel-hub.com/explore/sentinel-playground).