Report on Raung (Indonesia) — December 2020
Bulletin of the Global Volcanism Network, vol. 45, no. 12 (December 2020)
Managing Editor: Edward Venzke.
Edited by A. Elizabeth Crafford.
Raung (Indonesia) Explosions with ash plumes and a thermal anomaly at the summit crater, July-October 2020
Please cite this report as:
Global Volcanism Program, 2020. Report on Raung (Indonesia) (Crafford, A.E., and Venzke, E., eds.). Bulletin of the Global Volcanism Network, 45:12. Smithsonian Institution. https://doi.org/10.5479/si.GVP.BGVN202012-263340
Raung
Indonesia
8.119°S, 114.056°E; summit elev. 3260 m
All times are local (unless otherwise noted)
A massive stratovolcano in easternmost Java, Raung has over sixty recorded eruptions dating back to the late 16th Century. Explosions with ash plumes, Strombolian activity, and lava flows from a cinder cone within the 2-km-wide summit crater have been the most common activity. Pusat Vulkanologi dan Mitigasi Bencana Geologi (PVMBG, also known as Indonesian Center for Volcanology and Geological Hazard Mitigation, CVGHM) has installed webcams to monitor activity in recent years. An eruption from late 2014 through August 2015 produced a large volume of lava within the summit crater and formed a new pyroclastic cone in the same location as the previous one. The eruption that began in July 2020 is covered in this report with information provided by PVMBG, the Darwin Volcanic Ash Advisory Center (VAAC), and several sources of satellite data.
The 2015 eruption was the largest in several decades; Strombolian activity was reported for many months and fresh lava flows covered the crater floor (BGVN 45:09). Raung was quiet after the eruption ended in August of that year until July of 2020 when seismicity increased on 13 July and brown emissions were first reported on 16 July. Tens of explosions with ash emissions were reported daily during the remainder of July 2020. Explosive activity decreased during August, but thermal activity didn’t decrease until mid-September. The last ash emissions were reported on 3 October and the last thermal anomaly in satellite data was recorded on 7 October 2020.
Eruption during July-October 2020. No further reports of activity were issued after August 2015 until July 2020. Clear Google Earth imagery from October 2017 and April 2018 indicated the extent of the lava from the 2015 eruption, but no sign of further activity (figure 31). By August 2019, many features from the 2015 eruption were still clearly visible from the crater rim (figure 32).
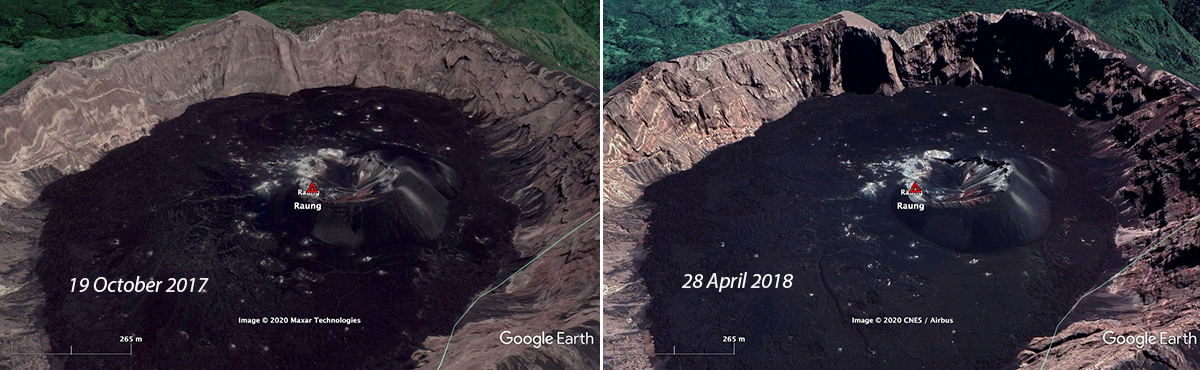 |
Figure 31. Little change can be seen at the summit of Raung in Google Earth images dated 19 October 2017 (left) and 28 April 2018 (right). The summit crater was full of black lava flows from the 2015 eruption. Courtesy of Google Earth. |
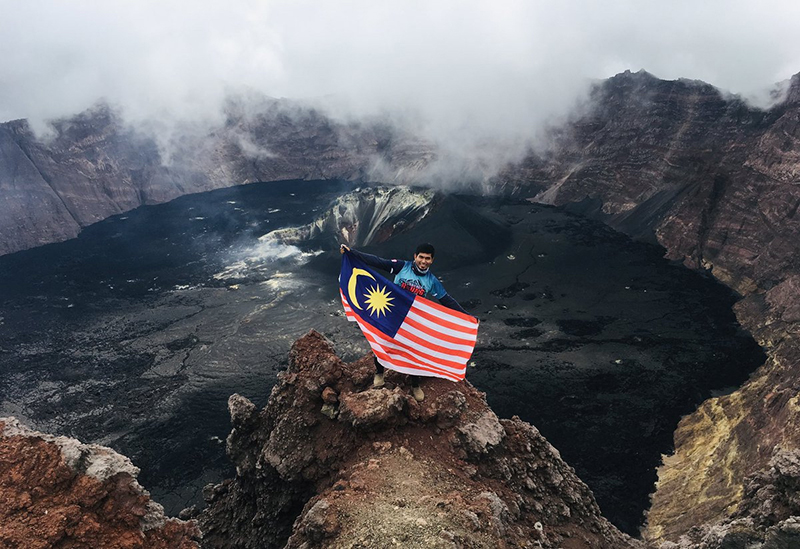 |
Figure 32. A Malaysian hiker celebrated his climbing to the summit of Raung on 30 August 2019. Weak fumarolic activity was visible from the base of the breached crater of the cone near the center of the summit crater, and many features of the lava flow that filled the crater in 2015 were still well preserved. Courtesy of MJ. |
PVMBG reported that the number and type of seismic events around the summit of Raung increased beginning on 13 July 2020, and on 16 July the height of the emissions from the crater rose to 100 m and the emission color changed from white to brown. About three hours later the emissions changed to gray and white. The webcams captured emissions rising 50-200 m above the summit that included 60 explosions of gray and reddish ash plumes (figure 33). The Raung Volcano Observatory released a VONA reporting an explosion with an ash plume that drifted N at 1353 local time (0653 UTC). The best estimate of the ash cloud height was 3,432 m based on ground observation. They raised the Aviation Color Code from unassigned to Orange. About 90 minutes later they reported a second seismic event and ash cloud that rose to 3,532 m, again based on ground observation. The Darwin VAAC reported that neither ash plume was visible in satellite imagery. The following day, on 17 July, PVMBG reported 26 explosions between midnight and 0600 that produced brown ash plumes which rose 200 m above the crater. Based on these events, PVMBG raised the Alert Level of Raung from I (Normal) to II (Alert) on a I-II-III-IV scale. By the following day they reported 95 explosive seismic events had occurred. They continued to observe gray ash plumes rising 100-200 m above the summit on clear days and 10-30 daily explosive seismic events through the end of July; plume heights dropped to 50-100 m and the number of explosive events dropped below ten per day during the last few days of the month.
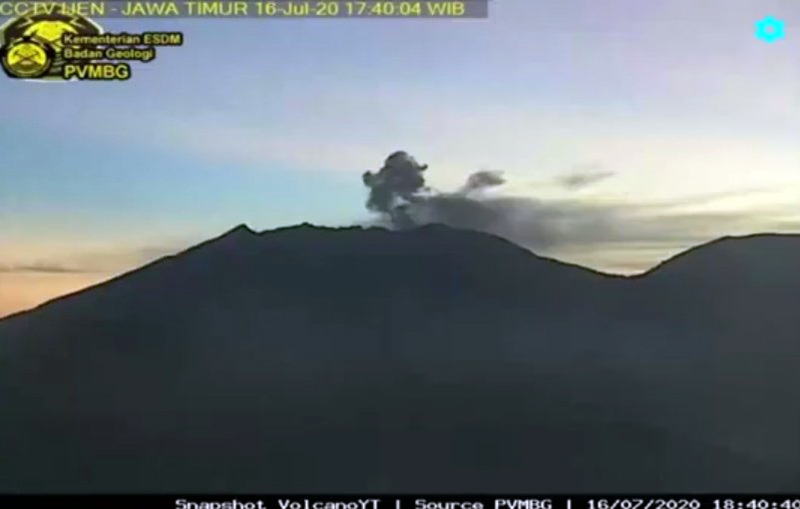 |
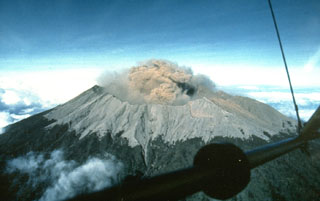
Figure 33. An ash plume rose from the summit of Raung on 16 July 2020 at the beginning of a new eruption. The last previous eruption was in 2015. Courtesy of Volcano Discovery and PVMBG. |
After a long period of no activity, MIROVA data showed an abrupt return to thermal activity on 16 July 2020; a strong pulse of heat lasted into early August before diminishing (figure 34). MODVOLC thermal alert data recorded two alerts each on 18 and 20 July, and one each on 21 and 30 July. Satellite images showed no evidence of thermal activity inside the summit crater from September 2015 through early July 2020. Sentinel-2 satellite imagery first indicated a strong thermal anomaly inside the pyroclastic cone within the crater on 19 July 2020; it remained on 24 and 29 July (figure 35). A small SO2 signature was measured by the TROPOMI instrument on the Sentinel-5P satellite on 25 July.
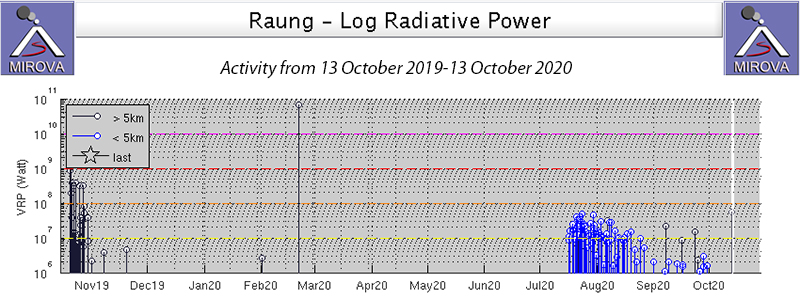 |
Figure 34. MIROVA thermal anomaly data indicated renewed activity on 16 July 2020 at Raung as seen in this graph of activity from 13 October 2019 through September 2020. Satellite images indicated that the dark lines at the beginning of the graph are from a large area of fires that burned on the flank of Raung in October 2019. Heat flow remained high through July and began to diminish in mid-August 2020. Courtesy of MIROVA. |
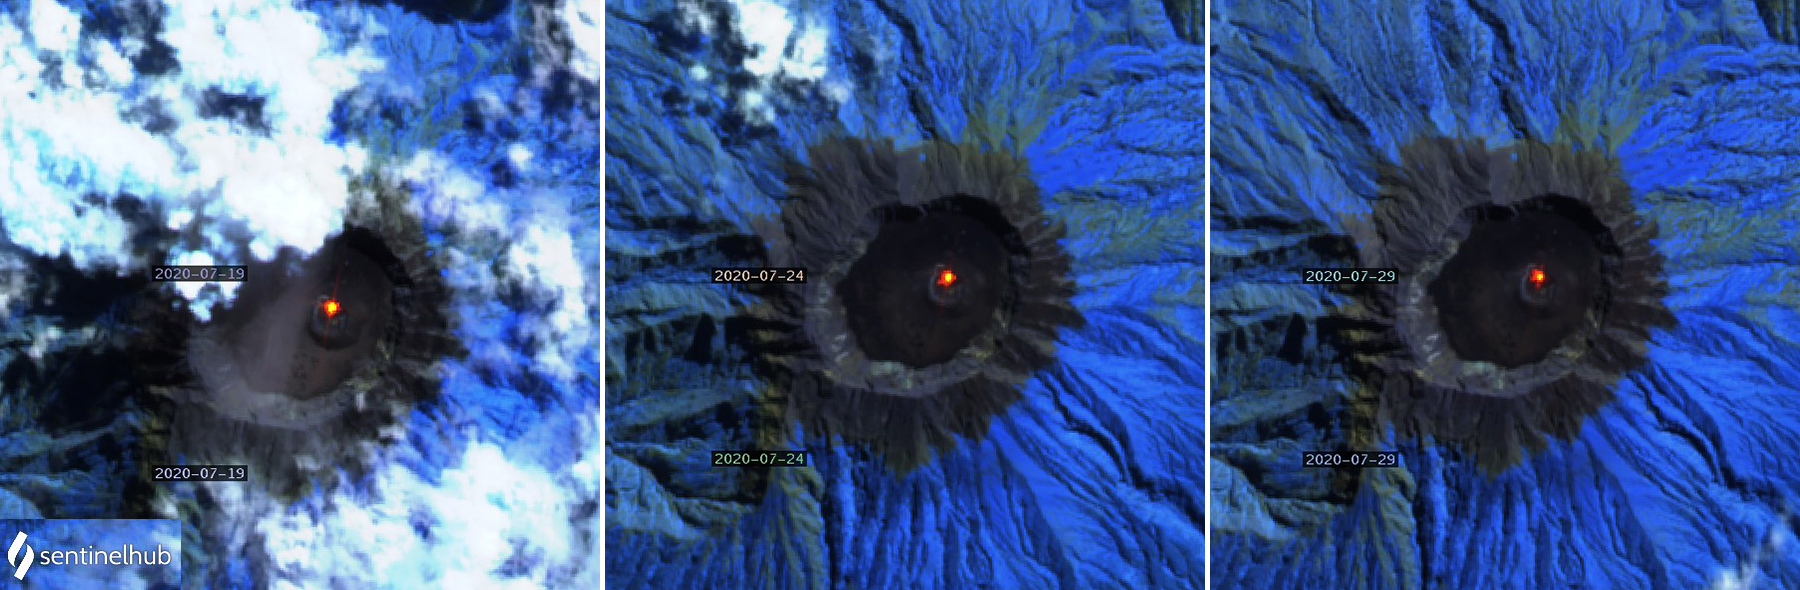 |
Figure 35. Thermal anomalies were distinct inside the crater of the pyroclastic cone within the summit crater of Raung on 19, 24, and 29 July 2020. Data is from the Sentinel-2 satellite shown with Atmospheric penetration rendering (bands 12, 11, 8A). Courtesy of Sentinel Hub Playground. |
After an explosion on 1 August 2020 emissions from the crater were not observed again until steam plumes were seen rising 100 m on 7 August. They were reported rising 100-200 m above the summit intermittently until a dense gray ash plume was reported by PVMBG on 11 August rising 200 m. After that, diffuse steam plumes no more than 100 m high were reported for the rest of the month except for white to brown emissions to 100 m on 21 August. Thermal anomalies of a similar brightness to July from the same point within the summit crater were recorded in satellite imagery on 3, 8, 13, 18, and 23 August. Single MODVOLC thermal alerts were reported on 1, 8, 12, and 19 August.
In early September dense steam plumes rose 200 m above the crater a few times but were mostly 50 m high or less. White and gray emissions rose 50-300 m above the summit on 15, 20, 27, and 30 September. Thermal anomalies were still present in the same spot in Sentinel-2 satellite imagery on 2, 7, 12, 17, and 27 September, although the signal was weaker than during July and August (figure 36). PVMBG reported gray emissions rising 100-300 m above the summit on 1 October 2020 and two seismic explosion events. Gray emissions rose 50-200 m the next day and nine explosions were recorded. On 3 October, emissions were still gray but only rose 50 m above the crater and no explosions were reported. No emissions were observed from the summit crater for the remainder of the month. Sentinel-2 satellite imagery showed a hot spot within the summit crater on 2 and 7 October, but clear views of the crater on 12, 17, and 22 October showed no heat source within the crater (figure 37).
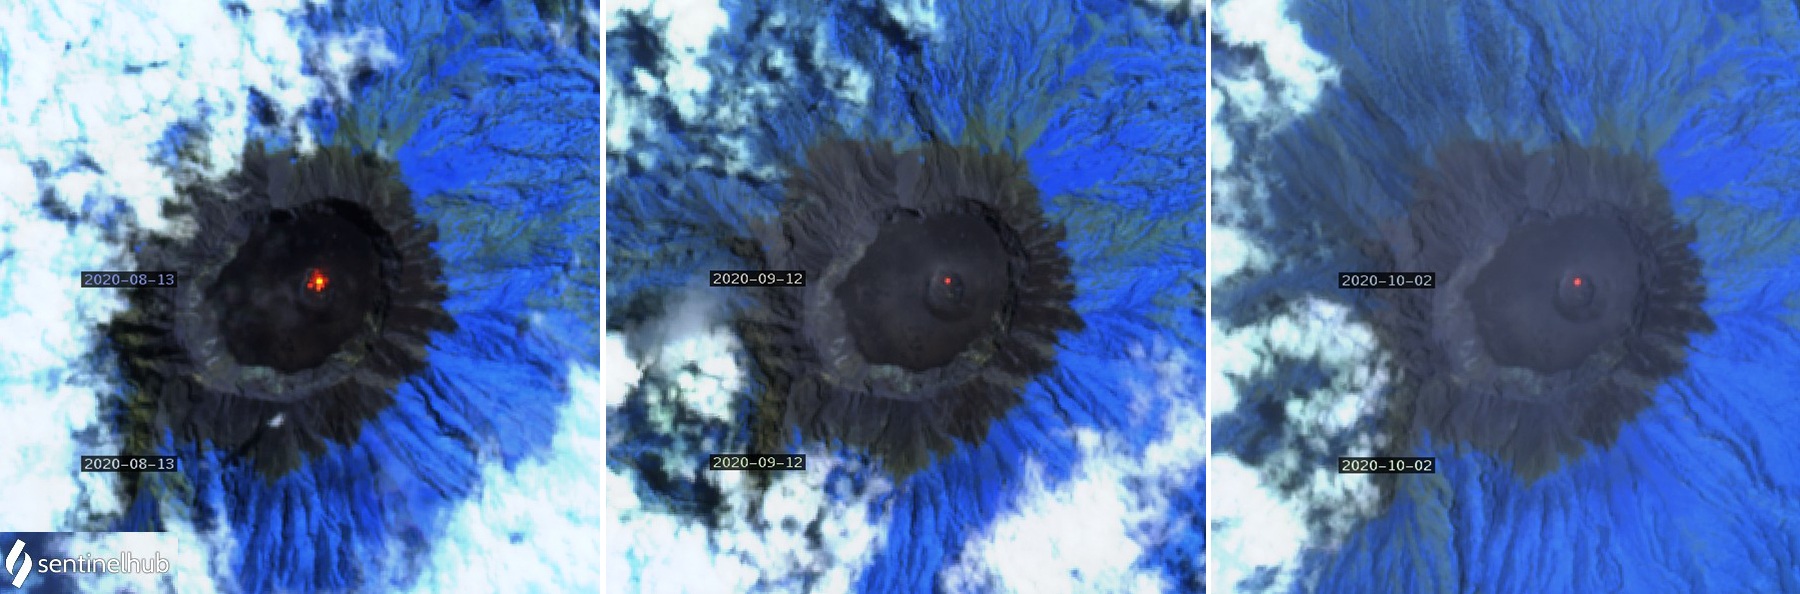 |
Figure 36. The thermal anomaly at Raung recorded in Sentinel-2 satellite data decreased in intensity between August and October 2020. It was relatively strong on 13 August (left) but had decreased significantly by 12 September (middle) and remained at a lower level into early October (right). Data shown with Atmospheric penetration rendering (bands 12, 11, 8A). Courtesy of Sentinel Hub Playground |
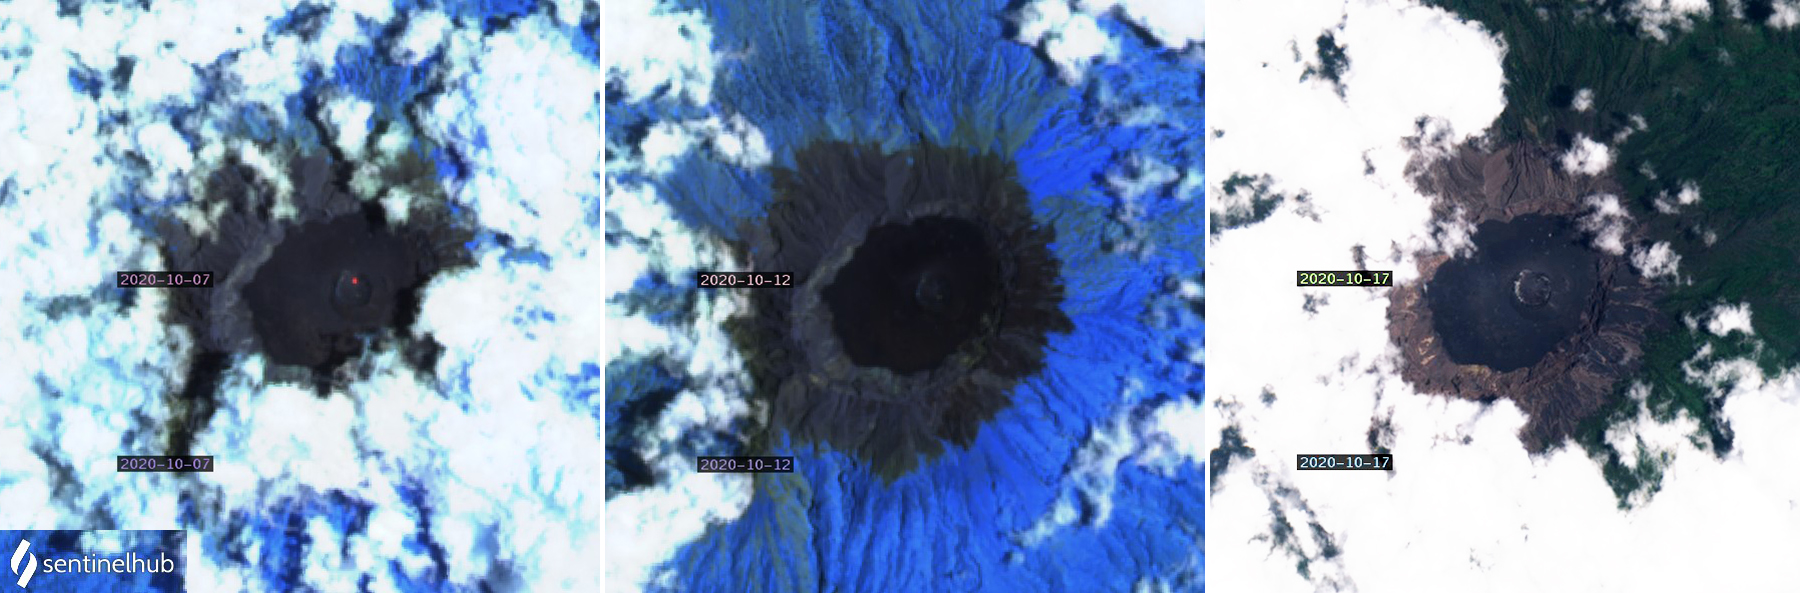 |
Figure 37. A small but distinct thermal anomaly was still present within the pyroclastic cone inside the summit crater of Raung on 7 October 2020 (left) but was gone by 12 October (middle) and did not reappear in subsequent clear views of the crater through the end of October. Satellite imagery of 7 and 12 October processed with Atmospheric penetration rendering (bands 12, 11, 8A). Natural color rendering (bands 4, 3, 2) from 17 October (right) shows no clear physical changes to the summit crater during the latest eruption. Courtesy of Sentinel Hub Playground. |
Geological Summary. Raung, one of Java's most active volcanoes, is a massive stratovolcano in easternmost Java that was constructed SW of the rim of Ijen caldera. The unvegetated summit is truncated by a dramatic steep-walled, 2-km-wide caldera that has been the site of frequent historical eruptions. A prehistoric collapse of Gunung Gadung on the W flank produced a large debris avalanche that traveled 79 km, reaching nearly to the Indian Ocean. Raung contains several centers constructed along a NE-SW line, with Gunung Suket and Gunung Gadung stratovolcanoes being located to the NE and W, respectively.
Information Contacts: Pusat Vulkanologi dan Mitigasi Bencana Geologi (PVMBG, also known as Indonesian Center for Volcanology and Geological Hazard Mitigation, CVGHM), Jalan Diponegoro 57, Bandung 40122, Indonesia (URL: http://www.vsi.esdm.go.id/); Hawai'i Institute of Geophysics and Planetology (HIGP) - MODVOLC Thermal Alerts System, School of Ocean and Earth Science and Technology (SOEST), Univ. of Hawai'i, 2525 Correa Road, Honolulu, HI 96822, USA (URL: http://modis.higp.hawaii.edu/); Darwin Volcanic Ash Advisory Centre (VAAC), Bureau of Meteorology, Northern Territory Regional Office, PO Box 40050, Casuarina, NT 0811, Australia (URL: http://www.bom.gov.au/info/vaac/); MIROVA (Middle InfraRed Observation of Volcanic Activity), a collaborative project between the Universities of Turin and Florence (Italy) supported by the Centre for Volcanic Risk of the Italian Civil Protection Department (URL: http://www.mirovaweb.it/); Global Sulfur Dioxide Monitoring Page, Atmospheric Chemistry and Dynamics Laboratory, NASA Goddard Space Flight Center (NASA/GSFC), 8800 Greenbelt Road, Goddard, Maryland, USA (URL: https://so2.gsfc.nasa.gov/); Google Earth (URL: https://www.google.com/earth/); Sentinel Hub Playground (URL: https://www.sentinel-hub.com/explore/sentinel-playground); Tom Pfeiffer, Volcano Discovery (URL: http://www.volcanodiscovery.com/); MJ (URL: https://twitter.com/MieJamaludin/status/1167613617191043072).